Exhibit 99.1
Additional Company Disclosure
May 2013
CHAMBERS STREET

Except where the context suggests otherwise, the terms “we,” “us,” “our” and “our company” refer to Chambers Street Properties, together
with its subsidiaries. Unless otherwise indicated, the information contained herein is as of December 31, 2012. Square footage amounts
include 100% of unconsolidated joint ventures and dollar amounts include our pro rata share of unconsolidated joint ventures. Such amounts
do not include our unconsolidated investment in CBRE Strategic Partners Asia II. Our ownership interest in CBRE Strategic Partners Asia II is
5.07%, which represents an $8.1 million equity position as of December 31, 2012. Our aggregate portfolio purchase price of approximately
$3.2 billion is pro forma for the March 1, 2013 purchase of Duke Realty’s 20% interest in 17 properties owned by our joint venture.
www.ChambersStreet.com | 1
Our Business
We are a self-administered and internally managed Maryland real estate investment trust,
or REIT, led by an experienced management team that is focused on acquiring, owning
and operating high-quality industrial and office properties. Our senior management team
is led by Mr. Jack A. Cuneo, President and Chief Executive Officer; Mr. Philip L. Kianka,
Executive Vice President and Chief Operating Officer and Mr. Martin A. Reid, Executive
Vice President and Chief Financial Officer. Our primary objective is to maximize shareholder
value through stable cash flow and long-term asset appreciation. In pursuing this
objective, we target growth through acquisitions and selective built-to-suit development
in markets that complement our existing portfolio, actively manage our balance sheet to
maintain flexibility with conservative leverage, and seek internal growth through proactive
asset management, leasing and property management oversight.
We have acquired and developed a high-quality industrial and office portfolio comprised
primarily of single-tenant net lease properties with an aggregate purchase price of approximately
$3.2 billion. We own or have majority interests in 129 properties (69 industrial,
57 office, and three retail) located in 22 states (Arizona, California, Colorado, Florida,
Georgia, Illinois, Indiana, Kansas, Kentucky, Maryland, Massachusetts, Minnesota,
Missouri, New Jersey, North Carolina, Ohio, Pennsylvania, South Carolina, Tennessee,
Texas, Utah, and Virginia), the United Kingdom and Germany encompassing approximately
34.1 million rentable square feet in the aggregate. Our portfolio has a weighted
average age of approximately 10 years and is 98% leased with approximately 82% of its
rentable square footage triple net leased to single-tenants.
Our portfolio has 272 tenants across 25 industries with 7.3 years of average lease term
remaining. No individual tenant accounts for more than 6.6% of our portfolio’s annualized
base rent. Our tenants include large and nationally recognized companies such
as Amazon, Raytheon, JP Morgan Chase, Comcast, Deloitte, Whirlpool, Kellogg’s and
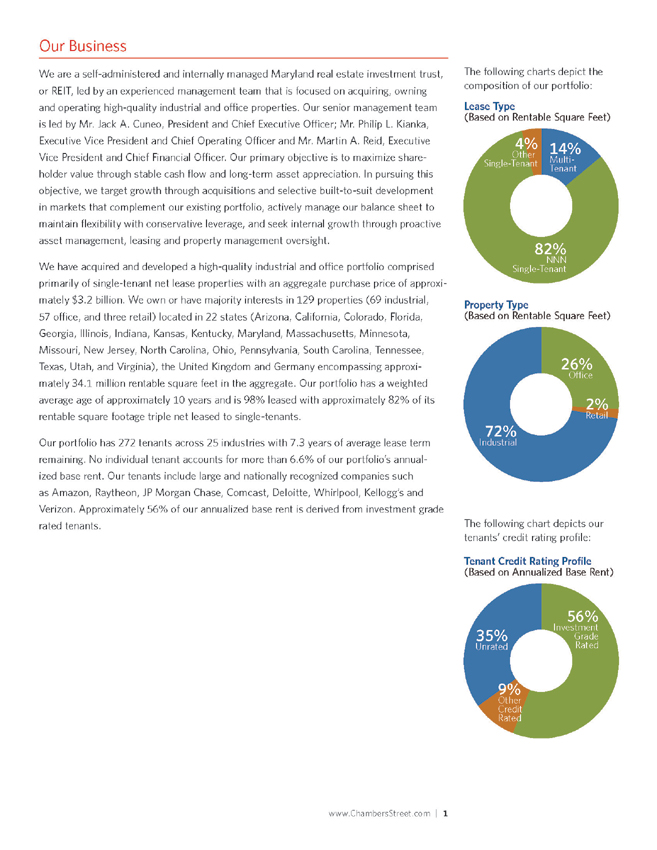
Verizon. Approximately 56% of our annualized base rent is derived from investment grade
rated tenants.
_%
Retail
Property_Type
(Based_on_Rentable_Square_Feet)
__%
Industrial
__%
O_ce
The following charts depict the
composition of our portfolio:
__%
Multi-
Tenant
Lease_Type
(Based_on_Rentable_Square_Feet)
__%
NNN
Single-Tenant
_%
Other_
Single-Tenant
_%
Other_
Credit
Rated
Tenant_Credit_Rating_Profile_
(Based_on_Annualized_Base_Rent)
_%
Unrated
__%
Investment
Grade
Rated
The following chart depicts our
tenants’ credit rating profile:
2 |
| | C hambers Street Properties | A dditional Company Disclosure May 2013 |
Our highly experienced senior management team has deep public and private commercial
real estate experience and each member of our senior management team has played a
pivotal role in our company throughout its growth. Our senior management team has been
involved in a wide range of real estate investment activity including acquisitions, development,
joint venture structuring, property sales, work outs and private equity financing for
REITs and real estate operating companies over multiple market cycles. The members
of our management team have a disciplined track record having acquired and managed
our large, geographically diverse portfolio, while maintaining a flexible balance sheet and
conservative leverage. Some of our notable achievements to date include:
• Acquired a $3.2 billion portfolio through a disciplined acquisition and development
strategy, prudently acquiring more than 89% of the portfolio after 2007.
• Maintained a high level of leasing. The portfolio is 98% leased to over 270 tenants
representing over 25 industries with 7.3 years of average lease term remaining. We
continue to build strong relationships with our tenants, the majority of which are investment
grade rated based on annualized base rent.
• Internalized our management team without a separate internalization payment to our
former investment advisor or its affiliates and changed our name to Chambers Street
Properties.
• Assembled a staff of 24 professionals that work together to actively manage our
portfolio and execute the business and growth strategies developed by our senior
management team, each of whom has played a pivotal role in our company throughout
its growth.
• Enhanced our liquidity and balance sheet flexibility by replacing a $125 million secured
facility with a $700 million unsecured revolving credit facility.
• Continued increasing our access to multiple capital sources with the closing of $250
million in unsecured term loans.
• Continued the growth of our sizable unencumbered asset base to $1.3 billion, based on
acquisition cost, as we transition to become a primarily unsecured borrower.
• Prudently maintained a low leverage profile with staggered debt maturities.
• Continued to grow our portfolio, closing approximately $340 million of acquisitions
during 2012.
www.ChambersStreet.com | 3
Recent Developments
Investment Activity:
• On January 30, 2013, we acquired all of Trammell Crow Company’s (“TCC”) 5%
interest in our 1400 Atwater Drive property, a 300,000 square foot office property that
we developed in a joint venture with TCC, located in Malvern, Pennsylvania, a suburb of
Philadelphia. 1400 Atwater Drive is 100% leased to Endo Pharmaceuticals, Inc. for use
as their corporate headquarters through November 2024. This triple net lease is guaranteed
by Endo Health Solutions Inc. (NASDAQ: ENDP), Endo Pharmaceuticals’ parent
company, a specialty pharmaceutical and healthcare solutions company.
• On February 19, 2013, we entered into an agreement with TCC to form a joint venture
to develop a four building, 454,801 square foot build-to-suit office complex in Malvern,
Pennsylvania, a suburb of Philadelphia, for Shire US, Inc., which will serve as their US
corporate headquarters under a 15-year lease. The total project cost is anticipated to be
approximately $122.3 million and upon completion of construction and satisfaction of
closing obligations, we will acquire all of TCC’s 5% interest in the joint venture.
• On March 1, 2013, we acquired all of Duke Realty’s 20% interests in 17 office and
warehouse properties that were owned by our joint venture. The aggregate purchase
price that we paid in connection with the acquisition of the 20% interest was approximately
$98.1 million.
Capital Markets Activity:
• On March 5, 2013, we entered into an unsecured term loan in the amount of $50 million
with TD Bank, N.A. (the “TD Term Loan”). Upon closing the TD Term Loan, we simultaneously
entered into an interest rate swap agreement with TD Bank, N.A. to effectively fix the
interest rate on the loan at 3.425% per annum for its seven-year term, based upon the TD
Term Loan’s current stated applicable margin, which may vary during its term based upon
the then-current leverage ratio or our then-current credit rating. We used the proceeds of
the TD Term Loan to repay a portion of our borrowings under our unsecured credit facility.
• On March 7, 2013, we entered into an unsecured term loan (the “Wells Fargo Term
Loan”) in the amount of $200 million with Wells Fargo Bank, National Association
(“Wells Fargo”) and certain other lenders defined in the Wells Fargo Term Loan. Upon
closing the Wells Fargo Term Loan, we simultaneously entered into an interest rate swap
agreement with Wells Fargo to effectively fix the interest rate on the Wells Fargo Term
Loan at 2.4885% per annum for its five-year term, based upon the Wells Fargo Term
Loan’s current stated applicable margin, which may vary based upon the then-current
leverage ratio or our then-current credit rating. We used the proceeds of the Wells Fargo
Term Loan to repay a portion of our borrowings under our unsecured credit facility.
4 |
| | C hambers Street Properties | A dditional Company Disclosure May 2013 |
Market Opportunity
Unless otherwise indicated, the information in the Market Opportunity section is derived from a
market study prepared for us by Rosen Consulting Group, or RCG, a nationally recognized real
estate consulting firm. Because of its fragmented and decentralized nature, information about
the net lease market, including its overall size and operating fundamentals, is generally not
available at the national level and rarely available at the regional level. However, RCG believes
that, in many cases, statistics describing the single-tenant market are generally applicable to the
net lease market, as single-tenant properties make up a large share of the net lease market. We
have paid RCG a fee for such services. The company believes the data prepared by RCG is reliable,
but it has not independently verified this information. Any forecasts prepared by RCG are
based on data (including third party data), models and experience of various professionals, and
are based on various assumptions, all of which are subject to change without notice. There is no
assurance that any of the forecasts will be achieved.
The Net Lease Market
Net lease properties are uniquely structured transactions where tenants, in addition to
paying rent, assume the majority or all of operating expenses associated with the property.
In the case of a triple net lease, the tenant bears the expense of property taxes, insurance,
utilities, and maintenance, including capital repairs to the property. These characteristics
distinguish a net lease from a full-service lease, under which the property owner pays utilities,
insurance premiums, and the cost to maintain the property and charges the tenant a
gross amount, ostensibly factoring into the rent the proportionate cost of these items.
Net leases for corporate real estate tend to have long terms, approximately 10 years on
average, plus successive options to extend – compared with full-service leases within
multi-tenant buildings, which typically run between 5 and 10 years. Longer terms obviate
the need to re-lease the property as frequently, minimizing vacancy risk and also saving
transaction costs such as legal fees and broker commissions. Net leases may also provide
for periodic rent escalation during the initial term, often on a set percentage increase over
the base rent, as well as during any exercised option periods. Long terms and steady rental
income with the prospect of periodic rent escalation confer stability and can mitigate the
effects of inflation and cyclical downturns in rents.
Moreover, net lease properties appeal to investors as the need to actively manage such
properties is reduced compared with multi-tenant properties. Expenses associated with
the property, particularly large outlays for capital repairs or improvements, are minimized.
In the context of an absolute net lease, the tenant expressly bears these expenses. With a
net lease, the responsibility of a property owner to manage the property is thus minimized
and there is greater cost certainty during the course of the tenancy. By contrast, owners of
multi-tenant real estate often bear the risk of increasing expenses, such as utilities rates,
and the costs of unexpected, and often expensive, capital repairs.
The net lease real estate market appeals increasingly to well-capitalized investors, including
REITs. Many well-capitalized investors prefer industrial and office net lease properties,
particularly properties located in prime markets or mission-critical properties. Investment
in the corporate net lease industrial and office property market is expanding in scope as
real estate operators seek stable assets and yields. Net leased industrial and office properties,
particularly corporate headquarters or other mission-critical spaces integral to core
business operations, present opportunities for investors. Although such properties often
are located outside of markets that many institutional investors deem primary markets,
www.ChambersStreet.com | 5
these properties are ideally suited for net lease investors. Tenants may prefer such markets
because of lower leasing expenses and labor costs than those associated with prime
markets. Despite being in secondary markets, frequently with lower rents than in primary
markets, these properties appeal to net lease investors because of lower acquisition costs
and the greater certainty offered by long-term leases at predictable rental rates. However,
because a net lease property often is leased to a single-tenant, the credit quality of the
tenant is paramount. All other factors being equal, a tenant with a higher credit rating will
confer more value on the property. Accordingly, cap rates can be appreciably lower for
single-tenant, net lease buildings leased by tenants with investment grade credit ratings.
In many respects, single-tenant, net lease real estate is analogous to a corporate bond.
Rent payments are fixed over long periods of time, though periodic, pre-determined rent
escalations may be negotiated. Management of the single-tenant, net lease real estate is
relatively passive, with the tenant assuming the obligation of maintenance and bearing
the operating expenses of the property. However, several key distinctions exist between
a corporate bond and a net lease property. The net lease property is a tangible asset, as
opposed to the intangible right to payment associated with a bond coupon. In the event of
a tenant bankruptcy, whereas the tenant may default on bond obligations, it may continue
paying rent during the restructuring because the leased space houses a mission-critical
aspect of the business. If the tenant rejects the lease during the restructuring, the underlying
real estate maintains some intrinsic value – and perhaps significant value depending
on the location and desirability of the property. Tax benefits unique to real estate ownership
also accrue to the net lease property owner, including the ability to depreciate the
value of the improvements, perhaps sheltering a significant portion of the rental income
collected in the process.
Outlook for Corporate Net Lease Real Estate
Industrial
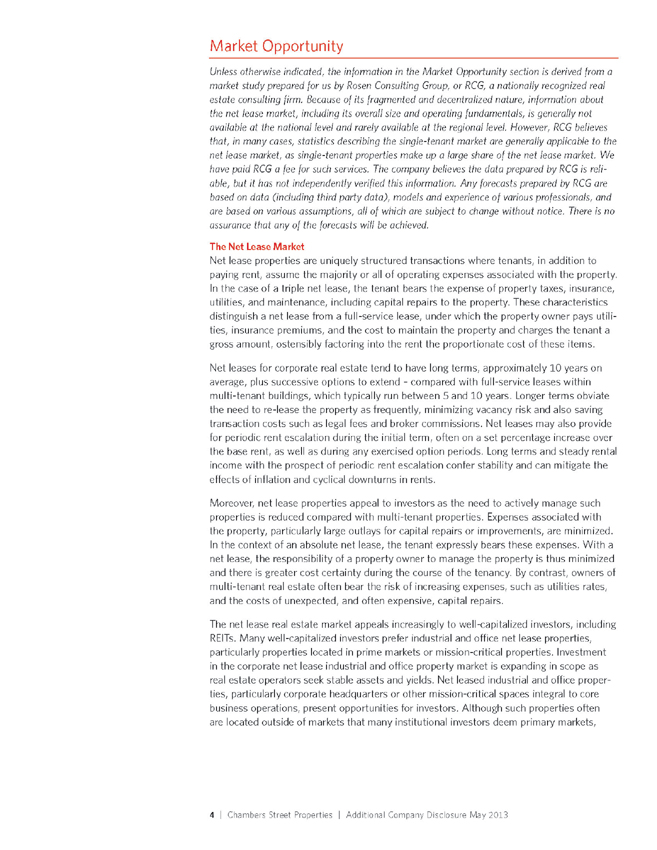
The industrial market is driven by production and distribution of goods, and specific
demand drivers vary from market to market. Overall, the industrial sector is in the early
stages of a moderate growth period, spurred by increased cargo flows driven by the
economic recovery and emphasis on on-shoring and near-shoring manufacturing processes.
Throughout 2012, demand for quality industrial space accelerated across much of the
country, but particularly in major distribution hubs. The rebounding space demand coupled
with little new construction contributed to a decrease in the vacancy rate. Increased
occupancy and tenant demand continued to give landlords leverage to raise asking rents,
particularly for larger and more efficient buildings.
Despite the improved demand conditions, construction activity remained limited, with
approximately 58 million square feet delivered in 2012. While recent construction deliveries
are a substantial recovery from the recession, deliveries were still just one-third of
the construction activity in the years preceding the recession.
Moving forward, the industrial market should continue to improve as the goods movement
and manufacturing industries expand. Improving operating conditions should lead to an
increase in the construction pipeline; however, RCG expects construction lending terms will
remain somewhat restrictive and RCG does not believe there is a significant risk of oversupply.
Note: Latest data as of 4Q12
Sources: C&W, RCG
U_S__National_
Industrial_Vacancy_Rate
__%
__%
_%
_%
_%
_%
‘ ‘ ‘ ‘ ‘ ‘ ‘__f ‘__f ‘__f
6 |
| | C hambers Street Properties | A dditional Company Disclosure May 2013 |
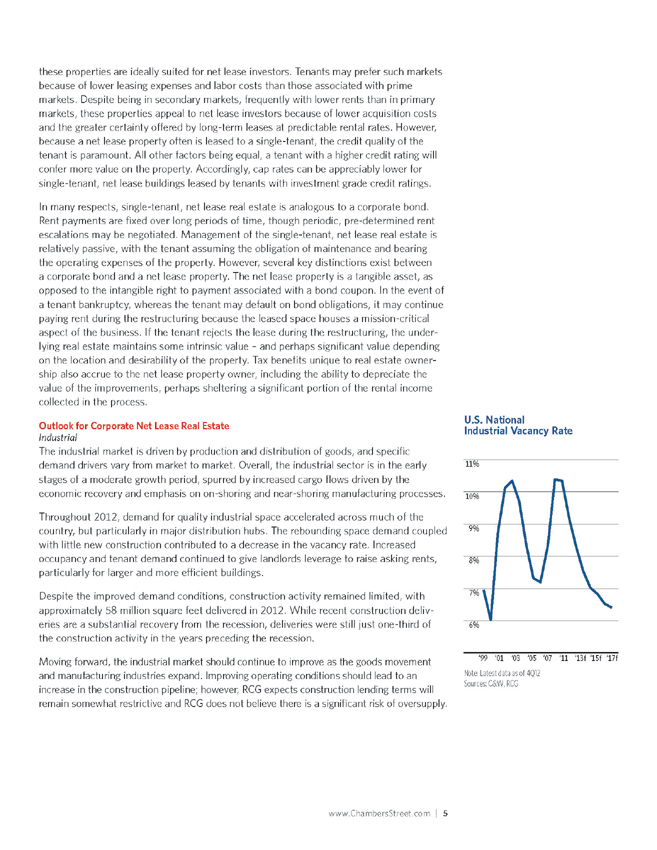
Office
The office market is in the midst of a slow recovery following the recession, with the rate
of recovery varying significantly by metropolitan area and submarket. Nationally, the CBD
office market was tighter than the suburban market at the end of 2012, with improvement
in recent years driven by tech-related employment and by the energy industry. Vacancy
rates in some markets remain elevated. The reasons for high vacancy rates in certain
metropolitan areas depend on the economic and real estate conditions in each location, but
generally include weak job creation and/or a large amount of functionally obsolete space.
Office construction levels remain very low relative to historical levels. The inflationadjusted
value of put-in-place construction averaged $22.0 billion between 2009 and
2012, less than half of the annual average of $48.8 billion during the preceding ten years.
RCG expects the trend of low construction activity to continue through the forecast period,
with the real value of put-in-place construction increasing marginally through the medium
term, but remaining significantly less than the long-term historical average.
On the demand side, RCG expect’s continued moderate growth in office-using employment
to drive steady absorption and a sustainable office market recovery through at least 2017.
With the net addition of nearly 2.1 million jobs in the primary office-using employment
sectors, office vacancy rates should trend downward. As economic conditions improve
further and new supply levels stay low, RCG expects rent growth to reflect moderate,
sustainable rates of improvement.
Net Lease
The net lease market is fragmented and highly fluid. These qualities preclude a precise
quantification of the size of the net lease market – the investable universe of net lease
assets is amorphous and fluctuates continuously as occupiers conduct sale-leaseback
transactions. An indicator of the potential size of the net lease market, estimates of the
value of U.S. real estate owned by corporate owner-occupiers range between $1.5 trillion
and more than $2.0 trillion, making such owner-occupied properties a significant portion
of the estimated $5.2 trillion in U.S. commercial real estate assets.
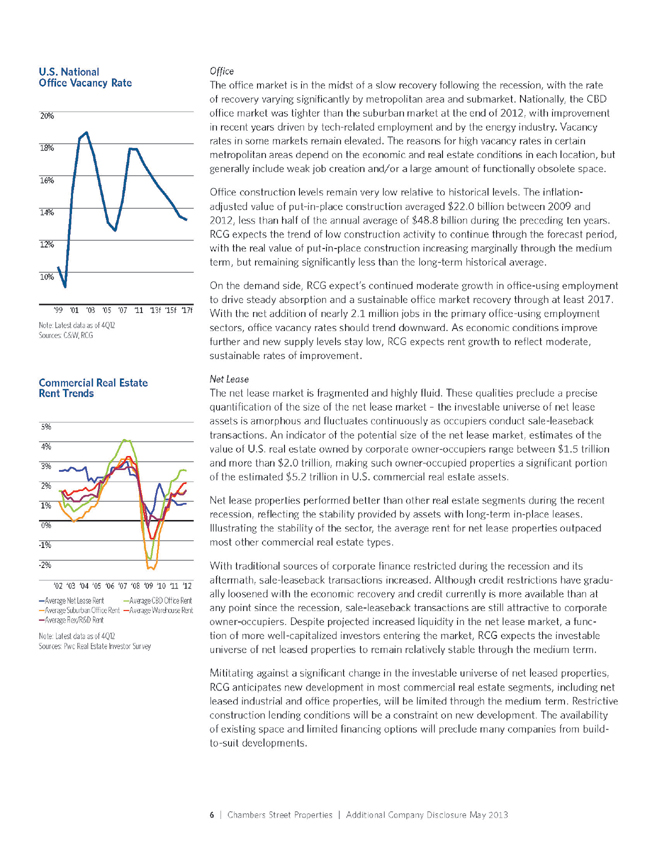
Net lease properties performed better than other real estate segments during the recent
recession, reflecting the stability provided by assets with long-term in-place leases.
Illustrating the stability of the sector, the average rent for net lease properties outpaced
most other commercial real estate types.
With traditional sources of corporate finance restricted during the recession and its
aftermath, sale-leaseback transactions increased. Although credit restrictions have gradually
loosened with the economic recovery and credit currently is more available than at
any point since the recession, sale-leaseback transactions are still attractive to corporate
owner-occupiers. Despite projected increased liquidity in the net lease market, a function
of more well-capitalized investors entering the market, RCG expects the investable
universe of net leased properties to remain relatively stable through the medium term.
Mititating against a significant change in the investable universe of net leased properties,
RCG anticipates new development in most commercial real estate segments, including net
leased industrial and office properties, will be limited through the medium term. Restrictive
construction lending conditions will be a constraint on new development. The availability
of existing space and limited financing options will preclude many companies from buildto-
suit developments.
Note: Latest data as of 4Q12
Sources: C&W, RCG
U_S__National_
O_ce_Vacancy_Rate
__%
__%
__%
__%
__%
__%
‘ ‘_ ‘ ‘ ‘ ‘ ‘_f ‘_ f ‘__f
Note: Latest data as of 4Q12
Sources: Pwc Real Estate Investor Survey
Commercial_Real_Estate
Rent_Trends
_%
_%
_%
_%
_%
_%
-_%
-_%
‘_ ‘_ ‘_ ‘_ ‘ ‘ ‘_ ‘_ ‘_ ‘ ‘__
Average Net Lease Rent Average CBD O_ce Rent
Average Suburban O_ce Rent Average Warehouse Rent
Average Flex/R&D Rent
www.ChambersStreet.com | 7
Capital Environment
With stricter lending guidelines and a reduced appetite for risk in the wake of the recession,
capital availability for commercial real estate remains limited, although there are
signs that lenders are relaxing underwriting standards. During 2012, some larger, more
creditworthy borrowers were able to obtain low, long-term rates. Lending volume accelerated
in 2012, with commercial mortgage originations increasing by 22.7% to $226.1
billion. The CMBS market, hampered since the recession by slow issuance, fluctuating
spreads, and regulatory uncertainty, strengthened during 2012. CMBS issuance reached
$48.4 billion in 2012, increasing by approximately 50% from the previous year. However,
CMBS issuance remained significantly less than peak years between 2005 and 2007,
when levels exceeded $160 billion annually. RCG does not expect CMBS issuance to
approach peak levels during the medium term, but issuance in 2013 should approach
the historical average between 2000 and 2005. Life insurance companies increased
commercial lending activity in 2012. Banks were also active lenders, but ongoing workouts
reduced outstanding commercial mortgages. Access to other forms of corporate finance is
improving, but still limited relative to the pre-recession peak.
Although the capital markets loosened somewhat during 2012, RCG believes that restrictive
lending conditions and limited access to other forms of corporate finance, such as corporate
bond issuances, will persist. In particular, credit for smaller, less creditworthy companies
will remain tight and expensive. Constrained access to credit should continue to spur new
sale-leaseback offerings and present net lease investors with opportunities for acquisitions.
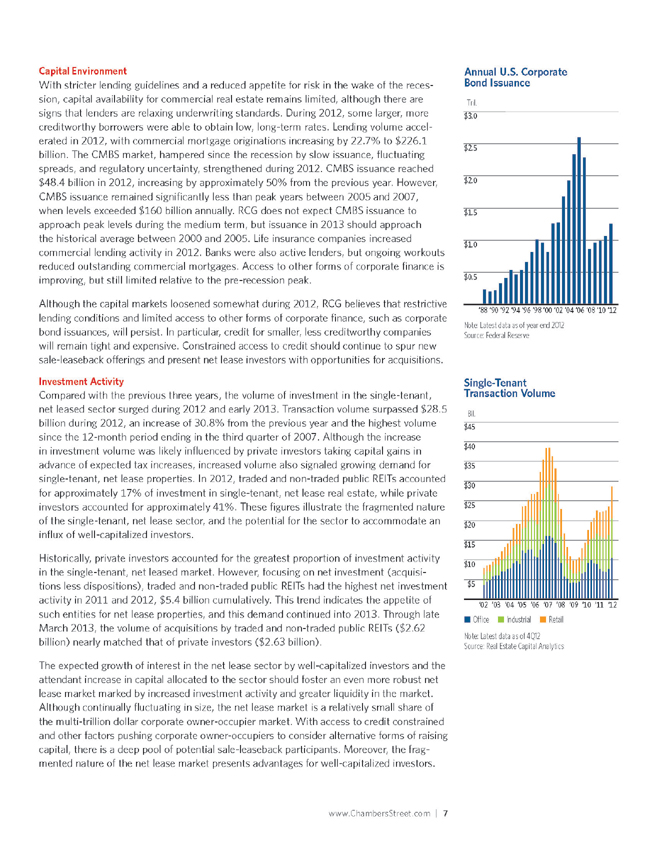
Investment Activity
Compared with the previous three years, the volume of investment in the single-tenant,
net leased sector surged during 2012 and early 2013. Transaction volume surpassed $28.5
billion during 2012, an increase of 30.8% from the previous year and the highest volume
since the 12-month period ending in the third quarter of 2007. Although the increase
in investment volume was likely influenced by private investors taking capital gains in
advance of expected tax increases, increased volume also signaled growing demand for
single-tenant, net lease properties. In 2012, traded and non-traded public REITs accounted
for approximately 17% of investment in single-tenant, net lease real estate, while private
investors accounted for approximately 41%. These figures illustrate the fragmented nature
of the single-tenant, net lease sector, and the potential for the sector to accommodate an
influx of well-capitalized investors.
Historically, private investors accounted for the greatest proportion of investment activity
in the single-tenant, net leased market. However, focusing on net investment (acquisitions
less dispositions), traded and non-traded public REITs had the highest net investment
activity in 2011 and 2012, $5.4 billion cumulatively. This trend indicates the appetite of
such entities for net lease properties, and this demand continued into 2013. Through late
March 2013, the volume of acquisitions by traded and non-traded public REITs ($2.62
billion) nearly matched that of private investors ($2.63 billion).
The expected growth of interest in the net lease sector by well-capitalized investors and the
attendant increase in capital allocated to the sector should foster an even more robust net
lease market marked by increased investment activity and greater liquidity in the market.
Although continually fluctuating in size, the net lease market is a relatively small share of
the multi-trillion dollar corporate owner-occupier market. With access to credit constrained
and other factors pushing corporate owner-occupiers to consider alternative forms of raising
capital, there is a deep pool of potential sale-leaseback participants. Moreover, the fragmented
nature of the net lease market presents advantages for well-capitalized investors.
Note: Latest data as of year end 2012
Source: Federal Reserve
Annual_U_S__Corporate_
Bond_Issuance
‘ ‘ _ ‘ _ ‘ _ ‘ _ ‘ ‘ ‘ ‘ ‘ ‘_ ‘ ‘__
Tril.
Note: Latest data as of 4Q12
Source: Real Estate Capital Analytics
Single-Tenant_
Transaction_Volume
__
‘ ‘_ ‘ ‘ ‘ ‘ ‘ ‘ ‘ ‘ ‘__
_ O_ce _ Industrial _ Retail
Bil.
8 |
| | C hambers Street Properties | A dditional Company Disclosure May 2013 |
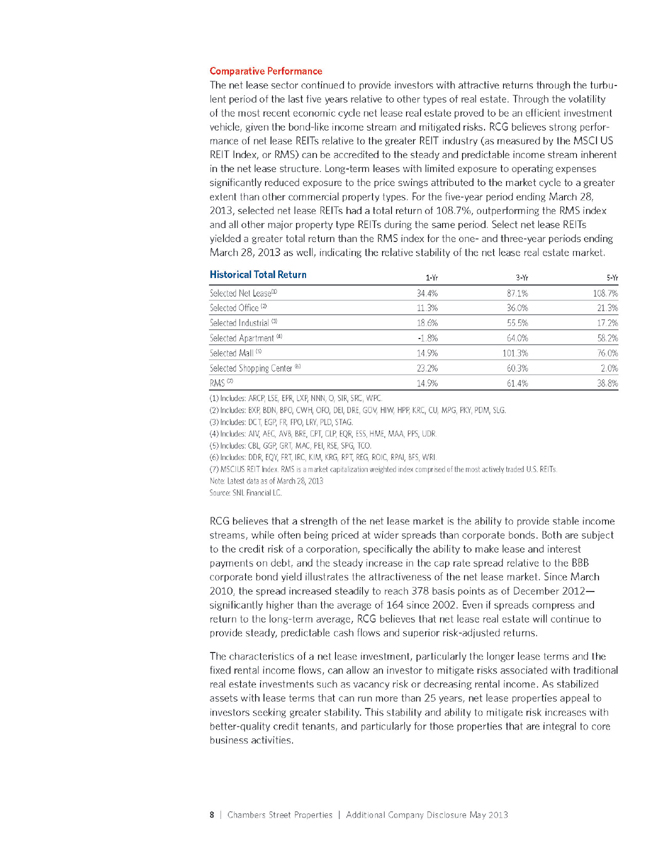
Comparative Performance
The net lease sector continued to provide investors with attractive returns through the turbulent
period of the last five years relative to other types of real estate. Through the volatility
of the most recent economic cycle net lease real estate proved to be an efficient investment
vehicle, given the bond-like income stream and mitigated risks. RCG believes strong performance
of net lease REITs relative to the greater REIT industry (as measured by the MSCI US
REIT Index, or RMS) can be accredited to the steady and predictable income stream inherent
in the net lease structure. Long-term leases with limited exposure to operating expenses
significantly reduced exposure to the price swings attributed to the market cycle to a greater
extent than other commercial property types. For the five-year period ending March 28,
2013, selected net lease REITs had a total return of 108.7%, outperforming the RMS index
and all other major property type REITs during the same period. Select net lease REITs
yielded a greater total return than the RMS index for the one- and three-year periods ending
March 28, 2013 as well, indicating the relative stability of the net lease real estate market.
Historical Total Return 1-Yr 3-Yr 5-Yr
Selected Net Lease(1) 34.4% 87.1% 108.7%
Selected Office (2) 11.3% 36.0% 21.3%
Selected Industrial (3) 18.6% 55.5% 17.2%
Selected Apartment (4) -1.8% 64.0% 58.2%
Selected Mall (5) 14.9% 101.3% 76.0%
Selected Shopping Center (6) 23.2% 60.3% 2.0%
RMS (7) 14.9% 61.4% 38.8%
(1) |
| Includes: ARCP, LSE, EPR, LXP, NNN, O, SIR, SRC, WPC. |
(2) |
| Includes: BXP, BDN, BPO, CWH, OFO, DEI, DRE, GOV, HIW, HPP, KRC, CU, MPG, PKY, PDM, SLG. |
(3) |
| Includes: DCT, EGP, FR, FPO, LRY, PLD, STAG. |
(4) |
| Includes: AIV, AEC, AVB, BRE, CPT, CLP, EQR, ESS, HME, MAA, PPS, UDR. |
(5) |
| Includes: CBL, GGP, GRT, MAC, PEI, RSE, SPG, TCO. |
(6) |
| Includes: DDR, EQY, FRT, IRC, KIM, KRG, RPT, REG, ROIC, RPAI, BFS, WRI. |
(7) |
| MSCIUS REIT Index. RMS is a market capitalization weighted index comprised of the most actively traded U.S. REITs. |
Note: Latest data as of March 28, 2013
Source: SNL Financial LC.
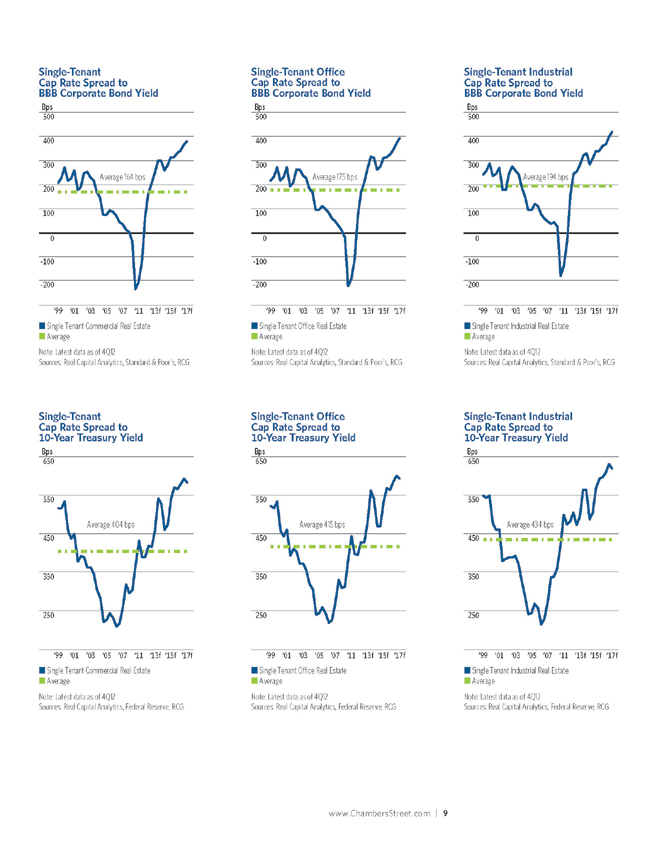
RCG believes that a strength of the net lease market is the ability to provide stable income
streams, while often being priced at wider spreads than corporate bonds. Both are subject
to the credit risk of a corporation, specifically the ability to make lease and interest
payments on debt, and the steady increase in the cap rate spread relative to the BBB
corporate bond yield illustrates the attractiveness of the net lease market. Since March
2010, the spread increased steadily to reach 378 basis points as of December 2012—
significantly higher than the average of 164 since 2002. Even if spreads compress and
return to the long-term average, RCG believes that net lease real estate will continue to
provide steady, predictable cash flows and superior risk-adjusted returns.
The characteristics of a net lease investment, particularly the longer lease terms and the
fixed rental income flows, can allow an investor to mitigate risks associated with traditional
real estate investments such as vacancy risk or decreasing rental income. As stabilized
assets with lease terms that can run more than 25 years, net lease properties appeal to
investors seeking greater stability. This stability and ability to mitigate risk increases with
better-quality credit tenants, and particularly for those properties that are integral to core
business activities.
www.ChambersStreet.com | 9
_ Single Tenant Commercial Real Estate
_ Average
Note: Latest data as of 4Q12
Sources: Real Capital Analytics, Standard & Poor’s, RCG
Average 164 bps
_
Single-Tenant__
Cap_Rate_Spread_to_
BBB_Corporate_Bond_Yield
Bps
‘ ‘ ‘_ ‘_ ‘ ‘_ ‘_ f ‘__f ‘__f
_ Single Tenant Commercial Real Estate
_ Average
Note: Latest data as of 4Q12
Sources: Real Capital Analytics, Federal Reserve, RCG
Average 404 bps
Single-Tenant__
Cap_Rate_Spread_to_
_-Year_Treasury_Yield
Bps
‘ ‘_ ‘_ ‘_ ‘_ ‘ ‘__f ‘__f ‘__f
_ Single Tenant O_ce Real Estate
_ Average
Note: Latest data as of 4Q12
Sources: Real Capital Analytics, Standard & Poor’s, RCG
Average 175 bps
_
Single-Tenant_O_ce__
Cap_Rate_Spread_to_
BBB_Corporate_Bond_Yield
Bps
‘ ‘ ‘ ‘ ‘ ‘ ‘__f ‘__f ‘__f
_ Single Tenant O_ce Real Estate
_ Average
Note: Latest data as of 4Q12
Sources: Real Capital Analytics, Federal Reserve, RCG
Average 415 bps
Single-Tenant_O_ce__
Cap_Rate_Spread_to_
_-Year_Treasury_Yield
Bps
‘ ‘_ ‘_ ‘_ ‘_ ‘ ‘__f ‘__f ‘__f
_ Single Tenant Industrial Real Estate
_ Average
Note: Latest data as of 4Q12
Sources: Real Capital Analytics, Standard & Poor’s, RCG
Average 194 bps
_
Single-Tenant_Industrial__
Cap_Rate_Spread_to_
BBB_Corporate_Bond_Yield
Bps
‘ ‘ ‘ ‘ ‘ ‘ ‘__f ‘__f ‘__f
_ Single Tenant Industrial Real Estate
_ Average
Note: Latest data as of 4Q12
Sources: Real Capital Analytics, Federal Reserve, RCG
Average 434 bps
Single-Tenant_Industrial__
Cap_Rate_Spread_to_
_-Year_Treasury_Yield
Bps
‘ ‘_ ‘_ ‘_ ‘_ ‘ ‘__f ‘__f ‘__f
10 | C hambers Street Properties | A dditional Company Disclosure May 2013
Our History
We were formed and commenced operations in 2004 as CB Richard Ellis Realty Trust,
following an initial $55 million private placement of our common shares placed by Wells
Fargo Investments, LLC to accredited investors. Jack Cuneo, our Chief Executive Officer and
President, developed the initial business plan and obtained sponsorship from CBRE Global
Investors to establish the company. Since that time, we have raised equity capital to finance
our real estate investment activities through two public offerings of our common shares. Our
public offerings raised an aggregate of approximately $2.4 billion in gross offering proceeds,
excluding proceeds associated with common shares issued under our amended and restated
dividend reinvestment plan. Our common shares are not currently listed on a national securities
exchange, but we expect to list them on or about May 21, 2013.
Major milestones in the acquisition of our $3.2 billion portfolio included the acquisition of
a portfolio of six fully leased industrial built-to-suit properties for $248.9 million through
a joint venture with Duke Realty (NYSE: DRE) in May 2008 and our initial international
industrial acquisitions of two properties in the United Kingdom and two properties in
Germany for a total of $52.9 million through a joint venture with the Goodman Group
(ASX:GMG) in June 2010.
Prior to July 1, 2012 we were externally managed by CBRE Advisors LLC, our former
investment advisor, pursuant to an advisory agreement that terminated according to its
terms on June 30, 2012. Substantially all of the current senior management team was
previously employed by an affiliate of our former investment advisor and since inception,
our company has been overseen by a board of trustees, a majority of whom are independent.
In July 2012, we internalized our management team, which did not include a
separate internalization payment to our former investment advisor or its affiliates, and we
changed our name to Chambers Street Properties. As we have progressed, our management
team has amassed a high-quality portfolio of 129 primarily net leased industrial and
office properties located in 22 states and in three countries.
www.ChambersStreet.com | 11
Our Competitive Strengths
We believe we distinguish ourselves from other real estate owners and investors through
the following competitive strengths:
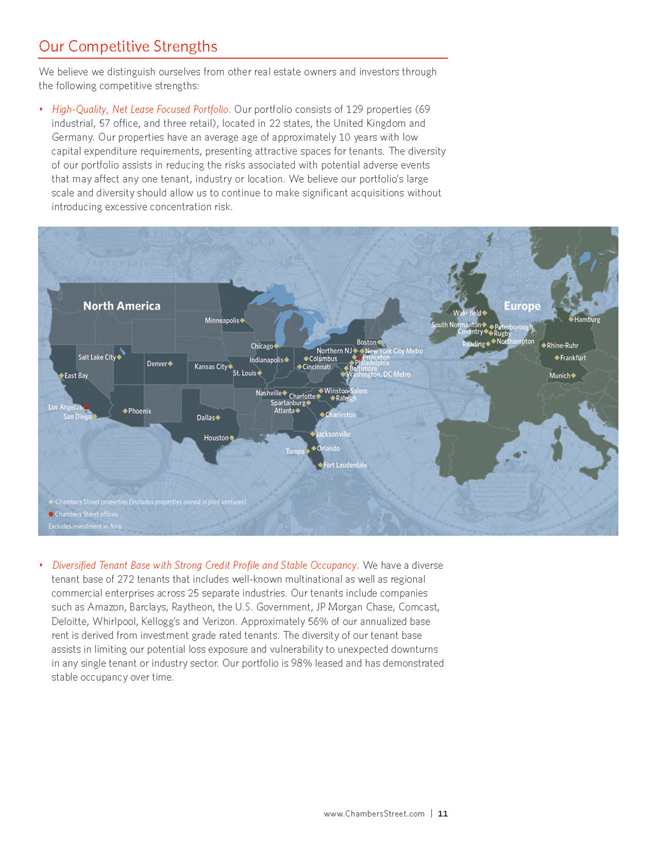
• High-Quality, Net Lease Focused Portfolio. Our portfolio consists of 129 properties (69
industrial, 57 office, and three retail), located in 22 states, the United Kingdom and
Germany. Our properties have an average age of approximately 10 years with low
capital expenditure requirements, presenting attractive spaces for tenants. The diversity
of our portfolio assists in reducing the risks associated with potential adverse events
that may affect any one tenant, industry or location. We believe our portfolio’s large
scale and diversity should allow us to continue to make significant acquisitions without
introducing excessive concentration risk.
• Diversified Tenant Base with Strong Credit Profile and Stable Occupancy. We have a diverse
tenant base of 272 tenants that includes well-known multinational as well as regional
commercial enterprises across 25 separate industries. Our tenants include companies
such as Amazon, Barclays, Raytheon, the U.S. Government, JP Morgan Chase, Comcast,
Deloitte, Whirlpool, Kellogg’s and Verizon. Approximately 56% of our annualized base
rent is derived from investment grade rated tenants. The diversity of our tenant base
assists in limiting our potential loss exposure and vulnerability to unexpected downturns
in any single tenant or industry sector. Our portfolio is 98% leased and has demonstrated
stable occupancy over time.
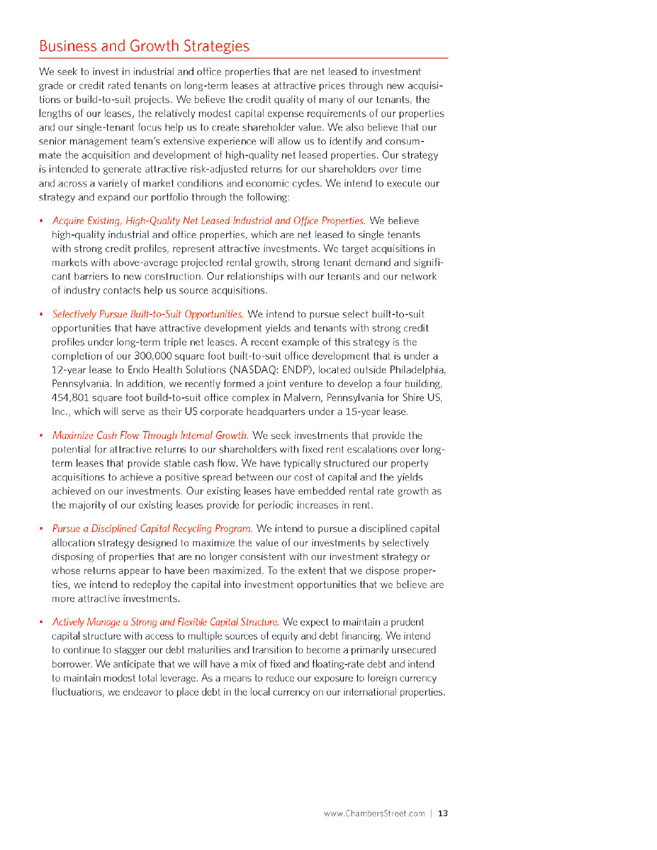
12 | C hambers Street Properties | A dditional Company Disclosure May 2013
Top Tenants S&P Credit Rating(1)
Annualized Base Rent
(in thousands)(2) % ABR
Amazon AA- $16,831 6.6%
Barclays Capital A 12,278 4.8%
Raytheon Company A- 10,023 3.9%
U.S. Government AA+ 9,516 3.7%
National Union Fire Insurance(3) A 6,011 2.4%
JP Morgan Chase A 5,973 2.4%
Nuance Communications BB- 5,665 2.2%
Endo Health Solutions BB 5,591 2.2%
Lord Abbett & Co – 5,211 2.1%
Eisai – 5,189 2.0%
Comcast BBB+ 4,819 1.9%
The Coleman Company – 4,528 1.8%
Deloitte – 4,390 1.7%
Clorox International BBB+ 4,310 1.7%
Barr Laboratories – 4,061 1.6%
Unilever A+ 3,864 1.5%
Other (256 tenants) – 145,702 57.4%
Total $253,962 100.0%
(1) |
| Credit ratings of our tenants, their guarantors or their parent companies. |
(2) Annualized Base Rent for Unconsolidated Properties is at our pro rata share of effective ownership. Includes consolidated and unconsolidated
properties.
(3) The National Union Fire Insurance Company’s lease expired on December 31, 2012, and it vacated the property. The 90 Hudson Street
property is currently 65% leased.
• Long-Term Net Leases. Due to the triple net structure of approximately 82% of our leases
(based on rentable square footage), we do not expect to incur significant operating
and capital expenditures on a recurring basis. Additionally, as the majority of our triple
net leases have contractual annual rent escalations, we have the ability to increase our
stable cash flow over time. Our leases have an average remaining term of 7.3 years, and
we have minimal scheduled lease expirations over the next three years, with over 84%
of annualized base rent expiring after 2015.
• Demonstrated Investment Track Record. We have distinguished ourselves as a reputable
buyer of properties with a strong performance record, having made approximately $340
million of new acquisitions in 2012. We increased the size of the company’s portfolio
from approximately $350 million of real estate assets at the end of 2007, based on pro
rata acquisition cost, to over $3 billion in five years. We believe a lack of new supply
in our markets, tenants’ desire to transition to more efficient buildings and a favorable
interest rate environment creates a positive outlook for future investment activity. Our
acquisition capabilities are driven by our extensive network of industry relationships and
through our deep relationships with our existing tenant base. Our built-to-suit capabilities
are focused on tenants with strong credit profiles and long-term, triple net leases.
We believe we have a dynamic platform in place with the expertise to execute these
potential external opportunities.
• Conservative Balance Sheet with Growth-Oriented Capital Structure. We have a conservative
capital structure with modest leverage. Our $700 million revolving credit facility has
ample capacity and, combined with our unrestricted cash, provides $542 million of total
corporate liquidity. Further, we have a broad unencumbered asset base of $1.3 billion
(based on acquisition cost). We believe that our attractive capital structure should allow
us to continue to make attractive acquisitions and efficiently operate our current portfolio.
• Experienced Management Team. Our senior management team has extensive experience
acquiring, leasing and managing real estate properties and each of whom has played a
pivotal role in our company throughout its growth. Members of our management team
have demonstrated a disciplined track record having acquired and managed our large,
geographically diverse $3.2 billion portfolio, while maintaining a flexible balance sheet
and conservative leverage.
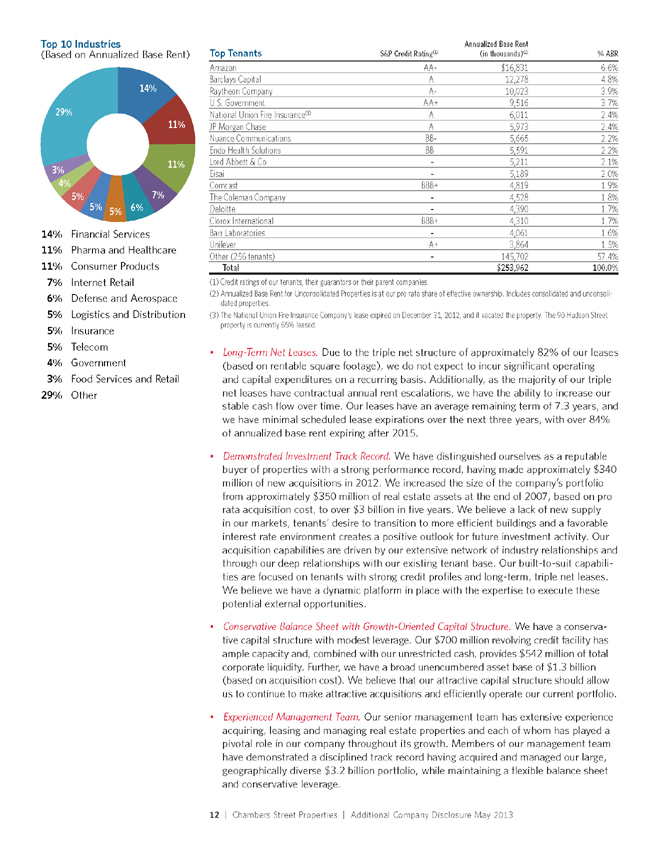
__%
Top Industries
(Based_on_Annualized_Base_Rent)
__%
__%
_%
_% _% %
_%
_%
_%
%
%_ Financial_Services
%_ Pharma_and_Healthcare
%_ Consumer_Products
%_ Internet_Retail
_ %_ Defense_and_Aerospace
%_ Logistics_and_Distribution
%_ Insurance
%_ Telecom
%_ Government
%_ Food_Services_and_Retail
_%_ Other_
www.ChambersStreet.com | 13
Business and Growth Strategies
We seek to invest in industrial and office properties that are net leased to investment
grade or credit rated tenants on long-term leases at attractive prices through new acquisitions
or build-to-suit projects. We believe the credit quality of many of our tenants, the
lengths of our leases, the relatively modest capital expense requirements of our properties
and our single-tenant focus help us to create shareholder value. We also believe that our
senior management team’s extensive experience will allow us to identify and consummate
the acquisition and development of high-quality net leased properties. Our strategy
is intended to generate attractive risk-adjusted returns for our shareholders over time
and across a variety of market conditions and economic cycles. We intend to execute our
strategy and expand our portfolio through the following:
• Acquire Existing, High-Quality Net Leased Industrial and Office Properties. We believe
high-quality industrial and office properties, which are net leased to single tenants
with strong credit profiles, represent attractive investments. We target acquisitions in
markets with above-average projected rental growth, strong tenant demand and significant
barriers to new construction. Our relationships with our tenants and our network
of industry contacts help us source acquisitions.
• Selectively Pursue Built-to-Suit Opportunities. We intend to pursue select built-to-suit
opportunities that have attractive development yields and tenants with strong credit
profiles under long-term triple net leases. A recent example of this strategy is the
completion of our 300,000 square foot built-to-suit office development that is under a
12-year lease to Endo Health Solutions (NASDAQ: ENDP), located outside Philadelphia,
Pennsylvania. In addition, we recently formed a joint venture to develop a four building,
454,801 square foot build-to-suit office complex in Malvern, Pennsylvania for Shire US,
Inc., which will serve as their US corporate headquarters under a 15-year lease.
• Maximize Cash Flow Through Internal Growth. We seek investments that provide the
potential for attractive returns to our shareholders with fixed rent escalations over longterm
leases that provide stable cash flow. We have typically structured our property
acquisitions to achieve a positive spread between our cost of capital and the yields
achieved on our investments. Our existing leases have embedded rental rate growth as
the majority of our existing leases provide for periodic increases in rent.
• Pursue a Disciplined Capital Recycling Program. We intend to pursue a disciplined capital
allocation strategy designed to maximize the value of our investments by selectively
disposing of properties that are no longer consistent with our investment strategy or
whose returns appear to have been maximized. To the extent that we dispose properties,
we intend to redeploy the capital into investment opportunities that we believe are
more attractive investments.
• Actively Manage a Strong and Flexible Capital Structure. We expect to maintain a prudent
capital structure with access to multiple sources of equity and debt financing. We intend
to continue to stagger our debt maturities and transition to become a primarily unsecured
borrower. We anticipate that we will have a mix of fixed and floating-rate debt and intend
to maintain modest total leverage. As a means to reduce our exposure to foreign currency
fluctuations, we endeavor to place debt in the local currency on our international properties.
14 | C hambers Street Properties | A dditional Company Disclosure May 2013
Our Properties
Overview
We own or have majority interests in 129 properties (69 industrial, 57 office, and three
retail) located in 22 states (Arizona, California, Colorado, Florida, Georgia, Illinois, Indiana,
Kansas, Kentucky, Maryland, Massachusetts, Minnesota, Missouri, New Jersey, North
Carolina, Ohio, Pennsylvania, South Carolina, Tennessee, Texas, Utah, and Virginia), the
United Kingdom and Germany encompassing approximately 34.1 million rentable square
feet in the aggregate. Our portfolio has a weighted average age of approximately 10 years
and is 98% leased with approximately 82% of its rentable square footage triple net leased
to single tenants. Additionally, we have more than 270 tenants across 25 different industries
with 7.3 years of average lease term remaining.
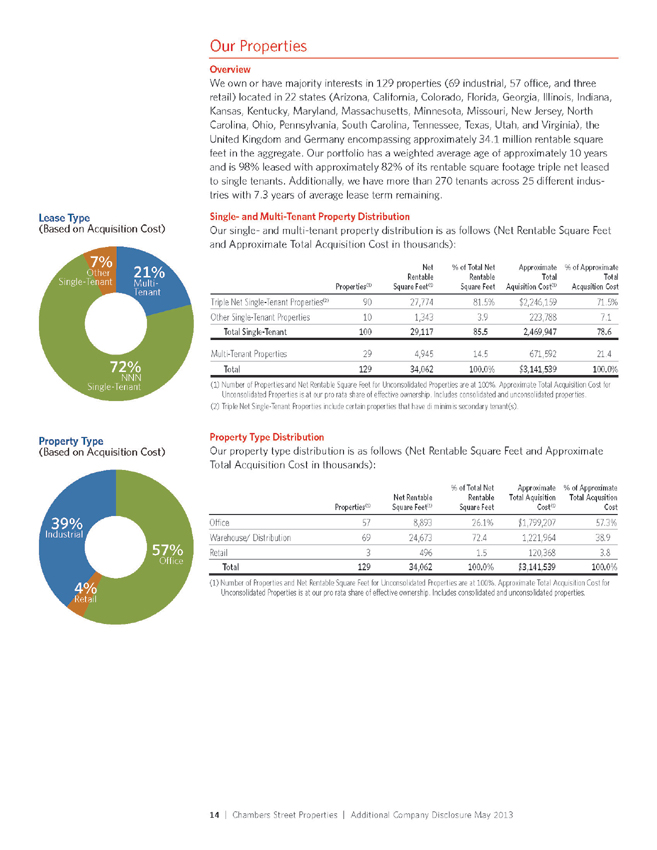
Single- and Multi-Tenant Property Distribution
Our single- and multi-tenant property distribution is as follows (Net Rentable Square Feet
and Approximate Total Acquisition Cost in thousands):
Properties(1)
Net
Rentable
Square Feet(1)
% of Total Net
Rentable
Square Feet
Approximate
Total
Aquisition Cost(1)
% of Approximate
Total
Acqusition Cost
Triple Net Single-Tenant Properties(2) 90 27,774 81.5% $2,246,159 71.5%
Other Single-Tenant Properties 10 1,343 3.9 223,788 7.1
Total Single-Tenant 100 29,117 85.5 2,469,947 78.6
Multi-Tenant Properties 29 4,945 14.5 671,592 21.4
Total 129 34,062 100.0% $3,141,539 100.0%
(1) Number of Properties and Net Rentable Square Feet for Unconsolidated Properties are at 100%. Approximate Total Acquisition Cost for
Unconsolidated Properties is at our pro rata share of effective ownership. Includes consolidated and unconsolidated properties.
(2) |
| Triple Net Single-Tenant Properties include certain properties that have di minimis secondary tenant(s). |
Property Type Distribution
Our property type distribution is as follows (Net Rentable Square Feet and Approximate
Total Acquisition Cost in thousands):
Properties(1)
Net Rentable
Square Feet(1)
% of Total Net
Rentable
Square Feet
Approximate
Total Aquisition
Cost(1)
% of Approximate
Total Acqusition
Cost
Office 57 8,893 26.1% $1,799,207 57.3%
Warehouse/ Distribution 69 24,673 72.4 1,221,964 38.9
Retail 3 496 1.5 120,368 3.8
Total 129 34,062 100.0% $3,141,539 100.0%
(1) Number of Properties and Net Rentable Square Feet for Unconsolidated Properties are at 100%. Approximate Total Acquisition Cost for
Unconsolidated Properties is at our pro rata share of effective ownership. Includes consolidated and unconsolidated properties.
__%
Multi-
Tenant
Lease_Type
(Based_on_Acquisition_Cost)
__%
NNN
Single-Tenant
_%
Other_
Single-Tenant
_%
Retail
Property_Type
(Based_on_Acquisition_Cost)
__%
Industrial
__%
O_ce
www.ChambersStreet.com | 15
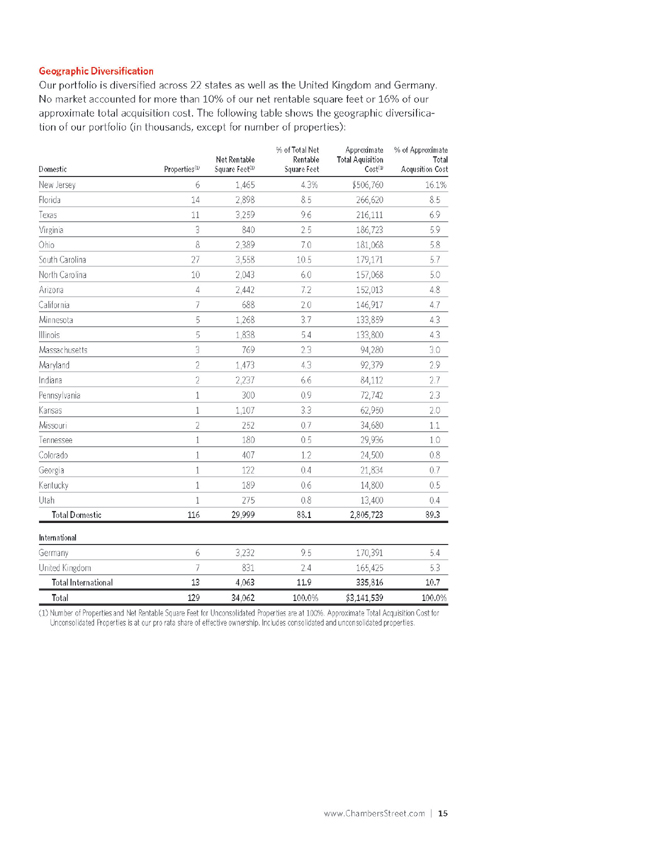
Geographic Diversification
Our portfolio is diversified across 22 states as well as the United Kingdom and Germany.
No market accounted for more than 10% of our net rentable square feet or 16% of our
approximate total acquisition cost. The following table shows the geographic diversification
of our portfolio (in thousands, except for number of properties):
Domestic Properties(1)
Net Rentable
Square Feet(1)
% of Total Net
Rentable
Square Feet
Approximate
Total Aquisition
Cost(1)
% of Approximate
Total
Acqusition Cost
New Jersey 6 1,465 4.3% $506,760 16.1%
Florida 14 2,898 8.5 266,620 8.5
Texas 11 3,259 9.6 216,111 6.9
Virginia 3 840 2.5 186,723 5.9
Ohio 8 2,389 7.0 181,068 5.8
South Carolina 27 3,558 10.5 179,171 5.7
North Carolina 10 2,043 6.0 157,068 5.0
Arizona 4 2,442 7.2 152,013 4.8
California 7 688 2.0 146,917 4.7
Minnesota 5 1,268 3.7 133,859 4.3
Illinois 5 1,838 5.4 133,800 4.3
Massachusetts 3 769 2.3 94,280 3.0
Maryland 2 1,473 4.3 92,379 2.9
Indiana 2 2,237 6.6 84,112 2.7
Pennsylvania 1 300 0.9 72,742 2.3
Kansas 1 1,107 3.3 62,950 2.0
Missouri 2 252 0.7 34,680 1.1
Tennessee 1 180 0.5 29,936 1.0
Colorado 1 407 1.2 24,500 0.8
Georgia 1 122 0.4 21,834 0.7
Kentucky 1 189 0.6 14,800 0.5
Utah 1 275 0.8 13,400 0.4
Total Domestic 116 29,999 88.1 2,805,723 89.3
International
Germany 6 3,232 9.5 170,391 5.4
United Kingdom 7 831 2.4 165,425 5.3
Total International 13 4,063 11.9 335,816 10.7
Total 129 34,062 100.0% $3,141,539 100.0%
(1) Number of Properties and Net Rentable Square Feet for Unconsolidated Properties are at 100%. Approximate Total Acquisition Cost for
Unconsolidated Properties is at our pro rata share of effective ownership. Includes consolidated and unconsolidated properties.
16 | C hambers Street Properties | A dditional Company Disclosure May 2013
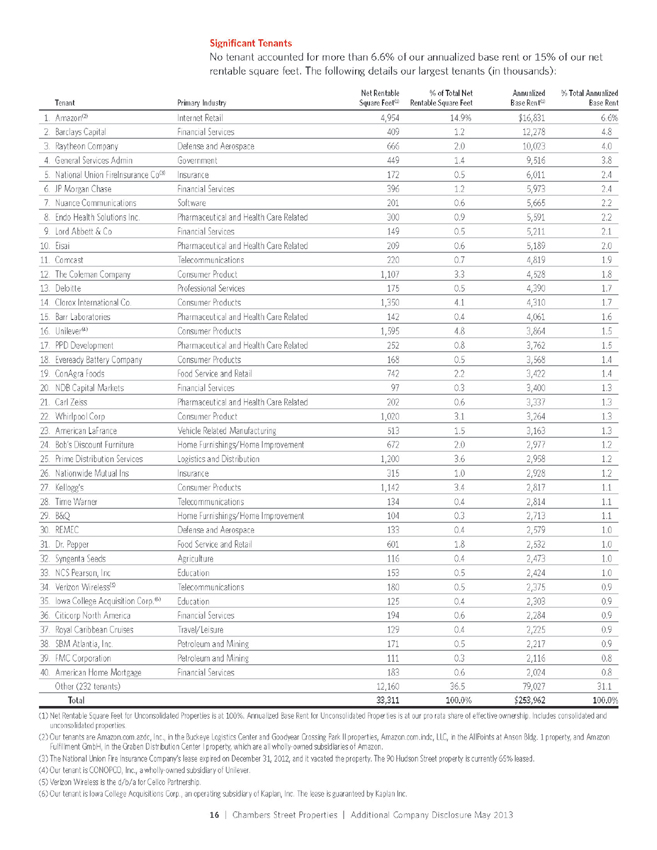
Significant Tenants
No tenant accounted for more than 6.6% of our annualized base rent or 15% of our net
rentable square feet. The following details our largest tenants (in thousands):
Tenant Primary Industry
Net Rentable
Square Feet(1)
% of Total Net
Rentable Square Feet
Annualized
Base Rent(1)
% Total Annualized
Base Rent
1. Amazon(2) Internet Retail 4,954 14.9% $16,831 6.6%
2. Barclays Capital Financial Services 409 1.2 12,278 4.8
3. Raytheon Company Defense and Aerospace 666 2.0 10,023 4.0
4. General Services Admin Government 449 1.4 9,516 3.8
5. National Union FireInsurance Co(3) Insurance 172 0.5 6,011 2.4
6. JP Morgan Chase Financial Services 396 1.2 5,973 2.4
7. Nuance Communications Software 201 0.6 5,665 2.2
8. Endo Health Solutions Inc. Pharmaceutical and Health Care Related 300 0.9 5,591 2.2
9. Lord Abbett & Co Financial Services 149 0.5 5,211 2.1
10. |
| Eisai Pharmaceutical and Health Care Related 209 0.6 5,189 2.0 |
11. |
| Comcast Telecommunications 220 0.7 4,819 1.9 |
12. |
| The Coleman Company Consumer Product 1,107 3.3 4,528 1.8 |
13. |
| Deloitte Professional Services 175 0.5 4,390 1.7 |
14. |
| Clorox International Co. Consumer Products 1,350 4.1 4,310 1.7 |
15. |
| Barr Laboratories Pharmaceutical and Health Care Related 142 0.4 4,061 1.6 |
16. |
| Unilever(4) Consumer Products 1,595 4.8 3,864 1.5 |
17. |
| PPD Development Pharmaceutical and Health Care Related 252 0.8 3,762 1.5 |
18. |
| Eveready Battery Company Consumer Products 168 0.5 3,568 1.4 |
19. |
| ConAgra Foods Food Service and Retail 742 2.2 3,422 1.4 |
20. |
| NDB Capital Markets Financial Services 97 0.3 3,400 1.3 |
21. |
| Carl Zeiss Pharmaceutical and Health Care Related 202 0.6 3,337 1.3 |
22. |
| Whirlpool Corp Consumer Product 1,020 3.1 3,264 1.3 |
23. |
| American LaFrance Vehicle Related Manufacturing 513 1.5 3,163 1.3 |
24. |
| Bob’s Discount Furniture Home Furnishings/Home Improvement 672 2.0 2,977 1.2 |
25. |
| Prime Distribution Services Logistics and Distribution 1,200 3.6 2,958 1.2 |
26. |
| Nationwide Mutual Ins Insurance 315 1.0 2,928 1.2 |
27. |
| Kellogg’s Consumer Products 1,142 3.4 2,817 1.1 |
28. |
| Time Warner Telecommunications 134 0.4 2,814 1.1 |
29. |
| B&Q Home Furnishings/Home Improvement 104 0.3 2,713 1.1 |
30. |
| REMEC Defense and Aerospace 133 0.4 2,579 1.0 |
31. |
| Dr. Pepper Food Service and Retail 601 1.8 2,532 1.0 |
32. |
| Syngenta Seeds Agriculture 116 0.4 2,473 1.0 |
33. |
| NCS Pearson, Inc Education 153 0.5 2,424 1.0 |
34. |
| Verizon Wireless(5) Telecommunications 180 0.5 2,375 0.9 |
35. |
| Iowa College Acquisition Corp.(6) Education 125 0.4 2,303 0.9 |
36. |
| Citicorp North America Financial Services 194 0.6 2,284 0.9 |
37. |
| Royal Caribbean Cruises Travel/Leisure 129 0.4 2,225 0.9 |
38. |
| SBM Atlantia, Inc. Petroleum and Mining 171 0.5 2,217 0.9 |
39. |
| FMC Corporation Petroleum and Mining 111 0.3 2,116 0.8 |
40. |
| American Home Mortgage Financial Services 183 0.6 2,024 0.8 |
Other (232 tenants) 12,160 36.5 79,027 31.1
Total 33,311 100.0% $253,962 100.0%
(1) Net Rentable Square Feet for Unconsolidated Properties is at 100%. Annualized Base Rent for Unconsolidated Properties is at our pro rata share of effective ownership. Includes consolidated and
unconsolidated properties.
(2) Our tenants are Amazon.com.azdc, Inc., in the Buckeye Logistics Center and Goodyear Crossing Park II properties, Amazon.com.indc, LLC, in the AllPoints at Anson Bldg. 1 property, and Amazon
Fulfillment GmbH, in the Graben Distribution Center I property, which are all wholly-owned subsidiaries of Amazon.
(3) The National Union Fire Insurance Company’s lease expired on December 31, 2012, and it vacated the property. The 90 Hudson Street property is currently 65% leased.
(4) |
| Our tenant is CONOPCO, Inc., a wholly-owned subsidiary of Unilever. |
(5) |
| Verizon Wireless is the d/b/a for Cellco Partnership. |
(6) Our tenant is Iowa College Acquisitions Corp., an operating subsidiary of Kaplan, Inc. The lease is guaranteed by Kaplan Inc.
www.ChambersStreet.com | 17
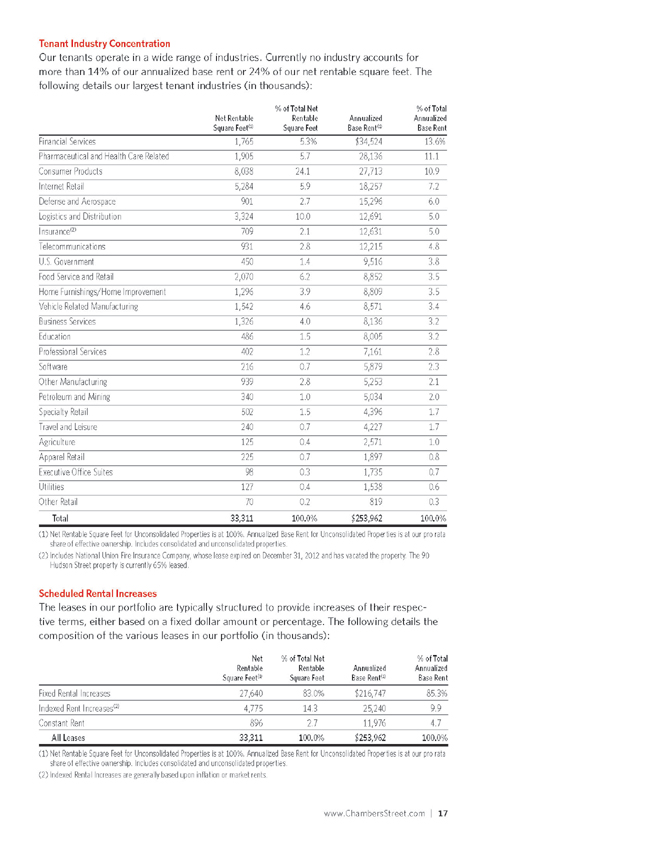
Tenant Industry Concentration
Our tenants operate in a wide range of industries. Currently no industry accounts for
more than 14% of our annualized base rent or 24% of our net rentable square feet. The
following details our largest tenant industries (in thousands):
Net Rentable
Square Feet(1)
% of Total Net
Rentable
Square Feet
Annualized
Base Rent(1)
% of Total
Annualized
Base Rent
Financial Services 1,765 5.3% $34,524 13.6%
Pharmaceutical and Health Care Related 1,905 5.7 28,136 11.1
Consumer Products 8,038 24.1 27,713 10.9
Internet Retail 5,284 5.9 18,257 7.2
Defense and Aerospace 901 2.7 15,296 6.0
Logistics and Distribution 3,324 10.0 12,691 5.0
Insurance(2) 709 2.1 12,631 5.0
Telecommunications 931 2.8 12,215 4.8
U.S. Government 450 1.4 9,516 3.8
Food Service and Retail 2,070 6.2 8,852 3.5
Home Furnishings/Home Improvement 1,296 3.9 8,809 3.5
Vehicle Related Manufacturing 1,542 4.6 8,571 3.4
Business Services 1,326 4.0 8,136 3.2
Education 486 1.5 8,005 3.2
Professional Services 402 1.2 7,161 2.8
Software 216 0.7 5,879 2.3
Other Manufacturing 939 2.8 5,253 2.1
Petroleum and Mining 340 1.0 5,034 2.0
Specialty Retail 502 1.5 4,396 1.7
Travel and Leisure 240 0.7 4,227 1.7
Agriculture 125 0.4 2,571 1.0
Apparel Retail 225 0.7 1,897 0.8
Executive Office Suites 98 0.3 1,735 0.7
Utilities 127 0.4 1,538 0.6
Other Retail 70 0.2 819 0.3
Total 33,311 100.0% $253,962 100.0%
(1) Net Rentable Square Feet for Unconsolidated Properties is at 100%. Annualized Base Rent for Unconsolidated Properties is at our pro rata
share of effective ownership. Includes consolidated and unconsolidated properties.
(2) Includes National Union Fire Insurance Company, whose lease expired on December 31, 2012 and has vacated the property. The 90
Hudson Street property is currently 65% leased.
Scheduled Rental Increases
The leases in our portfolio are typically structured to provide increases of their respective
terms, either based on a fixed dollar amount or percentage. The following details the
composition of the various leases in our portfolio (in thousands):
Net
Rentable
Square Feet(1)
% of Total Net
Rentable
Square Feet
Annualized
Base Rent(1)
% of Total
Annualized
Base Rent
Fixed Rental Increases 27,640 83.0% $216,747 85.3%
Indexed Rent Increases(2) 4,775 14.3 25,240 9.9
Constant Rent 896 2.7 11,976 4.7
All Leases 33,311 100.0% $253,962 100.0%
(1) Net Rentable Square Feet for Unconsolidated Properties is at 100%. Annualized Base Rent for Unconsolidated Properties is at our pro rata
share of effective ownership. Includes consolidated and unconsolidated properties.
(2) |
| Indexed Rental Increases are generally based upon inflation or market rents. |
18 | C hambers Street Properties | A dditional Company Disclosure May 2013
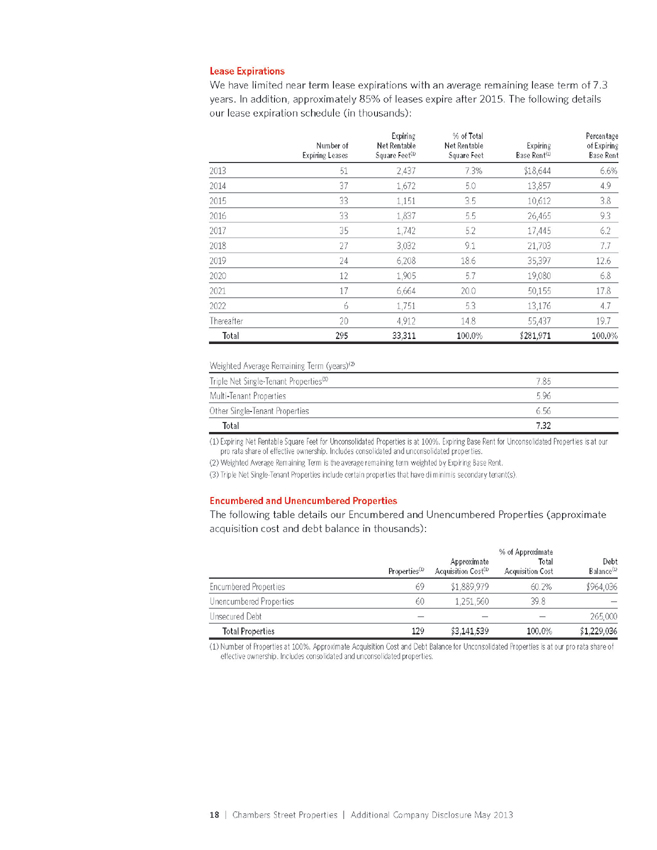
Lease Expirations
We have limited near term lease expirations with an average remaining lease term of 7.3
years. In addition, approximately 85% of leases expire after 2015. The following details
our lease expiration schedule (in thousands):
Number of
Expiring Leases
Expiring
Net Rentable
Square Feet(1)
% of Total
Net Rentable
Square Feet
Expiring
Base Rent(1)
Percentage
of Expiring
Base Rent
2013 51 2,437 7.3% $18,644 6.6%
2014 37 1,672 5.0 13,857 4.9
2015 33 1,151 3.5 10,612 3.8
2016 33 1,837 5.5 26,465 9.3
2017 35 1,742 5.2 17,445 6.2
2018 27 3,032 9.1 21,703 7.7
2019 24 6,208 18.6 35,397 12.6
2020 12 1,905 5.7 19,080 6.8
2021 17 6,664 20.0 50,155 17.8
2022 6 1,751 5.3 13,176 4.7
Thereafter 20 4,912 14.8 55,437 19.7
Total 295 33,311 100.0% $281,971 100.0%
Weighted Average Remaining Term (years)(2)
Triple Net Single-Tenant Properties(3) 7.85
Multi-Tenant Properties 5.96
Other Single-Tenant Properties 6.56
Total 7.32
(1) Expiring Net Rentable Square Feet for Unconsolidated Properties is at 100%. Expiring Base Rent for Unconsolidated Properties is at our
pro rata share of effective ownership. Includes consolidated and unconsolidated properties.
(2) |
| Weighted Average Remaining Term is the average remaining term weighted by Expiring Base Rent. |
(3) |
| Triple Net Single-Tenant Properties include certain properties that have di minimis secondary tenant(s). |
Encumbered and Unencumbered Properties
The following table details our Encumbered and Unencumbered Properties (approximate
acquisition cost and debt balance in thousands):
Properties(1)
Approximate
Acquisition Cost(1)
% of Approximate
Total
Acquisition Cost
Debt
Balance(1)
Encumbered Properties 69 $1,889,979 60.2% $964,036
Unencumbered Properties 60 1,251,560 39.8 —
Unsecured Debt — — — 265,000
Total Properties 129 $3,141,539 100.0% $1,229,036
(1) Number of Properties at 100%. Approximate Acquisition Cost and Debt Balance for Unconsolidated Properties is at our pro rata share of
effective ownership. Includes consolidated and unconsolidated properties.
www.ChambersStreet.com | 19
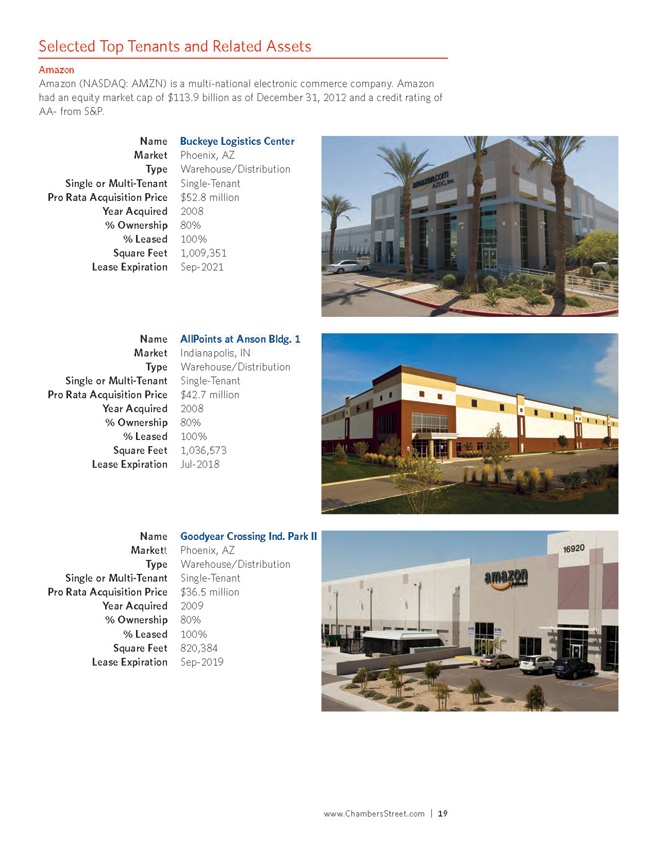
Selected Top Tenants and Related Assets
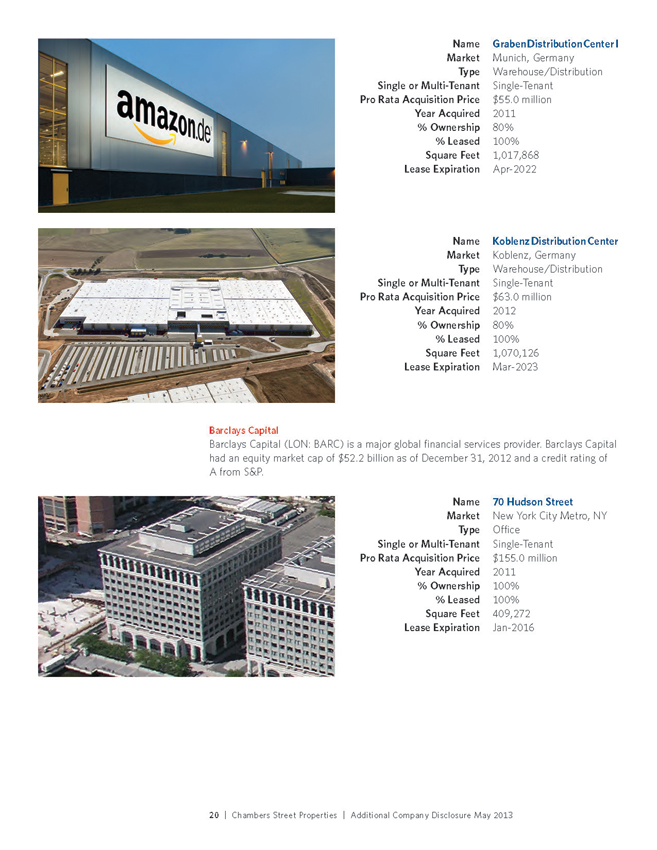
Amazon
Amazon (NASDAQ: AMZN) is a multi-national electronic commerce company. Amazon
had an equity market cap of $113.9 billion as of December 31, 2012 and a credit rating of
AA- from S&P.
Name Buckeye Logistics Center
Market Phoenix, A Z
Type Warehouse/Distribution
Single or TenaMntu ltiS-ingle-Tenant
Pro Rata cqAuisition rPice $52.8 millio n
Year cquired 20A08
% ship 8O0w%n er
% eased 100% L
Square eet 1,009,35F1
Lease ation ExSpeipr-2021
Name AllPoints at Anson Bldg. 1
Market Indianapolis, IN
Type Warehouse/Distribution
Single or TenaMntu ltiS-ingle-Tenant
Pro Rata cqAuisition rPice $42.7 millio n
Year cquired 20A08
% ship 8O0w%n er
% eased 100% L
Square eet 1,036,57F3
Lease ation ExJpuilr-2018
Name Goodyear Crossing Ind. Park II
Markett Phoenix, A Z
Type Warehouse/Distribution
Single or TenaMntu ltiS-ingle-Tenant
Pro Rata cqAuisition rPice $36.5 millio n
Year cquired 20A09
% ship 8O0w%n er
% eased 100% L
Square eet 820,384 F
Lease ation ExSpeipr-2019
20 | C hambers Street Properties | A dditional Company Disclosure May 2013
Name Graben Distribution Center I
Market Munich, Germayn
Type Warehouse/Distribution
Single Tenant Single-Tenant or Pro cquisition rice $55.0 Rmatiall io n P Year cquired 2011 A
% ship 80% Owner
% eased 100% Square eet 1,017,868 Lease ation Apr-2022 Expir
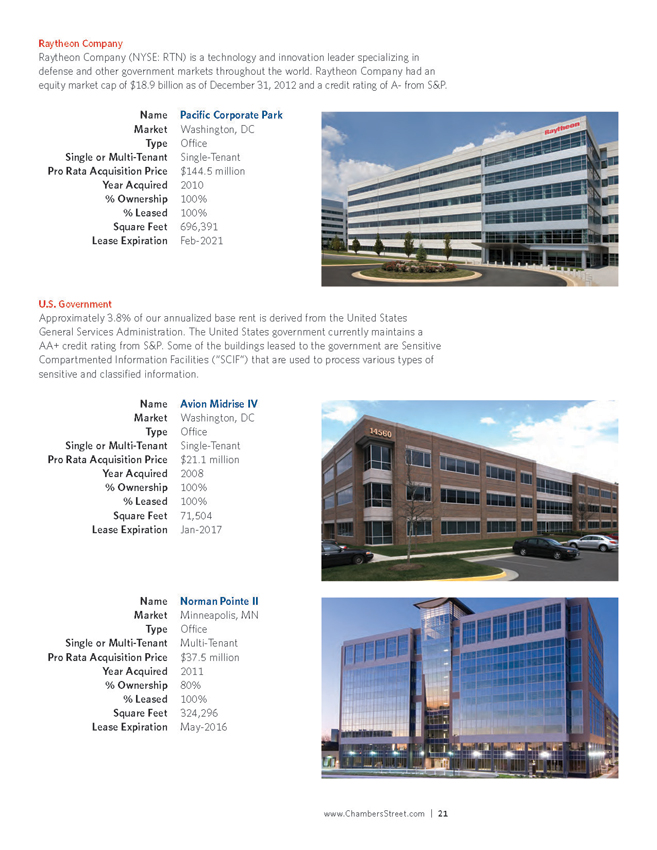
Name Koblenz Distribution Center
Market Koblenz, Germayn
Type Warehouse/Distribution
Single Tenant Single-Tenant or Pro cquisition rice $63.0 Rmatiall io n P Year cquired 2012 A
% ship 80% Owner
% eased 100% Square eet 1,070,126 Lease ation Mar-2023 Expir
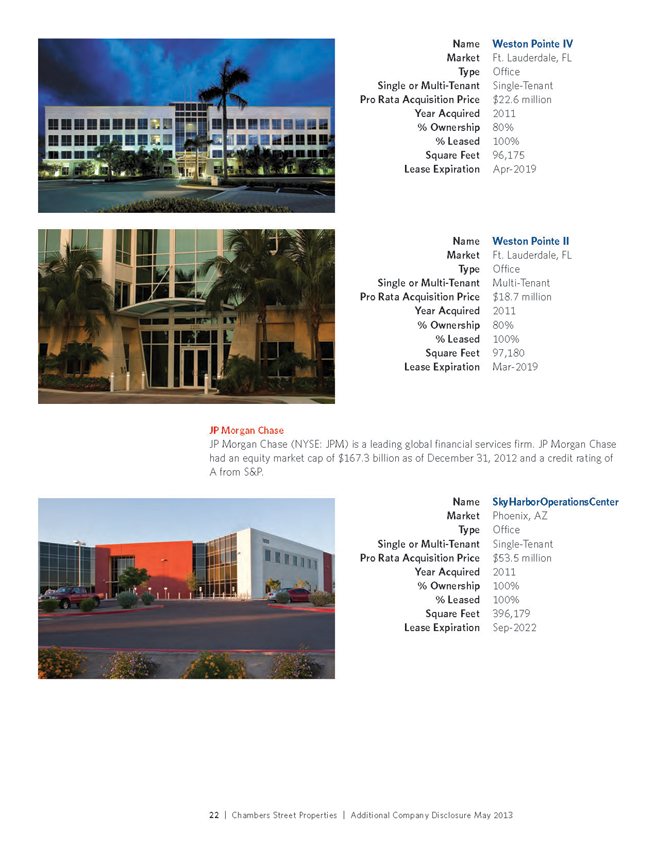
Barclays Capital
Barclays Capital (LON: BARC) is a major global financial services provider. Barclays Capital
had an equity market cap of $52.2 billion as of December 31, 2012 and a credit rating of
A from S&P.
Name 70 Hudson Street
Market New York City Metro, NY
Type Office
Single Tenant Single-Tenant or Pro cquisition rice $155.0 Ramtail lio n P Year cquired 2011 A
% ship 100% Owner
% eased 100% Square eet 409,272 Lease ation Jan-2016 Expir
www.ChambersStreet.com | 21
Raytheon Company
Raytheon Company (NYSE: RTN) is a technology and innovation leader specializing in
defense and other government markets throughout the world. Raytheon Company had an
equity market cap of $18.9 billion as of December 31, 2012 and a credit rating of A- from S&P.
Name Pacific Corporate Park
Market Washington, on, D C
Type Office
Single or TenaMntu ltiS-ingle-Tenant
Pro Rata cqAuisition rPice $144.5 millio n
Year cquired 20A10
% ship 1O0w0n%e r
% eased 100% L
Square eet 696,391 F
Lease ation ExFpeibr-2021
U.S. Government
Approximately 3.8% of our annualized base rent is derived from the United States
General Services Administration. The United States government currently maintains a
AA+ credit rating from S&P. Some of the buildings leased to the government are Sensitive
Compartmented Information Facilities (“SCIF”) that are used to process various types of
sensitive and classified information.
Name Avion Midrise IV
Market Washington, D C
Type Office
Single or TenaMntu ltiS-ingle-Tenant
Pro Rata cqAuisition rPice $21.1 millio n
Year cquired 20A08
% ship 1O0w0n%e r
% eased 100% L
Square eet 71,504 F
Lease ation ExJpainr-2017
Name Norman Pointe II
Market Minneapolis, M N
Type Office
Single or TenaMntu ltiM- ulti-Tenant
Pro Rata cqAuisition rPice $37.5 millio n
Year cquired 20A11
% ship 8O0w%n er
% eased 100% L
Square eet 324,296 F
Lease ation ExMpiary-2016
22 | C hambers Street Properties | A dditional Company Disclosure May 2013
Name Weston Pointe IV
Market Ft. Lauddearle, FL
Type Office
Single Tenant Single-Tenant or Pro cquisition rice $22.6 Rmatiall io n P Year cquired 2011 A
% ship 80% Owner
% eased 100% Square eet 96,175 Lease ation Apr-2019 Expir
Name Weston Pointe II
Market Ft. Lauddearle, FL
Type Office
Single Tenant Multi-Tenant or Pro cquisition rice $18.7 mRilalitoan P Year cquired 2011 A
% ship 80% Owner
% eased 100% Square eet 97,180 Lease ation Mar-2019 Expir
JP Morgan Chase
JP Morgan Chase (NYSE: JPM) is a leading global financial services firm. JP Morgan Chase
had an equity market cap of $167.3 billion as of December 31, 2012 and a credit rating of
A from S&P.
Name Sky Harbor Operations Center
Market Phoenix, A Z
Type Office
Single Tenant Single-Tenant or Pro cquisition rice $53.5 Rmatiall io n P Year cquired 2011 A
% ship 100% Owner
% eased 100% Square eet 396,179 Lease ation Sep-2022 Expir
www.ChambersStreet.com | 23
Senior Management Biographies
Jack A. Cuneo
Mr. Cuneo has been our President and Chief Executive Officer since March 2004. Mr. Cuneo
was the Chairman of our Board of Trustees from January 2009 until June 2012 and was the
President and Chief Executive Officer of our former investment advisor, from March 2004
through June 2012. Mr. Cuneo was also an Executive Managing Director of CBRE Global
Investors from July 2008 until June 2012. Mr. Cuneo has over 43 years of experience in the
real estate industry and had been involved in a wide range of real estate investment activity
including acquisitions, development, joint venture structuring, property sales, work outs and
private equity financing for REITs and real estate operating companies. Prior to joining CBRE
Global Investors in June 2003, Mr. Cuneo served as President of Cuneo Capital Group which
engaged in advisory and private equity investment activities from 2002 to 2003. Mr. Cuneo
also spent 26 years at Merrill Lynch where he served from 1997 to 2000 as the Chairman
and Chief Executive Officer of Merrill Lynch Hubbard, a real estate investment subsidiary
which acquired, operated and sold over 100 properties valued at $1.8 billion on behalf of
over 240,000 individual investors. Mr. Cuneo was a Managing Director of the Global Real
Estate and Hospitality Group at Merrill Lynch from 2000 to 2002 where he led private equity,
advisory and asset sales activities. He is a member of the Urban Land Institute (ULI), the
Policy Advisory Board at the Haas School of Business, University of California at Berkeley and
the Real Estate Board of New York. Mr. Cuneo received a B.A. from City College of New York
and pursued graduate studies at the University of Massachusetts at Amherst.
Martin A. Reid
Mr. Reid has been one of our trustees since March 2005, our Executive Vice President and
Chief Financial Officer since June 2012 and our Treasurer and Secretary since September
2012. From September 2010 to June 2012, Mr. Reid was the Executive Vice President,
Development and Acquisitions at Interstate Hotels & Resorts where he was responsible for
real estate holdings, sourcing and acquiring hotels, and identifying management contract
opportunities. Prior to joining Interstate, Mr. Reid was a partner in Cheswold Real Estate
Investment Management. Prior to joining Cheswold, Mr. Reid was the Chief Executive
Officer of the General Partner of Redstone Hotel Partners, advising on hotel transactions
and fund raising activities. From 1998 until 2006, Mr. Reid was a Managing Director of
Thayer Lodging where he was responsible for acquisitions, dispositions, capital raising and
financial matters of the Thayer Lodging. Mr. Reid has a broad professional background
in real estate investment, capital markets and finance, including experience in public
accounting and financial reporting. Prior to joining Thayer Lodging in 1998, Mr. Reid spent
four years as a Principal at LaSalle Advisors in Baltimore, Maryland, successor through
merger to Alex. Brown Kleinwort Benson, where he originated and closed real estate transactions
for pension fund clients. Prior to his tenure with LaSalle, Mr. Reid spent several
years in acquisitions and dispositions with real estate investment and advisory affiliates of
Merrill Lynch & Co. and Chase Manhattan Bank, where he was involved in the acquisition
of several office, retail and residential properties and portfolios. Mr. Reid received a B.S.
in Accounting from the State University of New York at Albany and an M.B.A. in Financial
Management from Pace University. Mr. Reid is a Member of the American Institute of
Certified Public Accountants and is a Full Member of the Urban Land Institute (ULI).
24 | C hambers Street Properties | A dditional Company Disclosure May 2013
Philip L. Kianka
Mr. Kianka became the Executive Vice President and Chief Operating Officer of Chambers
Street Properties in July 2012. Prior to joining Chambers Street Properties, Mr. Kianka was
the Executive Vice President and Chief Operating Officer at CB Richard Ellis Realty Trust
from October 2008 to June 2012. Mr. Kianka was the Director of Operations of our former
investment advisor from January 2006 to June 2012. Mr. Kianka was also a Managing
Director of CBRE Global Investors from January 2006 until June 2012. Mr. Kianka has
over 28 years of experience in acquisitions, asset and portfolio management, joint venture
structuring, development, financing and dispositions of real estate. Prior to joining our
former investment advisor, Mr. Kianka was a Vice President and senior asset manager for
Lexington Properties Trust from 1997 to December 2005. Mr. Kianka also spent 13 years
as Vice President at Merrill Lynch Hubbard, a real estate investment subsidiary of Merrill
Lynch, which acquired, operated and sold over 100 properties valued at $1.8 billion on
behalf of over 240,000 investors. Mr. Kianka received a B.A. and a Master of Architecture
from Clemson University in Clemson, South Carolina and is a licensed architect and
member of the American Institute of Architects and a Full Member of the Urban Land
Institute (ULI).
www.ChambersStreet.com | 25
Our Organizational Structure
We operate in an umbrella partnership REIT structure in which our operating partnership,
CSP Operating Partnership, LP (“CSP OP”) owns, directly or indirectly, substantially all of
the properties acquired on our behalf. We are CSP OP’s majority owner and sole general
partner. We elected to be taxed as a real estate investment trust (“REIT”) under sections
856 through 860 of the Internal Revenue Code of 1986, as amended (the “Internal Revenue
Code”), beginning with the taxable period ended December 31, 2004. For each interest
in our common shares that we issue, an equal interest in the limited partnership units of
CSP OP is issued to us in exchange for the cash proceeds from the issuance of the interest
in our common shares. We own approximately 99.90% of the common partnership units
of CSP OP. An affiliate of our former investment advisor, CBRE REIT Holdings, LLC (“REIT
Holdings”), holds the remaining interest in CSP OP through 246,361 limited partnership
units representing approximately a 0.10% ownership of the total limited partnership units.
In exchange for services provided to us relating to our formation and subsequent operations,
we have also issued to REIT Holdings a Class B limited partnership interest (“Class B
interest”) in CSP OP, which certain of our executive officers own an aggregate 15% distribution
interest. As the holder of the Class B interest, REIT Holdings is entitled to receive
distributions made by CSP OP in an amount equal to 15% of all net sales proceeds on
dispositions of properties or other assets (including by liquidation, merger or otherwise)
above a threshold equal to the amount at which the other partners, including us, have
received in the aggregate, cumulative distributions from property income, sales proceeds
or other services equal to (i) the total capital contributions made to CSP OP and (ii) a 7%
annual, uncompounded return on such capital contributions.
The Class B interest may be redeemed upon the occurrence of certain events, including our
common shares becoming listed or admitted to trading on a national securities exchange
or designated for quotation on the NASDAQ Global Select Market or the NASDAQ Global
Market (a “Listing”). In the event of a redemption of the Class B interest in connection
with a Listing, the consideration will be determined based upon the average closing price,
or the average of the bid and asked prices, as the case may be, of our shares for a 30-day
period beginning 150 days after the Listing (the “30-Day Market Value”). Upon redemption
of the Class B interest following a Listing, the consideration shall be paid within 10
business days of the determination of the 30-Day Market Value, and such consideration
shall be paid, as determined by our board of trustees, either in the form of cash or shares.
26 | C hambers Street Properties | A dditional Company Disclosure May 2013
Definitions
We use the term “net lease” throughout this document. Under a net lease, the tenant
occupying the leased property (usually as a single-tenant) does so in much the same
manner as if the tenant were the owner of the property. There are various forms of net
leases, most typically classified as “triple net” or “double net.” Triple net leases typically
require the tenant to pay all costs associated with a property, including real estate taxes,
insurance, utilities and routine maintenance in addition to the base rent. Double net leases
typically require the tenant to pay all the costs as triple net leases, but hold the landlord
responsible for capital expenditures, including the repair or replacement of specific
structural and/or bearing components of a property, such as the roof or structure of the
building. Accordingly, the owner receives the rent “net” of these expenses, rendering the
cash flow associated with the lease predictable for the term of the lease and exposing the
owner to limited expense risk. Under a net lease, the tenant generally agrees to lease the
property for a significant term and agrees that it will have either no ability or only limited
ability to terminate the lease or abate rent prior to the expiration of the term of the lease
as a result of real estate driven events such as casualty, condemnation or failure by the
landlord to fulfill its obligations under the lease. A majority of the leases of our properties
are net leases.
We use the term “credit rated tenant” throughout this document. When we refer to a
“credit rated tenant,” we mean a tenant, or the tenant’s guarantor or parent, that has a
credit rating, as determined by either Standard and Poor’s (“S&P”) or Moody’s. When we
refer to an “investment grade rated tenant,” we mean a tenant, or the tenant’s guarantor
or parent, that has an investment grade credit rating, as determined by either Standard
and Poor’s (“S&P”) or Moody’s.
We use the term “annualized base rent” or “ABR” throughout this document. When we
refer to “annualized base rent,” we mean as of December 31, 2012, either (i) current cash
base rent due on an annualized basis, or (ii) for any lease still in an initial free or reduced
rent period as of December 31, 2012, base rent due during the 12 months following
December 31, 2012.
Forward Looking Statements This document may contain various “forward-looking statements.” You can identify forward-looking statements by the use of forward-looking terminology such as “believes,” “expects,” “may,” “will,” “would,” “could,” “should,” “seeks,” “approximately,” “intends,” “plans,” “projects,” “estimates” or “anticipates” or the negative of these words and phrases or similar words or phrases. You can also identify forward-looking statements by discussions of strategy, plans or intentions, including statements about the timing and likelihood of providing a liquidity event to our shareholders. Statements regarding the following subjects may be impacted by a number of risks and uncertainties such as our busi-ness strategy; our ability to obtain future financing arrangements; estimates relating to our future distributions; our understanding of our competition; market trends; projected capital expenditures; the impact of technology on our products, operations and business; and the use of the proceeds of any offerings of securities. The forward-looking statements are based on our beliefs, assumptions and expectations of our future performance, taking into account all information currently available to us. These beliefs, assumptions and expectations are subject to risks and uncertainties and can change as a result of many possible events or factors, not all of which are known to us. If a change occurs, our business, financial condition, liquidity and results of operations may vary materially from those expressed in our forward-looking statements. You should carefully consider these risks before you make an investment decision with respect to our common shares, along with the following factors that could cause actual results to vary from our forward-looking statements such as our ability to complete the listing of our common shares on the NYSE; the price at which our common shares may trade on the NYSE; national, regional and local economic climates; changes in supply and demand for office and industrial properties; adverse changes in the real estate markets, including increasing vacancy, decreasing rental revenue and increasing insurance costs; availability and credit worthiness of prospective tenants; our ability to maintain rental rates and maximize occupancy; our ability to identify and secure acquisitions; our failure to successfully manage growth or operate acquired properties; our pace of acquisitions and/or dispositions of properties; risks related to development projects (including construction delay, cost overruns or our inability to obtain necessary permits); payment of distributions from sources other than cash flows and operating activities; receiving corpo-rate debt ratings and changes in the general interest rate environment; availability of capital (debt and equity); our ability to refinance existing indebtedness or incur additional indebtedness; failure to comply with our debt covenants; unanticipated increases in financing and other costs, including a rise in interest rates; the actual outcome of the resolution of any conflict; material adverse actions or omissions by any of our joint venture partners; our ability to operate as a self-managed company; availability of and ability to retain our executive officers and other qualified personnel; future terrorist attacks in the United States or abroad; the ability of our operating partnership to continue to qualify as a partnership for U.S. federal income tax purposes; our ability to continue to qualify as a REIT for U.S. federal income tax purposes; foreign currency fluctua-tions; changes to accounting principles, policies and guidelines applicable to REITs; legislative or regulatory changes adversely affecting REITs and the real estate business; environmental, regulatory and/or safety requirements; and other factors discussed under Item 1A Risk Factors of our Annual Report on Form 10-K for the year ended December 31, 2012 and those factors that may be contained in any filing we make with the Securities and Exchange Commission. We undertake no obligation to publicly update or revise any forward-looking statements, whether as a result of future events, new information or otherwise.