Exhibit 99.1
Company Presentation
September 2013
Forward Looking Statements
This presentation may contain various “forward-looking statements.” You can identify forward-looking statements by the use of forward-looking terminology such as “believes,” “expects,” “may,” “will,” “would,” “could,” “should,” “seeks,” “approximately,” “intends,” “plans,” “projects,” “estimates” or “anticipates” or the negative of these words and phrases or similar words or phrases. You can also identify forward-looking statements by discussions of strategy, plans or intentions. Statements regarding the following subjects may be impacted by a number of risks and uncertainties such as our business strategy; our ability to obtain future financing arrangements; estimates relating to our future distributions; our understanding of our competition; market trends; projected capital expenditures; the impact of technology on our products, operations and business; and the use of the proceeds of any offerings of securities.
The forward-looking statements are based on our beliefs, assumptions and expectations of our future performance, taking into account all information currently available to us. These beliefs, assumptions and expectations are subject to risks and uncertainties and can change as a result of many possible events or factors, not all of which are known to us. If a change occurs, our business, financial condition, liquidity and results of operations may vary materially from those expressed in our forward-looking statements. You should carefully consider these risks before you make an investment decision with respect to our common shares, along with the following factors that could cause actual results to vary from our forward-looking statements such as: general volatility of the securities markets in which we participate; national, regional and local economic climates; changes in supply and demand for office and industrial properties; adverse changes in the real estate markets, including increasing vacancy, decreasing rental revenue and increasing insurance costs; availability and credit worthiness of prospective tenants; our ability to maintain rental rates and maximize occupancy; our ability to identify and secure acquisitions; our failure to successfully manage growth or operate acquired properties; our pace of acquisitions and/or dispositions of properties; risks related to development projects (including construction delay, cost overruns or our inability to obtain necessary permits); payment of distributions from sources other than cash flows and operating activities; receiving corporate debt ratings and changes in the general interest rate environment; availability of capital (debt and equity); our ability to refinance existing indebtedness or incur additional indebtedness; failure to comply with our debt covenants; unanticipated increases in financing and other costs, including a rise in interest rates; the actual outcome of the resolution of any conflict; material adverse actions or omissions by any of our joint venture partners; our ability to operate as a self-managed company; availability of and ability to retain our executive officers and other qualified personnel; future terrorist attacks in the United States or abroad; the ability of our operating partnership to continue to qualify as a partnership for U.S. federal income tax purposes; our ability to continue to qualify as a REIT for U.S. federal income tax purposes; foreign currency fluctuations; changes to accounting principles, policies and guidelines applicable to REITs; legislative or regulatory changes adversely affecting REITs and the real estate business; and environmental, regulatory and/or safety requirements. The foregoing review of important factors should not be construed as exhaustive and should be read in conjunction with the other cautionary statements that are included herein and elsewhere, including the risk factors included in the Company’s Annual Report on Form 10-K for the fiscal year ended December 31, 2012, the Company’s Quarterly Report on Form 10-Q for the fiscal quarter ended June 30, 2013 and other documents of the Company on file with or furnished to the SEC; except to the extent that the risk factors therein are inconsistent with the fact that (i) we listed our shares on the NYSE on May 21, 2013 and (ii) we have amended and restated our bylaws and our declaration of trust. Any forward looking statements made in this press release are qualified by these cautionary statements, and there can be no assurance that the actual results or developments anticipated by the Company will be realized or, even if substantially realized, that they will have the expected consequences to, or effects on, the Company or its business or operations.
Except as required by law, the Company undertakes no obligation to update publicly or revise any forward looking statement, whether as a result of new information, future developments or otherwise. We caution you that actual outcomes and results may differ materially from what is expressed, implied or forecast by our forward looking statements.
Unless otherwise noted, the information in this presentation represents our portfolio as of June 30, 2013 and includes our consolidated and unconsolidated properties at our pro rata share of ownership.
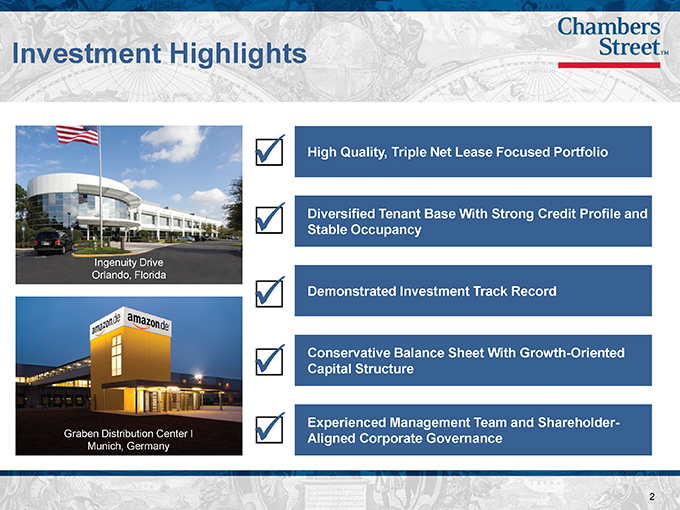
Investment Highlights
Ingenuity Drive
Orlando, Florida
Graben Distribution Center I
Munich, Germany
?High Quality, Triple Net Lease Focused Portfolio
?Diversified Tenant Base With Strong Credit Profile and Stable Occupancy
?Demonstrated Investment Track Record
?Conservative Balance Sheet With Growth-Oriented Capital Structure
?Experienced Management Team and Shareholder-Aligned Corporate Governance
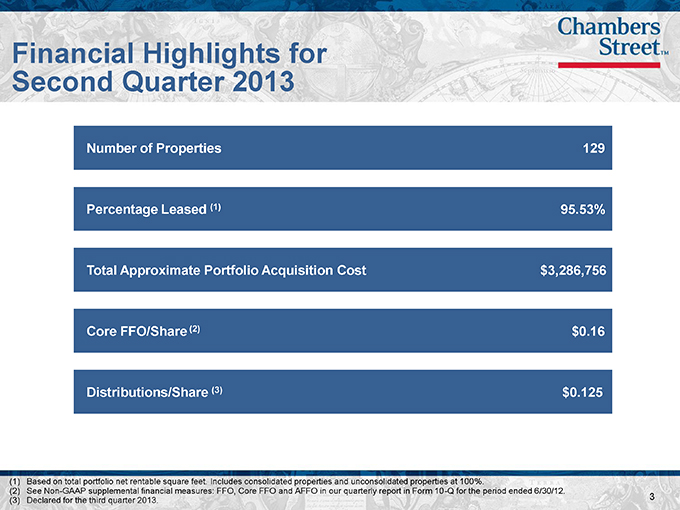
Financial Highlights for Second Quarter 2013
Number of Properties 129
Percentage Leased (1) 95.53%
Total Approximate Portfolio Acquisition Cost $3,286,756
Core FFO/Share (2) $0.16
Distributions/Share (3) $0.125
(1) Based on total portfolio net rentable square feet. Includes consolidated properties and unconsolidated properties at 100%.
(2) See Non-GAAP supplemental financial measures: FFO, Core FFO and AFFO in our quarterly report in Form 10-Q for the period ended 6/30/12.
(3) | | Declared for the third quarter 2013. |
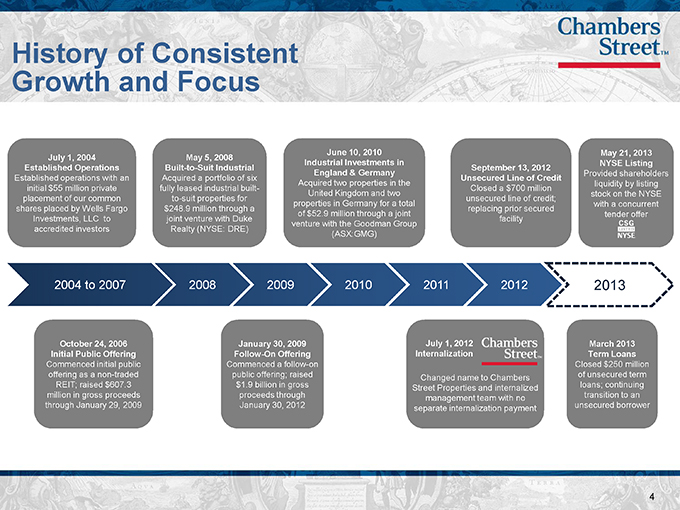
History of Consistent
Growth and Focus
July 1, 2004
Established Operations
Established operations with an
initial $55 million private
placement of our common
shares placed by Wells Fargo
Investments, LLC to
accredited investors
May 5, 2008
Built-to-Suit Industrial
Acquired a portfolio of six
fully leased industrial built-
to-suit properties for
$248.9 million through a
joint venture with Duke
Realty (NYSE: DRE)
June 10, 2010
Industrial Investments in
England & Germany
Acquired two properties in the
United Kingdom and two
properties in Germany for a total
of $52.9 million through a joint
venture with the Goodman Group
(ASX:GMG)
September 13, 2012
Unsecured Line of Credit
Closed a $700 million
unsecured line of credit;
replacing prior secured
facility
May 21, 2013
NYSE Listing
Provided shareholders
liquidity by listing
stock on the NYSE
with a concurrent
tender offer
2004 to 2007
2008
2009
2010
2011
2012
2013
October 24, 2006
Initial Public Offering
Commenced initial public
offering as a non-traded
REIT; raised $607.3
million in gross proceeds
through January 29, 2009
January 30, 2009
Follow-On Offering
Commenced a follow-on
public offering; raised
$1.9 billion in gross
proceeds through
January 30, 2012
July 1, 2012
Internalization
Changed name to Chambers
Street Properties and internalized
management team with no
separate internalization payment
March 2013
Term Loans
Closed $250 million
of unsecured term
loans; continuing
transition to an
unsecured borrower
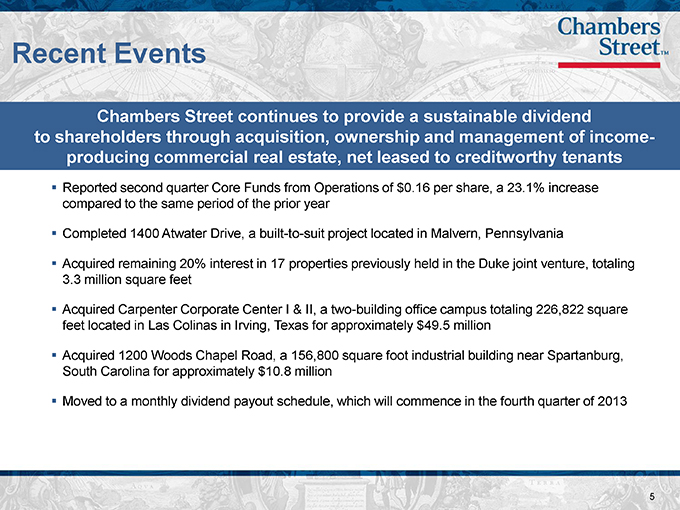
Recent Events
Chambers Street continues to provide a sustainable dividend to shareholders through acquisition, ownership and management of income producing commercial real estate, net leased to creditworthy tenants
Reported second quarter Core Funds from Operations of $0.16 per share, a 23.1% increase compared to the same period of the prior year
Completed 1400 Atwater Drive, a built-to-suit project located in Malvern, Pennsylvania
Acquired remaining 20% interest in 17 properties previously held in the Duke joint venture, totaling 3.3 million square feet
Acquired Carpenter Corporate Center I & II, a two-building office campus totaling 226,822 square feet located in Las Colinas in Irving, Texas for approximately $49.5 million
Acquired 1200 Woods Chapel Road, a 156,800 square foot industrial building near Spartanburg, South Carolina for approximately $10.8 million
Moved to a monthly dividend payout schedule, which will commence in the fourth quarter of 2013
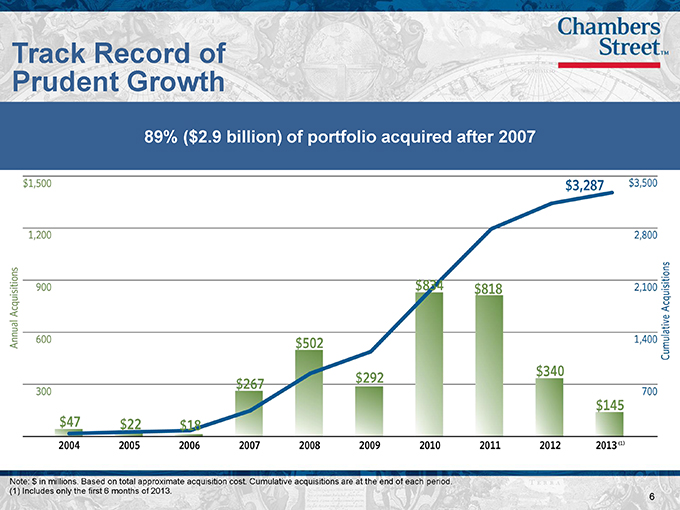
Track Record of Prudent Growth
89% ($2.9 billion) of portfolio acquired after 2007
Note: $ in millions. Based on total approximate acquisition cost. Cumulative acquisitions are at the end of each period.
(1) | | Includes only the first 6 months of 2013. |
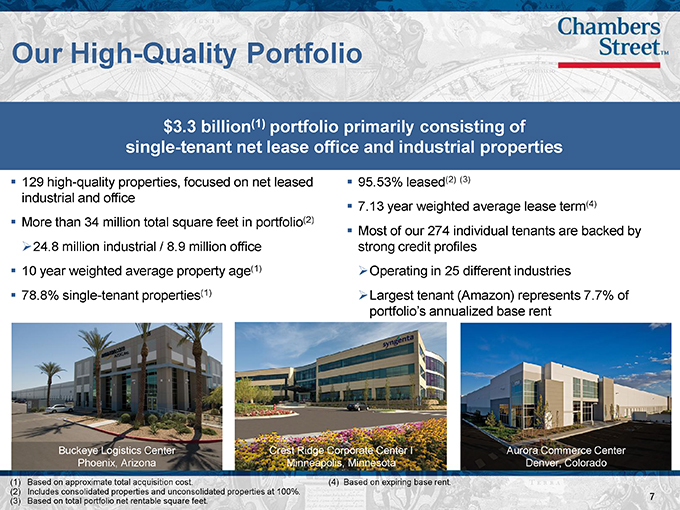
Our High-Quality Portfolio
$3.3 billion(1) portfolio primarily consisting of single-tenant net lease office and industrial properties
129 high-quality properties, focused on net leased
industrial and office
More than 34 million total square feet in portfolio(2)
24.8 million industrial / 8.9 million office
10 year weighted average property age(1)
78.8% single-tenant properties(1)
95.53% leased(2) (3)
7.13 year weighted average lease term(4)
Most of our 274 individual tenants are backed by
strong credit profiles
Operating in 25 different industries
Largest tenant (Amazon) represents 7.7% of
portfolio’s annualized base rent
Buckeye Logistics Center
Phoenix, Arizona
Crest Ridge Corporate Center I
Minneapolis, Minnesota
Aurora Commerce Center
Denver, Colorado
(1) | | Based on approximate total acquisition cost. |
(2) | | Includes consolidated properties and unconsolidated properties at 100%. |
(3) | | Based on total portfolio net rentable square feet. |
(4) | | Based on expiring base rent. |
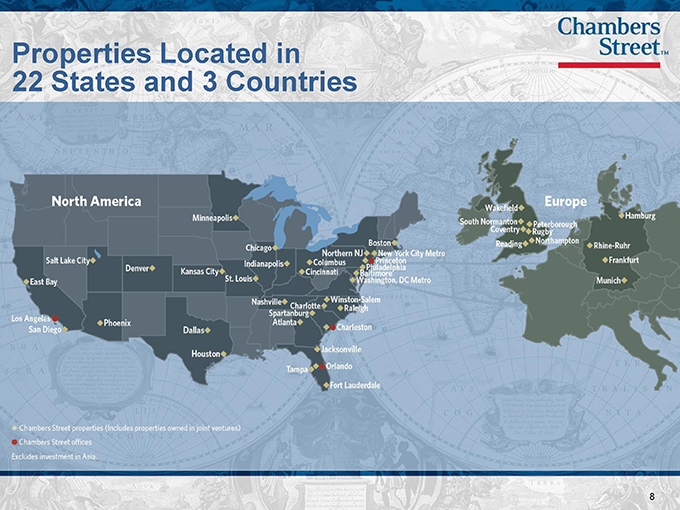
Properties Located in
22 States and 3 Countries
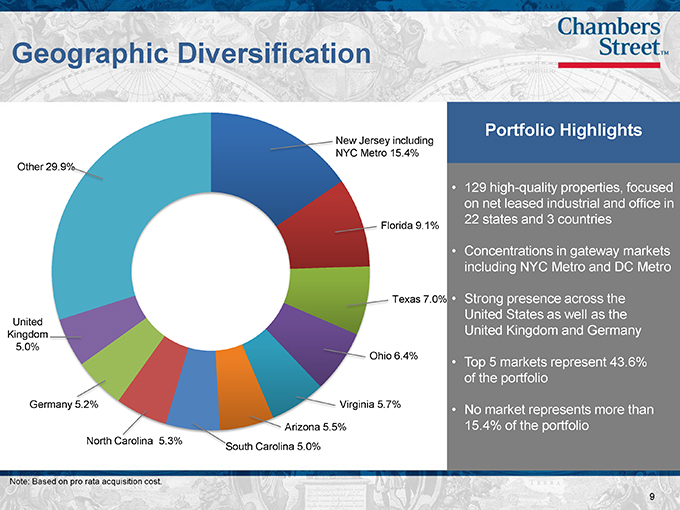
Geographic Diversification
Portfolio Highlights
129 high-quality properties, focused on net leased industrial and office in 22 states and 3 countries
Concentrations in gateway markets including NYC Metro and DC Metro
Strong presence across the United States as well as the United Kingdom and Germany
Top 5 markets represent 43.6% of the portfolio
No market represents more than 15.4% of the portfolio
Note: Based on pro rata acquisition cost.
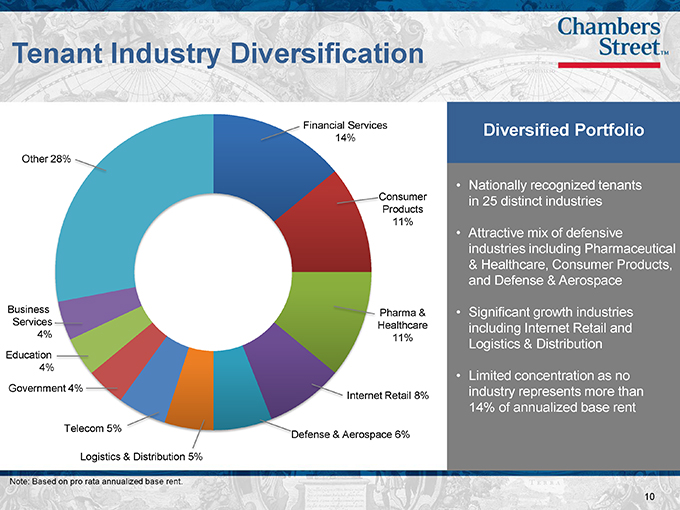
Tenant Industry Diversification
Diversified Portfolio
Nationally recognized tenants in 25 distinct industries
Attractive mix of defensive industries including Pharmaceutical & Healthcare, Consumer Products, and Defense & Aerospace
Significant growth industries including Internet Retail and Logistics & Distribution
Limited concentration as no industry represents more than 14% of annualized base rent
Note: Based on pro rata acquisition cost.
Strong Tenant Base
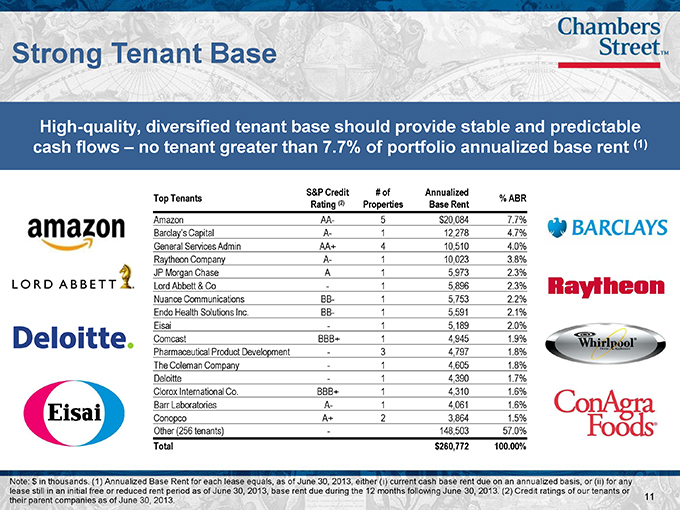
High-quality, diversified tenant base should provide stable and predictable cash flows – no tenant greater than 7.7% of portfolio annualized base rent (1)
S&P Credit # of Annualized
Top Tenants Rating (2) Properties Base Rent % ABR
Amazon AA- 5 $20,084 7.7%
Barclay’s Capital A- 1 12,278 4.7%
General Services Admin AA+ 4 10,510 4.0%
Raytheon Company A- 1 10,023 3.8%
JP Morgan Chase A 1 5,973 2.3%
Lord Abbett & Co—1 5,896 2.3%
Nuance Communications BB- 1 5,753 2.2%
Endo Health Solutions Inc. BB- 1 5,591 2.1%
Eisai—1 5,189 2.0%
Comcast BBB+ 1 4,945 1.9%
Pharmaceutical Product Development—3 4,797 1.8%
The Coleman Company—1 4,605 1.8%
Deloitte—1 4,390 1.7%
Clorox International Co. BBB+ 1 4,310 1.6%
Barr Laboratories A- 1 4,061 1.6%
Conopco A+ 2 3,864 1.5%
Other (256 tenants)—148,503 57.0%
Total $260,772 100.00%
Note: $ in thousands. (1) Annualized Base Rent for each lease equals, as of June 30, 2013, either (i) current cash base rent due on an annualized basis, or (ii) for any lease still in an initial free or reduced rent period as of June 30, 2013, base rent due during the 12 months following June 30, 2013. (2) Credit ratings of our tenants or their parent companies as of June 30, 2013.
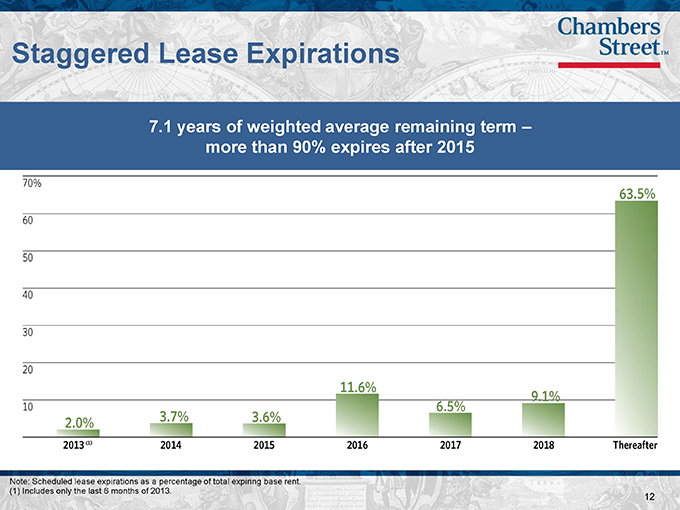
Staggered Lease Expirations
7.1 years of weighted average remaining term – more than 90% expires after 2015
Note: Scheduled lease expirations as a percentage of total expiring base rent.
(1) | | Includes only the last 6 months of 2013. |
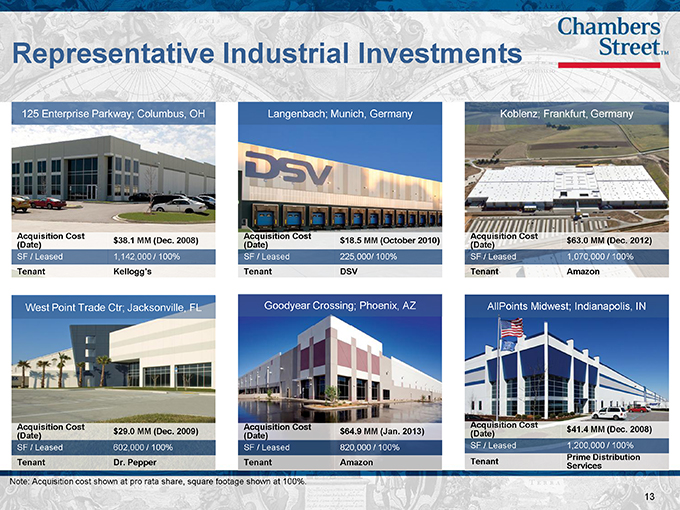
Representative Industrial Investments
125 Enterprise Parkway; Columbus, OH
Langenbach; Munich, Germany
Koblenz; Frankfurt, Germany
Acquisition Cost
(Date)
SF / Leased
Tenant
$38.1 MM (Dec. 2008)
1,142,000 / 100%
Kellogg’s
Acquisition Cost
(Date)
SF / Leased
Tenant
$18.5 MM (October 2010)
225,000/ 100%
DSV
Acquisition Cost
(Date)
SF / Leased
Tenant
$63.0 MM (Dec. 2012)
1,070,000 / 100%
Amazon
West Point Trade Ctr; Jacksonville, FL
Goodyear Crossing; Phoenix, AZ
AllPoints Midwest; Indianapolis, IN
(Date) Acquisition Cost
SF / Leased
Tenant
$29.0 MM (Dec. 2009)
602,000 / 100%
Dr. Pepper
(Date) Acquisition Cost
SF / Leased
Tenant
$64.9 MM (Jan. 2013)
820,000 / 100%
Amazon
(Date) Acquisition Cost
SF / Leased
Tenant
$41.4 MM (Dec. 2008)
1,200,000 / 100%
Prime Distribution
Services
Note: Acquisition cost shown at pro rata share, square footage shown at 100%.
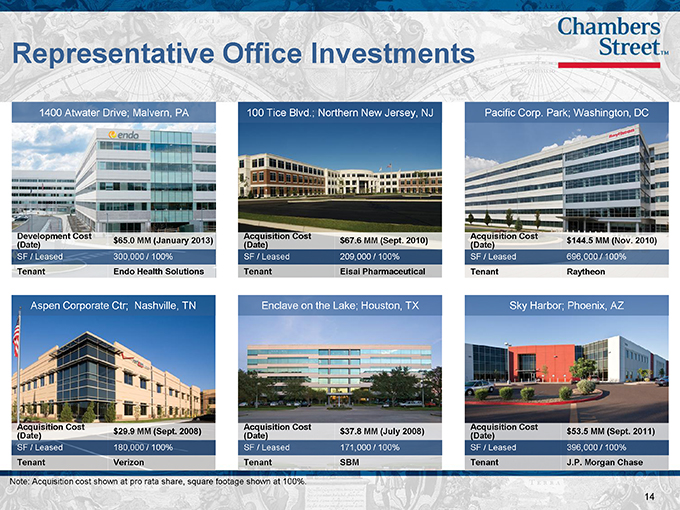
Representative Office Investments
1400 Atwater Drive; Malvern, PA
100 Tice Blvd.; Northern New Jersey, NJ
Pacific Corp. Park; Washington, DC
Development Cost
(Date)
SF / Leased
Tenant
$65.0 MM (January 2013)
300,000 / 100%
Endo Health Solutions
Acquisition Cost
(Date)
SF / Leased
Tenant
$67.6 MM (Sept. 2010)
209,000 / 100%
Eisai Pharmaceutical
Acquisition Cost
(Date)
SF / Leased
Tenant
$144.5 MM (Nov. 2010)
696,000 / 100%
Raytheon
Aspen Corporate Ctr;
Nashville, TN
Enclave on the Lake; Houston, TX
Sky Harbor; Phoenix, AZ
Acquisition Cost
(Date)
SF / Leased
Tenant
$29.9 MM (Sept. 2008)
180,000 / 100%
Verizon
Acquisition Cost
(Date)
SF / Leased
Tenant
$37.8 MM (July 2008)
171,000 / 100%
SBM
Acquisition Cost
(Date)
SF / Leased
Tenant
$53.5 MM (Sept. 2011)
396,000 / 100%
J.P. Morgan Chase
Note: Acquisition cost shown at pro rata share, square footage shown at 100%.
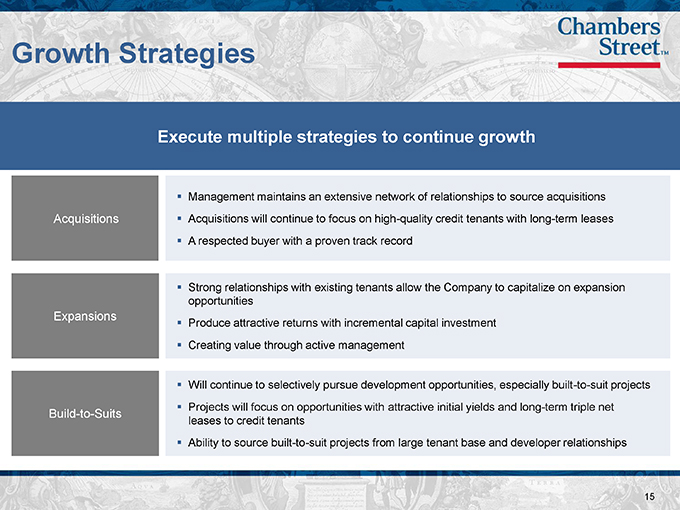
Growth Strategies
Execute multiple strategies to continue growth
Acquisitions
Management maintains an extensive network of relationships to source acquisitions
Acquisitions will continue to focus on high-quality credit tenants with long-term leases
A respected buyer with a proven track record
Expansions
Strong relationships with existing tenants allow the Company to capitalize on expansion
opportunities
Produce attractive returns with incremental capital investment
Creating value through active management
Build-to-Suits
Will continue to selectively pursue development opportunities, especially built-to-suit projects
Projects will focus on opportunities with attractive initial yields and long-term triple net
leases to credit tenants
Ability to source built-to-suit projects from large tenant base and developer relationships
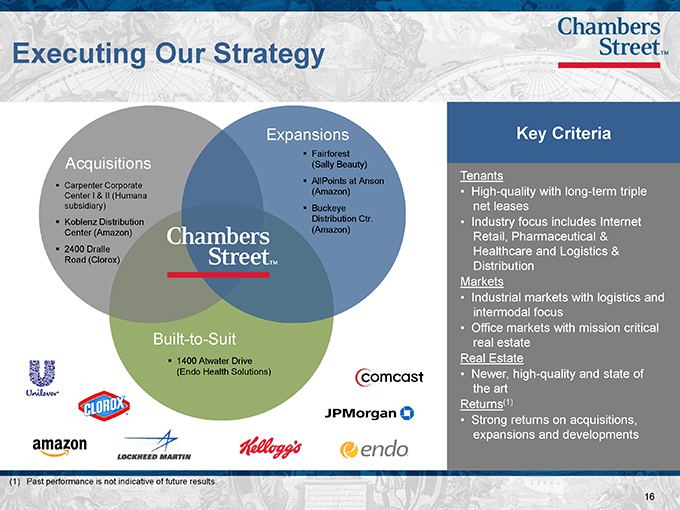
Executing Our Strategy
Acquisitions
Carpenter Corporate Center I & II (Humana subsidiary)
Koblenz Distribution Center (Amazon)
2400 Dralle Road (Clorox)
Expansions
Fairforest (Sally Beauty)
AllPoints at Anson (Amazon)
Buckeye Distribution Ctr. (Amazon)
Built-to-Suit
1400 Atwater Drive (Endo Health Solutions)
Key Criteria
Tenants
High-quality with long-term triple net leases
Industry focus includes Internet
Retail, Pharmaceutical & Healthcare and Logistics & Distribution Markets
Industrial markets with logistics and intermodal focus
Office markets with mission critical real estate Real Estate
Newer, high-quality and state of the art Returns(1)
Strong returns on acquisitions, expansions and developments
(1) | | Past performance is not indicative of future results. |
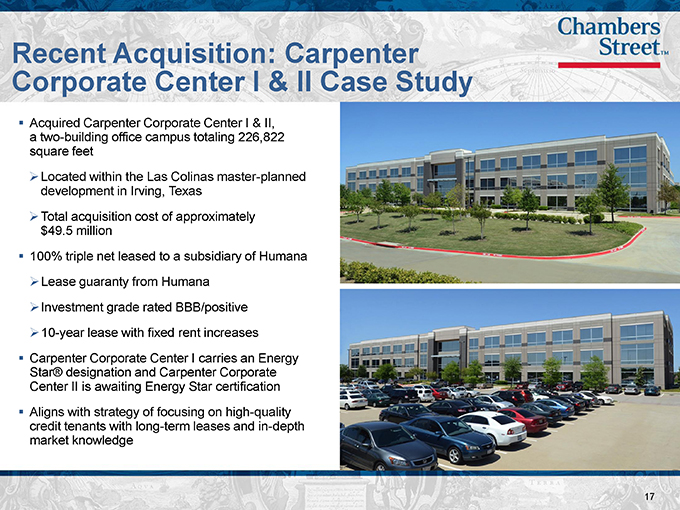
Recent Acquisition: Carpenter Corporate Center I & II Case Study
Acquired Carpenter Corporate Center I & II, a two-building office campus totaling 226,822 square feet
Located within the Las Colinas master-planned development in Irving, Texas
Total acquisition cost of approximately $49.5 million
100% triple net leased to a subsidiary of Humana
Lease guaranty from Humana
Investment grade rated BBB/positive
10-year lease with fixed rent increases
Carpenter Corporate Center I carries an Energy Star® designation and Carpenter Corporate Center II is awaiting Energy Star certification
Aligns with strategy of focusing on high-quality credit tenants with long-term leases and in-depth market knowledge
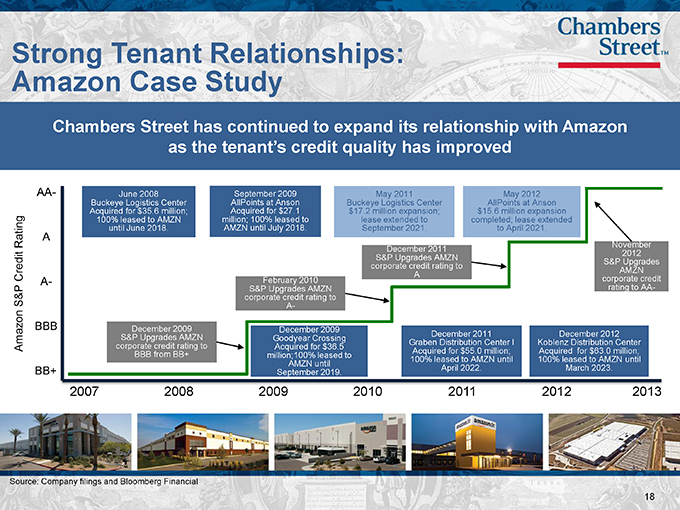
Strong Tenant Relationships: Amazon Case Study
Chambers Street has continued to expand its relationship with Amazon as the tenant’s credit quality has improved
June 2008
Buckeye Logistics Center Acquired for $35.6 million; 100% leased to AMZN until June 2018.
September 2009 AllPoints at Anson Acquired for $27.1 million; 100% leased to AMZN until July 2018.
May 2011
Buckeye Logistics Center
$17.2 million expansion; lease extended to September 2021.
May 2012 AllPoints at Anson
$15.6 million expansion completed; lease extended to April 2021.
December 2011 S&P Upgrades AMZN corporate credit rating to A
November 2012 S&P Upgrades AMZN corporate credit rating to AA-
February 2010 S&P Upgrades AMZN corporate credit rating to A-
December 2009 S&P Upgrades AMZN corporate credit rating to BBB from BB+
December 2009 Goodyear Crossing Acquired for $36.5 million;100% leased to AMZN until September 2019.
December 2011
Graben Distribution Center I Acquired for $55.0 million; 100% leased to AMZN until April 2022.
December 2012 Koblenz Distribution Center Acquired for $63.0 million; 100% leased to AMZN until March 2023.
Source: Company filings and Bloomberg Financial
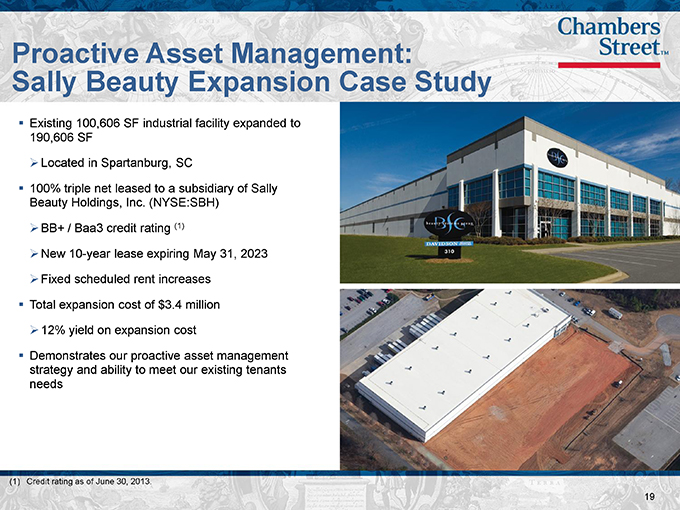
Proactive Asset Management: Sally Beauty Expansion Case Study
Existing 100,606 SF industrial facility expanded to 190,606 SF
Located in Spartanburg, SC
100% triple net leased to a subsidiary of Sally Beauty Holdings, Inc. (NYSE:SBH)
BB+ / Baa3 credit rating (1)
New 10-year lease expiring May 31, 2023
Fixed scheduled rent increases
Total expansion cost of $3.4 million
12% yield on expansion cost
Demonstrates our proactive asset management strategy and ability to meet our existing tenants needs
(1) | | Credit rating as of June 30, 2013. |
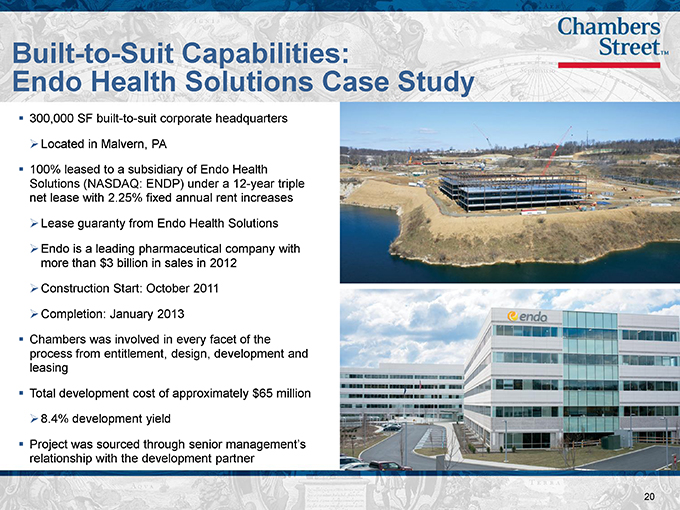
Built-to-Suit Capabilities:
Endo Health Solutions Case Study
300,000 SF built-to-suit corporate headquarters
Located in Malvern, PA
100% leased to a subsidiary of Endo Health Solutions (NASDAQ: ENDP) under a 12-year triple net lease with 2.25% fixed annual rent increases
Lease guaranty from Endo Health Solutions
Endo is a leading pharmaceutical company with more than $3 billion in sales in 2012
Construction Start: October 2011
Completion: January 2013
Chambers was involved in every facet of the process from entitlement, design, development and leasing
Total development cost of approximately $65 million
8.4% development yield
Project was sourced through senior management’s relationship with the development partner
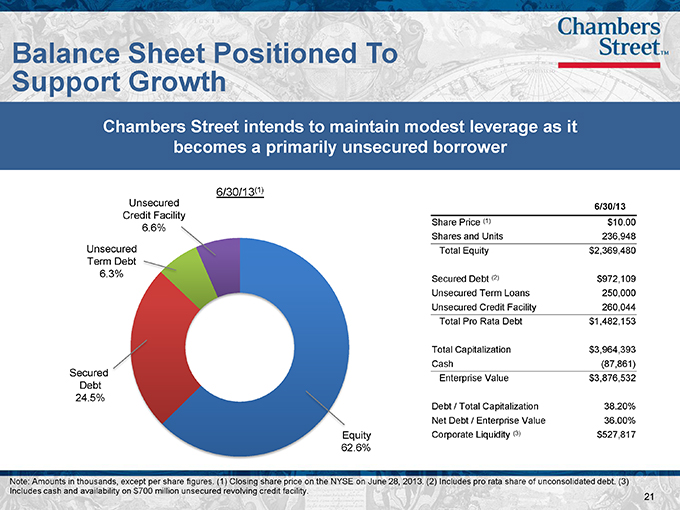
Balance Sheet Positioned To Support Growth
Chambers Street intends to maintain modest leverage as it becomes a primarily unsecured borrower
6/30/13
Share Price (1) $10.00
Shares and Units 236,948
Total Equity $2,369,480
Secured Debt (2) $972,109
Unsecured Term Loans 250,000
Unsecured Credit Facility 260,044
Total Pro Rata Debt $1,482,153
Total Capitalization $3,964,393
Cash (87,861)
Enterprise Value $3,876,532
Debt / Total Capitalization 38.20%
Net Debt / Enterprise Value 36.00%
Corporate Liquidity (3) $527,817
Note: Amounts in thousands, except per share figures. (1) Closing share price on the NYSE on June 28, 2013. (2) Includes pro rata share of unconsolidated debt. (3) Includes cash and availability on $700 million unsecured revolving credit facility.
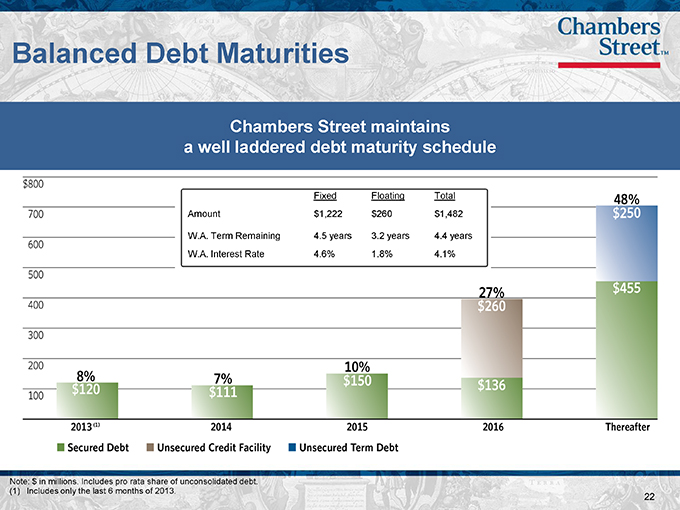
Balanced Debt Maturities
Chambers Street maintains a well laddered debt maturity schedule
Fixed Floating Total
Amount $1,222 $260 $1,482
W.A. Term Remaining 4.5 years 3.2 years 4.4 years
W.A. Interest Rate 4.6% 1.8% 4.1%
Note: $ in millions. Includes pro rata share of unconsolidated debt.
(1) | | Includes only the last 6 months of 2013. |
Highly Experienced Management
Led by a team with deep public and private commercial real estate experience
Philip Kianka, EVP—Chief Operating Officer
EVP, COO, Chambers Street Properties, since ‘08
Director of Operations, CBRE Advisors, ’06 -’12
Managing Director, CBRE Global Investors, ’06 -’12
VP and Senior Asset Manager, Lexington Realty Trust, ’97-
‘05
Jack Cuneo
Founder, President and CEO
President and CEO, Chambers Street Properties,
since ‘04
Chairman, Chambers Street Properties, ’09—‘12
President, CEO for CBRE Advisors, ’04 -‘12
Executive Managing Director, CBRE Global
Investors, ’03 -‘12
Managing Director, Merrill Lynch Global Real Estate
and Hospitality Group, ’00 -‘02
Chairman, CEO, Merrill Lynch Hubbard, ’97 -‘00
Martin Reid, EVP – Chief Financial Officer
EVP, CFO, Chambers Street Properties, since ‘12
Trustee, Chambers Street Properties, since ‘05
EVP—Development and Acquisitions,
Interstate Hotels & Resorts, ’10 -’12
Managing Director, Capital Markets,
Thayer Lodging Group, ’98 -’06
Corporate Officers
Chambers Street has a deep management team with 23 full-time employees
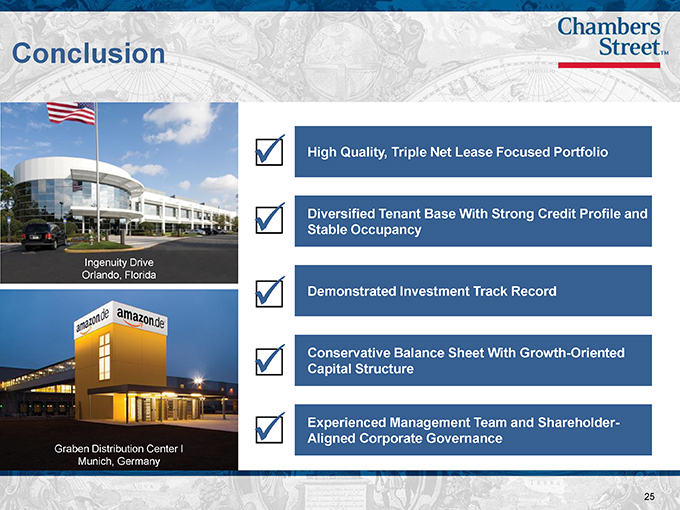
Conclusion
Ingenuity Drive
Orlando, Florida
Graben Distribution Center I
Munich, Germany
High Quality, Triple Net Lease Focused Portfolio
Diversified Tenant Base With Strong Credit Profile and
Stable Occupancy
Demonstrated Investment Track Record
Conservative Balance Sheet With Growth-Oriented
Capital Structure
Experienced Management Team and Shareholder-
Aligned Corporate Governance
Appendix
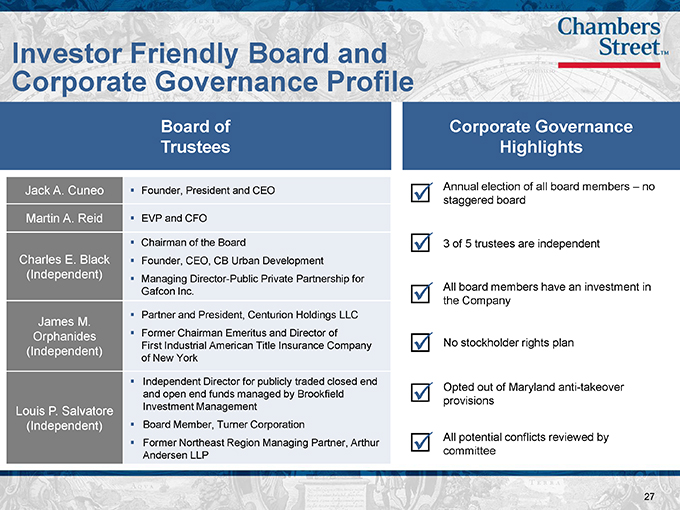
Investor Friendly Board and Corporate Governance Profile
Board of Corporate Governance
Trustees Highlights
Jack A. CuneoFounder, President and CEO Annual election of all board members – no
staggered board
Martin A. ReidEVP and CFO
Chairman of the Board3 of 5 trustees are independent
Charles E. BlackFounder, CEO, CB Urban Development
(Independent)Managing Director-Public Private Partnership for
Gafcon Inc.All board members have an investment in
the Company
James M.Partner and President, Centurion Holdings LLC
OrphanidesFormer Chairman Emeritus and Director of
(Independent) First Industrial American Title Insurance CompanyNo stockholder rights plan
of New York
Independent Director for publicly traded closed end Opted out of Maryland anti-takeover
and open end funds managed by Brookfield ?
Louis P. Salvatore Investment Management provisions
(Independent)Board Member, Turner Corporation
Former Northeast Region Managing Partner, ArthurAll potential conflicts reviewed by
Andersen LLP committee
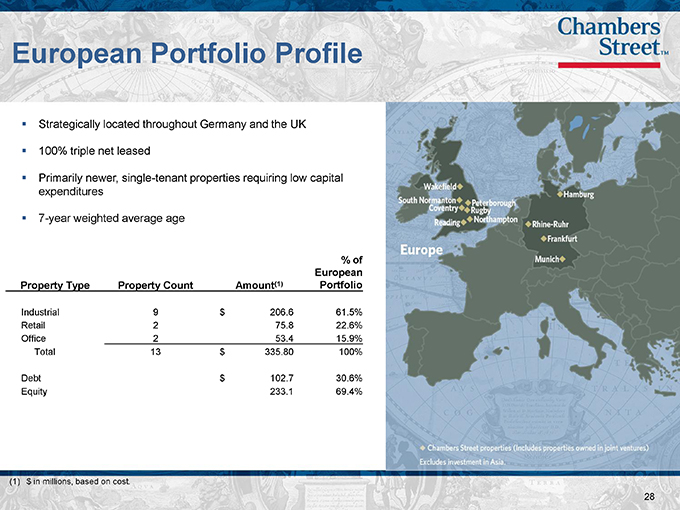
European Portfolio Profile
Strategically located throughout Germany and the UK
? 100% triple net leased
Primarily newer, single-tenant properties requiring low capital expenditures
7-year weighted average age
% of
European
Property Type Property Count Amount(1) Portfolio
Industrial 9 $ 206.6 61.5%
Retail 2 75.8 22.6%
Office 2 53.4 15.9%
Total 13 $ 335.80 100%
Debt $ 102.7 30.6%
Equity 233.1 69.4%
(1) | | $ in millions, based on cost. |