UNITED STATES
SECURITIES AND EXCHANGE COMMISSION
Washington, D.C. 20549
FORM 10-K
| x | ANNUAL REPORT PURSUANT TO SECTION 13 OR 15(d) OF THE SECURITIES EXCHANGE ACT OF 1934 |
For the fiscal year ended: August 31, 2006
OR
| ¨ | TRANSITION REPORT PURSUANT TO SECTION 13 OR 15(d) OF THE SECURITIES EXCHANGE ACT OF 1934 |
For the transition period from to
Commission file number: 000-51099
FCStone Group, Inc.
(Exact name of Registrant as specified in its charter)
| | |
| Iowa | | 42-1091210 |
(State or other jurisdiction of incorporation or organization) | | (I.R.S. Employer Identification No.) |
| |
| 2829 Westown Parkway, Suite 100, West Des Moines, Iowa | | 50266 |
| (Address of principal executive office) | | (Zip Code) |
Registrant’s telephone number, including area code: (515) 223-3756
Securities registered pursuant to Section 12(b) of the Act: None
Securities registered pursuant to 12(g) of the Act: Common Stock, no par value
Indicate by check mark if the registrant is a well-known seasoned issuer, as defined in Rule 405 of the Securities Act. Yes ¨ No x
Indicate by check mark if the registrant is not required to file reports pursuant to Section 13 or Section 15(d) of the Act. Yes ¨ No x
Indicate by check mark whether the registrant (1) has filed all reports required to be filed by Section 13 or 15(d) of the Securities Exchange Act of 1934 during the preceding 12 months (or for such shorter period that the registrant was required to file such reports), and (2) has been subject to such filing requirements for the past 90 days. Yes x No ¨
Indicate by check mark if disclosure of delinquent filers pursuant to Item 405 of Regulation S-K is not contained herein, and will not be contained, to the best of registrant’s knowledge, in definitive proxy or information statements incorporated by reference in Part III of this Form 10-K or any amendment to this Form 10-K. ¨
Indicate by check mark whether the registrant is a large accelerated filer, an accelerated filer, or a non-accelerated filer (as defined in Exchange Act Rule 12b-2).
| | | | |
| Large accelerated filer ¨ | | Accelerated filer ¨ | | Non-accelerated filer x |
Indicate by check mark whether the registrant is a shell company (as defined in Rule 12b-2 of the Act). Yes ¨ No x
There is currently no public market for the Registrant’s securities. As of November 28, 2006, the Registrant had 4,845,736 shares of common stock outstanding.
DOCUMENTS INCORPORATED BY REFERENCE
Portions of the Registrant’s definitive proxy statement for its Annual Meeting of Stockholders to be held on January 11, 2007, are incorporated by reference into Part III of this Report on Form 10-K.
CAUTIONARY STATEMENT REGARDING FORWARD-LOOKING INFORMATION
This report includes forward-looking statements regarding, among other things, our plans, strategies and prospects, both business and financial. All statements other than statements of current or historical fact contained in this annual report on Form 10-K are forward-looking statements. The words “believe,” “expect,” “anticipate,” “should,” “could,” “plan,” “will,” “may,” “intend,” “estimate,” “potential,” “continue” or the negative of these terms and similar expressions, as they relate to us, are intended to identify forward-looking statements.
We have based these forward-looking statements largely on our current expectations and projections about future events and financial trends that we believe may affect our financial condition, results of operations, business strategy and financial needs. They can be affected by inaccurate assumptions, including the risks, uncertainties and assumptions described in “Risk Factors.” In light of these risks, uncertainties and assumptions, the forward-looking statements in this report may not occur and actual results could differ materially from those anticipated or implied in the forward-looking statements. When you consider these forward-looking statements, you should keep in mind these risk factors and other cautionary statements in this report.
Our forward-looking statements speak only as of the date of this report. We undertake no obligation to update or revise any forward-looking statements, whether as a result of new information, future events or otherwise.
PART I
Item 1. Business
General
FCStone Group, Inc. is an integrated commodity risk management company providing risk management consulting and transaction execution services to commercial commodity intermediaries, end-users and producers. We assist primarily middle market customers in optimizing their profit margins and mitigating their exposure to commodity price risk. In addition to our risk management consulting services, we operate one of the leading independent clearing and execution platforms for exchange-traded futures and options contracts. We serve more than 7,500 customers and in fiscal 2006, executed more than 47.8 million derivative contracts in the exchange-traded and OTC markets. As a natural complement to our commodity risk management consulting and execution services, we also assist our customers with the financing, transportation and merchandising of their physical commodity requirements and inventories.
We began offering commodity risk management consulting services to grain elevators in 1968. Since that time, our business has evolved to meet the changing needs of our customers. In response to these changing needs, we expanded our risk management products to include derivatives on agricultural commodities, energy commodities, forest products and food products. We originally operated as a member-owned cooperative that was governed by a mission to deliver professional marketing and risk management programs to enhance the profitability of our members and other customers. In 2000, we acquired the assets of another futures commission merchant (FCM), Saul Stone & Company, which enhanced our execution and clearing capabilities and gave us the ability to clear all U.S. exchange-traded commodity futures and options contracts. In 2005, we converted to a stock corporation to improve our access to financial capital and to facilitate continued growth in our operations.
We provide our customers with various levels of commodity risk management services, ranging from value-added consulting services delivered through our Integrated Risk Management Program (“IRMP”) to lower-margin clearing and execution services for exchange-traded derivative contracts. Our consultative focus is demonstrated by our IRMP, which involves providing our customers with commodity risk management consulting services that are designed to help them mitigate their exposure to commodity price risk and maximize the amount and certainty of their operating profits. In performing consulting services, we educate our customers
1
as to the commodity risks that they may encounter and how they can use the derivative markets to mitigate those risks. The IRMP forms the basis of our value-added approach, and serves as a competitive advantage in customer
acquisition and retention. We offer our customers access to both exchange-traded and OTC derivative markets, integrating the two platforms into a seamless product offering delivered by our approximately 100 commodity risk management consultants.
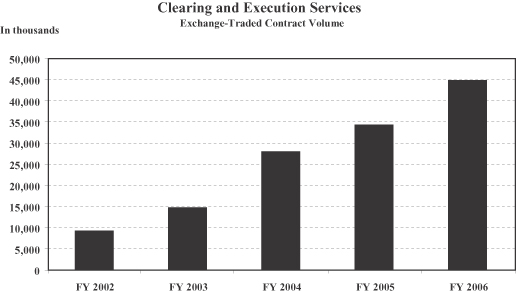
We also offer clearing and execution services to a broad array of participants in exchange-traded futures and options markets including commercial accounts, professional traders, managed futures funds, introducing brokers and retail customers. We are an FCM with clearing-member status at all of the major U.S. commodity futures and options exchanges. As of August 31, 2006, we were the third largest FCM in the U.S., as measured by required customer segregated assets, not affiliated with a major financial institution or commodity producer, intermediary or end-user. Our exchange-traded futures and options transaction volumes have grown from 10.6 million contracts in fiscal year 2002 to 47.5 million contracts in fiscal 2006. As of August 31, 2006, we had $764.8 million in customer segregated assets.
In addition to our Commodity and Risk Management and Clearing and Execution Services segments discussed above, we also operate in two other related business segments. In our Financial Services segment, through FCStone Financial, Inc. and FCStone Merchant Services, LLC, we offer financing and facilitation for our customers with respect to their inventories of physical commodities. FCStone Financial, Inc. offers financing services that help our customers finance physical grain inventories, while FCStone Merchant Services, LLC provides the same services for other commodities. FCStone Merchant Services, LLC also provides financing in transactions where it shares in profits with customers in commodity or commodity-related projects in exchange for financial support.
In the Grain Merchandising segment, we operate through our majority interest in FGDI, LLC. FGDI acts as a grain dealer in the United States and international markets, primarily Asia, Latin America and Canada. It also manages a pool of grain originated by a group of grain elevators in Texas. The primary role of FGDI is to link merchandisers of grain products through our network of industry contacts, serving as an intermediary to facilitate the purchase and sale of grain.
Operating Segments
We operate through a number of wholly-owned and majority-owned subsidiaries with offices and facilities in twelve states, China, Brazil, Canada and Ireland. See Note 18 to our consolidated financial statements for a description of segment financial information. Our principal business activities consist of four operating segments as follows: commodity and risk management services, clearing and execution services, grain merchandising, and financial services.
Commodity and Risk Management Services
The Commodity and Risk Management (“C&RM”) segment is the foundation of our company. Consistent with our original mandate as a cooperative to serve our grain elevator members, we approach middle-market intermediaries, end-users and producers of commodities with the objective of serving as their commodity risk manager. Some of these customers are sophisticated and knowledgeable of the derivative markets and how they operate, understanding the inherent commodity risk of their business and pursuing their own risk management policies. At the same time, many of our customers look for guidance and consulting with regard to their commodity risk exposure and the use of the derivative markets to mitigate that risk.
Within the C&RM segment, we serve customers through a force of approximately 100 risk management consultants with a level of service that maximizes our abilities and the opportunity to retain the customer. Among more sophisticated customers, we provide less in the way of consulting services and focus more on providing a breadth of products and competitive pricing, while among our customers with less experience in the derivative markets, we provide a broad range of consulting services that are demonstrated most clearly in our IRMP. The
2
IRMP is a fee-based commodity risk management consulting service that is based upon a review of our customers’ commodity inputs and outputs in their products and services, with exposures identified and quantified. We use the information obtained in this review to determine commodity exposures and design strategies intended to optimize their profit margins and mitigate our customers’ risks to changing commodity prices. We advise the client through monthly account reviews and an evaluation of existing hedge positions, as well as by review of year-to-date performance of the program.
We believe that our consulting services, including the IRMP, serve as a value-added competitive advantage in the acquisition and development of new customers. We provide our IRMP customers and other risk management consulting customers with assistance in the execution of their hedging strategies through our exchange-traded futures and options clearing and execution operations as well as access to more customized alternatives provided by our OTC trading desk. As our clients increase their knowledge and acceptance of risk management practices, they become more independent in their hedging decision-making and, in some cases, will transition to fully self-directed trading over a three- to five-year period. However, we often continue to provide transactional advice and consulting services to fully self-directed trading customers. Generally, our customers direct their own trading activity and we do not have discretionary authority to transact trades on behalf of our customers.
We maintain an extensive proprietary database of historical price information for each local market in which our customers operate. Local prices tend to react to similar fundamentals each year relative to the benchmark futures prices. Accordingly, these local characteristics can be analyzed and factored into a customer-specific risk analysis. A commodity price hedging program must recognize and account for these local differences because physical commodity prices are often driven by local supply and demand dynamics such as weather, transportation costs and availability, storage and insurance costs. While exchange–traded futures and options prices reflect the world market, local markets are considered to be more relevant to mid-sized commodity users. Therefore, we provide our customers with a tailored program reflective of the market characteristics within which they operate.
Reflective of the local nature of our product, we service our customers through 13 U.S. offices and five international offices. We currently serve approximately 460 customers through our IRMP.
We deliver our consulting services through an experienced force of approximately 100 risk management consultants. The average tenure of our consultants is eight years, while the annual turnover rate has averaged approximately 9% over the past four fiscal years. We maintain a formal training program for our incoming consultant trainees which provides a foundation in the basics of our business, including risk management, futures and options markets, OTC markets, financial statement analysis and derivative accounting. As part of the training process, new consultants apprentice with an experienced risk management consultant for up to two years before independently managing customer relationships.
We organize our marketing efforts into customer industry segments. We currently serve customers in the following areas:
| | • | | Commercial Grain—The commercial grain customer segment represents the foundation of our C&RM Segment, as the roots of our company can be traced back to this business. Within this sector we provide services to grain elevators, traders, processors, manufacturers and end-users. |
| | • | | Energy—The energy customer segment targets companies where energy represents a significant input cost into the production of their product or service. Such customers include producers, refiners, wholesalers, transportation companies, convenience store chains, auto and truck fleet operators, industrial companies, railroads and municipalities. |
| | • | | Introducing Brokers—Introducing Brokers within our C&RM segment include individuals or organizations that maintain relationships with customers and intermediate transactions between the customer and ourselves. The customers within this segment are primarily agricultural producers. |
3
| | • | | Latin America/Brazil—The customers within this customer segment are located predominantly in Mexico and Brazil. Our customers are involved in all sectors of agribusiness, including livestock production and feeding, flour milling and bakery, oilseed crushing and refining, grain merchandising, meat processing and sugar/ethanol production. We believe there are significant opportunities to deepen the penetration of risk management practices within this customer segment in this region. |
| | • | | China—The China customer segment represents both Chinese FCMs as well as commercial companies seeking to hedge their commodity risk exposures. The Chinese FCMs are similar to introducing brokers, facilitating the transactions of their clients in the U.S. commodities markets. The commercial accounts, generally, represent significant processors of grain or other commodities. |
| | • | | Renewable Fuels—The renewable fuels customer segment targets producers of ethanol and biodiesel products, capitalizing on the rapid growth occurring in the alternative fuels industry. |
| | • | | Other—We maintain a number of developing customer segments where the adoption of risk management practices is increasing and our consultative approach is serving as a catalyst to customer adoption. These customer segments currently include customers with risk management needs in the areas of forest products, food services, transportation and weather-related products. In addition, we believe that we are positioned to participate in the development of markets for carbon and emission credits. We have entered into agreements that would, depending on further developments, enable us to market carbon and emission credits generated by third parties and share in the proceeds from sales of such credits. |
Our integrated platform allows our customers, aided by our risk management consultants, to execute and clear commodity futures and options contracts for the purpose of establishing and maintaining their hedge positions through our C&RM segment. Alternatively, we are able to meet more customized hedging needs through our OTC trading desk. Our OTC trading desk, through broad access to commodity market participants as well as major financial institutions, is able to design hedge arrangements that may contain features with respect to contract performance, time period, commodity types, and transaction size that are not achievable in the highly-standardized exchange-traded commodity futures and options markets. Further, our OTC capability has provided an ability to create products that assist our customers, in turn, to offer value-added services to their clients. We believe that we are unique in offering both exchange-traded and OTC products to our middle-market target customers.
Source: Company Information
4
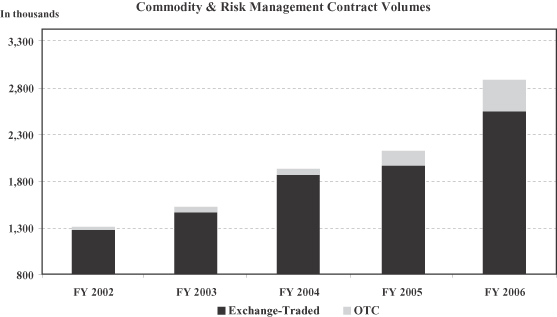
Within our C&RM business, we have experienced strong growth in contract trading volumes. Since 2002, growth in exchange-traded contract trading and OTC contract trading have both been robust.
In fiscal 2006, the C&RM segment had consolidated income before minority interest and income tax of $21.9 million, an increase of $10.7 million, or 95.5%, from $11.2 million in fiscal 2005. In fiscal 2006, the C&RM segment represented approximately 68% of our consolidated income before minority interest, income tax and corporate overhead.
See Note 18 of the notes to consolidated financial statements for a table showing a summary of the Company’s consolidated revenues by geographic area.
Clearing and Execution Services
We seek to provide economical clearing and execution of exchange-traded futures and options for the institutional and professional trader market segments through the Stone division of our subsidiary, FCStone LLC. Through our platform, we accept customer orders and direct those orders to the appropriate exchange for execution. We then facilitate the clearing of our customers’ transactions. Clearing involves the matching of our customers’ trades with the exchange, the collection and management of margin deposits to support the transactions, and the accounting and reporting of the transactions to our customers. We seek to leverage our capabilities and capacity by offering facilities management or outsourcing solutions to other FCMs.
FCStone LLC is a registered FCM and a clearing member of all major U.S. commodity futures exchanges including the CME, CBOT, NYMEX, COMEX Division of NYMEX, New York Board of Trade (“NYBOT”), Kansas City Board of Trade and the Minneapolis Grain Exchange. We are one of the largest clearing members on the NYBOT and NYMEX as measured by contracts cleared.
We service our customers though a Wholesale Division and a Professional Trading Division:
Wholesale Division. Wholesale division customers generally consist of non-clearing FCMs, introducing brokers and clearing FCMs for which we provide back-office services such as trade processing and accounting. These customers serve as intermediaries to the ultimate customer transacting the futures or options contract.
Professional Trading Division. The professional trading customers consist of retail-oriented introducing brokers, professional traders and floor traders. In this division, we target high-volume users of the futures and options markets. We hold the largest share of the professional floor trader market at the NYBOT and the COMEX Division of NYMEX. Through our retail division, we also target managed futures funds, hedge funds and commodity trading advisors. We believe that this segment of our customer base will benefit from the increasing significance of electronic trading, providing them a greater opportunity to trade across markets and commodities.
5
Source: Company Information
In fiscal 2006, the Clearing and Execution segment had consolidated income before minority interest and income tax of $11.0 million, an increase of $5.8 million, or 111.5%, from $5.2 million in fiscal 2005. In fiscal 2006, the Clearing and Execution Services segment represented approximately 34% of our consolidated income before minority interest, income tax and corporate overhead.
Financial Services
Our Financial Services segment is comprised of FCStone Financial, Inc. and FCStone Merchant Services, LLC. FCStone Financial, Inc. serves as a grain financing and facilitation business through which we lend to commercial grain-related companies against physical grain inventories. We use sale/repurchase agreements to purchase grain evidenced by warehouse receipts at local grain elevators subject to a simultaneous agreement to sell such grain back to the original seller at a later date.
Our activity in FCStone Financial, Inc. led us to develop FCStone Merchant Services, LLC. FCStone Merchant Services serves as a financing vehicle for a number of different commodities, including grain, energy products and renewable fuels. These arrangements can take the form of repurchase agreements or traditional lending arrangements, backed by letters of credit, depending on the risk, underlying commodity and borrower involved in the transaction.
We believe that our commodity risk management, merchandising and transportation expertise, along with our experience in the renewable fuels area, can be applied to the rapidly growing alternative fuels industry. Our presence in these markets and our interest in renewable fuels created an opportunity for us to provide financing to a startup biodiesel company. In fiscal 2006, we loaned $1.5 million to Green Diesel LLC as part of its financing to build a biodiesel production facility to be located in Houston, Texas. The loan included the issuance of warrants exercisable for up to 48% of the equity of Green Diesel. FCStone Merchants Services has discounted the note receivable relative to the value assigned to the warrants, which has been reported in other assets on the consolidated statement of financial condition. The discount is being amortized over the term of the loan agreement as an adjustment of the loan yield through interest income on the consolidated statement of operations. We have also committed to make available, or assist in arranging, a $15 million line of credit to Green Diesel to
6
be secured by all of its assets. The principal use of this line of credit will be to finance raw materials required for production of biodiesel and the storage, blending and sale of the final product. Our commitment is subject to satisfaction of certain conditions, the completion of due diligence and the negotiation of definitive terms acceptable to the parties. Subsequently, Green Diesel decided to raise additional equity in order to build a larger production facility with an annual production capacity of approximately 46 million gallons. In order for us to prevent the dilution of our potential 48% interest in Green Diesel, we invested an additional $2.4 million. Subsequent to August 31, 2006, we loaned an additional $600,000 to Green Diesel to finance the expanded facility. We are not contractually bound to invest additional equity in Green Diesel. We believe the Green Diesel production facility will begin commercial production in early calendar 2007. We continue to explore other avenues to increase our presence in the renewable fuels area.
Grain Merchandising
As a complement to our commodity risk management consulting services, through our majority interest in FGDI we assist our customers and utilize our market contacts to link merchandisers of grain products, serving as an intermediary to facilitate the purchase and sale of physical grain. We maintain a 70% equity interest in FGDI, and AGREX, Inc., a subsidiary of Mitsubishi Corporation, holds the remaining 30% interest.
FGDI’s services help elevators and grain marketers maximize the value of their grain by locating domestic and international buyers and assisting the originator in retaining ownership and margins as far into the marketing pipeline as possible. We consistently offer value-added opportunities for our customers to merchandise their inventories beyond their traditional channels.
In the grain merchandising segment, FGDI earns revenue primarily through the sale of grain which is driven by the volume and price of grain we merchandise.
For the end-users, processors and exporters, FGDI provides a dedicated and efficient method of sourcing the specific type and quality of grain, and assures consistent delivery to match a buyer’s needs. Because FGDI works closely with a wide range of customers, we are able to regularly link customers in mutually beneficial transactions. We manage and operate approximately 1,000 grain rail cars in conjunction with our merchandising program. In fiscal 2006, we merchandised 235.9 million bushels of grain, of which approximately 34.3 million were shipped through our leased facilities located at the port in Mobile, Alabama, primarily to the Asia market.
Regulatory Matters
We are regulated by several governmental agencies and self-regulatory organizations in connection with various aspects of our business. Compliance with these laws and regulations is material to our operations. The following discussion describes the material licenses and registrations that we maintain.
FCStone, LLC is a registered FCM with the CFTC and a member of the NFA, both of which have regulatory authority over our company. FCStone, LLC is also a clearing member of all major U.S. futures exchanges. The CME is its Designated Self-Regulatory Organization for regulatory purposes and performs an annual examination of FCStone, LLC’s activities.
FCStone Investments, Inc., is registered as a commodity pool operator with the NFA and acts as the general partner or managing member of commodity pools. FCStone Advisory, Inc. is registered with the NFA as a commodity trading advisor and provides market commentary.
FCC Futures, Inc., and Westown Commodities, LLC, are guaranteed introducing brokers of FCStone, LLC registered with the NFA.
FCC Investments, Inc. is a registered broker-dealer with the Securities and Exchange Commission (“SEC”) and the National Association of Securities Dealers (“NASD”). FCC Investments, Inc. must file annual Financial and Operational Combined Uniform Single reports with the SEC and is subject to the various rules and regulations of the NASD.
7
FGDI is licensed as a grain dealer in Missouri, North Dakota, South Dakota, Nebraska, Minnesota, Indiana, Michigan, Ohio, Kentucky, Georgia, Alabama and Ontario, Canada. FGDI also has a Canadian Federal License for grain dealing. FGDI is registered as an exporter of grain with the United States Department of Agriculture.
In addition, we are subject to other general legal and regulatory provisions applicable to trading services and commodities dealing.
Sales and Marketing
We have a comprehensive sales and marketing program that is primarily implemented by our staff of risk management consultants. Our risk management consultants are compensated on a commission basis and are responsible for developing new customers and providing services to new and existing customers. Our executive management team also engages in significant sales and marketing activities.
Sales efforts are primarily centered on consulting services and on presenting our ability to obtain and utilize commodity intelligence information to support customer needs and improve customer profitability. Specifically, we emphasize our IRMP, which provides the most comprehensive level of service offered by the Company. Sales efforts are supported by systems, staff and resources, including current commodity information and intelligence systems, communications systems, archives of commodity basis and pricing information and related presentation and analytical tools, marketing materials, an internet web site, advertising, and educational materials.
We engage in direct sales efforts to seek new customers with a strategy of extending our services from our existing customer base to similar customers not yet served and to different kinds of customers that have risk management needs similar to those of our existing customer base. We seek to serve not only those customers that currently use risk management methods, but also those customers that we believe should use risk management methods. We are expanding our services into new business segments and are expanding our services geographically into foreign markets, particularly in Asia, Latin America and Canada.
We stay in regular contact with existing customers to provide commodity information and services, usually on a daily basis, by direct personal contact and by issuing current market commentary by fax or e-mail. We also offer educational programs on risk management methods and regular outlook meetings for our customers as well as the customers of our customers.
Competition
The commodity and risk management industry can generally be classified into four basic types of companies: (1) pure consultants, (2) clearing FCMs providing trade execution but not broad-based consulting services, (3) captive businesses providing consulting and trade execution as divisions of financial institutions or larger commodity-oriented companies, and (4) integrated FCMs providing both consulting and trade execution from an independent platform. As a result, we compete with a large number of smaller firms that focus on personalized service, and a smaller number of large, better capitalized companies that focus less on personalized service but have significant execution capabilities and market presence. We believe that our C&RM segment, which operates as an integrated FCM, serves the needs of middle market companies that require both the personalized consulting services provided by our risk management consultants and the trade execution services that we offer as an FCM.
We compete with a large number of firms in the exchange-traded futures and options execution sector and in the OTC derivatives sector. We compete primarily on the basis of price and value of service. Our competitors in the exchange-traded futures and options sector include international brokerage firms, national brokerage firms, regional brokerage firms (both cooperatives and non-cooperatives) as well as local introducing brokers, with competition driven by price level and quality of service. Many of these competitors offer OTC trading programs as well. In addition, there are a number of financial firms and physical commodities firms that participate in the
8
OTC markets, both directly in competition with us and indirectly through firms like us. We compete in the OTC market by making specialized OTC transactions available to our customers in contract sizes smaller than those usually available from major counter-parties.
In the Financial Services segment we compete with traditional lenders, including banks and asset-based lenders. In addition, we also compete with specialized investment groups that seek to earn an investment return based on commodities transactions. We compete on price and service and by managing commodity risks that traditional lenders may seek to avoid. We are an extremely small participant in the financial services industry, which consists of a very large number of large and small firms. We do not attempt to compete generally in this industry. Rather, we focus our energies on filling a specific niche of supporting commodities transactions.
The grain merchandising segment competes for both the purchase and sale of grain. Competition is intense and profit margins are low. Our major competitors have substantially greater financial resources than those available to us, but we believe that our relationships, primarily with cooperative customers, give us a broad origination capability. Competition for grain sales is based on price, services and ability to provide the desired quantity and quality of grains. Our grain merchandising operations compete with numerous larger grain merchandisers, including major grain merchandising companies such as Archer-Daniels-Midland Co., Cargill, Incorporated, CHS Inc., ConAgra Foods, Inc., Bunge Ltd., and Louis Dreyfus Group, each of which handles grain volumes of more than one billion bushels annually.
Technology
We utilize front-end electronic trading, mid office, back office and accounting systems that process transactions on a daily basis. These systems are integrated to provide recordkeeping, trade reporting to exchange clearing, internal risk controls, and reporting to government entities, corporate managers, risk managers and customers. Our futures back office system is maintained by a service bureau which is located in Chicago with a disaster recovery site in New York. All other systems are maintained in our West Des Moines headquarters data center and system backups are stored off-site.
All of these systems are accessed through a wide area network. All systems are protected by a firewall and require proper security authorization for access. Our wide area network is managed by a service bureau which has redundant data facilities in Kansas City. We are currently building a disaster recovery plan to utilize the West Des Moines and Kansas City data centers to house redundant systems.
Our risk managers access market information from network-based software systems. Market information includes real-time quotes, market history (futures/cash), news and commentaries. Market information also includes our historic database of market pricing and trend information used in the IRMP. This information is used to analyze the markets to help risk managers determine the best strategy for a customer to minimize risk and maximize profit margins, especially when used in conjunction with the IRMP.
We use the RISC back office trade system to process exchange-traded futures and options trades. We also commenced use of the KIODEX and a proprietary back office trade system to process OTC/derivative trades beginning in fiscal 2007. We use Globex, Clearport, eAcess, CQ, Transact, TT, RANorder and PATS electronic trading/order routing platforms.
Employees
As of August 31, 2006, we employed 424 people. This total is broken down by business segment as follows: C&RM had 194 employees; Clearing and Execution Services had 114 employees; Financial Services had 2 employees; Grain Merchandising had 82 employees; and Corporate had 32 employees. We believe our relationship with our employees is good, and we have not suffered any work stoppages or labor disputes. None of our employees operate under a collective bargaining agreement. Many of our employees are subject to employment agreements. It is our current policy to obtain an employment agreement containing noncompetition provisions from each risk management consultant.
9
Item 1A. Risk Factors
Our business depends on commodity market and general economic conditions. We generate significant revenues from commissions and clearing fees we earn from executing and clearing customer orders, fees for providing commodity risk management consulting services and interest income we earn on cash balances in our customers’ accounts. These revenue sources are substantially dependent on customer trading volumes, interest rates and related services and activities. The volume of transactions our customers conduct with us, interest rates and demand for our related services and activities are directly affected by domestic and international commodity market and economic conditions that are beyond our control, including:
| | • | | commodity market conditions, such as price levels and volatility, |
| | • | | concerns about terrorism and war, |
| | • | | the level and volatility of interest rates, |
| | • | | availability and cost of funding and capital, |
| | • | | credit capacity or perceived creditworthiness of the futures industry in the marketplace, |
| | • | | legislative and regulatory changes, and |
| | • | | currency values and changes in government monetary policies. |
Declines in the volume of trading in the markets in which we operate generally result in lower revenue from our most profitable segments, which would adversely affect our profitability.
Our revenue depends on trading volume which depends in large part on commodity prices and commodity price volatility. Trading volume is driven largely by the degree of volatility—the magnitude and frequency of fluctuations—in prices of commodities. Higher volatility increases the need to hedge contractual price risk and creates opportunities for arbitrage trading. Energy commodities markets historically, and agricultural commodities markets periodically, have experienced significant price volatility. In addition to price volatility, increases in commodity prices lead to increased trading volume. As prices of commodities have risen, especially energy prices, new participants have entered the markets to address their growing risk-management needs or to take advantage of greater trading opportunities. Sustained periods of stability in the prices of commodities or generally lower prices could result in lower trading volumes and, potentially, lower revenues.
Factors that are particularly likely to affect price volatility and price levels of commodities include:
| | • | | supply and demand of commodities; |
| | • | | weather conditions affecting certain commodities; |
| | • | | national and international economic and political conditions; |
| | • | | perceived stability of commodities and financial markets; |
| | • | | the level and volatility of interest rates and inflation; and |
| | • | | financial strength of market participants. |
Any one or more of these factors may reduce price volatility or price levels in the markets for commodities trading, which in turn could reduce trading activity in those markets. Moreover, any reduction in trading activity could reduce liquidity which in turn could further discourage existing and potential market participants and thus accelerate any decline in the level of trading activity in these markets.
Decreases in short-term interest rates would negatively impact our profitability.The level of prevailing short-term interest rates affects our profitability because a portion of our revenue is derived from interest earned
10
from the investment of funds deposited with us by our customers. Our financial performance generally benefits from rising interest rates. Rising interest rates increase the amount of interest income earned from these customer deposits. If short-term interest rates fall, our revenues derived from interest will decline which would negatively impact our profitability.
Short-term interest rates are highly sensitive to factors that are beyond our control, including general economic conditions and the policies of various governmental and regulatory authorities. In particular, decreases in the federal funds rate by the Board of Governors of the Federal Reserve System usually lead to decreasing interest rates in the U.S., which generally lead to a decrease in short-term interest rates.
Our customers are concentrated in the agricultural sector and related industries and we are therefore particularly subject to government policies and regulations affecting those industries.We do a substantial amount of business with companies in the agricultural sector and related industries. Economic forces, including agricultural commodity, energy and financial markets, as well as government policies and regulations affecting the agricultural sector and related industries could adversely affect our operations and profitability. Agricultural production and trade flows are significantly affected by government policies and regulations. Governmental policies affecting the agricultural industry, such as taxes, tariffs, duties, subsidies and import and export restrictions on agricultural commodities and commodity products, can influence industry profitability, the planting of certain crops versus other uses of agricultural resources, the location and size of crop production, whether unprocessed or processed commodity products are traded and the volume and types of imports and exports.
Many of our customers and much of our expected growth are in the energy and related renewable fuels industries and our revenues could decline as a result of adverse developments in these industries.Many of our current customers and much of our expected growth are in the energy and related renewable fuels industries. Energy prices and energy price volatility are affected by local, regional and global events and conditions that affect supply and demand for the relevant energy-related commodity. Adverse developments in the energy markets could adversely affect the operations and profitability of our customers in these industries, which could adversely affect demand for our commodity risk management services in this area and our revenues. The renewable fuels industry is a developing industry that involves a high degree of risk. Generally, renewable fuel production is profitable as long as energy prices remain at relatively high levels and feed stocks are readily available at acceptable price and volume levels. In addition, government subsidies of the renewable fuel industry and favorable environmental regulations are critical to the industry’s profitability at this time. The renewable fuels industry is currently in a period of rapid expansion, and there can be no assurance that such expansion will continue or that such expansion will not result in reduced prices and profit margins in the industry. We enter into long-term supply contracts with renewable fuel producers, which creates potential credit risk with respect to the obligations of those producers, particularly if the producers become less profitable.
We are exposed to the credit risk of our customers and counterparties and their failure to meet their financial obligations could adversely affect our business.Each segment of our business is subject to credit risk. Over-the-counter derivative transactions are subject to credit risks, which is the risk that a counterparty will fail to perform its obligations when due. Customers and counterparties that owe us money, securities or other assets may default on their obligations to us due to bankruptcy, lack of liquidity, operational failure or other reasons.
As a clearing broker, we act on behalf of our customers for all trades consummated on exchanges. Accordingly, we are responsible for our customers’ obligations with respect to these transactions, which exposes us to significant credit risk. A substantial part of our working capital is at risk if customers default on their obligations to us and their account balances and security deposits are insufficient to meet all of their obligations.
Our grain merchandising business is also subject to credit risk for the failure of counterparties to meet their financial obligations. These counterparties may, in some instances, be in international markets, which may complicate collection efforts.
11
Our financial service activities, which primarily relate to financial accommodations to customers used to acquire and carry commodities, expose us to substantial credit risks due to possible defaults or nonperformance of our customers.
Although we have procedures for reviewing credit exposures to specific customers and counterparties to address present credit concerns, default risk may arise from events or circumstances that are difficult to detect or foresee including rapid changes in commodity price levels. Some of our risk management methods depend upon the evaluation of information regarding markets, clients or other matters that are publicly available or otherwise accessible by us. That information may not, in all cases, be accurate, complete, up-to-date or properly evaluated. In addition, concerns about, or a default by, one institution could lead to significant liquidity problems, losses or defaults by other institutions, which in turn could adversely affect us. We may be materially and adversely affected in the event of a significant default by our customers and counterparties.
We face substantial competition that could negatively impact our revenues and our profitability.The commodity risk management industry and the broader financial services industry are very competitive and we expect competition to continue to intensify in the future. Many of the companies with which we compete are better capitalized than we are and have greater financial, technical, marketing and other resources than we have. Our primary competitors include both large, diversified financial institutions and commodity-oriented businesses, smaller firms that focus on specific products or regional markets and independent futures commission merchants (“FCMs”). As a result, we compete with a large number of smaller firms that focus on personalized service, and a smaller number of larger, better capitalized companies that focus less on personalized service but have significant execution capabilities and market presence.
Some of our competitors offer a wider range of services, have broader name recognition and have larger customer bases than we do. Some of them may be able to respond more quickly to new or evolving opportunities, technologies and customer requirements than we can, and may be able to undertake more extensive marketing activities. If we are not able to compete successfully in the future, our business, financial condition and results of operations would be adversely affected.
We have experienced intense price competition in our clearing and execution business in recent years. Some competitors may offer clearing and execution services to customers at lower prices than we are offering, which may force us to reduce our prices or to lose market share and revenue. In addition, we focus on developing and marketing complex strategies to our clients that are specifically designed to address their commodity risk management or merchandising needs, or the needs of their customers. As the market adopts these strategies, competitors may have the ability to replicate our services. As a result, the need for our services in relation to these strategies could be significantly reduced.
Until recently we operated as a member-owned cooperative and have a limited operating history as a business corporation. Accordingly, our historical and recent financial and business results may not be representative of what they may be in the future.Prior to 2005, we operated as a member-owned cooperative operating for the benefit of our members and our business strategy was focused on providing services to our members at a reasonable cost. Since 2005, we have operated our business for the long-term benefit of our stockholders and our business strategy is designed to maximize revenue and profitability. We have a limited operating history as a business corporation on which you can evaluate our management decisions, business strategy and financial results. As a result, our historical financial and business results may not be representative of what they may be in the future. We are subject to risks, uncertainties, expenses and difficulties associated with changing and implementing our business strategy.
Future growth could strain our personnel and infrastructure resources.We anticipate a period of significant growth, which we expect to place a strain on our administrative, financial and operational resources. Our ability to manage growth effectively will require us to improve existing, and implement additional, operational, financial and management controls and reporting systems and procedures. We will also be required to identify, hire and train additional risk management consultants as well as administrative staff. We cannot
12
assure you that we will be able to improve or implement such controls, systems and procedures in an efficient and timely manner or that they will be adequate to support our future operations. Furthermore, we may not be able to identify, hire and train sufficient personnel to accommodate our growth. If we are unable to manage growth effectively, maintain our service or if new personnel are unable to achieve performance levels, our business, operating results, prospects and financial condition could be materially adversely affected.
Our business could be adversely affected if we are unable to retain our existing customers or attract new customers.The success of our business depends, in part, on our ability to maintain and increase our customer base. Customers in our market are sensitive to, among other things, the costs of using our services, the quality of the services we offer, the speed and reliability of order execution and the breadth of our service offerings and the products and markets to which we offer access. We may not be able to continue to offer the pricing, service, speed and reliability of order execution or the service, product and market breadth that customers desire. In addition, once our commodity risk management consulting customers have become better educated with regard to sources of commodity risk and the tools available to facilitate the management of this risk and we have provided them with recommended hedging strategies, they may no longer continue paying monthly fees for these services. Furthermore, our existing customers, including Integrated Risk Management Program (“IRMP”) customers, generally are not obligated to use our services and can switch providers of clearing and execution services or decrease their trading activity conducted through us at any time. As a result, we may fail to retain existing customers or be unable to attract new customers. Our failure to maintain or attract customers could have a material adverse effect on our business, financial condition and operating results.
We rely on relationships with introducing brokers for obtaining some of our customers. The failure to maintain these relationships could adversely affect our business.We have relationships with introducing brokers who assist us in establishing new customer relationships and provide marketing and customer service functions for some of our customers. These introducing brokers receive compensation for introducing customers to us. Many of our relationships with introducing brokers are non-exclusive or may be cancelled on relatively short notice. In addition, our introducing brokers have no obligation to provide new customer relationships or minimum levels of transaction volume. Our failure to maintain these relationships with these introducing brokers or the failure of these introducing brokers to establish and maintain customer relationships would result in a loss of revenues, which could adversely affect our business.
We are dependent on our management team, and the loss of any key member of our team may prevent us from executing our business strategy effectively.Our future success depends, in large part, upon our management team who possess extensive knowledge and management skills with respect to commodity risk management. The unexpected loss of services of any of our executive officers could adversely affect our ability to manage our business effectively or execute our business strategy. Although these officers have employment contracts with us, they are generally not required to remain with us for a specified period of time. In addition, we do not maintain key-man life insurance policies on any of our executive officers.
Competition for risk management consultants could result in our being unable to attract and retain the highly skilled risk management consultants that we need to support our business or we may be required to incur additional expense to do so.We strive to provide high-quality risk management consulting and execution services that allow us to establish and maintain long-term relationships with our clients. Our ability to continue to provide these services, maintain these relationships and expand our business depends, in large part, upon our risk management consultants. As a result, we must attract and retain highly qualified personnel. Competition for the services of consultants is intense, especially for people with extensive experience in the specialized markets in which we participate or may seek to enter. If we are unable to hire highly qualified people, we may not be able to enter new markets or develop new products. If we lose one or more of our risk management consultants in a particular market in which we participate, our revenues may decrease and we may lose market share in that particular market.
In addition, recruitment and retention of qualified personnel could require us to pay sign-on or guaranteed bonuses or otherwise increase our employee costs. These additional costs could adversely affect our profitability.
13
We operate in a highly regulated industry and we may face restrictions with respect to the way we conduct certain of our operations.Our businesses, and the commodity brokerage industry generally, are subject to extensive regulation at the federal level. These regulations are designed to protect the interests of the investing public generally rather than our stockholders. Self-regulatory organizations, including the National Futures Association (the “NFA”) and the Chicago Mercantile Exchange (the “CME”) (our designated self-regulatory organization), require compliance with their extensive rules and regulations. The Commodity Futures Trading Commission (the “CFTC”) and other federal agencies extensively regulate the U.S. futures and commodities industry. Our grain merchandising business is also subject to state regulation of grain dealers and federal regulation by the U.S. Department of Agriculture and the Food and Drug Administration.
Some aspects of our business are subject to extensive regulation, including:
| | • | | the way we deal with and solicit clients, |
| | • | | financial and reporting practices, |
| | • | | required record keeping and record retention procedures, |
| | • | | the licensing of our operating subsidiaries and our employees, |
| | • | | the conduct of directors, officers, employees and affiliates, |
| | • | | systems and control requirements, |
| | • | | restrictions on marketing, and |
| | • | | client identification and anti-money laundering requirements. |
Failure to comply with any of the laws, rules or regulations of any federal, state or self-regulatory authority could result in a fine, injunction, suspension or expulsion from the industry, which could materially and adversely impact us.
We and our employees, including our officers, may be subject to censure, fines, suspensions or other sanctions which may have a material and adverse impact on our business. Even if any sanction does not materially affect our financial position or results of operations, our reputation could be harmed.
The government agencies that regulate us have broad powers to investigate and enforce compliance and punish noncompliance with their rules, regulations and industry standards of practice. We or our directors, officers and employees may not comply with the rules and regulations of, and may be subject to claims or actions by, these agencies. In addition, because our industry is heavily regulated, regulatory approval may be required prior to expansion of business activities. We may not be able to obtain the necessary regulatory approvals for any desired expansion. Even if approvals are obtained, they may impose restrictions on our business or we may not be able to continue to comply with the terms of the approvals or applicable regulations. The implementation of unfavorable regulations or unfavorable interpretations of existing regulations by courts or regulatory bodies could require us to incur significant compliance costs or cause the development or continuation of business activities in affected markets to become impractical.
Changes in legislation or regulations may affect our ability to conduct our business or reduce our profitability.The legislative and regulatory environment in which we operate has undergone significant change in the past and may undergo significant change again in the future. The federal government, the CFTC, the Securities and Exchange Commission (the “SEC”), the CME, the NFA and other U.S. or foreign governmental authorities continuously review legislative and regulatory initiatives and may adopt new or revised laws and regulations. These legislative and regulatory initiatives may affect the way in which we conduct our business and may make our business less profitable. Changes in the interpretation or enforcement of existing laws and regulations by those entities may also adversely affect our business.
14
We are subject to a risk of legal proceedings, which may result in significant losses to us that we cannot recover.Many aspects of our business subject us to substantial risk of potential liability to customers and to regulatory enforcement proceedings by federal and other regulators. These risks include, among others, potential civil litigation triggered by regulatory investigations, potential liability from disputes over terms of a trade, the claim that a system failure or delay caused monetary losses to a customer, that we entered into an unauthorized transaction or that we provided materially false or misleading statements in connection with a transaction. Dissatisfied clients can make claims against us, including claims for negligence, fraud, unauthorized trading, failure to supervise, breach of fiduciary duty, employee errors, intentional misconduct, unauthorized transactions by associated persons and failures in the processing of transactions. These risks also include potential liability from disputes over the exercise of our rights with respect to customer accounts and collateral. Although our customer agreements generally provide that we may exercise such rights with respect to customer accounts and collateral as we deem reasonably necessary for our protection, our exercise of these rights could lead to claims by customers that we have exercised these rights improperly.
Additionally, employee misconduct could subject us to financial losses and regulatory sanctions and could seriously harm our reputation and negatively affect our business. It is not always possible to deter employee misconduct and the precautions taken to prevent and detect employee misconduct may not always be effective. Misconduct by employees could include engaging in unauthorized transactions or activities, failure to properly supervise other employees, engaging in improper or unauthorized activities on behalf of clients or improperly using confidential information. We cannot assure you that these types of proceedings will not materially and adversely affect us.
Employee errors, including mistakes in executing, recording or reporting transactions for clients, could cause us to enter into transactions that clients may disavow and refuse to settle, which could expose us to the risk of material losses until the errors are detected and the transactions are unwound or reversed. If our clients are not able to settle their transactions on a timely basis, the time in which employee errors are detected may be increased and our risk of material loss can be increased. The risk of employee error or miscommunication may be greater for products that are new or have non-standardized terms.
Misconduct by employees of our customers in dealing with us can also expose us to claims for financial losses or regulatory proceedings when it is alleged we or our employees knew or should have known that the employee of the customer was not authorized to undertake certain transactions.
In addition to the foregoing financial costs and risks associated with potential liability, the defense of litigation includes increased costs associated with attorneys’ fees. The amount of outside attorneys’ fees incurred in connection with the defense of litigation could be substantial and might materially and adversely affect our results of operations for any reporting period.
Our compliance and risk management methods might not be effective, which could increase the risk that we are subject to regulatory action or litigation or otherwise negatively impact our business.Our ability to comply with applicable laws, rules and regulations is largely dependent on our establishment and maintenance of compliance, audit and reporting systems, as well as our ability to attract and retain qualified compliance and other risk management personnel. If we fail to effectively establish and maintain such compliance and reporting systems or fail to attract and retain personnel who are capable of designing and operating such systems, it will increase the likelihood that we will become subject to legal and regulatory infractions, including civil litigation and investigations by regulatory agencies.
For us to avoid a number of risks inherent in our business, it is necessary for us to have polices and procedures that identify, monitor and manage our risk exposure. Management of operational, legal and regulatory risk requires, among other things, policies and procedures to record properly and verify a large number of transactions and events. Such policies may not be fully effective. Some of our risk management policies and procedures depend upon evaluation of information regarding markets, customers or other matters that are publicly available or otherwise accessible by us. That information may not in all cases be accurate, complete,
15
up-to-date or properly evaluated. Further, our risk management policies and procedures rely on a combination of technical and human controls and supervision, which are subject to error and failure. Some of our risk management policies and procedures are based on internally developed controls and observed historical market behavior and also involve reliance on industry standard practices. These policies and procedures may not adequately prevent future losses, particularly as they relate to extreme market movements, which may be significantly greater than comparable historical movements. We may not always be successful in monitoring or evaluating the risks to which we are or may be exposed. If our risk management efforts are ineffective, we could suffer losses that could have a material adverse effect on our financial condition or operating results.
We operate as a principal in the OTC derivatives markets which involves the risks associated with commodity derivative instruments.We offer OTC derivatives to our customers in which we act as a principal counterparty. We endeavor to simultaneously offset the commodity price risk of the instruments by establishing corresponding offsetting positions with commodity counterparties. To the extent that we are unable to simultaneously offset an open position or the offsetting transaction is not fully effective to eliminate the commodity derivative risk, we have market risk exposure on these unmatched transactions. Our exposure varies based on the size of the overall positions, the terms and liquidity of the instruments brokered, and the amount of time the positions remain open.
To the extent an unhedged position is not disposed of intra-day, adverse movements in the commodities underlying these positions or a downturn or disruption in the markets for these positions could result in a substantial loss. In addition, any principal gains and losses resulting from these positions could on occasion have a disproportionate effect, positive or negative, on our financial condition and results of operations for any particular reporting period.
Transactions involving OTC derivative contracts may be adversely affected by fluctuations in the level, volatility, correlation or relationship between market prices, rates, indices and/or other factors. These types of instruments may also suffer from illiquidity in the market or in a related market.
OTC derivative transactions are subject to unique risks.OTC derivative transactions are subject to the risk that, as a result of mismatches or delays in the timing of cash flows due from or to counterparties in OTC derivative transactions or related hedging, trading, collateral or other transactions, we or our counterparty may not have adequate cash available to fund its current obligations.
We could incur material losses pursuant to OTC derivative transactions because of inadequacies in or failures of our internal systems and controls for monitoring and quantifying the risk and contractual obligations associated with OTC derivative transactions and related transactions or for detecting human error, systems failure or management failure.
OTC derivative transactions may be modified or terminated only by mutual consent of the original parties and subject to agreement on individually negotiated terms. Accordingly it may not be possible to modify, terminate or offset obligations or exposure to the risk associated with a transaction prior to its scheduled termination date.
We are subject to regulatory capital requirements and failure to comply with these rules would significantly harm our business.The CFTC and various other self-regulatory organizations have stringent rules with respect to the maintenance of specific levels of net capital by our FCM subsidiary. Failure to maintain the required net capital may subject a firm to limitations on its activities, including suspension or revocation of its registration by the CFTC and suspension or expulsion by the NFA, various exchanges of which our FCM subsidiary is a member and ultimately may require its liquidation. Failure to comply with the net capital rules could have material and adverse consequences such as limiting our operations, or restricting us from withdrawing capital from our FCM subsidiary.
If these net capital rules are changed or expanded, or if there is an unusually large charge against net capital, operations that require the intensive use of capital would be limited. Also, our ability to withdraw capital from
16
our regulated subsidiaries is subject to restrictions, which in turn could limit our ability to pay dividends, repay debt and redeem or purchase shares of our common stock. A large operating loss or charge against net capital could adversely affect our ability to expand or even maintain our present levels of business, which could have a material adverse effect on our business. We cannot predict our future capital needs or our ability to obtain additional financing.
We are subject to margin funding requirements on short notice; failure to meet such requirements would significantly harm our business.Our business involves establishment and carrying of substantial open positions for customers on futures exchanges and in the OTC derivatives markets. We are required to post and maintain margin or credit support for these positions. Although we collect margin or other deposits from our customers for these positions, significant adverse price movements can occur which will require us to post margin or other deposits on short notice, whether or not we are able to collect additional margin or credit support from our customers. Although we maintain borrowing facilities for the purpose of funding margin and credit support and have systems to endeavor to collect margin and other deposits from customers on a same-day basis, there can be no assurance that these facilities and systems will be adequate to eliminate the risk of margin calls in the event of severe adverse price movements affecting open positions of our customers.
We must obtain and maintain credit facilities to operate; failure to maintain such facilities would require curtailment of our operations and result in losses.We are substantially dependent on credit facilities for liquidity and operational funding as well as to insure the availability of sufficient regulatory capital at our subsidiaries. These credit facilities are necessary in order to meet immediate margin funding requirements, to fund and carry ownership in cash commodities, and to maintain positions required for our own risk management position in futures and OTC markets. If our credit facilities are unavailable or insufficient to support our level of business activities, we may need to raise additional funds externally, either in the form of debt or equity. If we cannot raise additional funds on acceptable terms, we may not be able to develop or enhance our business, take advantage of future opportunities or respond to competitive pressure or unanticipated requirements.
Our international operations involve special challenges that we may not be able to meet, which could adversely affect our financial results.We engage in a significant amount of business with customers in Asia, Latin America and Canada, as well as other international markets. Certain additional risks are inherent in doing business in international markets, particularly in a regulated industry. These risks include:
| | • | | the inability to manage and coordinate the various regulatory requirements of multiple jurisdictions that are constantly evolving and subject to unexpected change, |
| | • | | tariffs and other trade barriers, |
| | • | | difficulties in recruiting and retaining personnel, and managing international operations, |
| | • | | difficulties of debt collection in foreign jurisdictions, |
| | • | | potentially adverse tax consequences, and |
| | • | | reduced protection for intellectual property rights. |
Our operations are also subject to the political, legal and economic risks associated with politically unstable and less developed regions of the world, including the risk of war and other international conflicts and actions by governmental authorities, insurgent groups, terrorists and others. Specifically, we conduct business in countries whose currencies may be unstable. Future instability in such currencies or the imposition of governmental or regulatory restrictions on such currencies could impede our foreign exchange business and our ability to collect on collateral held in such currencies.
In addition, we are required to comply with the laws and regulations of foreign governmental and regulatory authorities of each country in which we conduct business. These may include laws, rules and regulations, including registration requirements. Our compliance with these laws and regulations may be difficult and time consuming and may require significant expenditures and personnel requirements, and our failure to be in
17
compliance would subject us to legal and regulatory liabilities. We have customers in numerous countries around the world in which we are not registered. As a result, we may become subject to the regulatory requirements of those countries. We may also experience difficulty in managing our international operations because of, among other things, competitive conditions overseas, established domestic markets, language and cultural differences and economic or political instability. Any of these factors could have a material adverse effect on the success of our international operations or limit our ability to grow our international operations and, consequently, on our business, financial condition and operating results.
Although most of our international business is settled in U.S. dollars, our international operations also expose us to the risk of fluctuations in currency exchange rates. Our risk management strategies relating to exchange rates may not prevent us from suffering losses that would adversely affect our financial condition or results of operations.
If we are unable to manage any of these risks effectively, our business could be adversely affected.
We buy and sell agricultural commodities and agricultural commodity products in our business, the demand for which can be affected by weather, disease and other factors beyond our control.Weather conditions, disease and other factors have historically caused volatility in the agricultural commodities industry and consequently in our operating results by causing crop failures or significantly reduced or increased harvests, which can affect the supply and pricing of the agricultural commodities that we buy and sell in our business, reduce the demand for our fertilizer products and negatively affect the creditworthiness of our customers and suppliers. Reduced supply of agricultural commodities due to weather-related factors could adversely affect our profitability in the future.
Our grain merchandising activities involve numerous business risks.Our grain merchandising activities depend on our ability to earn a margin on bushels of grain purchased and sold. We can incur losses if the sale price, after taking into account hedge gains and losses, is less than the purchase price, if the purchase price cannot be collected or if there are uncovered losses relating to physical quality or uncovered risk of casualty losses. We attempt to mitigate the losses by appropriate policies and practices, but there can be no assurance that such efforts will be sufficient to avoid losses.
Our financial services activities involve substantial operational risk.We are exposed to various kinds of operational risks relating to the underlying commodities that form the basis of our financial services transactions. Losses in and to these commodities, which could be caused by fraud, misappropriation or other uninsured loss, could cause loss to us. Many of our financial services transactions depend on documents of title issued to, or held by, us. If such documents were invalid or not fully enforceable, it could cause a material loss. There are government programs that back grain warehouse receipts, but these could be inadequate to fully reimburse us for the value of grain evidenced by our warehouse receipts in the event of the business failure of the issuer of the receipt.
Computer systems failures, capacity constraints and breaches of security could increase our operating costs and cause us to lose clients.We are heavily dependent on the capacity and reliability of the computer and communications systems supporting our operations, whether owned and operated internally or by third parties. We receive and process a large portion of our trade orders through electronic means, such as through public and private communications networks. These computer and communications systems and networks are subject to performance degradation or failure from any number of reasons, including loss of power, acts of war or terrorism, human error, natural disasters, fire, sabotage, hardware or software malfunctions or defects, computer viruses, intentional acts of vandalism, customer error or misuse, lack of proper maintenance or monitoring and similar events. Our systems, or those of our third party providers, may fail or operate slowly, causing one or more of the following:
| | • | | unanticipated disruptions in service to our clients, |
18
| | • | | delays in our clients’ trade execution, |
| | • | | failed settlement of trades, |
| | • | | decreased client satisfaction with our services, |
| | • | | incomplete, untimely or inaccurate accounting, recording, reporting or processing of trades, |
| | • | | litigation or other client claims, and |
The occurrence of degradation or failure of the communications and computer systems on which we rely may lead to financial losses, litigation or arbitration claims filed by or on behalf of our customers and regulatory investigations and sanctions, including by the CFTC, which require that our trade execution and communications systems be able to handle anticipated present and future peak trading volumes. Any such degradation or failure could also have a negative effect on our reputation, which in turn could cause us to lose existing customers to our competitors or make it more difficult for us to attract new customers in the future. Further, any financial loss that we suffer as a result of such degradations or failures could be magnified by price movements of contracts involved in transactions impacted by the degradation or failure, and we may be unable to take corrective action to mitigate any losses we suffer.
We must keep up with rapid technological changes in order to compete effectively.The markets in which we compete are characterized by rapidly changing methods, evolving customer demand and uses of our services, frequent product and service introductions employing new methods and the emergence of new industry standards and practices that could render our existing systems obsolete. Our future success will depend in part on our ability to anticipate and adapt to these changes. Any upgrades or expansions may require significant expenditures of funds and may also increase the probability that we will suffer system degradations and failures. We may not have sufficient funds to adequately update and expand our networks, and any upgrade or expansion attempts may not be successful and accepted by the marketplace and our customers. Any failure to adequately update and expand our systems and networks or to adapt our systems to evolving customer demands or emerging industry standards would have a material adverse effect on our business.
We depend on third-party software licenses.The loss of any of our key licenses could adversely affect our ability to provide our brokerage services. We license software from third parties, some of which is integral to our business. These licenses are generally terminable if we breach our obligations under the licenses or if the licensor gives us notice in advance of the termination. If any of these relationships were terminated, or if any of these third parties were to cease doing business, we may be forced to spend significant time and money to replace the licensed software. These replacements may not be available on reasonable terms, if at all. A termination of any of these relationships could have a material adverse effect on our financial condition and results of operations.
We may not be able to protect our intellectual property rights or may be prevented from using intellectual property necessary for our business.We rely primarily on trade secret, contract, copyright and trademark law to protect our proprietary information and methods. It is possible that third parties may copy or otherwise obtain and use our proprietary information and methods without authorization or otherwise infringe on our rights. We may also face claims of infringement that could interfere with our ability to use information and methods that are material to our business operations.
In the future, we may have to rely on litigation to enforce our intellectual property rights, protect our trade secrets, determine the validity and scope of the proprietary rights of others or defend against claims of infringement or invalidity. Any such litigation, whether successful or unsuccessful, could result in substantial costs and the diversion of resources and the attention of management, any of which could negatively affect our business.
19
Our operating results are subject to significant fluctuations due to seasonality. As a result, you should not rely on our operating results in any particular period as an indication of our future performance.In the past, our business has experienced seasonal fluctuations, reflecting reduced trading activity during summer months, particularly in August. We also generally experience reduced activity in December due to seasonal holidays. Traditional commodity derivatives, such as grain and energy, will reflect changing supply/demand factors related to heating/cooling and planting/harvesting seasons. As a result, our quarterly operating results may not be indicative of the results we expect for the full year. Our operating results may also fluctuate quarter to quarter due to a variety of factors beyond our control such as conditions in the global financial markets, terrorism, war and other economic and political events. Furthermore, we may experience reduced revenues in a quarter due to a decrease in the number of business days in that quarter.
Restrictions on our eligibility to borrow may restrict our ability to pursue our business strategies.A majority of our company’s ownership must be held by cooperatives in order to maintain our eligibility to borrow from CoBank, ACB. As a result of this offering, cooperatives that are our stockholders will be able to sell their common stock, which, in the future, may cause us to be ineligible to borrow from CoBank, ACB. It is uncertain whether we will be able to find substitute lines of credit on similar or better terms.
We will be exposed to risks relating to the evaluation of our internal controls over financial reporting as required by Section 404 of the Sarbanes-Oxley Act of 2002.As of August 31, 2007, we will be subject to the requirements of Section 404 of the Sarbanes-Oxley Act and the SEC rules and regulations require an annual management report on our internal controls over financial reporting, including, among other matters, management’s assessment of the effectiveness of our internal control over financial reporting, and an attestation report by our independent registered public accounting firm addressing these assessments. The SEC has proposed an extension of the compliance deadline for non-accelerated filers, which, if adopted, would extend our deadline for compliance to August 31, 2008.
There can be no assurance that the company’s management will not conclude that there are material weaknesses in the company’s internal control over financial reporting. If management concludes that there are material weaknesses in the company’s internal control over financial reporting , we may be subject to investigation and sanctions by regulatory authorities, such as the SEC and our common stock may be subject to delisting by the NASDAQ Global Market.
Moreover, if we are unable to assert that our internal control over financial reporting is effective in any future period (or if our auditors are unable to express an opinion on the effectiveness of our internal controls), we could lose investor confidence in the accuracy and completeness of our financial reports, which may have a material adverse effect on our company.
Our compliance with Section 404 of the Sarbanes-Oxley Act may require significant expenses and management resources that would need to be diverted from our other operations and could require a restructuring of our internal controls over financial reporting. Any such expenses, time reallocations or restructuring could have a material adverse effect on our operations.
Item 2. Properties and Locations
We lease office space for our principal business operations. Our corporate headquarters is located in West Des Moines, Iowa, where we lease approximately 12,000 square feet. This lease is in place until December 31, 2016. We have other offices in Chicago, Illinois; New York, New York; Kansas City, Missouri; St. Louis, Missouri; Omaha, Nebraska; Minneapolis, Minnesota; Bloomington, Illinois; Roy, Utah; Buford, Georgia; Indianapolis, Indiana; Spirit Lake, Iowa; Bowling Green, Ohio; Summit, New Jersey; Winnipeg, Canada; Blenheim, Canada; and Campinas, Brazil. We have established representative offices in Beijing and Dalian in the
20
People’s Republic of China. All of our offices and other principal business properties are leased. We plan to relocate our corporate headquarters to Kansas City during 2007.
We have a major leased grain facility located at the port of Mobile, Alabama, and other leased grain facilities located in Indiana and Ontario, Canada. We own an additional facility located in Columbus Grove, Ohio.
The Mobile, Alabama facility consists of facilities for unloading rail shipments, temporary storage, and loading ocean-going vessels. The facility is leased from the State of Alabama for a term expiring December 1, 2012, under an agreement which is recognized as a capital lease for accounting purposes. Our obligations at Mobile are supported by an agreement with FGDI’s minority owner to purchase a minimum volume of grain through the facility.
Item 3. Legal Proceedings
On August 21, 2003, August 21, 2003, September 23, 2003, October 16, 2003, and July 16, 2004, Euro-Maritime Chartering, Inc. filed five separate claims under the arbitration facility established by the London Maritime Arbitrators Association of London, England, alleging a breach by FGDI of charter party agreements regarding five vessels and seeking to recover damages of $242,655, $230,863, $769,302, $649,031 and $403,167, respectively. Euro-Maritime Chartering alleges that these damages arise from detention and demurrage encountered at China ports with respect to cargos that FGDI sold to Chinese buyers. FGDI does not dispute the demurrage claims, which are estimated to total approximately $690,000. FGDI claims that, under the sales contracts with the Chinese buyers, any detention and demurrage charges were for the account of the buyers. FGDI has collected deposits from the Chinese buyers in the total amount of $669,436, which are being held pending resolution of the detention claims. FGDI intends to vigorously defend the detention claims and believes that it has meritorious defenses. If the claimant prevails on any of the detention claims, or otherwise in amounts above the corresponding deposit, FGDI expects to seek collection of such amounts from the buyers.
On December 13, 2003, Liaoyang Edible Oils filed a claim in arbitration under the arbitration facility established by the Federation of Oils, Seeds and Fats Associations Ltd. of Hong Kong alleging a breach of a sales contract by FGDI and seeking to recover damages of $1,125,000, of which $55,475 was not disputed as due under the contract. Liaoyang Edible Oils alleged that these damages arose out of disputes related to the final pricing of the contract. On December 15, 2005 the arbitration panel rendered a decision, dismissing the claim for pricing damages, but also doing its own accounting under the contract, and making an award to claimant, including interest and arbitration costs, of approximately $275,000. A partial award of attorneys’ fees and costs was also rendered in the decision, although this amount is yet to be quantified. FGDI has made an accrual related to this claim. On January 25, 2006, the claimant filed an appeal, which under the arbitration rules governing this dispute, is deemed to be a request for a new hearing. FGDI intends to defend the appeal and seek an order that the award be upheld in its entirety, except for the accounting amount and except that each party should be ordered to bear its own legal costs. In addition, FGDI has cross appealed as to the amount determined by the arbitration panel.
On December 9, 2004, Xiamen Zhonge Industry Co., Ltd. (Xiamen) filed a claim in arbitration under the arbitration facility established by the Federation of Oils, Seeds and Fats Associations Ltd. of Hong Kong. Xiamen’s claim alleges that FGDI breached its duty to accept pricing instructions provided by Xiamen to FGDI. FGDI submitted a statement of defense and counterclaim to which Xiamen replied with a modified claim. The matter is now fully submitted and is awaiting decision.
On May 23, 2006, a former customer, Watseka Farmers Grain Cooperative Company, filed an action in the United States District Court, Central District of Illinois seeking actual damages, interest, punitive damages and general relief relating to losses on allegedly improper speculative trades ordered by the former general manager of the customer in a commodity futures account at FCStone, LLC. The customer was placed under supervision by Illinois state authorities in May 2004, after examination revealed deficiencies in its financial reporting and condition, and its assets were subsequently sold. We intend to vigorously defend this claim.
21
We are currently unable to predict the outcome of these claims and, with the exception of the claim in which an arbitration panel has rendered a decision, believes their current status does not warrant accrual under the guidance of Statement on Financial Accounting Standards No. 5,Accounting for Contingencies, since the amount of any liability is neither probable nor reasonably estimable. As such, with the exception of the amount recorded as a result of the arbitration panel’s decision and the accounts receivable charged to bad debt expense, no amounts have been accrued in the financial statements. We intend to vigorously defend the claims against us and will continue to monitor the results of arbitration and assess the need for future accruals.
From time to time and in the ordinary course of our business, we are a plaintiff or are a defendant in other legal proceedings related to various issues, including worker’s compensation claims, tort claims, contractual disputes and collections. With the exception of the matters discussed above, we are not aware of other potential claims that could result in the commencement of material legal proceedings. We carry insurance that provides protection against certain types of claims, up to the policy limits of our insurance. In the opinion of our management, liabilities, if any, arising from existing litigation and claims will not have a material effect on our earnings, financial position or liquidity.
Item 4. Submission of Matters to a Vote of Security Holders
No matter was submitted to a vote of security holders during the last quarter of the fiscal year covered by this report.
Item 4A. Executive Officers of the Company
The following table sets forth the names, ages, positions and certain other information regarding the Company’s executive officers as of August 31, 2006. Officers are elected annually and serve at the discretion of the Board of Directors.
| | | | |
Name
| | Age
| | Positions
|
Paul G. (Pete) Anderson | | 53 | | President and Chief Executive Officer and Director |
Stephan Gutierrez | | 55 | | Executive Vice President and Chief Operating Officer |
Jeff Soman | | 55 | | Executive Vice President of FCStone, LLC |
Robert V. Johnson | | 57 | | Executive Vice President and Chief Financial Officer |
Steven J. Speck | | 47 | | President and Chief Executive Officer of FGDI, LLC |
Pete Anderson has been employed by our company since 1987, served as President and CEO since 1999, and has been appointed a director in November 2006. Prior to becoming president, Mr. Anderson was the Vice President of Operations. Mr. Anderson is the past president of the Kansas Cooperative Council and past founding chairman of the Arthur Capper Cooperative Center at Kansas State University. Mr. Anderson sits on the board of directors of Associated Benefits Corporation and is a member of National Council of Farmer Cooperatives, the National Feed and Grain Association and several other state associations.
Stephan Gutierrez has been employed as Executive Vice President and Chief Operating Officer of the company since 2002. He also serves as president of our subsidiaries, FCStone, LLC and FCStone Trading, LLC. Prior to his positions with FCStone, Mr. Gutierrez worked at Cargill as a Division Managing Director and Trading Manager. Mr. Gutierrez has 31 years of experience in trading, risk and asset management oversight with respect to multiple commodities.
Jeff Soman has been employed as Executive Vice President of FCStone, LLC since 2000. Mr. Soman has over 26 years of experience managing the clearing, internal risk management and brokerage facilities of several major brokerage firms. During the last 15 years he has worked in this capacity for FCStone, LLC or one of its predecessor companies.
Robert V. Johnson has been employed as our Chief Financial Officer since 1987. Mr. Johnson previously was the corporate controller for Heritage Communications, Inc. a publicly-traded cable television company.
22
Mr. Johnson is a member of Financial Executives International, the Iowa Society of CPAs and the American Institute of CPAs.
Steven Speck has served as the President and CEO of FGDI since 2001. Prior to 2001 he served as our Vice President-Specialty Crops of for nine years.
23
PART II
Item 5. Market for Registrant’s Common Equity and Related Stockholder Matters
(a) Market Information. There is no established public trading market for our common stock. On October 12, 2006, we filed a registration statement pursuant to the Securities Act of 1933, as amended, regarding our proposed public offering of common stock. If the public offering is consummated, we expect a public trading market for our common stock to be established.
(b) Holders. As of November 9, 2006, there were 512 record holders of our common stock.
(c) Dividends. The board declared a dividend of $1.25 per share payable on December 20, 2006 to holders of record as of November 9, 2006. In the prior year, the board declared a dividend of $0.60 per share paid to holders of record, as of October 27, 2005, on December 22, 2005. Future regular dividends may be declared and paid at the discretion of the board of directors. Any determination to pay cash dividends will be at the discretion of our board of directors, and will depend upon our results of operations and cash flows, our financial position and capital requirements, general business conditions, legal, tax, regulatory, rating agency and any contractual restrictions on the payment of dividends and any other factors our board of directors deems relevant.
(d) Securities Authorized for Issuance Under Equity Compensation Plans. The following table sets forth as of August 31, 2006 (a) the number of securities to be issued upon exercise of outstanding options, warrants and rights, (b) the weighted average exercise price of outstanding options, warrants and rights and (c) the number of securities remaining available for future issuance under equity compensation plans (excluding securities reflected in column (a)).
| | | | | | | |
Plan Category
| | (a) Number of securities to be issued upon exercise
of outstanding options,
warrants and rights
| | (b) Weighted average
exercise price of outstanding options, warrants and rights
| | (c) Number of securities remaining available for future issuance under equity compensation plans (excluding securities reflected in column (a))
|
Equity compensation plans approved by security holders | | N/A | | | N/A | | N/A |
Equity compensation plans not approved by security holders | | 400,000 | | $ | 24.76 | | 350,000 |
| | |
| |
|
| |
|
Total | | 400,000 | | $ | 24.76 | | 350,000 |
| | |
| |
|
| |
|
As of August 31, 2006, equity compensation plans not approved by security holders include our 2006 Equity Incentive Plan (the “Plan”).
The Plan was approved by our board of directors on May 2, 2006. We have submitted the Plan for approval by the holders of our common stock at a Special Meeting of our Stockholders scheduled for December 5, 2006. The purpose of the Plan is to encourage eligible participants to acquire a proprietary and vested interest in the growth and performance of the company. All key employees of the company, its affiliates and its subsidiaries, including employees who are officers or members of the board, and members of the board who are not employees of the company are eligible to participate in the Plan.
The Plan is administered by the Compensation Committee of the board of directors consisting of two or more directors. Subject to the terms of the Plan, the Committee has the sole discretion to administer and interpret the Plan and determine who shall be granted awards, the size and types of such awards and the terms and conditions of such awards. The Plan permits the issuance of up to 750,000 shares of the company’s common stock pursuant to awards granted under the Plan, such as stock options, restricted stock awards, restricted stock units and performance share awards, as well as other awards such as stock appreciation rights, and performance unit and performance share awards which may be payable in the form of common stock or cash.
The Plan will expire on May 2, 2016 unless the Plan is extended with the approval of the shareholders and the board. However, the company reserves the right to amend, change or terminate the Plan, in whole or in part, as permitted under the Plan, at any time for any reason.
24
We do not currently have any equity compensation plans other than the 2006 Equity Incentive Plan.
(e) Repurchases of Equity Securities by the Company. None.
Item 6. Selected Financial Data
The table shown below presents our summary financial data at the date and for the periods indicated. The summary financial data as of August 31, 2005 and August 31, 2006 and for each of the years in the three-year period ended August 31, 2006 have been derived from our audited consolidated financial statements included elsewhere in this report on Form 10-K. The summary financial data as of August 31, 2002, 2003 and 2004 and for each of the years in the two-year period ended August 31, 2003 have been derived from our audited consolidated financial statements that are not included in this report on Form 10-K. Historical per share data has been omitted for each fiscal year prior to the fiscal year 2005 because under our previous cooperative structure in place during those periods, earnings of the cooperative were distributed as patronage dividends to members based on the level of business conducted with the cooperative as opposed to common stockholder’s proportionate share of underlying equity in the cooperative.
You should read the data set forth below in conjunction with our audited consolidated financial statements and the related notes thereto, “Management’s Discussion and Analysis of Financial Condition and Results of Operations,” and other financial information included elsewhere in this report.
| | | | | | | | | | | | | | | | | |
| | | Year Ended August 31,
| |
| | | 2002
| | 2003
| | 2004
| | 2005
| | | 2006
| |
| | | (amounts in thousands, except per share amounts) | |
Statement of Operations Data: | | | | | | | | | | | | | | | | | |
Revenues: | | | | | | | | | | | | | | | | | |
Commissions and clearing fees | | $ | 41,025 | | $ | 48,947 | | $ | 67,594 | | $ | 76,674 | | | | 105,622 | |
Service, consulting and brokerage fees | | | 10,834 | | | 10,566 | | | 12,008 | | | 18,913 | | | | 33,388 | |
Interest | | | 3,634 | | | 4,610 | | | 3,982 | | | 8,177 | | | | 23,174 | |
Other | | | 2,088 | | | 4,299 | | | 4,521 | | | 7,463 | | | | 2,638 | |
Sales of commodities | | | 838,361 | | | 1,164,334 | | | 1,536,209 | | | 1,290,620 | | | | 1,129,983 | |
| | |
|
| |
|
| |
|
| |
|
|
| |
|
|
|
Total revenues | | | 895,942 | | | 1,232,756 | | | 1,624,314 | | | 1,401,847 | | | | 1,294,805 | |
| | |
|
| |
|
| |
|
| |
|
|
| |
|
|
|
| | | | | |
Costs and expenses: | | | | | | | | | | | | | | | | | |
Cost of commodities sold | | | 826,544 | | | 1,150,608 | | | 1,519,221 | | | 1,275,094 | | | | 1,112,949 | |
Employee compensation and broker commissions | | | 23,952 | | | 25,955 | | | 30,160 | | | 32,578 | | | | 44,229 | |
Pit brokerage and clearing fees | | | 11,557 | | | 16,382 | | | 26,713 | | | 33,141 | | | | 47,613 | |
Introducing broker commissions | | | 7,802 | | | 8,551 | | | 10,704 | | | 14,459 | | | | 22,826 | |
Employee benefits and payroll taxes | | | 4,707 | | | 5,971 | | | 7,136 | | | 8,044 | | | | 9,801 | |
Interest | | | 1,297 | | | 3,040 | | | 4,418 | | | 3,946 | | | | 5,705 | |
Depreciation and amortization | | | 892 | | | 837 | | | 861 | | | 1,551 | | | | 1,674 | |
Bad debt expense | | | 310 | | | 76 | | | 716 | | | 4,077 | | | | 1,909 | |
Other expenses | | | 13,613 | | | 15,270 | | | 15,365 | | | 18,926 | | | | 23,568 | |
| | |
|
| |
|
| |
|
| |
|
|
| |
|
|
|
Total costs and expenses | | | 890,674 | | | 1,226,690 | | | 1,615,294 | | | 1,391,816 | | | | 1,270,274 | |
| | |
|
| |
|
| |
|
| |
|
|
| |
|
|
|
Income before income tax expense and minority interest | | | 5,268 | | | 6,066 | | | 9,020 | | | 10,031 | | | | 24,531 | |
Minority interest | | | 600 | | | 561 | | | 576 | | | (499 | ) | | | (226 | ) |
| | |
|
| |
|
| |
|
| |
|
|
| |
|
|
|
Income after minority interest and before income taxes | | | 4,668 | | | 5,505 | | | 8,444 | | | 10,530 | | | | 24,757 | |
Income tax expense | | | 1,280 | | | 1,200 | | | 2,030 | | | 3,950 | | | | 9,500 | |
| | |
|
| |
|
| |
|
| |
|
|
| |
|
|
|
Net income | | $ | 3,388 | | $ | 4,305 | | $ | 6,414 | | $ | 6,580 | | | $ | 15,257 | |
| | |
|
| |
|
| |
|
| |
|
|
| |
|
|
|
Basic and diluted shares outstanding(1) | | | | | | | | | | | | 4,357 | | | | 4,833 | |
Basic and diluted earnings per share | | | | | | | | | | | $ | 1.51 | | | | 3.16 | |
25
| | | | | | | | | | | | | | | | | | | | |
| | | August 31,
| |
| | | 2002
| | | 2003
| | | 2004
| | | 2005
| | | 2006
| |
| | | (amounts in thousands) | |
Statement of Financial Condition: | | | | | | | | | | | | | | | | | | | | |
Total assets | | $ | 399,526 | | | $ | 504,733 | | | $ | 603,827 | | | $ | 809,584 | | | $ | 1,057,207 | |
Notes payable and subordinated debt | | | 66,013 | | | | 76,548 | | | | 47,281 | | | | 42,411 | | | | 55,169 | |
Obligations under capital leases | | | — | | | | 5,363 | | | | 4,675 | | | | 4,125 | | | | 3,575 | |
Minority interest | | | 3,758 | | | | 4,109 | | | | 5,488 | | | | 4,755 | | | | 3,607 | |
Redeemable common stock held by employee stock ownership plan (ESOP)(2) | | | — | | | | — | | | | — | | | | 4,487 | | | | 6,079 | |
Capital stock and equity | | $ | 35,172 | | | $ | 35,827 | | | $ | 39,829 | | | $ | 45,185 | | | $ | 58,895 | |
| |
| | | Year Ended August 31,
| |
| | | 2002
| | | 2003
| | | 2004
| | | 2005
| | | 2006
| |
| | | (amounts in thousands) | |
Segment and Other Data: | | | | | | | | | | | | | | | | | | | | |
Income (loss) before minority interest and income tax expense: | | | | | | | | | | | | | | | | | | | | |
Commodity and Risk Management Services | | $ | 5,591 | | | $ | 6,676 | | | $ | 7,907 | | | $ | 11,160 | | | $ | 21,937 | |
Clearing and Execution Services | | | 863 | | | | 947 | | | | 3,359 | | | | 5,152 | | | | 10,981 | |
Financial Services | | | — | | | | 109 | | | | (447 | ) | | | 556 | | | | (19 | ) |
Grain Merchandising | | | 2,002 | | | | 1,869 | | | | 2,230 | | | | (2,037 | ) | | | (430 | ) |
Corporate | | | (3,188 | ) | | | (3,535 | ) | | | (4,029 | ) | | | (4,800 | ) | | | (7,938 | ) |
| | |
|
|
| |
|
|
| |
|
|
| |
|
|
| |
|
|
|
| | | $ | 5,268 | | | $ | 6,066 | | | $ | 9,020 $ | | | | 10,031 | | | $ | 24,531 | |
| | |
|
|
| |
|
|
| |
|
|
| |
|
|
| |
|
|
|
Revenues, net of cost of commodities sold(3) | | $ | 69,398 | | | $ | 82,148 | | | $ | 105,093 | | | $ | 126,753 | | | $ | 181,856 | |
EBITDA(3) | | $ | 6,857 | | | $ | 9,382 | | | $ | 13,723 | | | $ | 16,027 | | | $ | 32,136 | |
Return on equity | | | 9.5 | % | | | 11.7 | % | | | 16.5 | % | | | 15.4 | % | | | 30.1 | % |
Exchange contract trading volume | | | 10,648 | | | | 16,268 | | | | 29,911 | | | | 36,240 | | | | 47,467 | |
Customer segregated assets, end of period | | $ | 262,482 | | | $ | 246,215 | | | $ | 389,953 | | | $ | 594,733 | | | $ | 764,847 | |
| (1) | The calculation of the basic and diluted shares outstanding for the year ended August 31, 2005 assumes the shares issued as a result of the restructuring have been issued and outstanding for the full year. |
| (2) | In the event a terminated plan participant desires to sell his or her shares of common stock, we may be required to purchase the shares from the participant at their appraised value. Redeemable common stock held by the ESOP represents our maximum obligation to purchase common stock distributed to a terminated plan participant based upon the most recent appraised value as of the applicable date. |
| (3) | See “Non-GAAP Financial Measures” below. |
Non-GAAP Financial Measures
The body of U.S. generally accepted accounting principles is commonly referred to as “GAAP.” A non-GAAP financial measure is generally defined by the SEC as one that purports to measure historical or future financial performance, financial position or cash flows, but excludes or includes amounts that would not be so adjusted under applicable GAAP guidance. In this report on Form 10-K, we disclose EBITDA and revenues, net of cost of commodities sold, both of which are non-GAAP financial measures. EBITDA is not a substitute for the GAAP measures of net income (loss) or cash flows. Revenues, net of cost of commodities sold, is not a substitute for the GAAP measure of total revenues.
EBITDA
EBITDA consists of net income (loss) before interest expense, income tax expense and depreciation and amortization. We have included EBITDA in this report on Form 10-K because our management uses it as an important supplemental measure of our performance and believes that it is frequently used by securities analysts,
26
investors and other interested persons in the evaluation of companies in our industry, some of which present EBITDA when reporting their results. We regularly use EBITDA to evaluate our performance as compared to other companies in our industry that have different financing and capital structures and/or tax rates. Our management also believes that EBITDA is a useful tool for measuring our ability to meet our future debt service, capital expenditures and working capital requirements, and EBITDA is commonly used by us to measure our ability to service indebtedness. EBITDA is not a substitute for the GAAP measures of net income (loss) or cash flows and is not necessarily a measure of our ability to fund our cash needs. In addition, it should be noted that companies calculate EBITDA differently and, therefore, EBITDA as presented for us may not be comparable to EBITDA reported by other companies. EBITDA has material limitations as a performance measure because it excludes interest expense, income tax expense and depreciation and amortization. The following table reconciles EBITDA with our net income.
| | | | | | | | | | | | | | | |
| | | Year Ended August 31,
|
| | | 2002
| | 2003
| | 2004
| | 2005
| | 2006
|
| | | (dollars in thousands) |
Net income | | $ | 3,388 | | $ | 4,305 | | $ | 6,414 | | $ | 6,580 | | $ | 15,257 |
Plus: interest expense | | | 1,297 | | | 3,040 | | | 4,418 | | | 3,946 | | | 5,705 |
Plus: depreciation and amortization | | | 892 | | | 837 | | | 861 | | | 1,551 | | | 1,674 |
Plus: income tax expense | | | 1,280 | | | 1,200 | | | 2,030 | | | 3,950 | | | 9,500 |
| | |
|
| |
|
| |
|
| |
|
| |
|
|
EBITDA | | $ | 6,857 | | $ | 9,382 | | $ | 13,723 | | $ | 16,027 | | $ | 32,136 |
| | |
|
| |
|
| |
|
| |
|
| |
|
|
Revenues, Net of Cost of Commodities Sold
Revenues, net of cost of commodities sold, consists of total revenues presented as determined in accordance with GAAP, less the cost of commodities sold. Revenues, net of cost of commodities sold, is a non-GAAP financial measure that is used in this report on Form 10-K because our management considers it an important supplemental measure of our performance. Management believes revenues, net of cost of commodities sold, is a more relevant measure of our economic interest in these commodities transactions because it removes the effect of commodity price driven changes in revenue and cost of commodities sold, which may not have a meaningful effect on net income. In managing our business, management has historically focused on revenues derived from sales of commodities, net of cost of commodities sold. This financial measure is meaningful in managing our business for several reasons. First, profit is driven more by the margin on commodities sold rather than the price of the commodities. Second, we generally establish the margin between the sales price and the cost at the time we enter into a transaction, eliminating the need to manage inventory cost. Lastly, analyzing consolidated costs and expenses as a percentage of total revenue is not meaningful because total revenues related to commodity sales is a disproportionately large number compared to margin. Measuring expense as a percentage of revenues, net of cost of commodities sold, provides a clearer understanding of the trends in costs and expenses and expense management.
The following table reconciles revenues, net of cost of commodities sold, with our total revenues.
| | | | | | | | | | | | | | | |
| | | Year Ended August 31,
|
| | | 2002
| | 2003
| | 2004
| | 2005
| | 2006
|
| | | (dollars in thousands) |
Revenues: | | | | | | | | | | | | | | | |
Commissions and clearing fees | | $ | 41,025 | | $ | 48,947 | | $ | 67,594 | | $ | 76,674 | | $ | 105,622 |
Service, consulting and brokerage fees | | | 10,834 | | | 10,566 | | | 12,008 | | | 18,913 | | | 33,388 |
Interest | | | 3,634 | | | 4,610 | | | 3,982 | | | 8,177 | | | 23,174 |
Other | | | 2,088 | | | 4,299 | | | 4,521 | | | 7,463 | | | 2,638 |
Sales of commodities | | | 838,361 | | | 1,164,334 | | | 1,536,209 | | | 1,290,620 | | | 1,129,983 |
| | |
|
| |
|
| |
|
| |
|
| |
|
|
Total revenues | | | 895,942 | | | 1,232,756 | | | 1,624,314 | | | 1,401,847 | | | 1,294,805 |
Less: Cost of commodities sold | | | 826,544 | | | 1,150,608 | | | 1,519,221 | | | 1,275,094 | | | 1,112,949 |
| | |
|
| |
|
| |
|
| |
|
| |
|
|
Revenues, net of cost of commodities sold | | $ | 69,398 | | $ | 82,148 | | $ | 105,093 | | $ | 126,753 | | $ | 181,856 |
| | |
|
| |
|
| |
|
| |
|
| |
|
|
27
Item 7. Management’s Discussion and Analysis of Financial Condition and Results of Operations
The following is a discussion and analysis of our financial condition, results of operations and liquidity and capital structure for the years ended August 31, 2006, 2005 and 2004. This section should be read together with our audited consolidated financial statements and related notes included elsewhere in this report on Form 10-K. Some of the information contained in this discussion and analysis or set forth elsewhere in this report on Form 10-K, including information with respect to our plans and strategies for our business, includes forward-looking statements that involve risks and uncertainties. You should review the “Risk Factors” section of this report on Form 10-K for a discussion of important factors that could cause actual results to differ materially from the results described in, or implied by, the forward-looking statements contained in this report on Form 10-K.
Overview
We are an integrated commodity risk management company providing risk management consulting and transaction execution services to commercial commodity intermediaries, end-users and producers. We assist primarily middle market customers in optimizing their profit margins and mitigating commodity price risk. In addition to our risk management consulting services, we operate one of the leading independent clearing and execution platforms for exchange-traded futures and options contracts. In fiscal 2006, we served more than 7,500 customers and transacted more than 47.6 million contracts in the exchange-traded and OTC markets. As a natural complement to our commodity risk management consulting and execution services, we also assist our customers with the financing, transportation and merchandising of their physical commodity inventories.
In the mid 1990’s, utilizing the expertise developed in providing risk management consulting services to our traditional grain-related customers, we began a period of growth driven by our strategic decision to expand into new products and customer segments. This expansion was further accelerated when we acquired Saul Stone & Company, which enhanced our execution and clearing capabilities and gave us the ability to clear all U.S. exchange-traded commodity futures and options contracts. As our business expanded, revenues from customers who were not among our cooperative members increased significantly. In late 2004, we recognized the need to align our corporate structure with the changed dynamics of our business and to provide access to capital to finance anticipated increases in our CFTC regulatory capital requirements. In March 2005, our members approved a restructuring plan, which resulted in our ceasing to operate as a cooperative and converted the interests of our members into common stock. Although the restructuring changed our ownership structure, our conversion did not have a meaningful impact on the way we operate our business. We seek to pursue opportunities for growth in our business by offering new products and services to our customers, and we expect this trend to continue.
We operate in four reportable segments consisting of Commodity and Risk Management Services (“C&RM”), Clearing and Execution Services, Financial Services and Grain Merchandising. We also report a Corporate and Other segment, which contains corporate expenses and equity investments not directly attributable to our operating segments.
28
Our profitability is primarily driven by the C&RM and Clearing and Execution Services segments of our business, as shown in the table below. While the revenues of our Grain Merchandising segment represent a large proportion of our total revenue, that segment is characterized by low operating profit margins. As a result, it is important that you read our consolidated financial statements in conjunction with the segment disclosure included below and in the notes to our consolidated financial statements. The following table sets forth for each segment the income (loss) before minority interest and income tax expense for each of the three fiscal years ended August 31, 2006.
| | | | | | | | | | | | |
| | | Year Ended August 31,
| |
| | | 2004
| | | 2005
| | | 2006
| |
| | | (in thousands) | |
Commodity and Risk Management Services | | $ | 7,907 | | | $ | 11,160 | | | $ | 21,937 | |
Clearing and Execution Services | | | 3,359 | | | | 5,152 | | | | 10,981 | |
Financial Services | | | (447 | ) | | | 556 | | | | (19 | ) |
Grain Merchandising | | | 2,230 | | | | (2,037 | ) | | | (430 | ) |
Corporate and Other | | | (4,029 | ) | | | (4,800 | ) | | | (7,938 | ) |
| | |
|
|
| |
|
|
| |
|
|
|
Income before minority interest and income tax expense | | $ | 9,020 | | | $ | 10,031 | | | $ | 24,531 | |
| | |
|
|
| |
|
|
| |
|
|
|
Factors that Affect Our Business
Our results of operations have been, and we expect will continue to be, affected principally by customer acceptance of risk management, commodity price volatility, transaction volumes, interest rates and our ability to develop new products for our customers.
Customer Acceptance of Risk Management
The growing sophistication of company managers and the heightened expectations of investors have increased the acceptance of commodity risk management strategies. Demand for risk management consulting services is growing in industries that have not traditionally been significant users of hedging techniques and the derivatives market. This increased demand drives our fee revenue from risk management consulting services and our commission and interest income generated from the trading activity of our customers. As we expand our customer base beyond the traditional users of derivative products, our ability to provide an analysis of the commodity markets and advise our customers about how to manage the commodity risk inherent in their businesses will continue to be an important driver in our ability to generate future revenues.
Commodity Price Volatility
Rising commodity price volatility historically has led to increases in transaction volume and better financial performance in both our C&RM and Clearing and Execution Services segments. High commodity price volatility affects our financial performance by increasing the uncertainty of the profit margins of intermediaries, end-users and producers, which ultimately leads them to derivatives as a way of mitigating their financial risk from changing prices. At the same time, market volatility creates opportunities for professional traders, who find derivatives a more efficient way to transact relative to traditional physical commodities. In general, high commodity price volatility increases the demand for risk management consulting services and trade execution and clearing by commodity producers, intermediaries, end-users and professional traders.
Transaction Volumes
Since 2001, market transaction volume, as measured by numbers of contracts, has increased due to higher commodity price volatility, product innovation and a shift to electronic trading. As noted above, high commodity price volatility results in increased demand for risk management consulting services and increased transaction
29
volumes. In addition, product innovation in both the international exchange-traded and OTC markets has resulted in higher transaction volumes. The continued convergence of derivatives and cash markets and the expanded use of derivatives for hedging and investment purposes have been the primary drivers of this industry trend. The shift from open outcry, pit-based trading to electronic trading platforms has increased trading volume as customers are drawn to more efficient and lower cost markets.
Interest Rates
The level of prevailing short-term interest rates affects our profitability because a portion of our revenue is derived from interest earned from the investment of funds deposited with us by customers in our C&RM and Clearing and Execution Services segments. Our financial performance generally benefits from rising interest rates. Rising interest rates increase the amount of interest income earned from these customer deposits. In contrast, declining interest rates decrease the amount of interest income earned on customer deposits.
Product Development
Our ability to develop customized products to meet our customers’ specialized needs affects the overall profitability of our operations. These customized products often have unique and complex structures based on OTC traded contracts and we provide value-added service components to our customers that make these products more profitable for us.
Statement of Operations
Revenues
Our revenues are comprised of: (1) commissions and clearing fees, (2) risk management service, consulting and related brokerage fees, (3) interest income, (4) other revenues and (5) sales of physical commodities.
Commissions and clearing fees. Commissions and clearing fees represent revenues generated from exchange-traded transactions that we execute or clear in our C&RM and Clearing and Execution Services segments. Commissions and clearing fee revenue is a product of the number of transactions we process for our customers and the rate charged on those transactions. The rate that we charge our customers varies by type of customer, type of transaction and a customer’s volume of trading activity. The following table shows commissions and clearing fees and the number of exchange-traded contracts that we have executed or cleared for our customers in the C&RM and Clearing and Execution Services segments over the three fiscal years ended August 31, 2006.
| | | | | | | | | |
| | | Year Ended August 31,
|
| | | 2004
| | 2005
| | 2006
|
Commissions and clearing fees (in thousands) | | $ | 67,594 | | $ | 76,674 | | $ | 105,622 |
Exchange contract volume (in millions) | | | 29.9 | | | 36.2 | | | 47.5 |
Commissions and clearing fees increased from $67.6 million in fiscal 2004, to $105.6 million in fiscal 2006. This growth was primarily due to increased trading of energy products and was also due to new customers in the Clearing and Execution Services segment, as well as new customers in the renewable fuels and the Latin America/China divisions within the C&RM segment.
Service, consulting and brokerage fees. Service, consulting and brokerage fees are revenue generated in the C&RM segment. Service revenues are monthly fees charged to IRMP customers for customized risk management consulting services. Brokerage fees are generated from OTC derivative trades executed with our customers and with other counterparties. These brokerage fees vary on a per trade basis depending on the level of service provided and the type of transaction. Consulting fees are primarily fees we charge for providing various
30
other risk management-related consulting services to customers, which are generally performed on either a monthly or project-by-project basis. The following table sets forth our service, consulting and brokerage fees and OTC contract volume for the three fiscal years ended August 31, 2006.
| | | | | | | | | |
| | | Year Ended August 31,
|
| | | 2004
| | 2005
| | 2006
|
| | | ($ in thousands) |
Service, consulting and brokerage fees | | $ | 12,008 | | $ | 18,913 | | $ | 33,388 |
OTC contract volume | | | 62,810 | | | 152,957 | | | 325,785 |
Service, consulting and brokerage fees have increased period from $12.0 million in fiscal 2004, to $33.4 million in fiscal 2006. This increase was primarily due to increased OTC contract volume during that period. OTC volume is higher primarily due to new products in our commodity risk management business and due to new customers in the Latin America and renewable fuels divisions. Another source of the increase in this revenue category has been an increase in the number of and average fees from our IRMP clients.
Interest income. Interest income is revenue generated from customer funds deposited with us to satisfy margin requirements and from our internally-generated cash balances invested at short-term interest rates. In addition, we earn interest income from financing fees related to grain inventory repurchase programs within our Financial Services segment. Interest revenue is primarily driven by the level of customer segregated assets deposited with us and the level of short-term interest rates. The level of customer segregated assets deposited with us is directly related to transaction volume and open contract interest of our customers. The following table sets forth interest income, customer segregated assets and average 90-day Treasury bill rates for the three fiscal years ended August 31, 2006.
| | | | | | | | | | | | |
| | | Year Ended August 31,
| |
| | | 2004
| | | 2005
| | | 2006
| |
| | | ($ in thousands) | |
Interest income | | $ | 3,982 | | | $ | 8,177 | | | $ | 23,174 | |
Customer segregated assets, end of period | | $ | 389,953 | | | $ | 594,733 | | | $ | 764,847 | |
90-day Treasury bill average rates for period | | | 1.06 | % | | | 2.60 | % | | | 4.42 | % |
Interest income has increased from $4.0 million in fiscal 2004, to $23.2 million in fiscal 2006. This increase is primarily the result of higher short-term interest rates and an increase in investable customer segregated assets, which is related to the increase in contract trading volume.
Other revenues. Other revenues represents revenue generated from ocean vessel dockage and related income in our Grain Merchandising segment, profit-share arrangements in our Financial Services segment and income from equity investments. Additionally, we have historically included income received from non-recurring items such as litigation settlements, gains on the sale of exchange membership stock or exchange seats and other non-recurring items which can vary significantly. The following table sets forth other revenues for the three fiscal years ended August 31, 2006.
| | | | | | | | | |
| | | Year Ended August 31,
|
| | | 2004
| | 2005
| | 2006
|
| | | (in thousands) |
Other revenues | | $ | 4,521 | | $ | 7,463 | | $ | 2,638 |
Other revenues have decreased over the period from $4.5 million in fiscal 2004 to $2.6 million in fiscal 2006. In fiscal 2005, we experienced a significant increase in other revenues due to the sale of exchange memberships and the gain on the termination of a profit sharing agreement with a customer. The decrease in other revenue in fiscal 2006 reflects the lack of similar gains during the year.
Sales of commodities. Sales of commodities represents revenue generated from the sale of grain in the Grain Merchandising segment, the sale of fuel in the C&RM segment and the sale of various commodities in the
31
Financial Services segment. The price of grain is volatile and is affected by various factors, including changes in the weather, economy and other factors affecting the supply and demand for grain. Although commodity sales generate a significant amount of our revenue, for management purposes we focus on the margin (gross profit) from commodity sales. The focus on gross profit from commodity sales removes the effect of commodity price driven changes on revenue and cost of goods sold, which may not have an effect on net income. The margin on commodity sales also provides a more meaningful comparison from period to period. The following table sets forth sales of commodities, commodities gross profit, grain bushels sold and fuel gallons sold for the three years ended August 31, 2006.
| | | | | | | | | |
| | | Year Ended August 31,
|
| | | 2004
| | 2005
| | 2006
|
| | | (in thousands) |
Sales of commodities | | $ | 1,536,209 | | $ | 1,290,620 | | $ | 1,129,983 |
Commodities gross profit | | $ | 16,988 | | $ | 15,526 | | $ | 17,034 |
Grain bushels sold (millions) | | | 257.9 | | | 258.0 | | | 235.9 |
Fuel gallons sold (millions) | | | 104.4 | | | 18.2 | | | 4.4 |
Total revenues from the sale of commodities decreased from $1.5 billion in fiscal 2004, to $1.1 billion in fiscal 2006. The sales volume of commodities underlying revenue from sales of commodities varied by the type of commodity. Fuel sales in our C&RM business declined as we shifted our focus from handling physical fuels to only periodically participating as a principal in back-to-back ethanol transactions. We decided to exit the physical fuels business as the margins were inadequate. Grain volume sales over this period declined due to both lower bushel volume and lower commodity prices.
Costs and Expenses
Cost of commodities sold. Cost of commodities sold represents the product of the volume of purchased commodities and the cost of these commodities. Commodities purchased include grain in our Grain Merchandising segment, renewable fuels and gasoline in our C&RM segment and various commodities in our Financial Services segment. The price of commodities and volume sold are variable, and can be influenced by weather conditions and general economic, market and regulatory factors.
Employee compensation and commissions. Employee compensation and commissions consists of salaries, incentive compensation and commissions and is one of our primary operating expenses. We classify employees as either risk management consultants or salaried and support personnel, which includes our executive officers. The most significant component of our compensation expense is the employment of our risk management consultants, who are compensated with commission based on the revenues that their customers generate. Accordingly, our commission expense component is variable and is dependent on our commissions revenue and service, consulting and brokerage fee revenue.
Pit brokerage and clearing fees. Pit brokerage and clearing fees relate directly to expenses for exchange-traded futures and options clearing and settlement services, including fees we pay to the exchanges and the floor pit brokers. These fees are variable and fluctuate based on transaction volume.
Introducing broker commissions. Introducing broker commissions are commissions that we pay to non-employee third parties that have introduced customers to us. Introducing brokers are individuals or organizations that maintain relationships with customers and accept futures and options orders from those customers. We directly provide all account, transaction and margining services to introducing brokers, including accepting money, securities and property from the customers. The commissions we pay an introducing broker vary based on a variety of factors, including on the trading volume of the customers introduced to our company. This expense is variable and is directly related to the overall volume of trades by those customers.
32
Employee benefits and payroll taxes expense. Employee benefits and payroll taxes expense consist primarily of employee health insurance, a defined benefit pension plan, a defined contribution 401K/ESOP plan, and payroll taxes. Accordingly, these expenses normally fluctuate in relation to employee compensation and commissions and the number of employees that we employ.
Interest expense. Interest expense consists of interest charged to us by our lenders on the loans, lines of credit and letters of credit outstanding. Our interest expense depends on the amount of debt outstanding and the interest rate environment, with all of our credit lines bearing interest at variable rates. Interest expense in our Grain Merchandising segment is affected by grain prices and the volume of bushels purchased and sold, as changes in these factors impact the amount of borrowings required to finance grain purchases and by the duration of sales transactions, which typically is longer for exported grain.
Depreciation and amortization. Depreciation and amortization expense arises from the depreciation of property, equipment and leasehold improvements. Beginning in fiscal 2005, depreciation within the Grain Merchandising segment increased significantly when grain bins at our Mobile, Alabama, port facility, recorded as a capital lease, were placed into service.
Bad debt expense. Bad debt expense consists of both amounts written off based on known defaults of customers and brokers, as well as an allowance for accounts that we believe may become uncollectible through our review of the historical aging of our receivables and our monitoring of the financial strength of our customers, brokers and counterparties.
Other expenses. Other expenses consist primarily of office and equipment rent, communications, marketing information, travel, advertising, insurance, professional fees and other various expenses. The majority of these expenses are relatively fixed in nature and do not necessarily vary directly with changes in revenue.
Minority interest. Minority interest reflects the 30% minority interest held by AGREX, Inc., a subsidiary of Mitsubishi Corporation, in FGDI LLC, the subsidiary that comprises our Grain Merchandising segment. Prior to March 31, 2006, minority interest also included a 30% interest held by an unaffiliated third party in FCStone Merchants Services, LLC. Effective March 31, 2006, FCStone Merchants Services redeemed the minority ownership interest in accordance with the Limited Liability Company Agreement.
Income tax expense. Income tax expense consist of current and deferred tax expense relating to federal, state and local taxes. We file a consolidated federal income tax return and combined state and local income tax returns for all wholly-owned subsidiaries.
Revenues, Net of Cost of Commodities Sold
Revenues, net of cost of commodities sold, consists of total revenues presented as determined in accordance with GAAP, less the cost of commodities sold. Revenues, net of cost of commodities sold, is a non-GAAP financial measure that is used in this report on Form 10-K because our management considers it an important supplemental measure of our performance. Management believes revenues, net of cost of commodities sold, is a more relevant measure of our economic interest in these commodities transactions because it removes the effect of commodity price driven changes in revenue and cost of commodities sold, which may not have a meaningful effect on net income. In managing our business, management has historically focused on revenues derived from sales of commodities, net of cost of commodities sold. This financial measure is meaningful in managing our business for several reasons. First, profit is driven more by the margin on commodities sold rather than the price of the commodities. Second, we generally establish the margin between the sales price and the cost at the time we enter into a transaction, eliminating the need to manage inventory cost. Lastly, analyzing consolidated costs and expenses as a percentage of total revenue is not meaningful because total revenues related to commodity sales is a disproportionately large number compared to margin. Measuring expense as a percentage of revenues, net of cost of commodities sold, provides a clearer understanding of the trends in costs and expenses and expense management.
33
Revenues, net of cost of commodities sold, have increased from $105.1 million in fiscal 2004, to $181.8 million in fiscal 2006, primarily due to increased exchange trading and OTC contract volume trading by our customers.
Critical Accounting Policies and Estimates
Our consolidated financial statements and accompanying notes have been prepared in accordance with U.S. Generally Accepted Accounting Principles applied on a consistent basis. The preparation of these financial statements requires us to make a number of estimates and assumptions that affect the reported amounts of assets and liabilities, the disclosure of contingent assets and liabilities at the date of the financial statements and the reported amounts of revenues and expenses during the reporting periods. We evaluate these estimates and assumptions on an ongoing basis. We base these estimates on the information currently available to us and on various other assumptions that we believe are reasonable under the circumstances. Actual results could vary materially from these estimates under different assumptions or conditions.
An accounting policy is deemed to be critical if it requires an accounting estimate to be made based on assumptions about matters that are highly uncertain at the time the estimate is made; if different estimates reasonably could have been used; or if changes in the estimate that are reasonably likely to occur periodically could materially impact the financial statements. We believe the following critical accounting policies reflect the significant estimates and assumptions used in the preparation of our consolidated financial statements.
Allowance for Doubtful Accounts
We maintain allowances for doubtful accounts for trade receivables and deficits on customer commodity accounts. The allowances for doubtful accounts are significant estimates, and are maintained at a level considered appropriate by our management based on analyses of the historical aging of our receivables, credit quality for specific accounts, historical trends of charge-offs and recoveries, and current and projected economic, market and other conditions. If we become aware of a customer’s inability to meet its financial obligations, we establish a specific allowance for a potential bad debt expense to reduce the net recognized receivable to the amount we reasonably believe will be collected. Additionally, different assumptions, changes in economic circumstances or the deterioration of the financial condition of our customers could result in additional provisions to the allowances for doubtful accounts and increased bad debt expense. The valuation of the allowances for doubtful accounts is performed on a quarterly basis.
Inventories
Grain inventories are carried at net realizable value, which approximates market value. Estimates are used in determining the net realizable value of grain. These estimates include measurement of the quantity of grain in bins and other storage facilities, and involve considerations of the grading of the commodity and the basis adjustment for location and expected costs to sell. If estimates regarding reserves for inventory shrinkage, the grade of the commodity or the valuation of the basis adjustment are less favorable than management’s assumptions, then additional reserves or write-downs of inventories may be required.
Open Contracts and Hedge Policy—Grain
Open cash and futures contracts for the purchase and sale of grain are reported at market value and the resulting gains or losses are recognized currently in earnings. Market value includes a quoted exchange component and a basis component. The basis component represents a significant estimate, and is directly influenced by several factors, including transportation costs and local supply and demand conditions. If estimates regarding the valuation of the basis component are less favorable than management’s assumptions, then a write-down of open contract equity may be required. Additionally, we are exposed to risks that we may not have sufficient grain to deliver into our contracts and thus would be obligated to purchase grain at prevailing market rates in order to meet such commitments. We follow the policy of hedging our grain transactions through the use of those cash and futures contracts in order to minimize risk due to market fluctuations.
34
Pensions
We have noncontributory defined benefits pension plans for most of our employees. Our funding policy for the U.S. plans is to contribute amounts sufficient to meet the minimum funding requirement of the Employee Retirement Income Security Act of 1974, plus any additional amount we may deem to be appropriate. We account for our defined benefit pension plans in accordance with Statement of Financial Accounting Standards (SFAS) No. 87, “Employers’ Accounting for Pensions,” which requires that amounts recognized in financial statements be determined on an actuarial basis. A minimum liability is required to be established in the Consolidated Statements of Financial Condition representing the amount of unfunded accrued pension cost. This represents the difference between the accumulated benefit obligation, net of accrued pension liabilities and the fair value of plan assets and is recorded as a reduction to stockholders’ equity through accumulated other comprehensive income, net of tax, in the Consolidated Statements of Financial Condition. As of August 31, 2006, we have recorded an accumulated reduction to stockholders’ equity of approximately $2.0 million.
To account for our defined benefits pension plan in accordance with SFAS No. 87, we must make three main determinations at the end of each year: First, we must determine the actuarial assumptions for the discount rate used to reflect the time value of money in the calculation of the projected benefit obligations for the end of the current fiscal year and to determine the net periodic pension cost for the subsequent fiscal year. For guidance in determining the rate, we look at rates of return on high-quality fixed-income investments and periodic published rate ranges. See Note 6 to the Consolidated Financial Statements for a listing of the discount rates used.
Second, we must determine the actuarial assumption for rates of increase in compensation levels used in the calculation of the accumulated and projected benefit obligation for the end of the current fiscal year and to determine the net periodic pension cost for the subsequent fiscal year. The salary growth assumptions reflect our long-term actual experience, the near-term outlook and assumed inflation. Retirement and mortality rates are based primarily on actual plan experience and standard industry actuarial tables, respectively. See Note 6 to the Consolidated Financial Statements for a table showing the rates used.
Third, we must determine the expected long-term rate of return on assets assumption that is used to determine the expected return on plan assets component of the net periodic pension cost for the subsequent year. The expected returned on plan assets reflects asset allocation, investment strategy and the view of investment managers and other large pension plan sponsors. See the table in Note 6 to the Consolidated Financial Statements for the expected long-term rates used.
Income Taxes
We account for income taxes under SFAS 109, “Accounting for Income Taxes.” Under the standard, certain assumptions are made which represent significant estimates. These estimates are required because: (a) income tax returns are generally filed months after the close of our annual accounting period; (b) tax returns are subject to audit by taxing authorities and audits can often take years to complete and settle; and (c) future events often impact the timing of when we recognize income tax expenses and benefits. Our assumptions are supported by historical data and reasonable projections and are reviewed quarterly by management. We routinely evaluate all deferred tax assets to determine the likelihood of their realization. Valuation allowances are recorded to reduce deferred tax assets when it is more likely than not that a tax benefit will not be realized. We have not recorded a valuation allowance as of August 31, 2006, August 31, 2005, and August 31, 2004, respectively.
Contingencies
As discussed in Note 14 to the consolidated financial statements (“Note 14”), certain legal proceedings are pending or threatened in various United States and foreign jurisdictions. We record provisions in the consolidated financial statements for pending litigation when it is determined that an unfavorable outcome is probable and the amount of the loss can be reasonably estimated. To the extent a range of potential outcomes is identified and no outcome is deemed more likely than another, we record our liability at the lower end of the range. Except as discussed in Note 14: (1) we have not concluded that it is probable that a loss has been incurred in any of the
35
pending litigation; (2) we are unable to make a meaningful estimate of the amount or range of loss that could result from an unfavorable outcome of pending litigation; and (3) accordingly, we have not provided any amounts in the consolidated financial statements for unfavorable outcomes, if any.
Results of Operations
Year Ended August 31, 2006, Compared to Year Ended August 31, 2005
Executive Summary
Net income increased $8.7 million, or 131.9%, from $6.6 million in fiscal 2005, to $15.3 million in fiscal 2006. This increase was primarily driven by higher exchange-traded and OTC contract trading volumes from new and existing customers, along with higher interest rates applicable to larger segregated customer balances. The following chart provides revenues, costs and expenses, and net income for the period comparison:
| | | | | | | | | | | | | | | | | | | | | |
| | | Year Ended August 31, 2005
| | | Year Ended August 31, 2006
| | | Variance
| |
| | | In Thousands
| | | % of Revenues,
Net of Cost of
Commodities
Sold
| | | In Thousands
| | | % of Revenues,
Net of Cost of
Commodities
Sold
| | | In Thousands
| | | %
Change
| |
Sales of commodities | | $ | 1,290,620 | | | N/M | | | $ | 1,129,983 | | | N/M | | | $ | (160,637 | ) | | (12.4 | )% |
Cost of commodities sold | | | 1,275,094 | | | N/M | | | | 1,112,949 | | | N/M | | | | (162,145 | ) | | (12.7 | )% |
| | |
|
|
| | | | |
|
|
| | | | |
|
|
| | | |
Gross profit on commodities sold | | | 15,526 | | | 12.2 | % | | | 17,034 | | | 9.4 | % | | | 1,508 | | | 9.7 | % |
Commissions and clearing fees | | | 76,674 | | | 60.5 | % | | | 105,622 | | | 58.1 | % | | | 28,948 | | | 37.8 | % |
Service, consulting and brokerage fees | | | 18,913 | | | 14.9 | % | | | 33,388 | | | 18.4 | % | | | 14,475 | | | 76.5 | % |
Interest | | | 8,177 | | | 6.5 | % | | | 23,174 | | | 12.7 | % | | | 14,997 | | | 183.4 | % |
Other revenues | | | 7,463 | | | 5.9 | % | | | 2,638 | | | 1.5 | % | | | (4,825 | ) | | (64.7 | )% |
| | |
|
|
| |
|
| |
|
|
| |
|
| |
|
|
| |
|
|
Revenues, net of cost of commodities sold(1) | | | 126,753 | | | 100.0 | % | | | 181,856 | | | 100.0 | % | | | 55,103 | | | 43.5 | % |
| | |
|
|
| |
|
| |
|
|
| |
|
| |
|
|
| |
|
|
Costs and expenses | | | | | | | | | | | | | | | | | | | | | |
Employee compensation and broker commissions | | | 32,578 | | | 25.7 | % | | | 44,229 | | | 24.3 | % | | | 11,651 | | | 35.8 | % |
Pit brokerage and clearing fees | | | 33,141 | | | 26.1 | % | | | 47,613 | | | 26.2 | % | | | 14,472 | | | 43.7 | % |
Introducing broker commissions | | | 14,459 | | | 11.4 | % | | | 22,826 | | | 12.6 | % | | | 8,366 | | | 57.9 | % |
Employee benefits and payroll taxes | | | 8,044 | | | 6.3 | % | | | 9,801 | | | 5.4 | % | | | 1,757 | | | 21.8 | % |
Interest | | | 3,946 | | | 3.1 | % | | | 5,705 | | | 3.1 | % | | | 1,759 | | | 44.6 | % |
Depreciation and amortization | | | 1,551 | | | 1.2 | % | | | 1,674 | | | 0.9 | % | | | 124 | | | 8.0 | % |
Bad debt expense | | | 4,077 | | | 3.2 | % | | | 1,909 | | | 1.0 | % | | | (2,168 | ) | | (53.2 | )% |
Other expenses | | | 18,926 | | | 14.9 | % | | | 23,568 | | | 13.0 | % | | | 4,642 | | | 24.5 | % |
| | |
|
|
| |
|
| |
|
|
| |
|
| |
|
|
| |
|
|
Total costs and expenses (excluding cost of commodities sold) | | | 116,722 | | | 92.1 | % | | | 157,325 | | | 86.5 | % | | | 40,603 | | | 34.8 | % |
| | |
|
|
| |
|
| |
|
|
| |
|
| |
|
|
| |
|
|
Income before income tax expense and minority interest | | | 10,031 | | | 7.9 | % | | | 24,531 | | | 13.5 | % | | | 14,500 | | | 144.6 | % |
Minority interest | | | (499 | ) | | (0.4 | )% | | | (226 | ) | | (0.1 | )% | | | 273 | | | (54.7 | )% |
Income tax expense | | | 3,950 | | | 3.1 | % | | | 9,500 | | | 5.2 | % | | | 5,550 | | | 140.5 | % |
| | |
|
|
| |
|
| |
|
|
| |
|
| |
|
|
| |
|
|
Net income | | $ | 6,580 | | | 5.2 | % | | $ | 15,257 | | | 8.4 | % | | $ | 8,677 | | | 131.9 | % |
| | |
|
|
| |
|
| |
|
|
| |
|
| |
|
|
| |
|
|
| (1) | Revenues, net of cost of commodities sold, consists of total revenues presented with the sales of commodities net of cost of commodities sold. See “Selected Financial Data—Non-GAAP Financial Measures” for further discussion of revenues, net of cost of commodities sold. |
36
Revenues and Cost of Commodities Sold
Revenues, net of cost of commodities sold, increased $55.1 million, or 43.5%, from $126.8 million in fiscal 2005, to $181.9 million in fiscal 2006.
Sale of Commodities and Cost of Commodities Sold. Sales of commodities decreased by $160.6 million, or 12.4%, from $1,290.6 million in fiscal 2005, to $1,130.0 million in fiscal 2006. Cost of commodities sold decreased $162.1 million, or 12.7%, from $1,275.1 million in fiscal 2005, to $1,112.9 million in fiscal 2006. The decrease in sales and cost of commodities sold was due to a decrease in grain bushels handled, grain prices and physical fuel sales, offset by an increase in energy sold through financing transactions we entered into as a principal. Grain bushels handled decreased by 22.1 million bushels, or 8.6%, from 258.0 million bushels in fiscal 2005, to 235.9 million bushels in fiscal 2006. The decrease in bushels handled was the result of our decision to reduce purchases of grain for export due to less favorable market conditions, which resulted in a decline in export volume. The decrease in grain bushels handled accounted for $160.3 million of the decrease in sales and cost of commodities sold. In addition, grain prices declined and also resulted in lower sales and cost of commodities sold. Physical fuel sales declined 13.8 million gallons, or 75.8%, from 18.2 million gallons in fiscal 2005, to 4.4 million gallons in fiscal 2006. This decline resulted in a $18.8 million decrease in revenue from fuel sales and was due to our shift in focus from handling physical fuels to only periodically participating as a principal in back-to-back ethanol transactions. The number of financing transactions we entered into as a principal increased, resulting in a $18.5 million increase in sales and cost of commodities sold. Gross profit on commodities sold increased $1.5 million, or 9.7%, from $15.5 million in fiscal 2005, to $17.0 million in fiscal 2006.
Commissions and Clearing Fees. Commissions and clearing fees increased $28.9 million, or 37.8%, from $76.7 million in fiscal 2005, to $105.6 million in fiscal 2006. The increase was due to higher trading volume, which increased by 11.3 million exchange-traded contracts, or 31.2%, from 36.2 million contracts in fiscal 2005, to 47.5 million contracts in fiscal 2006. Revenues increased approximately in line with trading volume, as there was little change in the average revenue per trade during the period.
Service, Consulting and Brokerage Fees. Service, consulting and brokerage fees increased $14.5 million, or 76.5%, from $18.9 million in fiscal 2005, to $33.4 million in fiscal 2006. This increase was primarily due to an increase in OTC contract volume from our energy, renewable fuels, grain risk management and Latin American and Chinese customers. OTC contract volume increased 172,828 contracts, or 113.0%, from 152,957 contracts in fiscal 2005, to 325,785 contracts in fiscal 2006. In addition, we experienced an increase in consulting fees due to more customers and higher average fees in the IRMP.
Interest Income. Interest income increased $15.0 million, or 183.4%, from $8.2 million in fiscal 2005, to $23.2 million in fiscal 2006. The increase was primarily due to higher short-term interest rates, increased customer segregated assets and increased activity in the grain inventory financing program.
Other Revenues. Other revenues decreased by $4.8 million, or 64.7%, from $7.5 million in fiscal 2005, to $2.6 million in fiscal 2006. The decrease was primarily due to a gain of $1.8 million from the sale of a CBOT seat recognized in fiscal 2005, a gain of $0.9 million recognized in fiscal 2005 as a result of the termination of a shared profit agreement with a customer, a $0.8 million decrease in revenue earned as a profit share from financing transactions, a $1.0 million decrease in service revenues from shipping grain, and a $0.7 million loss related to an unaffiliated equity investment recognized in fiscal 2006.
Other Costs and Expenses
Employee Compensation and Broker Commissions. Employee compensation and broker commissions increased $11.7 million, or 35.8%, from $32.6 million in fiscal 2005, to $44.2 million in fiscal 2006. This increase was primarily a result of a volume-related increase in broker commissions due to the higher revenues in our C&RM segment, and higher executive and staff incentive compensation due to higher net income.
37
Pit Brokerage and Clearing Fees. Pit brokerage and clearing fees increased $14.5 million, or 43.7%, from $33.1 million in fiscal 2005, to $47.6 million in fiscal 2006. This increase was directly related to increased volume of exchange traded contracts.
Introducing Broker Commissions. Introducing broker commissions expense increased $8.4 million, or 57.9%, from $14.5 million in fiscal 2005, to $22.8 million in fiscal 2006. The increase was due to higher contract volumes from customers introduced by our introducing brokers in the Clearing and Execution segment.
Employee Benefits and Payroll Taxes. Employee benefits and payroll taxes increased $1.8 million, or 21.8%, from $8.0 million in fiscal 2005, to $9.8 million in fiscal 2006, primarily related to higher employee compensation and broker commissions, and increased pension plan costs.
Interest Expense. Interest expense increased $1.8 million, or 44.6%, from $3.9 million in fiscal 2005, to $5.7 million in fiscal 2006. The increase was primarily due to higher short-term interest rates and higher borrowings as a result of increased activity in the grain inventory financing program.
Depreciation and Amortization. Depreciation and amortization increased $0.1 million, or 8.0%, from $1.6 million in fiscal 2005, to $1.7 million in fiscal 2006.
Bad Debt Expense. Bad debt expense decreased $2.2 million, or 53.2%, from $4.1 million in fiscal 2005, to $1.9 million in fiscal 2006. The decrease was primarily due to the $3.2 million write-off of two international receivables on grain sold in fiscal 2005. In 2006, a $1.0 million charge was recorded due to the bankruptcy of a customer in our Grain Merchandising segment, in addition to an increase in our provision.
Other Expenses. Other expenses increased $4.6 million, or 24.5%, from $18.9 million in fiscal 2005, to $23.6 million in fiscal 2006. This additional expense was due to increases in office, equipment and facilities rent and expenses, travel expenses, marketing expenses and technology to support our business, professional fees, and insurance costs.
Income Tax Expense. Our provision for income taxes increased $5.6 million, or 140.5%, from $4.0 million in fiscal 2005, to $9.5 million in fiscal 2006. This increase was due primarily to our significantly higher income before income taxes of $24.8 million in 2006 versus $10.5 million in 2005. As a result, we moved to a higher tax bracket and the effective income tax rate increased from 37.5% in fiscal 2005, to 38.4% in fiscal 2006.
38
Year Ended August 31, 2005, Compared to Year Ended August 31, 2004
Executive Summary
Net income increased $0.2 million, or 2.6%, from $6.4 million in fiscal 2004, to $6.6 million in fiscal 2005. Although our net income increased modestly during the period, our revenues, net of cost of commodities, increased $21.7 million, or 20.6%, in fiscal 2005 compared to fiscal 2004. The increase in revenue, net of commodities sold, resulted from higher short-term interest rates, increased customer segregated assets, higher exchange-traded and OTC contract trading volume, and the gain of $1.8 million on the sale of a Chicago Board of Trade (“CBOT”) seat. Net income growth did not match the growth in revenues, net of commodities sold, due primarily to an increase in bad debt expense and a higher effective income tax rate. In fiscal 2005 we recorded a bad debt expense of $3.4 million related to the write-off of two international grain merchandising-related receivables. We also experienced a higher effective income tax rate due to our restructuring in fiscal 2005 and our no longer being able to use the patronage dividend deduction, which is a tax deduction for all patronage dividends distributed to cooperative members. As a result, the effective income tax rate increased from 24.0% in fiscal 2004 to 37.5% in fiscal 2005. The following chart provides revenues, costs and expenses, and net income for the period comparison.
| | | | | | | | | | | | | | | | | | | | |
| | | Year Ended August 31, 2004
| | | Year Ended August 31, 2005
| | | Variance
| |
| | | In Thousands
| | % of Revenues,
Net of Cost of
Commodities
Sold
| | | In Thousands
| | | % of Revenues,
Net of Cost of
Commodities
Sold
| | | In Thousands
| | | %
Change
| |
Sales of commodities | | $ | 1,536,209 | | N/M | | | $ | 1,290,620 | | | N/M | | | $ | (245,589 | ) | | (16.0 | )% |
Cost of commodities sold | | | 1,519,221 | | N/M | | | | 1,275,094 | | | N/M | | | | (244,127 | ) | | (16.1 | )% |
| | |
|
| | | | |
|
|
| | | | |
|
|
| | | |
Gross profit on commodities sold | | | 16,988 | | 16.2 | % | | | 15,526 | | | 12.2 | % | | | (1,462 | ) | | (8.6 | )% |
Commissions and clearing fees | | | 67,594 | | 64.3 | % | | | 76,674 | | | 60.5 | % | | | 9,080 | | | 13.4 | % |
Service, consulting and brokerage fees | | | 12,008 | | 11.4 | % | | | 18,913 | | | 14.9 | % | | | 6,905 | | | 57.5 | % |
Interest | | | 3,982 | | 3.8 | % | | | 8,177 | | | 6.5 | % | | | 4,195 | | | 105.3 | % |
Other revenues | | | 4,521 | | 4.3 | % | | | 7,463 | | | 5.9 | % | | | 2,942 | | | 65.1 | % |
| | |
|
| |
|
| |
|
|
| |
|
| |
|
|
| |
|
|
Revenues, net of cost of commodities sold | | | 105,093 | | 100.0 | % | | | 126,753 | | | 100.0 | % | | | 21,660 | | | 20.6 | % |
| | |
|
| |
|
| |
|
|
| |
|
| |
|
|
| |
|
|
Costs and expenses | | | | | | | | | | | | | | | | | | | | |
Employee compensation and broker commissions | | | 30,160 | | 28.7 | % | | | 32,578 | | | 25.7 | % | | | 2,418 | | | 8.0 | % |
Pit brokerage and clearing fees | | | 26,713 | | 25.4 | % | | | 33,141 | | | 26.1 | % | | | 6,428 | | | 24.1 | % |
Introducing broker commissions | | | 10,704 | | 10.2 | % | | | 14,459 | | | 11.4 | % | | | 3,755 | | | 35.1 | % |
Employee benefits and payroll taxes | | | 7,136 | | 6.8 | % | | | 8,044 | | | 6.3 | % | | | 908 | | | 12.7 | % |
Interest | | | 4,418 | | 4.2 | % | | | 3,946 | | | 3.1 | % | | | (472 | ) | | (10.7 | )% |
Depreciation and amortization | | | 861 | | 0.8 | % | | | 1,551 | | | 1.2 | % | | | 690 | | | 80.1 | % |
Bad debt expense | | | 716 | | 0.7 | % | | | 4,077 | | | 3.2 | % | | | 3,361 | | | 469.4 | % |
Other expenses | | | 15,365 | | 14.6 | % | | | 18,926 | | | 14.9 | % | | | 3,561 | | | 23.2 | % |
| | |
|
| |
|
| |
|
|
| |
|
| |
|
|
| |
|
|
Total costs and expenses (excluding cost of commodities sold) | | | 96,073 | | 91.4 | % | | | 116,722 | | | 92.1 | % | | | 20,649 | | | 21.5 | % |
| | |
|
| |
|
| |
|
|
| |
|
| |
|
|
| |
|
|
Income before income tax expense and minority interest | | | 9,020 | | 8.6 | % | | | 10,031 | | | 7.9 | % | | | 1,011 | | | 11.2 | % |
Minority interest | | | 576 | | 0.5 | % | | | (499 | ) | | (0.4 | )% | | | (1,075 | ) | | (186.6 | )% |
Income tax expense | | | 2,030 | | 1.9 | % | | | 3,950 | | | 3.1 | % | | | 1,920 | | | 94.6 | % |
| | |
|
| |
|
| |
|
|
| |
|
| |
|
|
| |
|
|
Net income | | $ | 6,414 | | 6.1 | % | | $ | 6,580 | | | 5.2 | % | | $ | 166 | | | 2.6 | % |
| | |
|
| |
|
| |
|
|
| |
|
| |
|
|
| |
|
|
39
Revenues and Cost of Commodities Sold
Revenues, net of cost of commodities sold, increased $21.7 million, or 20.6%, from $105.1 million in fiscal 2004, to $126.8 million in fiscal 2005.
Sale of Commodities and Cost of Commodities Sold. Sales of commodities decreased by $245.6 million, or 16.0%, from $1,536.2 million in fiscal 2004, to $1,290.6 million in fiscal 2005. Cost of commodities sold decreased $244.1 million, or 16.1%, from $1,519.2 million in fiscal 2004, to $1,275.1 million in fiscal 2005. These decreases were primarily a result of lower grain prices, as bushels merchandised remained constant at 258 million bushels. Fuel sales declined $81.5 million, or 73.0%, from $111.7 million in fiscal 2004, to $30.2 million in fiscal 2005. Cost of fuel sold decreased by $80.6 million, or 72.7%, from $110.9 million in fiscal 2004, to $30.3 million in fiscal 2005. Fuel sales and costs declined as we shifted our focus from handling physical fuels to only periodically participating as a principal in back-to-back ethanol transactions. Gross profit on commodities sold decreased $1.5 million, or 8.6%, from $17.0 million in fiscal 2004, to $15.5 million in fiscal 2005.
Commissions and Clearing Fees. Commissions and clearing fees increased $9.1 million, or 13.4%, from $67.6 million in fiscal 2004, to $76.7 million in fiscal 2005. The increase in revenue resulted from a 6.3 million contract, or 21.1%, increase in futures trading volume from 29.9 million contracts in fiscal 2004, to 36.2 million contracts in fiscal 2005, driven by high energy commodities price volatility and the resulting increased trading activity. This increase in trading volume was offset by a decline in the average rate per contract. The decline in overall average rate per contract was due to growth in the lower-margin Clearing and Execution Services segment and the increasing proportion of our revenues that this segment accounted for during this period.
Service, Consulting and Brokerage Fees. Service, consulting and brokerage fees increased $6.9 million, or 57.5%, from $12.0 million in fiscal 2004, to $18.9 million in fiscal 2005. This increase was primarily due to increased OTC brokerage fees from energy and commercial grain customers. OTC contract volume increased 90,147 contracts, or 143.5%, from 62,810 contracts in fiscal 2004, to 152,957 contracts in fiscal 2005. In addition, we experienced an increase in consulting fees due to more customers and higher average fees in the IRMP.
Interest Income. Interest income increased $4.2 million, or 105.3%, from $4.0 million in fiscal 2004, to $8.2 million in fiscal 2005. The increase was primarily due to higher short-term interest rates and increased customer segregated assets.
Other Revenues. Other revenues increased by $2.9 million, or 65.1%, from $4.5 million in fiscal 2004, to $7.5 million in fiscal 2005. The increase was primarily due to the gain on the sale of a CBOT seat of $1.8 million. In addition, we realized $1.0 million of revenues earned as a profit share in a financing transaction through our subsidiary, FCStone Merchant Services.
Other Costs and Expenses
Employee Compensation and Broker Commissions. Employee compensation and broker commissions increased $2.4 million, or 8.0%, from $30.2 million in fiscal 2004, to $32.6 million in fiscal 2005. This volume-related increase was primarily due to increased broker commissions from our C&RM segment and additional personnel in our Clearing and Execution Services and Financial Services segments.
Pit Brokerage and Clearing Fees. Pit brokerage and clearing fees increased $6.4 million, or 24.1%, from $26.7 million in fiscal 2004, to $33.1 million in fiscal 2005. This increase was directly related to increased volume of traded and cleared contracts.
Introducing Broker Commissions. Introducing broker commissions increased $3.8 million, or 35.1%, from $10.7 million in fiscal 2004, to $14.5 million in fiscal 2005. The increase was primarily a result of the volume-related increase in commissions due to higher commission and clearing revenue.
40
Employee Benefits and Payroll Taxes. Employee benefits and payroll taxes increased $0.9 million, or 12.7%, from $7.1 million in fiscal 2004, to $8.0 million in fiscal 2005, primarily due to rate increases in our pension and medical insurance plans.
Interest Expense. Interest expense decreased $0.5 million, or 10.7%, from $4.4 million in fiscal 2004, to $3.9 million in fiscal 2005. The decrease was primarily due to lower grain prices and our decision to reduce export-related grain bushels in our Grain Merchandising segment. This reduced the amount and duration of grain financing. Our lower average borrowings were partially offset by higher short-term interest rates.
Depreciation and Amortization. Depreciation and amortization increased $0.7 million, or 80.1%, from $0.9 million in fiscal 2004, to $1.6 million in fiscal 2005. This increase was primarily due to grain bins at our Mobile, Alabama, port facility, recorded as a capital lease, being placed into service.
Bad Debt Expense. Bad debt expense increased $3.4 million, or 469.4%, from $0.7 million in fiscal 2004, to $4.1 million in fiscal 2005. The increase was primarily due to bad debt expenses associated with two large international customers in our Grain Merchandising segment.
Other Expenses. Other expenses increased $3.6 million, or 23.2%, from $15.4 million in fiscal 2004, to $18.9 million in fiscal 2005. This increase resulted primarily from higher legal and professional fees of $1.7 million incurred in connection with our restructuring and with managing ongoing claims in our Grain Merchandising segment.
Income Tax Expense. Our provision for income taxes increased $2.0 million, or 94.6%, from $2.0 million in fiscal 2004, to $4.0 million in fiscal 2005. This increase was due primarily to our restructuring in fiscal 2005, which resulted in our no longer being taxed as a cooperative and therefore not being eligible to use a patronage dividend deduction. As a result, the effective income tax rate increased from 24.0% in fiscal 2004, to 37.5% in fiscal 2005.
Operations by Segment
Our reportable operating segments consist of C&RM, Clearing and Execution Services, Financial Services and Grain Merchandising. We include the earnings of equity affiliates that are closely associated with our operating segments in the respective segment’s net income. Revenues, expenses and equity earnings from equity affiliates that are not easily identified with one of our four operating segments are reported in the Corporate and Other segment. Segment income (loss) before minority interest and income taxes is defined as total segment revenues less total segment costs and expenses before reconciling amounts, corporate expenses, minority interest and income taxes. Reconciling amounts represent the elimination of interest income and expense and commission income and expense between segments. Such transactions are conducted at market prices to more accurately evaluate the profitability of the individual business segments. A reconciliation of total segment revenues and segment income before minority interest and income taxes to the Consolidated Statements of Operations is included in Note 18 for the three fiscal years ended August 31, 2006.
We prepared the financial results for our operating segments on a basis that is consistent with the manner in which we internally prepare financial information to assist in making internal operating decisions. We have allocated certain common expenses among segments differently than we would for stand-alone financial information prepared in accordance with GAAP. Segment income before income taxes may not be consistent with measures used by other companies. The accounting policies of our operating segments are the same as those applied in the consolidated financial statements. Certain amounts in the fiscal year 2004, 2005 and 2006 consolidated financial statements have been reclassified. Revenues generated from ocean vessel dockage and related income in our Grain Merchandising segment have been reclassified to other income from sales of commodities. Expenses related to the dock facility in our Grain Merchandising segment have been reclassified to certain expense lines. These reclassifications are not significant and are intended to reflect in revenues and costs associated with grain merchandising that represent the purchases and delivery of grain, excluding revenues and expenses that are ancillary to those operations.
41
Commodity and Risk Management Services
Our C&RM segment offers risk management consulting and access to the commodity derivative markets with the objective of helping our customers mitigate commodity price risk and optimize their profit margins. In this segment, we generate revenues from six primary sources: (1) commission and clearing fee revenues from exchange-traded futures and options contracts, (2) brokerage fees from OTC transactions, (3) interest income derived from cash balances in our customers’ accounts, (4) risk management service and consulting fees, (5) fuel sales and (6) other revenues. Our customers in this segment consist of middle-market commodity intermediaries, end-users and producers, focused primarily in the areas of domestic and international grain, renewable fuels and energy. In fiscal 2006, this segment represented approximately 68% of our consolidated income before minority interest, income tax and corporate overhead. The principal factors that affect our financial performance in this segment include:
| | • | | the level of volatility in commodity prices, |
| | • | | the level of knowledge and sophistication of our customers with respect to commodity risk, |
| | • | | the development of new risk management products for our customers |
| | • | | the volume of commodities produced and consumed by our customers, and |
| | • | | the level of short-term interest rates and the amount of cash balances in our customers’ accounts. |
The following table provides the financial performance for this segment.
| | | | | | | | | | |
| | | Year Ended August 31,
|
| | | 2004
| | 2005
| | | 2006
|
| | | (in thousands) |
Sales of commodities | | $ | 111,661 | | $ | 30,179 | | | $ | 11,336 |
Cost of commodities sold | | | 110,840 | | | 30,279 | | | | 11,053 |
| | |
|
| |
|
|
| |
|
|
Gross profit on commodities sold | | | 821 | | | (100 | ) | | | 283 |
Commissions and clearing fees | | | 29,173 | | | 28,879 | | | | 36,886 |
Service, consulting and brokerage fees | | | 12,716 | | | 19,610 | | | | 33,990 |
Interest | | | 1,345 | | | 3,131 | | | | 9,610 |
Other revenues | | | 1,227 | | | 1,914 | | | | 148 |
| | |
|
| |
|
|
| |
|
|
Revenues, net of cost of commodities sold | | | 45,282 | | | 53,434 | | | | 80,917 |
Costs and expenses: | | | | | | | | | | |
Expenses (excluding interest expense) | | | 37,261 | | | 42,201 | | | | 58,825 |
Interest expense | | | 114 | | | 73 | | | | 155 |
| | |
|
| |
|
|
| |
|
|
Total costs and expenses (excluding cost of commodities sold) | | | 37,375 | | | 42,274 | | | | 58,980 |
| | |
|
| |
|
|
| |
|
|
Segment income before minority interest and income taxes | | $ | 7,907 | | $ | 11,160 | | | $ | 21,937 |
| | |
|
| |
|
|
| |
|
|
Year Ended August 31, 2006, Compared to Year Ended August 31, 2005
Sales of commodities decreased $18.9 million, or 62.6%, from $30.2 million in fiscal 2005, to $11.3 million in fiscal 2006. Costs of commodities sold decreased by $19.2 million, or 63.4%, from $30.3 million in fiscal 2005, to $11.1 million in fiscal 2006. These declines were due to a decrease in the volume sold, as we continue our shift away from handling physical fuels, which began in fiscal 2005, to only periodically participating as a principal in back-to-back ethanol transactions.
Service, consulting and brokerage fees increased $14.4 million, or 73.5%, from $19.6 million in fiscal 2005, to $34.0 million in fiscal 2006. This increase was primarily due to a significant increase in OTC brokerage volume from renewable fuels and commercial grain customers. Commissions and clearing fee revenues increased $8.0 million, or 27.7%, from $28.9 million in fiscal 2005, to $36.9 million in fiscal 2006, due to higher grain commodity price volatility and a larger Fall 2005 grain crop. This resulted in a 0.7 million contract, or 38.9%,
42
increase in trading volume for exchange-traded contracts from 1.8 million in the year ended August 31, 2005 to 2.5 million in the year ended August 31, 2006. Offsetting this increase in trading volume was a decline in the average rate per trade due to higher volumes from customers with lower average commission rates. Interest income increased $6.5 million, or 209.7%, from $3.1 million in fiscal 2005, to $9.6 million in fiscal 2006, primarily due to higher short-term interest rates and increased customer segregated assets. Other revenues decreased $1.8 million, or 94.7%, from $1.9 million in fiscal 2005, to $0.1 million in fiscal 2006. Other revenues included a gain of $1.8 million from the sale of a CBOT seat in fiscal 2005.
Revenues, net of cost of commodities sold, increased $27.5 million, or 51.5%, from $53.4 million in fiscal 2005, to $80.9 million in fiscal 2006.
Expenses, excluding interest expense, increased $16.6 million, or 39.4%, from $42.2 million in fiscal 2005, to $58.8 million in fiscal 2006. The expense increase was primarily due to volume-related revenue growth, which caused a related increase in employee commissions, related employee benefits, pit brokerage and introducing broker commissions. Interest expense increased $82,000 or 112.3%, from $73,000 in fiscal 2005, to $155,000 in fiscal 2006.
Year Ended August 31, 2005, Compared to Year Ended August 31, 2004
Sales of commodities decreased $81.5 million, or 73.0%, from $111.7 million in fiscal 2004, to $30.2 million in fiscal 2005. Costs of commodities sold decreased by $80.5 million, or 72.7%, from $110.8 million in fiscal 2004, to $30.3 million in fiscal 2005. These declines were due to our shifting away from handling physical fuels to only periodically participating as a principal in back-to-back ethanol transactions.
Service, consulting and brokerage fees increased $6.9 million, or 54.2%, from $12.7 million in fiscal 2004, to $19.6 million in fiscal 2005. This increase was primarily due to increased energy and grain OTC brokerage fees and, to a lesser extent, additional customers in the IRMP. Commissions and clearing fee revenues decreased slightly from $29.2 million in fiscal 2004, to $28.9 million in fiscal 2005, due to a relatively flat trading volume and a slightly lower average rate per contract. Interest income increased $1.8 million, or 132.8%, from $1.3 million in fiscal 2004, to $3.1 million in fiscal 2005, primarily due to higher short-term interest rates and increases customer segregated assets. Other revenues increased $0.7 million, or 56.0%, from $1.2 million in fiscal 2004, to $1.9 million in fiscal 2005. Other revenues included a $0.8 million gain on the sale of Board of Trade Clearing Corporation stock in fiscal 2004 and a gain of $1.8 million from the sale of a CBOT seat in fiscal 2005.
Revenues, net of cost of commodities sold, increased $8.1 million, or 18.0%, from $45.3 million in fiscal 2004, to $53.4 million in fiscal 2005.
Expenses, excluding interest expense, increased $4.9 million, or 13.3%, from $37.3 million in fiscal 2004, to $42.2 million in fiscal 2005. The expense increase was primarily due to volume-related revenue growth, which caused an increase in employee compensation and commissions, related employee benefits and introducing broker commissions and the addition of several risk management consultants. Interest expense decreased $41,000, or 36.0%, from $114,000 in fiscal 2004, to $73,000 in fiscal 2005.
Clearing and Execution Services
The Clearing and Execution Services segment offers low-cost clearing and execution for exchange-traded futures and options to the wholesale and professional trader market segments. In this segment, we generate revenues from two primary sources: commissions and clearing fee revenues from the execution and clearing of exchange-traded futures and options contracts, and interest income derived from cash balances in our customers’ accounts. In fiscal 2006, this segment represented approximately 34% of our consolidated income before minority interest, income tax and corporate overhead. The principal factors that affect our financial performance in this segment include:
| | • | | the level of volatility in commodity prices, and |
| | • | | the level of short-term interest rates and the amount of cash balances in our customers’ accounts. |
43
The following table provides the financial performance for this segment.
| | | | | | | | | |
| | | Year Ended August 31,
|
| | | 2004
| | 2005
| | 2006
|
| | | (in thousands) |
Sales of commodities | | $ | — | | $ | — | | $ | — |
Cost of commodities sold | | | — | | | — | | | — |
| | |
|
| |
|
| |
|
|
Gross profit on commodities sold | | | — | | | — | | | — |
Commissions and clearing fees | | | 39,072 | | | 48,332 | | | 69,246 |
Service, consulting and brokerage fees | | | — | | | — | | | — |
Interest | | | 1,412 | | | 4,124 | | | 10,702 |
Other revenues | | | — | | | 921 | | | — |
| | |
|
| |
|
| |
|
|
Revenues, net of cost of commodities sold | | | 40,484 | | | 53,377 | | | 79,948 |
Costs and expenses: | | | | | | | | | |
Expenses (excluding interest expense) | | | 36,932 | | | 47,888 | | | 68,541 |
Interest expense | | | 193 | | | 337 | | | 426 |
| | |
|
| |
|
| |
|
|
Total costs and expenses (excluding cost of commodities sold) | | | 37,125 | | | 48,225 | | | 68,967 |
| | |
|
| |
|
| |
|
|
Segment income before minority interest and income taxes | | $ | 3,359 | | $ | 5,152 | | $ | 10,981 |
| | |
|
| |
|
| |
|
|
Year Ended August 31, 2006, Compared to Year Ended August 31, 2005
Commissions and clearing fees increased $20.9 million, or 43.3%, from $48.3 million in fiscal 2005 to $69.2 million in fiscal 2006. This increase was the result of increased trading volume in energy and metals commodities due primarily to higher price volatility. Interest income increased $6.6 million, or 161.0%, from $4.1 million in fiscal 2005 to $10.7 million in fiscal 2006, primarily due to higher short-term interest rates and increased customer segregated assets. Other revenue decreased $0.9 million, or 100.0%, from $0.9 million in fiscal 2005, to $0.0 million in fiscal 2006. This decrease was due to a gain from the termination of a shared profit agreement with a customer, which was reflected in the results for fiscal 2005.
Revenues, net of cost of commodities sold, increased $26.5 million, or 49.6%, from $53.4 million in fiscal 2005, to $79.9 million in fiscal 2006. The primary reason for the increase in revenues, net of cost of commodities sold, was the increase in contract trading volume of 10.6 million contracts, or 30.4%, from 34.4 million contracts in fiscal 2005, to 45.0 million contracts in fiscal 2006.
Expenses, excluding interest expense, increased $20.6 million, or 43.0%, from $47.9 million in fiscal 2005, to $68.5 million in fiscal 2006. This increase in expenses was primarily due to volume-related increases in clearing fees of $12.7 million, pit brokerage expenses of $0.7 million, and introducing broker commissions of $5.4 million and related increased employee compensation of $1.3 million. Interest expense increased $0.1 million, or 33.3%, from $0.3 million in fiscal 2005, to $0.4 million in fiscal 2006.
Year Ended August 31, 2005, Compared to Year Ended August 31, 2004
Commissions and clearing fees increased $9.2 million, or 23.5%, from $39.1 million in fiscal 2004, to $48.3 million in fiscal 2005. This increase was the result of increased trading volume. Interest income increased $2.7 million, or 192.1%, from $1.4 million in fiscal 2004, to $4.1 million in fiscal 2005, primarily due to increased short-term interest rates and a higher level of customer segregated assets. Other income increased $0.9 million to $0.9 million in fiscal 2005, due to a gain from the termination of a shared-profit agreement with a customer in fiscal 2005.
Revenues, net of cost of commodities sold, increased $12.9 million, or 31.8%, from $40.5 million in fiscal 2004, to $53.4 million in fiscal 2005. With the increase in prices for energy and metals commodities in fiscal 2005, our customers’ trading volume increased over fiscal 2004. Total trade volume increased 6.3 million contracts, or 22.3%, from 28.2 million contracts in fiscal 2004, to 34.5 million contracts in fiscal 2005.
44
Expenses, excluding interest expense, increased $11.0 million, or 29.7%, from $36.9 million in fiscal 2004, to $47.9 million in fiscal 2005. This increase was primarily due to volume-related increases in pit brokerage and clearing fees of $7.5 million, higher introducing broker commissions of $2.1 million and increased salaries and wages and benefits of $0.9 million. Interest expense increased $0.1 million, or 74.6%, from $0.2 million in fiscal 2004, to $0.3 million in fiscal 2005.
Financial Services
The Financial Services segment is composed of two wholly-owned subsidiaries: FCStone Financial, Inc. and FCStone Merchant Services, LLC. Through these subsidiaries, we finance and facilitate physical commodity inventories through traditional lending agreements, or by entering into repurchase agreements with our customers. In addition, at times, we enter into arrangements with clients to share profits from transactions in physical commodities in exchange for financial support.
In this segment, we generate revenues from three primary sources: (1) interest income derived from commodity inventory financing through sale/repurchase agreements with commercial grain customers, (2) revenues from profit-share arrangements where we act as an agent in the transaction trades, and (3) revenues from the sale of energy and other various commodities in profit-share arrangements where we act as a principal in the transaction. For transactions in which we participate as an agent, the revenue recorded is limited to the contracted profit-share. For transactions in which we participate as a principal, we are required to record the gross amount of revenue from commodity sales and the gross amount of related costs. In fiscal 2006, the Financial Services segment was not profitable on the basis of income before minority interest, income tax and corporate overhead. Our customers in this segment consist primarily of commercial grain-related customers in the grain repurchase program and renewable fuels producers. The principal factors that affect our financial performance in this segment include:
| | • | | the level of commodity prices, and |
| | • | | the volume of commodities produced and consumed by our customers. |
The following table provides the financial performance of this segment.
| | | | | | | | | | | |
| | | Year Ended August 31,
| |
| | | 2004
| | | 2005
| | 2006
| |
| | | (dollars in thousands) | |
Sales of commodities | | $ | — | | | $ | 22,629 | | $ | 41,094 | |
Cost of commodities sold | | | — | | | | 22,413 | | | 40,906 | |
| | |
|
|
| |
|
| |
|
|
|
Gross profit on commodities sold | | | — | | | | 216 | | | 188 | |
Commissions and clearing fees | | | — | | | | — | | | — | |
Service, consulting and brokerage fees | | | — | | | | — | | | — | |
Interest | | | 1,519 | | | | 1,128 | | | 3,320 | |
Other revenues | | | 998 | | | | 2,018 | | | 1,491 | |
| | |
|
|
| |
|
| |
|
|
|
Revenues, net cost of commodities sold | | | 2,517 | | | | 3,362 | | | 4,999 | |
Costs and expenses: | | | | | | | | | | | |
Expenses (excluding interest expense) | | | 1,702 | | | | 1,869 | | | 2,302 | |
Interest expense | | | 1,262 | | | | 937 | | | 2,716 | |
| | |
|
|
| |
|
| |
|
|
|
Total costs and expenses (excluding cost of commodities sold) | | | 2,964 | | | | 2,806 | | | 5,018 | |
| | |
|
|
| |
|
| |
|
|
|
Segment income (loss) before minority interest and income taxes | | $ | (447 | ) | | $ | 556 | | $ | (19 | ) |
| | |
|
|
| |
|
| |
|
|
|
Year Ended August 31, 2006, Compared to August 31, 2005
Sales of commodities increased $18.5 million, or 81.9%, from $22.6 million in fiscal 2005, to $41.1 million in fiscal 2006. The cost of commodities sold increased $18.5 million, or 82.6%, from $22.4 million in fiscal
45
2005, to $40.9 million in fiscal 2006. These increases were primarily due to an increase in the number of financing transactions we entered into as a principal, which requires us to record the gross amount of revenue and costs from commodity sales.
Interest income increased $2.2 million, or 200.0%, from $1.1 million in fiscal 2005, to $3.3 million in fiscal 2006. This increase resulted from increased activity in the grain inventory financing program and higher short-term interest rates. Other income decreased $0.5 million, or 25.0%, from $2.0 million in fiscal 2005, to $1.5 million in fiscal 2006, primarily due to a decrease in the profitability of financing transactions entered into as agent.
Expenses, excluding interest expense, increased $0.4 million, or 21.1%, from $1.9 million in fiscal 2005, to $2.3 million in fiscal 2006, primarily due to increased railcar lease costs. Interest expense increased $1.8 million, or 200.0%, from $0.9 million in fiscal 2005, to $2.7 million in fiscal 2006. The increase in interest expense resulted from additional borrowings related to the increased activity in the grain inventory financing program and higher short-term interest rates.
Year Ended August 31, 2005, Compared to August 31, 2004
Sales of commodities of $22.6 million were recorded in fiscal 2005. The cost of commodities sold was $22.4 million in fiscal 2005. These amounts resulted from the startup of the steel and energy commodities financing business of FCStone Merchant Services, LLC, which had no revenues during fiscal 2004.
Interest income decreased $0.4 million, or 25.7%, from $1.5 million in fiscal 2004, to $1.1 million in fiscal 2005, primarily due to lower average customer account balances in the grain inventory financing program. Other revenues increased $1.0 million, or 102.2%. from $1.0 million in fiscal 2004, to $2.0 million in fiscal 2005, primarily due to the increased profitability of financing transactions entered into as an agent.
Expenses, excluding interest expense, increased $0.2 million, or 9.8%, from $1.7 million in fiscal 2004, to $1.9 million in fiscal 2005. This increase was primarily due to an increase in professional fees and other expenses for FCStone Merchant Services. Interest expense decreased $0.4 million, or 30.8%, from $1.3 million in fiscal 2004, to $0.9 million in fiscal 2005, as a result of decreased activity in the grain inventory financing program.
Grain Merchandising
The Grain Merchandising segment acts as a dealer in and manager of physical grain and fertilizer through a 70% interest in FGDI, LLC. FGDI acts as a grain dealer in the United States and international markets, with operations primarily in, Asia, Latin America and Canada. In this segment, we also manage a pool of grain originated by a group of elevators in Texas. We generate a majority of our revenues in this segment from the sale of grain. The principal factor that affects our financial performance in this segment is the global supply of and demand for grain. In fiscal 2006, this segment was not profitable on the basis of income before minority interest, income tax and corporate overhead. We have taken steps to return this segment to profitability by focusing our efforts on domestic grain merchandising, where there are higher risk-adjusted margins and the opportunity to capitalize on a growing renewable fuels industry.
46
The following table provides the financial performance of this segment.
| | | | | | | | | | | |
| | | Year Ended August 31,
| |
| | | 2004
| | 2005
| | | 2006
| |
| | | (dollars in thousands) | |
Sales of commodities | | $ | 1,424,548 | | $ | 1,237,812 | | | $ | 1,077,553 | |
Cost of commodities sold | | | 1,409,126 | | $ | 1,223,044 | | | | 1,061,557 | |
| | |
|
| |
|
|
| |
|
|
|
Gross profit on commodities sold | | | 15,422 | | | 14,768 | | | | 15,996 | |
Commissions and clearing fees | | | — | | | — | | | | — | |
Service, consulting and brokerage fees | | | — | | | — | | | | — | |
Interest | | | 68 | | | 153 | | | | 693 | |
Other revenues | | | 2,230 | | | 2,582 | | | | 1,582 | |
| | |
|
| |
|
|
| |
|
|
|
Revenues, net of cost of commodities sold | | | 17,720 | | | 17,503 | | | | 18,271 | |
Costs and expenses: | | | | | | | | | | | |
Expenses (excluding interest expense) | | | 12,322 | | | 16,691 | | | | 15,357 | |
Interest expense | | | 3,168 | | | 2,849 | | | | 3,344 | |
| | |
|
| |
|
|
| |
|
|
|
Total costs and expenses (excluding cost of commodities sold) | | | 15,490 | | | 19,540 | | | | 18,701 | |
| | |
|
| |
|
|
| |
|
|
|
Segment income (loss) before minority interest and income taxes | | $ | 2,230 | | $ | (2,037 | ) | | $ | (430 | ) |
| | |
|
| |
|
|
| |
|
|
|
Year Ended August 31, 2006, Compared to Year Ended August 31, 2005
Sales of commodities decreased $160.2 million, or 12.9%, from $1,237.8 million in fiscal 2005, to $1,077.6 million in fiscal 2006. Cost of commodities sold decreased $161.4 million, or 13.2%, from $1,223.0 million in fiscal 2005, to $1,061.6 million in fiscal 2006. Gross profit on commodities sold increased $1.2 million, or 8.1%, from $14.8 million in fiscal 2005, to $16.0 million in fiscal 2006. The decrease in sales of commodities and cost of commodities sold was primarily the result of a 22.1 million bushel, or 8.6%, decrease in the volume of grain bushels sold from 258.0 million bushels in fiscal 2005, to 235.9 million bushels in fiscal 2006. The gross margin per bushel increased as a result of improved margins on export sales made late in fiscal 2006, which typically experience better margins than domestic sales. The decrease in the volume of grain sold was a result of the redirection of FGDI to focus on the domestic market, resulting in a decline in export volume.
Other income decreased $1.0 million, or 38.5%, from $2.6 million in fiscal 2005, to $1.6 million in fiscal 2006. This decrease resulted from lower service revenue from ocean vessels and a decrease in patronage dividend income received from CoBank, which declined due to our lower average borrowings. Interest income increased $0.5 million from $0.2 million in fiscal 2005, to $0.7 million in fiscal 2006, due primarily to the financing of grain for the group of grain elevators in Texas.
Expenses, excluding interest expense, decreased $1.3 million, or 7.8%, from $16.7 million in fiscal 2005, to $15.4 million in fiscal 2006. The decrease was a result of a $2.6 million decrease in bad debt expense, offset by increases in employee compensation, transportation expenses, and facility expenses. The bad debt expense decrease was primarily due to the $3.2 million write-off of two international receivables on grain sold in fiscal 2005. In 2006, a $1.0 million charge was recorded due to the bankruptcy of a customer. Interest expense increased $0.5 million, or 17.9%, from $2.8 million in fiscal 2005, to $3.3 million in fiscal 2006, primarily due to increasing variable interest rates on the lines of credit, as average borrowings have remained consistent.
Year Ended August 31, 2005, Compared to Year Ended August 31, 2004
Sales of commodities decreased $186.7 million, or 13.1%, from $1,424.5 million in fiscal 2004 to $1,237.8 million in fiscal 2005. The cost of commodities sold decreased $186.1 million, or 13.2%, from $1,409.1 million
47
in fiscal 2004, to $1,223.0 million in fiscal 2005. The decrease in sales of commodities and cost of commodities sold was primarily the result of lower grain prices, as volumes remained relatively constant at approximately 258 million bushels merchandised in each year. Gross profit decreased $0.6 million, or 4.2%, from $15.4 million in fiscal 2004, to $14.8 million in fiscal 2005. This decrease was due to a slight decline in per-bushel margins from fiscal 2004 as a result of lower export margins in fiscal 2005.
Other income increased $0.4 million, or 15.8%, from $2.2 million in fiscal 2004, to $2.6 million in fiscal 2005, primarily due to the collection of a litigation settlement. Interest income increased $0.1 million from $0.1 million in fiscal 2004, to $0.2 million in fiscal 2005.
Expenses, excluding interest expense, increased $4.4 million, or 35.5%, from $12.3 million in fiscal 2004, to $16.7 million in fiscal 2005. This increase was primarily the result of a $3.2 million increase in bad debts related to the write-off of two international receivables on grain sold. In addition, the increase in expenses was caused by an increase in legal and professional fees of $0.7 million primarily due to ongoing export-related arbitration claims, collection activities, and other legal disputes. Interest expense decreased $0.4 million, or 12.5%, from $3.2 million in fiscal 2004, to $2.8 million in fiscal 2005, primarily due to lower average borrowings and lower interest rates.
Corporate and Other
The Corporate and Other segment consists of income from investments in other companies accounted for using the equity method and overall corporate level expenses primarily related to employee compensation and benefits, travel, technology, professional fees, director fees, and general insurance. The Corporate and Other segment generated insignificant amounts of revenue during the three fiscal years ended August 31, 2006. Corporate net expenses for the three years ended August 31, 2006, were $4.0 million in fiscal 2004, $4.8 million in fiscal 2005, and $7.9 million in fiscal 2006. The primary reasons for the increases were increased employee incentive plan accruals due to the higher net income, additional staff and related benefits, and a $0.7 million loss related to an unaffiliated equity investment recognized in fiscal 2006.
Liquidity and Capital Resources
Overview
We have substantial lines of credit available and annual cash flow from operations to support continued additional growth in each segment of our operations. We believe we have a strong liquidity position and expect to maintain this position over the next twelve months as a result of the available capacity under our revolving credit facilities, operating cash flows and our remaining balance of available cash and temporary cash investments.
Primary Sources and Uses of Cash
Operating cash flow provides the primary source of funds to finance operating needs, capital expenditures and equity investments. As necessary, we supplement operating cash flow with debt to fund these activities, primarily in the Grain Merchandising and Financial Services segments. Excess operating cash is used to fund shareholder dividends and, during the period we operated as a cooperative, patronage dividends to members.
Cash Flows
Unrestricted cash and cash equivalents consist of unrestricted cash and highly liquid investments with original maturities of three months or less. Changes to our unrestricted cash and cash equivalents balances are due to our operating, investing and financing activities discussed below.
48
The following table sets forth our cash flows from operating activities, investing activities and financing activities for the three fiscal years ended August 31, 2006.
| | | | | | | | | | | | |
| | | Year Ended August 31,
| |
| | | 2004
| | | 2005
| | | 2006
| |
| | | (dollars in thousands) | |
Cash flows provided by (used for): | | | | | | | | | | | | |
Operating activities | | $ | 17,102 | | | $ | 30,344 | | | $ | 41,011 | |
Investing activities | | | 10,658 | | | | (7,483 | ) | | | (14,819 | ) |
Financing activities | | | (24,923 | ) | | | (5,659 | ) | | | 8,489 | |
| | |
|
|
| |
|
|
| |
|
|
|
Net increase in cash and cash equivalents | | $ | 2,837 | | | $ | 17,202 | | | $ | 34,681 | |
| | |
|
|
| |
|
|
| |
|
|
|
Cash Flows from Operations
In the commodities industry, companies report trading activities in the operating section of the statement of cash flows. Due to the potential volatility in the commodities market, wide fluctuations in the balances of customer segregated assets, deposits held at various exchanges, marketable securities and customer commodity accounts may occur from day-to-day. As a result of this volatility, cash flows from operations may fluctuate positively or negatively at the end of a reporting period. These fluctuations may not be indicative of the health of our business.
Cash provided by operating activities was $41.0 million for the year ended August 31, 2006, which consisted of net income of $15.3 million increased by $2.0 million of non-cash items and $18.9 million of cash provided by working capital. The $23.8 million provided by working capital primarily consisted of increases in commodity accounts receivable/payable; net marketable securities and customer segregated assets; inventories and other assets. These were offset by increases in trade accounts payable and accrued expenses and a decrease in accounts receivable and advances on grain.
Cash provided by operating activities was $30.3 million for the year ended August 31, 2005, which consisted of net income of $6.6 million decreased by $1.0 million of non-cash items and $24.7 million of cash provided by working capital. Cash provided by operating activities was $17.1 million for the year ended August 31, 2004, which consisted of net income of $6.4 million increased by $1.3 million of non-cash items and $9.4 million of cash provided by working capital.
Cash Flows from Investing Activities
Cash used in investing activities was $14.8 million for fiscal 2006, primarily consisting of $5.5 million of issued notes receivable, associated with the increased activity of the grain inventory financing program within the Financial Services segment, and $5.4 million of purchases of exchange memberships and stocks. The Exchange membership seats and stock provide us with the right to do business on the various exchanges. We have moved towards owning our own exchange seats and stock, rather than relying on memberships from affiliated individuals. We also invested $2.4 million to maintain our minority interest in a company building a biodiesel production facility in Houston, Texas, $1.3 million in fixed asset expenditures primarily for computer hardware and software, furniture and other office equipment and $0.9 million to acquire a minority interest in a subsidiary. Offsetting these cash investments was $0.6 million in proceeds from the sale of exchange membership trading rights.
Cash used in investing activities was $7.5 million for fiscal 2005, consisting primarily of $7.6 million of issued notes receivable and offset by net proceeds of $1.2 million on the sale of exchange memberships. Cash provided by investing activities was $10.7 million for fiscal 2004, consisting primarily of $9.7 million collected on notes receivable and $1.9 million in proceeds from the sale of exchange membership stock.
Cash Flows from Financing Activities
Cash provided by financing activities was $8.5 million for the year ended August 31, 2006, primarily consisting of $11.3 million of net proceeds drawn on our credit facilities, offset by payment of $2.9 million of
49
shareholder dividends. The Company also had net proceeds from the issuance of subordinated debt of $1.5 million and deposited $2.6 million in escrow related to required letters of credit. The notes payable proceeds were used primarily to issue notes receivable associated with the grain inventory financing program and purchase inventories.
Cash used by financing activities was $5.7 million for fiscal 2005, consisting primarily of payments on our credit lines and payment of patronage dividends, offset by proceeds from the issuance of subordinated debt and common stock. See “—Common Stock Issuance” and “—Short- and Long-Term Debt”. Cash used in financing activities was $24.9 million for fiscal 2004, consisting primarily of payments on our credit lines, offset by proceeds from subordinated debt.
Common Stock Issuance
The ESOP purchased 17,457 shares during fiscal 2006 related to the reinvestment of dividends. We generated $4.5 million as a result of the initial sale of stock to the ESOP, which was consummated in August 2005. Our common stock subscription offering to existing shareholders, which was commenced on April 15, 2005, and continued until June 29, 2005, raised an additional $1.7 million. These transactions provided additional working capital to meet the increased regulatory capital requirements resulting from increased growth in the C&RM and the Clearing and Execution Services segments of our business.
Common Stock Dividends
On November 9, 2006, the Company’s board of directors declared a dividend of $1.25 per share on the 4,845,736 shares outstanding. The stock record date for such dividend was November 9, 2006, payable on December 20, 2006. Previously, on October 27, 2005, our board of directors declared a common stock dividend totaling $2.9 million, payable on December 22, 2005. Prior to our conversion from a cooperative to a stock corporation, patronage dividends were paid to members based on a certain amount of the fees paid by our members in their role as customers in the current year. Future regular dividends may be declared and paid at the discretion of the board of directors. Any determination to pay cash dividends will be at the discretion of our board of directors, and will depend upon our results of operations and cash flows, our financial position and capital requirements, general business conditions, legal, tax, regulatory, rating agency and any contractual restrictions on the payment of dividends and any other factors our board of directors deems relevant.
Short- and Long-Term Debt
We believe we have adequate lines of credit available to conduct our business. See “—Credit Facilities.” Certain of the credit facilities are used to a greater extent than others, and represent a significant portion of the proceeds drawn on our lines. Our Grain Merchandising segment has a $68.0 million line of credit with CoBank and a $8.0 million line of credit with AFG Trust Finance available to finance its operations, including carrying significant accounts receivable and inventory, and is used extensively throughout the year. Our Financial Services segment has a $96.0 million line of credit with Deere Credit, Inc and a $75.0 million line of credit with CoBank available to finance its grain inventory repurchasing program. This program’s demand tends to fluctuate throughout the year. While usage corresponds to demand fluctuations, the lines are used consistently throughout the year.
50
Credit Facilities
We maintain a number of lines of credit to support operations. A summary of such lines is noted below.
| | | | | | | | | | | |
Creditor
| | Renewal/Expiration
Date
| | Use
| | Amount
Available
| | | Amount
Outstanding at
August 31, 2006
|
| | | | | | | (dollars in millions) |
Deere Credit, Inc. | | March 1, 2007 | | Margin Calls | | $ | 36.75 | | | $ | -0- |
Deere Credit, Inc. | | March 1, 2007 | | Repurchase Agreements | | | 96.0 | | | | 7.1 |
Deere Credit, Inc. | | October 1, 2009 | | Subordinated Debt for Regulatory Capital | | | 12.0 | | | | 6.0 |
Deere Credit, Inc. | | October 1, 2009 | | General Corporate | | | 13.25 | | | | 10.2 |
| | | | | | |
|
|
| |
|
|
Total Deere | | | | | | | 158.0 | | | | 23.3 |
CoBank, ACB | | December 31, 2007 | | Grain Merchandising | | | 68.0 | (1) | | | 21.0 |
CoBank, ACB | | March 28, 2008 | | Grain Merchandising | | | 8.0 | (1) | | | -0- |
CoBank, ACB | | December 30, 2006 | | OTC & Fuel Operations | | | 10.0 | | | | -0- |
CoBank, ACB | | December 30, 2007 | | OTC & Fuel Operations | | | 10.0 | | | | -0- |
CoBank, ACB | | May 1, 2007 | | Repurchase Agreements | | | 75.0 | | | | 3.4 |
| | | | | | |
|
|
| |
|
|
Total CoBank | | | | | | | 171.0 | | | | 24.4 |
Harris, N.A. | | Demand | | Margin Calls | | | 30.0 | (2) | | | -0- |
Harris, N.A. | | January 31, 2007 | | Grain Deliveries | | | 5.0 | | | | -0- |
AFG Trust Finance Limited | | September 18, 2007 | | Grain Merchandising | | | 8.0 | | | | 4.1 |
Industrial Revenue Bonds (Capitalized Lease Obligations) | | Annual Payments to December 1, 2012 | | Mobile, Alabama facility additional storage | | | -0- | | | | 3.6 |
Fortis Capital Corp. | | Demand | | Financial Services operations | | | 20.0 | | | | 1.1 |
RZB Finance, LLC | | Demand | | Financial Services operations | | | 8.0 | | | | 1.1 |
Bank of Tokyo-Mitsubishi UFJ, Ltd. | | Demand | | Financial Services operations | | | 10.0 | | | | -0- |
Standard Chartered Bank, New York | | Demand | | Financial Services operations | | | 20.0 | | | | -0- |
Subordinated Debt | | December 31, 2006 | | Regulatory Capital | | | 1.8 | | | | 1.0 |
Long-term Note | | December 31, 2012 | | NYMEX seat | | | 0.5 | | | | 0.2 |
| (1) | Grain merchandising’s CoBank revolving credit line and term loan advances in the aggregate cannot exceed $68.0 million. |
| (2) | Effective June 30, 2006, the amount available to borrow from Harris, N.A. has been temporarily increased from $15.0 million to $30.0 million through December 31, 2006. |
We have approximately $422 million available under current credit agreements. While there is no guarantee that we will be able to replace current credit agreements when they expire, based on our strong liquidity position and new capital structure, we believe we will be able to do so.
All of our credit facilities include financial covenants and the failure to comply with any such covenants could result in the debt becoming payable on demand. We were in compliance with all debt covenants effective August 31, 2006, except for an annual fixed charge coverage ratio covenant on FGDI’s line of credit with CoBank. We received a written waiver from CoBank, regarding the annual fixed charge coverage ratio, covering the year ended August 31, 2006, as discussed in Note 11 to the consolidated financial statements.
Due to the terms of the existing lines of credit in our Grain Merchandising segment, we expect our growth in this business segment will be limited by the capital it can retain from annual operations.
We carry significant open futures positions on behalf of our customers in the C&RM and the Clearing and Execution Services segments of our business. The above lines of credit in place for margin calls are rarely used,
51
but necessary to cover any abnormal commodity market fluctuations and the margin calls they may produce. With our own and customer funds on deposit and the available credit lines noted above, management believes we have adequate capital reserves to meet any foreseeable market fluctuations based upon current commodity market activities.
Other Capital Considerations
Our wholly-owned subsidiaries, FCStone LLC and FCC Investments, Inc., are subject to various regulations and capital adequacy requirements. Pursuant to the rules, regulations, and requirements of the CFTC and other self-regulatory organizations, FCStone LLC is required to maintain certain minimum net capital as defined in such rules, regulations, and requirements. Net capital will fluctuate on a daily basis. FCC Investments, Inc. is required to maintain certain net capital as defined by the SEC. As of August 31, 2006 the regulatory capital for these entities was $31,311,896 and $436,071, respectively.
Prior to April 1, 2006, Sowood Commodity Partners Fund LP (“Sowood”) owned a minority interest in FCStone Merchants Services, LLC (“Merchants”). On March 9, 2006, Merchants sent a redemption notice to Sowood, informing them of its intention to redeem their minority ownership interest in Merchants, in accordance with the Limited Liability Company Agreement. The redemption was completed on the close of business on March 31, 2006, with a redemption payment of $0.9 million.
In fiscal 2006, we loaned $1.5 million to Green Diesel LLC as part of its financing to build a biodiesel production facility to be located in Houston, Texas. The loan included the issuance of warrants exercisable for 48% of the equity of Green Diesel. We also committed to make available a $15 million line of credit to Green Diesel to be secured by all of its assets. Subsequently, Green Diesel decided to raise additional equity in order to build a larger production facility with an annual production capacity of approximately 46 million gallons. In order to prevent the dilution of our potential 48% interest in Green Diesel, we invested an additional $2.4 million. Subsequent to August 31, 2006, we loaned an additional $600,000 to Green Diesel to finance the expanded facility. We are not contractually bound to invest additional equity in Green Diesel. We believe the Green Diesel production facility will begin commercial production in early 2007.
Seasonality and Fluctuations in Operating Results
We generally experience seasonality in our operations with the first quarter typically being our strongest period as a result of the U.S. grain harvest. However, with global political factors and their effect on the commodities markets, we have been seeing more frequent trading volume spikes throughout the year than in the past.
Off-balance Sheet Financing Activities
During fiscal 2004, our grain merchandising subsidiary, FGDI, began participating in a bank program to provide liquidity through the sale of insured receivables, with limited recourse. FGDI’s business purpose for entering into this program was to accelerate the receipt of funds and enable FGDI to utilize the increase in the line of credit available as a result of this program to generate additional sales. Aggregate sales of receivables during the fiscal 2004 were $21.7 million. This program ended on February 17, 2005, and no amounts remain outstanding in respect of accounts receivable previously sold. We do not anticipate that the expiration of this program will have a material impact on our future operations as we intend to concentrate more on domestic business that, along with current lower commodity prices, should result in reduced financing requirements for this segment. FGDI accounted for sales of receivables under these agreements as sales in accordance with SFAS No. 140, Accounting for Transfers and Servicing of Financial Assets and Extinguishments of Liabilities.
52
Contractual Obligations
The following table describes our cash payment obligations as of August 31, 2006:
| | | | | | | | | | | | | | | |
| | | Payments Due by Period
|
| | | Total
| | Less than
1 Year
| | 1-3
Years
| | 4-5
Years
| | After
5
Years
|
| | | (in thousands) |
Subordinated debt | | $ | 7,000 | | $ | 1,000 | | $ | — | | $ | 6,000 | | $ | — |
Obligation under capital lease | | | 3,575 | | | 550 | | | 1,100 | | | 1,100 | | | 825 |
Notes payable | | | 48,169 | | | 48,059 | | | 110 | | | — | | | — |
Operating leases | | | 22,001 | | | 7,103 | | | 9,269 | | | 5,629 | | | — |
Purchase obligations(1) | | | 46,052 | | | 46,052 | | | — | | | — | | | — |
| | |
|
| |
|
| |
|
| |
|
| |
|
|
Total | | $ | 126,797 | | $ | 102,764 | | $ | 10,479 | | $ | 12,729 | | $ | 825 |
| | |
|
| |
|
| |
|
| |
|
| |
|
|
| (1) | Purchase obligations are legally binding and enforceable agreements, net of offsetting sale obligations, to purchase commodities at specific terms. |
Based upon our current operations, we believe that cash flow from operations, available cash and available borrowings under our lines of credit will be adequate to meet our future liquidity needs.
Inflation
We believe that our results of operations are not materially affected by moderate changes in the general inflation rate. Inflation did not have a material affect on our operations in the fiscal years ended August 31, 2006, 2005 and 2004. Severe increases in inflation, however, that would affect the global and U.S. economies could have an adverse affect on our business, financial condition and results of operation.
Recently Issued Accounting Standards
In December 2004, the Financial Accounting Standards Board (FASB) issued SFAS No. 123 (Revised 2004),Share-Based Payment (FAS 123(R)). This statement requires that the compensation cost relating to share based payment transactions be recognized in the financial statements. Compensation cost is to be measured based on the estimated fair value of the equity-based compensation awards issued as of the grant date. The related compensation expense will be based on the estimated number of awards expected to vest and will be recognized over the requisite service period (often the vesting period) for each grant. The statement requires the use of assumptions and judgments about future events and some of the inputs to the valuation models will require considerable judgment by management. FAS 123(R) replaces FAS 123 and supersedes APB 25. The Company applied SFAS 123, Accounting for Stock-Based Compensation to the equity-based compensation award granted in June 2006, and will adopt FAS 123(R) as of September 1, 2006 using the modified prospective transition method, which will not impact the options granted in fiscal 2006, unless they are subsequently modified.
In June 2005, the FASB issued SFAS No. 154,Accounting Changes and Error Corrections (SFAS 154), a replacement of APB Opinion No. 20,Accounting Changes, and SFAS No. 3,Reporting Accounting Changes in Interim Financial Statements. SFAS 154 changes the requirements for the accounting for and reporting of a change in accounting principle. Previously, most voluntary changes in accounting principles required recognition of a cumulative effect adjustment within net income of the period of the change. SFAS 154 requires retrospective application to prior periods’ financial statements unless it is impracticable to determine either the period-specific effects or the cumulative effect of the change. SFAS 154 is effective for accounting changes made in fiscal years beginning after December 15, 2005; however, it does not change the transition provisions of any existing accounting pronouncements. Management does not believe adoption of SFAS 154 will have a material effect on our consolidated financial statements.
53
In June 2006, the FASB issued FASB Interpretation No. 48 (“FIN 48” or the “Interpretation”),Accounting for Uncertainty in Income Taxes, an interpretation of FASB Statement No. 109,Accounting for Income Taxes (“FASB No. 109”). FIN 48 clarifies the accounting for uncertainty in income taxes in an enterprise’s financial statements in accordance with FASB 109. This Interpretation requires a recognition threshold and measurement factor for the financial statement recognition and measurement of a tax position taken or expected to be taken in a tax return. This Interpretation also provides guidance on derecognition, classification, interest and penalties, accounting in interim periods, disclosure and transition. FIN 48 is effective for the fiscal year beginning September 1, 2007. We are still evaluating the impact of this Interpretation.
In September 2006, the FASB issued SFAS No. 158,Employers’ Accounting for Defined Benefit Pension and Other Postretirement Plans (SFAS 158). SFAS 158 requires that the net amount by which the defined benefit postretirement obligation is over or underfunded to be reported on the balance sheet. The funded-status amount will be measured as the difference between the fair value of plan assets and the projected benefit obligation, which includes all actuarial gains and losses, prior costs and any remaining transition amounts. SFAS 158 is effective for fiscal years ending after December 15, 2006. In addition, SFAS 158 requires the use of a measurement date as of the balance sheet date for fiscal years ending after December 15, 2008. Application of SFAS 158 at August 31, 2006 would have resulted in the Company recording an additional pension liability of $7.9 million, with the offset to accumulated other comprehensive income, net of applicable tax effects.
In September 2006, the SEC issued Staff Accounting Bulletin No. 108,Considering the Effects of Prior Year Misstatements When Quantifying Misstatements in Current Year Financial Statements (SAB 108), which provides interpretive guidance on how the effects of the carryover or reversal of prior year misstatements should be considered in quantifying a current year misstatement. It establishes an approach that requires quantification of financial statement misstatements based on the effects of the misstatements on each of the company’s financial statements and the related financial statement disclosures. SAB 108 will be effective for the fiscal year ending August 31, 2007. Management does not believe adoption of SAB 108 will have a material impact on the Company’s consolidated financial statements.
Item 7A. Quantitative and Qualitative Disclosures About Market Risk
Market Risk Disclosures
Commodity Price Risk
As part of our grain merchandising activity in FGDI, we utilize futures and option contracts offered through regulated commodity exchanges to reduce risk. We follow a policy of hedging our grain transactions and physical fuel through the use of cash and futures contracts in order to minimize risk due to market fluctuations. Inventories and purchases and sales contracts are hedged to the extent practical so as to arrive at a net commodity position within the formal position limits set by us and deemed prudent for each commodity. We are exposed to risk of loss in the market value of net open commodity positions, which are calculated by aggregating grain inventories and grain subject to contract for purchase and sale. The following table presents the number of bushels in inventory, under purchase and sales contracts and in futures positions by commodity at August 31, 2006:
| | | | | | | | | | | | |
| | | Bushels
| |
| | | Corn
| | | Soybeans
| | | Wheat
| | | Oats & Barley
| |
| | | (in thousands) | |
Inventory | | 5,140 | | | 228 | | | 2,097 | | | 230 | |
Purchase Contracts | | 29,608 | | | 13,771 | | | 14,597 | | | 734 | |
Sale Contracts | | (10,265 | ) | | (11,966 | ) | | (5,515 | ) | | (643 | ) |
Futures Long | | — | | | 1,616 | | | — | | | — | |
Futures Short | | (24,512 | ) | | (3,541 | ) | | (11,165 | ) | | (330 | ) |
| | |
|
| |
|
| |
|
| |
|
|
Net Open Position | | (29 | ) | | 108 | | | 14 | | | (9 | ) |
54
Bushel information is used to calculate the net open commodity position, which is sensitive to changes in commodity prices. Open cash and futures contracts for the purchase and sale of grain are reported at market value; therefore the net open commodity position multiplied by the year-end market price approximates fair value. A hypothetical 10% increase (or decrease) in the market price of the commodities listed in the table from the August 31, 2006 level would result in a gain (or loss) to future earnings of approximately $55,000.
Interest Rate Risk
We manage interest expense using fixed and floating rate debt. The debt instruments are carried at amounts approximating estimated fair value. Of our normal borrowing, greater than 90% of the outstanding balance at August 31, 2006, has a variable interest rate and except for the industrial revenue development bonds associated with the Mobile facility, practically all of our borrowing is on a short-term basis.
Short-term debt used to finance inventories and receivables is represented by notes payable within thirty days or less. The blended interest rate for all such notes approximates current market rates.
In the financing of grain, as interest rates increase, the spread between future option months generally becomes wider, allowing larger incomes in grain margins to offset the potential increases in interest expense. A portion of the outstanding balance of variable rate debt is used to finance certain notes receivable to customers in the Financial Services segment. The interest charged on the notes receivable is also at a variable rate, therefore eliminating the interest rate risk on that debt. Of the variable rate debt, the average outstanding balance subject to interest rate risk of the past year was $37.3 million. A hypothetical 100 basis point increase (or decrease) in interest rates would result in a (loss) or gain to future earnings of $373,000, assuming a similar debt level throughout fiscal 2007.
The risk on variable rate long-term debt associated with the capital lease obligation in the amount of $3.6 million is not material to the financial statements. We believe the risk associated with these borrowings will not have an adverse effect on our financial position, results of operations or cash flows.
Foreign Currency Risk
We conduct most of our international business in U.S. dollars, but there remains a minor risk regarding foreign currency fluctuations. We hedge foreign currency risk using forward contracts to the extent practicable on those transactions. These contracts are marked to market though the same financial statement line as the underlying transactions to which they relate. Foreign currency fluctuations do, however, impact the ability of foreign buyers to purchase U.S. agricultural products and the competitiveness of U.S. agricultural products compared to the same products offered by alternative sources of world supply.
Item 8. Financial Statements and Supplementary Data
Our audited consolidated financial statements are filed under this Item, beginning on page F-1 of this Report. Our financial statement schedules are filed under Item 15 “Exhibits and Financial Statement Schedules.”
Item 9. Changes in and Disagreements with Accountants on Accounting and Financial Disclosure
None
Item 9A. Controls & Procedures
Evaluation of disclosure controls and procedures. The Company’s Chief Executive Officer (“CEO”) and Chief Financial Officer (“CFO”) have evaluated the effectiveness of the Company’s disclosure controls and procedures (as defined in the Exchange Act Rules 13a-15(e) and 15d-15(e)) as of the end of the period covered
55
by this Annual Report on Form 10-K (the “Evaluation Date”). They have concluded that, as of the Evaluation Date, these disclosure controls and procedures were effective to ensure that material information relating to the Company and its consolidated subsidiaries would be made known to them by others within those entities and would be disclosed on a timely basis.
Item 9B. Other Information
None
56
PART III
Item 10. Directors and Executive Officers of the Registrant.
The Registrant’s Proxy Statement to be used in connection with the Annual Meeting of Shareholders to be held on January 11, 2007, will contain under the caption “Election of Directors” and “Audit Committee Report” certain information required by Item 10 of Form 10-K and such information is incorporated herein by this reference. The information required by Item 10 of Form 10-K as to executive officers is set forth in Item 4A of Part I hereof.
The Registrant’s Proxy Statement to be used in connection with the Annual Meeting of Shareholders to be held on January 11, 2007, will contain under the caption “Compliance with Section 16(a) of the Securities Exchange Act of 1934” certain information required by Item 10 of Form 10-K and such information is incorporated herein by this reference.
Item 11. Executive Compensation
The Registrant’s Proxy Statement to be used in connection with the Annual Meeting of Shareholders to be held on January 11, 2007, will contain under the caption “Executive Compensation and Related Matters” the information required by Item 11 of Form 10-K and such information is incorporated herein by this reference.
Item 12. Security Ownership of Certain Beneficial Owners and Management
The Registrant’s Proxy Statement to be used in connection with the Annual Meeting of Shareholders to be held on January 11, 2007, will contain under the caption “Principal Stockholders” the information required by Item 12 of Form 10-K and such information is incorporated herein by this reference.
Item 13. Certain Relationships and Related Transactions
The Registrant’s Proxy Statement to be used in connection with the Annual Meeting of Shareholders to be held on January 11, 2007, will contain under the caption “Related Party Transactions” the information required by Item 13 of Form 10-K and such information is incorporated herein by this reference.
Item 14. Principal Accountant Fees and Services
The Registrant’s Proxy Statement to be used in connection with the Annual Meeting of Shareholders to be held on January 11, 2007, will contain under the caption “Independent Auditor Fees and Services” the information required by Item 14 of Form 10-K and such information is incorporated herein by this reference.
57
PART IV
Item 15. Exhibits and Financial Statement Schedules.
| | | | |
| (a) | | Financial Statements and Schedules |
| | |
| | | (1) | | The following financial statements are filed as a part of this Report on Form 10-K: |
| | |
| | | | | Report of Independent Registered Public Accounting Firm |
| | |
| | | | | Consolidated Statements of Financial Condition as of August 31, 2005 and August 31, 2006 |
| | |
| | | | | Consolidated Statements of Operations for the years ended August 31, 2004, August 31, 2005 and August 31, 2006 |
| | |
| | | | | Consolidated Statements of Stockholders’ Equity and Comprehensive Income for the years ended August 31, 2004, August 31, 2005 and August 31, 2006 |
| | |
| | | | | Consolidated Statements of Cash Flows for the years ended August 31, 2004, August 31, 2005 and August 31, 2006 |
| | |
| | | | | Notes to Consolidated Financial Statements |
| | |
| | | (2) | | The following financial statement schedules are filed as a part of this Report on Form 10-K: |
| | |
| | | | | Schedule I—Parent company condensed financial statements |
| | |
| | | | | Schedule II—Valuation and qualifying accounts |
| |
| (b) | | Exhibits |
| |
| | | The exhibits listed in the Exhibit Index immediately preceding the exhibits are filed as part of this Annual Report on Form 10-K or incorporated herein by reference as indicated below. |
58
SIGNATURES
Pursuant to the requirements of Section 13 or 15(d) of the Securities Exchange Act of 1934, the Registrant has duly caused this report to be signed on its behalf by the undersigned, thereunto duly authorized.
| | |
| | | FCSTONE GROUP, INC. |
| |
November 29, 2006
| | /S/ PAUL G. ANDERSON
|
| Date | | Paul G. Anderson, Chief Executive Officer (Principal Executive Officer) |
Pursuant to the requirements of the Securities Exchange Act of 1934, this report has been signed below by the following persons on behalf of the registrant and in the capacities and on the dates indicated
| | | | |
Signature
| | Title
| | Date
|
| | |
/S/ PAUL G. ANDERSON
Paul G. Anderson | | President and Chief Executive Officer and Director (Principal Executive Officer) | | November 29, 2006 |
| | |
/S/ ROBERT V. JOHNSON
Robert V. Johnson | | Executive Vice President and Chief Financial Officer (Principal Financial and Accounting Officer) | | November 29, 2006 |
| | |
/S/ BRUCE KREHBIEL
Bruce Krehbiel | | Chairman of the Board, Director | | November 29, 2006 |
| | |
Jack Friedman | | Vice Chairman, Director | | November 29, 2006 |
| | |
/S/ ERIC PARTHEMORE
Eric Parthemore | | Director | | November 29, 2006 |
| | |
/S/ BRENT BUNTE
Brent Bunte | | Director | | November 29, 2006 |
| | |
/S/ DOUG DERSCHEID
Doug Derscheid | | Director | | November 29, 2006 |
| | |
/S/ KENNETH HAHN
Kenneth Hahn | | Director | | November 29, 2006 |
| | |
/S/ TOM LEITING
Tom Leiting | | Director | | November 29, 2006 |
| | |
/S/ DAVE REINDERS
Dave Reinders | | Director | | November 29, 2006 |
| | |
/S/ DAVID ANDRESEN
David Andresen | | Director | | November 29, 2006 |
| | |
/S/ ROLLAND SVOBODA
Rolland Svoboda | | Director | | November 29, 2006 |
| | |
/S/ DARYL HENZE
Daryl Henze | | Director | | November 29, 2006 |
59
INDEX TO COMPANY FINANCIAL STATEMENTS
Report of Independent Registered Public Accounting Firm
The Board of Directors
FCStone Group, Inc.:
We have audited the accompanying consolidated statements of financial condition of FCStone Group, Inc. and subsidiaries (the Company) as of August 31, 2006 and 2005 and the related consolidated statements of operations, stockholders’ equity and comprehensive income, and cash flows for each of the years in the three-year period ended August 31, 2006. In connection with our audits of the consolidated financial statements, we have also audited the financial statement schedules I and II. These consolidated financial statements and financial statement schedules are the responsibility of the Company’s management. Our responsibility is to express an opinion on these consolidated financial statements and financial statement schedules based on our audits.
We conducted our audits in accordance with the standards of the Public Company Accounting Oversight Board (United States). Those standards require that we plan and perform the audit to obtain reasonable assurance about whether the consolidated financial statements are free of material misstatement. An audit includes examining, on a test basis, evidence supporting the amounts and disclosures in the consolidated financial statements. An audit also includes assessing the accounting principles used and significant estimates made by management, as well as evaluating the overall consolidated financial statement presentation. We believe that our audits provide a reasonable basis for our opinion.
In our opinion, the consolidated financial statements referred to above present fairly, in all material respects, the financial position of FCStone Group, Inc. and subsidiaries as of August 31, 2006 and 2005 and the results of their operations and their cash flows for each of the years in the three-year period ended August 31, 2006, in conformity with U.S. generally accepted accounting principles. Also, in our opinion, the related financial statement schedules, when considered in relation to the basic consolidated financial statements taken as a whole, present fairly, in all material respects, the information set forth therein.
November 28, 2006
Des Moines, Iowa
F-1
FCSTONE GROUP, INC. AND SUBSIDIARIES
CONSOLIDATED STATEMENTS OF FINANCIAL CONDITION
(in thousands, except share and per share amounts)
| | | | | | | | |
| | | August 31,
| |
| | | 2005
| | | 2006
| |
| ASSETS | | | | | | | | |
Cash and cash equivalents: | | | | | | | | |
Unrestricted | | $ | 25,045 | | | $ | 59,726 | |
Restricted | | | 1,410 | | | | 4,010 | |
Segregated | | | 10,509 | | | | 14,221 | |
Commodity deposits and accounts receivable: | | | | | | | | |
Commodity exchanges and clearing organizations—customer segregated, including United States treasury bills and notes of $338,837 in 2005, $600,609 in 2006 | | | 395,908 | | | | 604,536 | |
Proprietary commodity accounts | | | 18,028 | | | | 20,133 | |
Customer regulated accounts in deficit secured by U.S. Treasury bills and notes of $2,786 in 2005 and $26,979 in 2006 included above | | | 6,351 | | | | 29,166 | |
| | |
|
|
| |
|
|
|
Total commodity deposits and accounts receivable | | | 420,287 | | | | 653,835 | |
| | |
|
|
| |
|
|
|
Marketable securities, at fair value—Customer segregated and other (including other of $376 in 2005 and $378 in 2006) | | | 192,328 | | | | 149,612 | |
Accounts receivable and advances on grain | | | 114,946 | | | | 103,434 | |
Notes receivable | | | 9,632 | | | | 14,971 | |
Inventories—grain, fertilizer, and fuel | | | 14,605 | | | | 26,628 | |
Exchange memberships and stock, at cost (fair value of $5,871 in 2005, $14,391 in 2006)(note 2) | | | 1,797 | | | | 6,587 | |
Furniture, equipment, and improvements, net of accumulated depreciation of $4,676 in 2005 and $4,700 in 2006 | | | 8,206 | | | | 7,386 | |
Deferred income taxes(note 4) | | | 4,013 | | | | 4,697 | |
Investments in affiliates | | | 1,726 | | | | 3,540 | |
Investments in other organizations | | | 1,847 | | | | 1,994 | |
Other assets | | | 3,233 | | | | 6,566 | |
| | |
|
|
| |
|
|
|
| | | $ | 809,584 | | | $ | 1,057,207 | |
| | |
|
|
| |
|
|
|
| LIABILITIES AND STOCKHOLDERS’ EQUITY | | | | | | | | |
Liabilities: | | | | | | | | |
Checks written in excess of bank balance | | $ | 4,880 | | | $ | 6,436 | |
Commodity and customer regulated accounts payable | | | 548,562 | | | | 726,920 | |
Trade accounts payable and advances | | | 134,415 | | | | 169,650 | |
Accrued expenses | | | 20,764 | | | | 26,876 | |
Notes payable(note 11) | | | 36,911 | | | | 48,169 | |
Subordinated debt(note 13) | | | 5,500 | | | | 7,000 | |
Obligations under capital leases | | | 4,125 | | | | 3,575 | |
| | |
|
|
| |
|
|
|
Total liabilities | | | 755,157 | | | | 988,626 | |
| | |
|
|
| |
|
|
|
Minority interest(note 1) | | | 4,755 | | | | 3,607 | |
Redeemable common stock held by Employee Stock Ownership Plan (note 10) | | | 4,487 | | | | 6,079 | |
| | |
Stockholders’ equity(notes 5 and 10): | | | | | | | | |
Common stock, no par value, authorized 20,000,000 at August 31, 2005 and 2006, respectively; issued and outstanding 4,828,279 and 4,845,736 shares at August 31, 2005 and 2006 | | | 21,524 | | | | 21,747 | |
Additional paid-in capital | | | — | | | | 120 | |
Accumulated other comprehensive loss | | | (4,555 | ) | | | (1,955 | ) |
Retained earnings | | | 32,703 | | | | 45,062 | |
| | |
|
|
| |
|
|
|
| | | | 49,672 | | | | 64,974 | |
Less maximum cash obligation related to ESOP shares (note 10) | | | (4,487 | ) | | | (6,079 | ) |
| | |
|
|
| |
|
|
|
Total stockholders’ equity | | | 45,185 | | | | 58,895 | |
| | |
|
|
| |
|
|
|
Commitments and contingencies(notes 9, 12, and 14) | | | | | | | | |
| | |
Total liabilities and stockholders’ equity | | $ | 809,584 | | | $ | 1,057,207 | |
| | |
|
|
| |
|
|
|
See accompanying notes to consolidated financial statements.
F-2
FCSTONE GROUP, INC. AND SUBSIDIARIES
CONSOLIDATED STATEMENTS OF OPERATIONS
(in thousands, except per share amounts)
| | | | | | | | | | | |
| | | Year Ended August 31,
| |
| | | 2004
| | 2005
| | | 2006
| |
Revenues: | | | | | | | | | | | |
Commissions and clearing fees | | $ | 67,594 | | $ | 76,674 | | | $ | 105,622 | |
Service, consulting and brokerage fees | | | 12,008 | | | 18,913 | | | | 33,388 | |
Interest | | | 3,982 | | | 8,177 | | | | 23,174 | |
Other | | | 4,521 | | | 7,463 | | | | 2,638 | |
Sales of commodities | | | 1,536,209 | | | 1,290,620 | | | | 1,129,983 | |
| | |
|
| |
|
|
| |
|
|
|
Total revenues | | | 1,624,314 | | | 1,401,847 | | | | 1,294,805 | |
| | |
|
| |
|
|
| |
|
|
|
Costs and expenses: | | | | | | | | | | | |
Cost of commodities sold | | | 1,519,221 | | | 1,275,094 | | | | 1,112,949 | |
Employee compensation and broker commissions | | | 30,160 | | | 32,578 | | | | 44,229 | |
Pit brokerage and clearing fees | | | 26,713 | | | 33,141 | | | | 47,613 | |
Introducing broker commissions | | | 10,704 | | | 14,459 | | | | 22,826 | |
Employee benefits and payroll taxes(note 6) | | | 7,136 | | | 8,044 | | | | 9,801 | |
Interest | | | 4,418 | | | 3,946 | | | | 5,705 | |
Depreciation and amortization | | | 861 | | | 1,551 | | | | 1,674 | |
Bad debt expense | | | 716 | | | 4,077 | | | | 1,909 | |
Other expenses (note 9) | | | 15,365 | | | 18,926 | | | | 23,568 | |
| | |
|
| |
|
|
| |
|
|
|
Total costs and expenses | | | 1,615,294 | | | 1,391,816 | | | | 1,270,274 | |
| | |
|
| |
|
|
| |
|
|
|
Income before income tax expense and minority interest | | | 9,020 | | | 10,031 | | | | 24,531 | |
Minority interest(note 1) | | | 576 | | | (499 | ) | | | (226 | ) |
| | |
|
| |
|
|
| |
|
|
|
Income after minority interest and before income tax expense | | | 8,444 | | | 10,530 | | | | 24,757 | |
Income tax expense(note 4) | | | 2,030 | | | 3,950 | | | | 9,500 | |
| | |
|
| |
|
|
| |
|
|
|
Net income | | $ | 6,414 | | $ | 6,580 | | | $ | 15,257 | |
| | |
|
| |
|
|
| |
|
|
|
Basic and diluted shares outstanding | | | | | | 4,357 | | | | 4,833 | |
Basic and diluted earnings per share | | | | | $ | 1.51 | | | $ | 3.16 | |
See accompanying notes to consolidated financial statements.
F-3
FCSTONE GROUP, INC. AND SUBSIDIARIES
CONSOLIDATED STATEMENTS OF STOCKHOLDERS’ EQUITY AND COMPREHENSIVE INCOME
(in thousands, except per share amount)
| | | | | | | | | | | | | | | | | | | | | | | | | | | | | | | | | | | |
| | | Common Stock
| | | Preferred
Stock
| | | Common Stock
| | | Additional Paid In Capital
| | Accumulated Other Comprehensive Loss
| | | Retained Earnings
| | | Maximum Cash Obligation Related to ESOP Shares
| | | Total
Stockholders’ Equity
| |
| | | | | Class A
| | | Class B
| | | | | | |
Balance at August 31, 2003 | | $ | — | | | $ | 14,006 | | | $ | 2,753 | | | $ | 500 | | | $ | — | | $ | (3,932 | ) | | $ | 22,500 | | | $ | — | | | $ | 35,827 | |
Net income | | | — | | | | — | | | | — | | | | — | | | | — | | | — | | | | 6,414 | | | | — | | | | 6,414 | |
Pension adjustment | | | — | | | | — | | | | — | | | | — | | | | — | | | 893 | | | | — | | | | — | | | | 893 | |
| | | | | | | | | | | | | | | | | | | | | | | | | | | | | | | | | |
|
|
|
Total comprehensive income | | | — | | | | — | | | | — | | | | — | | | | — | | | — | | | | — | | | | — | | | | 7,307 | |
Transfer of Class A to preferred stock due to member reorganizations | | | — | | | | 49 | | | | (49 | ) | | | — | | | | — | | | — | | | | — | | | | — | | | | — | |
Patronage refunds: | | | | | | | | | | | | | | | | | | | | | | | | | | | | | | | | | | | |
Payable in cash: | | | | | | | | | | | | | | | | | | | | | | | | | | | | | | | | | | | |
Class A | | | — | | | | — | | | | — | | | | — | | | | — | | | — | | | | (1,420 | ) | | | — | | | | (1,420 | ) |
Class B | | | — | | | | — | | | | — | | | | — | | | | — | | | — | | | | (449 | ) | | | — | | | | (449 | ) |
Application of current year patronage to common and preferred stock | | | — | | | | 851 | | | | 65 | | | | — | | | | — | | | — | | | | (916 | ) | | | — | | | | — | |
Cash received on shares issued and subscribed | | | — | | | | — | | | | 1 | | | | — | | | | — | | | — | | | | — | | | | — | | | | 1 | |
Cash disbursed on shares retired | | | — | | | | (1,036 | ) | | | (401 | ) | | | — | | | | — | | | — | | | | — | | | | — | | | | (1,437 | ) |
| | |
|
|
| |
|
|
| |
|
|
| |
|
|
| |
|
| |
|
|
| |
|
|
| |
|
|
| |
|
|
|
Balance at August 31, 2004 | | | — | | | | 13,870 | | | | 2,369 | | | | 500 | | | | — | | | (3,039 | ) | | | 26,129 | | | | — | | | | 39,829 | |
| | |
|
|
| |
|
|
| |
|
|
| |
|
|
| |
|
| |
|
|
| |
|
|
| |
|
|
| |
|
|
|
Net income | | | — | | | | — | | | | — | | | | — | | | | — | | | — | | | | 6,580 | | | | — | | | | 6,580 | |
Pension adjustment | | | — | | | | — | | | | — | | | | — | | | | — | | | (1,516 | ) | | | — | | | | — | | | | (1,516 | ) |
| | | | | | | | | | | | | | | | | | | | | | | | | | | | | | | | | |
|
|
|
Total comprehensive income | | | — | | | | — | | | | — | | | | — | | | | — | | | — | | | | — | | | | — | | | | 5,064 | |
Application of prior year’s patronage | | | — | | | | 6 | | | | — | | | | — | | | | — | | | — | | | | (6 | ) | | | — | | | | — | |
Conversion, as a result of restructuring | | | 16,737 | | | | (13,872 | ) | | | (2,365 | ) | | | (500 | ) | | | — | | | — | | | | — | | | | — | | | | — | |
Repurchase of stock | | | (605 | ) | | | — | | | | — | | | | — | | | | — | | | — | | | | — | | | | — | | | | (605 | ) |
Cash received on shares issued | | | 6,231 | | | | — | | | | — | | | | — | | | | — | | | — | | | | — | | | | (4,487 | ) | | | 1,744 | |
Cash disbursed on shares retired | | | — | | | | (4 | ) | | | (4 | ) | | | — | | | | — | | | — | | | | — | | | | — | | | | (8 | ) |
Registration costs | | | (839 | ) | | | — | | | | — | | | | — | | | | — | | | — | | | | — | | | | — | | | | (839 | ) |
| | |
|
|
| |
|
|
| |
|
|
| |
|
|
| |
|
| |
|
|
| |
|
|
| |
|
|
| |
|
|
|
Balance at August 31, 2005 | | | 21,524 | | | | — | | | | — | | | | — | | | | — | | | (4,555 | ) | | | 32,703 | | | | (4,487 | ) | | | 45,185 | |
| | |
|
|
| |
|
|
| |
|
|
| |
|
|
| |
|
| |
|
|
| |
|
|
| |
|
|
| |
|
|
|
Net income | | | — | | | | — | | | | — | | | | — | | | | — | | | — | | | | 15,257 | | | | — | | | | 15,257 | |
Pension adjustment | | | — | | | | — | | | | — | | | | — | | | | — | | | 2,600 | | | | — | | | | — | | | | 2,600 | |
| | | | | | | | | | | | | | | | | | | | | | | | | | | | | | | | | |
|
|
|
Total comprehensive income | | | — | | | | — | | | | — | | | | — | | | | — | | | — | | | | — | | | | — | | | | 17,857 | |
Dividends paid ($0.60 per share) | | | — | | | | — | | | | — | | | | — | | | | — | | | — | | | | (2,898 | ) | | | — | | | | (2,898 | ) |
Stock compensation | | | — | | | | — | | | | — | | | | — | | | | 120 | | | — | | | | — | | | | — | | | | 120 | |
Change in value of shares held by ESOP | | | — | | | | — | | | | — | | | | — | | | | — | | | — | | | | — | | | | (1,369 | ) | | | (1,369 | ) |
Cash received on shares issued | | | 223 | | | | — | | | | — | | | | — | | | | — | | | — | | | | — | | | | (223 | ) | | | — | |
| | |
|
|
| |
|
|
| |
|
|
| |
|
|
| |
|
| |
|
|
| |
|
|
| |
|
|
| |
|
|
|
Balance at August 31, 2006 | | $ | 21,747 | | | $ | — | | | $ | — | | | $ | — | | | $ | 120 | | $ | (1,955 | ) | | $ | 45,062 | | | $ | (6,079 | ) | | $ | 58,895 | |
| | |
|
|
| |
|
|
| |
|
|
| |
|
|
| |
|
| |
|
|
| |
|
|
| |
|
|
| |
|
|
|
See accompanying notes to consolidated financial statements.
F-4
FCSTONE GROUP, INC. AND SUBSIDIARIES
CONSOLIDATED STATEMENTS OF CASH FLOWS
(in thousands)
| | | | | | | | | | | | |
| | | Year Ended August 31,
| |
| | | 2004
| | | 2005
| | | 2006
| |
Cash flows from operating activities: | | | | | | | | | | | | |
Net income | | $ | 6,414 | | | $ | 6,580 | | | $ | 15,257 | |
Depreciation | | | 861 | | | | 1,551 | | | | 1,674 | |
Amortization of discount on note receivable | | | — | | | | — | | | | (46 | ) |
Gain on sale of exchange memberships and stock | | | (833 | ) | | | (1,750 | ) | | | — | |
Equity in earnings of affiliates, net of distributions | | | (66 | ) | | | (25 | ) | | | 591 | |
Minority interest, net of distributions | | | 1,380 | | | | (733 | ) | | | (237 | ) |
Change in commodity accounts receivable/payable, marketable securities and customer segregated funds, net | | | (12,535 | ) | | | (33,097 | ) | | | (16,186 | ) |
(Increase) decrease in accounts receivable and advances on grain | | | (19,622 | ) | | | (3,379 | ) | | | 815 | |
Decrease (increase) in inventories—grain, fertilizer and fuel | | | 10,831 | | | | (2,407 | ) | | | (12,023 | ) |
Increase in other assets | | | (1,627 | ) | | | (356 | ) | | | (3,998 | ) |
Increase in accounts payable | | | 30,152 | | | | 60,908 | | | | 45,932 | |
Increase in accrued expenses | | | 2,147 | | | | 3,052 | | | | 9,233 | |
| | |
|
|
| |
|
|
| |
|
|
|
Net cash provided by operating activities | | | 17,102 | | | | 30,344 | | | | 41,011 | |
| | |
|
|
| |
|
|
| |
|
|
|
Cash flows from investing activities: | | | | | | | | | | | | |
Purchase of furniture, equipment, and improvements | | | (918 | ) | | | (1,105 | ) | | | (1,255 | ) |
Acquisition of equity investment | | | — | | | | — | | | | (2,405 | ) |
Acquisition of minority interest | | | — | | | | — | | | | (911 | ) |
Collection (issuance) of notes receivable | | | 9,732 | | | | (7,553 | ) | | | (5,458 | ) |
Purchase of exchange memberships and stock | | | (68 | ) | | | (925 | ) | | | (5,403 | ) |
Proceeds from sale of exchange memberships and stock | | | 1,912 | | | | 2,100 | | | | 613 | |
| | |
|
|
| |
|
|
| |
|
|
|
Net cash provided by (used in) investing activities | | | 10,658 | | | | (7,483 | ) | | | (14,819 | ) |
| | |
|
|
| |
|
|
| |
|
|
|
Cash flows from financing activities: | | | | | | | | | | | | |
Increase (decrease) in checks written in excess of bank balance | | | 8,022 | | | | (3,142 | ) | | | 1,556 | |
(Payments on) proceeds from note payable, net | | | (34,517 | ) | | | (4,620 | ) | | | 11,258 | |
Proceeds from issuance of common stock | | | 1 | | | | 1,744 | | | | — | |
Proceeds from issuance of redeemable common stock held by ESOP | | | — | | | | 4,487 | | | | 223 | |
Payment for redemption of stock | | | (1,437 | ) | | | (613 | ) | | | — | |
Payment of prior year patronage | | | (1,429 | ) | | | (1,869 | ) | | | — | |
Dividends paid | | | — | | | | — | | | | (2,898 | ) |
Payments under capital lease | | | (688 | ) | | | (550 | ) | | | (550 | ) |
Proceeds from subordinated debt | | | 5,750 | | | | 9,000 | | | | 4,500 | |
Payment of subordinated debt | | | (500 | ) | | | (9,250 | ) | | | (3,000 | ) |
Monies deposited in escrow | | | — | | | | (7 | ) | | | (2,600 | ) |
Debt issuance costs | | | (125 | ) | | | — | | | | — | |
Registration costs | | | — | | | | (839 | ) | | | — | |
| | |
|
|
| |
|
|
| |
|
|
|
Net cash (used in) provided by financing activities | | | (24,923 | ) | | | (5,659 | ) | | | 8,489 | |
| | |
|
|
| |
|
|
| |
|
|
|
Net increase in cash and cash equivalents—unrestricted | | | 2,837 | | | | 17,202 | | | | 34,681 | |
Cash and cash equivalents—unrestricted—at beginning of year | | | 5,006 | | | | 7,843 | | | | 25,045 | |
| | |
|
|
| |
|
|
| |
|
|
|
Cash and cash equivalents—unrestricted—at end of year | | $ | 7,843 | | | $ | 25,045 | | | $ | 59,726 | |
| | |
|
|
| |
|
|
| |
|
|
|
Supplemental disclosures of cash flow information: | | | | | | | | | | | | |
Cash paid during the year for: | | | | | | | | | | | | |
Interest | | $ | 4,785 | | | $ | 3,821 | | | $ | 5,587 | |
Income taxes | | | 2,057 | | | | 4,215 | | | | 10,335 | |
| | |
|
|
| |
|
|
| |
|
|
|
Supplemental disclosure of noncash investing and financing activities: | | | | | | | | | | | | |
Application of current year patronage to common and preferred stock | | $ | 916 | | | $ | — | | | $ | — | |
Transfer of Class A common stock to preferred stock, due to member reorganizations | | | 49 | | | | — | | | | — | |
Transfer of retained earnings to patronage payable, due to patronage refunds | | | 1,869 | | | | — | | | | — | |
| | |
|
|
| |
|
|
| |
|
|
|
See accompanying notes to consolidated financial statements.
F-5
FCSTONE GROUP, INC. AND SUBSIDIARIES
NOTES TO CONSOLIDATED FINANCIAL STATEMENTS
1. SUMMARY OF SIGNIFICANT ACCOUNTING POLICIES AND RELATED MATTERS
ORGANIZATION
The accompanying consolidated financial statements include the financial statements of FCStone Group, Inc. and its wholly-owned subsidiaries, FCStone, L.L.C. (FCStone); FCC Investments, Inc. (FCC Investments); FCStone Trading L.L.C. (FCStone Trading); FCC Futures, Inc.; FCStone Financial, Inc. (FCStone Financial); FCStone Forex LLC; FCStone International, LLC; FCStone Merchant Services, LLC (FCStone Merchant Services); and 70% owned FGDI, L.L.C. (FGDI) (collectively, the Company). All significant intercompany balances and transactions have been eliminated in consolidation.
FCStone is a commodity futures commission merchant servicing customers primarily in grain and energy related businesses. FCC Investments is registered as a securities broker-dealer. FCStone Trading provides risk management consulting services, acts as a dealer in over-the-counter (OTC) derivative contracts on physical commodities. FCC Futures, Inc. acts as a guaranteed introducing broker of FCStone and is registered with the National Futures Association. FCStone Financial provides railcar services to grain companies through leasing and subleasing of railcars and also enters into sale/repurchase agreements with grain companies for the purchase and sale of certain commodities. FCStone Forex LLC provides OTC interbank currency dealing services to self-directed and professionally managed client accounts. FGDI’s primary operations relate to grain merchandising. FCStone Merchant Services provides specialized financing through inventory repurchase arrangements, transactional commodity finance arrangements, and processing and tolling arrangements. FCStone International, LLC owns subsidiaries formed in Canada and Brazil.
The Company’s investment in Farmers Commodities Transportation Company, LLC (FCTC) represents 10% of the outstanding member units and is reported under the equity method at August 31, 2005 and 2006. FCTC provides railcar service through the leasing and subleasing of railcars and brokering the usage of these cars. FCStone provides management services, including accounting, administrative, personnel, and office space, to FCTC and has two members on FCTC’s board of directors. The Company also has minority holdings in three other entities, Green Diesel LLC, Lehi Mills L.L.C. and Hurley & Associates, all of which are carried under the equity method.
On March 1, 2005, the voting members of the Company approved the restructuring of the Company by terminating the Company’s cooperative status and ending the patronage-based rights accruing to the Company’s members (see note 10).
USE OF ESTIMATES
The preparation of financial statements in conformity with accounting principles generally accepted in the United States of America requires management to make estimates and assumptions that affect the reported amounts of assets and liabilities and disclosure of contingent assets and liabilities at the date of the financial statements and the reported amounts of revenues and expenses during the reporting period. Actual results could differ from those estimates.
COMMODITY DEPOSITS AND ACCOUNTS RECEIVABLE/PAYABLE
Commodity accounts include equities and deficits in open futures and option contracts and funds received to margin or guarantee commodity transactions. The Company is obligated to fund margin calls on open contracts and, in turn, receives reimbursement from customers for maintenance of their respective margins. In accordance with the Commodity Futures Trading Commission’s regulations, customer funds received to margin, guarantee,
F-6
FCSTONE GROUP, INC. AND SUBSIDIARIES
NOTES TO CONSOLIDATED FINANCIAL STATEMENTS—(Continued)
and/or secure commodity futures transactions are segregated and accounted for separately from the general assets of the Company. Commodity deposits and receivables with clearing organizations and commodity customer payables are reported gross except where a right of offset exists. The future collectability of these amounts can be impacted by the Company’s collection efforts, the financial stability of its customers and the general economic climate in which it operates. The Company evaluates accounts that it believes may become uncollectible through reviewing margin deficit reports and by monitoring the financial strength of its customers.
MARKETABLE SECURITIES
Marketable securities consist of short-term overnight investments in U.S. Treasury and U.S. Government Agency repurchase agreements and money market funds allowed by the Commodities Futures Trading Commission’s regulations for segregated customer funds. These securities are reported at market value, which approximates cost given their short-term nature.
TRADE ACCOUNTS RECEIVABLE
The Company records trade receivables due from its customers at the time sales are recorded in accordance with its revenue recognition policy. The future collectibility of these amounts can be impacted by the Company’s collection efforts, the financial stability of its customers, and the general economic climate in which it operates. The Company applies a consistent practice of establishing an allowance for accounts that it believes may become uncollectible through reviewing the historical aging of its receivables and by monitoring the financial strength of its customers. If the Company becomes aware of a customer’s inability to meet its financial obligations (e.g., where it has filed for bankruptcy), the Company establishes a specific allowance for the potential bad debt to reduce the net recognized receivable to the amount it reasonably believes it is probable will be collected.
NOTES RECEIVABLE
FCStone Financial and FCStone Merchant Services accept notes receivable under sale/repurchase agreements with customers whereby the customers sell certain commodity inventory to them and agree to repurchase the commodity inventory from them at a future date. The customers bear the risk of changes in market price while under contract and are required to maintain a security account with FCStone to hedge this risk. FCStone Financial and FCStone Merchant Services apply SFAS 49,Accounting for Product Financing Arrangements, and accordingly, these transactions are treated as secured borrowings rather than commodity inventory in the Company’s financial statements. Interest is accrued on the outstanding notes balance on a daily basis using an applicable interest rate, which ranged from 7.25% to 10.75% during 2006, from 7.50% to 8.25% during 2005 and from 3.75% to 5.50% during 2004. The notes are carried at their principal balance which approximates fair value.
During 2006, FCStone Merchant Services loaned $1.5 million to Green Diesel LLC as part of its financing to build a biodiesel production facility to be located in Houston, Texas. The note receivable bears interest on the principal balance outstanding at an annual rate of 10% and matures on October 31, 2008. The terms of the loan agreement included the issuance of warrants exercisable for up to 48% of the equity of Green Diesel. FCStone Merchants Services has discounted the note receivable relative to the value assigned to the warrants, which has been reported in other assets on the consolidated statement of financial condition. The discount is being amortized over the term of the loan agreement as an adjustment of the loan yield through interest income on the consolidated statement of operations.
F-7
FCSTONE GROUP, INC. AND SUBSIDIARIES
NOTES TO CONSOLIDATED FINANCIAL STATEMENTS—(Continued)
INVENTORIES
Grain inventories are carried at market value, which is net realizable value (NRV). NRV is determined by estimating selling prices in the applicable market location and related costs of disposal in the ordinary course of business. Realized and unrealized gains and losses on futures contracts are credited or charged to current cost of sales.
Fertilizer inventory is recorded at the lower of cost or market using the first-in, first-out method.
Fuel inventory is recorded at the lower of cost or market using the weighted average method. FCStone Trading had a minimum line fill requirement at two pipeline companies which expired during fiscal 2006.
A summary of inventories as of August 31, 2005 and 2006 are as follows:
| | | | | | |
| | | 2005
| | 2006
|
Grain | | $ | 13,507,493 | | $ | 25,539,782 |
Fertilizer | | | 633,293 | | | 1,087,799 |
Fuel | | | 464,315 | | | — |
| | |
|
| |
|
|
| | | $ | 14,605,101 | | $ | 26,627,581 |
| | |
|
| |
|
|
DERIVATIVE FINANCIAL INSTRUMENTS—GRAIN
FGDI’s use of derivative instruments includes commodity futures and option contracts offered through regulated commodity exchanges to reduce price risk. FGDI does not use derivative instruments for trading purposes and have procedures in place to monitor and control their use.
Accounting for these derivative instruments is done in accordance with SFAS No. 133, “Accounting for Derivative Instruments and Hedging Activities” as amended by SFAS No. 149, “Amendment of Statement 133 on Derivative Instruments and Hedging Activities.” Derivative instruments are required to be reported on the consolidated statements of financial condition at fair values. Fair values are determined based on published prices from regulated commodity exchanges.
COMMODITY PRICE RISK
FGDI has open cash contracts for the purchase and sale of grain, which are reported at market value and the resulting gains or losses are recognized currently in cost of products sold. FGDI is exposed to risks that it may not have sufficient grain quantity to deliver against its contacts and thus would be obligated to purchase grain at prevailing market prices in order to meet such commitments. FGDI is exposed to risk of loss in the market value of net open commodity positions, which are calculated by aggregating grain inventories and cash grain purchases and sales contracts. In order to reduce these risks, FGDI generally takes opposite and offsetting positions using futures contracts or options.
Realized and unrealized gains and losses on futures contracts and option contracts used as economic hedges of grain inventories and purchase and sale contracts are recognized in cost of products sold for financial reporting, using market prices. Inventories and cash purchase and sale contracts are marked to fair value using market-based prices so that gains and losses on the derivative contracts are offset by gains or losses on inventories and purchase and sale contracts.
F-8
FCSTONE GROUP, INC. AND SUBSIDIARIES
NOTES TO CONSOLIDATED FINANCIAL STATEMENTS—(Continued)
HEDGE POLICY—FUEL
The Company follows the policy of hedging its fuel purchases made on behalf of its customers to minimize the risk due to market fluctuations. The gains and losses relating to closed hedge positions are either billed to or returned to the customer and are allocated based upon their respective volume of business. The Company is exposed to credit risk of customers, to the extent they fail to settle their obligations.
Balances receivable from or due to customers under these hedging contracts are reported at market value based on publicly available third-party pricing services and reflected as other receivables or accounts payable—customers in the financial statements and the related unrealized gain or loss is recorded in cost of fuel sold.
FURNITURE, EQUIPMENT, SOFTWARE, AND IMPROVEMENTS
Furniture, equipment, software, and improvements are recorded at cost. Expenditures for maintenance, repairs, and minor replacements are charged to operations, while expenditures for major replacements and betterments are capitalized.
FGDI had leased property, primarily comprised of grain bins, under capital lease having a net carrying value of $4,950,000 and $4,331,250 at August 31, 2005 and 2006, respectively (see note 9).
Depreciation expense is provided using the straight-line method over the estimated useful lives of the assets. Furniture, equipment, and leasehold improvements are depreciated over five to forty years. Software is depreciated over a useful life of three years. Capital leases for grain bins are depreciated over the remaining life of the lease from the date placed in service.
CASH AND CASH EQUIVALENTS—UNRESTRICTED
Cash equivalents consist of investments with original maturities of three months or less and include money market funds totaling $17,329,530 and $48,591,534 at August 31, 2005 and 2006, respectively.
CASH AND CASH EQUIVALENTS—RESTRICTED
FCStone and FGDI have deposited monies into an escrow account held at a financial institution, in connection with FGDI’s capital lease obligation (see note 8). The deposited funds, and all earnings, are required to be held in escrow until repayment of the bond sinking fund. Additionally, FCStone Trading has deposited monies in a money market fund and can only be used as collateral for a letter of credit agreement (see Note 12).
CASH AND CASH EQUIVALENTS—SEGREGATED
Pursuant to requirements of the Commodity Exchange Act, funds deposited by customers relating to futures contracts in regulated commodities must be carried in separate accounts which are designated as segregated customers’ accounts. At August 31, 2005 and 2006, cash and cash equivalents—segregated included an interest bearing cash account of $5,043,322 and $6,080,886, respectively, for deposit of customer funds.
MINORITY INTERESTS
Minority interest in net assets and income reflected in the accompanying consolidated financial statements consists of:
a) A 30% minority interest, held since 2001, by an unaffiliated third party in FGDI, a domestic limited liability company, for 2005 and 2006.
F-9
FCSTONE GROUP, INC. AND SUBSIDIARIES
NOTES TO CONSOLIDATED FINANCIAL STATEMENTS—(Continued)
b) A 30% minority interest, from October 2004 through March 2006, held by an unaffiliated third party in FCStone Merchant Services, a domestic limited liability company for 2005 and 2006. Effective March 31, 2006, the Company redeemed the minority ownership interest in accordance with the Limited Liability Company Agreement. On April 1, 2006, FCStone Merchant Services became a wholly owned subsidiary of the Company.
The following tables set forth the components of minority interest in the consolidated statements of financial condition:
| | | | | | |
| | | August 31
|
| | | 2005
| | 2006
|
FGDI, LLC | | $ | 3,736,249 | | $ | 3,607,344 |
FCStone Merchant Services, LLC | | | 1,018,776 | | | — |
| | |
|
| |
|
|
Total | | $ | 4,755,025 | | $ | 3,607,344 |
| | |
|
| |
|
|
COMMON STOCK HELD BY ESOP
In 2005, the Company formed an employee stock ownership plan (ESOP) and the ESOP purchased shares of the Company’s common stock. The Company’s maximum cash obligation related to these shares is classified outside stockholders’ equity because the shares are not readily traded and could be put to the Company for cash upon termination by an employee.
OTHER COMPREHENSIVE INCOME (LOSS)
Other comprehensive income (loss) refers to expense, gains, and losses that are included in comprehensive income (loss) but are excluded from net income as these amounts are recorded directly as an adjustment to stockholders’ equity, net of tax. The Company’s other comprehensive income (loss) is comprised of minimum pension liability adjustments, net of tax.
COMMISSION REVENUE AND EXPENSE AND CLEARING AND TRANSACTION FEES
Commissions on futures contracts are recognized when the related open commodity futures transaction is made (opened and closed). Commissions on option contracts are recognized upon the purchase or sale of the option. Clearing and transaction fees are charged when each trade is made (opened and closed).
SERVICE AND CONSULTING FEES
Risk management service and consulting fees are billed and recognized as revenue on a monthly basis when such services are provided. Such agreements are generally for one-year periods but are cancelable by either party with a 30-day notice.
REVENUE RECOGNITION ON PURCHASE AND SALE OF COMMODITIES
The Company recognizes revenue on sales when the agricultural products or fuel are shipped and/or the customer takes ownership and assumes risk of loss. In addition, in accordance with accounting principles generally accepted in the United States of America, revenues from certain activities should be reported gross with a separate display of cost of sales. Revenues from our grain merchandising and fuel sales have been presented gross. These grain merchandising and fuel sales include activities in which we are the primary obligor responsible for fulfillment, act as principal, change the product or perform part of the service, take title to the inventory and assume the risk and rewards of ownership, such as the risk of loss for collection and delivery.
F-10
FCSTONE GROUP, INC. AND SUBSIDIARIES
NOTES TO CONSOLIDATED FINANCIAL STATEMENTS—(Continued)
REVENUE RECOGNITION ON COMMODITY FINANCING TRANSACTIONS
The Company recognizes revenue on sales in instances where the Company is not the primary obligor in the arrangement, based on the amount retained. These commodity financing transactions include activities in which the Company does not take title to the commodities and does not have the risks and rewards of ownership. The Company’s compensation, a stated percentage of the transaction’s profit, is calculated and recorded upon settlement of the transaction, as funds become available for distribution.
OTHER REVENUES
The Company reports its equity in the earnings of unconsolidated affiliates as other revenue. This amounted to $65,569, $25,263 and a loss of $584,029, in 2004, 2005 and 2006, respectively. The 2006 amount included a write-off of $737,727 related to an unaffiliated equity investment.
The Company recorded a gain on the sale of a Chicago Board of Trade exchange seat in the amount of $1,749,850 in 2005, which is included in other income.
The Company recorded a gain on the sale of its investment in The Clearing Corporation stock of $832,880 in 2004, which is included in other income.
STOCK-BASED COMPENSATION
On June 13, 2006, the Company issued stock options and adopted the fair value method of accounting for stock-based in accordance with SFAS No. 123, Accounting for Stock-Based Compensation (SFAS 123), as described in Note 7. The options were fully vested and exercisable upon issuance. The Company obtained a third party valuation of the fair value of the shares to establish the fair value of the shares for purposes of determining the stock option strike price. The value of the stock options issued was based upon an option-pricing model using the minimum value method as allowed under SFAS 123 and was recognized as an expense in the period granted.
In December 2004, the Financial Accounting Standards Board (“FASB”) issued FAS No. 123 (Revised 2004), “Share-Based Payment” (“FAS 123(R)”). This statement requires that the compensation cost relating to share based payment transactions be recognized in the financial statements. Compensation cost is to be measured based on the estimated fair value of the equity-based compensation awards issued as of the grant date. The related compensation expense will be based on the estimated number of awards expected to vest and will be recognized over the requisite service period (often the vesting period) for each grant. The statement requires the use of assumptions and judgments about future events and some of the inputs to the valuation models will require considerable judgment by management. FAS 123(R) replaces FAS 123 and supersedes APB 25. The Company will adopt FAS 123(R) as of September 1, 2006 using the modified prospective transition method, which will not impact the options granted in fiscal 2006, unless they are subsequently modified.
PATRONAGE REFUNDS
Prior to September 1, 2004, the Company operated on a cooperative basis; accordingly, substantially all savings arising from business transacted with or for members were allocated to them in the form of cash or stockholders’ equity.
INCOME TAXES
Prior to September 1, 2004, the Company operated as a nonexempt cooperative under Sections 1381 through 1388 of the Internal Revenue Code. Accordingly, federal income taxes were based on nonmember savings and the portion of member savings not allocated as patronage refunds, if any. The companies file a consolidated income tax return, and income taxes are allocated to the companies on the basis of their taxable income.
F-11
FCSTONE GROUP, INC. AND SUBSIDIARIES
NOTES TO CONSOLIDATED FINANCIAL STATEMENTS—(Continued)
Deferred tax assets and liabilities are recognized for the future tax consequences attributable to differences between the consolidated financial statement carrying amounts of existing assets and liabilities and their respective tax bases and are measured using enacted tax rates expected to apply to taxable income in the years in which those temporary differences are expected to be recovered or settled. The effect of a change in tax rates on deferred tax assets and liabilities is recognized in income in the period that includes the enactment date. Valuation allowances will be recorded to reduce deferred tax assets when is more likely than not that a tax benefit will not be realized.
RECLASSIFICATIONS
Certain amounts in the fiscal year 2004 and 2005 consolidated financial statements have been reclassified. Revenues generated from ocean vessel dockage and related income in our grain merchandising segment have been reclassified to other income from sales of commodities. Expenses related to the dock facility in our grain merchandising segment have been reclassified from cost of commodities sold to the applicable expense. These reclassifications are not significant and are intended to result in revenues and costs associated with grain merchandising that better reflect the purchases and delivery of grain, excluding revenues and expenses that are ancillary to those operations.
2. EXCHANGE MEMBERSHIPS AND STOCK
The Company has exchange memberships seats on the Chicago Board of Trade, the Board of Trade of Kansas City, Missouri, Inc., the Minnesota Grain Exchange, and the New York Mercantile Exchange. Additionally, the Company holds stock of the Chicago Mercantile Exchange and the New York Mercantile Exchange. These exchange memberships and stock provide FCStone the right to process trades directly with the various exchanges. The exchange memberships and stock are recorded at cost, in accordance with U.S. GAAP and Commodity Futures Trading Commission (CFTC) regulations.
3. SEGREGATED REQUIREMENTS
Pursuant to the requirements of the Commodity Exchange Act, funds deposited by customers of FCStone relating to futures contracts in regulated commodities must be carried in separate accounts which are designated as segregated customers’ accounts. Certain amounts in the accompanying table reflect reclassifications and eliminations required for regulatory filing and as a result, may differ from those presented in the accompanying consolidated statements of financial position. Funds deposited by customers and other assets, which have been aggregated as belonging to the commodity customers at August 31, 2005 and 2006, are as follows:
| | | | | | |
| | | 2005
| | 2006
|
Cash-segregated | | $ | 9,818,297 | | $ | 12,388,880 |
Marketable securities, at fair value—customer segregated | | | 191,951,270 | | | 149,234,280 |
Marketable securities held at a bank classified in commodity deposits and accounts receivable from commodity exchanges and clearing organizations | | | 27,056,721 | | | 19,428,569 |
Commodity deposits and accounts receivable from commodity exchanges and clearing organizations, including marketable securities, net of omnibus eliminations | | | 365,906,721 | | | 576,799,335 |
Securities held for customers in lieu of cash | | | — | | | 6,995,610 |
| | |
|
| |
|
|
Total customer segregated funds | | | 594,733,009 | | | 764,846,674 |
| | |
Amount required to be segregated | | | 571,451,661 | | | 727,680,363 |
| | |
|
| |
|
|
Excess funds in segregation | | $ | 23,281,348 | | $ | 37,166,311 |
| | |
|
| |
|
|
F-12
FCSTONE GROUP, INC. AND SUBSIDIARIES
NOTES TO CONSOLIDATED FINANCIAL STATEMENTS—(Continued)
Funds deposited by customers and other assets, which are held in separate accounts for foreign futures, and foreign options customers at August 31, 2005 and 2006 are as follows:
| | | | | | |
| | | 2005
| | 2006
|
Cash-segregated | | $ | 100,000 | | $ | 136,735 |
Equities with registered futures commissions merchants | | | 72,625 | | | 222,024 |
Amounts held by members of foreign boards of trade | | | 787,224 | | | 2,661,020 |
| | |
|
| |
|
|
| | | | 959,849 | | | 3,019,779 |
| | |
Amount required to be segregated | | | 130,584 | | | 1,583,764 |
| | |
|
| |
|
|
Excess funds in segregation | | $ | 829,265 | | $ | 1,436,015 |
| | |
|
| |
|
|
4. INCOME TAXES
Income tax expense consists of current and deferred taxes as follows:
| | | | | | | | | | | | |
| | | 2004
| | | 2005
| | | 2006
| |
Current: | | | | | | | | | | | | |
Federal | | $ | 2,425,700 | | | $ | 4,027,000 | | | $ | 10,549,000 | |
State and local | | | 256,300 | | | | 373,000 | | | | 925,000 | |
| | |
|
|
| |
|
|
| |
|
|
|
Total current | | | 2,682,000 | | | | 4,400,000 | | | | 11,474,000 | |
| | |
|
|
| |
|
|
| |
|
|
|
Deferred: | | | | | | | | | | | | |
Federal | | | (615,700 | ) | | | (402,000 | ) | | | (1,962,000 | ) |
State and local | | | (36,300 | ) | | | (48,000 | ) | | | (12,000 | ) |
| | |
|
|
| |
|
|
| |
|
|
|
Total deferred | | | (652,000 | ) | | | (450,000 | ) | | | (1,974,000 | ) |
| | |
|
|
| |
|
|
| |
|
|
|
Total income tax expense | | $ | 2,030,000 | | | $ | 3,950,0000 | | | $ | 9,500,000 | |
| | |
|
|
| |
|
|
| |
|
|
|
Total income tax expense differs from the “expected” tax expense computed by applying the federal income tax rate of 34% in fiscal years 2004 and 2005 and 35% in fiscal year 2006 to earnings before income tax expense as follows:
| | | | | | | | | | |
| | | 2004
| | | 2005
| | 2006
|
“Expected” tax expense | | $ | 2,870,937 | | | $ | 3,580,247 | | $ | 8,664,950 |
Patronage refund deduction | | | (1,002,609 | ) | | | — | | | — |
State income tax | | | 145,300 | | | | 214,500 | | | 593,450 |
Non-deductible items and other | | | 16,372 | | | | 155,253 | | | 241,600 |
| | |
|
|
| |
|
| |
|
|
Income tax expense | | $ | 2,030,000 | | | $ | 3,950,000 | | $ | 9,500,000 |
| | |
|
|
| |
|
| |
|
|
The tax effects of temporary differences that give rise to deferred income tax assets are:
| | | | | | |
| | | 2005
| | 2006
|
Pension liability | | $ | 2,182,500 | | $ | 1,590,029 |
Deferred compensation | | | 1,440,100 | | | 2,148,600 |
Bad debt reserve | | | 243,000 | | | 532,800 |
All other assets | | | 147,100 | | | 425,096 |
| | |
|
| |
|
|
Net deferred tax assets | | $ | 4,012,700 | | $ | 4,696,525 |
| | |
|
| |
|
|
F-13
FCSTONE GROUP, INC. AND SUBSIDIARIES
NOTES TO CONSOLIDATED FINANCIAL STATEMENTS—(Continued)
Based on the level of historical taxable income and projections for future taxable income over the periods in which the deferred tax assets are deductible, management believes it is more likely than not that the Company will realize the benefits of these deductible differences. As such, no valuation allowances have been provided.
5. EARNINGS PER SHARE
Earnings per share has been presented in the accompanying Consolidated Statement of Operations. Basic earnings per shares excludes dilution and is computed by dividing the applicable net earnings by the weighted average number of common shares outstanding for the period. Diluted earnings per share is calculated based on the weighted average shares of common stock as adjusted for the potential dilutive effect of stock options. Stock-based compensation arrangements, including options, are considered to be outstanding as of the grant date for purposes of computing diluted earnings per share. Options to purchase 400,000 shares of common stock at $24.76 per share (see Note 7) were outstanding during the fourth quarter of 2006 but were not included in the computation of diluted EPS. As the Company’s common stock is not traded on a public exchange, there has been no change between the fair value of the options at the grant date that would give rise to a dilutive effect. The calculation of the basic and diluted shares outstanding for the year ended August 31, 2005, assumes the shares issued as a result of the restructuring (see Note 10) had been issued and outstanding for the full year. Prior to the conversion from a cooperative to a corporation, per share data had been omitted because, under the cooperative structure, earnings of the Company were distributed as patronage dividends to members based on the level of business conducted with the Company as opposed to a common shareholder’s proportionate share of underlying equity in the Company. Under the corporate structure, earnings of the Company may be distributed to shareholders based on their proportionate share of underlying equity.
6. RETIREMENT PLANS
The Company has a noncontributory retirement plan, which is a defined benefit plan that covers substantially all employees. Effective April 1, 2006, such plan was closed to new employees hired subsequent to the April 1, 2006 date. Additionally, the Company has a nonqualified noncontributory retirement plan covering certain executive employees. The Company’s policy is to fund amounts that are intended to provide for benefits attributed to service to date.
F-14
FCSTONE GROUP, INC. AND SUBSIDIARIES
NOTES TO CONSOLIDATED FINANCIAL STATEMENTS—(Continued)
The following table presents changes in, and components of, the Company’s net liability for retirement costs:
| | | | | | | | | | | | |
Changes in Benefit Obligation
| | 2004
| | | 2005
| | | 2006
| |
Benefit obligation at beginning of year | | $ | 17,536,068 | | | $ | 19,363,500 | | | $ | 25,197,577 | |
Service cost with interest | | | 1,624,129 | | | | 1,708,926 | | | | 2,043,529 | |
Interest cost | | | 988,797 | | | | 1,143,801 | | | | 1,315,018 | |
Assumption changes | | | (769,016 | ) | | | 3,403,226 | | | | (4,064,592 | ) |
Actuarial (gain)/loss | | | 245,927 | | | | (132,427 | ) | | | 1,664,380 | |
Benefits paid | | | (262,405 | ) | | | (289,449 | ) | | | (299,257 | ) |
| | |
|
|
| |
|
|
| |
|
|
|
Benefit obligation at end of year | | | 19,363,500 | | | | 25,197,577 | | | | 25,856,655 | |
| | |
|
|
| |
|
|
| |
|
|
|
| | | |
Changes in Plan Assets
| | | | | | | | | |
Fair value at beginning of year | | | 7,564,857 | | | | 10,881,775 | | | | 13,632,532 | |
Actual return | | | 1,391,001 | | | | 454,266 | | | | 1,174,254 | |
Employer contribution | | | 2,188,322 | | | | 2,585,940 | | | | 2,518,704 | |
Benefits paid | | | (262,405 | ) | | | (289,449 | ) | | | (299,257 | ) |
| | |
|
|
| |
|
|
| |
|
|
|
Fair value at end of year | | | 10,881,775 | | | | 13,632,532 | | | | 17,026,233 | |
| | |
|
|
| |
|
|
| |
|
|
|
Funded status | | | (8,481,725 | ) | | | (11,565,045 | ) | | | (8,830,422 | ) |
Unrecognized net obligation | | | 584,620 | | | | 584,620 | | | | 417,203 | |
Unrecognized actuarial (gain)/loss | | | 7,189,412 | | | | 10,855,102 | | | | 7,466,293 | |
Contributions from measurement date to fiscal year end | | | 867,120 | | | | 419,784 | | | | 619,784 | |
Minimum liability | | | (3,755,667 | ) | | | (6,702,314 | ) | | | (2,811,548 | ) |
| | |
|
|
| |
|
|
| |
|
|
|
Accrued pension cost | | $ | (3,596,240 | ) | | $ | (6,407,853 | ) | | $ | (3,138,690 | ) |
| | |
|
|
| |
|
|
| |
|
|
|
A change in the minimum pension liability resulted in a $1,515,912 after-tax reduction of comprehensive income in 2005 and a $2,599,640 after-tax increase in other comprehensive income in 2006.
The following table displays FCStone Group, Inc.’s plans that have accumulated benefit obligations and projected benefit obligations in excess of plan assets:
| | | | | | |
| | | August 31,
|
| | | 2005
| | 2006
|
Accumulated benefit obligations | | $ | 20,460,169 | | $ | 20,784,707 |
| | |
|
| |
|
|
Projected benefit obligations | | | 25,197,577 | | | 25,856,655 |
| | |
|
| |
|
|
Plan assets | | | 13,632,532 | | | 17,026,233 |
| | |
|
| |
|
|
The retirement benefit obligation was based upon an annual measurement date of June 30. The following weighted-average assumptions were used to determine benefit obligations in the accompanying statements of financial condition as of August 31, 2005 and 2006:
| | | | | | |
| | | 2005
| | | 2006
| |
Weighted-average assumptions: | | | | | | |
Discount rate | | 5.25 | % | | 6.25 | % |
Rate of compensation increase—based on age graded scale | | 2.50% to 7.20 | % | | 2.75% to 7.25 | % |
F-15
FCSTONE GROUP, INC. AND SUBSIDIARIES
NOTES TO CONSOLIDATED FINANCIAL STATEMENTS—(Continued)
The following weighted-average assumptions were used to determine net periodic pension cost for the years ended August 31, 2004, 2005 and 2006:
| | | | | | | | | |
| | | 2004
| | | 2005
| | | 2006
| |
Weighted-average assumptions: | | | | | | | | | |
Discount rate | | 6.00 | % | | 6.25 | % | | 5.25 | % |
Expected return on assets | | 8.50 | % | | 8.50 | % | | 8.50 | % |
Rate of compensation increase—based on age graded scale | | 3.50% to 7.20 | % | | 3.50% to 7.20 | % | | 2.50% to 7.20 | % |
To account for our defined benefits pension plan in accordance with SFAS No. 87, we must make three main determinations at the end of each year: First, we must determine the actuarial assumptions for the discount rate used to reflect the time value of money in the calculation of the projected benefit obligations for the end of the current fiscal year and to determine the net periodic pension cost for the subsequent fiscal year. For guidance in determining the rate, we look at rates of return on high-quality fixed-income investments and periodic published rate ranges.
Second, we must determine the actuarial assumption for rates of increase in compensation levels used in the calculation of the accumulated and projected benefit obligation for the end of the current fiscal year and to determine the net periodic pension cost for the subsequent fiscal year. The salary growth assumptions reflect our long-term actual experience, the near-term outlook and assumed inflation. Retirement and mortality rates are based primarily on actual plan experience and standard industry actuarial tables, respectively.
Third, we must determine the expected long-term rate of return on assets assumption that is used to determine the expected return on plan assets component of the net periodic pension cost for the subsequent year. The expected returned on plan assets reflects asset allocation, investment strategy and the view of investment managers and other large pension plan sponsors.
The expected long-term rate of return on asset assumption was determined, with the assistance of the Company’s investment consultants, based on a variety of factors. These factors include, but are not limited to, the plan’s asset allocations, a review of historical capital market performance, historical plan performance, current market factors such as inflation and interest rates, and a forecast of expected future asset returns. The Company reviews this long-term assumption on a periodic basis.
The components of retirement benefit costs recognized in the consolidated statements of operations were as follows:
| | | | | | | | | | |
| | | 2004
| | 2005
| | | 2006
|
Service cost | | $ | 1,624,129 | | $ | 1,708,926 | | | $ | 2,043,529 |
Interest cost | | | 988,797 | | | 1,143,801 | | | | 1,315,018 |
Less: Actual return on assets | | | 1,391,001 | | | 454,266 | | | | 1,174,254 |
Net amortization and deferral | | | 1,293,586 | | | (79,103 | ) | | | 862,786 |
| | |
|
| |
|
|
| |
|
|
| | | $ | 2,515,511 | | $ | 2,319,358 | | | $ | 3,047,079 |
| | |
|
| |
|
|
| |
|
|
F-16
FCSTONE GROUP, INC. AND SUBSIDIARIES
NOTES TO CONSOLIDATED FINANCIAL STATEMENTS—(Continued)
The following table sets forth the actual asset allocation for the years ended August 31, 2005 and 2006, and the target asset allocation for the Company’s plan assets:
| | | | | | | | | |
| | | August 31,
| | | Target Asset Allocation (1)
| |
| | | 2005
| | | 2006
| | |
Equity securities | | 73 | % | | 72 | % | | 65% to 75 | % |
Debt securities | | 27 | % | | 28 | % | | 25% to 35 | % |
Total | | 100 | % | | 100 | % | | | |
| (1) | The long-term goal for equity exposure and for fixed income exposure is within the limits presented. The exact allocation at any point in time is at the discretion of the investment manager, but should recognize the need to satisfy both the volatility and the rate of return objectives for equity exposure, and satisfy the objective of preserving capital for the fixed income exposure. |
The Company expects to contribute approximately $2.5 million to the pension plan during 2007.
The following benefit payments, which reflect expected future service, are expected to be paid:
| | | |
Fiscal Year
| | Pension Benefits
|
2007 | | $ | 405,673 |
2008 | | | 485,429 |
2009 | | | 581,829 |
2010 | | | 702,291 |
2011 | | | 851,468 |
2012 – 2016 | | | 6,733,810 |
The Company participates in a 401(k) plan in the Thrift/Savings Plan for Cooperatives and the FCStone Group Employee Stock Ownership Plan, both defined contribution plans. The Company contributed approximately $813,000, $913,000 and $1,039,000 to these plans during 2004, 2005, and 2006, respectively.
F-17
FCSTONE GROUP, INC. AND SUBSIDIARIES
NOTES TO CONSOLIDATED FINANCIAL STATEMENTS—(Continued)
7. STOCK AWARD PLAN
On May 2, 2006, FCStone Group, Inc.’s Board of Directors approved the FCStone Group, Inc. 2006 Equity Incentive Plan (the “Plan”). The Plan permits the issuance of shares of the Company’s common stock to key employees and non-employee directors, pursuant to awards granted under the Plan, such as stock options, restricted stock awards, restricted stock units and performance share awards, as well as other stock-based awards. At August 31, 2006, 350,000 shares were available for issuance under the Plan.
Non-qualified Stock Options—Options granted to date under the plan were granted at a strike price of $24.76 as determined contemporaneously by an independent valuation firm. In reliance upon such valuation and pursuant to the Plan, on June 13, 2006 the Compensation Committee of the Board of Directors of the Company granted nonqualified stock options to purchase a total of 320,000 shares of Common Stock to executive officers and management employees of the Company and 80,000 shares of Common Stock to the non-employee directors of the Company. The options were 100% vested on the grant date and expire on June 13, 2016. A summary of the stock option activity is as follows:
| | | | | | | | | | |
| | | Options Outstanding
| | Weighted- Average Exercise Price
| | Options Exercisable
| | Weighted- Average Exercise Price
|
Balance at August 31, 2005 | | — | | | — | | — | | | — |
Options granted | | 400,000 | | $ | 24.76 | | | | | |
Options exercised | | — | | | — | | | | | |
Options forfeited | | — | | | — | | | | | |
| | |
| | | | | | | | |
Balance at August 31, 2006 | | 400,000 | | $ | 24.76 | | 400,000 | | $ | 24.76 |
| | |
| | | | | | | | |
Information regarding options outstanding at August 31, 2006 was as follows:
| | | | | | | | | | |
| | | Options Outstanding
| | Options Exercisable
|
Range of Exercise Prices
| | Options
| | Weighted Average
Exercise price
| | Weighted Average Remaining
Contractual Life
(in years)
| | Options
| | Weighted Average
Exercise price
|
| $24.76 | | 400,000 | | $24.76 | | 9.79 | | 400,000 | | $24.76 |
No options were granted during fiscal years 2004 and 2005. The value of the options granted during 2006 was determined under the minimum value method using a Black-Scholes pricing model and the significant assumptions used in this model were as follows:
| | | | |
| | | 2006
| |
Value of options | | $ | 0.30 | |
Volatility | | | 0.00 | % |
Risk free interest rate | | | 4.95 | % |
Expected life | | | 5 years | |
Expected dividend yield on date of grant | | | 4.6 | % |
Total stock-based compensation expense related to options issued to executive officers and management employees of the Company and non-employee directors of the Company under the minimum value method was $120,000 in the year ended August 31, 2006.
F-18
FCSTONE GROUP, INC. AND SUBSIDIARIES
NOTES TO CONSOLIDATED FINANCIAL STATEMENTS—(Continued)
8. ADJUSTED NET CAPITAL REQUIREMENTS
Pursuant to the rules, regulations, and requirements of the Commodity Futures Trading Commission and other regulatory agencies, FCStone is required to maintain certain minimum net capital as defined in such rules, regulations, and requirements. Net capital and the related net capital requirement may fluctuate on a daily basis. FCStone’s adjusted net capital and minimum net capital requirement at August 31, 2005 and 2006 were as follows:
| | | | | | |
| | | 2005
| | 2006
|
Adjusted net capital | | $ | 24,935,736 | | $ | 31,311,896 |
Minimum net capital requirement | | $ | 17,480,009 | | $ | 21,869,555 |
The rules, regulations, and requirements of the Commodity Futures Trading Commission prohibit the withdrawal of equity if, after giving effect to such withdrawal and capital reductions which are scheduled to occur within six months, adjusted net capital is less than the greater of 120% of the minimum financial requirements of the CFTC or any self-regulatory organization of which FCStone is a member.
FCC Investments, Inc. is required to maintain certain net capital as defined by the Securities and Exchange Commission. At August 31, 2005 and 2006, FCC Investments net capital was $385,603 and $434,561, respectively. The minimum net capital requirement was $250,000 at August 31, 2005 and 2006, respectively.
9. COMMITMENTS
FCStone leases office space, equipment, automobiles, and an airplane under noncancelable operating leases which expire on various dates through 2012. Most of the leases provide that FCStone pay taxes, maintenance, insurance, and other expenses. At August 31, 2006, minimum rental payments due under operating leases were approximately as follows: 2007, $1,973,000; 2008, $1,697,000; 2009, $1,111,000; 2010, $650,000; and 2011 and beyond, $2,352,000.
The rental expense under the above operating leases was approximately $1,862,000, $2,290,000 and $2,361,000, in 2004, 2005 and 2006, respectively.
FCStone Financial leases covered hopper cars and, in turn, subleases these cars to a railroad company. The lease renewed for a three-year period effective October 1, 2005, and has been classified as an operating lease. Rental expense, excluding mileage credits and maintenance costs, under this lease totaled approximately $642,000, $656,000, and $1,066,000 in 2004, 2005 and 2006, respectively. Future minimum lease payments under this operating lease are approximately $1,106,000 in 2007; $1,106,000 in 2008; and $92,000 in 2009. The sublease also was renewed on a cancelable basis for a three year period effective October 1, 2005. Sublease rental income, excluding mileage credits and maintenance costs, totaled approximately $830,000, $831,000, and $1,188,000 in 2004, 2005 and 2006, respectively. Future minimum lease payments expected to be received under the sublease subsequent to August 31, 2006 are approximately $1,222,000 in 2007; $1,222,000 in 2008; and $102,000 in 2009.
FGDI is party to a capital lease agreement for grain bins in Mobile, Alabama. The capitalized asset was placed into service during September, 2005 and is being depreciated over the lease term. FGDI made payments on the lease equal to $687,500, $550,000, and $550,000 during 2004, 2005 and 2006, respectively. In addition, the Company pays interest on the Industrial Development Revenue Bonds which amounted to approximately $91,000, $82,000, and $92,000 in 2004, 2005, and 2006, respectively. The lease expires December 1, 2012 and annual minimum lease payments are equal to $550,000.
F-19
FCSTONE GROUP, INC. AND SUBSIDIARIES
NOTES TO CONSOLIDATED FINANCIAL STATEMENTS—(Continued)
FGDI also leases grain storage facilities under various operating leases with expiration dates ranging from August 31, 2005 through September 30, 2013. The terms of the operating lease for grain facilities in Mobile, Alabama, require an annual lease commitment of $800,000, which is included in the future minimum rental payments below. Payment of the annual lease amount, or a portion thereof, must be made in the instances where annual rail service and dockage income collected by the lessor, relating to the facilities’ volume of grain bushels handled, does not cover the annual lease amount. Additionally, the minority owner of FGDI has agreed to load a certain minimum number of bushels through the facility. Cash receipts by the lessor, associated with elevation of the member bushels, have been adequate to fund the minimum lease payment for the years ending August 31 2004, 2005 and 2006.
FGDI leases covered hopper cars for use in its Ohio operations under various operating leases from unrelated parties, with term ranging from twelve to sixty months. Rental expenses under these leases, which are included in cost of commodities sold, totaled approximately $2,000,000, $2,800,000, and $3,200,000 in 2004, 2005 and 2006, respectively.
FGDI’s approximate future minimum rental payments for the above facilities and railcars for subsequent fiscal years are approximately as follows: 2007, $4,639,000; 2008, $3,903,000; 2009, $2,600,000; 2010, $2,110,000; and 2011, $1,647,000.
FGDI leases various office space and grain storage facilities under year-to-year operating leases. Rental expense for these offices and facilities was approximately $415,000, $542,000, and $609,000 in 2004, 2005 and 2006, respectively. FGDI also rents equipment periodically throughout the year under day-to-day agreements. Rent expense for equipment and machinery was approximately $48,000, $51,000, and $64,000 in 2004, 2005 and 2006, respectively.
In the event the counterparty is unable to meet its contractual obligations, FCStone Trading may be exposed to the risk of purchasing energy related products at prevailing market prices. To mitigate this risk, FCStone Trading has purchased credit default swaps and credit insurance that provides some coverage against counterparty risk. FCStone Trading records the insurance or premium paid for swaps as a prepaid asset, which is amortized over the life of the policy or contract. At August 31, 2005 and 2006, FCStone Trading held 13 and 14 credit default swaps with a reported value of $196,752 and $125,893, respectively. The fair value of these swaps at August 31, 2005 and 2006 was consistent with the amounts reported. FCStone Trading has not experienced any significant recoveries under these arrangements in 2004, 2005, or 2006. Customer credit risk is mitigated through the collection of margin deposits.
During 2006, FCStone Trading entered into offsetting contracts with two parties to acquire and deliver fuel under a fixed price arrangement. FCStone Trading does not take possession of the fuel and recognizes a margin on the purchase and sale at each delivery date.
FCStone Merchant Services has a noncancelable operating lease for office space in New Jersey. The lease is for an initial three year term expiring on June 30, 2007. The lease contains a renewal option for an additional five year term and requires payment of all executory costs, such as maintenance and liability insurance. Rent expense associated with this lease totaled approximately $66,000 and in 2005 and 2006, respectively. Future minimum lease payments under the lease for the years subsequent to August 31, 2006 are $55,000.
F-20
FCSTONE GROUP, INC. AND SUBSIDIARIES
NOTES TO CONSOLIDATED FINANCIAL STATEMENTS—(Continued)
10. STOCKHOLDERS’ EQUITY
On March 1, 2005, the voting stockholder/members of the Company approved the restructuring of the Company by terminating the Company’s cooperative status and ending the patronage-based rights accruing to the Company’s members. Pursuant to the restructuring, stockholders and subscribers received on April 15, 2005, 500 shares of new common stock for each fully-paid share of Class A common stock, $5,000 par value, 10,000 shares of new common stock for each fully-paid share of Class B common stock, $100,000 par value, one share of new common stock for each $10.00 of paid subscription and one share of new common stock for each $10.00 par value of preferred stock held. Membership interests in the Company represented by patronage-based rights as of August 31, 2004, were converted on April 15, 2005 into (i) shares of new common stock based on an appraised value and relative patronage; and (ii) subscription rights exercisable at a purchase price of $10.00 per share within 60 days after the distribution of new common stock and subscription rights. The Company distributed 4,310,237 shares of new common stock on April 15, 2005 pursuant to the restructuring. The Company commenced the subscription rights offering on April 15, 2005 and the offering continued until June 29, 2005 with 174,372 shares sold and $1,743,720 of equity raised.
In June 2005, the Company formed an employee stock ownership plan (ESOP) and filed a Form S-8 Registration Statement in order to provide employee incentives and an additional capital infusion to the Company. Generally, employees of the Company or any participating affiliates who meet the criteria defined in the ESOP are eligible. Eligible participants were able to elect to make a one-time irrevocable transfer of a portion of their 401(k) Plan to the ESOP. The amount of the transfer was limited to no more than one-third (1/3) of the eligible participant’s 401(k) Plan account balance. The ESOP intends to operate on a plan year which corresponds to the calendar year. For plan years beginning after December 31, 2005, the Company will make matching contributions to the ESOP in an amount equal to 50% of each participant’s eligible elective deferral contribution to the 401(k) Plan. Dividends received with respect to shares of Company Stock allocated to participants’ accounts in the ESOP will be credited to such participants’ accounts annually on the basis of the number of shares of Company Stock allocated to each such participant’s account. The initial ESOP stock sale was consummated as of August 26, 2005, with the ESOP purchasing from the Company 448,692 shares of common stock at a purchase price of $10.00 per share, for an aggregate of $4,486,920. All shares held by the ESOP are treated as outstanding in computing earnings per share. In the event a terminated plan participant, whether by death, disability, retirement or other termination, desires to sell his or her shares of Company stock, the Company may be required to purchase the shares from the participant at their appraised value at that time. To the extent that shares of common stock held by the ESOP are not readily tradeable, a sponsor must reflect the maximum cash obligation related to those securities outside of stockholders’ equity as temporary equity.
As of August 31, 2005 and 2006, the shares held by the ESOP, fair value and maximum cash obligation were as follows:
| | | | | | |
| | | 2005
| | 2006
|
Shares held by the ESOP | | | 448,692 | | | 466,149 |
Fair value per share | | $ | 10.00 | | $ | 13.04 |
Maximum cash obligation | | $ | 4,486,920 | | $ | 6,078,583 |
On August 15, 2005, we purchased 103,922 shares of the common stock of the Company held by Farmland Industries pursuant to an auction held by Farmland’s liquidating trustee and the approval of the bankruptcy court. The aggregate purchase price for the purchase of these shares was $605,000, or $5.82 per share. We do not have a plan or program for the purchase of shares of the Company’s common stock.
F-21
FCSTONE GROUP, INC. AND SUBSIDIARIES
NOTES TO CONSOLIDATED FINANCIAL STATEMENTS—(Continued)
11. NOTES PAYABLE
Notes payable outstanding at August 31, 2005 and 2006 consisted of the following:
| | | | | | | | | | | |
| | | Renewal /
Expiration Date
| | Amount Available
| | Amount Outstanding at August 31,
|
| | | | | 2005
| | 2006
|
| | | | | (in millions) | | | | |
Margin Call Facilities: | | | | | | | | | | | |
Deere Credit, Inc. | | March 1, 2007 | | $ | 36.75 | | $ | — | | $ | — |
Harris, N.A. | | January 31, 2007 | | | 35.0 | | | — | | | — |
CoBank, ACB | | December 31, 2007 | | | 20.0 | | | — | | | — |
Commodity Merchandising Facilities: | | | | | | | | | | | |
CoBank, ACB | | December 31, 2007 | | | 68.0 | | | 6,004,545 | | | 20,992,636 |
AFG Trust Finance Limited | | May 25, 2007 | | | 8.0 | | | 3,586,792 | | | 4,057,937 |
Commodity Financing Facilities: | | | | | | | | | | | |
Deere Credit, Inc. | | March 1, 2007 | | | 96.0 | | | 17,778,000 | | | 7,100,000 |
CoBank, ACB | | May 1, 2007 | | | 75.0 | | | 4,833,000 | | | 3,405,000 |
Fortis Capital Corp. | | Demand | | | 20.0 | | | — | | | 1,116,000 |
RZB Finance, LLC | | Demand | | | 8.0 | | | — | | | 1,068,000 |
Bank of Tokyo-Mitsubishi UFJ, Ltd | | Demand | | | 10.0 | | | — | | | — |
Standard Chartered Bank, New York | | Demand | | | 20.0 | | | — | | | — |
Other borrowings: | | | | | | | | | | | |
Deere Credit, Inc. | | October 1, 2009 | | | 10.25 | | | 4,250,000 | | | 10,250,000 |
Long-term Note | | December 31, 2012 | | | 0.5 | | | 458,550 | | | 179,452 |
| | | | | | | |
|
| |
|
|
Total | | | | | | | $ | 36,910,887 | | $ | 48,169,025 |
| | | | | | | |
|
| |
|
|
Margin Call Facilities
FCStone has an unsecured line of credit with Deere Credit, Inc. (Deere Credit) to be used for margin calls, if necessary. The margin call line of credit is subject to annual review, and continued availability of this line of credit is subject to the Company’s financial condition and operating results continuing to be satisfactory to Deere Credit. Borrowings under this line are on a demand basis and bear interest at 0.35% under the Prime rate or base rate of interest established by Citibank, N.A. Unused portions of the credit facility require a commitment fee of .15% on the unused commitment.
FCStone has unsecured lines of credit with Harris, N.A. (Harris) to be used for margin calls and commodity deliveries, if necessary. These lines of credit are subject to annual review and continued availability of these lines are subject to FCStone’s financial condition and operating results continuing to be satisfactory to Harris. Borrowings under this line are on a demand basis and bear interest at the prime rate as announced by Harris. Unused portions of the credit facility require a commitment fee of 1/4% on the unused commitment. Effective June 30, 2006, the amount available to borrow from Harris has been increased from $20,000,000 to $35,000,000 through December 31, 2006.
On January 25, 2006, FCStone Trading entered into a new master loan agreement with CoBank, ACB (CoBank). The agreement includes a revolving credit facility in the amount up to $10,000,000, which expires on December 30, 2006. Additionally, the agreement includes a revolving term loan in the amount up to $10,000,000, which expires on December 30, 2007. The purpose of these facilities is to provide funding for commodities risk management consulting services that FCStone Trading provides to its customers, primarily the payment of option
F-22
FCSTONE GROUP, INC. AND SUBSIDIARIES
NOTES TO CONSOLIDATED FINANCIAL STATEMENTS—(Continued)
premiums and margin calls on hedge and swap transactions entered into by the FCStone Trading on behalf of customers. Additionally, the revolving term loan provides funding for the issuance of letters of credit required by and for the benefit of certain swap transaction counterparties. Amounts outstanding under these credit facilities will bear interest at a rate of 1/4 of 1% below the National Variable Rate established by CoBank from time to time. Unused portions of the credit facility require a commitment fee of 1/4% on the unused commitment. The agreement contains financial covenants related to current assets in excess of current liabilities and total assets in excess of total liabilities, as defined. The loan agreement requires Trading to acquire and maintain nonvoting participation certificates in CoBank in amounts determined in accordance with CoBank’s bylaws and capital plan. These certificates are reported as investments in other organizations.
Commodity Merchandising Facilities
On March 28, 2006, the FGDI entered into a new master loan agreement with CoBank. The agreement includes a revolving credit facility for an amount of up to $68,000,000, to be used to finance inventory and receivables. The commitment expires March 28, 2007 and carries an interest rate on a variable basis indexed to LIBOR, as defined in the agreement, which was 7.56% at August 31, 2006. The agreement also includes a revolving term loan for an amount of up to $8,000,000, to be used to reimburse CoBank for any drafts that it may honor under issued letters of credit. The commitment expires March 28, 2008 and carries an interest rate on a variable basis indexed to LIBOR, as defined in the agreement. The credit facility and the term loan are secured by inventories, accounts receivable, and intangible properties. The agreement’s financial covenants include a minimum current ratio, a minimum net worth, and a maximum debt to adjusted working capital ratio. Additionally, FGDI is required to have at the end of each fiscal year, a minimum “Fixed Charge Coverage Ratio”. The FGDI was not in compliance with the annual fixed charge coverage ratio at August 31, 2006, but received a written waiver from CoBank for the fiscal year ended August 31, 2006. Unused portions of the credit facility require a commitment fee of .50% on the unused commitment. The loan agreement requires FGDI to acquire and maintain nonvoting participation certificates in CoBank in amounts determined in accordance with CoBank’s bylaws and capital plan. These certificates are reported as investments in other organizations.
On September 18, 2006, FGDI renewed its agreements with AFG Trust Finance Limited and AFG Trust Assets Limited for a United States dollar (USD) credit facility and a Chinese RenMinBi (RMB) credit facility, as well as an USD investment facility and a RMB investment facility. The USD credit facility carries an interest rate of the aggregate of the prime rate, as published by The Asian Wall Street Journal and .75% per annum, which was 9.0% at August 31, 2006. The credit facility is secured by all of the interest and rights in respect of the USD and RMB investment facilities with AFG Trust Assets Limited. The aggregate principal amounts of all the borrowings outstanding shall not exceed the lesser of the facility amount and the available limit, to be calculated as defined
in the agreement. There are no commitment fees associated with this line of credit and there have been no borrowings outstanding under the RMB credit facility.
Commodity Financing Facilities
On February 23, 2006, FCStone Financial amended its uncommitted line of credit agreement with Deere Credit, increasing the available amount to $96.0 million. The commitment expires on March 1, 2007, at which time it is FCStone Financial’s intent to renew this agreement. The line of credit carries an interest rate on a variable basis calculated based on the collateral quality of advances requested by FCStone Financial as defined in the agreement, which ranged from 7.50% to 8.25% at August 31, 2006. The line of credit is secured by inventories and accounts receivable. The agreement contains financial covenants related to current assets in excess of current liabilities and total assets in excess of total liabilities. FCStone Financial was in compliance with these requirements at August 31, 2006. In addition, FCStone Financial must obtain a Guaranty from FCStone Group, Inc. to meet minimum net worth levels at the end of each month and fiscal year. The Company
F-23
FCSTONE GROUP, INC. AND SUBSIDIARIES
NOTES TO CONSOLIDATED FINANCIAL STATEMENTS—(Continued)
maintains a limited corporate guarantee with Deere Credit to meet this obligation. There are no commitment fees associated with this line of credit.
On February 28, 2003, FCStone Financial entered into an uncommitted line of credit agreement with CoBank, ACB. The commitment expires on April 30, 2007, at which time it is FCStone Financial’s intent to renew this agreement. Interest under the agreement will be determined separately at the time advances are requested by FCStone Financial. At August 31, 2006, the line of credit was bearing interest at 7.46%. Under a subordination agreement dated February 28, 2003, borrowings under the line of credit with Deere Credit, discussed above, are subordinate to those under the line of credit with CoBank. The agreement contains financial covenants related to equity. FCStone Financial was in compliance with this requirement in 2006. In addition, the Company maintains a guarantee of payment agreement with CoBank with a maximum obligation of $1.5 million. The loan agreement requires FCStone Financial to acquire and maintain nonvoting participation certificates in CoBank in amounts determined in accordance with CoBank’s bylaws and capital plan. These certificates are reported as investments in other organizations. There are no commitment fees associated with this line of credit.
FCStone Merchant Services has an uncommitted line of credit agreement with RZB Finance (RZB) in the amount of $8.0 million, to be used for short term advances (Loans) and issuance of commercial letters of credit (L/C’s). The Loans and L/C’s shall be used to finance the purchase of inventory, by FCStone Merchant Services or by their customers, from suppliers and accounts receivable arising from the sale of inventory. FCStone Merchant Services has executed and delivered to RZB a general security agreement and related UCC 1 financing statements granting RZB a first priority perfected lien on all personal property of FCStone Merchant Services. Each Loan is payable on demand, and in no event shall be outstanding for more than 180 days. Loans under the facility bear interest at a variable rate determined in accordance with the terms of the agreement. At August 31, 2006, the line of credit was bearing interest at an annual rate of 8.0%. The fees for issuing L/C’s under the facility are determined in accordance with the terms of the agreement, with a minimum fee of $500. The agreement contains financial covenants related to FCStone Merchant Services’s tangible net worth, as defined. FCStone Merchant Services was in compliance with the requirement at August 31, 2006. No commitment fees were paid in 2006 under this facility.
FCStone Merchant Services has an uncommitted line of credit agreement with Fortis Capital Corp. (Fortis) in the amount of $20.0 million, to be used for loans and documentary and standby letters of credit (L/C’s). Each loan or L/C shall be used to finance self liquidating transactions involving the purchase, storage, hedging, and sale of grains, crude oil, natural gas, and petroleum products that are traded on commodities exchanges, as well as, repurchase agreements with counterparties acceptable to Fortis. FCStone Merchant Services’s obligation to Fortis is secured by a perfected security interest in all personal property and fixtures of FCStone Merchant
Services. All loans are payable on demand, and in no event shall be outstanding for more than 74 days, unless agreed by Fortis. Loans under the facility bear interest at a variable rate determined in accordance with the terms of the agreement. At August 31, 2006, the line of credit was bearing interest at an annual rate of 7.71%. The fees for issuing documentary L/C’s under the facility are determined in accordance with the terms of the agreement, with a minimum fee of $500. The fees for issuing trade and financial standby L/C’s shall be not less than a fee at a rate of 2.0% and 2.50%, respectively, of the daily average maximum undrawn face amount outstanding. The agreement contains financial covenants related to FCStone Merchant Services’s working capital and ratio of total outstanding loans and extensions of credit from all banks and institutions to tangible net worth, as defined. FCStone Merchant Services was in compliance with the requirements at August 31, 2006. No commitment fees were paid in 2006 under this facility.
FCStone Merchant Services has an uncommitted line of credit agreement with Bank of Toyko-Mitsubishi UFJ, Limited (BTMU) in the amount of $10.0 million, to be used for loans and commercial and standby letters of credit (L/C’s). Each loan or L/C shall be used to finance self liquidating transactions involving the purchase,
F-24
FCSTONE GROUP, INC. AND SUBSIDIARIES
NOTES TO CONSOLIDATED FINANCIAL STATEMENTS—(Continued)
storage, hedging, and sale of grains, crude oil, natural gas, and petroleum products that are traded on commodities exchanges, as well as, repurchase agreements with counterparties acceptable to BTMU. The facility is secured by a first priority lien on the inventory, accounts receivable, hedge contracts, and the proceeds from the specific commodity transaction financed. All loans are payable on demand, and in no event shall be outstanding for more than 364 days. Loans under the facility bear interest at a variable rate determined in accordance with the terms of the agreement. The fees for issuing commercial L/C’s under the facility are determined in accordance with the terms of the agreement, with a minimum fee of $500. The fees for issuing standby L/C’s under the facility are determined in accordance with the terms of the agreement, with a minimum fee of $250 for each ninety day period outstanding. No commitment fees were paid in 2006 under this facility.
FCStone Merchant Services has an uncommitted revolving credit facility agreement with Standard Chartered Bank, New York in the amount of $20.0 million, to be used for short term loans, the issuance of documentary and standby letters of credit, and letters of indemnity. Each loan or letter of credit shall be used to finance physical commodity transactions, including grains and energy products. The facility is secured by a first priority lien on the inventory, accounts receivable, hedge contracts, and the proceeds from the specific commodity transaction financed. All loans are payable on demand, and in no event shall be outstanding for more than ninety days, with provisions for rollovers if necessary. Loans under the facility bear interest at a variable rate determined in accordance with the terms of the agreement. The fees for issuing documentary and standby letters of credit under the facility are determined in accordance with the terms of the agreement, with a minimum of $500. The agreement contains financial covenants related to FCStone Merchant Services’s tangible net worth, minimum working capital and maximum total leverage, as defined. FCStone Merchant Services was in compliance with the requirements at August 31, 2006. No commitment fees were paid in 2006 under this facility.
Other Borrowings
The Company has a general corporate unsecured line of credit agreement with Deere Credit. The availability of this line of credit is subject to the Company’s financial condition and operating results continuing to be satisfactory to Deere Credit. Borrowings under this line are on a demand basis and bear interest at a rate equal to 2.90% in excess of the LIBOR rate, as defined in the agreement. At August 31, 2006, the line of credit was bearing interest at 8.29%. Unused portions of the credit facility require a commitment fee of .50% on the unused commitment.
FCStone has an installment note payable to an individual, due $5,750 per month, including interest at a rate equal to 1.75% in excess of the Fed Funds rate as reported by the Wall Street Journal, with final payment due in December 2012. At August 31, 2006, the note was bearing interest at 7.01%. Payments required to be made on the installment note during the fiscal years ending 2007 through 2009 are $69,000, $69,000, and $41,452, respectively.
12. LETTERS OF CREDIT
FCStone Trading is required to provide letters of credit to certain customers and counterparties that can be drawn upon if there is a loss on the over-the-counter contracts. FCStone Trading has provided several letters of credit, under agreements with CoBank, in the aggregate amount of $7,375,000, with maturity dates that ranged from September 30, 2004 to September 30, 2006. To date, no counterparties have drawn down on these facilities. The agreements require commitment fees paid in advance, which are recorded as prepaid expenses and recognized over the life of the respective letter of credit. At August 31, 2006, FCStone Trading had $2,526,110 of cash restricted to collateralize a standby letter of credit with Harris in favor of a counterparty.
During 2003, the City of Mobile, Alabama, issued $5,500,000 of Industrial Development Revenue Bonds (Bonds) related to the construction of grain bins (see note 9), of which $3,575,000 remains outstanding. FGDI is
F-25
FCSTONE GROUP, INC. AND SUBSIDIARIES
NOTES TO CONSOLIDATED FINANCIAL STATEMENTS—(Continued)
required to maintain a bank letter of credit in the amount of approximately $4,000,000, which expires on August 31, 2006, subject to required renewal, to secure the Bonds. FGDI agrees to pay a standby letter of credit fee, payable annually and charged to interest expense ratably.
FCStone Merchant Services provides credit support on behalf of certain customers using arrangements such as documentary and standby letters of credit (see note 11). These arrangements enable customers to execute transactions or obtain desired financial arrangements with third parties. Should the customer fail to perform under the terms of the transaction or financing arrangement, FCStone Merchant Services would be required to perform on their behalf. The length of these credit support arrangements parallels the length of the related financing arrangements or transactions. FCStone Merchant Services has issued letters of credit in the amount of $7,417,000 and $10,394,180 at August 31, 2005 and 2006, respectively.
13. SUBORDINATED DEBT
FCStone has an unsecured subordinated debt line of credit with Deere Credit in the amount of $7,000,000 million. The subordinated revolving line of credit bears interest at the rate of 4.8% in excess of LIBOR, which was 10.19% at August 31, 2006. Unused portions of the credit facility require a commitment fee of 1/2 percent on the unused commitment. Borrowings outstanding under this line of credit were $4,000,000 and $6,000,000 at August 31, 2005 and 2006, respectively.
FCStone has several subordinated notes with various individuals, amounting to $1,500,000 and $1,000,000 at August 31, 2005 and 2006, respectively (see note 15). The notes are variable rate notes, and bear interest at a rate equal to the prime rate as published inThe Wall Street Journal, which was 8.25% at August 31, 2006. The notes mature on dates ranging from December 31, 2006 through June 30 2007, and are subordinated as defined by Commodity Futures Trading Commission Regulations.
14. CONTINGENCIES
The Company, from time to time, is involved in various legal matters considered normal in the course of its business. It is the Company’s policy to accrue for amounts related to these matters if it is probable that a liability has been incurred and an amount can be reasonably estimated. Although the outcome of such matters cannot be predicted with certainty and no assurances can be given with respect to such matters, the Company believes that the outcome of these matters in which it is currently involved will not have a materially adverse effect on its results of operations, liquidity, or financial position except as discussed below.
During 2004, FCStone LLC received approximately $600,000 in subrogation payments which were reimbursements for legal expenses incurred in previous years. Such amounts are reflected as a reduction of other expenses in the accompanying statement of operations.
On August 21, 2003, August 21, 2003, September 23, 2003, October 16, 2003, and July 16, 2004, Euro-Maritime Chartering, Inc. filed five separate claims under the arbitration facility established by the London Maritime Arbitrators Association of London, England, alleging a breach by FGDI of charter party agreements regarding five vessels and seeking to recover damages of $242,655, $230,863, $769,302, $649,031 and $403,167, respectively. Euro-Maritime Chartering alleges that these damages arise from detention and demurrage encountered at China ports with respect to cargos that FGDI sold to Chinese buyers. FGDI does not dispute the demurrage claims, which are estimated to total approximately $690,000. FGDI claims that, under the sales contracts with the Chinese buyers, any detention and demurrage charges were for the account of the buyers. FGDI has collected deposits from the Chinese buyers in the total amount of $669,436, which are being held pending resolution of the detention claims. FGDI intends to vigorously defend the detention claims and believes
F-26
FCSTONE GROUP, INC. AND SUBSIDIARIES
NOTES TO CONSOLIDATED FINANCIAL STATEMENTS—(Continued)
that it has meritorious defenses. If the claimant prevails on any of the detention claims, or otherwise in amounts above the corresponding deposit, FGDI expects to seek collection of such amounts from the buyers.
On December 13, 2003, Liaoyang Edible Oils filed a claim in arbitration under the arbitration facility established by the Federation of Oils, Seeds and Fats Associations Ltd. of Hong Kong alleging a breach of a sales contract by FGDI and seeking to recover damages of $1,125,000, of which $55,475 was not disputed as due under the contract. Liaoyang Edible Oils alleged that these damages arose out of disputes related to the final pricing of the contract. On December 15, 2005 the arbitration panel rendered a decision, dismissing the claim for pricing damages, but also doing its own accounting under the contract, and making an award to claimant, including interest and arbitration costs, of approximately $275,000. A partial award of attorneys’ fees and costs was also rendered in the decision, although this amount is yet to be quantified. FGDI has made an accrual related to this claim, based on current estimates. On January 25, 2006, the claimant filed an appeal, which under the arbitration rules governing this dispute, is deemed to be a request for a new hearing. FGDI intends to defend the appeal and seek an order that the award be upheld in its entirety, except for the accounting amount and except that each party should be ordered to bear its own legal costs. In addition, FGDI has cross appealed as to the amount determined by the arbitration panel.
On December 9, 2004, Xiamen Zhonge Industry Co., Ltd. (Xiamen) filed a claim in arbitration under the arbitration facility established by the Federation of Oils, Seeds and Fats Associations Ltd. of Hong Kong. Xiamen’s claim alleges that FGDI breached its duty to accept pricing instructions provided by Xiamen to FGDI. FGDI submitted a statement of defense and counterclaim to which Xiamen replied with a modified claim. The matter is now fully submitted and is awaiting decision.
On May 23, 2006, a former customer, Watseka Farmers Grain Cooperative Company, filed an action in the United States District Court, Central District of Illinois seeking actual damages, interest, punitive damages and general relief relating to losses on allegedly improper speculative trades ordered by the former general manager of the customer in a commodity futures account at FCStone, LLC. The customer was placed under supervision by Illinois state authorities in May 2004, after examination revealed deficiencies in its financial reporting and condition, and its assets were subsequently sold. We intend to vigorously defend this claim.
Management is currently unable to predict the outcome of these claims and, except as noted above, believes their current status does not warrant accrual under the guidance of Statement on Financial Accounting Standards No. 5,Accounting for Contingencies, since the amount of any liability is neither probable nor reasonably estimable. As such, except as noted above, no amounts have been accrued in the financial statements. Management intends to vigorously defend these claims and will continue to monitor the result of arbitration and assess the need for future accruals.
15. ACCOUNTS RECEIVABLE
During 2006, an FGDI customer located in Alabama declared bankruptcy. Assets were sold through a court administered auction. FGDI is uncertain as to the amount of its receivable that it can collect from this customer and has reserved the entire balance receivable through a $1.1 million charge to bad debt expense in 2006.
An FGDI customer located in Mexico failed to make timely payment on accounts owed to the Company in the amount of $2.9 million. Although this customer has subsequently provided a mortgage on real estate located in Mexico, based on available information, it appears probable that the Company will be unable to collect the amount due. As a result, the Company’s loss from this default is approximately $2.9 million, which has been recognized as a charge to bad debt expense during fiscal 2005. During November 2004, an FGDI customer located in Mexico failed to make timely payment on its receivables. As a result, the Company’s loss from this
F-27
FCSTONE GROUP, INC. AND SUBSIDIARIES
NOTES TO CONSOLIDATED FINANCIAL STATEMENTS—(Continued)
non payment default was $1.0 million. The Company recognized the loss through a $0.7 million charge to bad debt expense during fiscal 2005, in addition to $0.3 million previously recorded for this matter.
16. TRANSACTIONS WITH AFFILIATED COMPANIES
FCStone has entered into an agreement with FCTC to provide management services, including accounting, administrative, personnel, and office space. The Company receives a monthly fee plus 15% of net earnings of FCTC, which totaled approximately $207,000, $231,000, and $359,704 in 2004, 2005 and 2006, respectively.
The Company loaned monies to individuals who subsequently loaned the monies in the form of subordinated debt to FCStone, creating a financial interest which is required to enable FCStone to execute transactions through exchange membership seats held by these individuals on the Chicago Mercantile Exchange. At August 31, 2005 and 2006, $1,000,000 was outstanding under this arrangement, respectively.
17. FAIR VALUE OF FINANCIAL INSTRUMENTS
The carrying value of cash and cash equivalents, commodity and accounts and note receivables, marketable securities and payables contained in the Consolidated Statements of Financial Condition approximates their fair values due to the short-term nature of these instruments. Short-term borrowings and obligations under capital lease have variable rates which approximate fair value.
The fair value estimates presented herein are based on pertinent information available to management as of August 31, 2005 and 2006. Although management is not aware of any factors that would significantly affect the estimated fair value amounts, such amounts have not been comprehensively revalued for purposes of these financial statements since that date, and current estimates of fair value may be different significantly from the amounts presented herein.
18. OPERATING SEGMENT INFORMATION
The Company reports its operating segments based on services provided to customers, which includes Commodity and Risk Management Services, Clearing and Execution Services, Grain Merchandising, and Financial Services. The Commodity and Risk Management Services segment offers commodity services to its customers, with an emphasis on risk management using futures, options, and other derivative instruments. The Clearing and Execution Services segment offers low-cost clearing and direct execution services to commodities firms, fund operators, commodities traders and others. The Grain Merchandising segment acts as a dealer in, and manager of, physical grain and fertilizer in the United States and international markets. The Financial Services segment offers financing and facilitation for customers to carry grain and other commodities.
The accounting policies of the segments are the same as those described in the summary of significant accounting policies. The Company evaluates individual segment performance based on segment income or loss defined as the respective segment’s portion of the total Company’s income before taxes and minority interest.
Reconciling Amounts represent the elimination of interest income and expense, and commission income and expense between segments. Such transactions are conducted at market prices to more accurately evaluate the profitability of the individual business segments. Additionally, certain assets consisting primarily of commodity deposits and accounts receivable, notes receivable, and amounts due from affiliates between segments have been eliminated.
F-28
FCSTONE GROUP, INC. AND SUBSIDIARIES
NOTES TO CONSOLIDATED FINANCIAL STATEMENTS—(Continued)
The following table represents the significant items by operating segment for the results of operations for the years ended August 31, 2004, 2005, and 2006, respectively:
| | | | | | | | | | | | | | | | | | | | | | | | | |
| | | Commodity
& Risk
Management
Services
| | Clearing
&
Execution
Services
| | Grain
Merchandising
| | | Financial
Services
| | | Corporate
& Other
| | | Reconciling
Amounts
| | | Total
|
| | | (in thousands) |
2004 | | | | | | | | | | | | | | | | | | | | | | | | | |
Total revenues | | $ | 156,122 | | $ | 40,484 | | $ | 1,426,846 | | | $ | 2,517 | | | $ | 80 | | | $ | (1,735 | ) | | $ | 1,624,314 |
| | | | | | | |
Interest revenues | | | 1,345 | | | 1,412 | | | 68 | | | | 1,519 | | | | 10 | | | | (372 | ) | | | 3,982 |
Interest expense | | | 114 | | | 193 | | | 3,168 | | | | 1,262 | | | | 53 | | | | (372 | ) | | | 4,418 |
Income (loss) before minority interest and income tax expense | | | 7,907 | | | 3,359 | | | 2,230 | | | | (447 | ) | | | (4,029 | ) | | | — | | | | 9,020 |
Total assets | | | 212,430 | | | 289,651 | | | 98,306 | | | | 5,244 | | | | 10,836 | | | | (12,640 | ) | | | 603,827 |
2005 | | | | | | | | | | | | | | | | | | | | | | | | | |
Total revenues | | $ | 83,713 | | $ | 53,377 | | $ | 1,240,547 | | | $ | 25,775 | | | $ | 157 | | | $ | (1,722 | ) | | $ | 1,401,847 |
| | | | | | | |
Interest revenues | | | 3,131 | | | 4,124 | | | 153 | | | | 1,128 | | | | 125 | | | | (484 | ) | | | 8,177 |
Interest expense | | | 73 | | | 337 | | | 2,849 | | | | 937 | | | | 234 | | | | (484 | ) | | | 3,946 |
Income (loss) before minority interest and income tax expense | | | 11,160 | | | 5,152 | | | (2,037 | ) | | | 556 | | | | (4,800 | ) | | | — | | | | 10,031 |
Total assets | | | 356,341 | | | 380,422 | | | 80,569 | | | | 28,554 | | | | 8,887 | | | | (45,189 | ) | | | 809,584 |
2006 | | | | | | | | | | | | | | | | | | | | | | | | | |
Total revenues | | $ | 91,970 | | $ | 79,948 | | $ | 1,079,828 | | | $ | 45,905 | | | $ | (300 | ) | | $ | (2,546 | ) | | $ | 1,294,805 |
| | | | | | | |
Interest revenues | | | 9,610 | | | 10,702 | | | 693 | | | | 3,320 | | | | 279 | | | | (1,430 | ) | | | 23,174 |
Interest expense | | | 155 | | | 426 | | | 3,344 | | | | 2,716 | | | | 494 | | | | (1,430 | ) | | | 5,705 |
Income (loss) before minority interest and income tax expense | | | 21,937 | | | 10,981 | | | (430 | ) | | | (19 | ) | | | (7,938 | ) | | | — | | | | 24,531 |
Total assets | | | 395,001 | | | 581,709 | | | 87,461 | | | | 27,960 | | | | 16,140 | | | | (51,064 | ) | | | 1,057,207 |
A summary of the Company’s consolidated revenues by geographic area is presented below:
| | | | | | | | | |
| | | Consolidated Revenues (1)(000’s)
|
| | | 2004
| | 2005
| | 2006
|
United States | | $ | 883,159 | | $ | 692,556 | | $ | 718,247 |
China | | | 433,849 | | | 553,393 | | | 311,489 |
Japan (2) | | | 90,009 | | | — | | | 35 |
Canada | | | 79,874 | | | 59,868 | | | 74,419 |
Mexico | | | 96,661 | | | 63,491 | | | 45,530 |
Other countries | | | 40,762 | | | 32,539 | | | 145,085 |
| | |
|
| |
|
| |
|
|
Total | | $ | 1,624,314 | | $ | 1,401,847 | | $ | 1,294,805 |
| | |
|
| |
|
| |
|
|
| (1) | Revenues are attributed to countries based on location of customer. |
| (2) | In 2005 and 2006, no revenues from our grain merchandising segment were attributed to a customer located in Japan. As a result of a change in the location of the customer’s headquarters, the 2005 and 2006 revenues were attributed to the customer’s U.S. based affiliated entity. |
F-29
Mitsubishi is a significant customer for grain sold by FGDI, accounting for 6%, 6%, and 8% of consolidated total revenues for the years ended August 31, 2004, 2005, and 2006, respectively.
19. QUARTERLY FINANCIAL DATA (UNAUDITED)
Summarized quarterly data is set forth in the following table (in thousands):
| | | | | | | | | | | | | | | |
| | | Quarter
|
| | | First
| | Second
| | Third
| | Fourth
| | Total
|
2005 | | | | | | | | | | | | | | | |
Total revenues | | $ | 445,489 | | $ | 346,090 | | $ | 315,370 | | $ | 294,898 | | $ | 1,401,847 |
Income (loss) before minority interest and income tax expense | | | 1,572 | | | 3,222 | | | 3,552 | | | 1,685 | | | 10,031 |
Net income | | | 930 | | | 1,746 | | | 2,226 | | | 1,678 | | | 6,580 |
2006 | | | | | | | | | | | | | | | |
Total revenues | | $ | 350,009 | | $ | 268,861 | | $ | 358,798 | | $ | 317,137 | | $ | 1,294,805 |
Income (loss) before minority interest and income tax expense | | | 5,371 | | | 6,556 | | | 6,023 | | | 6,581 | | | 24,531 |
Net income | | | 3,383 | | | 3,936 | | | 4,051 | | | 3,887 | | | 15,257 |
As a result of the deterioration of the financial statements of an unaffiliated equity investment, which included a going concern opinion, the Company recorded a loss of $0.6 million in the fourth quarter of fiscal 2006 related to this unaffiliated equity investment.
20. SUBSEQUENT EVENTS
On October 6, 2006, a commodity pool limited partnership, which maintained its commodity account with the Company and for which a subsidiary of the Company acted as general partner and commodity pool operator, was unable to meet a margin call from assets of the pool. The resulting liquidation of pool positions under continuing adverse market conditions resulted in a deficit account balance of approximately $1.5 million. The company is seeking recourse from the commodity trading advisor, which was a former introducing broker of the Company, but the amount of possible recovery, if any, is unknown at this time. The Company expects to take a charge against income in the first quarter of the fiscal year ending August 31, 2007.
On November 2, 2006, the Company loaned an additional $600,000 to Green Diesel to finance the expanded facility.
On November 9, 2006, the Company’s board of directors declared a dividend of $1.25 per share on the 4,845,736 shares outstanding. The stock record date for such dividend payment was November 9, 2006, and the payment date is December 20, 2006.
On November 9, 2006, the Company issued a notice of redemption of 27,463 shares of common stock held by Watseka Grain Cooperative Company pursuant to Article IV, Section 3 of the Amended and Restated Articles of Incorporation of the Company at a redemption price of $13.35 per share. The Company claims a lien in the approximate amount of $254,000 against such proceeds relating to deficit amounts due to the Company.
On November 20, 2006, the Company’s agreement with Deere Credit, related to the general corporate unsecured line of credit, was amended, increasing the available amount by $3,000,000 making a total loan commitment of $13,250,000, with all other terms of the agreement remaining the same. Additionally, FCStone’s agreement with Deere Credit, related to the unsecured subordinated debt line of credit, was amended, increasing the available amount by $5,000,000 making a total loan commitment of $12,000,000, with all other terms of the agreement remaining the same.
F-30
SCHEDULE I
FCSTONE GROUP, INC.
CONDENSED STATEMENT OF FINANCIAL CONDITION
Parent Company Only
August 31, 2005 and 2006
(in thousands)
| | | | | | | | |
| | | 2005
| | | 2006
| |
| ASSETS | | | | | | | | |
Cash and cash equivalents | | $ | 420 | | | $ | 669 | |
Accounts receivable | | | 38 | | | | 219 | |
Notes receivable | | | 1,250 | | | | 1,325 | |
Notes receivable—subsidiaries | | | 1,000 | | | | 3,500 | |
Deferred income taxes | | | 4,013 | | | | 4,697 | |
Investments in affiliates and others | | | 54,865 | | | | 69,332 | |
| | |
|
|
| |
|
|
|
| | | $ | 61,586 | | | $ | 79,742 | |
| | |
|
|
| |
|
|
|
| LIABILITIES AND STOCKHOLDERS’ EQUITY | | | | | | | | |
Liabilities: | | | | | | | | |
Accounts payable | | $ | 25 | | | $ | 75 | |
Accrued expenses: | | | | | | | | |
Accrued pension liability | | | 5,965 | | | | 2,074 | |
Income taxes payable | | | 480 | | | | 1,555 | |
Other | | | 439 | | | | 207 | |
Notes payable | | | 4,250 | | | | 10,250 | |
| | |
|
|
| |
|
|
|
Total liabilities | | | 11,159 | | | | 14,161 | |
| | |
|
|
| |
|
|
|
Minority interest | | | 755 | | | | 607 | |
Redeemable common stock held by Employee Stock Ownership Plan | | | 4,487 | | | | 6,079 | |
| | |
Stockholders’ equity: | | | | | | | | |
Common stock, no par value | | | 21,524 | | | | 21,747 | |
Additional paid in capital | | | — | | | | 120 | |
Accumulated other comprehensive loss | | | (4,555 | ) | | | (1,955 | ) |
Retained earnings | | | 32,703 | | | | 45,062 | |
| | |
|
|
| |
|
|
|
| | | | 49,672 | | | | 64,974 | |
Less maximum cash obligation related to ESOP shares | | | (4,487 | ) | | | (6,079 | ) |
| | |
|
|
| |
|
|
|
Total stockholders’ equity | | | 45,185 | | | | 58,895 | |
| | |
|
|
| |
|
|
|
| | | $ | 61,586 | | | $ | 79,742 | |
| | |
|
|
| |
|
|
|
S-1
SCHEDULE I
FCSTONE GROUP, INC.
CONDENSED STATEMENT OF OPERATIONS
Parent Company Only
Years Ended August 31, 2004, 2005 and 2006
(in thousands)
| | | | | | | | | | | | | |
| | | 2004
| | 2005
| | | 2006
| | | |
Revenues: | | | | | | | | | | | | | |
Interest | | $ | 10 | | $ | 129 | | | $ | 283 | | | |
Equity in earnings of affiliates | | | 9,063 | | | 10,142 | | | | 24,839 | | | |
| | |
|
| |
|
|
| |
|
|
| | |
Total revenues | | | 9,073 | | | 10,271 | | | | 25,122 | | | |
| | |
|
| |
|
|
| |
|
|
| | |
Costs and expenses: | | | | | | | | | | | | | |
Interest | | | 53 | | | 234 | | | | 494 | | | |
Bank charges and miscellaneous | | | — | | | 6 | | | | 97 | | | |
| | |
|
| |
|
|
| |
|
|
| | |
Total costs and expenses | | | 53 | | | 240 | | | | 591 | | | |
| | |
|
| |
|
|
| |
|
|
| | |
Income before minority interest and income tax expense | | | 9,020 | | | 10,031 | | | | 24,531 | | | |
Minority interest | | | 576 | | | (499 | ) | | | (226 | ) | | |
| | |
|
| |
|
|
| |
|
|
| | |
Income before income tax expense | | | 8,444 | | | 10,530 | | | | 24,757 | | | |
Income tax expense | | | 2,030 | | | 3,950 | | | | 9,500 | | | |
| | |
|
| |
|
|
| |
|
|
| | |
Net income | | $ | 6,414 | | $ | 6,580 | | | $ | 15,257 | | | |
| | |
|
| |
|
|
| |
|
|
| | |
S-2
SCHEDULE I
FCSTONE GROUP, INC.
CONDENSED STATEMENTS OF CASH FLOWS
Parent Company Only
Years Ended August 31, 2004, 2005 and 2006
(in thousands)
| | | | | | | | | | | | |
| | | 2004
| | | 2005
| | | 2006
| |
Cash flows from operating activities: | | | | | | | | | | | | |
Net income | | $ | 6,414 | | | $ | 6,580 | | | $ | 15,257 | |
Equity in earnings of affiliates | | | (9,108 | ) | | | (10,142 | ) | | | (24,839 | ) |
Minority interest, net of distributions | | | 380 | | | | (733 | ) | | | (226 | ) |
Increase in deferred income taxes | | | (236 | ) | | | (450 | ) | | | (1,975 | ) |
Increase in accounts receivable | | | (17 | ) | | | (21 | ) | | | (181 | ) |
Increase in accrued expenses | | | — | | | | — | | | | 120 | |
Increase in accounts payables | | | 15 | | | | 10 | | | | 50 | |
(Decrease) increase in income taxes payable | | | (27 | ) | | | 101 | | | | 1,075 | |
| | |
|
|
| |
|
|
| |
|
|
|
Net cash used in operating activities | | | (2,579 | ) | | | (4,655 | ) | | | (10,719 | ) |
| | |
|
|
| |
|
|
| |
|
|
|
Cash flows from investing activities: | | | | | | | | | | | | |
Distributions from affiliates | | | 5,373 | | | | 2,514 | | | | 17,395 | |
Capital contribution in affiliate | | | (2,100 | ) | | | (225 | ) | | | (5,190 | ) |
Purchase of exchange membership and stock | | | — | | | | — | | | | (2,600 | ) |
Proceeds from sale of exchange membership | | | — | | | | — | | | | 613 | |
| | |
|
|
| |
|
|
| |
|
|
|
Net cash provided by investing activities | | | 3,273 | | | | 2,289 | | | | 10,218 | |
| | |
|
|
| |
|
|
| |
|
|
|
Cash flows from financing activities: | | | | | | | | | | | | |
Increase (reduction) in checks written in excess of bank balance | | | 124 | | | | (124 | ) | | | — | |
Proceeds from issuance of common stock | | | 1 | | | | 1,744 | | | | — | |
Proceeds from issuance of redeemable common stock held by ESOP | | | — | | | | 4,487 | | | | 223 | |
Payment for redemption of stock | | | (1,437 | ) | | | (613 | ) | | | — | |
Payment of prior year patronage | | | (1,429 | ) | | | (1,869 | ) | | | — | |
Dividends paid | | | — | | | | — | | | | (2,898 | ) |
(Issuance of) proceeds from repayment of notes receivable, net | | | (6,250 | ) | | | 4,000 | | | | (2,575 | ) |
Proceeds from (issuance of) notes payable, net | | | 8,250 | | | | (4,000 | ) | | | 6,000 | |
Registration costs | | | — | | | | (839 | | | | — | |
| | |
|
|
| |
|
|
| |
|
|
|
Net cash (used in) provided by financing activities | | | (741 | ) | | | 2,786 | | | | 750 | |
| | |
|
|
| |
|
|
| |
|
|
|
Net (decrease) increase in cash and cash equivalents | | | (47 | ) | | | 420 | | | | 249 | |
Cash and cash equivalents at beginning of year | | | 47 | | | | — | | | | 420 | |
| | |
|
|
| |
|
|
| |
|
|
|
Cash and cash equivalents at end of year | | $ | — | | | $ | 420 | | | $ | 669 | |
| | |
|
|
| |
|
|
| |
|
|
|
Supplemental disclosures of cash flow information: | | | | | | | | | | | | |
Cash paid during the year for: | | | | | | | | | | | | |
Interest | | $ | 53 | | | $ | 224 | | | $ | 443 | |
Income taxes | | | 2,057 | | | | 4,215 | | | | 10,310 | |
S-3
SCHEDULE II
FCSTONE GROUP, INC. AND SUBSIDIARIES
VALUATION AND QUALIFYING ACCOUNTS
(in thousands)
| | | | | | | | | | | | | | | | |
| | | | | Additions
| | | | | |
Those reserves which are deducted in the Consolidated
Financial Statements from Receivables
| | Balance at
Beginning
of Period
| | Charged to
Costs and
Expenses
| | Charged to
Other
Accounts
| | Deductions
| | | Balance at
End of Period
|
Fiscal year ended August 31, 2004 | | | | | | | | | | | | | | | | |
Reserve for doubtful accounts | | $ | 445 | | $ | 716 | | $ | — | | $ | (191 | ) | | $ | 970 |
| | | | | |
Fiscal year ended August 31, 2005 | | | | | | | | | | | | | | | | |
Reserve for doubtful accounts | | $ | 970 | | $ | 4,077 | | $ | — | | $ | (4,122 | ) | | $ | 925 |
| | | | | |
Fiscal year ended August 31, 2006 | | | | | | | | | | | | | | | | |
Reserve for doubtful accounts | | $ | 925 | | $ | 1,909 | | $ | — | | $ | — | | | $ | 2,834 |
S-4
EXHIBIT INDEX
| | |
Exhibit No.
| | Description of Document
|
| 3.1 | | Certificate of Incorporation of FCStone Group, Inc. (as currently in effect) (2) |
| |
| 3.2 | | Bylaws of FCStone Group, Inc. (as currently in effect) (2) |
| |
| 4.3 | | FCStone Group, Inc. 2006 Equity Incentive Plan (3) |
| |
| 10.1 | | Employment Agreement, dated as of September 1, 2005, between FCStone, LLC, and Paul G. Anderson (4) |
| |
| 10.2 | | Employment Agreement, dated as of January 5, 2004, between FCStone Group, Inc., and Jeff Soman (2) |
| |
| 10.3 | | Employment Agreement, dated as of April 18, 1988, between Farmers Commodities Corporation and Robert V. Johnson (2) |
| |
| 10.4 | | Employment Agreement, dated as of May 9, 2003, between FCStone, LLC, and Steve Gutierrez (2) |
| |
| 10.5 | | Employment Agreement, dated as of July 8, 1996, among Farmers Commodities Corporation, Farmers Grain Dealers, Incorporated, and Steve Speck (2) |
| |
| 10.6 | | CEO Deferred Compensation Plan for Paul G. Anderson dated February 22, 2002 (2) |
| |
| 10.7 | | Farmers Commodities Corporation Supplemental Nonqualified Pension Plan (5) |
| |
| 10.8 | | Short-term Incentive Plan (5) |
| |
| 10.9 | | Long-term Incentive Plan (5) |
| |
| 10.10 | | FGDI Incentive Plan (6) |
| |
| 10.11 | | FCStone Group, Inc. Amended and Restated Mutual Commitment Compensation Plan (5) |
| |
| 10.12 | | Form of Director Indemnification Agreement (6) |
| |
| 10.13 | | Master Loan Agreement, dated November 3, 2003, between FCStone Group, Inc., and Deere Credit, Inc. (2) |
| |
| 10.14 | | Amended and Restated Unsecured Revolving Operating Note, dated May 19, 2006, between FCStone, LLC, and Deere Credit, Inc., due on March 1, 2007 (11) |
| |
| 10.15 | | Master Loan Agreement, dated April 15, 2002, between FCStone Financial, Inc., and Deere Credit, Inc. (2) |
| |
| 10.16 | | Limited Corporate Guaranty, dated April 16, 2002, between FCStone Financial, Inc., and Deere Credit, Inc. (2) |
| |
| 10.17 | | Amended and Restated Revolving Statused Operating Note, dated February 23, 2006, between FCStone Financial, Inc., and Deere Credit, Inc. (7) |
| |
| 10.18 | | Revolving Subordinated Loan Agreement, dated November 21, 2002, between FCStone, LLC, and Deere Credit, Inc. (2) |
| |
| 10.19 | | First Amendment to the Revolving Subordinated Loan Agreement, dated November 3, 2003, between FCStone, LLC, and Deere Credit, Inc. (2) |
| |
| 10.20 | | Second Amendment to the Revolving Subordinated Loan Agreement, dated February 28, 2005, between FCStone, LLC, and Deere Credit, Inc. (11) |
| | |
Exhibit No.
| | Description of Document
|
| 10.21 | | Unsecured Revolving Subordinated Note, dated November 21, 2002, between FCStone, LLC, and Deere Credit, Inc., due on December 1, 2005 (2) |
| |
| 10.22 | | First Amendment to the Unsecured Revolving Subordinated Note, dated November 3, 2003, between FCStone, LLC, and Deere Credit, Inc. (2) |
| |
| 10.23 | | Change in Terms Agreement, dated February 28, 2005, between FCStone, LLC, and Deere Credit, Inc. (8) |
| |
| 10.24 | | Master Loan Agreement, dated February 15, 2001, between FCStone, LLC, and Deere Credit, Inc. (2) |
| |
| 10.25 | | Unsecured Demand Note, dated September 15, 2000, between FCStone, LLC, and Harris Trust Savings Bank (2) |
| |
| 10.26 | | Letter Agreement for $15 Million Credit Facility, dated March 5, 2003, between FCStone, LLC, and Harris Trust Savings Bank (2) |
| |
| 10.27 | | Master Loan Agreement dated February 28, 2003 between FCStone Financial, Inc., and CoBank ACB (9) |
| |
| 10.28 | | Guaranty of Payment, dated February 28, 2003, between FCStone Group, Inc., and CoBank ACB (9) |
| |
| 10.29 | | Revolving Credit, Term Loan and Security Agreement, dated March 28, 2006, by and between FGDI, LLC, and CoBank ACB, as lender and agent (7) |
| |
| 10.30 | | First Amendment to Revolving Credit, Term Loan and Security Agreement, dated as of May 31, 2006 between FGDI, LLC, and CoBank ACB, as lender and agent (10) |
| |
| 10.31 | | Cash Subordinated Loan Agreement, dated June 30, 2004, between FCStone, LLC, and Gerald Hirsch (5) |
| |
| 10.32 | | Amendment to Cash Subordinated Loan Agreement and Promissory Note, dated June 30, 2006, between FCStone, LLC, and Gerald Hirsch (1) |
| |
| 10.33 | | Cash Subordinated Loan Agreement, dated December 12, 2003 between FCStone, LLC, and William Shepard (5) |
| |
| 10.34 | | Amendment to Cash Subordinated Loan Agreement and Promissory Note, dated December 14, 2005 between FCStone, LLC, and William Shepard (1) |
| |
| 10.35 | | Trust Indenture for Industrial Revenue Bonds, dated December 1, 2003 (5) |
| |
| 10.36 | | Lease Agreement, dated December 1, 2002, between the Industrial Development Board of the City of Mobile, Alabama and FGDI, LLC (5) |
| |
| 10.37 | | Letter Agreement, dated March 31, 2004, between FCStone Merchant Services, LLC, and Fortis Capital Corp. for $20,000,000 credit facility (6) |
| |
| 10.38 | | Promissory Note ($20,000,000), dated May 10, 2004, between FCStone Merchant Services, LLC, and Fortis Capital Corp. (6) |
| |
| 10.39 | | Continuing Security Agreement between FCStone Merchant Services, LLC, and Fortis Capital Corp. (6) |
| |
| 10.40 | | Letter Agreement, dated February 17, 2004, between FCStone Merchant Services, LLC, and RZB Finance, LLC, for $5,000,000 credit facility (6) |
| |
| 10.41 | | General Security Agreement and Supplement, dated February 17, 2004, between FCStone Merchant Services, LLC, and RZB Finance, LLC (6) |
| |
| 10.42 | | Amended and Restated Promissory Note ($8,000,000), dated January 30, 2006, between FCStone Merchant Services, LLC, and RZB Finance, LLC (11) |
| | |
Exhibit No.
| | Description of Document
|
| |
| 10.43 | | Demand Note, dated November 23, 2004, between FCStone Merchant Services, LLC, and UFJ Bank, Limited (1) |
| |
| 10.44 | | Letter Agreement, dated December 1, 2004, between FCStone Merchant Services, LLC, and Standard Chartered Bank (1) |
| |
| 10.45 | | Promissory Note, dated December 1, 2004, between FCStone Merchant Services, LLC, and Standard Chartered Bank (1) |
| |
| 21.1 | | Subsidiaries of the Registrant (2) |
| |
| 23.1 | | Consent of KPMG LLP (1) |
| |
| 31.1 | | Certification of Paul G. Anderson, Chief Executive Officer, pursuant to Rule 13a-15(e) /15d-15(e). (1) |
| |
| 31.2 | | Certification of Robert V. Johnson, Chief Financial Officer, pursuant to Rule 13a-15(e) /15d-15(e). (1) |
| |
| 32.1 | | Certification of Paul G. Anderson, Chief Executive Officer, pursuant to 18 U.S.C. Section 1350, as adopted pursuant to Section 906 of the Sarbanes-Oxley Act of 2002. (1) |
| |
| 32.2 | | Certification of Robert V. Johnson, Chief Financial Officer, pursuant to 18 U.S.C. Section 1350, as adopted pursuant to Section 906 of the Sarbanes-Oxley Act of 2002. (1) |
| (2) | Previously filed as an exhibit to the Registration Statement on Form S-4 filed by FCStone Group, Inc., on August 18, 2004. |
| (3) | Previously filed as an exhibit to the Registration Statement on Form S-8, filed by FCStone Group, Inc., on June 12, 2006. |
| (4) | Previously filed as an exhibit to the Current Report on Form 8-K filed by FCStone Group, Inc., on December 14, 2005. |
| (5) | Previously filed as an exhibit to Amendment No. 2 to the Registration Statement on Form S-4 filed by FCStone Group, Inc., on December 9, 2004. |
| (6) | Previously filed as an exhibit to Amendment No. 3 to the Registration Statement on Form S-4 filed by FCStone Group, Inc., on December 30, 2004. |
| (7) | Previously filed as an exhibit to the Quarterly Report on Form 10-Q for the quarter ended February 28, 2006, filed by FCStone Group, Inc., on April 19, 2006. |
| (8) | Previously filed as an exhibit to the Quarterly Report on Form 10-Q for the quarter ended February 28, 2005 filed by FCStone Group, Inc., on April 14, 2005. |
| (9) | Previously filed as an exhibit to Amendment No. 1 to the Registration Statement on Form S-4 filed by FCStone Group, Inc., on October 6, 2004. |
| (10) | Previously filed as an exhibit to the Quarterly Report on Form 10-Q for the quarter ended May 31, 2006, filed by FCStone Group, Inc., on July 17, 2006. |
| (11) | Previously filed as an exhibit to the Registration Statement of Form S-1, filed by FCStone Group, Inc., on October 12, 2006. |