Exhibit 99.2

Digital Realty Trust, Inc.
Second Quarter 2005
Supplemental Operating and Financial Data
June 30, 2005
This Supplemental Operating and Financial Data package is not an offer to sell or solicitation to buy
securities of Digital Realty Trust, Inc. Any offers to sell or solicitation to buy securities of Digital Realty
Trust, Inc. shall be made only by means of a prospectus approved for that purpose.
Digital Realty Trust, Inc.
Second Quarter 2005
Table of Contents
| | |
| | | PAGE
|
Corporate Data | | |
| |
Corporate Information | | 3 |
Investor Information | | 4 |
Stock Performance | | 5 |
Ownership Structure | | 6 |
Pro Forma Ownership Structure | | 7 |
| |
Consolidated Financial Results | | |
| |
Acquisitions | | 8 |
Key Financial Data | | 9 |
Consolidated Balance Sheets | | 10 |
Consolidated Statements of Operations | | 11 |
Funds From Operations | | 12 |
Adjusted Funds from Operations | | 13 |
Reconciliation of Earnings Before Interest, Taxes and Depreciation and Amortization | | 14 |
Capital Structure | | 15 |
Debt Summary | | 16 |
Debt Maturities | | 17 |
| |
Portfolio Data | | |
| |
Occupancy Analysis | | 18 |
Major Tenants | | 19 |
Lease Expirations | | 20 |
Lease Distribution | | 21 |
Leasing Activity | | 22 |
Tenant Improvements and Leasing Commissions | | 23 |
Historical Capital Expenditures | | 24 |
Management Statements on Non-GAAP Supplemental Measures | | 25 |
This supplemental package contains forward-looking statements within the meaning of the federal securities laws. Such statements are based on management’s beliefs and assumptions made based on information currently available to management. Such statements are subject to risks, uncertainties and assumptions and are not guarantees of future performance and may be affected by known and unknown risks, trends, uncertainties and factors that are beyond our control. Should one or more of these risks or uncertainties materialize, or should underlying assumptions prove incorrect, actual results may vary materially from those anticipated, estimated or projected. Some of the risks and uncertainties that may cause our actual results, performance or achievements to differ materially from those expressed or implied by forward-looking statements include, among others, the following: adverse economic or real estate developments in our markets or the technology industry; general and local economic conditions; defaults on or non-renewal of leases by tenants; increased interest rates and operating costs; our inability to manage growth effectively; our failure to obtain necessary outside financing; decreased rental rates or increased vacancy rates; difficulties in identifying properties to acquire and completing acquisitions; our failure to successfully operate acquired properties and operations; our failure to maintain our status as a REIT; possible adverse changes to tax laws; environmental uncertainties and risks related to natural disasters; financial market fluctuations; changes in foreign currency exchange rates; and changes in real estate and zoning laws and increases in real property tax rates. The risks included here are not exhaustive, and additional factors could adversely affect our business and financial performance. We discussed a number of additional material risks in our annual report on Form 10-K for the year ended December 31, 2004 and other filings with the Securities and Exchange Commission. Those risks continue to be relevant to our performance and financial condition. Moreover, we operate in a very competitive and rapidly changing environment. New risk factors emerge from time to time and it is not possible for management to predict all such risk factors, nor can it assess the impact of all such risk factors on the business or the extent to which any factor, or combination of factors, may cause actual results to differ materially from those contained in any forward-looking statements. We expressly disclaim any responsibility to update forward-looking statements, whether as a result of new information, future events or otherwise.
2
Digital Realty Trust, Inc.
Second Quarter 2005
Corporate Information
Corporate Profile
Digital Realty Trust is firmly positioned at the crossroads of real estate and technology and focuses solely on the ownership of technology real estate:
| | • | | We own and operate properties that are critical to the operations of our tenants; |
| | • | | As of June 30, 2005, our portfolio is primarily located in 15 major metropolitan areas in the United States and Europe; |
| | • | | We concentrate on areas within the technology industry that we believe have growth potential. As such, we emphasize properties that provide the infrastructure for sectors such as corporate enterprise data centers, disaster recovery and business continuity, electronic commerce and the security of stored or transmitted electronic data. |
As of June 30, 2005, our 33 property portfolio, totaling 7.8 million square feet, consists mainly of highly improved properties containing specialized facilities that play a critical role in our tenants' operations and in the delivery of services to their customers. We maintain a significant focus on Internet gateway and data center properties that are located at the junction of major high-speed data networks that deliver Internet, data, voice, video, wireless and satellite services.
Our tenant base includes media, communications and technology-based businesses, Internet enterprises and Fortune 1000 companies. Our tenants' operations typically require specially designed and engineered facilities that maintain sophisticated security systems, robust and redundant power services, backup power systems, redundant air conditioning systems and advanced fire suppression systems.
Corporate Headquarters
560 Mission Street, Suite 2900
San Francisco, California 94105
| | |
Telephone: | | (415) 738-6500 |
Facsimile: | | (415) 738-6501 |
Web site: | | www.digitalrealtytrust.com |
Senior Management
| | |
Richard A. Magnuson | | Executive Chairman |
Michael F. Foust | | Chief Executive Officer |
A. William Stein | | Chief Financial Officer and Chief Investment Officer |
Scott E. Peterson | | Senior Vice President, Acquisitions |
Christopher J. Crosby | | Vice President, Sales |
Investor Relations
To request an Investor Relations package or be added to our e-mail distribution list, please contact us at:
Web site: www.digitalrealtytrust.com (Go to Information Request in the Investor Relations section)
This Supplemental Operating and Financial Data package supplements the information provided in our quarterly and annual reports filed with the Securities and Exchange Commission. Additional information about us and our properties is also available at our website www.digitalrealtytrust.com.
3
Digital Realty Trust, Inc.
Second Quarter 2005
Investor Information
Analyst Coverage
| | |
| Credit Suisse First Boston | | Merrill Lynch |
| Andrew Rosivach | | Brian Legg |
| (212) 325-6205 | | (212) 449-1153 |
| |
| JMP Securities | | RBC Capital Markets |
| William Marks | | David Copp |
| (415) 835-8944 | | (415) 633-8558 |
| |
| KeyBanc Capital Markets | | SmithBarney Citigroup |
| Richard Moore | | Jonathan Litt |
| (216) 443-2815 | | (212) 816-0231 |
Quarterly Reporting Schedule
Quarterly results will be announced according to the following anticipated schedule:
| | |
Second Quarter | | August 9, 2005 |
Third Quarter | | Mid November 2005 |
Fourth Quarter and Year End | | TBD |
Stock Listing
The stock of Digital Realty Trust, Inc. is traded primarily on the New York Stock Exchange under the following symbols:
| | |
Common Stock: | | DLR |
Series A Preferred Stock: | | DLRPA |
Note that symbols may vary by stock quote provider.
4
Digital Realty Trust, Inc.
Second Quarter 2005
Stock Performance
The following summarizes recent activity of Digital Realty’scommon stock (DLR):
| | | | | | | | |
| | | 1st Quarter
2005
| | | 2nd Quarter
2005
| |
High Price * | | $ | 14.81 | | | $ | 17.49 | |
Low Price * | | $ | 12.50 | | | $ | 13.67 | |
Closing Price, end of period * | | $ | 14.37 | | | $ | 17.38 | |
Average daily trading volume * | | | 94,884 | | | | 94,248 | |
Indicated dividend per share ** | | $ | 0.975 | | | $ | 0.975 | |
Closing dividend yield, end of period | | | 6.8 | % | | | 5.6 | % |
Closing shares and units outstanding (thousands), end of period | | | 52,943 | | | | 52,943 | |
Closing market value of shares and units outstanding (thousands), end of period | | $ | 760,787 | | | $ | 920,145 | |
The following summarizes recent activity of Digital Realty’sSeries A preferred stock (DLRPA):
| | | | | | | | |
| | | 2/9/05 to
3/31/05
| | | 2nd Quarter
2005
| |
High Price * | | $ | 26.63 | | | $ | 26.70 | |
Low Price * | | $ | 25.90 | | | $ | 25.85 | |
Closing Price, end of period * | | $ | 26.00 | | | $ | 25.97 | |
Indicated dividend per share ** | | $ | 2.125 | | | $ | 2.125 | |
Closing dividend yield, end of period | | | 8.2 | % | | | 8.2 | % |
Closing shares outstanding (thousands), end of period | | | 4,140 | | | | 4,140 | |
Closing market value of shares outstanding (thousands), end of period | | $ | 107,640 | | | $ | 107,516 | |
| * | New York Stock Exchange trades only |
5
Digital Realty Trust, Inc.
Ownership Structure
As of June 30, 2005(1)
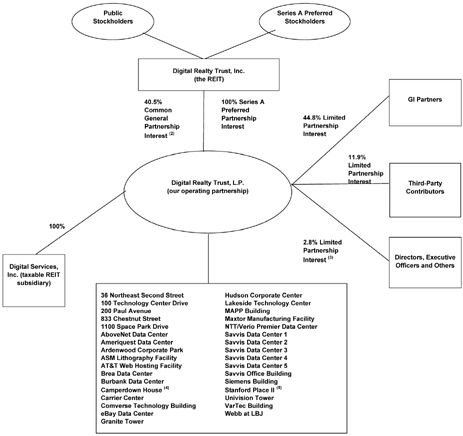
| | | | | |
Limited Partner
| | # of Units(6)
| | % Ownership (2)
| |
Digital Realty Trust, Inc. | | 21,421,300 | | 40.5 | % |
GI Partners, LLC | | 23,699,359 | | 44.8 | % |
Cambay Tele.com, LLC(7) | | 5,903,124 | | 11.1 | % |
Wave Exchange, LLC(7) | | 32,722 | | 0.1 | % |
Pacific-Bryan Partners, L.P.(8) | | 395,665 | | 0.7 | % |
Directors, Executive Officers and Others | | 1,490,561 | | 2.8 | % |
| | |
| |
|
|
Total | | 52,942,731 | | 100.0 | % |
| | |
| |
|
|
| (1) | Excludes the effects of the issuance of 5,780,891 shares of common stock and 2,530,000 shares of Series B Cumulative Redeemable Preferred Stock on July 26, 2005 in exchange for gross proceeds of approximately $166.2 million. |
| (2) | Excludes shares issuable with respect to stock options that have been granted but are not yet exercisable. |
| (3) | Reflects limited partnership interests held by our officers and directors in the form of vested long-term incentive units. |
| (4) | This property is held through a taxable REIT subsidiary. |
| (5) | We indirectly own a 98% interest in a subsidiary that holds the fee simple interest in this property. An unrelated third party holds the remaining 2% interest in this subsidiary. |
| (6) | The total number of units includes 21,421,300 shares of common stock and 31,521,431 common units. |
| (7) | These third-party contributors received the units (along with cash and the operating partnership assuming debt) in exchange for their interests in 200 Paul Avenue, 1100 Space Park Drive, the eXchange colocation business and other specified assets and liabilities. |
| (8) | This third-party contributor received the units in exchange for a 10% minority interest in the Univison Tower property. |
6
Digital Realty Trust, Inc.
Pro Forma Ownership Structure
As of June 30, 2005(1)
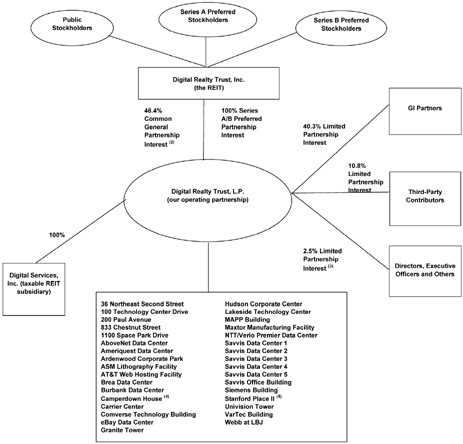
| | | | | |
Limited Partner
| | # of Units(6)
| | % Ownership (2)
| |
Digital Realty Trust, Inc. | | 27,292,191 | | 46.4 | % |
GI Partners, LLC | | 23,699,359 | | 40.3 | % |
Cambay Tele.com, LLC(7) | | 5,903,124 | | 10.0 | % |
Wave Exchange, LLC(7) | | 32,722 | | 0.1 | % |
Pacific-Bryan Partners, L.P.(8) | | 395,665 | | 0.7 | % |
Directors, Executive Officers and Others | | 1,490,561 | | 2.5 | % |
| | |
| |
|
|
Total | | 58,813,622 | | 100.0 | % |
| | |
| |
|
|
| (1) | Includes the effects of the issuance of 5,780,891 shares of common stock and 2,530,000 shares of Series B Cumulative Redeemable Preferred Stock on July 26, 2005 in exchange for gross proceeds of approximately $166.2 million. |
| (2) | Excludes shares issuable with respect to stock options that have been granted but are not yet exercisable. |
| (3) | Reflects limited partnership interests held by our officers and directors in the form of vested long-term incentive units. |
| (4) | This property is held through a taxable REIT subsidiary. |
| (5) | We indirectly own a 98% interest in a subsidiary that holds the fee simple interest in this property. An unrelated third party holds the remaining 2% interest in this subsidiary. |
| (6) | The total number of units includes 27,292,191 shares of common stock and 31,521,431 common units. |
| (7) | These third-party contributors received the units (along with cash and the operating partnership assuming debt) in exchange for their interests in 200 Paul Avenue, 1100 Space Park Drive, the eXchange colocation business and other specified assets an |
| (8) | This third-party contributor received the units in exchange for a 10% minority interest in the Univison Tower property. |
7
Digital Realty Trust, Inc.
Second Quarter 2005
Properties Acquired
For the three months ended June 30, 2005
| | | | | | | | | | | | | | | | |
Property
| | Metropolitan
Area
| | Date
Acquired
| | Purchase
Price
(in millions)
| | Net Rentable
Square Footage
of Property
| | Total Square
Footage Held for
Redevelopment
| | Percentage of
Total Rentable
Square Footage
of Property
Occupied (1)
| | | Major Tenant(s)
|
Lakeside Technology Center | | Chicago | | May 2005 | | $ | 141.6 | | 805,150 | | 290,000 | | 94.2 | % | | Qwest Communications International, Inc. |
Ameriquest Data Center | | Denver | | June 2005 | | $ | 16.5 | | 82,229 | | — | | 100.0 | % | | Ameriquest |
Savvis Data Center 2 | | Silicon Valley | | June 2005 | | $ | 27.4 | | 167,932 | | — | | 100.0 | % | | Savvis Communications Corp. |
Savvis Data Center 3 | | Los Angeles | | June 2005 | | $ | 18.6 | | 113,606 | | — | | 100.0 | % | | Savvis Communications Corp. |
Savvis Data Center 4 | | Silicon Valley | | June 2005 | | $ | 18.3 | | 103,940 | | — | | 100.0 | % | | Savvis Communications Corp. |
Savvis Data Center 5 | | Silicon Valley | | June 2005 | | $ | 16.4 | | 90,139 | | — | | 100.0 | % | | Savvis Communications Corp. |
Savvis Office Building | | Silicon Valley | | June 2005 | | $ | 11.8 | | 84,383 | | — | | 100.0 | % | | Savvis Communications Corp. |
| | | | | | |
|
| |
| |
| |
|
| | |
| | | | | | | $ | 250.6 | | 1,447,379 | | 290,000 | | 96.8 | % | | |
| | | | | | |
|
| |
| |
| |
|
| | |
| (1) | The property at Lakeside Technology Center has a total of 1,095,150 square feet, including approximately 290,000 square feet held for redevelopment. The occupancy percentage presented excludes the space available for redevelopment. |
8
Digital Realty Trust, Inc.
Second Quarter 2005
Key Financial Data
(Dollars in thousands, except per share data)
| | | | | | | | | | | | | | | | | | | | | |
| | | For the three months ended or as of
| |
| | | 6/30/2005
| | | 3/31/2005
| | | 12/31/2004
| | | 9/30/2004
| | | 6/30/2004
| | | 3/31/2004
| |
Shares and Units | | | | | | | | | | | | | | | | | | | | | |
Common Shares Outstanding | | | 21,421,300 | | | | 21,421,300 | | | | 21,421,300 | | | N/A | | | N/A | | | N/A | |
Common Units Outstanding | | | 31,521,431 | | | | 31,521,431 | | | | 31,521,431 | | | N/A | | | N/A | | | N/A | |
| | |
|
|
| |
|
|
| |
|
|
| |
|
| |
|
| |
|
|
Total Shares and Operating Partnership Units | | | 52,942,731 | | | | 52,942,731 | | | | 52,942,731 | | | N/A | | | N/A | | | N/A | |
| | |
|
|
| |
|
|
| |
|
|
| |
|
| |
|
| |
|
|
Market Capitalization | | | | | | | | | | | | | | | | | | | | | |
Market Value of Common Equity(1) | | | 920,145 | | | | 760,787 | | | | 713,139 | | | N/A | | | N/A | | | N/A | |
Stated Value of Preferred Equity | | | 103,500 | | | | 103,500 | | | | N/A | | | N/A | | | N/A | | | N/A | |
Total Debt | | | 765,687 | | | | 515,701 | | | | 519,498 | | | 551,351 | | | 473,896 | | | 318,199 | |
| | |
|
|
| |
|
|
| |
|
|
| |
|
| |
|
| |
|
|
Total Market Capitalization | | | 1,789,332 | | | | 1,379,988 | | | | 1,232,637 | | | N/A | | | N/A | | | N/A | |
| | |
|
|
| |
|
|
| |
|
|
| |
|
| |
|
| |
|
|
Total Debt/Total Market Capitalization | | | 42.8 | % | | | 37.4 | % | | | 42.1 | % | | N/A | | | N/A | | | N/A | |
Selected Balance Sheet Data | | | | | | | | | | | | | | | | | | | | | |
Book Value of Real Estate Assets before Depreciation | | | 1,099,699 | | | | 889,803 | | | | 818,392 | | | 675,204 | | | 602,805 | | | 433,123 | |
Total Assets | | | 1,368,256 | | | | 1,099,727 | | | | 1,013,287 | | | 822,189 | | | 731,237 | | | 513,968 | |
Total Liabilities | | | 856,617 | | | | 579,393 | | | | 584,229 | | | 593,699 | | | 509,684 | | | 346,545 | |
Selected Operating Data | | | | | | | | | | | | | | | | | | | | | |
Revenue | | | 49,663 | | | | 39,643 | | | | 36,205 | | | 29,346 | | | 22,800 | | | 18,770 | |
Expenses (including interest expense) | | | 42,189 | | | | 34,748 | | | | 51,774 | | | 25,959 | | | 19,806 | | | 15,263 | |
Interest Expense | | | 9,289 | | | | 8,121 | | | | 8,657 | | | 7,926 | | | 4,065 | | | 3,813 | |
Net Income (Loss) | | | 4,335 | | | | 2,739 | | | | (5,359 | ) | | 3,359 | | | 3,096 | | | 3,461 | |
Net Income Allocable to Common Stockholders | | | 2,136 | | | | 1,468 | | | | — | | | — | | | — | | | — | |
Financial Ratios | | | | | | | | | | | | | | | | | | | | | |
EBITDA(2) | | | 24,813 | | | | 25,519 | | | | N/A | | | N/A | | | N/A | | | N/A | |
Cash interest expense (2) | | | 8,086 | | | | 7,416 | | | | N/A | | | N/A | | | N/A | | | N/A | |
Debt Service Coverage Ratio(2) | | | 3.1 | | | | 3.4 | | | | N/A | | | N/A | | | N/A | | | N/A | |
Fixed Charges(3) | | | 12,266 | | | | 10,525 | | | | N/A | | | N/A | | | N/A | | | N/A | |
Fixed Charge Coverage Ratio(3) | | | 2.0 | | | | 2.4 | | | | N/A | | | N/A | | | N/A | | | N/A | |
EPS, FFO and AFFO | | | | | | | | | | | | | | | | | | | | | |
Basic Net Income per share | | $ | 0.10 | | | $ | 0.07 | | | $ | (0.30 | ) (4) | | N/A | | | N/A | | | N/A | |
Diluted Net Income per share | | $ | 0.10 | | | $ | 0.07 | | | $ | (0.30 | ) (4) | | N/A | | | N/A | | | N/A | |
Diluted FFO per share(5) | | $ | 0.37 | | | $ | 0.30 | | | $ | (0.17 | ) | | N/A | | | N/A | | | N/A | |
Diluted AFFO per share (5) | | $ | 0.31 | | | $ | 0.24 | | | | N/A | | | N/A | | | N/A | | | N/A | |
Dividends per share and common unit | | $ | 0.24 | | | $ | 0.24 | | | $ | 0.16 | | | N/A | | | N/A | | | N/A | |
Diluted FFO payout ratio (6) | | | 65.8 | % | | | 81.3 | % | | | N/A | | | N/A | | | N/A | | | N/A | |
Portfolio Statistics | | | | | | | | | | | | | | | | | | | | | |
Properties | | | 33 | | | | 26 | | | | 24 | | | 20 | | | 18 | | | 14 | |
Net rentable square feet | | | 7,791,110 | | | | 6,303,226 | | | | 5,652,700 | | | 4,796,996 | | | 4,252,058 | | | 2,989,266 | |
Occupancy at end of quarter | | | 89.7 | %(7) | | | 88.9 | % (8) | | | 88.4 | % | | 89.4 | % | | 89.3 | % | | 88.8 | % |
| (1) | Assuming 100% conversion of the limited partnership units in the operating partnership into shares of our common stock. |
| (2) | Calculated as earnings before interest, taxes and depreciation and amortization and preferred dividends, or EBITDA divided by cash interest expense. For a definition of cash interest expense, see page 16. For a discussion of EBITDA, see page 25. For a quantitative reconciliation of the differences between EBITDA and net income, see page 14. |
| (3) | Calculated as EBITDA divided by fixed charges. For a definition of fixed charges, see page 16. |
| (4) | The net loss per common share - basic and diluted is for the period from November 3, 2004 to December 31, 2004. This may not be comparable future net income (loss) per common share since it includes the effect of various IPO-related charges. |
| (5) | For a definition and discussion of FFO, see page 25. For a quantitative reconciliation of the differences between FFO and net income, see page 12. For a quantitative reconciliation of the difference between FFO and AFFO see page 13. |
| (6) | Calculated as dividend declared per common share divided by FFO per common share - diluted. |
| (7) | Excludes 397,503 square feet of space held for development. |
| (8) | Excludes 107,503 square feet of space held for development. |
Note: The Predecessor is not a legal entity; rather it is a combination of certain of the real estate subsidiaries of Global Innovation Partners, LLC, a Delaware limited liability company (GI Partners) along with an allocation of certain assets, liabilities, revenues and expenses of GI Partners related to the real estate held by such subsidiaries. The financial statements presented are the consolidated financial statements of the Company. The financial statements presented for periods prior to November 3, 2004 are the combined financial statements of the Predecessor.
9
Digital Realty Trust, Inc.
Second Quarter 2005
Consolidated Balance Sheets
(in thousands, except share data)
| | | | | | | | |
| | | June 30,
2005
| | | December 31,
2004
| |
| | | (unaudited) | | | | |
ASSETS | | | | | | | | |
Investments in real estate | | | | | | | | |
Land | | $ | 172,919 | | | $ | 129,112 | |
Acquired ground lease | | | 1,477 | | | | 1,477 | |
Buildings and improvements | | | 810,740 | | | | 613,058 | |
Tenant improvements | | | 114,563 | | | | 74,745 | |
| | |
|
|
| |
|
|
|
Investments in real estate | | | 1,099,699 | | | | 818,392 | |
Accumulated depreciation and amortization | | | (45,098 | ) | | | (30,980 | ) |
| | |
|
|
| |
|
|
|
Net investments in real estate | | | 1,054,601 | | | | 787,412 | |
Cash and cash equivalents | | | 3,982 | | | | 4,557 | |
Accounts and other receivables | | | 5,021 | | | | 3,051 | |
Deferred rent | | | 17,165 | | | | 12,236 | |
Acquired above market leases, net | | | 49,770 | | | | 43,947 | |
Acquired in place lease value and deferred leasing costs, net | | | 201,690 | | | | 136,721 | |
Deferred financing costs, net | | | 7,711 | | | | 8,236 | |
Restricted cash | | | 24,961 | | | | 14,207 | |
Other assets | | | 3,355 | | | | 2,920 | |
| | |
|
|
| |
|
|
|
Total Assets | | $ | 1,368,256 | | | $ | 1,013,287 | |
| | |
|
|
| |
|
|
|
LIABILITIES AND STOCKHOLDERS’ EQUITY | | | | | | | | |
Notes payable under line of credit | | $ | 188,000 | | | $ | 44,000 | |
Mortgage loans | | | 555,687 | | | | 453,498 | |
Other secured loans | | | 22,000 | | | | 22,000 | |
Accounts payable and other accrued liabilities | | | 24,416 | | | | 12,789 | |
Accrued dividends and distributions | | | — | | | | 8,276 | |
Acquired below market leases, net | | | 58,513 | | | | 37,390 | |
Security deposits and prepaid rents | | | 8,001 | | | | 6,276 | |
| | |
|
|
| |
|
|
|
Total Liabilities | | | 856,617 | | | | 584,229 | |
| | |
|
|
| |
|
|
|
Commitments and contingencies | | | — | | | | — | |
Minority interests in consolidated joint ventures | | | 145 | | | | 997 | |
Minority interests in operating partnership | | | 245,417 | | | | 254,862 | |
Stockholders’ equity: | | | | | | | | |
Preferred Stock; $0.01 par value, 20,000,000 authorized: 8.50% Series A Cumulative Redeemable Preferred Stock, $103,500,000 liquidation preference ($25.00 per share), 4,140,000 issued and outstanding | | | 99,297 | | | | — | |
Common Stock; $0.01 par value; 100,000,000 authorized, 21,421,300 shares issued and outstanding | | | 214 | | | | 214 | |
Additional paid-in capital | | | 182,140 | | | | 182,411 | |
Dividends in excess of earnings | | | (16,357 | ) | | | (9,517 | ) |
Accumulated other comprehensive income, net | | | 783 | | | | 91 | |
| | |
|
|
| |
|
|
|
Total Stockholders’ Equity | | | 266,077 | | | | 173,199 | |
| | |
|
|
| |
|
|
|
Total Liabilities and Stockholders’ Equity | | $ | 1,368,256 | | | $ | 1,013,287 | |
| | |
|
|
| |
|
|
|
10
Digital Realty Trust, Inc.
Second Quarter 2005
Consolidated and Combined Statements of Operations
(unaudited and in thousands, except share data)
| | | | | | | | | | | | | | | | | | | | | | | |
| | | Three Months Ended
| |
| | | 6/30/2005
| | | 3/31/2005
| | | 12/31/2004
| | | 9/30/2004
| | | 6/30/2004
| | 3/31/2004
| |
Revenues | | | | | | | | | | | | | | | | | | | | | | | |
Rental | | $ | 37,604 | | | $ | 32,691 | | | $ | 29,981 | | | $ | 24,666 | | | $ | 18,433 | | $ | 16,028 | |
Tenant reimbursements | | | 8,113 | | | | 6,520 | | | | 6,174 | | | | 4,658 | | | | 2,669 | | | 2,728 | |
Other | | | 3,946 | | | | 432 | | | | 50 | | | | 22 | | | | 1,698 | | | 14 | |
| | |
|
|
| |
|
|
| |
|
|
| |
|
|
| |
|
| |
|
|
|
Total Revenues | | | 49,663 | | | | 39,643 | | | | 36,205 | | | | 29,346 | | | | 22,800 | | | 18,770 | |
| | |
|
|
| |
|
|
| |
|
|
| |
|
|
| |
|
| |
|
|
|
Expenses | | | | | | | | | | | | | | | | | | | | | | | |
Rental property operating and maintenance | | | 9,718 | | | | 7,145 | | | | 7,349 | | | | 5,336 | | | | 3,283 | | | 3,006 | |
Property taxes | | | 4,910 | | | | 3,681 | | | | 3,084 | | | | 2,417 | | | | 2,115 | | | 1,718 | |
Insurance | | | 530 | | | | 599 | | | | 696 | | | | 617 | | | | 321 | | | 241 | |
Interest | | | 9,289 | | | | 8,121 | | | | 8,657 | | | | 7,926 | | | | 4,065 | | | 3,813 | |
Asset management fees to related party | | | — | | | | — | | | | 266 | | | | 797 | | | | 796 | | | 796 | |
Depreciation and amortization | | | 14,328 | | | | 12,143 | | | | 10,576 | | | | 8,604 | | | | 6,711 | | | 5,507 | |
General and administrative | | | 2,453 | | | | 2,413 | | | | 20,774 | | | | 86 | | | | 65 | | | 92 | |
Net loss from early extinguishment of debt | | | — | | | | 125 | | | | 283 | | | | — | | | | — | | | — | |
Other | | | 961 | | | | 521 | | | | 89 | | | | 176 | | | | 2,450 | | | 90 | |
| | |
|
|
| |
|
|
| |
|
|
| |
|
|
| |
|
| |
|
|
|
Total Expenses | | | 42,189 | | | | 34,748 | | | | 51,774 | | | | 25,959 | | | | 19,806 | | | 15,263 | |
| | |
|
|
| |
|
|
| |
|
|
| |
|
|
| |
|
| |
|
|
|
Income (loss) before minority interests | | | 7,474 | | | | 4,895 | | | | (15,569 | ) | | | 3,387 | | | | 2,994 | | | 3,507 | |
Minority interests in consolidated joint ventures | | | 4 | | | | 3 | | | | (4 | ) | | | (28 | ) | | | 102 | | | (46 | ) |
Minority interests in operating partnership | | | (3,143 | ) | | | (2,159 | ) | | | 10,214 | | | | — | | | | — | | | — | |
| | |
|
|
| |
|
|
| |
|
|
| |
|
|
| |
|
| |
|
|
|
Net income (loss) | | | 4,335 | | | | 2,739 | | | $ | (5,359 | ) | | $ | 3,359 | | | $ | 3,096 | | $ | 3,461 | |
| | | | | | | | | | |
|
|
| |
|
|
| |
|
| |
|
|
|
Dividends to preferred stockholders | | | (2,199 | ) | | | (1,271 | ) | | | | | | | | | | | | | | | |
| | |
|
|
| |
|
|
| | | | | | | | | | | | | | | |
Net income allocable to common stockholders | | $ | 2,136 | | | $ | 1,468 | | | | | | | | | | | | | | | | |
| | |
|
|
| |
|
|
| | | | | | | | | | | | | | | |
Net income (loss) per common share - basic and diluted | | $ | 0.10 | | | $ | 0.07 | | | $ | (0.30 | ) (1) | | | | | | | | | | | |
Weighted-average shares outstanding - basic | | | 21,421,300 | | | | 21,421,300 | | | | 20,770,875 | | | | | | | | | | | | |
Weighted-average shares outstanding - diluted | | | 21,584,913 | | | | 21,535,485 | | | | 20,770,875 | | | | | | | | | | | | |
Weighted-average fully diluted shares and units | | | 53,106,344 | | | | 53,056,916 | | | | 52,942,731 | | | | | | | | | | | | |
| (1) | The net loss per common share - basic and diluted is for the period from November 3, 2004 to December 31, 2004. This may not be comparable future net income (loss) per common share since it includes the effect of various IPO-related charges. |
11
Digital Realty Trust, Inc.
Second Quarter 2005
Funds From Operations
(unaudited and in thousands, except share data)
| | | | | | | | | | | | | | | | | | | |
| | | Three Months Ended
|
| | | 6/30/2005
| | 3/31/2005
| | 12/31/2004
| | | 9/30/2004
| | 6/30/2004
| | 3/31/2004
|
Reconciliation of net income (loss) to funds from operations: | | | | | | | | | | | | | | | | | | | |
Net income (loss) allocable to common stockholders | | $ | 2,136 | | $ | 1,468 | | $ | (5,359 | ) | | $ | 3,359 | | $ | 3,096 | | $ | 3,461 |
Adjustments: | | | | | | | | | | | | | | | | | | | |
Minority interests in operating partnership | | | 3,143 | | | 2,159 | | | (10,214 | ) | | | — | | | — | | | — |
Real estate related depreciation and amortization | | | 14,318 | | | 12,143 | | | 10,576 | | | | 8,604 | | | 6,711 | | | 5,507 |
| | |
|
| |
|
| |
|
|
| |
|
| |
|
| |
|
|
Funds from operations available to common stockholders and unitholders (FFO) | | $ | 19,597 | | $ | 15,770 | | $ | (4,997 | ) | | $ | 11,963 | | $ | 9,807 | | $ | 8,968 |
| | |
|
| |
|
| |
|
|
| |
|
| |
|
| |
|
|
FFO per share - basic and diluted | | $ | 0.37 | | $ | 0.30 | | $ | (0.17 | )(1) | | | N/A | | | N/A | | | N/A |
| | |
|
| |
|
| |
|
|
| |
|
| |
|
| |
|
|
Weighted-average shares outstanding - basic | | | 52,943 | | | 52,943 | | | 52,943 | | | | N/A | | | N/A | | | N/A |
Weighted-average shares outstanding - diluted | | | 53,106 | | | 53,057 | | | 52,943 | | | | N/A | | | N/A | | | N/A |
| (1) | The FFO per share - basic and diluted is for the period from November 3, 2004 to December 31, 2004. This may not be comparable future net income (loss) per common share since it includes the effect of various IPO-related charges. |
Note:For a definition and discussion of FFO, see page 25.
12
Digital Realty Trust, Inc.
Second Quarter 2005
Adjusted Funds From Operations
(unaudited and in thousands)
| | | | | | | | |
| | | Three Months Ended
| |
| | | 6/30/2005
| | | 3/31/2005
| |
Reconciliation of net income (loss) to funds from operations: | | | | | | | | |
Funds from operations available to common stockholders and unitholders (FFO) | | $ | 19,597 | | | $ | 15,770 | |
Adjustments: | | | | | | | | |
Non real estate depreciation | | | 10 | | | | — | |
Amortization of deferred financing costs | | | 707 | | | | 675 | |
Non cash compensation | | | 44 | | | | 52 | |
Loss from early extinguishment of debt | | | — | | | | 125 | |
Straight line rents | | | (2,483 | ) | | | (2,553 | ) |
Fair value lease revenue amortization | | | (230 | ) | | | (439 | ) |
Capitalized leasing payroll | | | (127 | ) | | | — | |
Recurring capital expenditures and tenant improvements | | | (732 | ) | | | (519 | ) |
Capitalized leasing commissions | | | (579 | ) | | | (180 | ) |
| | |
|
|
| |
|
|
|
Adjusted Funds from operations available to common stockholders and unitholders (AFFO) | | $ | 16,207 | | | $ | 12,931 | |
| | |
|
|
| |
|
|
|
Note:For a definition and discussion of AFFO, see page 25.
13
Digital Realty Trust, Inc.
Second Quarter 2005
Reconciliation of Earnings Before Interest Taxes and Depreciation and Amortization
| | | | | | | | | | | | | | | | | | | | | |
| | | Three Months Ended
|
| | | 6/30/2005
| | | 3/31/2005
| | 12/31/2004
| | | 9/30/2004
| | 6/30/2004
| | | 3/31/2004
|
Reconciliation of net income (loss) to earnings before interest, taxes and depreciation and amortization (EBITDA(1)): | | | | | | | | | | | | | | | | | | | | | |
Net income (loss) | | $ | 4,335 | | | $ | 2,739 | | $ | (5,359 | ) | | $ | 3,359 | | $ | 3,096 | | | $ | 3,461 |
Add: Minority interests | | | (3,139 | ) | | | 2,156 | | | (10,210 | ) | | | 28 | | | (102 | ) | | | 46 |
Interest | | | 9,289 | | | | 8,121 | | | 8,657 | | | | 7,926 | | | 4,065 | | | | 3,813 |
Depreciation and amortization | | | 14,328 | | | | 12,143 | | | 10,576 | | | | 8,604 | | | 6,711 | | | | 5,507 |
| | |
|
|
| |
|
| |
|
|
| |
|
| |
|
|
| |
|
|
EBITDA | | $ | 24,813 | | | $ | 25,159 | | $ | 3,664 | | | $ | 19,917 | | $ | 13,770 | | | $ | 12,827 |
| | |
|
|
| |
|
| |
|
|
| |
|
| |
|
|
| |
|
|
| (1) | For the definition and discussion of EBITDA, see page 25. |
14
Digital Realty Trust, Inc.
Second Quarter 2005
Capital Structure
As of June 30, 2005
Consolidated Debt
(in thousands)
| | | |
| | | Aggregate Principal
June 30, 2005
|
Mortgage and Other Secured Loans Payable | | $ | 577,687 |
Unsecured Credit Facility | | | 188,000 |
| | |
|
|
Total Debt | | $ | 765,687 |
| | |
|
|
Equity
(in thousands)
| | | | | |
| | | Shares
Outstanding
| | Total Liquidation
Preference
|
Preferred Stock | | 4,140 | | $ | 103,500 |
| | |
| | | Shares & Units
Outstanding
| | Market Value(1)
|
Common Stock | | 21,421.3 | | $ | 372,302 |
Operating Partnership Units | | 31,521.4 | | | 452,963 |
| | |
| |
|
|
Total Common Equity | | 52,942.7 | | $ | 825,265 |
| | |
| |
|
|
Total Market Capitalization | | | | $ | 1,694,452 |
| | | | |
|
|
| (1) | Value based on June 30, 2005 closing price of $17.38. |
15
Digital Realty Trust, Inc.
Second Quarter 2005
Consolidated Debt Analysis
(in thousands)
| | | | | | | | | | | |
| | | Maturity Date
| | Principal Balance as
of June 30, 2005
| | % of Debt
| | | Interest Rate as of
June 30, 2005
| |
Floating Rate Debt | | | | | | | | | | | |
Carrier Center-Mortgage | | November 11, 2007 (1) | | $ | 25,743 | | 3.4 | % | | 7.59 | % |
Maxtor Manufacturing Facility-Mortgage | | December 31, 2006 (2) | | | 17,752 | | 2.3 | % | | 5.04 | % |
Ardenwood Corporate Park, NTT/Verio Premier Data Center, VarTec Building-Mezzanine | | August 9, 2006(3) | | | 22,000 | | 2.9 | % | | 9.09 | % |
Unsecured Credit Facility | | November 3, 2007 | | | 188,000 | | 24.6 | % | | 4.97 | % |
| | | | |
|
| |
|
| |
|
|
Total Unhedged Floating Rate Debt | | | | | 253,495 | | 33.2 | % | | | |
Fixed Rate Debt | | | | | | | | | | | |
Secured Term Debt | | November 11, 2014 | | | 153,878 | | 20.1 | % | | 5.65 | % |
Lakeside Technology Center | | June 9, 2008(2) | | | 100,000 | | 13.1 | % | | 5.54 | % (4) |
Univision Tower-Mortgage | | November 6, 2009 | | | 57,612 | | 7.5 | % | | 6.04 | % |
200 Paul Avenue-Mortgage | | July 1, 2006(2) | | | 45,796 | | 6.0 | % | | 6.42 | % (4) |
Ardenwood Corporate Park, NTT/Verio Premier Data Center, VarTec Building-Mortgage | | August 9, 2006(3) | | | 43,000 | | 5.5 | % | | 4.93 | % (4) |
Stanford Place II-Mortgage | | January 1, 2009 | | | 26,000 | | 3.4 | % | | 5.14 | % |
Camperdown House-Mortgage | | October 31, 2009 | | | 25,083 | | 3.3 | % | | 6.85 | % |
Granite Tower-Mortgage | | January 1, 2009 | | | 21,420 | | 2.8 | % | | 4.72 | % (4) |
100 Technology Center Drive-Mortgage | | April 1, 2009 | | | 20,000 | | 2.6 | % | | 5.22 | % (4) |
MAPP Building-Mortgage | | March 1, 2032 | | | 9,723 | | 1.3 | % | | 7.62 | % |
AT&T Web Hosting Facility-Mortgage | | December 1, 2006 (2) | | | 8,775 | | 1.1 | % | | 5.37 | % (4) |
| | | | |
|
| |
|
| | | |
Total Fixed Rate Debt | | | | | 511,287 | | 66.7 | % | | | |
Debt Premium - MAPP Building | | | | | 905 | | 0.1 | % | | | |
| | | | |
|
| |
|
| | | |
Total Consolidated Debt | | | | $ | 765,687 | | 100.0 | % | | | |
| | | | |
|
| |
|
| | | |
| (1) | A one-year extension option is available. |
| (2) | Two one-year extensions are available. |
| (3) | A 13-month extension and a one-year extension are available. |
| (4) | Mortgage loans subject to interest rate swap agreements. The interest rates on the mortgage loans, adjusted for the interest rate swap agreements are as follows: |
| | | |
Lakeside Technology Center | | 6.23 | % |
200 Paul Avenue-Mortgage | | 6.26 | % |
Ardenwood Corporate Park, NTT/Verio Premier Data Center, VarTec Building-Mortgage | | 4.84 | % |
Granite Tower-Mortgage | | 4.95 | % |
100 Technology Center Drive-Mortgage | | 5.52 | % |
AT&T Web Hosting Facility-Mortgage | | 5.18 | % |
Credit Facility
(in thousands)
| | | | | | | | | |
| | | Maximum Available
| | Available as of
June 30, 2005
| | Drawn
|
Unsecured Credit Facility | | $ | 210,000 | | $ | 17,000 | | $ | 188,000 |
Financial Ratios
| | | |
EBITDA | | 24,813 | |
Total interest expense per income statement | | 9,289 | |
Less amortization of deferred financing fees | | 1,203 | |
| | |
|
|
Cash interest expense | | 8,086 | |
Debt service coverage ratio based on cash interest expense(a) | | 3.1 | |
Scheduled debt principal payments and preferred dividends | | 4,180 | |
Total fixed charges | | 12,266 | |
Fixed charge coverage ratio(b) | | 2.0 | |
Debt to total market capitalization(c) | | 42.8 | % |
Debt plus preferred stock to total market capitalization(d) | | 48.6 | % |
| (a) | EBITDA divided by cash interest expense. Cash interest expense relates to indebtedness less amortized deferred financing fees. Debt service coverage ratio based on GAAP interest expense was 2.7. |
| (b) | EBITDA divided by fixed charges. Fixed charges include cash interest expense as per a above and scheduled debt principal payments and preferred dividends. Fixed charge coverage ratio including noncash interest expense was 1.8. |
| (c) | Mortgage debt and other loans divided by mortgage debt and other loans plus the liquidation value of preferred stock and the market value of outstanding common stock and operating partnership units, assuming the conversion of operating partnership units into shares of our common stock. |
| (d) | Same as (c), except numerator includes preferred stock. |
16
Digital Realty Trust, Inc.
Second Quarter 2005
Debt Maturities
(in thousands)
| | | | | | | | | | | | | | |
Property
| | Remainder of
2005
| | 2006
| | 2007
| | 2008
| | 2009
| | Thereafter
| | Total
|
Secured Term Debt(1) | | 960 | | 2,030 | | 2,150 | | 2,252 | | 2,408 | | 144,078 | | 153,878 |
Lakeside Technology Center(2) | | — | | 523 | | 1,107 | | 98,370 | | — | | — | | 100,000 |
Univision Tower-Mortgage | | 331 | | 702 | | 747 | | 784 | | 55,048 | | — | | 57,612 |
200 Paul Avenue-Mortgage(2) | | 979 | | 44,817 | | — | | — | | — | | — | | 45,796 |
Ardenwood Corporate Park, NTT/Verio Premier Data Center, VarTec Building-Mortgage(3) | | — | | 43,000 | | — | | — | | — | | — | | 43,000 |
Stanford Place II-Mortgage | | — | | — | | — | | — | | 26,000 | | — | | 26,000 |
Carrier Center-Mortgage(4) | | 221 | | 442 | | 25,080 | | — | | — | | — | | 25,743 |
Camperdown House-Mortgage | | 991 | | 2,086 | | 2,233 | | 2,390 | | 17,383 | | — | | 25,083 |
Ardenwood Corporate Park, NTT/Verio Premier Data Center, VarTec Building-Mezzanine(3) | | — | | 22,000 | | — | | — | | — | | — | | 22,000 |
Granite Tower-Mortgage | | 270 | | 540 | | 540 | | 540 | | 19,530 | | — | | 21,420 |
100 Technology Center Drive-Mortgage | | — | | — | | — | | — | | 20,000 | | — | | 20,000 |
Maxtor Manufacturing Facility-Mortgage(2) | | 212 | | 17,540 | | — | | — | | — | | — | | 17,752 |
MAPP Building-Mortgage | | 49 | | 105 | | 114 | | 120 | | 132 | | 9,203 | | 9,723 |
AT&T Web Hosting Facility-Mortgage(2) | | — | | 8,775 | | — | | — | | — | | — | | 8,775 |
Unsecured Credit Facility | | — | | — | | 188,000 | | — | | — | | — | | 188,000 |
| | |
| |
| |
| |
| |
| |
| |
|
Total | | 4,013 | | 142,560 | | 219,971 | | 104,456 | | 140,501 | | 153,281 | | 764,782 |
| | |
| |
| |
| |
| |
| |
| |
|
| (1) | This amount represents six mortgage loans secured by the Company’s interests in 36 Northeast Second Street, Brea Data Center, Comverse Technology Building, Hudson Corporate Center, Siemens Building, and Webb at LBJ. Each of these loans are cross-collateralized by the six properties. |
| (2) | Two one-year extensions are available. |
| (3) | A 13-month extension and a one-year extension are available. |
| (4) | A one-year extension option is available. |
| Note: | Above amounts assume no exercise of extensions. |
17
Digital Realty Trust, Inc.
Second Quarter 2005
Occupancy Analysis
As of June 30, 2005
| | | | | | | | | | | | | | | | | | | | | | | | | | | |
| | | Acquisition date
| | Metropolitan Area
| | Net Rentable
Square Feet
| | Annualized
Rent(1)
| | Occupancy
| | | Square Feet
as a % of
| | | Annualized Rent
as a % of
| |
Property
| | | | | | As of
6/30/05
| | | As of
3/31/05
| | | Property
Type
| | | Total
Portfolio
| | | Property
Type
| | | Total
Portfolio
| |
Telecommunications Infrastructure | | | | | | | | | | | | | | | | | | | | | | | | | | | |
Lakeside Technology Center | | May 2005 | | Chicago | | 805,150 | | $ | 19,107,622 | | 89.3 | (2)% | | N/A | % | | 29.0 | % | | 10.3 | | | 32.6 | % | | 13.5 | % |
200 Paul Avenue | | Nov. 2004 | | San Francisco | | 532,238 | | $ | 11,831,316 | | 87.1 | | | 83.4 | | | 19.1 | | | 6.8 | | | 20.2 | | | 8.3 | |
Univision Tower | | Jan. 2002 | | Dallas | | 477,107 | | $ | 8,305,773 | | 80.3 | | | 79.9 | | | 17.2 | | | 6.1 | | | 14.2 | | | 5.8 | |
Carrier Center | | May 2004 | | Los Angeles | | 490,078 | | $ | 7,333,289 | | 72.3 | | | 79.7 | | | 17.6 | | | 6.3 | | | 12.5 | | | 5.2 | |
Camperdown House | | July 2002 | | London, UK | | 63,233 | | $ | 3,980,460 | | 100.0 | | | 100.0 | | | 2.3 | | | 0.8 | | | 6.8 | | | 2.8 | |
1100 Space Park Drive | | Nov. 2004 | | Silicon Valley | | 167,951 | | $ | 3,522,947 | | 46.6 | | | 46.6 | | | 6.0 | | | 2.2 | | | 6.0 | | | 2.5 | |
36 Northeast Second Street | | Jan. 2002 | | Miami | | 162,140 | | $ | 3,129,972 | | 81.2 | | | 81.2 | | | 5.8 | | | 2.1 | | | 5.3 | | | 2.2 | |
Burbank Data Center | | Dec. 2004 | | Los Angeles | | 82,911 | | $ | 1,414,300 | | 100.0 | | | 100.0 | | | 3.0 | | | 1.1 | | | 2.4 | | | 1.0 | |
| | | | | | |
| |
|
| |
|
| |
|
| |
|
| |
|
| |
|
| |
|
|
| | | | | | | 2,780,808 | | | 58,625,679 | | 81.9 | | | 80.9 | | | 100.0 | | | 35.7 | | | 100.0 | | | 41.3 | |
Information Technology Infrastructure | | | | | | | | | | | | | | | | | | | | | | | | | | | |
833 Chestnut Street | | March 2005 | | Philadelphia | | 547,195 | | | 7,178,893 | | 91.5 | (2) | | 91.5 | | | 18.2 | | | 7.0 | | | 14.5 | | | 5.1 | |
Hudson Corporate Center | | Nov. 2002 | | New York | | 311,950 | | | 6,867,246 | | 87.4 | | | 87.4 | | | 10.4 | | | 4.0 | | | 13.9 | | | 4.8 | |
Savvis Data Center 1 | | May 2004 | | Silicon Valley | | 300,000 | | | 5,760,000 | | 100.0 | | | 100.0 | | | 10.0 | | | 3.8 | | | 11.7 | | | 4.1 | |
Webb at LBJ | | Aug. 2004 | | Dallas | | 365,648 | | | 4,615,911 | | 90.5 | | | 90.6 | | | 12.2 | | | 4.7 | | | 9.3 | | | 3.3 | |
AboveNet Data Center | | Sept. 2004 | | Silicon Valley | | 187,334 | | | 4,431,834 | | 95.7 | | | 96.2 | | | 6.2 | | | 2.4 | | | 9.0 | | | 3.1 | |
NTT/Verio Premier Data Center | | Dec. 2002 | | Silicon Valley | | 130,752 | | | 3,932,448 | | 100.0 | | | 100.0 | | | 4.3 | | | 1.7 | | | 8.0 | | | 2.8 | |
Savvis Data Center 2 | | June 2005 | | Silicon Valley | | 167,932 | | | 3,027,814 | | 100.0 | | | N/A | | | 5.6 | | | 2.2 | | | 6.1 | | | 2.1 | |
Savvis Data Center 3 | | June 2005 | | Los Angeles | | 113,606 | | | 2,048,316 | | 100.0 | | | N/A | | | 3.8 | | | 1.5 | | | 4.1 | | | 1.4 | |
Savvis Data Center 4 | | June 2005 | | Silicon Valley | | 103,940 | | | 1,874,038 | | 100.0 | | | N/A | | | 3.5 | | | 1.3 | | | 3.8 | | | 1.3 | |
Savvis Data Center 5 | | June 2005 | | Silicon Valley | | 90,139 | | | 1,625,206 | | 100.0 | | | N/A | | | 3.0 | | | 1.2 | | | 3.3 | | | 1.1 | |
Ameriquest | | June 2005 | | Denver | | 82,229 | | | 1,521,240 | | 100.0 | | | N/A | | | 2.7 | | | 1.1 | | | 3.1 | | | 1.1 | |
eBay Data Center | | Oct. 2004 | | Sacramento | | 62,957 | | | 1,479,943 | | 100.0 | | | 100.0 | | | 2.1 | | | 0.8 | | | 3.0 | | | 1.0 | |
VarTec Building | | Jan. 2003 | | Dallas | | 135,250 | | | 1,352,500 | | 100.0 | | | 100.0 | | | 4.5 | | | 1.7 | | | 2.7 | | | 1.0 | |
MAPP Building | | March 2005 | | Minneapolis/St. Paul | | 88,134 | | | 1,339,637 | | 100.0 | | | 100.0 | | | 2.9 | | | 1.1 | | | 2.7 | | | 0.9 | |
Brea Data Center | | Aug. 2003 | | Los Angeles | | 68,807 | | | 1,228,194 | | 100.0 | | | 100.0 | | | 2.3 | | | 0.9 | | | 2.5 | | | 0.9 | |
AT&T Web Hosting Facility | | June 2003 | | Atlanta | | 250,191 | | | 1,137,564 | | 50.5 | | | 50.5 | | | 8.3 | | | 3.2 | | | 2.3 | | | 0.8 | |
| | | | | | |
| |
|
| |
|
| |
|
| |
|
| |
|
| |
|
| |
|
|
| | | | | | | 3,006,064 | | | 49,420,784 | | 91.6 | | | 89.1 | | | 100.0 | | | 38.6 | | | 100.0 | | | 34.8 | |
Technology Manufacturing | | | | | | | | | | | | | | | | | | | | | | | | | | | |
Ardenwood Corporate Park | | Jan. 2003 | | Silicon Valley | | 307,657 | | | 7,852,980 | | 100.0 | | | 100.0 | | | 50.9 | | | 3.9 | | | 57.0 | | | 5.5 | |
Maxtor Manufacturing Facility | | Sept. 2003 | | Silicon Valley | | 183,050 | | | 3,371,122 | | 100.0 | | | 100.0 | | | 30.3 | | | 2.3 | | | 24.5 | | | 2.4 | |
ASM Lithography Training Facility | | May 2003 | | Phoenix | | 113,405 | | | 2,549,165 | | 100.0 | | | 100.0 | | | 18.8 | | | 1.5 | | | 18.5 | | | 1.8 | |
| | | | | | |
| |
|
| |
|
| |
|
| |
|
| |
|
| |
|
| |
|
|
| | | | | | | 604,112 | | | 13,773,267 | | 100.0 | | | 100.0 | | | 100.0 | | | 7.7 | | | 100.0 | | | 9.7 | |
Technology Office/Corporate Headquarters | | | | | | | | | | | | | | | | | | | | | | | | | | | |
Comverse Technology Building | | June 2004 | | Boston | | 386,956 | | | 5,989,152 | | 100.0 | | | 100.0 | | | 27.6 | | | 5.0 | | | 29.8 | | | 4.2 | |
Stanford Place II | | Sept. 2003 | | Denver | | 366,184 | | | 3,201,311 | | 91.9 | | | 88.4 | | | 26.2 | | | 4.7 | | | 15.9 | | | 2.3 | |
100 Technology Center Drive | | Feb. 2004 | | Boston | | 197,000 | | | 3,743,000 | | 100.0 | | | 100.0 | | | 14.1 | | | 2.5 | | | 18.6 | | | 2.6 | |
Granite Tower | | Sept. 2003 | | Dallas | | 240,065 | | | 3,391,390 | | 94.3 | | | 94.6 | | | 17.1 | | | 3.1 | | | 16.9 | | | 2.4 | |
Siemens Building | | April 2004 | | Dallas | | 125,538 | | | 2,262,735 | | 100.0 | | | 100.0 | | | 9.0 | | | 1.6 | | | 11.2 | | | 1.6 | |
Savvis Office Building | | June 2005 | | Silicon Valley | | 84,383 | | | 1,521,425 | | 100.0 | | | N/A | | | 6.0 | | | 1.1 | | | 7.6 | | | 1.1 | |
| | | | | | |
| |
|
| |
|
| |
|
| |
|
| |
|
| |
|
| |
|
|
| | | | | | | 1,400,126 | | | 20,109,013 | | 96.9 | | | 95.8 | | | 100.0 | | | 18.0 | | | 100.0 | | | 14.2 | |
| | | | | | |
| |
|
| |
|
| |
|
| |
|
| |
|
| |
|
| |
|
|
Portfolio Total/Weighted Average | | | | | | 7,791,110 | | $ | 141,928,743 | | 89.7 | % | | 88.9 | % | | 100.0 | % | | 100.0 | % | | 100.0 | % | | 100.0 | % |
| | | | | | |
| |
|
| |
|
| |
|
| |
|
| |
|
| |
|
| |
|
|
| (1) | Annualized rent represents the annualized monthly contractual rent under existing leases as of June 30, 2005. This amount reflects total base rent before any one-time or non-recurring rent abatements, but after annually recurring rent credits and is shown on a net basis; thus, for any tenant under a partial gross lease, the expense stop, or under a full gross lease, the current year operating expenses (which may be estimates as of such date), are subtracted from gross rent. |
| (2) | The properties at Lakeside Technology Center and 833 Chestnut Street have an additional 290,000 and 107,563 square feet, respectively of vacant space held for redevelopment. The occupancy percentage presented excludes the space available for redevelopment. |
18
Digital Realty Trust, Inc.
Second Quarter 2005
Major Tenants
As of June 30, 2005
| | | | | | | | | | | | | | | |
Tenant
| | Number of
Locations
| | Total
Occupied
Square
Feet (1)
| | Percentage of
Net Rentable
Square Feet
| | | Annualized
Rent
| | Percentage of
Annualized
Rent
| | | Weighted
Average
Remaining
Lease Term
in Months
|
1 Savvis Communications | | 9 | | 1,119,401 | | 14.4 | % | | $ | 22,573,500 | | 15.9 | % | | 132 |
2 Qwest Communications International, Inc. | | 7 | | 610,181 | | 7.8 | % | | | 16,878,209 | | 11.9 | % | | 113 |
3 Verio Inc.(2) | | 2 | | 238,051 | | 3.1 | % | | | 6,663,756 | | 4.7 | % | | 87 |
4 Equinix, Inc. | | 2 | | 272,904 | | 3.5 | % | | | 5,933,780 | | 4.2 | % | | 119 |
5 Comverse Network Systems | | 2 | | 367,033 | | 4.7 | % | | | 5,690,307 | | 4.0 | % | | 68 |
6 Abgenix | | 1 | | 131,386 | | 1.7 | % | | | 5,114,252 | | 3.6 | % | | 70 |
7 Leslie & Godwin(3) | | 2 | | 63,233 | | 0.8 | % | | | 3,980,460 | | 2.8 | % | | 54 |
8 Stone & Webster, Inc. | | 1 | | 197,000 | | 2.5 | % | | | 3,743,000 | | 2.6 | % | | 93 |
9 AboveNet | | 3 | | 135,103 | | 1.7 | % | | | 3,673,549 | | 2.6 | % | | 171 |
10 Maxtor Corporation | | 1 | | 183,050 | | 2.3 | % | | | 3,371,122 | | 2.4 | % | | 75 |
11 SBC Communications | | 1 | | 141,663 | | 1.8 | % | | | 2,773,762 | | 2.0 | % | | 75 |
12 XO | | 5 | | 98,636 | | 1.3 | % | | | 2,770,070 | | 2.0 | % | | 115 |
13 Tycom Networks, Inc. | | 1 | | 59,289 | | 0.8 | % | | | 2,721,041 | | 1.9 | % | | 137 |
14 Thomas Jefferson University | | 1 | | 185,707 | | 2.4 | % | | | 2,594,810 | | 1.8 | % | | 65 |
15 ASML US, Inc. | | 1 | | 113,405 | | 1.5 | % | | | 2,549,165 | | 1.8 | % | | 140 |
| | | | |
| |
|
| |
|
| |
|
| |
|
Total/Weighted Average | | | | 3,916,042 | | 50.3 | % | | $ | 91,030,783 | | 64.1 | % | | 107 |
| | | | |
| |
|
| |
|
| |
|
| |
|
| (1) | Occupied square footage is defined as leases that have commenced on or before June 30, 2005. |
| (2) | Verio is a wholly-owned subsidiary of Nippon Telegraph & Telephone. |
| (3) | Leslie & Godwin is a United Kingdom subsidiary of AON Corporation. |
19
Digital Realty Trust, Inc.
Second Quarter 2005
Lease Expirations
As of June 30, 2005
| | | | | | | | | | | | | | | | | | | | | | |
Year
| | Number of
Leases
Expiring
| | Square
Footage of
Expiring
Leases
| | Percentage of
Net Rentable
Square Feet
| | | Annualized
Rent
| | Percentage of
Annualized
Rent
| | | Annualized
Rent Per
Occupied
Square
Foot
| | Annualized
Rent Per
Occupied
Square
Foot at
Expiration
| | Annualized
Rent at
Expiration
|
Available | | | | 800,653 | | 10.3 | % | | $ | — | | 0.0 | % | | | | | | | | | |
2005 | | 15 | | 46,273 | | 0.6 | % | | | 754,467 | | 0.5 | % | | $ | 16.30 | | $ | 17.58 | | $ | 813,618 |
2006 | | 30 | | 220,307 | | 2.8 | % | | | 3,142,331 | | 2.2 | % | | $ | 14.26 | | $ | 15.00 | | | 3,305,554 |
2007 | | 28 | | 145,315 | | 1.9 | % | | | 2,644,800 | | 1.9 | % | | $ | 18.20 | | $ | 20.41 | | | 2,965,536 |
2008 | | 36 | | 253,041 | | 3.3 | % | | | 5,470,160 | | 3.9 | % | | $ | 21.62 | | $ | 22.86 | | | 5,784,337 |
2009 | | 34 | | 447,715 | | 5.7 | % | | | 10,221,269 | | 7.2 | % | | $ | 22.83 | | $ | 24.56 | | | 10,996,466 |
2010 | | 41 | | 905,552 | | 11.6 | % | | | 18,208,254 | | 12.8 | % | | $ | 20.11 | | $ | 22.22 | | | 20,120,769 |
2011 | | 26 | | 1,156,425 | | 14.9 | % | | | 24,338,375 | | 17.1 | % | | $ | 21.05 | | $ | 24.05 | | | 27,814,311 |
2012 | | 9 | | 134,740 | | 1.7 | % | | | 2,637,258 | | 1.8 | % | | $ | 19.57 | | $ | 22.81 | | | 3,073,558 |
2013 | | 15 | | 632,975 | | 8.1 | % | | | 9,899,745 | | 7.0 | % | | $ | 15.64 | | $ | 17.41 | | | 11,020,953 |
2014 | | 22 | | 571,689 | | 7.3 | % | | | 9,025,637 | | 6.4 | % | | $ | 15.79 | | $ | 20.30 | | | 11,606,422 |
Thereafter | | 52 | | 2,476,425 | | 31.8 | % | | | 55,586,447 | | 39.2 | % | | $ | 22.45 | | $ | 31.51 | | | 78,025,883 |
| | |
| |
| |
|
| |
|
| |
|
| | | | | | | |
|
|
Portfolio Total / Weighted Average | | 308 | | 7,791,110 | | 100.0 | % | | $ | 141,928,743 | | 100.0 | % | | $ | 20.30 | | $ | 25.11 | | $ | 175,527,407 |
| | |
| |
| |
|
| |
|
| |
|
| | | | | | | |
|
|
20
Digital Realty Trust, Inc.
Second Quarter 2005
Lease Distribution
As of June 30, 2005
| | | | | | | | | | | | | | | | |
Square Feet Under Lease
| | Number of
Leases
| | Percentage
of All
Leases
| | | Total Net
Rentable
Square
Feet
| | Percentage of
Net Rentable
Square Feet
| | | Annualized
Rent
| | Percentage of
Annualized
Rent
| |
Available | | | | | | | 800,653 | | 10.3 | % | | $ | — | | 0.0 | % |
2,500 or less | | 113 | | 36.7 | % | | 101,210 | | 1.3 | % | | | 4,555,423 | | 3.2 | % |
2,501 - 10,000 | | 71 | | 23.0 | % | | 377,421 | | 4.8 | % | | | 7,530,278 | | 5.3 | % |
10,001 - 20,000 | | 40 | | 13.0 | % | | 599,497 | | 7.7 | % | | | 12,077,305 | | 8.5 | % |
20,001 - 40,000 | | 37 | | 12.0 | % | | 1,004,516 | | 12.9 | % | | | 15,596,598 | | 11.0 | % |
40,001 - 100,000 | | 27 | | 8.8 | % | | 1,815,395 | | 23.3 | % | | | 40,908,567 | | 28.8 | % |
Greater than 100,000 | | 20 | | 6.5 | % | | 3,092,418 | | 39.7 | % | | | 61,260,572 | | 43.2 | % |
| | |
| |
|
| |
| |
|
| |
|
| |
|
|
Portfolio Total | | 308 | | 100.0 | % | | 7,791,110 | | 100.0 | % | | $ | 141,928,743 | | 100.0 | % |
| | |
| |
|
| |
| |
|
| |
|
| |
|
|
21
Digital Realty Trust, Inc.
Second Quarter 2005
Leasing Activity
As of June 30, 2005
| | | | | | | |
| | | For the Three
Months Ended June
30, 2005
| | | % Leased
| |
Occupied Square Feet as of March 31, 2005 | | 5,600,470 | | | | 88.9 | % |
Q2 2005 Acquisition: Lakeside Technology Center(1) | | 718,921 | | | | | |
Q2 2005 Acquisition: Ameriquest | | 82,229 | | | | | |
Q2 2005 Acquisition: Savvis #3 | | 113,606 | | | | | |
Q2 2005 Acquisition: Savvis #2 | | 167,932 | | | | | |
Q2 2005 Acquisition: Savvis #4 | | 103,940 | | | | | |
Q2 2005 Acquisition: Savvis #5 | | 90,139 | | | | | |
Q2 2005 Acquisition: Savvis Office Building | | 84,383 | | | | | |
| | |
|
| | | | |
Occupied Square Feet including Q2 2005 Acquisitions | | 6,961,620 | | | | 89.4 | % |
Expirations | | (6,573 | ) | | | (0.1 | %) |
New Leases | | 41,967 | | | | 0.5 | % |
Renewals | | 4,517 | | | | 0.1 | % |
Expansions | | 424 | | | | 0.0 | % |
Remeasurements(2) | | 56,670 | | | | 0.7 | % |
Terminations | | (68,168 | ) | | | (0.9 | %) |
| | |
|
| |
|
|
|
Occupied Square Feet as of June 30, 2005 | | 6,990,457 | | | | 89.7 | % |
| | |
|
| |
|
|
|
Cash Rent Growth(3) | | | | | | | |
Expiring Rate per Square Foot | | | | | $ | 15.43 | |
New / Renewed Rate per Square Foot | | | | | $ | 58.73 | |
Percentage Increase | | | | | | 280.7 | % |
GAAP Rent Growth(4) | | | | | | | |
Expiring Rate per Square Foot | | | | | $ | 22.50 | |
New / Renewed Rate per Square Foot | | | | | $ | 60.65 | |
Percentage Increase | | | | | | 169.6 | % |
Weighted Average Lease Term - New (in months) | | | | | | 42 | |
Weighted Average Lease Term - Renewal (in months) | | | | | | 60 | |
| (1) | Excludes space held for redevelopment. |
| (2) | Represents remeasuring of building to BOMA standards. |
| (3) | Represents the difference between (i) initial contractual rents on new and renewed leases and (ii) the cash rents on expiring leases immediately prior to the expiration or termination. |
| (4) | Represents estimated cash rent growth adjusted for straight-line rents in accordance with GAAP. |
22
Digital Realty Trust, Inc.
Second Quarter 2005
Tenant Improvements and Leasing Commissions
As of June 30, 2005
| | | | | | | | | | | | | | | |
| | | | | | | Full Year
|
| | | Q2 2005
| | Q1 2005
| | 2004
| | 2003
| | 2002
|
Renewals(1) | | | | | | | | | | | | | | | |
Number of renewals | | | 1 | | | 3 | | | 4 | | | 10 | | | 5 |
Square Feet | | | 4,517 | | | 12,295 | | | 19,079 | | | 78,172 | | | 28,418 |
Tenant improvement costs per square foot(2) | | $ | 20.00 | | $ | 3.93 | | $ | 15.06 | | $ | 1.83 | | $ | 4.12 |
Leasing commission costs per square foot(2) | | | 6.24 | | | 9.11 | | | 6.78 | | | 6.09 | | | 5.08 |
Total tenant improvement and leasing commission costs per square foot | | $ | 26.24 | | $ | 13.04 | | $ | 21.84 | | $ | 7.92 | | $ | 9.20 |
| | | | | |
New Leases(3) | | | | | | | | | | | | | | | |
Number of leases | | | 18 | | | 6 | | | 34 | | | 18 | | | 4 |
Square Feet | | | 41,967 | | | 15,762 | | | 220,868 | | | 229,211 | | | 34,794 |
Tenant improvement costs per square foot(2) | | $ | 5.10 | | $ | 13.01 | | $ | 14.55 | | $ | 2.27 | | $ | 14.34 |
Leasing commission costs per square foot(2) | | | 8.58 | | | 4.54 | | | 10.08 | | | 12.55 | | | 12.37 |
Total tenant improvement and leasing commission costs per square foot | | $ | 13.68 | | $ | 17.55 | | $ | 24.63 | | $ | 14.82 | | $ | 26.71 |
| | | | | |
Total(4) | | | | | | | | | | | | | | | |
Number of leases/renewals | | | 19 | | | 9 | | | 38 | | | 28 | | | 9 |
Square Feet | | | 46,484 | | | 28,057 | | | 239,947 | | | 307,383 | | | 63,212 |
Tenant improvement costs per square foot(2) | | $ | 6.55 | | $ | 9.03 | | $ | 14.59 | | $ | 2.16 | | $ | 9.75 |
Leasing commission costs per square foot(2) | | | 8.35 | | | 6.54 | | | 9.82 | | | 10.91 | | | 9.09 |
Total tenant improvement and leasing commission costs per square foot | | $ | 14.90 | | $ | 15.57 | | $ | 24.41 | | $ | 13.07 | | $ | 18.84 |
| (1) | Does not include retained tenants that have relocated to new space or expanded into new space. |
| (2) | Assumes all tenant improvement and leasing commissions are paid in the calendar year in which the lease commences, which may be different than the year in which they are actually paid. |
| (3) | Includes retained tenants that have relocated to new space or expanded into new space within our portfolio. |
| (4) | We have acquired several properties in the past which may make a period over period comparison difficult. For a list of the acquisition dates of our properties see page 18. |
23
Digital Realty Trust, Inc.
Second Quarter 2005
Historical Capital Expenditures
As of June 30, 2005
| | | | | | | | | | | | | | | |
| | | | | | | Full Year
|
| | | Q2 2005
| | Q1 2005
| | 2004
| | 2003
| | 2002
|
Recurring capital expenditures(1) (2) | | $ | 91,049 | | $ | 266,974 | | $ | 711,998 | | $ | 388,636 | | $ | 208,758 |
Non-recurring capital expenditures(2) | | $ | 1,604,007 | | $ | 1,352,219 | | $ | 2,168,837 | | $ | 765,587 | | $ | 430,183 |
Total square feet at period end | | | 7,791,110 | | | 6,303,226 | | | 5,652,700 | | | 2,792,266 | | | 1,145,182 |
Recurring capital expenditures per square foot | | $ | 0.01 | | $ | 0.04 | | $ | 0.13 | | $ | 0.14 | | $ | 0.18 |
Non-recurring capital expenditures per square foot | | $ | 0.21 | | $ | 0.21 | | $ | 0.38 | | $ | 0.27 | | $ | 0.38 |
| (1) | Recurring capital expenditures represents non-incremental building improvements required to maintain current revenues. Recurring capital expenditures do not include acquisition capital that was taken into consideration when underwriting the purchase of a building or which are incurred to bring a building up to “operating standard” |
| (2) | We have acquired several properties in the past which may make a period over period comparison difficult. For a list of the acquisition dates of our properties see page 18. |
24
Digital Realty Trust, Inc.
Second Quarter 2005
MANAGEMENT STATEMENTS ON NON-GAAP SUPPLEMENTAL MEASURES
Funds from Operations:
We calculate Funds from Operations, or FFO, in accordance with the standards established by the National Association of Real Estate Investment Trusts, or NAREIT. FFO represents net income (loss) (computed in accordance with GAAP), excluding gains (or losses) from sales of property, real estate related depreciation and amortization (excluding amortization of deferred financing costs) and after adjustments for unconsolidated partnerships and joint ventures. Management uses FFO as a supplemental performance measure because, in excluding real estate related depreciation and amortization and gains and losses from property dispositions, it provides a performance measure that, when compared year over year, captures trends in occupancy rates, rental rates and operating costs. We also believe that, as a widely recognized measure of the performance of REITs, FFO will be used by investors as a basis to compare our operating performance with that of other REITs. However, because FFO excludes depreciation and amortization and captures neither the changes in the value of our properties that result from use or market conditions, nor the level of capital expenditures and leasing commissions necessary to maintain the operating performance of our properties, all of which have real economic effect and could materially impact our results from operations, the utility of FFO as a measure of our performance is limited. Other REITs may not calculate FFO in accordance with the NAREIT definition and, accordingly, our FFO may not be comparable to such other REITs’ FFO. Accordingly, FFO should be considered only as a supplement to net income as a measure of our performance.
Adjusted Funds From Operations:
We present adjusted funds from operations, or AFFO, as a supplemental operating measure because, when compared year over year, it assesses our ability to fund dividend and distribution requirements from our operating activities. We also believe that, as a widely recognized measure of the operations of REITs, AFFO will be used by investors as a basis to assess our ability to fund dividend payments in comparison to other REITs. We calculate adjusted funds from operations, or AFFO, by adding to or subtracting from FFO (i) non-real estate depreciation, (ii) amortization of deferred financing costs (iii) noncash compensation (iv) loss from early extinguishment of debt (v) straight line rents (vi) fair valule of lease revenue amortization (vii) capitalized leasing payroll (viii) recurring tenant improvements and (ix) capitalized leasing commissions. Other equity REITs may not calculate AFFO in a consistent manner. Accordingly, our AFFO may not be comparable to other equity REITs’ AFFO. AFFO should be considered only as a supplement to net income computed in accordance with GAAP as a measure of our operations.
EBITDA:
We believe that earnings before interest, income taxes, depreciation and amortization, or EBITDA, is a useful supplemental performance measure. Management uses EBITDA as an indicator of our ability to incur and service debt. We believe EBITDA is an appropriate supplemental measure for such purposes, because the amounts spent on interest are, by definition, available to pay interest, income tax expense is inversely correlated to interest expense because tax expense goes down as deductible interest expense goes up, and depreciation and amortization are non-cash charges. In addition, we believe EBITDA is frequently used by securities analysts, investors and other interested parties in the evaluation of REITs. Because EBITDA is calculated before recurring cash charges including interest expense and income taxes, and is not adjusted for capital expenditures or other recurring cash requirements of our business, its utility as a measure of our performance is limited. Accordingly, EBITDA should be considered only as supplement to net income (computed in accordance with GAAP) as a measure of our financial performance. Other equity REITs may calculate EBITDA differently than we do; accordingly, our EBITDA may not comparable to such other REITs’ EBITDA.
25