December 2005 Road Show Presentation Exhibit 99.1 |
1 Forward Looking Statements The information included in this presentation contains forward-looking statements. Such statements are based on management’s beliefs and assumptions made based on information currently available to management. Such forward looking statements include statements and projections related to 2005 and 2006 FFO, growth in the e-commerce market, the digital communication and distribution market, the market effects of regulatory requirements, the disaster recovery market, the replacement cost of our assets, capitalization rates for our properties and other properties, the effect new leases will have on our rental revenues and results of operations, lease expiration rates, the effect of leasing and acquisition on our FFO, FFO payout ratio and implied cap rates and our implied valuation using these cap rates and other metrics. Such statements are subject to risks, uncertainties and assumptions and are not guarantees of future performance and may be affected by known and unknown risks, trends, uncertainties and factors that are beyond our control that may cause actual results to vary materially. Some of the risks and uncertainties include, among others, the following: adverse economic or real estate developments in our markets or the technology industry; general and local economic conditions; defaults on or non-renewal of leases by tenants; difficulty acquiring or operating properties in foreign jurisdictions, changes in foreign laws and regulations, including those related to taxation and real estate ownership and operation, increased interest rates and operating costs; inability to acquire new properties (including those we are in the process of acquiring); our failure to obtain necessary outside financing; decreased rental rates or increased vacancy rates; difficulties in identifying properties to acquire and completing acquisitions; our failure to successfully operate acquired properties and operations; our failure to maintain our status as a REIT; possible adverse changes to tax law; environmental uncertainties and risks related to natural disasters; financial market fluctuations; changes in foreign currency exchange rates; and changes in real estate and zoning laws and increases in real property tax rates. The risks described above are not exhaustive, and additional factors could adversely affect our business and financial performance, including those discussed in our annual report on Form 10-K for the year ended December 31, 2004 and other filings with the Securities and Exchange Commission. We expressly disclaim any responsibility to update forward-looking statements, whether as a result of new information, future events or otherwise. |
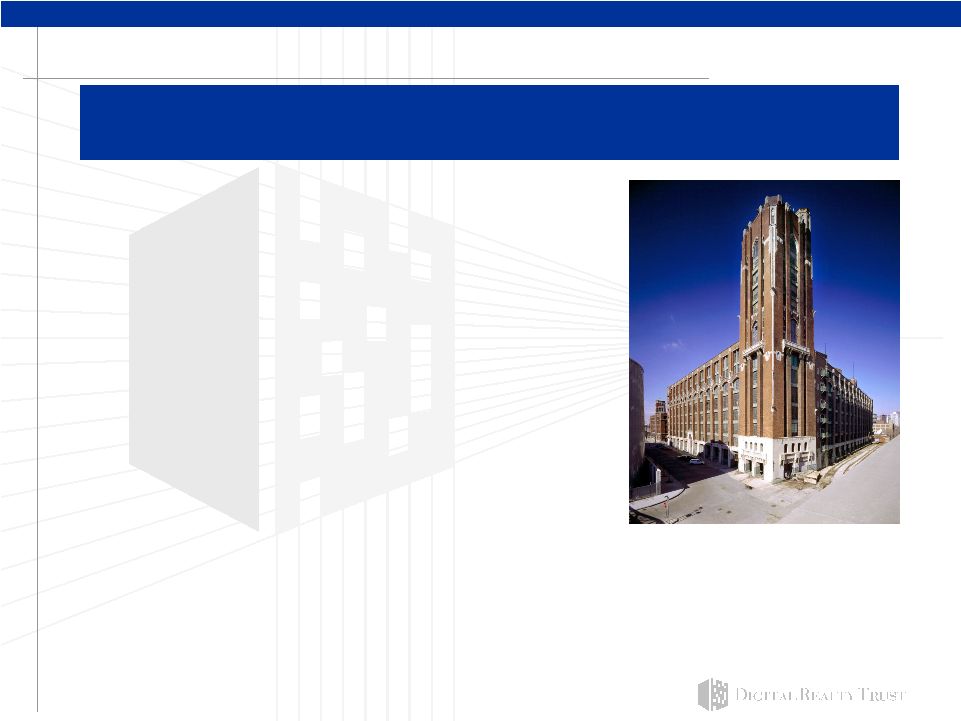
2 Digital Realty Trust Overview • Tenants consist of leading global companies diversified across various industries • Own 41 properties comprising 8.0 million rentable sq ft excluding 732,000 sq ft of additional space held for redevelopment • Portfolio occupancy of 93.2% (1) • Assets strategically located in top technology markets in US and Western Europe DLR is a leading institutional owner focused on mission critical technology properties in the US and Western Europe Lakeside Tech Center Chicago, IL Note: Unless otherwise indicated, information as of November 29, 2005. (1) Leasing calculated based on in place leases as of September 30, 2005 and excludes approximately 732,000 square feet of space held for redevelopment. |
3 DLR investment highlights • Specialized focus in dynamic and growing industries • High quality portfolio that is difficult to replicate • Experienced industry consolidator with proven ability to acquire assets below replacement cost • Acquisition and leasing pace creates potential for strong FFO growth • Uniquely positioned as both a value and growth REIT Univision Tower Dallas, TX |
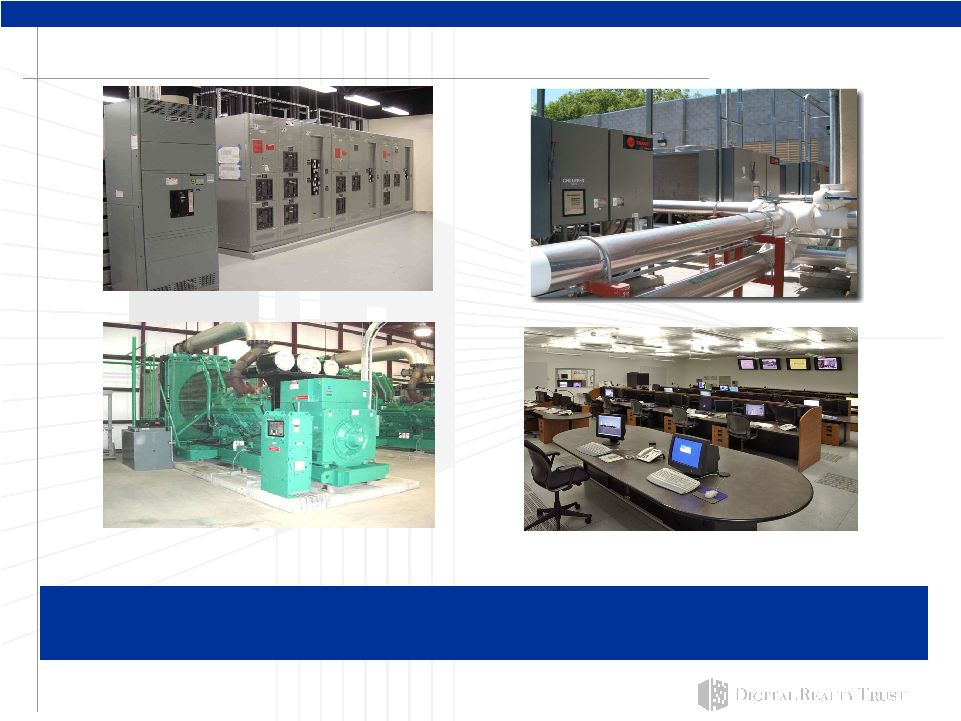
4 DLR properties feature advanced technical systems Power backup/redundancy Power management/conversion Precision air cooling/handling Systems and security controls Between $500 and $1,000 psf typically invested in DLR buildings, creating a barrier to exit for tenants and discouraging speculative new supply |
5 DLR is unique in its focus on technology properties Data Centers (34% (1) ) Internet Gateways (43% (1) ) Financial Health/Insurance Communications Internet Enterprise • Storage/server intensive buildings • Provide a secure 24 x 7 environment for the storage and processing of mission-critical electronic information • Used to house the primary IT operations of leading companies, transaction processing and disaster recovery purposes • Internet and telecom network intensive buildings • Serve as the hub for Internet and data communications within and between major metropolitan areas • Market-dominant position in their respective MSAs • Frequently serve as a super- regional connection point with multiple anchor tenants (1) Calculated based on annualized rents using in place leases as of September 30, 2005. IT Services |
6 Strong trends drive sustained demand for DLR space • IDC predicts that US residential VOIP subscribers will grow to 27M in 2009 from 3M in 2005 (73% growth per year) • Wall Street Journal reports corporate data storage capacity is expanding 60% a year • SEC, NYSE, and NASD business continuity and records retention rules require financial information for over six years, records backup, etc. • Forrester Research expects US online retail sales to increase to $329B in 2010 from $172B in 2005 (14% growth per year) Trends E-Commerce Digital Communication & Distribution Regulatory Requirements Disaster Recovery |
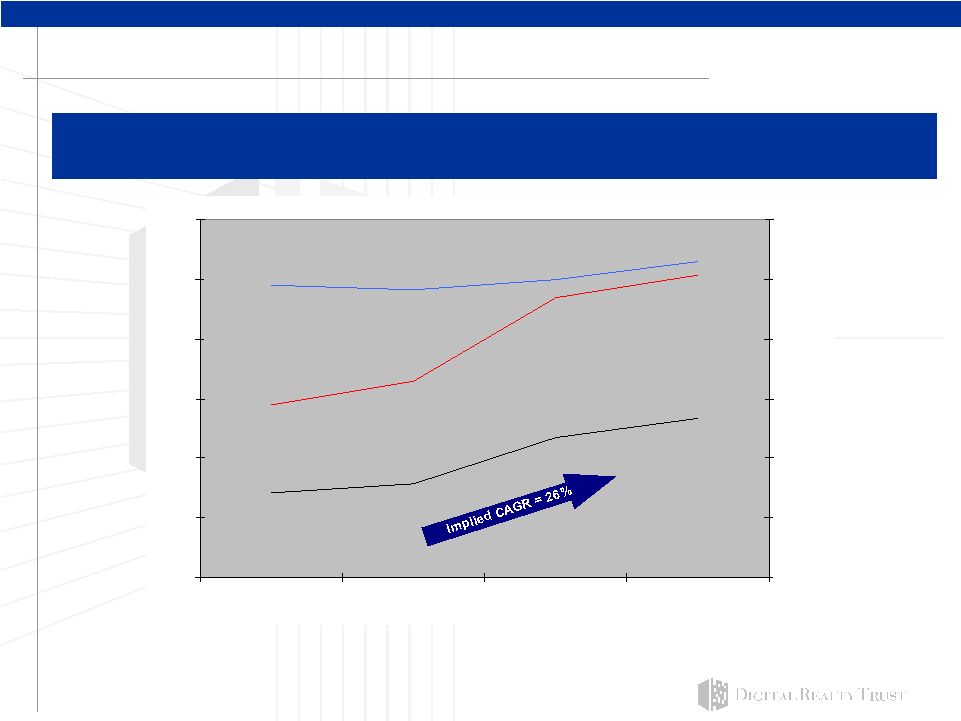
7 0% 10% 20% 30% 40% 50% 60% 2002 2003 2004 3Q2005 $- $100 $200 $300 $400 $500 $600 Source: Estimated based on reported cabinet (available and billing), square feet and revenue data from Equinix and Savvis as per press releases, SEC filings, research reports and internal DLR estimates as of October 28, 2005. Assumes 35 sq ft per cabinet throughout period if square feet not reported. Equinix and Savvis, two leading managed service providers that “resell” space leased directly from DLR, are experiencing strong growth in revenues and utilization Bill rates and utilization rates are escalating Revenue PSF Utilization Rate Revenue PSF (Utilized) Revenue PSF (Total) Utilization Rate $491 psf $529 psf $142 psf $266 psf 29% 51% |
8 • Former General Manager of Critical Facilities for EDS • 18+ years of technology infrastructure experience Ted Martin Director of Operations • Former Director of Sales, Nortel Networks • 13+ years of technology business experience Christopher Crosby VP Sales & Tech Svcs • Former Head of GI Partners real estate acquisitions • 17+ years of real estate experience Scott Peterson Sr. VP Acquisitions • Former President & CFO of TriNet • 24+ years of finance and real estate experience A. William Stein CFO/CIO • Co-founder of Digital Realty Trust • 25+ years of real estate and technology experience Michael Foust CEO • Co-founder of Digital Realty Trust • 23+ years of real estate and technology experience Richard Magnuson Executive Chairman Senior management leads a complete REIT team • Relevant experience • Proven track record • Public markets background DLR is organized and managed to deliver growth Management is supported by a team of approximately 50 professionals in the US and Europe focused on executing DLR’s core strategy |
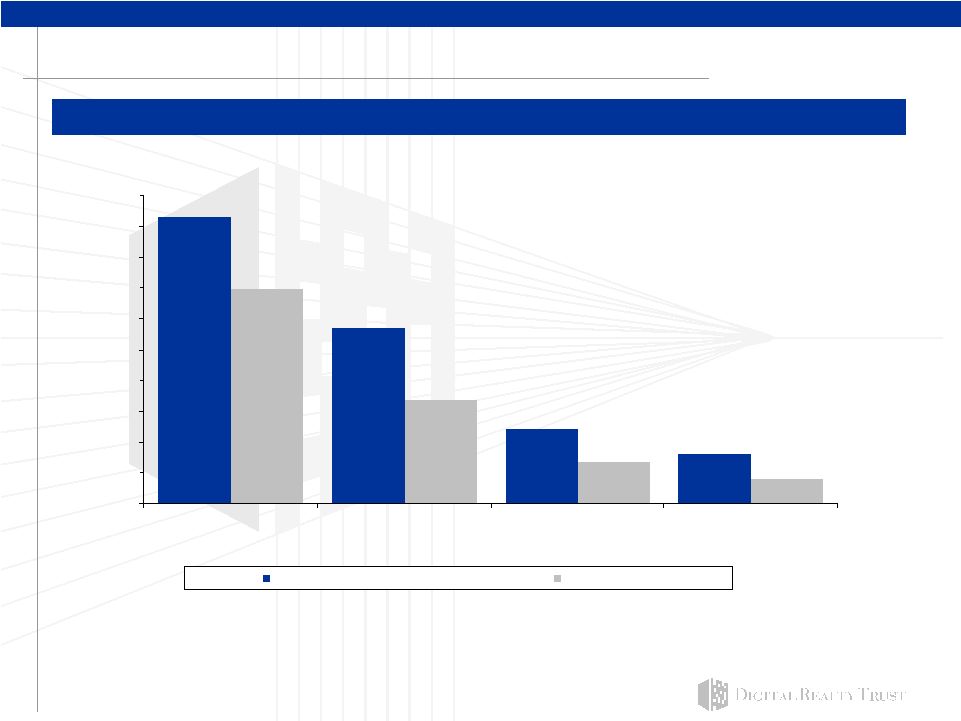
9 Since its IPO, DLR has outperformed its peers and the RMS DLR is a top performing 2004 REIT IPO Note: Total return as of November 25, 2005 assuming dividend reinvestment as per Factset. IPO date: October 29, 2004. (1) Tech Real Estate composite includes ARE, BMR and GSL. (2) Mixed Office / Industrial composite includes BED, GLB, MSW, PSB, KRC, HIW, LRY and DRE. 69.9% 33.5% 13.5% 8.1% 16.2% 24.3% 56.9% 93.0% 0% 10% 20% 30% 40% 50% 60% 70% 80% 90% 100% DLR Tech Real Estate composite RMS Mixed Office/Industrial composite Total Return Since IPO YTD Total Return (2) (1) |
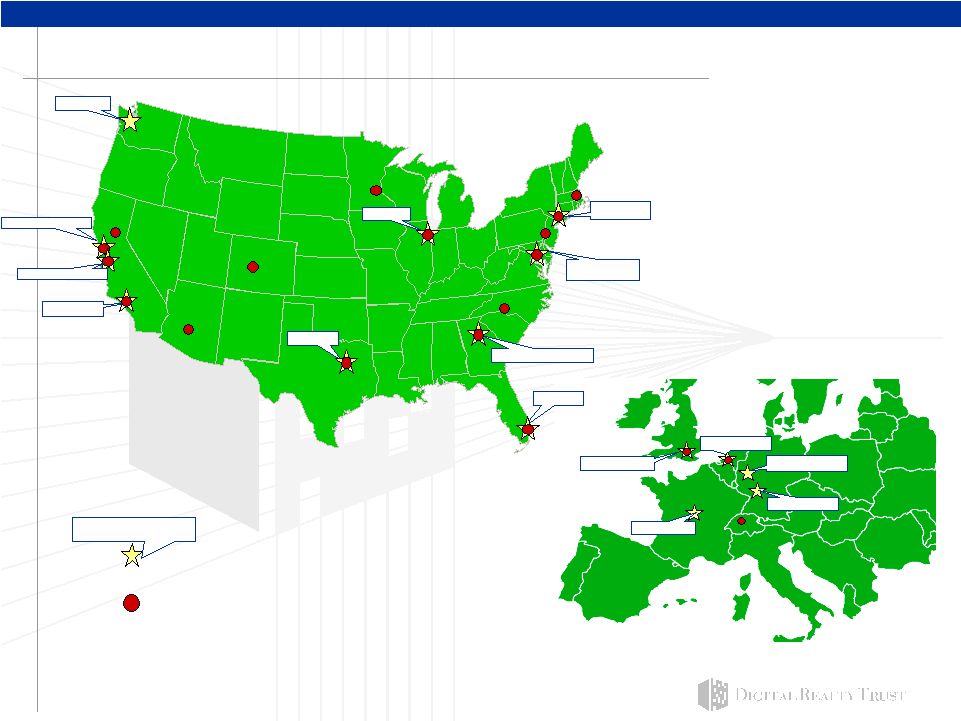
10 DLR is established in top technology markets San Francisco LA Dallas Atlanta Chicago NYC Metro London Amsterdam Paris Frankfurt Top Tech Market DLR Market Source: Top technology markets based on TeleGeography Colocation 2006 ranking of largest colocation markets in US and Europe. Note: Reflects all owned assets at of November 29, 2005. Silicon Valley Charlotte St. Paul Philadelphia DC Metro Phoenix Denver Seattle Sacramento Miami Boston Geneva Düsseldorf |
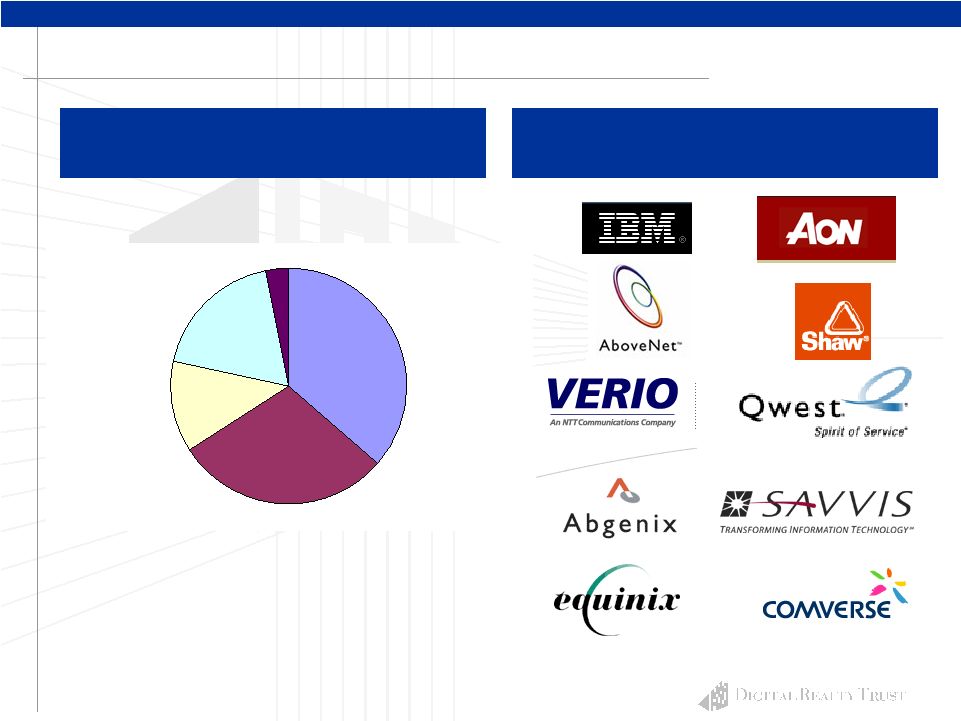
11 DLR is increasingly well diversified by sector Industry Distribution (1) Communications 36% IT Services 30% Other Technology 12% Financial & Professional Services 19% Non-Technology 3% Top 10 Tenants (1) Calculated based on annualized rents using in place leases as of September 30, 2005. (2) Pending the closing of the IBM Campus (Mainz, Germany) acquisition. (2) |
12 Source: Independent study by CCG Facilities Integration Inc. based on data center projects with improvements similar to DLR. (1) Infrastructure only. Does not include electronic equipment. Assumes 60% ratio of data center to total building with all cost allocated to raised floor area. (2) Reflects all owned properties and properties under contract as of October 28, 2005. Replacement Cost Estimate Replacement cost illustrates the value of DLR’s portfolio DLR owns over 3.3M sq ft of improved data center space (2) Cost per Square Foot Cost Components Low High Land $40 $70 Building Shell 60 150 Electrical Systems $297 $396 Mechanical Systems (HVAC) 92 122 Fire Protection 21 29 Other Construction and Fees 130 173 Sub Total $540 $720 Total Development Costs $640 $940 Base Building Data Center Improvements (1) |
13 Source: Press releases, company reports and internal estimates as of October 28, 2005. (1) Reflects all owned properties and properties under contract as of October 28, 2005. Recent data center sales support $750 psf in value Indicative Recent Data Center Sales Comps Announced Total Est Data Implied $psf Est Acq. Property Buyer Location Prior Tenant Price ($M) Sq Ft Ctr Sq Ft Data Ctr Cap Rate 1350 Duane Inland Santa Clara, CA Sprint/Equinix $97.5 185,000 80,000 $1,219 7.8% Kilroy (ex-MFN) 365 Main El Segundo, CA Vacant $22.5 131,000 48,000 $469 N/A Exodus Equinix El Segundo, CA Vacant $34.5 107,000 50,000 $690 N/A Beaumeade Business Park Equinix Ashburn, VA Equinix/Others $53.0 461,700 N/A N/A 6.5% Exodus (Equinix) * Undisc. El Segundo, CA Equinix $38.7 107,000 50,000 $774 7.8% Average $788 7.0% - 7.5% * Sale/leaseback of original purchase as per press release. Transaction pending. DLR owns over 3.3M sq ft of improved data center space (1) |
14 DLR’s acquisitions team continues to deliver … Note: Reflects 2005 acquisitions through November 29, 2005. Net rentable square feet figures include space held for redevelopment. DLR has acquired approximately $438M in new properties contributing approximately $42M in projected NOI Purchase Net Rentable In-place yr 1 Purchase Occupancy Property Location Price ($M) Sq Ft NOI Cap Price PSF (Net of Redev) 833 Chestnut Philadelphia $59.0 654,758 10.7% $90 91% MAPP St. Paul $15.6 88,134 9.7% $177 100% Lakeside Technology Center Chicago $141.6 1,133,391 9.0% $125 89% Denver Data Center Denver $16.5 82,229 9.2% $201 100% Savvis Data Centers Los Angeles $92.5 560,000 11.0% $165 100% Printer's Square Chicago $39.0 161,547 10.0% $241 84% Amsterdam Data Center Amsterdam $17.3 112,472 9.2% $154 62% Charlotte Internet Gateway Charlotte $17.2 95,490 9.5% $180 73% Boston Data Center Waltham $14.3 71,000 Vacant $201 N/A Geneva Data Center Geneva $12.1 59,191 9.1% $204 100% Looking Glass Building Herndon, VA $12.9 71,000 9.9% $182 100% YTD 2005 Acquisitions $438.0 3,089,212 9.5% $142 |
15 • 60 leases for technical space representing approx. 116,000 sq ft • Rent per square foot: approx. $65.91 psf gross • Leasing costs per square foot: approx. $19.22 (1) • 40 leases for non-technical space representing approx. 216,000 sq ft • Rent per square foot: approx. $19.34 psf gross • Leasing costs per square foot: approx. $20.42 (1) • Excluding space held for redevelopment, portfolio is 93.2% leased (2) Note: Based on new leases executed YTD 2005 as of November 6, 2005. Rents are annualized, straight line GAAP per net rentable square foot. (1) Leasing costs per square foot are a one-time cost. Excludes redevelopment expense associated with space designated as space held for redevelopment. (2) Calculated based on in place leases as of September 30, 2005. Excludes 732,000 sq ft of space held for redevelopment. … with sales/leasing driving additional growth DLR has executed 100 US leases (new and renewals) contributing over $11.8M in incremental annual GAAP rental revenues Indicative DLR leasing in 2005 |
16 Case studies: DLR’s value-add leasing - DLR invested approx. $2.5M to fully condition 10,000 sq. ft. on a speculative basis - DLR invested approx. $10 psf to enhance space DLR Action - Executed new 10,000 sq. ft. suite lease with IT services company at approx. $100 psf for 10 yr term - Executed new 22,300 sq. ft. lease with financial institution at approx. $69 psf for 2.5 yr term - 35,000 sq. ft. previously vacant - Prior rate approx. $25 psf - Executed new 10,000 sq. ft. lease with international telecom at approx. $57 psf for 10 yr term - Executed new 22,500 sq. ft. lease with software company at approx. $62 psf for 3 yr term - 40,000 sq. ft. suite previously vacant - Space substantially conditioned by prior tenant for data center operations - Prior rate approx. $36 psf New Lease(s) Prior Lease Recent leasing illustrates effectiveness of DLR’s leasing and engineering team |
17 2.50% 1.80% 3.50% 6.10% 12.10% 14.10% 1.60% 7.80% 6.60% 32.50% 2006 2007 2008 2009 2010 2011 2012 2013 2014 Thereafter DLR’s model features long-term, stable leases • The average lease term is in excess of 12 years with over 7 years remaining • Leases typically contain 3% annual rent bumps 7.8% in next 3 yrs The stability of our long-term leases complements our growth Note: Excludes 2005 lease expirations and space held for redevelopment as of September 30, 2005. Lease Expiration as a % of Net Rentable Square Feet |
18 Lease-Up (2) 200,000 sq ft of basic commercial space (gross rent $20 / sq ft) o 130,000 sq ft leased YTD at $19.60 / sq ft 45,000 - 50,000 sq ft of highly improved tech space (gross rent $60 / sq ft) o 115,500 sq ft leased YTD at $71.10 / sq ft Acquisitions $450 - $500 million at 8.75% - 9.25% cap rate o $520m acquired at 9.5% cap rate (3) DLR is re-affirming its 2005 forecast Internal Growth 2005 projected FFO Per Share Guidance (1) : $1.35 - $1.40 External Growth (1) As per Company guidance provided on August 9, 2005. (2) Based on new leases executed YTD 2005 as of October 10, 2005. (3) Reflects 2005 acquisitions and properties under contract as of September 30, 2005. 3 – 4% FFO Per Share Growth 6 – 8% FFO Per Share Growth 9 – 12% Overall FFO Per Share Growth |
19 DLR recently released its preliminary 2006 forecast Internal Growth 2006 projected FFO Per Share Guidance (1) : $1.65 - $1.75 External Growth (1) As per Company guidance provided on November 9, 2005. 10 – 14% FFO Per Share Growth 10 – 14% FFO Per Share Growth 20 – 28% Overall FFO Per Share Growth Lease-Up 125,000 – 150,000 sq ft of basic commercial space (gross rent $19 / sq ft) 200,000 - 300,000 sq ft of highly improved tech space (gross rent $40 / sq ft) Acquisitions $200 - $400 million at 8.0% - 9.0% cap rate |
20 DLR employs a conservative capital structure • Wtd Average Cost of Debt: 6.0% • Approximately 75% fixed rate debt • Recently executed $350M credit facility which reduced borrowing cost and increased flexibility • $103.8M outstanding on the credit facility at September 30, 2005 • Periodically refinancing high cost debt with lower rate, longer term, fixed rate financing • No debt maturing through 2008 (assuming extensions) Total Market Capitalization (4) $1,918.0M Note: Based on September 30, 2005 financial statements. (1) Based on most recent company guidance for 2006 FFO per share ($1.65 - $1.75) provided on November 9, 2005. (2) Adjusted EBITDA divided by Interest Expense at September 30, 2005. (3) Adjusted EBITDA divided by Fixed Charges at September 30, 2005. Fixed Charges include Interest Expense, Scheduled Debt Principal Payments, and Preferred Dividends. (4) Based on closing price of DLR common stock ($18.00) and preferred stock as of September 30, 2005. Dividend Yield / Rate: 5.9% / $1.06 Projected FFO Payout Ratio (1) : 60.6% - 64.2% Debt Service Coverage Ratio (2): 3.4x Fixed Charge Coverage Ratio (3): 2.2x Fixed Rate Debt $517.9M Variable Rate Debt $169.0M Preferred Stock (4) $172.2M Equity (4) $1,058.9M 27% 9% 55% 9% |
21 15.4x 15.7x 16.0x 20.3x 14.8x 12.8x 13.9x 17.1x 4.5% 4.9% 5.6% 4.0% 10.0x 11.0x 12.0x 13.0x 14.0x 15.0x 16.0x 17.0x 18.0x 19.0x 20.0x 21.0x RMS DLR Mixed Office / Industrial Tech Real Estate Composite 3.0% 3.5% 4.0% 4.5% 5.0% 5.5% 6.0% 2005E FFO Multiple 2006E FFO Multiple Dividend Yield (2) FFO Multiple (1) Note: Based on closing price of DLR common stock ($21.86) and other securities as of November 25, 2005. (1) Based on First Call consensus estimates for indicative purposes. DLR does not endorse the First Call consensus estimate. DLR guidance for 2005 FFO per share remains $1.35 - $1.40 as provided on August 9, 2005. DLR guidance for 2006 FFO per share of $1.65 - $1.75 as provided on November 9, 2005. (2) Tech Real Estate composite includes ARE, BMR and GSL. (3) Mixed Office / Industrial composite includes BED, GLB, MSW, PSB, KRC, HIW, LRY and DRE. Dividend Yield (3) DLR trades at a discount to public peers DLR’s FFO multiples remain at a discount |
22 DLR is valued at a discount to prevailing RE metrics Note: Tech RE Composite includes ARE, BMR and GSL. Mixed Office/Industrial Composite includes BED, GLB, MSW, PSB, KRC, HIW, LRY and DRE. (1) Based on annualized NOI run rate for owned properties at September 30, 2005. (2) Based on market price of DLR common stock ($18.00) and debt balances at September 30, 2005. (3) Cap rate methodology calculated as 3Q NOI annualized / Total Market Capitalization as of November 25, 2005. (4) Assumes $125 psf value for pro forma space held for redevelopment (includes owned properties at September 30, 2005). (5) Includes square footage associated with owned properties at September 30, 2005. An analysis by Cushman & Wakefield of 60+ recent sales of properties similar to DLR’s portfolio indicates a current market cap rate range of 7.50% to 8.25% All figures in thousands except sq ft, % and psf figures Projected NOI ('000) (1) $154,873 Est current total capitalization (2) $1,918,000 Implied cap rate 8.1% Est value - Redev Space @ $125 psf ('000) (4) $91,458 Implied value - income producing $1,826,542 Implied cap rate - income producing 8.5% Sq Ft (3Q including redevelopment) (5) 8,596,423 Implied value psf - income producing $212 DLR Implied Valuation (3) 5.00% Tech RE Composite (5.3%) 6.00% 7.00% Office/Industrial Composite (6.7%) C&W Mkt Cap Rates 8.00% DLR Total Cap (8.1%) 9.00% DLR Cap - Income Producing (9.1%) |
23 Definition of Non-GAAP Financial Measures This presentation includes certain non-GAAP financial measures that management believes are helpful in understanding our business, as further described below. Our definition and calculation of non-GAAP financial measures may differ from those of other REITs, and, therefore, may not be comparable. The non-GAAP financial measures should not be considered an alternative to net income or any other GAAP measurement of performance and should not be considered an alternative to cash flows from operating, investing or financing activities as a measure of liquidity. Net Operating Income (NOI) NOI represents rental revenue and tenant reimbursement revenue less rental property operating and maintenance, property taxes and insurance expenses (as reflected in statement of operations). NOI is commonly used by stockholders, company management and industry analysts as a measurement of operating performance of the company’s rental portfolio. However, because NOI excludes depreciation and amortization and captures neither the changes in the value of our properties that result from use or market conditions, nor the level of capital expenditures and leasing commissions necessary to maintain the operating performance of our properties, all of which have real economic effect and could materially impact our results from operations, the utility of NOI as a measure of our performance is limited. Other REITs may not calculate NOI in the same manner we do and, accordingly, our NOI may not be comparable to such other REITs’ NOI. Accordingly, NOI should be considered only as a supplement to net income as a measure of our performance. Funds from Operations (FFO) We calculate Funds from Operations, or FFO, in accordance with the standards established by the National Association of Real Estate Investment Trusts, or NAREIT. FFO represents net income (loss) (computed in accordance with GAAP), excluding gains (or losses) from sales of property, real estate related depreciation and amortization (excluding amortization of deferred financing costs) and after adjustments for unconsolidated partnerships and joint ventures. Management uses FFO as a supplemental performance measure because, in excluding real estate related depreciation and amortization and gains and losses from property dispositions, it provides a performance measure that, when compared year over year, captures trends in occupancy rates, rental rates and operating costs. We also believe that, as a widely recognized measure of the performance of REITs, FFO will be used by investors as a basis to compare our operating performance with that of other REITs. However, because FFO excludes depreciation and amortization and captures neither the changes in the value of our properties that result from use or market conditions, nor the level of capital expenditures and leasing commissions necessary to maintain the operating performance of our properties, all of which have real economic effect and could materially impact our results from operations, the utility of FFO as a measure of our performance is limited. Other REITs may not calculate FFO in accordance with the NAREIT definition and, accordingly, our FFO may not be comparable to such other REITs’ FFO. Accordingly, FFO should be considered only as a supplement to net income as a measure of our performance. |
24 Definition of Non-GAAP Financial Measures (continued) EBITDA and Adjusted EBITDA We believe that earnings before interest, income taxes, depreciation and amortization, or EBITDA and Adjusted EBITDA (as defined below), are useful supplemental performance measures because they allow investors to view our performance without the impact of noncash depreciation and amortization or the cost of debt and with respect to Adjusted EBITDA preferred dividends and minority interests. Adjusted EBITDA is EBITDA excluding minority interests and preferred stock dividends. In addition, we believe EBITDA and adjusted EBITDA are frequently used by securities analysts, investors and other interested parties in the evaluation of REITs. Because EBITDA and adjusted EBITDA are calculated before recurring cash charges including interest expense and income taxes, and are not adjusted for capital expenditures or other recurring cash requirements of our business, their utility as a measure of our performance is limited. Accordingly, EBITDA and Adjusted EBITDA should be considered only as supplements to net income (computed in accordance with GAAP) as a measure of our financial performance. Other equity REITs may calculate EBITDA and Adjusted EBITDA differently than we do; accordingly, our EBITDA and Adjusted EBITDA may not comparable to such other REITs’ EBITDA and Adjusted EBITDA. Each of FFO,NOI, and Adjusted EBITDA exclude items that have real economic effect and could materially impact our results from operations, and therefore the utility of FFO, NOI, and Adjusted EBTIDA as a measure of our performance is limited. Unless otherwise indicated, all information assumes properties purchased and closed as of November 29, 2005. Nothing contained herein is intended to revise the earnings, FFO or acquisition guidance we provided in a press release dated November 9, 2005 and available on our website at www.digitalrealtytrust.com. |
25 Reconciliation of Non-GAAP Financial Measures Reconciliation of the range of 2005 projected net income to projected FFO Low End High end Net Income $11.3 - - $12.7 Add: Minority interest in operating partnership $13.5 - - $15.2 $24.8 - - $27.9 Add: Real estate related depreciation and amortization 60.1 - - 60.1 Funds from operations (FFO) $84.9 - - $88.0 Less: Preferred stock dividends (10.1) - - (10.1) FFO available to common stock and unit holders $74.8 - - $77.9 FFO per share of common stock and unit outstanding $1.35 - - $1.40 55.5 - - 55.5 (in millions) Net income before minority interest in operating partnership but after minority interest in consolidated joint ventures Weighted average number of shares of common stock and units outstanding |
26 Reconciliation of Non-GAAP Financial Measures (continued) Reconciliation of the range of 2006 projected net income to projected FFO Low End High end Net Income $23.2 - - $24.9 Add: Minority interest in operating partnership $18.1 - - $19.5 $41.3 - - $44.4 Add: Real estate related depreciation and amortization 69.8 - - 73.0 Funds from operations (FFO) $111.1 - - $117.4 Less: Preferred stock dividends (13.8) - - (13.8) FFO available to common stock and unit holders $97.3 - - $103.6 FFO per share of common stock and unit outstanding $1.65 - - $1.75 59.2 - - 59.2 (in millions) Net income before minority interest in operating partnership but after minority interest in consolidated joint ventures Weighted average number of shares of common stock and units outstanding |
27 Reconciliation of Non-GAAP Financial Measures (continued) Reconciliation of Earnings Before Interest Taxes and Depreciation and Amortization 9/30/2005 6/30/2005 3/31/2005 Net income available to common stockholders 1,326 $ 2,136 $ 1,468 $ Add: Interest 10,724 9,289 8,121 Depreciation and amortization 16,957 14,328 12,143 EBITDA 29,007 25,753 21,732 Minority interests 1,624 3,139 2,156 Dividends to preferred stockholders 3,099 2,199 1,271 Adjusted EBITDA 33,730 $ 31,091 $ 25,159 $ Reconciliation of net income available to common stockholders to earnings before interest, taxes and depreciation and amortization (EBITDA) and Adjusted EBITDA Three Months Ended |