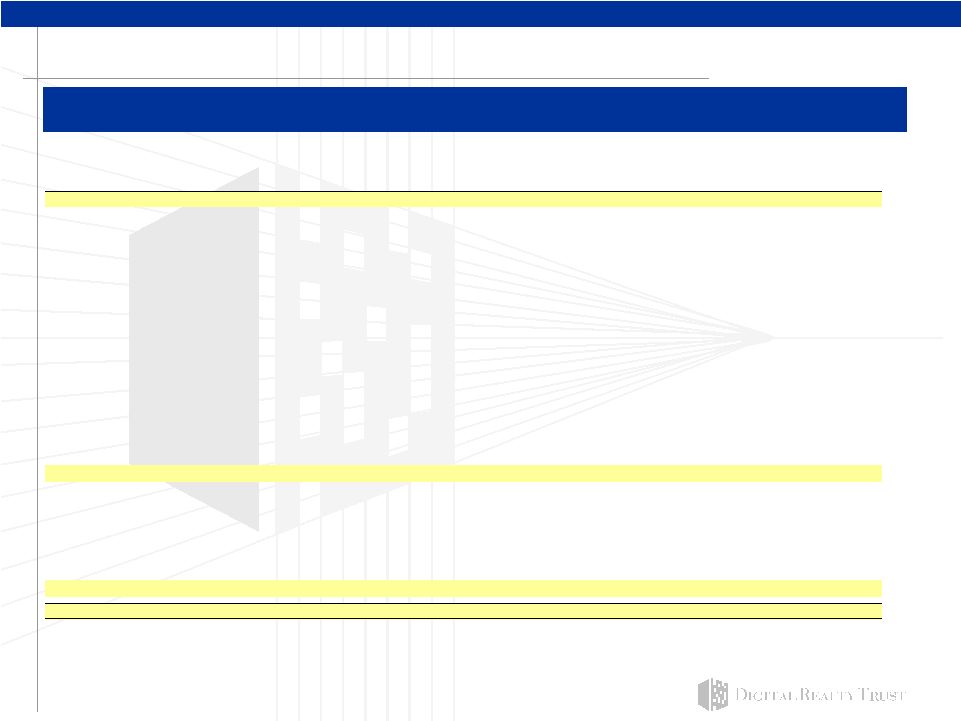
30 Reconciliation of non GAAP items to their closest GAAP Funds from operations (1) Cash interest expense (including discontinued operations) Q406 Q306 Q405 FY2006 FY2005 Q406 Q306 Q405 FY2006 FY2005 Net income available to common stockholders $2,978 $11,342 $1,157 $17,612 $6,087 Total GAAP interest expense (including discontinued operations) $14,569 $14,533 $10,988 $52,671 $39,122 Capitalized interest 1,114 917 279 3,851 279 Minority interests in operating partnership including discontinued operations 1,276 8,464 1,338 12,926 8,268 �� Change in accrued interest and other noncash amounts (3,206) (2,590) (1,660) (7,645) (4,345) Real estate related depreciation and amortization (2) 28,055 24,454 18,781 90,932 62,171 Cash interest expense $12,477 $12,860 $9,607 $48,877 $35,056 Real estate related depreciation and amortization related to investment in unconsolidated joint venture 796 - - 796 - Gain on sale of assets (80) (18,016) - (18,096) - Funds from operations (FFO) $33,025 $26,244 $21,276 $104,170 $76,526 Funds from operations (FFO) per diluted share $ 0.48 $ 0.41 $ 0.36 $ 1.63 $ 1.37 Net income per diluted share available to common stockholders $ 0.06 $ 0.30 $ 0.04 $ 0.47 $ 0.25 Funds from operations (FFO) $33,025 $26,244 $21,276 $104,170 $76,526 Non real estate depreciation 118 285 23 511 61 Amortization of deferred financing costs 1,115 916 793 3,763 2,965 Non cash compensation 491 430 335 1,787 481 Loss from early extinguishment of debt 6 40 896 528 1,021 Straight line rents (5,810) (3,856) (4,172) (17,742) (13,023) Above and below market rent amortization (2,238) (2,837) (632) (7,012) (1,717) Capitalized leasing compensation (217) (185) (105) (2,054) (781) Recurring capital expenditures and tenant improvements (2,574) (344) (1,406) (4,160) (2,897) Capitalized leasing commissions (3,716) (1,523) (1,535) (7,186) (3,051) Adjusted funds from operations (1) $20,200 $19,170 $15,473 $72,605 $59,585 (2) Real estate depreciation and amortization was computed as follows: Q406 Q306 Q405 FY2006 FY2005 Depreciation and amortization per income statement $28,173 $24,739 $18,040 $89,936 $59,616 Depreciation and amortization of discontinued operations at 7979 East Tufts Avenue - - 764 1,507 2,616 Non real estate depreciation (118) (285) (23) (511) (61) $28,055 $24,454 $18,781 $90,932 $62,171 Weighted-average shares outstanding - diluted 69,213 64,397 59,248 63,870 55,761 (1) Funds from operations and Adjusted Funds from operations for all periods presented above includes the results of 7979 East Tufts Avenue, a property which we sold on July 12, 2006. 2007 FFO Reconcilliation (in millions, except per share and unit data) Low end of range High end of range $43.10 — $50.40 Plus: Real estate related depreciation and amortization 109.8 — 111.2 Funds from operations $152.90 — $161.20 Less: Preferred stock dividends -19.2 -19.2 FFO available to common stockholders and unit holders $133.70 — $142.40 FFO per share of common stock and unit outstanding $1.85 — $1.95 Net income before minority interest in operating partnership but after minority interest in consolidated joint ventures |
