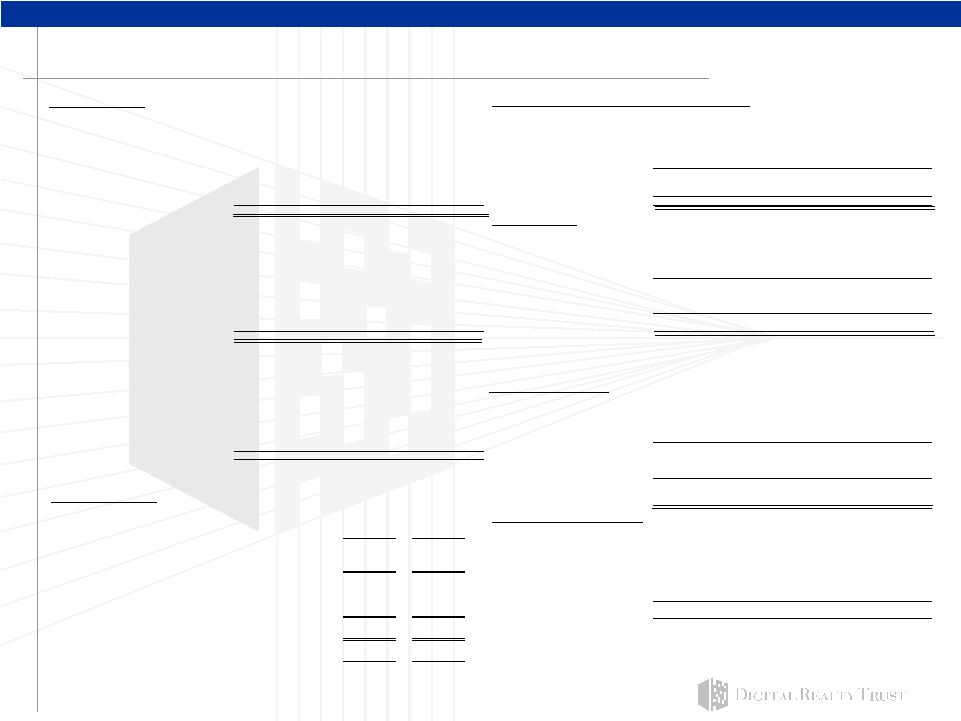
31 Reconciliation of non-GAAP items to their closest GAAP 2007 FFO Reconciliation (in millions, except per share and unit data) Low end of range High end of range Net income before minority interest in operating partnership $26.4 — $28.9 Plus: Real estate related depreciation and amortization 126.9 — 128.0 Funds from operations $153.3 — $156.9 Less: Preferred stock dividends (19.3) (19.3) FFO available to common stockholders and unit holders $134.0 — $137.6 FFO per diluted share of common stock and unit outstanding $1.91 — $1.96 Funds from operations (1) Cash interest expense and fixed charges (including discontinued operations) Q207 Q107 Q406 Q306 Q206 Q106 FY2006 FY2005 Q207 Q107 Q406 Q306 Q206 Q106 FY2006 FY2005 Net income available to common stockholders $2,591 $18,641 $2,978 $11,342 $1,650 $1,642 $17,612 $6,087 Total GAAP interest expense (including discontinued operations) $15,142 $17,323 $14,569 $14,533 $12,181 $11,388 $52,671 $39,122 Capitalized interest 2,792 1,507 1,114 917 1,058 762 3,851 279 Minority interests in operating partnership including discontinued operations 310 3,762 1,276 8,464 1,340 1,846 12,926 8,268 Change in accrued interest and other noncash amounts (3,575) (948) (3,206) (2,590) 57 (1,906) (7,645) (4,345) Real estate related depreciation and amortization (2) 31,708 29,643 28,055 24,454 20,238 18,185 90,932 62,171 Cash interest expense 14,359 17,882 12,477 12,860 13,296 10,244 48,877 35,056 Real estate related depreciation and amortization related to investment in unconsolidated joint venture 1,010 1,036 796 - - - 796 - Scheduled debt principal payments and preferred dividends 6,902 5,085 5,063 4,960 4,567 4,869 19,458 17,275 Gain on sale of assets - (18,049) (80) (18,016) - - (18,096) - Total fixed charges $21,261 $22,967 $17,540 $17,820 $17,863 $15,113 $68,335 $52,331 Funds from operations (FFO) $35,619 $35,033 $33,025 $26,244 $23,228 $21,673 $104,170 $76,526 Funds from operations (FFO) per diluted share $ 0.51 $ 0.50 $ 0.48 $ 0.41 $ 0.38 $ 0.36 $ 1.63 $ 1.37 Reconciliation of EBITDA Net income per diluted share available to common stockholders $ 0.04 $ 0.32 $ 0.06 $ 0.30 $ 0.05 $ 0.06 $ 0.47 $ 0.25 Q207 Q107 Q406 Q306 Q206 Q106 FY2006 FY2005 Funds from operations (FFO) $35,619 $35,033 $33,025 $26,244 $23,228 $21,673 $104,170 $76,526 Net income available to common stockholders $2,591 $18,641 $2,978 $11,342 $1,650 $1,642 $17,612 $6,087 Non real estate depreciation 124 135 118 285 37 71 511 61 Amortization of deferred financing costs 1,321 1,389 1,115 916 937 795 3,763 2,965 Interest 15,142 17,323 14,569 14,533 12,181 11,388 52,671 39,122 Non cash compensation 836 507 491 430 435 431 1,787 481 Depreciation and amortization 31,832 29,778 28,173 24,739 20,275 18,256 91,443 62,232 Loss from early extinguishment of debt - - 6 40 425 57 528 1,021 Straight line rents (5,770) (5,111) (5,810) (3,856) (4,233) (3,843) (17,742) (13,023) EBITDA 49,565 65,742 45,720 50,614 34,106 31,286 161,726 107,441 Above and below market rent amortization (2,578) (2,338) (2,238) (2,837) (1,504) (433) (7,012) (1,717) Capitalized leasing compensation (175) (175) (217) (185) (888) (764) (2,054) (781) Gain on sale of assets, net of minority interests - 15,019 56 10,318 - - 10,374 - Recurring capital expenditures and tenant improvements 99 (393) (2,574) (344) (338) (904) (4,160) (2,897) Capitalized leasing commissions (3,836) (439) (3,716) (1,523) (1,682) (265) (7,186) (3,051) EBITDA, less effect of gain on sale of assets $49,565 $50,723 $45,664 $40,296 $34,106 $31,286 $151,352 $107,441 Adjusted funds from operations (1) $25,640 $28,608 $20,200 $19,170 $16,417 $16,818 $72,605 $59,585 Reconciliation of Adjusted EBITDA (2) Real estate depreciation and amortization was computed as follows: Q207 Q107 Q406 Q306 Q206 Q106 FY2006 FY2005 EBITDA $49,565 $65,742 $45,720 $50,614 $34,106 $31,286 $161,726 $107,441 Q207 Q107 Q406 Q306 Q206 Q106 FY2006 FY2005 Depreciation and amortization per income statement $31,832 $29,399 $27,290 $23,768 $18,534 $16,537 $86,129 $59,616 Minority interests 310 3,762 1,276 8,464 1,340 1,846 12,926 8,268 Depreciation and amortization of discontinued operations - 379 883 971 1,741 1,719 5,314 2,616 Preferred stock dividends 5,167 3,445 3,445 3,445 3,445 3,445 13,780 10,014 Non real estate depreciation (124) (135) (118) (285) (37) (71) (511) (61) $31,708 $29,643 $28,055 $24,454 $20,238 $18,185 $90,932 $62,171 Adjusted EBITDA 55,042 72,949 50,441 62,523 38,891 36,577 188,432 125,723 Weighted-averageshares outstanding - diluted 70,229 69,831 69,213 64,397 60,959 59,874 63,870 55,761 Gain on sale of assets - 18,049 80 18,016 - - 18,096 - Adjusted EBITDA, less effect of gain on sale of assets $55,042 $54,900 $50,361 $44,507 $38,891 $36,577 $170,336 $107,441 Reconciliation of Net Operating Income (NOI) Q207 Q107 Q406 Q306 Q206 Q106 FY2006 FY2005 Operating income 22,541 $ 21,965 $ 20,943 $ 18,451 $ 17,787 $ 17,388 $ 74,569 $ 59,587 $ Less: Other revenue (247) - (197) - - (168) (365) (5,829) Add: Depreciation and amortization 31,832 29,399 27,290 23,768 18,534 16,537 86,129 55,701 General and administrative 8,456 7,210 6,535 4,986 4,674 4,246 20,441 12,615 Other expenses 128 188 173 607 150 181 1,111 1,617 Net Operating Income 62,710 $ 58,762 $ 54,744 $ 47,812 $ 41,145 $ 38,184 $ 181,885 $ 123,691 $ (1) Funds from operations and Adjusted Funds from operations for all periods presented above includes the results of properties sold in 2006 and 2007; 7979 East Tufts Avenue (July 2006), 100 Technology Center Drive (March 2007) and 4055 Valley View Lane (March 2007). |
