 Investor Meetings November 2007 Foundation of the Digital World Exhibit 99.1 |
 1 Forward Looking Statements The information included in this presentation contains forward-looking statements. Such statements are based on management’s beliefs and assumptions made based on information currently available to management. Such forward looking statements include statements and projections related to growth in the Software as a Service (SaaS) and e-commerce market, the digital communication and distribution market, and the data storage market, online advertising, the market effects of regulatory requirements and litigation, the disaster recovery market, estimates of sufficiency of power and cooling in existing datacenters, the replacement cost of our assets, redevelopment costs in our buildings, and time periods to stabilization of our development space, the effect new leases will have on our rental revenues and results of operations, lease expiration rates, the effect of leasing and acquisition on our FFO, estimates of the value of our redevelopment portfolio and annualized GAAP rent. Such statements are subject to risks, uncertainties and assumptions and are not guarantees of future performance and may be affected by known and unknown risks, trends, uncertainties and factors that are beyond our control that may cause actual results to vary materially. Some of the risks and uncertainties include, among others, the following: adverse economic or real estate developments in our markets or the technology industry; general and local economic conditions; defaults on or non- renewal of leases by tenants; increased interest rates and operating costs; our inability to manage domestic and international growth effectively; difficulty acquiring or operating properties in foreign jurisdictions, changes in foreign laws and regulations, including those related to taxation and real estate ownership and operation, increased interest rates and operating costs; inability to acquire new properties (including those we are in the process of acquiring); our failure to obtain necessary outside financing; increased construction costs; decreased rental rates or increased vacancy rates; difficulties in identifying properties to acquire and completing acquisitions at acceptable return levels; our failure to successfully operate acquired properties and operations; failure of acquired properties to perform as expected; our failure to successfully develop or redevelop properties acquired for that purpose or unexpected costs related to development or redevelopment; our failure to maintain our status as a REIT; possible adverse changes to tax law; environmental uncertainties and risks related to natural disasters; environmental or contamination issues at our buildings; financial market fluctuations; changes in foreign currency exchange rates; risks of operating in foreign countries; and changes in real estate and zoning laws and increases in real property tax rates. The risks described above are not exhaustive, and additional factors could adversely affect our business and financial performance, including those discussed in our annual report on Form 10-K for the year ended December 31, 2006 and subsequent filings with the Securities and Exchange Commission. We expressly disclaim any responsibility to update forward-looking statements, whether as a result of new information, future events or otherwise. |
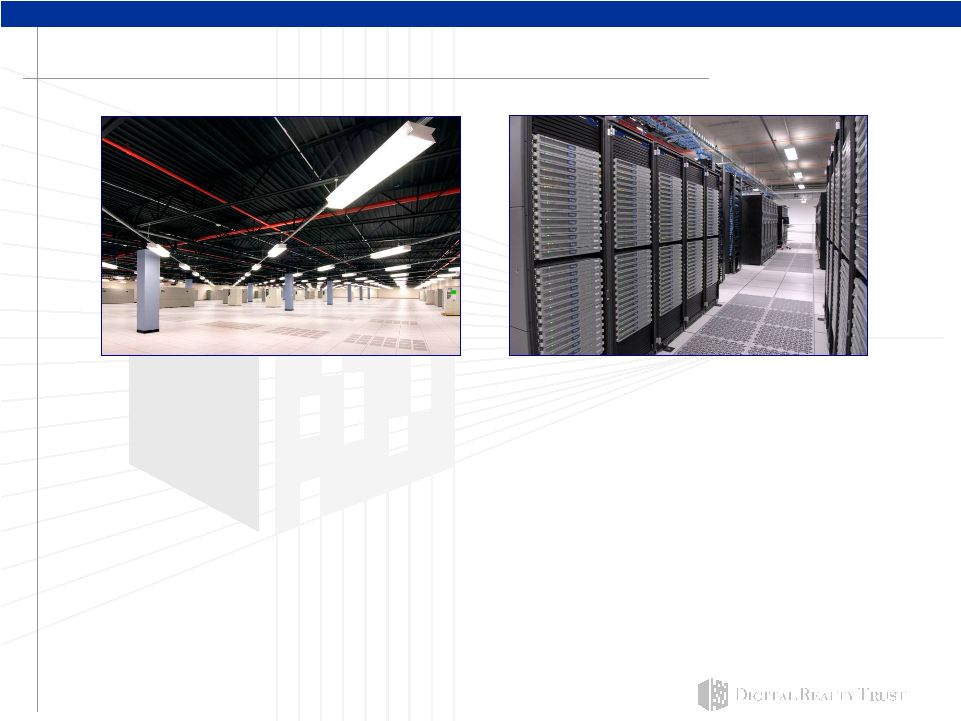
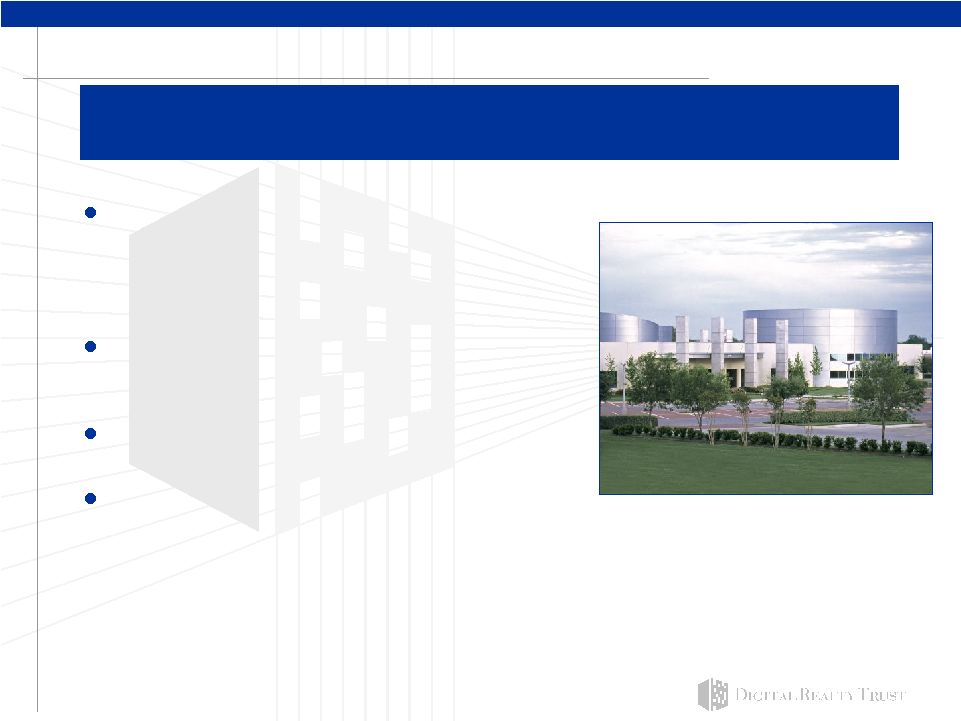 2 Digital Realty Trust Overview Diverse base of 444 tenants consisting of leading global companies across various industries resulting in $307.3 million in annualized rent on a straight-line basis, or $31.30 psf (1) Own 67 properties comprising 12.0 million rsf, which includes 1.7 million rsf of space held for redevelopment (2) Portfolio occupancy of 95.1% and “same store” occupancy of 94.4% (3) Assets strategically located in 26 top markets throughout North America and Europe DLR is the leading institutional owner focused on mission-critical datacenters throughout North America and Europe. 11830 Webb Chapel Road Dallas, TX (1) Annualized rent on a straight-line basis represents the monthly straight-line rent as of September 30, 2007 multiplied by 12. (2) Including property acquisitions as of November 7, 2007, excluding one property held through an investment in an unconsolidated joint venture. (3) Occupancy is as of September 30, 2007, net of redevelopment space. Same store occupancy includes properties acquired before December 31, 2005, excluding properties sold in 2006 and 2007. |
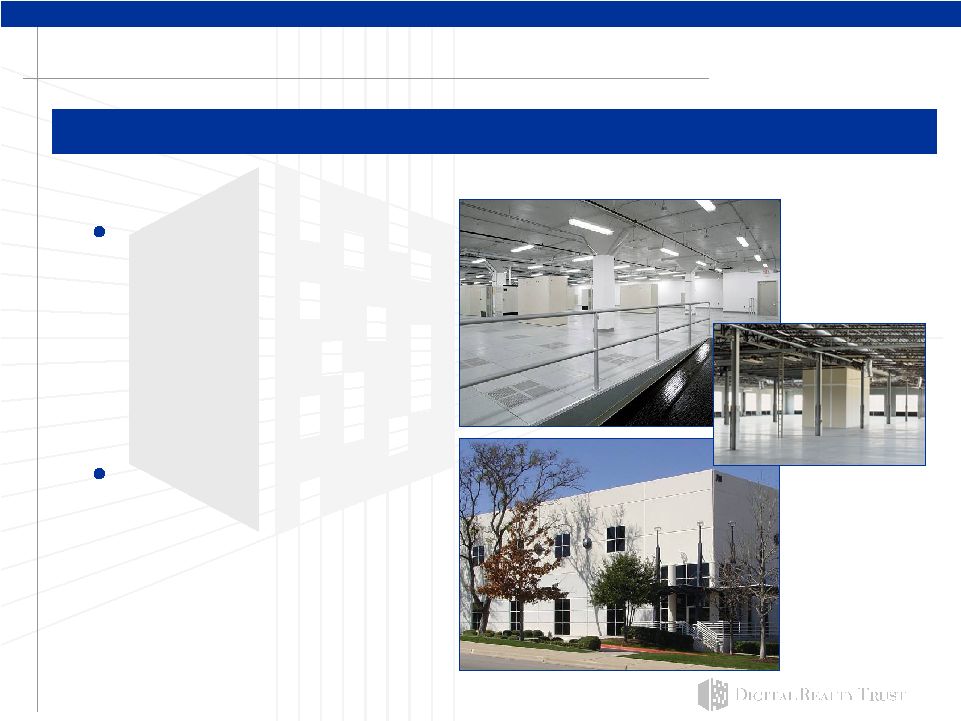
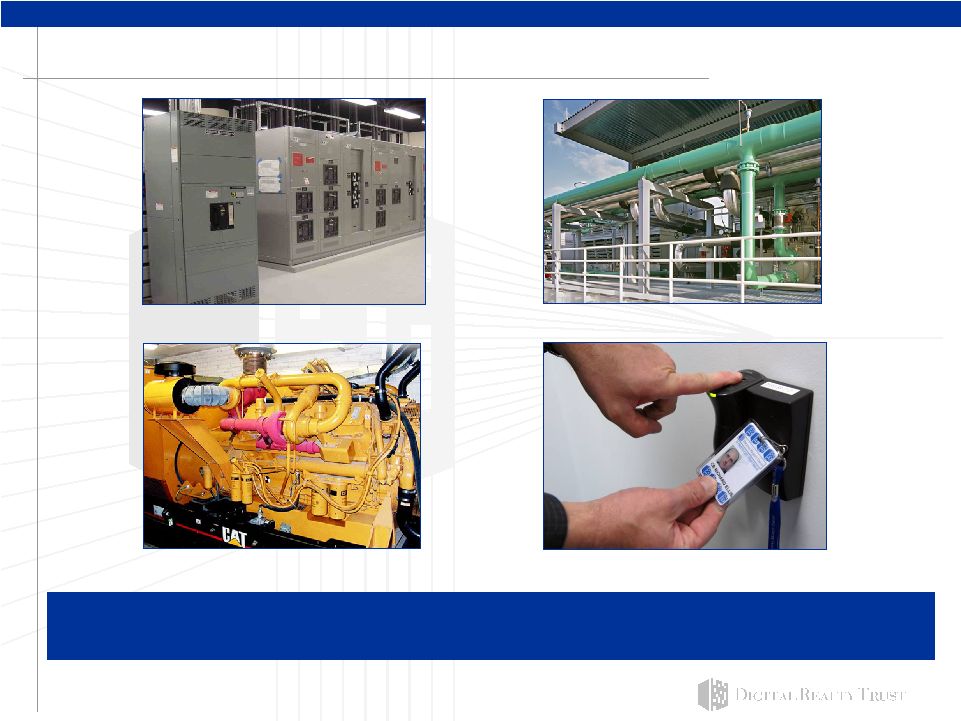 3 DLR Properties Feature Advanced Technical Systems Between $500 and $1,000 psf typically invested in DLR buildings, creating a barrier to exit for tenants and discouraging speculative new supply. Power backup/redundancy Power management/conversion Precision air cooling/handling Systems and security controls |
 4 DLR Organizational Depth and Breadth 146 employees (1) Core capabilities: – Acquisitions – Sales & Technical Services Sales Engineering Design & Construction – Operations Portfolio Management Technical Operations – Finance Accounting Capital Markets Taxation Investor Relations – Legal – Human Resources Corporate headquarters – San Francisco Regional offices – North America Los Angeles Phoenix Dallas Chicago Northern Virginia New York Boston – Europe London Dublin Paris (1) As of November 7, 2007 |
 5 DLR’s Competitive Advantage: Dedicated Technical Professionals Staff of over 75 DLR technical professionals: – IT sales team Focus on end-user, IT professionals (CIO or CTO) – Datacenter sales engineers Provide value engineering and custom design expertise – Design and construction experts Disciplined approach to project management Volume purchase agreements for equipment and services Best-in-class engineering and contracting – Datacenter facilities management team Best-in-class operating policies and procedures Fully-integrated Building Automation Systems Global preventative maintenance agreements Operating scale and process-based approach result in significant cost savings and added value for tenants. DLR possesses the necessary scale to support these specialized professionals. |
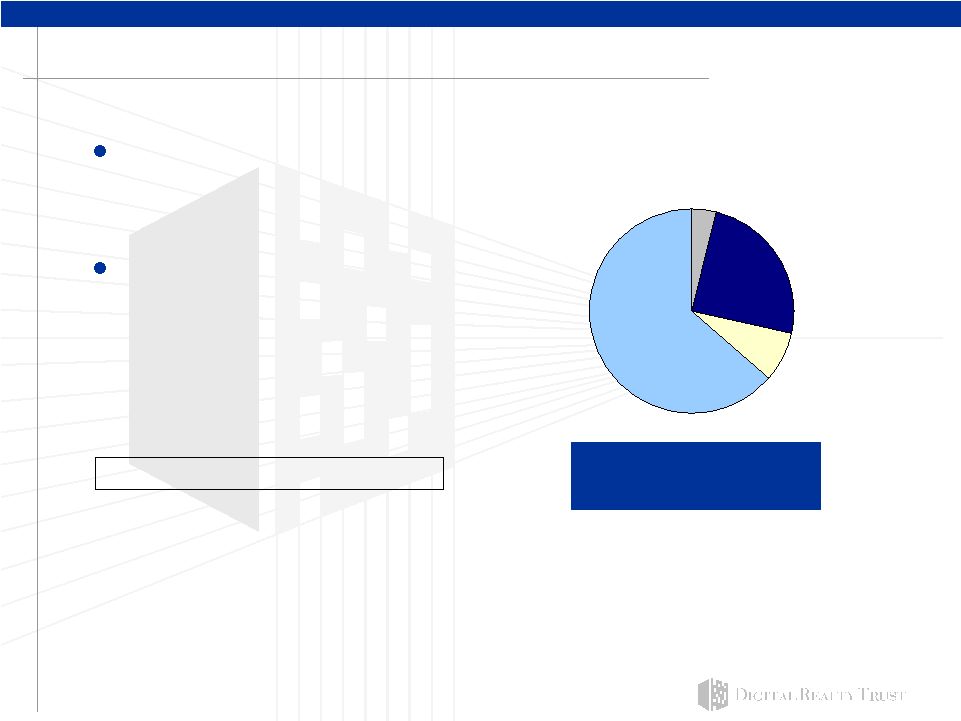
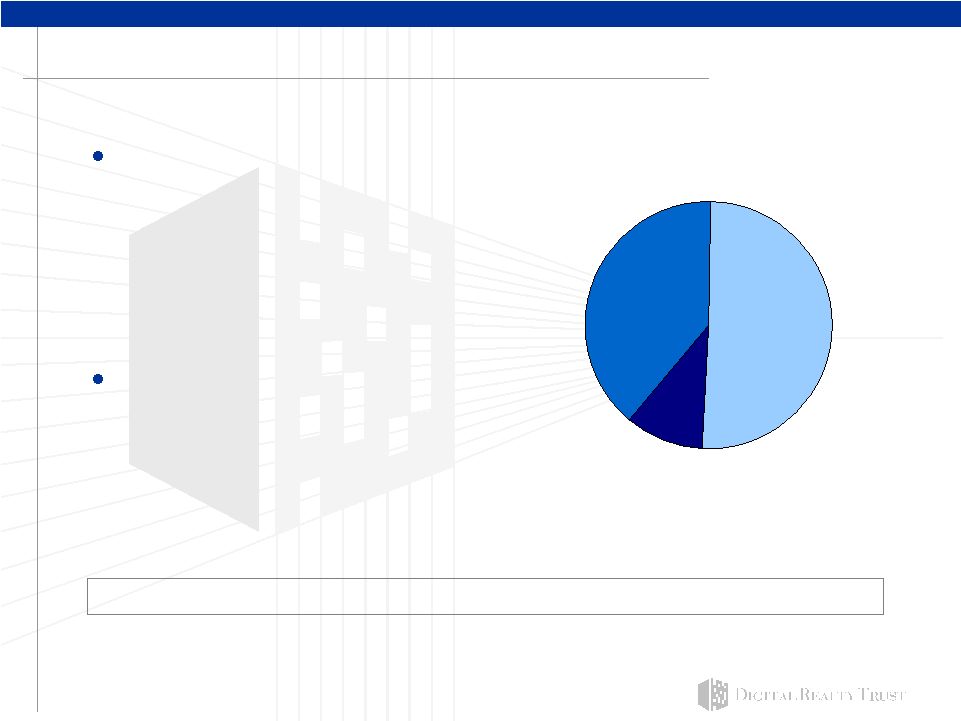 6 DLR has a Unique Portfolio of Datacenter Properties Internet Gateways – Highly strategic assets that are extremely difficult to replicate due to their existing IP network infrastructure – Serve as the hub for Internet and data communications within and between major metropolitan areas – Frequently serve as a super-regional connection point with multiple anchor tenants Corporate Datacenters – Storage/server intensive buildings – Provide a secure 24x7 environment for the storage and processing of mission- critical electronic information – Used to house primary IT operations: transaction processing, data storage, disaster recovery, CRM and email (1) Calculation based on average annualized rents using in-place leases as of September 30, 2007. (2) Includes occupied and vacant square feet. In most cases DLR either owns the improvements or has the option to require the tenant to restore the space to its original shell condition at the end of the lease term. DLR has approximately 7.7 million sf of improved datacenter space (2) Portfolio Distribution (1) Data Center 39% Internet Gateway 51% Non-Technical 10% |
  7 DLR Owns Over 1,100 MW of Utility Power Capacity (1) Top 15 Properties (2) : Property Name Market Capacity (MW) Devon Shafron Drive (3 Buildings) Northern Virginia 225 350 East Cermak Road Chicago 100 3 Corporate Place New York 44 114 Rue Ambroise Croizat Paris, France 40 2045 & 2055 LaFayette Street Silicon Valley 40 44470 Chilum Place Northern Virginia 36 150 South First Street Silicon Valley 36 1500 Space Park Santa Clara 34 101 Aquila Way Atlanta 30 14901 FAA Boulevard Dallas 25 155 Comtock Street Santa Clara 25 2401 Walsh Street Silicon Valley 25 2403 Walsh Street Silicon Valley 25 4700 Old Ironsides Drive Silicon Valley 25 8534 Concord Center Drive Denver 23 Total Power Capacity - Top 15 Properties 733 (1) Utility Power Capacity is defined as the power that could potentially be provided by the utility company depending upon factors such as peak demand load at the property. (2) As of September 30, 2007. |
 8 Region West Midwest East Europe Total # of Properties 21 16 21 9 67 Total RSF 3,676,000 3,852,000 3,584,000 908,000 12,020,000 Total Improved Datacenter RSF 2,502,000 2,395,000 2,279,000 507,000 7,683,000 DLR Presence in 26 Top Markets Note: Table above includes properties owned as of November 7, 2007, excluding one property held through an investment in an unconsolidated joint venture. |
 9 DLR Properties Support a Variety of Industry Verticals DLR provides real estate solutions for its diverse tenant base. Technology Internet Enterprise Communications Energy Manu/Services Financial |
  10 DLR Tenant Distribution Tenant % of Annualized Rent Savvis 12.7% Qwest 8.9% Equinix 4.0% TelX 3.6% AT&T 3.2% NTT Verio 2.7% Comverse Technology,Inc. 2.6% JP Morgan Chase 2.6% Microsoft 2.3% Level 3 2.2% Total 44.8% (1) Calculation based on average annualized rents using in place leases as of September 30, 2007, excluding one property held through an investment in an unconsolidated joint venture. (2) DLR’s Internet Enterprise tenants consist of Microsoft, Yahoo, Google, eBay and Amazon totaling 891,000 square feet. No single tenant accounts for more than 13% of annualized rent (1) . Communications Services 28% IT Services 37% Internet Enterprise 5% Professional & Financial Services 12% Other Technology 6% Non-Technology 12% |
 11 Strong Trends Drive Sustained Demand for DLR Space Primary Growth Drivers By 2008, 50% of existing corporate datacenters will have insufficient power and cooling capacity to meet the demands of high-density equipment (3) Increased business continuity and records retention efforts due to federal regulatory, legislative and litigation requirements Significant growth in online advertising: up 30% in 2006; expected 19% increase in 2007 (4) U.S. e-commerce spending increased 24% during 2006 (5) HIPAA patient records security and retention regulations Other Drivers – Estimated Five Year CAGRs (1) IDC (May 2007) estimated growth in Software as a Service (SaaS) from 2006-2011. (2) IDC (April 2007) estimated growth of video infrastructure and VoIP markets from 2006-2011. (3) Gartner 25 Annual Datacenter Conference 2006. (4) eMarketer.com, February 2007. (5) comScore Networks, 2007. (6) Based on the results of a DLR-commissioned phone and web-based survey conducted by Campos Research and Analysis in the first quarter of 2007 of 150 senior IT decision-makers at North American companies with over $1 billion in revenue or 5,000 employees. (7) Based on the result of a DLR-commissioned phone and web-based survey conducted by Campos Research and Analysis in the third quarter of 2007 of 125 senior IT decision-makers at European companies with over €1 billion/£667 million (€100 million/£67 million for Irish or Dutch companies) or 5,000 employees. 34% 30% 24% (1) (2) (2) 85% of US Enterprises plan to expand their datacenters with 77% of those expanding in two or more locations (6) 82% of European Enterprises plan to expand their datacenters with 79% of those expanding in two or more locations (7) 0% 10% 20% 30% 40% SaaS Video on Demand VoIP th |
 12 DLR Growth Drivers Leasing of Turn-Key Datacenter and Powered Base Building Space – Redevelopment Inventory Acquisitions – Value-Add Income Producing Properties – Vacant Properties for Redevelopment DLR growth is derived from two sources. TM TM |
 13 Leasing Drives Internal Growth YTD 2007 DLR commenced 68 leases totaling 611,000 sf, contributing approximately $33.3 million in annualized GAAP rent (1) . (1) GAAP rental revenues include total rent for both renewals and expansions. (2) Excludes leases for parking garages and rooftops. $1.0 million $19.00 52,000 24 Non-Technical (2) $15.1 million $34.00 441,000 10 Powered Base Building™ $17.2 million $146.00 118,000 34 Turn-Key Datacenter™ Annualized GAAP Rent Annualized GAAP Rent PSF Total SF Leased # of Leases Type of Space Leases Signed YTD as of September 30, 2007: 78 leases totaling 569,000 sf of space, including 190,000 sf of Turn-Key Datacenter TM , 308,000 sf of Powered Base Building TM , and 721,000 sf of non-technical space, representing annualized GAAP rent of $38.9 million. Leases Commenced YTD as of September 30, 2007: |
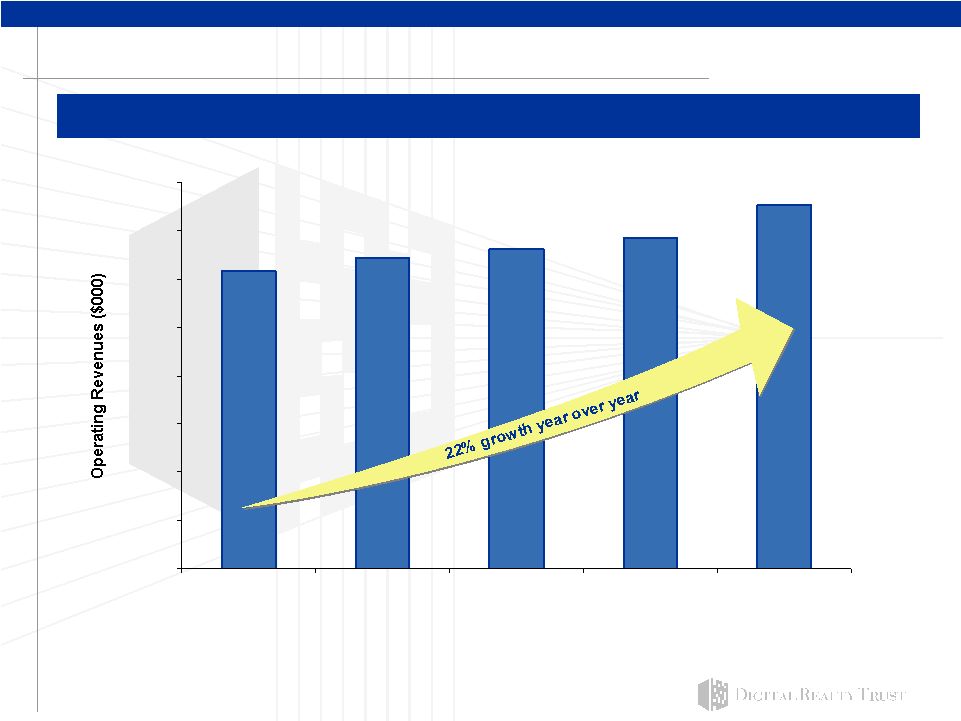 14 $61,617 $64,388 $66,338 $68,516 $75,235 0 10,000 20,000 30,000 40,000 50,000 60,000 70,000 80,000 3Q2006 4Q2006 1Q2007 2Q2007 3Q2007 Same Store Growth (1) Same store properties were acquired before December 31, 2005, excluding properties sold in 2006 and 2007. (2) Quarterly operating revenue includes rental and tenant reimbursement revenue. Strong Increase in Same Store Quarterly Operating Revenue (1)(2) Same store cash NOI increased to $40.8 million in the 3Q07, up 14.6% from $35.6 million in 3Q06. |
   15 Case Studies: DLR’s Value-Add Leasing (1) Calculation based on IPO date of November 2004 and actual annualized net operating income (NOI) as of September 30, 2007. See page 28 for a description of NOI. 350 East Cermak Road 1100 Space Park Drive 300 Boulevard East 200 Paul Avenue Property Name Location Acquisition / IPO Date % Change in NOI from later of Acquisition or IPO (1) Annualized NOI (1) 300 Boulevard East Weehawken, NJ Nov-04 89.3% $12,994,000 1100 Space Park Santa Clara, CA Nov-04 95.0% $6,968,000 200 Paul Avenue San Francisco, CA Nov-04 32.5% $15,427,000 350 East Cermak Road Chicago, IL May-05 96.2% $25,116,000 600 West 7th Street Los Angeles Nov-04 113.9% $11,750,000 |
 16 DLR Redevelopment Program Redevelopment inventory totals 1.7 million rsf (1) with potential for up to 1.1 million rsf of datacenter (2) : – Approximately 76% of redevelopment space in income- producing properties – Remaining 24% of redevelopment space in five vacant buildings Redevelopment costs vary by building: – Powered Base Building structural upgrades: $35 - $75 (3) per rsf – Turn-Key Datacenter and Build-to-Suit: $520 to $900 per rsf (4) (funding available through DLR) Primary Growth Driver (1) As of November 7, 2007 (2) Assumes datacenter footprint is 60% of rentable square footage. (3) DLR estimate. (4) Source: DPR Construction, Inc. (October 2007) TM TM |
 17 Redevelopment Program Progress Report • Construction projects currently underway in 9 U.S. and European markets totaling approximately 440,000 rentable square feet of Turn-Key Datacentre™, New Powered Base Building™ shell construction and Build-to-Suit space (1) • DLR’s Turn-Key Datacenters™ – Move-in ready, physically secure facilities with redundant power and cooling capabilities – Measuring 8,000 – 12,000 square feet of raised-floor featuring DLR’s POD Architecture™ • Stabilized income projected over the next 24 months Turn-Key Datacenter™ Built-to-Suit (1) As of September 30, 2007 |
  18 Cost Per Gross Square Foot Low High Land (1) $25 $75 Base Building Building Shell $80 $160 Electrical Systems $280 $460 Mechanical Systems (HVAC) $125 $215 Datacenter Improvements Fire Protection $15 $25 Other Construction / Fees $100 $200 Sub total $520 $900 Total Development Costs $625 $1,135 Cost Components Source: DPR Construction, Inc. based on datacenter projects with improvements similar to DLR (October 2007). (1) DLR Estimate Replacement Cost Estimate: Replacement Cost Illustrates the Value of DLR’s Portfolio |
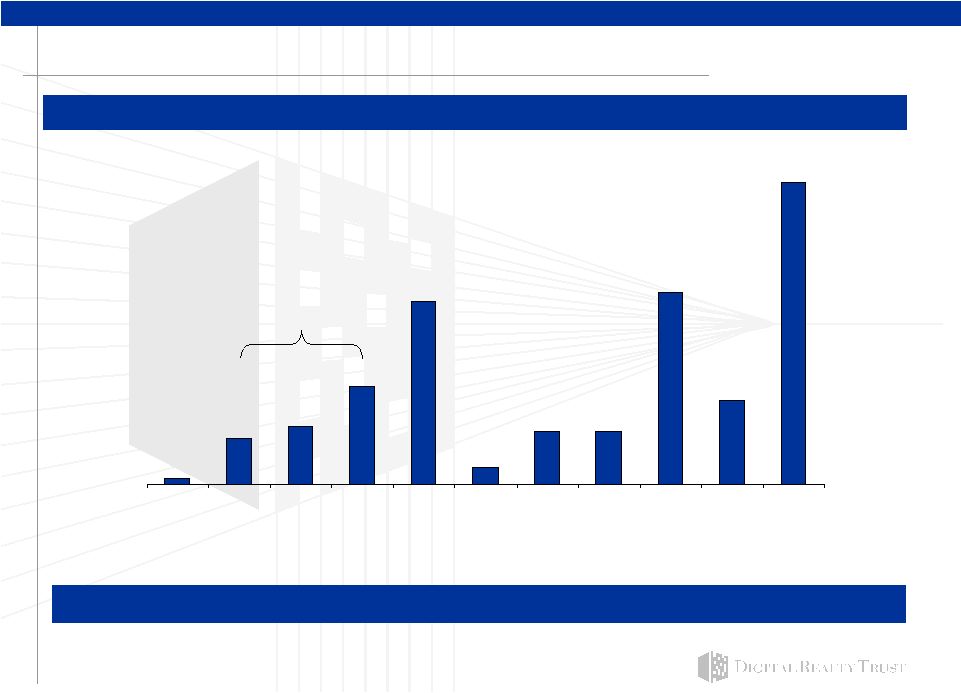
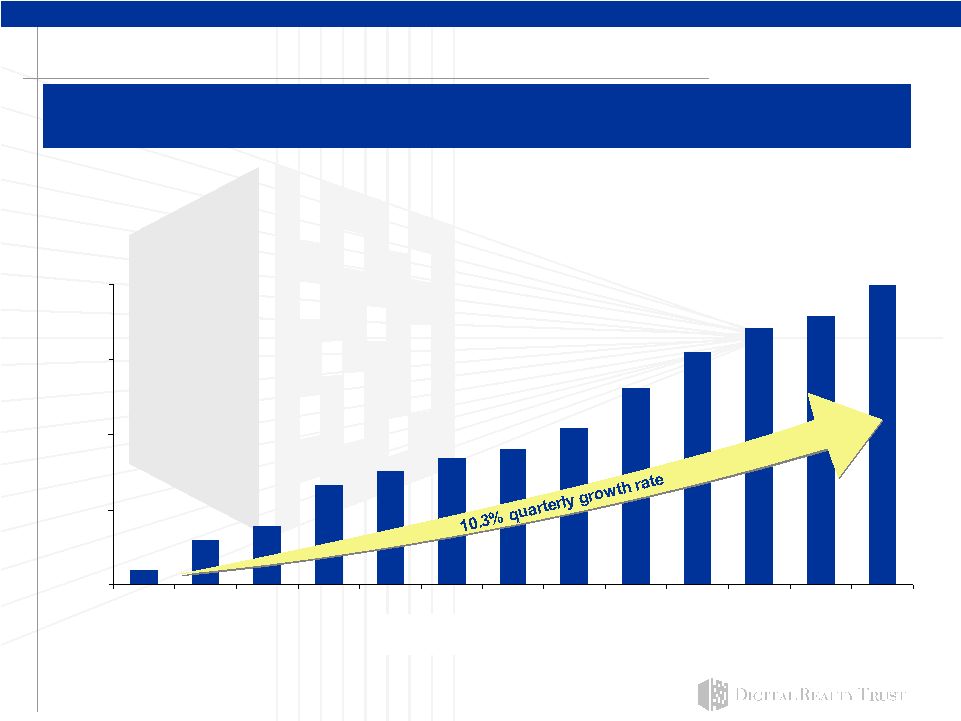 19 $847.2 $1,044.3 $1,137.4 $1,413.4 $1,508.5 $1,593.6 $1,648.2 $1,794.4 $2,066.2 $2,298.7 $2,457.5 $2,740.2 $2,535.5 $750 $1,250 $1,750 $2,250 $2,750 Sep-04 Dec-04 Mar-05 Jun-05 Sep-05 Dec-05 Mar-06 Jun-06 Sep-06 Dec-06 Mar-07 Jun-07 Sep-07 Proven Track Record: Strong Acquisition Activity Since its IPO, DLR has more than doubled its total assets through property acquisitions. Total Undepreciated Assets ($000s) |
 20 (1) Net rentable square feet figures excludes space held for redevelopment. (2) A leasehold interest consisting of two suites in 111 8th Ave. (NY) acquired from NYC Connect. (3) Devon Shafron Drive consists of 43881, 43831 & 43791 Devin Shafron Drive (VA). (4) 9.4 acre development site in suburban London, England with planning permission for a datacenter facility. (5) Legal title to these properties is currently held by a 1031 exchange accommodator. (6) Includes a $2.3 million earn-out payment made at closing. (7) DLR owns a 50% ownership interest in a consolidated joint venture which owns this property. At the time of acquisition, the property was encumbered by $5.5 million of debt, which DLR guaranteed along with its joint venture partner. (8) Includes land that can support the development of datacenter facilities for a potential of up to 290,000 sf. DLR has acquired new properties totaling approximately $280 million in 2007. 2007 Acquisition Activity Property Metropolitan Area Purchase Price (in millions) Total Rentable Square Feet Total Net Rentable Square Feet Total Square Feet Held for Redevelopment Percentage of Net Rentable Square Feet Occupied (1) 21110 Ridgetop Northern Virginia $17.2 135,500 135,500 - 100% 3011 Lafayette Street Silicon Valley $13.7 90,800 - 90,800 - 44470 Chilum Place Northern Virginia $43.1 95,400 95,400 - 100% 111 Eighth Avenue (2) New York City $24.4 33,700 33,700 - 91% Devon Shafron Drive (3) Northern Virginia $63.0 432,000 167,000 265,000 100% Mundells Roundabout (4) London, England $31.4 - - - - 210 Tucker (5) St. Louis, MI $20.8 (6) 201,600 139,600 62,000 95% 900 Walnut (5) St. Louis, MI $34.5 (6) 112,300 112,300 - 99% 1 Savvis Parkway (5) St. Louis, MI $27.7 156,000 156,000 - 100% 1500 Space Park Drive Silicon Valley $3.7 (7) 49,900 - 49,900 (8) - YTD 2007 $279.5 1,307,200 839,500 467,700 |
 21 0.6% 4.0% 5.1% 8.5% 15.9% 1.5% 4.6% 4.6% 16.7% 7.3% 26.3% 2007 2008 2009 2010 2011 2012 2013 2014 2015 2016 Thereafter DLR’s Model Features Long-Term, Stable Leases The stability of our long-term leases complements our growth. Note: Excludes vacant square footage of 0.5 million square feet and 1.7 million square feet of space held for redevelopment as of September 30, 2007. Lease Expiration as a Percentage of Net Rentable Square Feet 17.6% through 2010 The average lease term is approximately 13 years with 7.5 years remaining. Leases typically contain 3% annual rent bumps. |
 22 DLR Financial Overview Strong and consistent FFO (1) growth – $0.51 per diluted share and unit for 3Q07, +24% from 3Q06 – $1.63 per diluted share and unit for 2006, +19% from 2005 Increasing NOI (1) – $64.9 million in 3Q07, +4% from $62.7 million in 2Q07 and +31% from $49.5 million in 3Q06 Well supported dividend – 3.1% yield (2) – FFO / AFFO (1) payout ratio of 66% / 90% (3) for 3Q07 – Increased quarterly common dividend in 4Q07, +8.3% (1) FFO, AFFO and NOI are non-GAAP financial measures. For a description of FFO, AFFO and NOI see page 28. (2) Based on most recent quarterly dividend annualized. Dividend yield based on November 9, 2007 closing stock price of $39.66. (3) FFO payout ratio is dividend declared per common share and unit divided by diluted FFO per share and unit. AFFO payout ratio is dividend declared per common share and unit divided by diluted AFFO per share and unit. For a description of FFO and AFFO see page 28. For a reconciliation to net income see page 29. |
 23 DLR Capital Raising Activities Proven access to capital – YTD 2007 Issued 4.025 million shares of common stock, resulting in $150.5 of net proceeds Entered into enhanced $650 million revolving credit facility – Increased size from $500 million – Reduced applicable margin ranges by 12.5 to 25 basis points – Extended maturity to 2010 – Modified covenants to enhance financial flexibility Issued $175.0 million of 4.375% convertible preferred: 20% premium Sold two non-core assets resulting in a total gain on sale of $18.0 million Raised approximately $2.4 billion of capital since IPO |
 24 DLR 2008 Guidance (1) 2007 revised projected Funds from Operations (FFO) (2) per share guidance: $2.02 to $2.04 (1) Based on third quarter 2007 earnings conference call dated November 7, 2007. (2) FFO and AFFO are non GAAP financial measures. For a description of FFO and AFFO see page 28. For a reconciliation to net income see page 29. (3) Includes $2.4 million of acquisition related costs previously capitalized, which now must be expensed under new accounting rules commencing January 1, 2008. Internal Growth 10.2% to 15.0% FFO (2) Per Share Growth Leasing 890,000 to 990,000 sq ft of Turn-Key Datacenter™ & Powered Base Building™ space (average gross rent $90 / sq ft) 100,000 to 125,000 sq ft of basic commercial space (average gross rent $19 / sq ft) Acquisitions $300 - $350 million o $100 to $150 million of vacant properties for redevelopment o $200 million of income producing properties at an average cap rate of 8.00% External Growth 2.5% to 3.8% FFO (2) Per Share Growth 12.7% to 18.8% Overall FFO (2) Per Share Growth • Capital Expenditure for redevelopment of $340 million • Total G&A of $44 million (3) 2008 projected Funds from Operations (FFO) (2) per share guidance: $2.30 to $2.40: |
 25 DLR Capital Structure Preferred 7.6% Fixed Rate Debt 24.9% Variable Rate Debt 3.8% Equity 63.7% DLR Employs a Conservative Capital Structure Weighted average cost of debt: 5.84% (5) ; approximately 87% fixed rate debt (6) Coverage ratios (7) : – Debt service: 3.4x – Fixed charge: 2.4x Total Enterprise Value (1) $4,483.6 million Dividend Yield / Rate: 3.1% / $1.24 (1) Based on 72.0 million shares & OP units outstanding as of November 9, 2007 and $39.66 share price as of close of market on November 9, 2007 equal to $2.9 billion in equity. (2) Excludes $1.8 million of unamortized debt premium for 1125 Energy Park Drive & 731 East Trade Street. (3) Credit facility as of November 9, 2007 based on outstanding amount of $167.4 million; fluctuates based on amount outstanding. (4) Includes $175 million of 4.375% convertible preferred stock issued in April 2007. (5) Excluding the equity component of the exchangeable debt, the weighted average cost of debt is 5.67%. (6) Includes $172.5M of exchangeable debt and $257.4M of swapped floating rate debt. (7) As of September 30, 2007; debt service coverage ratio is Adjusted EBITDA divided by GAAP interest expense; fixed charge coverage ratio is Adjusted EBITDA divided by fix ed charges. See p. 28 for a description of Adjusted EBITDA and p. 29 for a reconciliation of Adjusted EBITDA, GAAP interest expense and fixed charge coverage ratio. (3) (2)(6) (4) (1) |
 26 DLR Implied Cap Rate ($ in thousands, except per square foot values) Current Market Value of Common Stock and OP Units (1) $2,773,701 $2,773,701 $2,773,701 Liquidation Value of Perpetual Preferred Stock 341,750 341,750 341,750 Net Debt (2) 1,285,926 1,285,926 1,285,926 Less: Book Value of Construction Work in Progress (107,768) (107,768) (107,768) Less: Value of Redevelopment Portfolio (3) (512,418) (854,030) (1,195,641) Range of Values per Square Foot $300 $500 $700 Total Implied Value of Income Producing Assets $3,781,192 $3,439,580 $3,097,968 Cash Net Operating Income (3Q Annualized) (4) 223,272 223,272 223,272 Implied Cap Rate (3Q Annualized) (4) 5.9% 6.5% 7.2% Total Portfolio Square Footage (in thousands) (5) 12,020 12,020 12,020 Total Portfolio Square Footage w/o Redevelopment Space (in thousands) (5) 10,312 10,312 10,312 Value per Square Foot w/o Redevelopment Space $367 $334 $300 (1) Represents 69,937 diluted shares & OP units (as of November 9, 2007) and $39.66 share price as of close of market on November 9, 2007. (2) Represents total debt balance of $1,335,108 less cash balance of $49,182 (as of September 30, 2007). (3) Reflects 1,708 square feet of redevelopment space (as of September 30, 2007) at hypothetical values per square foot. (4) Annualized cash NOI calculation based on third quarter 2007 NOI of $65,713 less straight line rents of $7,204 and above and below market rent amortization of $2,691. In 3Q 2007, office properties contributed cash NOI of $6,198. See page 27 for a description of NOI and Cash NOI. (5) As of September 30, 2007. |
 |
 28 Definition of non-GAAP financial measures This presentation includes certain non-GAAP financial measures that management believes are helpful in understanding our business, as further described below. Our definition and calculation of non-GAAP financial measures may differ from those of other REITs, and, therefore, may not be comparable. The non-GAAP financial measures should not be considered an alternative to net income or any other GAAP measurement of performance and should not be considered an alternative to cash flows from operating, investing or financing activities as a measure of liquidity. Funds from Operations (FFO) We calculate Funds from Operations, or FFO, in accordance with the standards established by the National Association of Real Estate Investment Trusts, or NAREIT. FFO represents net income (loss) (computed in accordance with GAAP), excluding gains (or losses) from sales of property, real estate related depreciation and amortization (excluding amortization of deferred financing costs) and after adjustments for unconsolidated partnerships and joint ventures. Management uses FFO as a supplemental performance measure because, in excluding real estate related depreciation and amortization and gains and losses from property dispositions, it provides a performance measure that, when compared year over year, captures trends in occupancy rates, rental rates and operating costs. We also believe that, as a widely recognized measure of the performance of REITs, FFO will be used by investors as a basis to compare our operating performance with that of other REITs. However, because FFO excludes depreciation and amortization and captures neither the changes in the value of our properties that result from use or market conditions, nor the level of capital expenditures and leasing commissions necessary to maintain the operating performance of our properties, all of which have real economic effect and could materially impact our results from operations, the utility of FFO as a measure of our performance is limited. Other REITs may not calculate FFO in accordance with the NAREIT definition and, accordingly, our FFO may not be comparable to such other REITs’ FFO. Accordingly, FFO should be considered only as a supplement to net income as a measure of our performance. Adjusted Funds From Operations (AFFO) We present adjusted funds from operations, or AFFO, as a supplemental operating measure because, when compared year over year, it assesses our ability to fund dividend and distribution requirements from our operating activities. We also believe that, as a widely recognized measure of the operations of REITs, AFFO will be used by investors as a basis to assess our ability to fund dividend payments in comparison to other REITs. We calculate adjusted funds from operations, or AFFO, by adding to or subtracting from FFO (i) non-real estate depreciation, (ii) amortization of deferred financing costs (iii) non cash compensation (iv) loss from early extinguishment of debt (v) straight line rents (vi) fair value of lease revenue amortization (vii) capitalized leasing payroll (viii) recurring tenant improvements and (ix) capitalized leasing commissions. Other equity REITs may not calculate AFFO in a consistent manner. Accordingly, our AFFO may not be comparable to other equity REITs’ AFFO. AFFO should be considered only as a supplement to net income computed in accordance with GAAP as a measure of our operations. Net Operating Income (NOI) and Cash NOI NOI represents rental revenue and tenant reimbursement revenue less rental property operating and maintenance, property taxes and insurance expenses (as reflected in statement of operations). NOI is commonly used by stockholders, company management and industry analysts as a measurement of operating performance of the company’s rental portfolio. Cash NOI is NOI less straight-line rents and above and below market rent amortization. Cash NOI is commonly used by stockholders, company management and industry analysts as a measure of property operating performance on a cash basis. However, because NOI and cash NOI exclude depreciation and amortization and capture neither the changes in the value of our properties that result from use or market conditions, nor the level of capital expenditur es and leasing commissions necessary to maintain the operating performance of our properties, all of which have real economic effect and could materially impact our results from operations, the utility of NOI and cash NOI as measures of our performance is limited. Other REITs may not calculate NOI and cash NOI in the same manner we do and, accordingly, our NOI and cash NOI may not be comparable to such other REITs’ NOI and cash NOI. Accordingly, NOI and cash NOI should be considered only as supplements to net income as measures of our performance. Earnings Before Interest Taxes Depreciation and Amortization (EBITDA) We present Earnings Before Interest Taxes Depreciation and Amortization or EBITDA as a supplemental operating measure because, because in excluding interest, taxes, depreciation and amortization, it permits investors to view income from operations without the impact of the cost of debt, non cash depreciation and amortization and taxes. We also believe that, as awidely recognized measure of the performance of other companies in the data center industry thatwill be used by investors as a basis to compare our operating performance with that of others in that industry. However, because EBITDA excludes interest, taxes, depreciation and amortization and captures neither the changes in the value of our properties that result from use or market conditions, nor the current level of capital expenditures and other capitalize d items, all of which have real economic effect and could materially impact our results from operations, the utility of EBITDA as a measure of our performance is limited. Accordingly, EBITDA should be considered only as a supplement to net income as a measure of our performance. Each of FFO and Adjusted EBITDA exclude items that have real economic effect and could materially impact our results from operations, and therefore the utility of FFO and Adjusted EBTIDA as a measure of our performance is limited. Nothing contained herein is intended to revise or confirm the earnings, FFO or acquisition guidance we discussed on our Earnings Conference Call held on November 7, 2007 and available on our website at www.digitalrealtytrust.com. |
   29 Reconciliation of non-GAAP items to their closest GAAP 2007 FFO Reconciliation (Low - High) Net income available to common stockholders per diluted share $0.35 - 0.37 Less: Gain on sale of assets ($0.25) Add: Minority interest $0.01 Real estate depreciation and amortization $1.91 Projected FFO per diluted share and unit $2.02 – 2.04 2008 FFO Reconciliation (Low - High) Net income available to common stockholders per diluted share $0.33 - 0.42 Add: Minority interest $0.01 - 0.02 Real estate depreciation and amortization $1.96 Projected FFO per diluted share and unit $2.30 – 2.40 Funds from operations (1) Cash interest expense and fixed charges (including discontinued operations) Q307 Q207 Q107 Q406 Q306 Q206 Q106 FY2006 FY2005 Q307 Q207 Q107 Q406 Q306 Q206 Q106 FY2006 FY2005 Net income (loss) available to common stockholders (224) $ $2,591 $18,641 $2,978 $11,342 $1,650 $1,642 $17,612 $6,087 Total GAAP interest expense (including discontinued operations) $16,683 $15,142 $17,323 $14,569 $14,533 $12,181 $11,388 $52,671 $39,122 Capitalized interest 3,096 2,792 1,507 1,114 917 1,058 762 3,851 279 Minority interests in operating partnership including discontinued operations (27) 310 3,762 1,276 8,464 1,340 1,846 12,926 8,268 Change in accrued interest and other noncash amounts (315) (3,575) (948) (3,206) (2,590) 57 (1,906) (7,645) (4,345) Real estate related depreciation and amortization (2) 35,216 31,708 29,643 28,055 24,454 20,238 18,185 90,932 62,171 Cash interest expense 19,464 14,359 17,882 12,477 12,860 13,296 10,244 48,877 35,056 Real estate related depreciation and amortization related to investment in unconsolidated joint venture 969 1,010 1,036 796 - - - 796 - Scheduled debt principal payments and preferred dividends 7,215 6,902 5,085 5,063 4,960 4,567 4,869 19,458 17,275 Gain on sale of assets - - (18,049) (80) (18,016) - - (18,096) - Total fixed charges $26,679 $21,261 $22,967 $17,540 $17,820 $17,863 $15,113 $68,335 $52,331 Funds from operations (FFO) $35,934 $35,619 $35,033 $33,025 $26,244 $23,228 $21,673 $104,170 $76,526 Funds from operations (FFO) per diluted share $ 0.51 $ 0.51 $ 0.50 $ 0.48 $ 0.41 $ 0.38 $ 0.36 $ 1.63 $ 1.37 Reconciliation of EBITDA Net income (loss) per diluted share available to common stockholders $ - $ 0.04 $ 0.32 $ 0.06 $ 0.30 $ 0.05 $ 0.06 $ 0.47 $ 0.25 Q307 Q207 Q107 Q406 Q306 Q206 Q106 FY2006 FY2005 Funds from operations (FFO) $35,934 $35,619 $35,033 $33,025 $26,244 $23,228 $21,673 $104,170 $76,526 Net income (loss) available to common stockholders (224) $ $2,591 $18,641 $2,978 $11,342 $1,650 $1,642 $17,612 $6,087 Non real estate depreciation 129 124 135 118 285 37 71 511 61 Amortization of deferred financing costs 1,682 1,321 1,389 1,115 916 937 795 3,763 2,965 Interest 16,683 15,142 17,323 14,569 14,533 12,181 11,388 52,671 39,122 Non cash compensation 1,103 836 507 491 430 435 431 1,787 481 Depreciation and amortization 35,345 31,832 29,778 28,173 24,739 20,275 18,256 91,443 62,232 Loss from early extinguishment of debt - - - 6 40 425 57 528 1,021 Straight line rents (7,204) (5,770) (5,111) (5,810) (3,856) (4,233) (3,843) (17,742) (13,023) EBITDA 51,804 49,565 65,742 45,720 50,614 34,106 31,286 161,726 107,441 Above and below market rent amortization (2,691) (2,578) (2,338) (2,238) (2,837) (1,504) (433) (7,012) (1,717) Capitalized leasing compensation (300) (175) (175) (217) (185) (888) (764) (2,054) (781) Gain on sale of assets, net of minority interests - - 15,019 56 10,318 - - 10,374 - Recurring capital expenditures and tenant improvements (2,765) 99 (393) (2,574) (344) (338) (904) (4,160) (2,897) Capitalized leasing commissions (1,389) (3,836) (439) (3,716) (1,523) (1,682) (265) (7,186) (3,051) EBITDA, less effect of gain on sale of assets $51,804 $49,565 $50,723 $45,664 $40,296 $34,106 $31,286 $151,352 $107,441 Adjusted funds from operations (1) $24,499 $25,640 $28,608 $20,200 $19,170 $16,417 $16,818 $72,605 $59,585 Reconciliation of Adjusted EBITDA (2) Real estate depreciation and amortization was computed as follows: Q307 Q207 Q107 Q406 Q306 Q206 Q106 FY2006 FY2005 EBITDA $51,804 $49,565 $65,742 $45,720 $50,614 $34,106 $31,286 $161,726 $107,441 Q307 Q207 Q107 Q406 Q306 Q206 Q106 FY2006 FY2005 Depreciation and amortization per income statement $35,345 $31,832 $29,399 $27,290 $23,768 $18,534 $16,537 $86,129 $59,616 Minority interests (27) 310 3,762 1,276 8,464 1,340 1,846 12,926 8,268 Depreciation and amortization of discontinued operations - - 379 883 971 1,741 1,719 5,314 2,616 Preferred stock dividends 5,359 5,167 3,445 3,445 3,445 3,445 3,445 13,780 10,014 Non real estate depreciation (129) (124) (135) (118) (285) (37) (71) (511) (61) $35,216 $31,708 $29,643 $28,055 $24,454 $20,238 $18,185 $90,932 $62,171 Adjusted EBITDA 57,136 55,042 72,949 50,441 62,523 38,891 36,577 188,432 125,723 Weighted-average shares outstanding - diluted 69,937 70,229 69,831 69,213 64,397 60,959 59,874 63,870 55,761 Gain on sale of assets - - 18,049 80 18,016 - - 18,096 - Adjusted EBITDA, less effect of gain on sale of assets $57,136 $55,042 $54,900 $50,361 $44,507 $38,891 $36,577 $170,336 $107,441 Reconciliation of Net Operating Income (NOI) Q307 Q207 Q107 Q406 Q306 Q206 Q106 FY2006 FY2005 Operating income 21,425 $ 22,541 $ 21,965 $ 20,943 $ 18,451 $ 17,787 $ 17,388 $ 74,569 $ 59,587 $ Less: Other revenue (154) (247) - (197) - - (168) (365) (5,829) Add: Depreciation and amortization 35,345 31,832 29,399 27,290 23,768 18,534 16,537 86,129 55,701 General and administrative 7,775 8,456 7,210 6,535 4,986 4,674 4,246 20,441 12,615 Other expenses 495 128 188 173 607 150 181 1,111 1,617 Net Operating Income 64,886 $ 62,710 $ 58,762 $ 54,744 $ 47,812 $ 41,145 $ 38,184 $ 181,885 $ 123,691 $ (1) Funds from operations and Adjusted Funds from operations for all periods presented above includes the results of properties sold in 2006 and 2007; 7979 East Tufts Avenue (July 2006), 100 Technology Center Drive (March 2007) and 4055 Valley View Lane (March 2007). |