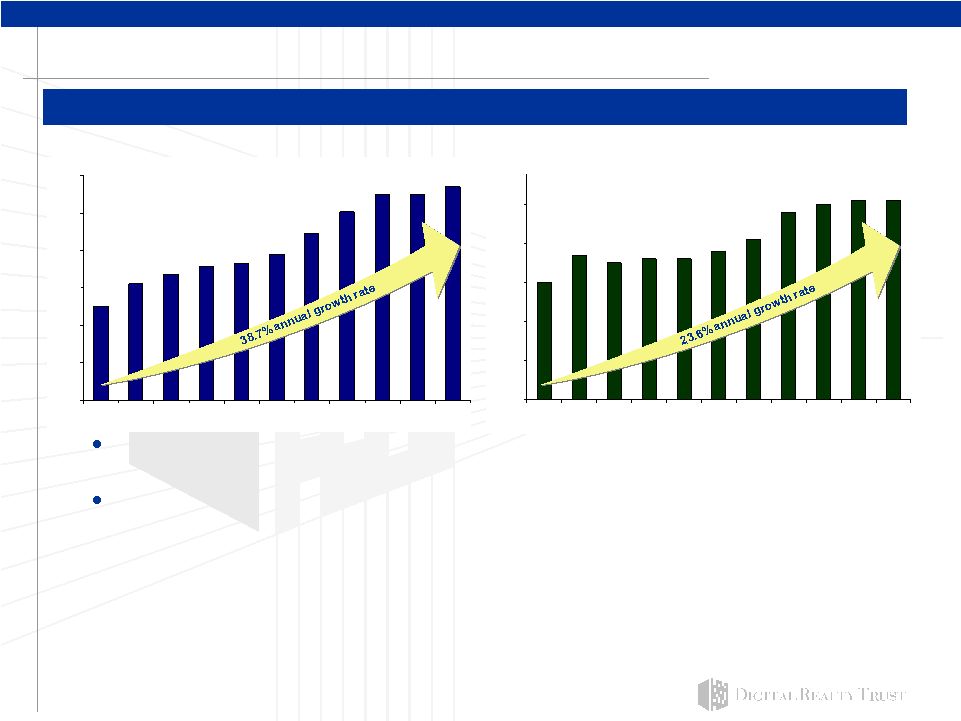
29 Reconciliation of non-GAAP items to their closest GAAP Cash interest expense and fixed charges (including discontinued operations) Q307 Q207 Q107 Q406 Q306 Q206 Q106 FY2006 Q405 Q305 Q205 Q105 FY2005 Total GAAP interest expense (including discontinued operations) $16,683 $15,142 $17,323 $14,569 $14,533 $12,181 $11,388 $52,671 $10,988 $10,724 $9,289 $8,121 $39,122 Capitalized interest 3,096 2,792 1,507 1,114 917 1,058 762 3,851 279 - - - 279 Change in accrued interest and other noncash amounts (315) (3,575) (948) (3,206) (2,590) 57 (1,906) (7,645) (1,660) (777) (1,203) (705) (4,345) Cash interest expense 19,464 14,359 17,882 12,477 12,860 13,296 10,244 48,877 9,607 9,947 8,086 7,416 35,056 Scheduled debt principal payments and preferred dividends 7,215 6,902 5,085 5,063 4,960 4,567 4,869 19,458 4,914 5,072 4,180 3,109 17,275 Total fixed charges $26,679 $21,261 $22,967 $17,540 $17,820 $17,863 $15,113 $68,335 $14,521 $15,019 $12,266 $10,525 $52,331 Reconciliation of EBITDA Q307 Q207 Q107 Q406 Q306 Q206 Q106 FY2006 Q405 Q305 Q205 Q105 FY2005 Net income (loss) available to common stockholders (224) $ $2,591 $18,641 $2,978 $11,342 $1,650 $1,642 $17,612 $1,157 $1,326 $2,136 $1,468 $6,087 Interest 16,683 15,142 17,323 14,569 14,533 12,181 11,388 52,671 10,988 10,724 9,289 8,121 39,122 Depreciation and amortization 35,345 31,832 29,778 28,173 24,739 20,275 18,256 91,443 18,804 16,957 14,328 12,143 62,232 EBITDA 51,804 49,565 65,742 45,720 50,614 34,106 31,286 161,726 30,949 29,007 25,753 21,732 107,441 Gain on sale of assets, net of minority interests - - 15,019 56 10,318 - - 10,374 - - - - - EBITDA, less effect of gain on sale of assets $51,804 $49,565 $50,723 $45,664 $40,296 $34,106 $31,286 $151,352 $30,949 $29,007 $25,753 $21,732 $107,441 Reconciliation of Adjusted EBITDA Q307 Q207 Q107 Q406 Q306 Q206 Q106 FY2006 Q405 Q305 Q205 Q105 FY2005 EBITDA $51,804 $49,565 $65,742 $45,720 $50,614 $34,106 $31,286 $161,726 $30,949 $29,007 $25,753 $21,732 $107,441 Minority interests (27) 310 3,762 1,276 8,464 1,340 1,846 12,926 1,338 1,628 3,143 2,159 8,268 Preferred stock dividends 5,359 5,167 3,445 3,445 3,445 3,445 3,445 13,780 3,445 3,099 2,199 1,271 10,014 Adjusted EBITDA 57,136 55,042 72,949 50,441 62,523 38,891 36,577 188,432 35,732 33,734 31,095 25,162 125,723 Gain on sale of assets - - 18,049 80 18,016 - - 18,096 - - - - - Adjusted EBITDA, less effect of gain on sale of assets $57,136 $55,042 $54,900 $50,361 $44,507 $38,891 $36,577 $170,336 $35,732 $33,734 $31,095 $25,162 $125,723 Reconciliation of Net Operating Income (NOI) Q307 Q207 Q107 Q406 Q306 Q206 Q106 FY2006 Q405 Q305 Q205 Q105 FY2005 Operating income 21,425 $ 22,541 $ 21,965 $ 20,943 $ 18,451 $ 17,787 $ 17,388 $ 74,569 $ 15,734 $ 15,986 $ 15,776 $ 12,091 $ 59,587 $ Less: Other revenue (154) (247) - (197) - - (168) (365) (1,432) (265) (3,832) (300) (5,829) Add: Depreciation and amortization 35,345 31,832 29,399 27,290 23,768 18,534 16,537 86,129 17,061 15,340 12,733 10,567 55,701 General and administrative 7,775 8,456 7,210 6,535 4,986 4,674 4,246 20,441 4,425 3,324 2,453 2,413 12,615 Other expenses 495 128 188 173 607 150 181 1,111 73 106 961 477 1,617 Net Operating Income 64,886 $ 62,710 $ 58,762 $ 54,744 $ 47,812 $ 41,145 $ 38,184 $ 181,885 $ 35,861 $ 34,491 $ 28,091 $ 25,248 $ 123,691 $ |