|
| | |
| Table of Contents | | Financial Supplement |
| | Third Quarter 2014 |
|
| | | | | |
| Overview | PAGE |
| | | | | | |
| 3 |
| | | | | | |
| 5 |
| | | | | | |
| 6 |
| | | | | | |
| Consolidated Statements of Operations | |
| | | | | | |
| 7 |
| | | | | | |
| 8 |
| | | | | | |
| 9 |
| | | | | | |
| 10 |
| | | | | | |
| Balance Sheets | |
| | | | | | |
| 11 |
| | | | | | |
| 12 |
| | | | | | |
| 13 |
| | | | | | |
| 14 |
| | | | | | |
| 15 |
| | | | | | |
| Internal Growth | |
| | | | | | |
| 16 |
| | | | | | |
| 17 |
| | | | | | |
| 18 |
| | | | | | |
| 19 |
| | | | | | |
| 20 |
| | | | | | |
| 21 |
| | | | | | |
| 22 |
| | | | | | |
| 23 |
| | | | | | |
| 24 |
| | | | | | |
| 25 |
| | | | | | |
| External Growth | |
| | | | | | |
| 30 |
| | | | | | |
| 31 |
| | | | | | |
| 32 |
| | | | | | |
| 33 |
| | | | | | |
| 34 |
| | | | | | |
| 35 |
| | | | | | |
| 36 |
| | | | | | |
| 37 |
| | | | | | |
| Definitions | |
| | | | | | |
| 41 |
| | | | | | |
| 42 |
|
| | |
| Corporate Information | �� | Financial Supplement |
| | Third Quarter 2014 |
Corporate Profile
Digital Realty Trust, Inc. owns, acquires, develops and manages technology-related real estate. The Company is focused on providing data center and colocation solutions for domestic and international tenants across a variety of industry verticals ranging from financial services, cloud and information technology services, to manufacturing, energy, healthcare, and consumer products. As of September 30, 2014, the Company's 131 properties, including 14 properties held as investments in unconsolidated joint ventures, contain applications and operations critical to the day-to-day operations of technology industry and corporate enterprise data center tenants. Digital Realty's portfolio is comprised of approximately 22.0 million square feet, excluding approximately 1.3 million square feet of space under active development and 1.2 million square feet of space held for future development, located throughout North America, Europe, Asia and Australia. For additional information, please visit the Company's website at www.digitalrealty.com.
Corporate Headquarters
Four Embarcadero Center, Suite 3200
San Francisco, California 94111
Telephone: (415) 738-6500
Facsimile: (415) 738-6501
Website: www.digitalrealty.com
Senior Management
A. William Stein: Interim Chief Executive Officer and Chief Financial Officer
Scott E. Peterson: Chief Investment Officer
Jim Smith: Chief Technology Officer
David J. Caron: Senior Vice President, Portfolio Management
Matthew Miszewski: Senior Vice President, Sales
Investor Relations
To request an Investor Relations package or to be added to our e-mail distribution list, please visit our website:
www.digitalrealty.com (Proceed to Information Request in the Investor Relations section)
Analyst Coverage
|
| | | | | | | | | | |
| Baird | | Bank of America
Merrill Lynch | | Barclays Capital | | Canaccord Genuity | | Cantor Fitzgerald | | Citigroup |
| David Rodgers | | Stephen Douglas | | Ross Smotrich | | Greg Miller | | David Toti | | Michael Bilerman |
| (216) 737-7341 | | (646) 855-2615 | | (212) 526-2306 | | (212) 389-8128 | | (212) 915-1219 | | (212) 816-1383 |
| |
| |
| |
| |
| |
|
| |
| |
| | Matthew Kahn | | Evan Smith | | Emmanuel Korchman |
| |
| |
| | (212) 389-8129 | | (212) 915-1220 | | (212) 816-1382 |
| |
| |
| |
| |
| |
|
| Cowen | | Deutsche Bank | | Evercore | | Green Street | | Jefferies | | KeyBanc Capital Markets |
| Colby Synesael | | Vincent Chao | | Jonathan Schildkraut | | Michael Knott | | Omotayo Okusanya | | Jordan Sadler |
| (646) 562-1355 | | (212) 250-6799 | | (212) 497-0864 | | (949) 640-8780 | | (212) 336-7076 | | (917) 368-2280 |
| |
| |
| |
| |
| |
|
| Jonathan Charbonneau | |
| | Robert Gutman | | John Bejjani | | Kunal Madhukar | | Austin Wurschmidt |
| (646) 562-1356 | |
| | (212) 497-0877 | | (949) 640-8780 | | (212) 707-6464 | | (917) 368-2311 |
| |
| |
| |
| |
| |
|
| MLV & Co. | | Morgan Stanley | | Raymond James | | RBC Capital Markets | | Stifel | | UBS |
| Jonathan M. Petersen | | Vance Edelson | | Paul D. Puryear | | Jonathan Atkin | | Matthew Heinz | | Ross Nussbaum |
| (646) 556-9185 | | (212) 761-0078 | | (727) 567-2253 | | (415) 633-8589 | | (443) 224-1382 | | (212) 713-2484 |
| |
| |
| |
| |
| |
|
| Ryan Meliker | |
| | William A. Crow | | Brian Hyun | |
| |
|
| (212) 542-5872 | |
| | (727) 567-2594 | | (415) 633-8581 | |
| |
|
This Supplemental Operating and Financial Data package supplements the information provided in our quarterly and annual reports filed
with the Securities and Exchange Commission. Additional information about us and our properties is also available on our website
www.digitalrealty.com.
|
| | |
| Corporate Information (Continued) | | Financial Supplement |
| | Third Quarter 2014 |
Stock Listing Information
The stock of Digital Realty Trust, Inc. is traded primarily on the New York Stock Exchange under the following symbols:
|
| | |
| Common Stock: | | DLR |
| Series E Preferred Stock | | DLRPRE |
| Series F Preferred Stock | | DLRPRF |
| Series G Preferred Stock | | DLRPRG |
| Series H Preferred Stock | | DLRPRH |
Note that symbols may vary by stock quote provider.
Credit Ratings
|
| | | | |
| Standard & Poors | | | | |
| Corporate Credit Rating: | | BBB | | (Stable Outlook) |
| Preferred Stock: | | BB+ | | |
| | | | | |
| Moody's | | | | |
| Issuer Rating: | | Baa2 | | (Stable Outlook) |
| Preferred Stock: | | Baa3 | | |
| | | | | |
| Fitch | | | | (Stable Outlook) |
| Issuer Default Rating: | | BBB | | |
| Preferred Stock: | | BB+ | | |
These credit ratings may not reflect the potential impact of risks relating to the structure or trading of the Company’s securities and are provided solely for informational purposes. Credit ratings are not recommendations to buy, sell or hold any security, and may be revised or withdrawn at any time by the issuing organization at its sole discretion. The Company does not undertake any obligation to maintain the ratings or to advise of any change in ratings. Each agency’s rating should be evaluated independently of any other agency’s rating. An explanation of the significance of the ratings may be obtained from each of the rating agencies.
Common Stock Price Performance
The following summarizes recent activity of Digital Realty's common stock (DLR):
|
| | | | | | | | | | | | | | | | | | | | | | | |
| 30-Sep-14 | | 30-Jun-14 | | 31-Mar-14 | | 31-Dec-13 | | 30-Sep-13 | | 30-Jun-13 |
| High price (1) | $ | 67.75 |
| | $ | 59.50 |
| | $ | 57.52 |
| | $ | 58.35 |
| | $ | 65.43 |
| | $ | 74.00 |
|
| Low price (1) | $ | 57.64 |
| | $ | 51.33 |
| | $ | 48.85 |
| | $ | 43.04 |
| | $ | 50.98 |
| | $ | 56.02 |
|
| Closing price, end of quarter (1) | $ | 62.38 |
| | $ | 58.32 |
| | $ | 53.08 |
| | $ | 49.12 |
| | $ | 53.10 |
| | $ | 61.00 |
|
| Average daily trading volume (1) | 1,130,023 |
| | 1,635,316 |
| | 1,519,608 |
| | 1,814,127 |
| | 1,571,339 |
| | 1,680,636 |
|
| Indicated dividend per common share (2) | $ | 3.32 |
| | $ | 3.32 |
| | $ | 3.32 |
| | $ | 3.12 |
| | $ | 3.12 |
| | $ | 3.12 |
|
| Closing annual dividend yield, end of quarter | 5.3 | % | | 5.7 | % | | 6.3 | % | | 6.4% |
| | 5.9% |
| | 5.1% |
|
| Shares and units outstanding, end of quarter (3) | 138,627,370 |
| | 138,498,396 |
| | 131,732,073 |
| | 131,422,371 |
| | 131,421,001 |
| | 131,418,758 |
|
| Closing market value of shares and units outstanding (4) | $ | 8,647,575 |
| | $ | 8,077,226 |
| | $ | 6,992,338 |
| | $ | 6,455,467 |
| | $ | 6,978,455 |
| | $ | 8,016,544 |
|
| |
| (1) | New York Stock Exchange trades only. |
| |
| (2) | On an annualized basis. |
| |
| (3) | As of September 30, 2014, the total number of shares and units includes 135,503,184 shares of common stock, 1,478,814 common units held by third parties and 1,645,372 common units, vested and unvested long-term incentive units and vested class C units held by officers and directors, and excludes all unexercised common stock options and all shares potentially issuable upon conversion of our series E, series F, series G and series H cumulative redeemable preferred stock upon certain change of control transactions. |
| |
| (4) | Dollars in thousands as of the end of the quarter. |
This Supplemental Operating and Financial Data package supplements the information provided in our quarterly and annual
reports filed with the Securities and Exchange Commission. Additional information about us and our properties is also
available on our website www.digitalrealty.com.
|
| | |
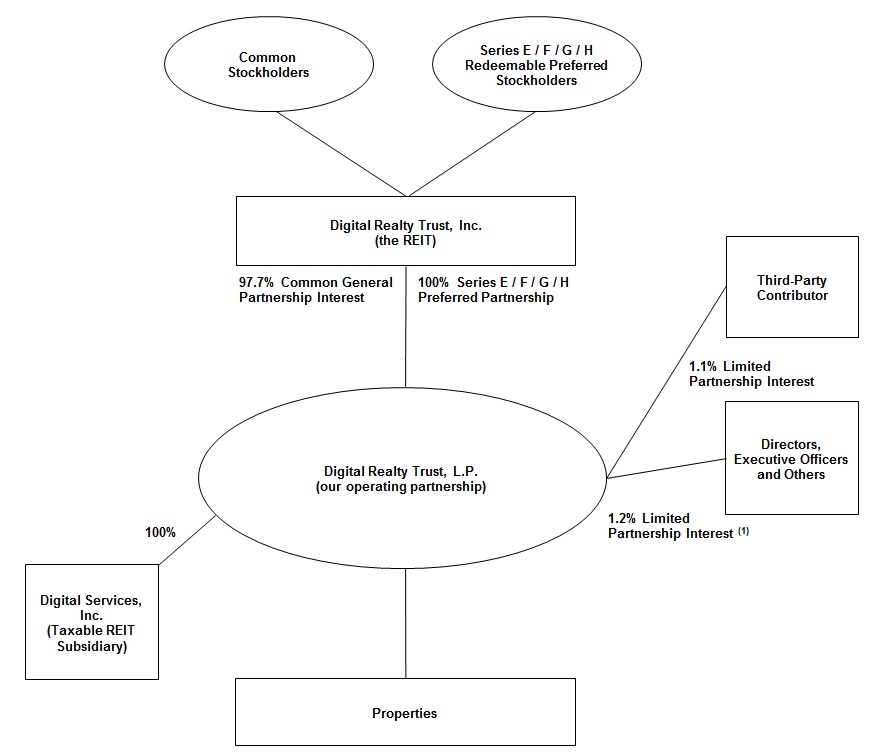
| Ownership Structure | | Financial Supplement |
| As of September 30, 2014 | Third Quarter 2014 |
|
| | | | | | |
| Partner |
| # of Units (2) | | % Ownership |
| Digital Realty Trust, Inc. |
| 135,503,184 |
| | 97.7 | % |
Cambay Tele.com, LLC (3) |
| 1,478,814 |
| | 1.1 | % |
| Directors, Executive Officers and Others |
| 1,645,372 |
| | 1.2 | % |
| Total |
| 138,627,370 |
| | 100.0 | % |
| |
| (1) | Reflects limited partnership interests held by our officers and directors in the form of common units, vested and unvested long-term incentive units and vested class C units and excludes all unexercised common stock options. |
| |
| (2) | The total number of units includes 135,503,184 general partnership common units, 1,478,814 common units held by third parties and 1,645,372 common units, vested and unvested long-term incentive units and vested class C units held by officers and directors, and excludes all unexercised common stock options and all shares potentially issuable upon conversion of our series E, series F, series G and series H cumulative redeemable preferred stock upon certain change of control transactions. |
| |
| (3) | This third-party contributor received the common units (along with cash and our operating partnership's assumption of debt) in exchange for their interests in 200 Paul Avenue, 1100 Space Park Drive, the eXchange colocation business and other specified assets and liabilities. Includes 400,913 common units held by the members of Cambay Tele.com, LLC. |
|
| | |
| Key Quarterly Financial Data | | Financial Supplement |
| Unaudited and dollars in thousands, except per share data | Third Quarter 2014 |
|
| | | | | | | | | | | | | | | | | | | |
| Shares and Units at End of Quarter | 30-Sep-14 | | 30-Jun-14 | | 31-Mar-14 | | 31-Dec-13 | | 30-Sep-13 |
| Common shares outstanding | 135,503,184 |
| | 135,370,016 |
| | 128,606,462 |
| | 128,455,350 |
| | 128,438,970 |
|
| Common units outstanding | 3,124,186 |
| | 3,128,380 |
| | 3,125,611 |
| | 2,967,021 |
| | 2,982,031 |
|
| Total Shares and Partnership Units | 138,627,370 |
| | 138,498,396 |
| | 131,732,073 |
| | 131,422,371 |
| | 131,421,001 |
|
| | | | | | | | | | |
| Enterprise Value | | | | | | | | | |
| Market value of common equity (1) | $ | 8,647,575 |
| | $ | 8,077,226 |
| | $ | 6,992,338 |
| | $ | 6,455,467 |
| | $ | 6,978,455 |
|
| Liquidation value of preferred equity | 1,085,000 |
| | 1,085,000 |
| | 1,020,000 |
| | 720,000 |
| | 720,000 |
|
| Total debt at balance sheet carrying value | 4,739,729 |
| | 4,859,235 |
| | 5,007,381 |
| | 4,961,892 |
| | 4,780,397 |
|
| Total Enterprise Value | $ | 14,472,304 |
| | $ | 14,021,461 |
| | $ | 13,019,719 |
| | $ | 12,137,359 |
| | $ | 12,478,852 |
|
| Total debt / total enterprise value | 32.8 | % | | 34.7 | % | | 38.5 | % | | 40.9 | % | | 38.3 | % |
| | | | | | | | | | |
| Selected Balance Sheet Data | | | | | | | | | |
| Investments in real estate (before depreciation) | $ | 10,331,214 |
| | $ | 10,352,848 |
| | $ | 10,107,121 |
| | $ | 9,950,082 |
| | $ | 9,576,467 |
|
| Total Assets | 9,722,007 |
| | 9,864,624 |
| | 9,741,453 |
| | 9,626,830 |
| | 9,360,151 |
|
| Total Liabilities | 5,618,447 |
| | 5,730,343 |
| | 5,865,733 |
| | 5,980,318 |
| | 5,679,582 |
|
| | | | | | | | | | |
| Selected Operating Data | | | | | | | | | |
| Total operating revenues | $ | 412,186 |
| | $ | 401,446 |
| | $ | 390,590 |
| | $ | 380,931 |
| | $ | 379,456 |
|
| Total operating expenses | 329,814 |
| | 308,993 |
| | 300,583 |
| | 282,876 |
| | 294,279 |
|
| Interest expense | 48,169 |
| | 49,146 |
| | 47,374 |
| | 45,996 |
| | 47,742 |
|
| Net income | 130,161 |
| | 61,332 |
| | 46,717 |
| | 55,667 |
| | 153,480 |
|
| Net income available to common stockholders | 109,314 |
| | 41,510 |
| | 34,186 |
| | 42,977 |
| | 138,872 |
|
| | | | | | | | | | |
| Financial Ratios | | | | | | | | | |
| EBITDA (2) | $ | 296,330 |
| | $ | 229,062 |
| | $ | 214,310 |
| | $ | 215,884 |
| | $ | 308,868 |
|
| Adjusted EBITDA (3) | 234,714 |
| | 233,965 |
| | 233,962 |
| | 226,270 |
| | 216,634 |
|
| Net Debt to Adjusted EBITDA (4) | 5.0x |
| | 5.1x |
| | 5.3x |
| | 5.4x |
| | 5.5x |
|
| GAAP interest expense | 48,169 |
| | 49,146 |
| | 47,374 |
| | 45,996 |
| | 47,742 |
|
| Fixed charges (5) | 75,069 |
| | 75,869 |
| | 67,754 |
| | 68,207 |
| | 69,498 |
|
| Interest coverage ratio (6) | 4.4x |
| | 4.3x |
| | 4.4x |
| | 4.2x |
| | 4.0x |
|
| Fixed charge coverage ratio (7) | 3.1x |
| | 3.1x |
| | 3.5x |
| | 3.3x |
| | 3.1x |
|
| | | | | | | | | | |
| Profitability Measures | | | | | | | | | |
| Net income per common share - basic | $ | 0.81 |
| | $ | 0.31 |
| | $ | 0.27 |
| | $ | 0.33 |
| | $ | 1.08 |
|
| Net income per common share - diluted | 0.80 |
| | 0.31 |
| | 0.26 |
| | 0.33 |
| | 1.06 |
|
| Funds from operations (FFO) / diluted share and unit (8) | 1.22 |
| | 1.20 |
| | 1.22 |
| | 1.26 |
| | 1.10 |
|
| Core funds from operations (CFFO) / diluted share and unit (8) | 1.22 |
| | 1.21 |
| | 1.28 |
| | 1.26 |
| | 1.16 |
|
| Adjusted funds from operations (AFFO) / diluted share and unit (9) | 0.96 |
| | 0.93 |
| | 0.97 |
| | 0.94 |
| | 0.92 |
|
| Dividends per share and common unit | 0.83 |
| | 0.83 |
| | 0.83 |
| | 0.78 |
| | 0.78 |
|
| Diluted FFO payout ratio (10) | 68.2 | % | | 69.4 | % | | 68.2 | % | | 61.7 | % | | 71.0 | % |
| Diluted CFFO payout ratio (11) | 68.0 | % | | 68.6 | % | | 65.0 | % | | 61.7 | % | | 67.0 | % |
| Diluted AFFO payout ratio (9) (12) | 86.8 | % | | 88.9 | % | | 85.5 | % | | 83.1 | % | | 85.2 | % |
| | | | | | | | | | |
| Portfolio Statistics | | | | | | | | | |
| Buildings (13) | 187 |
| | 187 |
| | 188 |
| | 187 |
| | 188 |
|
| Properties (13) | 131 |
| | 131 |
| | 132 |
| | 132 |
| | 131 |
|
| Net rentable square feet, excluding development space (13) | 21,964,327 |
| | 21,771,485 |
| | 21,711,427 |
| | 21,399,551 |
| | 21,033,398 |
|
| Occupancy at end of quarter (14) | 93.0 | % | | 92.8 | % | | 92.1 | % | | 92.6 | % | | 93.0 | % |
| Occupied square footage | 20,431,569 |
| | 20,204,632 |
| | 19,987,044 |
| | 19,821,269 |
| | 19,563,183 |
|
| Space under active development (15) | 1,253,692 |
| | 1,395,890 |
| | 1,335,358 |
| | 1,759,681 |
| | 1,532,902 |
|
| Space held for development (16) | 1,247,686 |
| | 1,283,538 |
| | 1,422,244 |
| | 1,331,685 |
| | 2,127,025 |
|
| Weighted average remaining lease term (years) (17) | 6.3 |
| | 6.8 |
| | 6.9 |
| | 7.0 |
| | 6.9 |
|
| Same-store occupancy at end of quarter (14) (18) | 92.2 | % | | 92.0 | % | | 91.3 | % | | 91.9 | % | | 92.4 | % |
|
| | |
| Key Quarterly Financial Data | | Financial Supplement |
| Unaudited and dollars in thousands, except per share data | Third Quarter 2014 |
| |
| (1) | The market value of common equity is based on the closing stock price at the end of the quarter and assumes 100% redemption of the limited partnership units in our operating partnership, including common units and vested and unvested long-term incentive units (including vested class C units), for shares of our common stock. Excludes shares issuable with respect to stock options that have been granted but have not yet been exercised, and also excludes all shares potentially issuable upon conversion of our series E, series F, series G and series H cumulative redeemable preferred stock upon certain change of control transactions. |
| |
| (2) | EBITDA is calculated as earnings before interest, taxes, depreciation & amortization. For a discussion of EBITDA, see page 42. For a reconciliation of net income available to common stockholders to EBITDA, see page 41. |
| |
| (3) | Adjusted EBITDA is EBITDA excluding straight-line rent expense adjustment attributable to prior periods, change in fair value of contingent consideration, severance accrual and equity acceleration, impairment of investments in real estate, gain on sale of property, gain on contribution of properties to unconsolidated joint venture, noncontrolling interests, and preferred stock dividends. For a discussion of Adjusted EBITDA, see page 42. For a reconciliation of net income available to common stockholders to Adjusted EBITDA, see page 41. |
| |
| (4) | Calculated as total debt at balance sheet carrying value less unrestricted cash and cash equivalents, divided by the product of Adjusted EBITDA multiplied by four. |
| |
| (5) | Fixed charges consist of GAAP interest expense, capitalized interest, scheduled debt principal payments and preferred dividends. |
| |
| (6) | Interest coverage ratio is Adjusted EBITDA divided by GAAP interest expense plus capitalized interest. |
| |
| (7) | Fixed charge coverage ratio is Adjusted EBITDA divided by fixed charges. |
| |
| (8) | For a definition and discussion of FFO and CFFO, see page 42. For a reconciliation of net income available to common stockholders to FFO and CFFO, see page 9. |
| |
| (9) | All periods presented include internal leasing commissions, the amounts of which have historically been included in capitalized leasing commissions and were previously excluded from recurring capital expenditures. For a definition and discussion of AFFO, see page 42. For a reconciliation of FFO to AFFO, see page 10. |
| |
| (10) | Diluted FFO payout ratio is dividends declared per common share and unit divided by diluted FFO per share and unit. |
| |
| (11) | Diluted CFFO payout ratio is dividends declared per common share and unit divided by diluted CFFO per share and unit. |
| |
| (12) | Diluted AFFO payout ratio is dividends declared per common share and unit divided by diluted AFFO per share and unit. |
| |
| (13) | Includes properties held as investments in unconsolidated joint ventures. |
| |
| (14) | Occupancy and same-store occupancy exclude space under active development and space held for development. Occupancy represents consolidated portfolio in addition to our managed portfolio of unconsolidated joint ventures and non-managed unconsolidated joint ventures. For some of our properties, we calculate occupancy based on factors in addition to contractually leased square feet, including available power, required support space and common area. |
| |
| (15) | Space under active development includes current Base Building and Data Centers projects in progress. See page 30. |
| |
| (16) | Space held for development includes space held for future Data Center development, and excludes space under active development. See page 34. |
| |
| (17) | Weighted average remaining lease term excludes renewal options and is weighted by net rentable square feet. |
| |
| (18) | Same-store properties were acquired on or before December 31, 2012. Excludes properties sold or contributed to joint ventures for all periods presented. |
|
| | |
| 2014 Guidance | | Financial Supplement |
| | Third Quarter 2014 |
|
| | | | | | | | | |
| | As of February 25, 2014 | | As of May 6, 2014 | | As of July 29, 2014 | | As of October 28, 2014 |
| Internal Growth | | | | | | | |
| Rental rates on renewal leases | | | | | | | |
| Cash basis | Roughly flat | | Roughly flat | | Roughly flat |
| | Roughly flat |
|
| GAAP basis | Modestly positive | | Modestly positive | | Modestly positive |
| | Modestly positive |
|
| Year-end portfolio occupancy | N/A | | 92.0% - 93.0% | | 93.0% - 93.5% |
| | 93.0% - 93.5% |
|
| "Same-capital" cash NOI growth (1) | N/A | | 4.0% - 5.0% | | 4.0% - 5.0% |
| | 4.5% - 5.5% |
|
| Operating margin | 25 - 75 bps < historical run-rate | | 25 - 75 bps < historical run-rate | | 25 - 75 bps < historical run-rate |
| | 25 - 75 bps < historical run-rate |
|
| Incremental revenue from speculative leasing (2) | $20 - $30 million | | $10 - $15 million | | $5 - $10 million |
| | $0 - $5 million |
|
| Overhead load (3) | 75 - 85 bps on total assets | | 75 - 85 bps on total assets | | 75 - 85 bps on total assets |
| | 75 - 85 bps on total assets |
|
| | | | | | | | |
| | | | | | | | |
| External Growth | | | | | | | |
| Acquisitions | | | | | | | |
| Dollar volume | $0 - $400 million | | $0 - $400 million | | $0 - $200 million |
| | $0 - $100 million |
|
| Cap rate | 7.5% - 8.5% | | 7.5% - 8.5% | | 7.5% - 8.5% |
| | 7.5% - 8.5% |
|
| Dispositions | | | | | | | |
| Dollar volume | N/A | | N/A | | $42 - $400 million |
| | $73 - $400 million |
|
| Cap rate | N/A | | N/A | | 0.0% - 12.0% |
| | 0.0% - 12.0% |
|
| Joint ventures | | | | | | | |
| Dollar volume | $0 - $400 million | | $40 - $400 million | | $40 - $400 million |
| | $228 million |
|
| Cap rate | 6.75% - 7.25% | | 6.75% - 7.25% | | 6.75% - 7.25% |
| | 7.1% |
|
| Development | | | | | | | |
| Capex | $600 - $800 million | | $600 - $800 million | | $775 - $850 million |
| | $750 - $800 million |
|
| Average stabilized yields | 10% - 12% | | 10% - 12% | | 10% - 12% |
| | 10% - 12% |
|
| Enhancements and other non-recurring capex (4) | $85 - $90 million | | $85 - $90 million | | $85 - $90 million |
| | $85 - $90 million |
|
| Recurring capex + capitalized leasing costs (5) | $75 - $80 million | | $75 - $80 million | | $85 - $90 million |
| | $85 - $90 million |
|
| | | | | | | | |
| | | | | | | | |
| Balance Sheet | | | | | | | |
| Preferred equity | | | | | | | |
| Dollar amount | $100 - $250 million | | $365 million | | $365 million |
| | $365 million |
|
| Pricing | 8.0% - 8.5% | | 7.375% | | 7.375 | % | | 7.375 | % |
| Timing | Early 2014 | | Early 2014 | | Early 2014 |
| | Early 2014 |
|
| Long-term debt | | | | | | | |
| Dollar amount | $700 - $900 million | | $700 - $900 million | | $700 - $900 million |
| | $700 - $900 million |
|
| Pricing | 4.75% - 5.50% | | 4.75% - 5.50% | | 4.75% - 5.50% |
| | 4.75% - 5.50% |
|
| Timing | Early 2014 | | Mid 2014 | | Mid 2014 |
| | Mid-late 2014 |
|
| | | | | | | | |
| | | | | | | | |
| Core Funds From Operations / share | $4.75 - $4.90 | | $4.80 - $4.90 | | $4.85 - $4.95 |
| | $4.90 - $4.95 |
|
| |
| (1) | The “same-capital” pool includes properties owned as of December 31, 2012 with less than 5% of total rentable square feet under development. It also excludes properties that were undergoing, or were expected to undergo, development activities in 2013-2014. NOI represents rental revenue and tenant reimbursement revenue less rental property operating and maintenance expenses, property taxes and insurance expenses (as reflected in the statement of operations), and cash NOI is NOI less straight-line rents and above and below market rent amortization. |
| |
| (2) | Incremental revenue from speculative leasing represents revenue expected to be recognized in the current year from leases that have not yet been signed. |
| |
| (3) | Overhead load is defined as General & Administrative expense divided by Total Assets. |
| |
| (4) | Other non-recurring capex represents costs incurred to enhance the capacity or marketability of operating properties, such as network fiber initiatives, the build-out of an additional sub-station or installation of a new security system, in addition to major remediation costs on recently-acquired properties, whether or not contemplated in the original acquisition underwriting. Other non-recurring capex also includes infrequent and major component replacements. |
| |
| (5) | Recurring capex represents non-incremental improvements required to maintain current revenues, including second-generation tenant improvements and leasing commissions. Capitalized leasing costs include capitalized leasing compensation as well as capitalized internal leasing commissions, as disclosed in the AFFO reconciliation on page 10. |
|
| | |
| Consolidated Quarterly Statements of Operations | | Financial Supplement |
| Unaudited and in thousands, except share and per share data | Third Quarter 2014 |
|
| | | | | | | | | | | | | | | | | | | | | | | | | | | |
| | Three Months Ended | Nine Months Ended |
| | 30-Sep-14 | | 30-Jun-14 | | 31-Mar-14 | | 31-Dec-13 | | 30-Sep-13 | | 30-Sep-14 | | 30-Sep-13 |
| Rental revenues | $ | 317,064 |
| | $ | 313,420 |
| | $ | 305,786 |
| | $ | 296,987 |
| | $ | 290,712 |
| | $ | 936,270 |
| | $ | 858,064 |
|
| Tenant reimbursements - Utilities | 65,604 |
| | 62,063 |
| | 59,183 |
| | 55,319 |
| | 59,936 |
| | 186,850 |
| | 165,578 |
|
| Tenant reimbursements - Other | 26,605 |
| | 23,625 |
| | 24,438 |
| | 27,310 |
| | 28,123 |
| | 74,667 |
| | 75,079 |
|
| Fee income | 2,748 |
| | 1,466 |
| | 1,183 |
| | 1,315 |
| | 671 |
| | 5,397 |
| | 2,205 |
|
| Other | 165 |
| | 873 |
| | — |
| | — |
| | 14 |
| | 1,038 |
| | 402 |
|
| Total Operating Revenues | $ | 412,186 |
| | $ | 401,446 |
| | $ | 390,590 |
| | $ | 380,931 |
| | $ | 379,456 |
| | $ | 1,204,222 |
| | $ | 1,101,328 |
|
| | | | | | | | | | | | | | |
| Utilities | $ | 69,388 |
| | $ | 65,432 |
| | $ | 62,087 |
| | $ | 58,773 |
| | $ | 65,055 |
| | $ | 196,907 |
| | $ | 176,169 |
|
| Rental property operating | 32,017 |
| | 33,313 |
| | 30,659 |
| | 29,294 |
| | 29,403 |
| | 95,988 |
| | 84,564 |
|
| Repairs & maintenance | 29,489 |
| | 28,052 |
| | 25,150 |
| | 27,109 |
| | 24,788 |
| | 82,691 |
| | 70,699 |
|
| Non-cash straight-line rent expense adjustment | — |
| | — |
| | — |
| | — |
| | 9,988 |
| | — |
| | 9,988 |
|
| Property taxes | 25,765 |
| | 20,595 |
| | 22,125 |
| | 23,831 |
| | 26,074 |
| | 68,485 |
| | 66,490 |
|
| Insurance | 2,145 |
| | 1,896 |
| | 2,422 |
| | 2,156 |
| | 2,144 |
| | 6,463 |
| | 6,587 |
|
| Construction management | 60 |
| | 121 |
| | 164 |
| | 35 |
| | 51 |
| | 345 |
| | 729 |
|
| Change in fair value of contingent consideration | (1,465 | ) | | 766 |
| | (3,403 | ) | | (1,749 | ) | | (943 | ) | | (4,102 | ) | | (13 | ) |
| Depreciation & amortization | 137,474 |
| | 137,092 |
| | 130,620 |
| | 126,776 |
| | 121,198 |
| | 405,186 |
| | 348,688 |
|
| General & administrative | 20,709 |
| | 20,061 |
| | 18,248 |
| | 15,536 |
| | 16,275 |
| | 59,018 |
| | 50,117 |
|
| Severance accrual and equity acceleration | — |
| | 260 |
| | 12,430 |
| | — |
| | — |
| | 12,690 |
| | — |
|
| Transactions | 144 |
| | 755 |
| | 81 |
| | 1,108 |
| | 243 |
| | 980 |
| | 3,497 |
|
| Impairment of investments in real estate | 12,500 |
| | — |
| | — |
| | — |
| | — |
| | 12,500 |
| | — |
|
| Other | 1,588 |
| | 651 |
| | — |
| | 7 |
| | 3 |
| | 2,239 |
| | 56 |
|
| Total Operating Expenses | $ | 329,814 |
| | $ | 308,993 |
| | $ | 300,583 |
| | $ | 282,876 |
| | $ | 294,279 |
| | $ | 939,390 |
| | $ | 817,571 |
|
| | | | | | | | | | | | | | |
| Operating Income | $ | 82,372 |
| | $ | 92,453 |
| | $ | 90,007 |
| | $ | 98,055 |
| | $ | 85,177 |
| | $ | 264,832 |
| | $ | 283,757 |
|
| | | | | | | | | | | | | | |
| Equity in earnings of unconsolidated joint ventures | $ | 3,455 |
| | $ | 3,477 |
| | $ | 2,581 |
| | $ | 2,957 |
| | $ | 2,174 |
| | $ | 9,513 |
| | $ | 6,839 |
|
| Gain on insurance settlement | — |
| | — |
| | — |
| | — |
| | — |
| | — |
| | 5,597 |
|
| Gain on sale of property | — |
| | 15,945 |
| | — |
| | — |
| | — |
| | 15,945 |
| | — |
|
| Gain on contribution of properties to unconsolidated JV | 93,498 |
| | — |
| | 1,906 |
| | 555 |
| | 115,054 |
| | 95,404 |
| | 115,054 |
|
| Interest and other income | 378 |
| | (83 | ) | | 1,727 |
| | 231 |
| | (127 | ) | | 2,022 |
| | (92 | ) |
| Interest expense | (48,169 | ) | | (49,146 | ) | | (47,374 | ) | | (45,996 | ) | | (47,742 | ) | | (144,689 | ) | | (143,403 | ) |
| Tax (expense) benefit | (1,178 | ) | | (1,021 | ) | | (1,838 | ) | | 473 |
| | (352 | ) | | (4,037 | ) | | (1,765 | ) |
| Loss from early extinguishment of debt | (195 | ) | | (293 | ) | | (292 | ) | | (608 | ) | | (704 | ) | | (780 | ) | | (1,205 | ) |
| Net Income | $ | 130,161 |
| | $ | 61,332 |
| | $ | 46,717 |
| | $ | 55,667 |
| | $ | 153,480 |
| | $ | 238,210 |
| | $ | 264,782 |
|
| | | | | | | | | | | | | | |
| Net income attributable to noncontrolling interests | (2,392 | ) | | (993 | ) | | (805 | ) | | (964 | ) | | (2,882 | ) | | (4,190 | ) | | (4,997 | ) |
| Net Income Attributable to Digital Realty Trust, Inc. | $ | 127,769 |
| | $ | 60,339 |
| | $ | 45,912 |
| | $ | 54,703 |
| | $ | 150,598 |
| | $ | 234,020 |
| | $ | 259,785 |
|
| | | | | | | | | | | | | | |
| Preferred stock dividends | (18,455 | ) | | (18,829 | ) | | (11,726 | ) | | (11,726 | ) | | (11,726 | ) | | (49,010 | ) | | (31,179 | ) |
| Net Income Available to Common Stockholders | $ | 109,314 |
| | $ | 41,510 |
| | $ | 34,186 |
| | $ | 42,977 |
| | $ | 138,872 |
| | $ | 185,010 |
| | $ | 228,606 |
|
| | | | | | | | | | | | | | |
| Weighted-average shares outstanding - basic | 135,492,618 |
| | 133,802,622 |
| | 128,535,995 |
| | 128,444,744 |
| | 128,427,444 |
| | 132,635,894 |
| | 127,771,419 |
|
| Weighted-average shares outstanding - diluted | 135,946,533 |
| | 133,977,885 |
| | 129,136,961 |
| | 128,641,470 |
| | 135,301,765 |
| | 132,852,966 |
| | 127,955,769 |
|
| Weighted-average fully diluted shares and units | 138,762,045 |
| | 137,912,511 |
| | 138,161,544 |
| | 137,890,892 |
| | 137,851,514 |
| | 138,216,486 |
| | 137,729,611 |
|
| | | | | | | | | | | | | | |
| Net income per share - basic | $ | 0.81 |
| | $ | 0.31 |
| | $ | 0.27 |
| | $ | 0.33 |
| | $ | 1.08 |
| | $ | 1.39 |
| | $ | 1.79 |
|
| Net income per share - diluted | $ | 0.80 |
| | $ | 0.31 |
| | $ | 0.26 |
| | $ | 0.33 |
| | $ | 1.06 |
| | $ | 1.39 |
| | $ | 1.79 |
|
|
| | |
| Funds From Operations and Core Funds From Operations | | Financial Supplement |
| Unaudited and in thousands, except per share data | Third Quarter 2014 |
|
| | | | | | | | | | | | | | | | | | | | | | | | | | | |
| Reconciliation of Net Income to Funds From Operations (FFO) | Three Months Ended | | Nine Months Ended |
| 30-Sep-14 | | 30-Jun-14 | | 31-Mar-14 | | 31-Dec-13 | | 30-Sep-13 | | 30-Sep-14 | | 30-Sep-13 |
| | | | | | | | | | | | | | |
| Net Income Available to Common Stockholders | $ | 109,314 |
| | $ | 41,510 |
| | $ | 34,186 |
| | $ | 42,977 |
| | $ | 138,872 |
| | $ | 185,010 |
| | $ | 228,606 |
|
| Adjustments: |
| |
| |
| |
| |
| |
| |
|
| Noncontrolling interests in operating partnership | 2,272 |
| | 873 |
| | 693 |
| | 849 |
| | 2,757 |
| | 3,838 |
| | 4,517 |
|
| Real estate related depreciation & amortization (1) | 136,289 |
| | 135,938 |
| | 129,496 |
| | 125,671 |
| | 120,006 |
| | 401,723 |
| | 345,609 |
|
| Unconsolidated JV real estate related depreciation & amortization | 1,934 |
| | 1,802 |
| | 1,628 |
| | 1,387 |
| | 788 |
| | 5,364 |
| | 2,418 |
|
| Gain on sale of property | — |
| | (15,945 | ) | | — |
| | — |
| | — |
| | (15,945 | ) | | — |
|
| Gain on contribution of properties to unconsolidated joint venture | (93,498 | ) | | — |
| | (1,906 | ) | | (555 | ) | | (115,054 | ) | | (95,404 | ) | | (115,054 | ) |
| Impairment of investments in real estate | 12,500 |
| | — |
| | — |
| | — |
| | — |
| | 12,500 |
| | — |
|
| Funds From Operations | $ | 168,811 |
| | $ | 164,178 |
| | $ | 164,097 |
| | $ | 170,329 |
| | $ | 147,369 |
| | $ | 497,086 |
| | $ | 466,096 |
|
| | | | | | | | | | | | | | |
| Add: Interest and amortization of debt issuance costs on 2029 Debentures | — |
| | 675 |
| | 4,050 |
| | 4,050 |
| | 4,050 |
| | 4,725 |
| | 12,150 |
|
|
| |
| |
| |
| |
| |
| |
|
| Funds From Operations - diluted | $ | 168,811 |
| | $ | 164,853 |
| | $ | 168,147 |
| | $ | 174,379 |
| | $ | 151,419 |
| | $ | 501,811 |
| | $ | 478,246 |
|
| | | | | | | | | | | | | | |
| Weighted-average shares and units outstanding - basic | 138,308 |
| | 136,615 |
| | 131,143 |
| | 130,982 |
| | 130,977 |
| | 135,382 |
| | 130,287 |
|
| Weighted-average shares and units outstanding - diluted (2) | 138,762 |
| | 137,912 |
| | 138,162 |
| | 137,891 |
| | 137,851 |
| | 138,217 |
| | 137,728 |
|
| | | | | | | | | | | | | | |
| Funds From Operations per share - basic | $ | 1.22 |
| | $ | 1.20 |
| | $ | 1.25 |
| | $ | 1.30 |
| | $ | 1.13 |
| | $ | 3.67 |
| | $ | 3.58 |
|
| | | | | | | | | | | | | | |
| Funds From Operations per share - diluted (2) | $ | 1.22 |
| | $ | 1.20 |
| | $ | 1.22 |
| | $ | 1.26 |
| | $ | 1.10 |
| | $ | 3.63 |
| | $ | 3.47 |
|
| | | | | | | | | | | | | | |
|
| | | | | | | | | | | | | | | | | | | | | | | | | | | |
| Reconciliation of FFO to CFFO | Three Months Ended | | Nine Months Ended |
| 30-Sep-14 | | 30-Jun-14 | | 31-Mar-14 | | 31-Dec-13 | | 30-Sep-13 | | 30-Sep-14 | | 30-Sep-13 |
| | | | | | | | | | | | | | |
| Funds From Operations - diluted | $ | 168,811 |
| | $ | 164,853 |
| | $ | 168,147 |
| | $ | 174,379 |
| | $ | 151,419 |
| | $ | 501,811 |
| | $ | 478,246 |
|
| Termination fees and other non-core revenues (3) | (165 | ) | | (873 | ) | | (2,047 | ) | | — |
| | (14 | ) | | (3,085 | ) | | (402 | ) |
| Gain on insurance settlement | — |
| | — |
| | — |
| | — |
| | — |
| | — |
| | (5,597 | ) |
| Significant transaction expenses | 144 |
| | 755 |
| | 81 |
| | 1,108 |
| | 243 |
| | 980 |
| | 3,497 |
|
| Loss from early extinguishment of debt | 195 |
| | 293 |
| | 292 |
| | 608 |
| | 704 |
| | 780 |
| | 1,205 |
|
| Straight-line rent expense adjustment attributable to prior periods | — |
| | — |
| | — |
| | — |
| | 9,155 |
| | — |
| | 7,489 |
|
| Change in fair value of contingent consideration (4) | (1,465 | ) | | 766 |
| | (3,403 | ) | | (1,749 | ) | | (943 | ) | | (4,102 | ) | | (13 | ) |
| Equity in earnings adjustment for non-core items | — |
| | — |
| | 843 |
| | — |
| | — |
| | 843 |
| | — |
|
| Severance accrual and equity acceleration (5) | — |
| | 260 |
| | 12,430 |
| | — |
| | — |
| | 12,690 |
| | — |
|
| Other non-core expense adjustments (6) | 1,588 |
| | 651 |
| | — |
| | 7 |
| | 3 |
| | 2,239 |
| | 56 |
|
| Core Funds From Operations - diluted | $ | 169,108 |
| | $ | 166,705 |
| | $ | 176,343 |
| | $ | 174,353 |
| | $ | 160,567 |
| | $ | 512,156 |
| | $ | 484,481 |
|
| | | | | | | | | | | | | | |
| Weighted-average shares and units outstanding - diluted (2) | 138,762 |
| | 137,912 |
| | 138,162 |
| | 137,891 |
| | 137,851 |
| | 138,217 |
| | 137,728 |
|
| | | | | | | | | | | | | | |
| Core Funds From Operations per share - diluted (2) | $ | 1.22 |
| | $ | 1.21 |
| | $ | 1.28 |
| | $ | 1.26 |
| | $ | 1.16 |
| | $ | 3.71 |
| | $ | 3.52 |
|
|
| | |
| Funds From Operations and Core Funds From Operations | | Financial Supplement |
| Unaudited and in thousands, except per share data | Third Quarter 2014 |
| |
| (1) | Real Estate Related Depreciation & Amortization |
|
| | | | | | | | | | | | | | | | | | | | | | | | | | | |
| Three Months Ended | | Nine Months Ended |
| 30-Sep-14 | | 30-Jun-14 | | 31-Mar-14 | | 31-Dec-13 | | 30-Sep-13 | | 30-Sep-14 | | 30-Sep-13 |
| Depreciation & amortization per income statement | $ | 137,474 |
| | $ | 137,092 |
| | $ | 130,620 |
| | $ | 126,776 |
| | $ | 121,198 |
| | 405,186 |
| | 348,688 |
|
| Non-real estate depreciation | (1,185 | ) | | (1,154 | ) | | (1,124 | ) | | (1,105 | ) | | (1,192 | ) | | (3,463 | ) | | (3,079 | ) |
| Real Estate Related Depreciation & Amortization | $ | 136,289 |
| | $ | 135,938 |
| | $ | 129,496 |
| | $ | 125,671 |
| | $ | 120,006 |
| | $ | 401,723 |
| | $ | 345,609 |
|
| |
| (2) | At September 30, 2013, we had no series D convertible preferred shares outstanding, as a result of the conversion of all remaining shares on February 26, 2013, which calculates into 629 common shares on a weighted average basis for the nine months ended September 30, 2013. For all periods presented, we have excluded the effect of dilutive series E, series F, series G and series H preferred stock, as applicable, that may be converted upon the occurrence of specified change in control transactions as described in the articles supplementary governing the series E, series F, series G and series H preferred stock, as applicable, which we consider highly improbable. In addition, we had a balance of $0, $0 and $266,400 of 5.50% exchangeable senior debentures due 2029 that were exchangeable for 0, 1,122 and 6,684 common shares on a weighted average basis for the three months ended September 30, 2014, June 30, 2014 and September 30, 2013, respectively, and were exchangeable for 2,618 and 6,628 common shares on a weighted average basis for the nine months ended September 30, 2014 and September 30, 2013, respectively. See page 10 for calculations of weighted average common stock and units outstanding. |
| |
| (3) | Includes one-time fees, proceeds and certain other adjustments that are not core to our business. |
| |
| (4) | Relates to earn-out contingency in connection with the Sentrum Portfolio acquisition. The earn-out contingency expires in July 2015 and is reassessed on a quarterly basis. |
| |
| (5) | Relates to severance charge of approximately $12,400, or $0.09 per share and unit, related to the departure of the company's former Chief Executive Officer. |
| |
| (6) | Includes reversal of accruals and certain other adjustments that are not core to our business. |
|
| | |
| Adjusted Funds From Operations (AFFO) | | Financial Supplement |
| Unaudited and in thousands, except per share data | Third Quarter 2014 |
|
| | | | | | | | | | | | | | | | | | | | | | | | | | | | |
| Reconciliation of FFO to AFFO | Three Months Ended | | Nine Months Ended |
| 30-Sep-14 | | 30-Jun-14 | | 31-Mar-14 | | 31-Dec-13 | | 30-Sep-13 | | 30-Sep-14 | | 30-Sep-13 |
| | | | | | | | | | | | | | |
| FFO available to common stockholders and unitholders | $ | 168,811 |
| | $ | 164,178 |
| | $ | 164,097 |
| | $ | 170,329 |
| | $ | 147,369 |
| | $ | 497,086 |
| | $ | 466,096 |
|
| Adjustments: |
| |
| |
| |
| |
| |
|
| |
|
|
| Non-real estate depreciation | $ | 1,185 |
| | $ | 1,154 |
| | $ | 1,124 |
| | $ | 1,105 |
| | $ | 1,192 |
| | $ | 3,463 |
| | $ | 3,079 |
|
| Amortization of deferred financing costs | 2,275 |
| | 2,402 |
| | 2,085 |
| | 2,925 |
| | 2,831 |
| | 6,762 |
| | 7,733 |
|
| Amortization of debt discount/premium | 487 |
| | 359 |
| | 357 |
| | 338 |
| | 418 |
| | 1,203 |
| | 1,441 |
|
| Non-cash compensation | 2,849 |
| | 3,656 |
| | 3,153 |
| | 2,183 |
| (5 | ) | 2,877 |
| | 9,658 |
| | 9,345 |
|
| Deferred compensation related to equity acceleration | — |
| | — |
| | 5,832 |
| | — |
| | — |
| | 5,832 |
| | — |
|
| Loss from early extinguishment of debt | 195 |
| | 293 |
| | 292 |
| | 608 |
| | 704 |
| | 780 |
| | 1,205 |
|
| Straight-line rents, net | (17,710 | ) | | (19,099 | ) | | (20,471 | ) | | (21,858 | ) | | (19,661 | ) | | (57,280 | ) | | (60,722 | ) |
| Non-cash straight-line rent expense adjustment | — |
| | — |
| | — |
| | — |
| | 9,988 |
| | — |
| | 9,988 |
|
| Above- and below-market rent amortization | (2,370 | ) | | (2,553 | ) | | (2,787 | ) | | (2,887 | ) | | (2,746 | ) | | (7,710 | ) | | (8,832 | ) |
| Change in fair value of contingent consideration (1) | (1,465 | ) | | 766 |
| | (3,403 | ) | | (1,749 | ) | | (943 | ) | | (4,102 | ) | | (13 | ) |
| Capitalized leasing compensation | (6,641 | ) | | (6,894 | ) | | (6,891 | ) | | (4,214 | ) | | (4,924 | ) | | (20,426 | ) | | (14,763 | ) |
| Recurring capital expenditures (2) | (11,481 | ) | | (11,355 | ) | | (8,685 | ) | | (17,025 | ) | | (12,895 | ) | | (31,521 | ) | | (36,184 | ) |
| Capitalized internal leasing commissions | (3,488 | ) | | (4,829 | ) | | (4,670 | ) | | (4,435 | ) | | (2,077 | ) | | (12,987 | ) | | (7,433 | ) |
| AFFO available to common stockholders and unitholders - basic (3) | $ | 132,647 |
| | $ | 128,078 |
| | $ | 130,033 |
| | $ | 125,320 |
| | $ | 122,133 |
| | $ | 390,758 |
| | $ | 370,940 |
|
| | | | | | | | | | | | | | |
| Weighted-average shares and units outstanding - basic | 138,308 |
| | 136,615 |
| | 131,143 |
| | 130,982 |
| | 130,977 |
| | 135,382 |
| | 130,287 |
|
| Weighted-average shares and units outstanding - diluted (4) | 138,762 |
| | 137,912 |
| | 138,162 |
| | 137,891 |
| | 137,851 |
| | 138,217 |
| | 137,728 |
|
| | | | | | | | | | | | | | |
| AFFO available to common stockholders and unitholders - basic | $ | 132,647 |
| | $ | 128,078 |
| | $ | 130,033 |
| | $ | 125,320 |
| | $ | 122,133 |
| | $ | 390,758 |
| | $ | 370,940 |
|
| | | | | | | | | | | | | | |
| Add: Interest and amortization of debt issuance costs on 2029 Debentures | - |
| | 675 |
| | 4,050 |
| | 4,050 |
| | 4,050 |
| | 4,725 |
| | 12,150 |
|
| | | | | | | | | | | | | | |
| AFFO available to common stockholders and unitholders - diluted | $ | 132,647 |
| | $ | 128,753 |
| | $ | 134,083 |
| | $ | 129,370 |
| | $ | 126,183 |
| | $ | 395,483 |
| | $ | 383,090 |
|
| | | | | | | | | | | | | | |
| AFFO per share - diluted (3) | $ | 0.96 |
| | $ | 0.93 |
| | $ | 0.97 |
| | $ | 0.94 |
| | $ | 0.92 |
| | $ | 2.86 |
| | $ | 2.78 |
|
| | | | | | | | | | | | | | |
| Dividends per share and common unit | $ | 0.83 |
| | $ | 0.83 |
| | $ | 0.83 |
| | $ | 0.78 |
| | $ | 0.78 |
| | $ | 2.49 |
| | $ | 2.34 |
|
| | | | | | | | | | | | | | |
| Diluted AFFO Payout Ratio | 86.8 | % | | 88.9 | % | | 85.5 | % | | 83.1 | % | | 85.2 | % | | 87.0 | % | | 84.1 | % |
| | | | | | | | | | | | | | |
| | | | | | | | | | | | | | |
|
| | | | | | | | | | | | | | | | | | | | |
| Three Months Ended | | Nine Months Ended |
| Share Count Detail | 30-Sep-14 | | 30-Jun-14 | | 31-Mar-14 | | 31-Dec-13 | | 30-Sep-13 | | 30-Sep-14 | | 30-Sep-13 |
| Weighted Average Common Stock and Units Outstanding | 138,308 |
| | 136,615 |
| | 131,143 |
| | 130,982 |
| | 130,977 |
| | 135,382 |
| | 130,287 |
|
| Add: Effect of dilutive securities (excludes series D convertible preferred stock & 5.50% debentures) | 454 |
| | 175 |
| | 213 |
| | 197 |
| | 190 |
| | 217 |
| | 184 |
|
| Add: Effect of dilutive series D convertible preferred stock | — |
| | — |
| | — |
| | — |
| | — |
| | — |
| | 629 |
|
| Add: Effect of dilutive 5.50% exchangeable senior debentures | — |
| | 1,122 |
| | 6,806 |
| | 6,712 |
| | 6,684 |
| | 2,618 |
| | 6,628 |
|
| Weighted Avg. Common Stock and Units Outstanding - diluted | 138,762 |
| | 137,912 |
| | 138,162 |
| | 137,891 |
| | 137,851 |
| | 138,217 |
| | 137,728 |
|
| |
| (1) | Relates to earn-out contingency in connection with the Sentrum Portfolio acquisition. The earn-out contingency expires in July 2015 and is reassessed on a quarterly basis. |
| |
| (2) | For a definition of recurring capital expenditures, see page 33. |
| |
| (3) | For a definition and discussion of AFFO, see page 42. For a reconciliation of net income available to common stockholders to FFO, see page 9. |
|
| | |
| Adjusted Funds From Operations (AFFO) | | Financial Supplement |
| Unaudited and in thousands, except per share data | Third Quarter 2014 |
| |
| (4) | At September 30, 2013, we had no series D convertible preferred shares outstanding, as a result of the conversion of all remaining shares on February 26, 2013, which calculates into 629 common shares on a weighted average basis for the nine months ended September 30, 2013. For all periods presented, we have excluded the effect of dilutive series E, series F, series G and series H preferred stock, as applicable, that may be converted upon the occurrence of specified change in control transactions as described in the articles supplementary governing the series E, series F, series G and series H preferred stock, as applicable, which we consider highly improbable. In addition, we had a balance of $0, $0 and $266,400 of 5.50% exchangeable senior debentures due 2029 that were exchangeable for 0, 1,122 and 6,684 common shares on a weighted average basis for the three months ended September 30, 2014, June 30, 2014 and September 30, 2013, respectively, and were exchangeable for 2,618 and 6,628 common shares on a weighted average basis for the nine months ended September 30, 2014 and September 30, 2013, respectively. See above for calculations of weighted average common stock and units outstanding. |
| |
| (5) | Corrects overstated amount in previously reported non-cash compensation. |
|
| | |
| Consolidated Balance Sheets | | Financial Supplement |
| Dollars in thousands, except share and per share data | Third Quarter 2014 |
|
| | | | | | | | | | | | | | | | | | | |
| | Unaudited | | Audited | | Unaudited |
| | 30-Sep-14 | | 30-Jun-14 | | 31-Mar-14 | | 31-Dec-13 | | 30-Sep-13 |
| Assets | | | | | | | | | |
| Investments in real estate: | | | | | | | | | |
| Land | $ | 694,237 |
| | $ | 688,664 |
| | $ | 685,640 |
| | $ | 693,791 |
| | $ | 684,644 |
|
| Acquired ground leases | 14,030 |
| | 14,868 |
| | 14,680 |
| | 14,618 |
| | 14,355 |
|
| Buildings and improvements | 9,032,432 |
| | 9,056,305 |
| | 8,834,693 |
| | 8,680,677 |
| | 8,357,786 |
|
| Tenant improvements | 496,018 |
| | 500,392 |
| | 490,697 |
| | 490,492 |
| | 466,616 |
|
| Investments in Real Estate | $ | 10,236,717 |
| | $ | 10,260,229 |
| | $ | 10,025,710 |
| | $ | 9,879,578 |
| | $ | 9,523,401 |
|
| Accumulated depreciation & amortization | (1,840,379 | ) | | (1,778,768 | ) | | (1,665,421 | ) | | (1,565,996 | ) | | (1,459,055 | ) |
| Net Investments in Properties | $ | 8,396,338 |
| | $ | 8,481,461 |
| | $ | 8,360,289 |
| | $ | 8,313,582 |
| | $ | 8,064,346 |
|
| Land held for sale | — |
| | — |
| | — |
| | — |
| | 11,015 |
|
| Investment in unconsolidated joint ventures | 94,497 |
| | 92,619 |
| | 81,411 |
| | 70,504 |
| | 53,066 |
|
| Net Investments in Real Estate | $ | 8,490,835 |
| | $ | 8,574,080 |
| | $ | 8,441,700 |
| | $ | 8,384,086 |
| | $ | 8,128,427 |
|
| Cash and cash equivalents | $ | 36,528 |
| | $ | 80,926 |
| | $ | 70,242 |
| | $ | 56,808 |
| | $ | 55,118 |
|
| Accounts and other receivables (1) | 140,463 |
| | 115,888 |
| | 117,492 |
| | 122,248 |
| | 125,825 |
|
| Deferred rent | 442,358 |
| | 436,443 |
| | 415,515 |
| | 393,504 |
| | 369,979 |
|
| Acquired above-market leases, net | 42,477 |
| | 47,181 |
| | 49,521 |
| | 52,264 |
| | 54,446 |
|
| Acquired in-place lease value and deferred leasing costs, net | 461,243 |
| | 470,620 |
| | 479,940 |
| | 489,456 |
| | 484,445 |
|
| Deferred financing costs, net | 33,761 |
| | 36,914 |
| | 34,295 |
| | 36,475 |
| | 39,132 |
|
| Restricted cash | 13,986 |
| | 39,778 |
| | 42,842 |
| | 40,362 |
| | 42,457 |
|
| Assets held for sale | — |
| | — |
| | 25,070 |
| | — |
| | — |
|
| Other assets | 60,356 |
| | 62,794 |
| | 64,836 |
| | 51,627 |
| | 60,322 |
|
| Total Assets | $ | 9,722,007 |
| | $ | 9,864,624 |
| | $ | 9,741,453 |
| | $ | 9,626,830 |
| | $ | 9,360,151 |
|
| | | | | | | | | | |
| Liabilities and Equity | | | | | | | | | |
| Global revolving credit facility | $ | 485,023 |
| | $ | 374,641 |
| | $ | 790,500 |
| | $ | 724,668 |
| | $ | 498,082 |
|
| Unsecured term loan | 1,002,186 |
| | 1,034,830 |
| | 1,026,891 |
| | 1,020,984 |
| | 950,205 |
|
| Unsecured senior notes, net of discount | 2,835,478 |
| | 2,897,068 |
| | 2,368,848 |
| | 2,364,232 |
| | 2,382,059 |
|
| Exchangeable senior debentures | — |
| | — |
| | 266,400 |
| | 266,400 |
| | 266,400 |
|
| Mortgage loans, net of premiums | 417,042 |
| | 552,696 |
| | 554,742 |
| | 585,608 |
| | 683,651 |
|
| Accounts payable and other accrued liabilities | 648,314 |
| | 636,783 |
| | 614,645 |
| | 662,687 |
| | 652,720 |
|
| Accrued dividends and distributions | — |
| | — |
| | — |
| | 102,509 |
| | — |
|
| Acquired below-market leases, net | 110,708 |
| | 118,432 |
| | 123,152 |
| | 130,269 |
| | 133,625 |
|
| Security deposits and prepaid rents | 119,696 |
| | 115,893 |
| | 116,945 |
| | 122,961 |
| | 112,840 |
|
| Liabilities associated with assets held for sale | — |
| | — |
| | 3,610 |
| | — |
| | — |
|
| Total Liabilities | $ | 5,618,447 |
| | $ | 5,730,343 |
| | $ | 5,865,733 |
| | $ | 5,980,318 |
| | $ | 5,679,582 |
|
| | | | | | | | | | |
| Equity | | | | | | | | | |
| Preferred Stock: $0.01 par value per share, 70,000,000 shares authorized: | | | | | | | | | |
| Series E Cumulative Redeemable Preferred Stock (2) | $ | 277,172 |
| | $ | 277,172 |
| | $ | 277,172 |
| | $ | 277,172 |
| | $ | 277,172 |
|
| Series F Cumulative Redeemable Preferred Stock (3) | 176,191 |
| | 176,191 |
| | 176,191 |
| | 176,191 |
| | 176,191 |
|
| Series G Cumulative Redeemable Preferred Stock (4) | 241,468 |
| | 241,468 |
| | 241,468 |
| | 241,468 |
| | 241,511 |
|
| Series H Cumulative Redeemable Preferred Stock (5) | 353,300 |
| | 353,378 |
| | 289,857 |
| | — |
| | — |
|
| Common Stock: $0.01 par value per share, 215,000,000 shares authorized (6) | 1,348 |
| | 1,347 |
| | 1,279 |
| | 1,279 |
| | 1,279 |
|
| Additional paid-in capital | 3,964,876 |
| | 3,955,830 |
| | 3,689,098 |
| | 3,688,937 |
| | 3,685,668 |
|
| Dividends in excess of earnings | (931,777 | ) | | (928,626 | ) | | (857,779 | ) | | (785,222 | ) | | (728,012 | ) |
| Accumulated other comprehensive (loss) income, net | (20,470 | ) | | 14,962 |
| | 13,947 |
| | 10,691 |
| | (10,327 | ) |
| Total Stockholders' Equity | $ | 4,062,108 |
| | $ | 4,091,722 |
| | $ | 3,831,233 |
| | $ | 3,610,516 |
| | $ | 3,643,482 |
|
| | | | | | | | | | |
| Noncontrolling Interests | | | | | | | | | |
| Noncontrolling interest in operating partnership | 34,632 |
| | 35,632 |
| | 37,406 |
| | 29,027 |
| | 30,264 |
|
| Noncontrolling interest in consolidated joint ventures | 6,820 |
| | 6,927 |
| | 7,081 |
| | 6,969 |
| | 6,823 |
|
| Total Noncontrolling Interests | $ | 41,452 |
| | $ | 42,559 |
| | $ | 44,487 |
| | $ | 35,996 |
| | $ | 37,087 |
|
|
| |
| |
| |
| |
|
| Total Equity | $ | 4,103,560 |
| | $ | 4,134,281 |
| | $ | 3,875,720 |
| | $ | 3,646,512 |
| | $ | 3,680,569 |
|
|
|
| |
|
| |
|
| |
|
| |
|
|
|
| | |
| Consolidated Balance Sheets | | Financial Supplement |
| Dollars in thousands, except share and per share data | Third Quarter 2014 |
|
| | | | | | | | | | | | | | | | | | | |
| Total Liabilities and Equity | $ | 9,722,007 |
| | $ | 9,864,624 |
| | $ | 9,741,453 |
| | $ | 9,626,830 |
| | $ | 9,360,151 |
|
| |
| (1) | Net of allowance for doubtful accounts of $7,652 and $5,576 as of September 30, 2014 and December 31, 2013, respectively. |
| |
| (2) | Series E Cumulative Redeemable Preferred Stock, 7.000%, $287,500 and $287,500 liquidation preference, respectively ($25.00 per share), 11,500,000 and 11,500,000 shares issued and outstanding as of September 30, 2014 and December 31, 2013, respectively. |
| |
| (3) | Series F Cumulative Redeemable Preferred Stock, 6.625%, $182,500 and $182,500 liquidation preference, respectively ($25.00 per share), 7,300,000 and 7,300,000 shares issued and outstanding as of September 30, 2014 and December 31, 2013, respectively. |
| |
| (4) | Series G Cumulative Redeemable Preferred Stock, 5.875%, $250,000 and $250,000 liquidation preference, respectively ($25.00 per share), 10,000,000 and 10,000,000 shares issued and outstanding as of September 30, 2014 and December 31, 2013, respectively. |
| |
| (5) | Series H Cumulative Redeemable Preferred Stock, 7.375%, $365,000 and $0 liquidation preference, respectively ($25.00 per share), 14,600,000 and 0 shares issued and outstanding as of September 30, 2014 and December 31, 2013, respectively. |
| |
| (6) | Common Stock: 135,503,184 and 128,455,350 shares issued and outstanding as of September 30, 2014 and December 31, 2013, respectively. |
|
| | |
Components of Net Asset Value (NAV) (1) | | Financial Supplement |
| In thousands | Third Quarter 2014 |
|
| | | |
| Consolidated Properties Cash Net Operating Income (NOI)(2), Annualized (3) |
|
| Internet Gateway (4) | $ | 184,308 |
|
| Turn-Key Flex® (4) | 460,770 |
|
| Powered Base Building® (4) | 184,308 |
|
| Colo & Non-tech (4) | 92,154 |
|
| less: Partners' share of consolidated JVs | (507 | ) |
| Dispositions & expirations | (8,000 | ) |
| 3Q14 carry-over & 4Q14-FY15 backlog Cash NOI (stabilized) (5) | 60,125 |
|
| Total Consolidated Cash NOI, Annualized | $ | 973,158 |
|
|
|
| Digital Realty's Pro Rata Share of Unconsolidated Joint Venture Cash NOI |
|
| Turn-Key Flex® | $ | 13,839 |
|
| Powered Base Building® | 8,280 |
|
| Total Unconsolidated Cash NOI, Annualized | $ | 22,119 |
|
|
|
| Other Income |
|
| Development and Management Fees (net), Annualized | $ | 10,752 |
|
|
|
| Other Assets |
|
| Pre-stabilized inventory, at cost | $ | 381,128 |
|
| Land held for development | 146,390 |
|
| Development CIP (6) | 876,494 |
|
| less: Investment associated with Backlog NOI | (270,000 | ) |
| Cash and cash equivalents | 36,528 |
|
| Restricted cash | 13,986 |
|
| Accounts and other receivables, net | 140,463 |
|
| Other assets | 60,356 |
|
| less: Partners' share of consolidated JV assets | (102 | ) |
| Total Other Assets | $ | 1,385,243 |
|
|
|
| Liabilities |
|
| Global revolving credit facility | $ | 485,023 |
|
| Unsecured term loan | 1,002,186 |
|
| Unsecured senior notes | 2,835,478 |
|
| add: Unamortized discounts | 16,432 |
|
| Mortgage loans, excluding premiums | 416,425 |
|
| Accounts payable and other accrued liabilities (7) | 648,314 |
|
| Security deposits and prepaid rents | 119,696 |
|
| Backlog NOI cost to complete (8) | 232,000 |
|
| Preferred stock, at liquidation value | 1,085,000 |
|
| Digital Realty's share of unconsolidated JV debt | 137,952 |
|
| Total Liabilities | $ | 6,978,506 |
|
|
|
| Diluted Shares and Units Outstanding | 138,762 |
|
| |
| (1) | Includes Digital Realty's share of backlog leasing at unconsolidated joint venture properties. |
| |
| (2) | For a definition and discussion of NOI and Cash NOI and a reconciliation of operating income to NOI and Cash NOI, see page 43. |
| |
| (3) | Annualized Cash NOI is calculated by multiplying results for the most recent quarter by four. Annualized results may not be indicative of any four-quarter period and do not take into account scheduled lease expirations, among other things. Annualized data is presented for illustrative purposes only. |
| |
| (4) | Reflects annualized 3Q14 Cash NOI of $922 million. NOI is allocated 20% to Powered Base Building®, 50% to Turn-Key Flex®, 20% to Internet Gateway, and 10% to Colo/Non-tech. Actual Cash NOI allocable to each product or property type may be different. |
| |
| (5) | Estimated Cash NOI related to signed leasing expected to commence in FY14 through FY15. Includes Digital Realty's share of signed leasing at unconsolidated JV properties. |
| |
| (6) | See page 32 for further details on the breakdown of the CIP balance. |
| |
| (7) | Includes net deferred tax liability of approximately $143.3 million. |
| |
| (8) | Includes Digital Realty's share of cost to complete at unconsolidated joint venture properties. |
|
| | |
| Consolidated Debt Analysis | | Financial Supplement |
| Unaudited, in thousands | Third Quarter 2014 |
|
| | | | | | | | | | | |
| | As of September 30, 2014 |
| | Maturity Date | | Principal Balance | | % of Total Debt | | Interest Rate | | Interest Rate
Including Swaps |
| Global Revolving Credit Facility (1) | | | | | | | | | |
| Global revolving credit facility | November 3, 2018 | | $ | 485,023 |
| | | | | | |
| Total Global Revolving Credit Facility | | | $ | 485,023 |
| | 10% | | 1.91% | | |
| | | | | | | | | | |
| Unsecured Term Loan (1) | | | | | | | | | |
| Unhedged variable rate portion of term loan | April 16, 2018 | | $ | 442,747 |
| | | | | | |
| Hedged variable rate portion of term loan | April 16, 2018 | | 559,439 |
| | | | | | |
| Total Unsecured Term Loan | | | $ | 1,002,186 |
| | 21% | | 1.65% | | 1.99% |
| | | | | | | | | | |
| Prudential Unsecured Senior Notes | | | | | | | | | |
| Series C | January 6, 2016 | | $ | 25,000 |
| | | | 9.68% | | |
| Series D | January 20, 2015 | | 50,000 |
| | | | 4.57% | | |
| Series E | January 20, 2017 | | 50,000 |
| | | | 5.73% | | |
| Series F | February 3, 2015 | | 17,000 |
| | | | 4.50% | | |
| Total Prudential Unsecured Senior Notes | | | $ | 142,000 |
| | 3% | | | | |
| | | | | | | | | | |
| Senior Notes | | | | | | | | | |
| 4.50% notes due 2015 | July 15, 2015 | | $ | 375,000 |
| | | | 4.50% | | |
| 5.875% notes due 2020 | February 1, 2020 | | 500,000 |
| | | | 5.88% | | |
| 5.25% notes due 2021 | March 15, 2021 | | 400,000 |
| | | | 5.25% | | |
| 3.625% notes due 2022 | October 1, 2022 | | 300,000 |
| | | | 3.63% | | |
| 4.75% notes due 2023 | October 13, 2023 | | 486,390 |
| | | | 4.75% | | |
| 4.25% notes due 2025 | January 17, 2025 | | 648,520 |
| | | | 4.25% | | |
| Unamortized discounts | | | (16,432 | ) | | | | | | |
| Total Senior Notes | | | $ | 2,693,478 |
| | 57% | | | | |
| | | | | | | | | | |
| Total Unsecured Senior Notes | | | $ | 2,835,478 |
| | 60% | | | | |
| | | | | | | | | | |
| | | | | | | | | | |
| Mortgage Loans | | | | | | | | | |
| Cressex 1 (2) | October 16, 2014 | | $ | 27,616 |
| | | | 5.68% | | |
| Manchester Technopark (2) | October 16, 2014 | | 8,401 |
| | | | 5.68% | | |
| Secured Term Debt (3) | November 11, 2014 | | — |
| | | | 5.65% | | |
| 200 Paul Avenue | October 8, 2015 | | 69,191 |
| | | | 5.74% | | |
| 8025 North Interstate 35 | March 6, 2016 | | 6,122 |
| | | | 4.09% | | |
| 600 West Seventh Street | March 15, 2016 | | 48,266 |
| | | | 5.80% | | |
| 34551 Ardenwood Boulevard | November 11, 2016 | | 51,549 |
| | | | 5.95% | | |
| 2334 Lundy Place | November 11, 2016 | | 37,493 |
| | | | 5.96% | | |
| 1100 Space Park Drive | December 11, 2016 | | 51,507 |
| | | | 5.89% | | |
| 2045 & 2055 Lafayette Street | February 6, 2017 | | 62,836 |
| | | | 5.93% | | |
| 150 South First Street | February 6, 2017 | | 49,518 |
| | | | 6.30% | | |
| 731 East Trade Street | July 1, 2020 | | 3,926 |
| | | | 8.22% | | |
| Unamortized net premiums | | | 617 |
| | | | | | |
| Total Mortgage Loans | | | $ | 417,042 |
| | 9% | | | | |
| | | | | | | | | | |
| | | | | | | | | | |
| Debt Summary | | | | | | | | | |
| Total unhedged variable rate debt | | | $ | 927,770 |
| | 20% | | | | |
| Total fixed rate / hedged variable rate debt | | | 3,811,959 |
| | 80% | | | | |
| Total Consolidated Debt | | | $ | 4,739,729 |
| | 100% | | | | 4.01% |
|
| | |
| Consolidated Debt Analysis | | Financial Supplement |
| Unaudited, in thousands | Third Quarter 2014 |
|
| | | | | | | | | | | |
| Global Revolving Credit Facility Detail as of September, 30, 2014 |
|
|
|
|
|
| Maximum Available |
| Existing Capacity (4) |
| Currently Drawn |
|
|
|
|
|
|
| Global Revolving Credit Facility | $ | 2,000,000 |
| | $ | 1,491,949 |
| | $ | 485,023 |
|
| |
| (1) | Maturity dates assume that all extensions will be exercised. |
| |
| (2) | These loans were paid in full at maturity in October 2014. |
| |
| (3) | The six mortgage loans were paid in full in September 2014. These loans were secured by our interests in 36 NE 2nd Street, 3300 East Birch Street, 100 & 200 Quannapowitt Parkway, 300 Boulevard East, 4849 Alpha Road, and 11830 Webb Chapel Road. Each of these loans was cross-collateralized by the six properties. |
| |
| (4) | Net of letters of credit issued of $23.0 million. |
|
| | |
| Debt Maturities | �� | Financial Supplement |
| Unaudited, in thousands | Third Quarter 2014 |
|
| | | | | | | | | | | | | | | | | | | | | | | | | | | | | |
| As of September 30, 2014 |
| Interest Rate | | 2014 | | 2015 | | 2016 | | 2017 | | 2018 | | Thereafter | | Total |
| Global Revolving Credit Facility (1) |
| |
| |
| |
| |
| |
| |
| |
|
| Global revolving credit facility |
| | — |
| | — |
| | — |
| | — |
| | $ | 485,023 |
| | — |
| | $ | 485,023 |
|
| Total Global Revolving Credit Facility | 1.91% | | — |
| | — |
| | — |
| | — |
| | $ | 485,023 |
| | — |
| | $ | 485,023 |
|
|
| |
| |
| |
| |
| |
| |
| |
|
| Unsecured Term Loan (1) |
| |
| |
| |
| |
| |
| |
| |
|
| Unhedged variable rate portion of term loan |
| | — |
| | — |
| | — |
| | — |
| | $ | 442,747 |
| | — |
| | $ | 442,747 |
|
| Hedged variable rate portion of term loan |
| | — |
| | — |
| | — |
| | — |
| | 559,439 |
| | — |
| | 559,439 |
|
| Total Unsecured Term Loan | 1.99% | (2) | — |
| | — |
| | — |
| | — |
| | $ | 1,002,186 |
| | — |
| | $ | 1,002,186 |
|
|
| |
| |
| |
| |
| |
| |
| |
|
| Prudential Unsecured Senior Notes |
| |
| |
| |
| |
| |
| |
| |
|
| Series C | 9.68% | | — |
| | — |
| | $ | 25,000 |
| | — |
| | — |
| | — |
| | $ | 25,000 |
|
| Series D | 4.57% | | — |
| | 50,000 |
| | — |
| | — |
| | — |
| | — |
| | 50,000 |
|
| Series E | 5.73% | | — |
| | — |
| | — |
| | 50,000 |
| | — |
| | — |
| | 50,000 |
|
| Series F | 4.50% | | — |
| | 17,000 |
| | — |
| | — |
| | — |
| | — |
| | 17,000 |
|
| Total Prudential Unsecured Senior Notes | 5.87% | | — |
| | $ | 67,000 |
| | $ | 25,000 |
| | $ | 50,000 |
| | — |
| | — |
| | $ | 142,000 |
|
|
| |
| |
| |
| |
| |
| |
| |
|
| Senior Notes |
| |
| |
| |
| |
| |
| |
| |
|
| 4.50% notes due 2015 | 4.50% | | — |
| | $ | 375,000 |
| | — |
| | — |
| | — |
| | — |
| | $ | 375,000 |
|
| 5.875% notes due 2020 | 5.88% | | — |
| | — |
| | — |
| | — |
| | — |
| | 500,000 |
| | 500,000 |
|
| 5.25% notes due 2021 | 5.25% | | — |
| | — |
| | — |
| | — |
| | — |
| | 400,000 |
| | 400,000 |
|
| 3.625% notes due 2022 | 3.63% | | — |
| | — |
| | — |
| | — |
| | — |
| | 300,000 |
| | 300,000 |
|
| 4.75% notes due 2023 | 4.75% | | — |
| | — |
| | — |
| | — |
| | — |
| | 486,390 |
| | 486,390 |
|
| 4.25% notes due 2025 | 4.25% | | — |
| | — |
| | — |
| | — |
| | — |
| | 648,520 |
| | 648,520 |
|
| Total Senior Notes | 4.75% | | — |
| | $ | 375,000 |
| | — |
| | — |
| | — |
| | $ | 2,334,910 |
| | $ | 2,709,910 |
|
|
| |
| |
| |
| |
| |
| |
| | |
|
| |
| |
| |
| |
| |
| |
| |
|
| Mortgage Loans |
| |
| |
| |
| |
| |
| |
| |
|
| Secured Term Debt (3) | 5.65% | | — |
| | — |
| | — |
| | — |
| | — |
| | — |
| | — |
|
| 200 Paul Avenue | 5.74% | | $ | 526 |
| | $ | 68,665 |
| | — |
| | — |
| | — |
| | — |
| | $ | 69,191 |
|
| 2045 & 2055 Lafayette Street | 5.93% | | 273 |
| | 1,125 |
| | 1,195 |
| | 60,243 |
| | — |
| | — |
| | 62,836 |
|
| 34551 Ardenwood Boulevard | 5.95% | | 210 |
| | 862 |
| | 50,477 |
| | — |
| | — |
| | — |
| | 51,549 |
|
| 1100 Space Park Drive | 5.89% | | 213 |
| | 871 |
| | 50,423 |
| | — |
| | — |
| | — |
| | 51,507 |
|
| 150 South First Street | 6.30% | | 202 |
| | 832 |
| | 878 |
| | 47,606 |
| | — |
| | — |
| | 49,518 |
|
| 600 West Seventh Street | 5.80% | | 440 |
| | 1,826 |
| | 46,000 |
| | — |
| | — |
| | — |
| | 48,266 |
|
| 2334 Lundy Place | 5.96% | | 152 |
| | 627 |
| | 36,714 |
| | — |
| | — |
| | — |
| | 37,493 |
|
| Cressex 1 (4) | 5.68% | | 27,616 |
| | — |
| | — |
| | — |
| | — |
| | — |
| | 27,616 |
|
| Manchester Technopark (4) | 5.68% | | 8,401 |
| | — |
| | — |
| | — |
| | — |
| | — |
| | 8,401 |
|
| 8025 North Interstate 35 | 4.09% | | 65 |
| | 268 |
| | 5,789 |
| | — |
| | — |
| | — |
| | 6,122 |
|
| 731 East Trade Street | 8.22% | | 90 |
| | 417 |
| | 503 |
| | 546 |
| | 593 |
| | 1,777 |
| | 3,926 |
|
| Total Mortgage Loans | 5.90% | | $ | 38,188 |
| | $ | 75,493 |
| | $ | 191,979 |
| | $ | 108,395 |
| | $ | 593 |
| | $ | 1,777 |
| | $ | 416,425 |
|
| | | | | | | | | | | | | | | | |
| Total unhedged variable rate debt |
| | — |
| | — |
| | — |
| | — |
| | $ | 927,770 |
| | — |
| | $ | 927,770 |
|
| Total fixed rate / hedged variable rate debt |
| | 38,188 |
| | 517,493 |
| | 216,979 |
| | 158,395 |
| | 560,032 |
| | 2,336,687 |
| | 3,827,774 |
|
| Total Debt | 4.01% | | $ | 38,188 |
| | $ | 517,493 |
| | $ | 216,979 |
| | $ | 158,395 |
| | $ | 1,487,802 |
| | $ | 2,336,687 |
| | $ | 4,755,544 |
|
|
| |
| |
| |
| |
| |
| |
| |
|
| Weighted Average Interest Rate |
| | 5.68 | % | | 4.67 | % | | 6.28 | % | | 5.98 | % | | 1.96 | % | | 4.80 | % | | 4.01 | % |
| | | | | | | | | | | | | | | | |
|
| | |
| Debt Maturities | | Financial Supplement |
| Unaudited, in thousands | Third Quarter 2014 |
|
| | | | | | | | | | | | | | | | | | | | | | | | | | | | | |
| Summary | |
| |
| |
| |
| |
| |
| |
|
| Weighted Average Term to Initial Maturity | |
| | 5.0 Years | |
|
| Weighted Average Maturity (assuming exercise of extension options) | |
| | 5.4 Years | |
|
| |
| (1) | Assumes all extensions will be exercised. |
| |
| (2) | Interest rate including swaps. |
| |
| (3) | The six mortgage loans were paid in full in September 2014. These loans were secured by our interests in 36 NE 2nd Street, 3300 East Birch Street, 100 & 200 Quannapowitt Parkway, 300 Boulevard East, 4849 Alpha Road, and 11830 Webb Chapel Road. Each of these loans was cross-collateralized by the six properties. |
| |
| (4) | These loans were paid in full at maturity in October 2014. |
Note: Total excludes $15,815, net premiums/discounts which consists of $617 of loan premiums and ($196), ($5,177), ($633), ($3,269), ($2,828), and ($4,329) of debt discount on 4.50% unsecured senior notes due 2015, 5.875% unsecured senior notes due 2020, 5.25% unsecured senior notes due 2021, 3.625% unsecured senior notes due 2022, 4.75% unsecured senior notes due 2023, and 4.25% unsecured senior notes due 2025, respectively.
|
| | |
| Debt Analysis & Covenant Compliance | | Financial Supplement |
| Unaudited | Third Quarter 2014 |
|
| | | | | | | | | |
| As of September 30, 2014 |
| 4.50% Notes due 2015
5.875% Notes due 2020
5.25% Notes due 2021 | | 3.625% Notes due 2022
4.750% Notes due 2023
4.250% Notes due 2025 | | Global Revolving Credit Facility |
| Required | | Actual | | Actual | | Required | | Actual |
| Debt Covenant Ratios (1) |
| |
| |
| |
| |
|
| Total outstanding debt / total assets(2) | Less than 60% | | 41% | | 38% | | Less than 60%(3) | | 36% |
| Secured debt / total assets (4) | Less than 40% | | 4% | | 3% | | Less than 40% | | 4% |
| Total unencumbered assets / unsecured debt | Greater than 150% | | 254% | | 274% | | N/A | | N/A |
| Consolidated EBITDA / interest expense (5) | Greater than 1.5x | | 4.1x | | 4.1x | | N/A | | N/A |
| Fixed charge coverage |
| | N/A | | N/A | | Greater than 1.5x | | 3.2x |
| Unsecured debt / total unencumbered asset value (6) |
| | N/A | | N/A | | Less than 60% | | 39% |
| Unencumbered assets debt service coverage ratio |
| | N/A | | N/A | | Greater than 1.5x | | 5.1x |
| |
| (1) | For a definition of the terms used in the table above and related footnotes, please refer to: the Indenture dated January 28, 2010, which governs the 5.875% Notes due 2020; the Indenture dated July 8, 2010, which governs the 4.50% Notes due 2015; the Indenture and Supplemental Indenture No. 1 dated March 8, 2011, which governs the 5.25% Notes due 2021; the Indenture and Supplemental Indenture No. 1 dated September 24, 2012, which governs the 3.625% Notes due 2022; the Indenture dated January 18, 2013, which governs the 4.250% Notes due 2025; the Global Senior Credit Agreement dated as of August 15, 2013, as amended; and the Indenture dated April 1, 2014, which governs the 4.750% Notes due 2023, which are filed as exhibits to our reports filed with the Securities and Exchange Commission. |
| |
| (2) | This ratio is referred to as the Leverage Ratio, defined as Consolidated Debt / Total Asset Value, under the Global Revolving Credit Facility. Under the 4.50% Notes due 2015, 5.875% Notes due 2020, and 5.25% Notes due 2021, Total Assets is calculated using Consolidated EBITDA capped at 9.0%. Under the 3.625% Notes due 2022, 4.750% Notes due 2023, and 4.250% Notes due 2025, Total Assets is calculated using Consolidated EBITDA capped at 8.25%. Under the Global Revolving Credit Facility, Total Asset Value is calculated using Adjusted Net Operating Income capped at 8.00% for Data Center Assets and 7.50% for Other Assets. |
| |
| (3) | The Company has the right to maintain a Leverage Ratio of greater than 60.0% but less than or equal to 65.0% for up to four consecutive fiscal quarters during the term of the Facility following an acquisition of one or more Assets for a purchase price and other consideration in an amount not less than 5% of Total Asset Value. |
| |
| (4) | This ratio is referred to as the Secured Debt Leverage Ratio, defined as Secured Debt / Total Asset Value, under the Global Revolving Credit Facility. |
| |
| (5) | Calculated as current quarter annualized Consolidated EBITDA to current quarter annualized Interest Expense (including capitalized interest and debt discounts). |
| |
| (6) | Assets must satisfy certain conditions to qualify for inclusion as an Unencumbered Asset under the Global Revolving Credit Facility. |
|
| | |
| Same- Store Operation Trend Summary | | Financial Supplement |
| Unaudited and in thousands | Third Quarter 2014 |
Same-Store Portfolio (1)
|
| | | | | | | | | | | | | | | | | | | | | | | | | | | | |
| | Three Months Ended | | Nine Months Ended |
| | 30-Sep-14 | | 30-Sep-13 | | % Change | | 30-Jun-14 | | % Change | | 30-Sep-14 | | 30-Sep-13 | | % Change |
| Rental | $ | 308,924 |
| | $ | 275,782 |
| | 12.0 | % | | $ | 305,434 |
| | 1.1 | % | | $ | 910,355 |
| | $ | 815,876 |
| | 11.6 | % |
| Tenant reimbursements - Utilities | 64,820 |
| | 59,064 |
| | 9.7 | % | | 61,289 |
| | 5.8 | % | | 184,539 |
| | 162,330 |
| | 13.7 | % |
| Tenant reimbursements - Other | 26,236 |
| | 26,107 |
| | 0.5 | % | | 22,934 |
| | 14.4 | % | | 73,192 |
| | 70,343 |
| | 4.1 | % |
| Total Revenue | $ | 399,980 |
|
| $ | 360,953 |
| | 10.8 | % | | $ | 389,657 |
| | 2.6 | % | | $ | 1,168,086 |
|
| $ | 1,048,549 |
| | 11.4 | % |
| Utilities | $ | 68,513 |
| | $ | 64,084 |
| | 6.9 | % | | $ | 64,607 |
| | 6.0 | % | | $ | 194,429 |
| | $ | 172,702 |
| | 12.6 | % |
| Rental property operating | 31,433 |
| | 28,385 |
| | 10.7 | % | | 32,805 |
| | (4.2 | )% | | 94,703 |
| | 82,009 |
| | 15.5 | % |
| Repairs & maintenance | 28,888 |
| | 24,436 |
| | 18.2 | % | | 27,350 |
| | 5.6 | % | | 80,944 |
| | 69,718 |
| | 16.1 | % |
| Non-cash straight-line rent expense adjustment | — |
| | 9,988 |
| | (100.0 | )% | | — |
| | — | % | | — |
| | 9,988 |
| | (100.0 | )% |
| Property taxes | 25,410 |
| | 24,450 |
| | 3.9 | % | | 19,995 |
| | 27.1 | % | | 66,884 |
| | 62,571 |
| | 6.9 | % |
| Insurance | 2,128 |
| | 1,960 |
| | 8.6 | % | | 1,871 |
| | 13.7 | % | | 6,391 |
| | 6,045 |
| | 5.7 | % |
| Total Expenses | $ | 156,372 |
|
| $ | 153,303 |
| | 2.0 | % | | $ | 146,628 |
| | 6.6 | % | | $ | 443,351 |
|
| $ | 403,033 |
| | 10.0 | % |
| | | | | | | | | | | | | | | | |
Net Operating Income (2) | $ | 243,608 |
|
| $ | 207,650 |
| | 17.3 | % | | $ | 243,029 |
| | 0.2 | % | | $ | 724,735 |
|
| $ | 645,516 |
| | 12.3 | % |
| Same-store straight-line rent | $ | 16,905 |
| | $ | 18,668 |
| | (9.4 | )% | | $ | 18,294 |
| | (7.6 | )% | | $ | 55,559 |
| | $ | 58,616 |
| | (5.2 | )% |
| Non-cash straight-line rent expense adjustment | — |
| | (9,988 | ) | | (100.0 | )% | | — |
| | — | % | | — |
| | (9,988 | ) | | (100.0 | )% |
| Above and below market rent | 2,254 |
| | 2,630 |
| | (14.3 | )% | | 2,437 |
| | (7.5 | )% | | 7,304 |
| | 8,602 |
| | (15.1 | )% |
Cash Net Operating Income (3) | $ | 224,449 |
| | $ | 196,340 |
| | 14.3 | % | | $ | 222,298 |
| | 1.0 | % | | $ | 661,872 |
|
| $ | 588,286 |
| | 12.5 | % |
| | | | | | | | | | | | | | | | |
Same-Store occupancy at period end (4) | 92.2 | % | | 92.3 | % | | (0.1 | )% | | 92.0 | % | | 0.2 | % | | 92.2 | % | | 92.3 | % | | (0.1 | )% |
Stabilized ("Same-Capital") Portfolio (5)
|
| | | | | | | | | | | | | | | | | | | | | | | | | | | | |
| | Three Months Ended | | Nine Months Ended |
| | 30-Sep-14 | | 30-Sep-13 | | % Change | | 30-Jun-14 | | % Change | | 30-Sep-14 | | 30-Sep-13 | | % Change |
| Rental | $ | 194,329 |
| | $ | 188,435 |
| | 3.1 | % | | $ | 194,096 |
| | 0.1 | % | | $ | 581,448 |
| | $ | 565,757 |
| | 2.8 | % |
| Tenant reimbursements - Utilities | 39,406 |
| | 40,469 |
| | (2.6 | )% | | 39,063 |
| | 0.9 | % | | 117,213 |
| | 113,195 |
| | 3.5 | % |
| Tenant reimbursements - Other | 18,206 |
| | 21,708 |
| | (16.1 | )% | | 16,382 |
| | 11.1 | % | | 52,216 |
| | 55,470 |
| | (5.9 | )% |
| Total Revenue | $ | 251,941 |
|
| $ | 250,612 |
| | 0.5 | % | | $ | 249,541 |
| | 1.0 | % | | $ | 750,877 |
|
| $ | 734,422 |
| | 2.2 | % |
| Utilities | $ | 41,271 |
| | $ | 43,324 |
| | (4.7 | )% | | $ | 40,749 |
| | 1.3 | % | | $ | 122,360 |
| | $ | 118,788 |
| | 3.0 | % |
| Rental property operating | 19,195 |
| | 19,528 |
| | (1.7 | )% | | 20,996 |
| | (8.6 | )% | | 59,429 |
| | 56,684 |
| | 4.8 | % |
| Repairs & maintenance | 15,956 |
| | 14,933 |
| | 6.9 | % | | 15,666 |
| | 1.9 | % | | 45,741 |
| | 44,426 |
| | 3.0 | % |
| Non-cash straight-line rent expense adjustment | — |
| | 9,988 |
| | (100.0 | )% | | — |
| | — | % | | — |
| | 9,988 |
| | (100.0 | )% |
| Property taxes | 15,544 |
| | 17,589 |
| | (11.6 | )% | | 13,370 |
| | 16.3 | % | | 43,113 |
| | 44,897 |
| | (4.0 | )% |
| Insurance | 1,557 |
| | 1,501 |
| | 3.7 | % | | 1,300 |
| | 19.8 | % | | 4,678 |
| | 4,648 |
| | 0.6 | % |
| Total Expenses | $ | 93,523 |
|
| $ | 106,863 |
| | (12.5 | )% | | $ | 92,081 |
| | 1.6 | % | | $ | 275,321 |
|
| $ | 279,431 |
| | (1.5 | )% |
| | | | | | | | | | | | | | | | |
Net Operating Income (2) | $ | 158,418 |
|
| $ | 143,749 |
| | 10.2 | % | | $ | 157,460 |
| | 0.6 | % | | $ | 475,556 |
|
| $ | 454,991 |
| | 4.5 | % |
| Stabilized straight-line rent | $ | 5,231 |
| | $ | 8,631 |
| | (39.4 | )% | | $ | 5,112 |
| | 2.3 | % | | $ | 17,865 |
| | $ | 27,374 |
| | (34.7 | )% |
| Non-cash straight-line rent expense adjustment | — |
| | (9,988 | ) | | (100.0 | )% | | — |
| | — | % | | — |
| | (9,988 | ) | | (100.0 | )% |
| Above and below market rent | 3,189 |
| | 3,475 |
| | (8.2 | )% | | 3,367 |
| | (5.3 | )% | | 10,111 |
| | 11,093 |
| | (8.9 | )% |
Cash Net Operating Income (3) | $ | 149,998 |
| | $ | 141,631 |
| | 5.9 | % | | $ | 148,981 |
| | 0.7 | % | | $ | 447,580 |
|
| $ | 426,512 |
| | 4.9 | % |
| | | | | | | | | | | | | | | | |
Stabilized occupancy at period end (4) | 93.7 | % | | 94.2 | % | | (0.5 | )% | | 93.2 | % | | 0.5 | % | | 93.7 | % | | 94.2 | % | | (0.5 | )% |
| |
| (1) | Same-store properties were acquired on or before December 31, 2012. Excludes properties sold or contributed to joint ventures for all periods presented. |
|
| | |
| Same- Store Operation Trend Summary | | Financial Supplement |
| Unaudited and in thousands | Third Quarter 2014 |
| |
| (2) | For a definition and discussion of net operating income and a reconciliation of operating income to NOI, see page 43. |
| |
| (3) | For a definition and discussion of cash net operating income and a reconciliation of operating income to Cash NOI, see page 43. |
| |
| (4) | Occupancy excludes space under active development and space held for development. For some of our properties, we calculate occupancy based on factors in addition to contractually leased square feet, including available power, required support space and common area. |
| |
| (5) | Represents properties owned as of December 31, 2012 with less than 5% of total rentable square feet under development. Also excludes properties that were undergoing, or were expected to undergo, development activities in 2013-2014 and properties sold or contributed to joint ventures for all periods presented. |
Note: Unconsolidated joint ventures excluded from same-store / stabilized portfolio in all periods.
|
| | |
| Summary of Leasing Activity | | Financial Supplement |
| Leases Signed in the Quarter Ended September 30, 2014 | Third Quarter 2014 |
|
| | | | | | | | | | | | | | | | | | | | | | | | | | | | | | | | | | | | | | | | | | | | | | | | |
| | Turn-Key Flex® | | Powered Base
Building® | | Colocation | | Custom Solutions | Non-Tech | Total |
| Leasing Activity - New (1) (6) | | 3Q14 | | LTM | | 3Q14 | | LTM | | 3Q14 | | LTM | | 3Q14 | | LTM | | 3Q14 | | LTM | | 3Q14 | | LTM |
| Number of leases(2) | | 22 |
| | 73 |
| | 2 |
| | 8 |
| | 43 |
| | 199 |
| | 1 |
| | 2 |
| | 11 |
| | 52 |
| | 79 |
| | 334 |
|
| Rentable Square Feet Leased (3) | | 148,612 |
| | 799,393 |
| | 22,000 |
| | 217,437 |
| | 23,082 |
| | 113,903 |
| | 15,195 |
| | 30,515 |
| | 15,939 |
| | 183,855 |
| | 224,828 |
| | 1,345,103 |
|
| Initial stabilized cash rent per square foot | | $ | 140 |
| | $ | 142 |
| | $ | 44 |
| | $ | 56 |
| | $ | 223 |
| | $ | 191 |
| | $ | 227 |
| | $ | 196 |
| | $ | 30 |
| | $ | 24 |
| | $ | 137 |
| | $ | 118 |
|
| GAAP rent per square foot (4) | | $ | 140 |
| | $ | 149 |
| | $ | 46 |
| | $ | 66 |
| | $ | 229 |
| | $ | 198 |
| | $ | 238 |
| | $ | 188 |
| | $ | 32 |
| | $ | 27 |
| | $ | 139 |
| | $ | 124 |
|
| Leasing cost per square foot | | $ | 36 |
| | $ | 45 |
| | $ | 4 |
| | $ | 1 |
| | $ | 60 |
| | $ | 56 |
| | $ | 39 |
| | $ | 40 |
| | $ | 13 |
| | $ | 27 |
| | $ | 34 |
| | $ | 36 |
|
| Weighted Average Lease Term (years) | | 5.2 |
| | 6.7 |
| | 10.3 |
| | 14.6 |
| | 4.5 |
| | 4.4 |
| | 5.5 |
| | 5.3 |
| | 4.8 |
| | 7.8 |
| | 5.6 |
| | 7.9 |
|
|
| | | | | | | | | | | | | | | | | | | | | | | | | | | | | | | | | | | | | | | | | | | | |
| | Turn-Key Flex® | | Powered Base
Building® | | Colocation | | Custom Solutions | Non-Tech | Total |
| Leasing Activity - Renewals (1) | | 3Q14 | | LTM | | 3Q14 | | LTM | | 3Q14 | | LTM | | 3Q14 | | LTM | | 3Q14 | | LTM | | 3Q14 | | LTM |
| Number of leases (2) | | 15 |
| | 25 |
| | 1 |
| | 21 |
| | 20 |
| | 80 |
| | N/A | | N/A | | 13 |
| | 37 |
| | 49 |
| | 163 |
|
| Rentable Square Feet Renewed (3) | | 233,956 |
| | 337,631 |
| | 107,299 |
| | 483,780 |
| | 57,407 |
| | 100,307 |
| | N/A | | N/A | | 39,890 |
| | 146,601 |
| | 438,552 |
| | 1,068,319 |
|
| Expiring cash rent per square foot | | $ | 164 |
| | $ | 165 |
| | $ | 35 |
| | $ | 42 |
| | $ | 226 |
| | $ | 211 |
| | N/A | | N/A | | $ | 32 |
| | $ | 27 |
| | $ | 129 |
| | $ | 94 |
|
| Renewed cash rent per square foot | | $ | 149 |
| | $ | 154 |
| | $ | 43 |
| | $ | 46 |
| | $ | 221 |
| | $ | 208 |
| | N/A | | N/A | | $ | 33 |
| | $ | 31 |
| | $ | 122 |
| | $ | 93 |
|
| Cash Rental Rate Change | | (9.3 | )% | | (6.4 | )% | | 22.3 | % | | 9.7 | % | | (2.1 | )% | | (1.4 | )% | | N/A | | N/A | | 5.0 | % | | 12.1 | % | | (5.2 | )% | | (1.4 | )% |
| Expiring GAAP rent per square foot (4) | | $ | 150 |
| | $ | 148 |
| | $ | 31 |
| | $ | 38 |
| | $ | 215 |
| | $ | 203 |
| | N/A | | N/A | | $ | 32 |
| | $ | 27 |
| | $ | 118 |
| | $ | 87 |
|
| Renewed GAAP rent per square foot (4) | | $ | 157 |
| | $ | 159 |
| | $ | 51 |
| | $ | 50 |
| | $ | 224 |
| | $ | 211 |
| | N/A | | N/A | | $ | 35 |
| | $ | 32 |
| | $ | 129 |
| | $ | 97 |
|
| GAAP Rental Rate Change | | 5.1 | % | | 7.2 | % | | 66.4 | % | | 29.7 | % | | 3.8 | % | | 4.1 | % | | N/A | | N/A | | 7.4 | % | | 19.8 | % | | 8.7 | % | | 11.6 | % |
| Leasing cost per square foot | | $ | 6 |
| | $ | 5 |
| | $ | — |
| | $ | 6 |
| | $ | 1 |
| | $ | 2 |
| | N/A | | N/A | | $ | 2 |
| | $ | 5 |
| | $ | 3 |
| | $ | 5 |
|
| Weighted Average Lease Term (years) | | 5.4 |
| | 6.0 |
| | 16.0 |
| | 8.8 |
| | 2.0 |
| | 2.3 |
| | N/A | | N/A | | 4.7 |
| | 5.3 |
| | 7.5 |
| | 6.8 |
|
| |
|
| |
|
| |
|
| |
|
| |
|
| |
|
| |
| |
| |
|
| |
|
| |
|
| |
|
|
| Retention Ratio (5) | | 89 | % | | 83 | % | | 82 | % | | 72 | % | | 87 | % | | 84 | % | | N/A | | N/A | | 42 | % | | 59 | % | | 79 | % | | 74 | % |
| |
| (1) | Excludes short-term, roof and garage leases. |
| |
| (2) | The number of leases represents the leased-unit count; a lease may include multiple units. |
| |
| (3) | For some of our properties, we calculate square footage based on factors in addition to contractually leased square feet, including power, required support space and common area. |
| |
| (4) | Rental rates represent annual estimated cash rent per rentable square foot, adjusted for straight-line rents in accordance with GAAP. |
| |
| (6) | Includes leases for new and re-leased space. |
Note: LTM is last twelve months, including current quarter.
|
| | |
| Summary of Leasing Activity | | Financial Supplement |
| Leases Commenced in the Quarter Ended September 30, 2014 | Third Quarter 2014 |
|
| | | | | | | | | | | | | | | | | | | | | | | | | | | | | | | | | | | | | | | | | | | | | | |
| | Turn-Key Flex® | | Powered Base
Building® | | Colocation | | Custom Solutions | Non-Tech | Total |
| Leasing Activity - New (1) (5) | | 3Q14 | | LTM | | 3Q14 | | LTM | | 3Q14 | | LTM | | 3Q14 | | LTM | | 3Q14 | | LTM | | 3Q14 | | LTM |
| Number of leases(2) | | 18 |
| | 67 |
| | 2 |
| | 6 |
| | 50 |
| | 197 |
| | — |
| | 4 |
| | 15 |
| | 58 |
| | 85 |
| | 332 |
|
| Rentable Square Feet Leased (3) | | 167,683 |
| | 700,775 |
| | 22,000 |
| | 57,437 |
| | 25,525 |
| | 114,766 |
| | — |
| | 55,402 |
| | 83,419 |
| | 264,837 |
| | 298,627 |
| | 1,193,217 |
|
| Initial stabilized cash rent per square foot | | $ | 152 |
| | $ | 135 |
| | 44 |
| | $ | 34 |
| | $ | 218 |
| | $ | 188 |
| | — |
| | $ | 145 |
| | $ | 21 |
| | $ | 22 |
| | $ | 113 |
| | $ | 111 |
|
| GAAP rent per square foot (4) | | $ | 156 |
| | $ | 145 |
| | 46 |
| | $ | 36 |
| | $ | 236 |
| | $ | 195 |
| | — |
| | $ | 146 |
| | $ | 25 |
| | $ | 24 |
| | $ | 118 |
| | $ | 118 |
|
| Leasing cost per square foot | | $ | 22 |
| | $ | 45 |
| | 4 |
| | $ | 5 |
| | $ | 67 |
| | $ | 53 |
| | — |
| | $ | 50 |
| | $ | 41 |
| | $ | 32 |
| | $ | 30 |
| | $ | 41 |
|
| Weighted Average Lease Term (years) | | 6.1 |
| | 7.7 |
| | 10.3 |
| | 13.3 |
| | 4.5 |
| | 4.4 |
| | — |
| | 7.4 |
| | 8.8 |
| | 9.4 |
| | 7.0 |
| | 8.0 |
|
|
| | | | | | | | | | | | | | | | | | | | | | | | | | | | | | | | | | | | | | | | | | | | |
| | Turn-Key Flex® | | Powered Base
Building® | | Colocation | | Custom Solutions | Non-Tech | Total |
| Leasing Activity - Renewals (1) | | 3Q14 | | LTM | | 3Q14 | | LTM | | 3Q14 | | LTM | | 3Q14 | | LTM | | 3Q14 | | LTM | | 3Q14 | | LTM |
| Number of leases(2) | | 10 |
| | 20 |
| | 1 |
| | 22 |
| | 23 |
| | 82 |
| | N/A | | N/A | | 12 |
| | 34 |
| | 46 |
| | 158 |
|
| Rentable Square Feet Renewed(3) | | 143,184 |
| | 252,432 |
| | 107,299 |
| | 487,280 |
| | 54,830 |
| | 94,817 |
| | N/A | | N/A | | 51,316 |
| | 142,370 |
| | 356,629 |
| | 976,899 |
|
| Expiring cash rent per square foot | | $ | 170 |
| | $ | 170 |
| | $ | 35 |
| | $ | 41 |
| | $ | 213 |
| | $ | 203 |
| | N/A | | N/A | | $ | 29 |
| | $ | 27 |
| | $ | 116 |
| | $ | 88 |
|
| Renewed cash rent per square foot | | $ | 149 |
| | $ | 157 |
| | $ | 43 |
| | $ | 45 |
| | $ | 220 |
| | $ | 207 |
| | N/A | | N/A | | $ | 31 |
| | $ | 30 |
| | $ | 111 |
| | $ | 88 |
|
| Cash Rental Rate Change | | (12.5 | )% | | (7.6 | )% | | 22.3 | % | | 9.7 | % | | 3.1 | % | | 1.6 | % | | N/A | | N/A | | 6.6 | % | | 12.8 | % | | (4.3 | )% | | (0.6 | )% |
| Expiring GAAP rent per square foot(4) | | $ | 155 |
| | $ | 153 |
| | $ | 31 |
| | $ | 38 |
| | $ | 205 |
| | $ | 198 |
| | N/A | | N/A | | $ | 30 |
| | $ | 26 |
| | $ | 107 |
| | $ | 81 |
|
| Renewed GAAP rent per square foot(4) | | $ | 157 |
| | $ | 162 |
| | $ | 51 |
| | $ | 50 |
| | $ | 224 |
| | $ | 210 |
| | N/A | | N/A | | $ | 32 |
| | $ | 32 |
| | $ | 117 |
| | $ | 92 |
|
| GAAP Rental Rate Change | | 1.1 | % | | 6.0 | % | | 66.4 | % | | 30.4 | % | | 9.4 | % | | 6.2 | % | | N/A | | N/A | | 7.2 | % | | 23.7 | % | | 9.4 | % | | 12.5 | % |
| Leasing cost per square feet | | $ | 1 |
| | $ | 2 |
| | $ | — |
| | $ | 6 |
| | $ | 11 |
| | $ | 9 |
| | N/A | | N/A | | $ | 2 |
| | $ | 5 |
| | $ | 3 |
| | $ | 5 |
|
| Weighted Average Lease Term (years) | | 4.4 |
| | 6.2 |
| | 16.0 |
| | 8.8 |
| | 2.8 |
| | 2.5 |
| | N/A | | N/A | | 3.4 |
| | 5.3 |
| | 7.5 |
| | 7.0 |
|
| |
| (1) | Excludes short-term, roof and garage leases. |
| |
| (2) | The number of leases represents the leased-unit count; a lease may include multiple units. |
| |
| (3) | For some of our properties, we calculate square footage based on factors in addition to contractually leased square feet, including power, required support space and common area. |
| |
| (4) | Rental rates represent annual estimated cash rent per rentable square foot, adjusted for straight-line rents in accordance with GAAP. |
| |
| (5) | Includes leases for new and re-leased space. |
Note: LTM is last twelve months, including current quarter.
|
| | |
| Lease Expirations and Lease Distribution | | Financial Supplement |
| Dollars in thousands, except per square foot | Third Quarter 2014 |
Lease Expirations
|
| | | | | | | | | | | | | | | | | | | | | | | | | | | | |
| Year | | Number of Leases Expiring(1) | | Square Footage of Expiring Leases (2) | | % of Net Rentable Square Feet | | Annualized Rent (3) | | % of Annualized Rent | | Annualized Rent Per Occupied Square Foot | | Annualized Rent Per Occupied Square Foot at Expiration | | Annualized Rent at Expiration |
| Available | | | | 1,519,966 |
| | 7.4 | % | | | | — | % | | | | | | |
Month to Month (4) | | 91 |
| | 61,200 |
| | 0.3 | % | | $ | 4,761 |
| | 0.4 | % | | $ | 78 |
| | $ | 78 |
| | $ | 4,761 |
|
| 2014 | | 56 |
| �� | 285,269 |
| | 1.4 | % | | 20,842 |
| | 1.8 | % | | 73 |
| | 85 |
| | 24,244 |
|
| 2015 | | 361 |
| | 1,615,742 |
| | 7.9 | % | | 92,793 |
| | 7.8 | % | | 57 |
| | 58 |
| | 93,299 |
|
| 2016 | | 325 |
| | 1,546,556 |
| | 7.6 | % | | 94,335 |
| | 7.9 | % | | 61 |
| | 64 |
| | 98,552 |
|
| 2017 | | 348 |
| | 1,628,600 |
| | 8.0 | % | | 87,113 |
| | 7.3 | % | | 53 |
| | 56 |
| | 92,011 |
|
| 2018 | | 246 |
| | 1,615,568 |
| | 7.9 | % | | 120,416 |
| | 10.1 | % | | 75 |
| | 82 |
| | 132,454 |
|
| 2019 | | 331 |
| | 2,216,545 |
| | 10.8 | % | | 160,186 |
| | 13.5 | % | | 72 |
| | 84 |
| | 185,926 |
|
| 2020 | | 168 |
| | 1,299,629 |
| | 6.4 | % | | 100,145 |
| | 8.4 | % | | 77 |
| | 90 |
| | 117,330 |
|
| 2021 | | 97 |
| | 1,408,385 |
| | 6.9 | % | | 90,754 |
| | 7.6 | % | | 64 |
| | 78 |
| | 109,792 |
|
| 2022 | | 110 |
| | 1,462,312 |
| | 7.2 | % | | 70,343 |
| | 5.9 | % | | 48 |
| | 58 |
| | 84,118 |
|
| 2023 | | 104 |
| | 863,412 |
| | 4.2 | % | | 58,858 |
| | 5.0 | % | | 68 |
| | 87 |
| | 75,116 |
|
| Thereafter | | 370 |
| | 4,908,171 |
| | 24.0 | % | | 288,932 |
| | 24.3 | % | | 59 |
| | 81 |
| | 397,924 |
|
| | | | | | | | | | | | | | | | | |
| Total / Wtd. Avg. | | 2,607 |
| | 20,431,355 |
| | 100.0 | % | | $ | 1,189,478 |
| | 100.0 | % | | $ | 63 |
| | $ | 75 |
| | $ | 1,415,527 |
|
Lease Distribution
|
| | | | | | | | | | | | | | | | |
Square Feet Under Lease | | Number of Leases (1) | | Total Net Rentable Square Feet (2) | | % of Net Rentable Square Feet | | Annualized Rent (3) | | % of Annualized Rent |
| Available | |
|
| | 1,519,966 |
| | 7.4 | % | | — |
| | — | % |
| 2,500 or less | | 1,745 |
| | 780,858 |
| | 3.8 | % | | $ | 74,768 |
| | 6.3 | % |
| 2,501 - 10,000 | | 388 |
| | 2,302,975 |
| | 11.3 | % | | 228,415 |
| | 19.2 | % |
| 10,001 - 20,000 | | 248 |
| | 3,623,340 |
| | 17.7 | % | | 349,056 |
| | 29.3 | % |
| 20,001 - 40,000 | | 117 |
| | 3,341,082 |
| | 16.4 | % | | 235,694 |
| | 19.8 | % |
| 40,001 - 100,000 | | 76 |
| | 4,587,367 |
| | 22.5 | % | | 188,918 |
| | 15.9 | % |
| Greater than 100,000 | | 33 |
| | 4,275,767 |
| | 20.9 | % | | 112,627 |
| | 9.5 | % |
| | | | | | | | | | | |
| Total / Wtd. Avg. | | 2,607 |
| | 20,431,355 |
| | 100.0 | % | | $ | 1,189,478 |
| | 100.0 | % |
| |
| (1) | Number of leases represents the leased-unit count; a lease may include multiple units. |
| |
| (2) | For some of our properties, we calculate square footage based on factors in addition to contractually leased square feet, including available power, required support space and common area. We estimate the total net rentable square feet available for lease based on a number of factors in addition to contractually leased square feet, including available power, required support space and common area. |
| |
| (3) | Annualized rent represents the monthly contractual base rent (defined as cash base rent before abatements) under existing leases as of September 30, 2014 multiplied by 12. |
| |
| (4) | Includes leases, licenses and similar agreements that upon expiration have been automatically renewed on a month-to-month basis. |
Note: Represents consolidated portfolio in addition to our managed portfolio of unconsolidated joint ventures based on our ownership percentage.
|
| | |
| Lease Expirations - By Product Type | | Financial Supplement |
| Dollars in thousands, except per square foot | Third Quarter 2014 |
|
| | | | | | | | | | | | | | | | | | | | | | |
| Turn-Key Flex® | | | | | | | | |
| Year | | Square Footage of Expiring Leases (1) | | Annualized Rent (2) | | % of Annualized Rent | | Annualized Rent Per Occupied
Square Foot | | Annualized Rent Per Occupied Square Foot at Expiration | | Annualized Rent at Expiration |
| | | | | | | | | | | | | |
| Available | | 410,910 |
| | — |
| | — | % | | | | | | |
| Month to Month (3) | | 12,626 |
| | $ | 2,606 |
| | 0.2 | % | | $ | 206 |
| | $ | 206 |
| | $ | 2,606 |
|
| 2014 | | 19,862 |
| | 3,803 |
| | 0.3 | % | | 191 |
| | 196 |
| | 3,886 |
|
| 2015 | | 300,749 |
| | 38,228 |
| | 3.2 | % | | 127 |
| | 127 |
| | 38,179 |
|
| 2016 | | 356,659 |
| | 53,483 |
| | 4.5 | % | | 150 |
| | 157 |
| | 55,949 |
|
| 2017 | | 398,171 |
| | 59,868 |
| | 5.0 | % | | 150 |
| | 160 |
| | 63,719 |
|
| 2018 | | 615,025 |
| | 84,025 |
| | 7.0 | % | | 137 |
| | 151 |
| | 93,055 |
|
| 2019 | | 664,994 |
| | 103,708 |
| | 8.7 | % | | 156 |
| | 185 |
| | 122,775 |
|
| 2020 | | 536,190 |
| | 75,328 |
| | 6.3 | % | | 140 |
| | 166 |
| | 88,834 |
|
| 2021 | | 448,580 |
| | 71,080 |
| | 6.0 | % | | 158 |
| | 194 |
| | 87,139 |
|
| 2022 | | 272,060 |
| | 39,686 |
| | 3.3 | % | | 146 |
| | 175 |
| | 47,665 |
|
| 2023 | | 346,011 |
| | 47,530 |
| | 4.0 | % | | 137 |
| | 182 |
| | 62,840 |
|
| Thereafter | | 1,325,167 |
| | 159,129 |
| | 13.4 | % | | 120 |
| | 165 |
| | 217,994 |
|
| Total / Wtd. Avg. | | 5,707,004 |
| | $ | 738,474 |
| | 61.9 | % | | $ | 139 |
| | $ | 167 |
| | $ | 884,641 |
|
| | | | | | | | | | | | | |
| | | | | | | | | | | | | |
| Powered Base Building® | | | | | | | | |
| Available | | 191,227 |
| | — |
| | — | % | | | | | | |
| Month to Month (3) | | 36,218 |
| | $ | 1,091 |
| | 0.1 | % | | $ | 30 |
| | $ | 30 |
| | $ | 1,091 |
|
| 2014 | | 208,074 |
| | 11,696 |
| | 1.0 | % | | 56 |
| | 60 |
| | 12,565 |
|
| 2015 | | 943,238 |
| | 30,572 |
| | 2.6 | % | | 32 |
| | 33 |
| | 30,702 |
|
| 2016 | | 891,545 |
| | 25,907 |
| | 2.2 | % | | 29 |
| | 30 |
| | 26,927 |
|
| 2017 | | 514,722 |
| | 5,377 |
| | 0.4 | % | | 10 |
| | 11 |
| | 5,574 |
|
| 2018 | | 723,241 |
| | 25,012 |
| | 2.1 | % | | 35 |
| | 37 |
| | 26,548 |
|
| 2019 | | 1,086,301 |
| | 39,487 |
| | 3.3 | % | | 36 |
| | 40 |
| | 43,801 |
|
| 2020 | | 473,697 |
| | 15,476 |
| | 1.3 | % | | 33 |
| | 38 |
| | 18,225 |
|
| 2021 | | 511,435 |
| | 13,380 |
| | 1.1 | % | | 26 |
| | 30 |
| | 15,547 |
|
| 2022 | | 879,358 |
| | 24,973 |
| | 2.1 | % | | 28 |
| | 34 |
| | 29,828 |
|
| 2023 | | 420,923 |
| | 9,132 |
| | 0.8 | % | | 22 |
| | 25 |
| | 10,522 |
|
| Thereafter | | 2,674,114 |
| | 113,180 |
| | 9.5 | % | | 42 |
| | 59 |
| | 158,711 |
|
| Total / Wtd. Avg. | | 9,554,093 |
| | $ | 315,283 |
| | 26.5 | % | | $ | 34 |
| | $ | 41 |
| | $ | 380,041 |
|
| | | | | | | | | | | | | |
| | | | | | | | | | | | | |
|
| | |
| Lease Expirations - By Product Type | | Financial Supplement |
| Dollars in thousands, except per square foot | Third Quarter 2014 |
|
| | | | | | | | | | | | | | | | | | | | | | |
| Colocation | | | | | | | | |
| Available | | 205,171 |
| | — |
| | — | % | | | | | | |
| Month to Month (3) | | 3,774 |
| | $ | 848 |
| | 0.1 | % | | $ | 225 |
| | $ | 225 |
| | $ | 848 |
|
| 2014 | | 20,283 |
| | 4,405 |
| | 0.4 | % | | 217 |
| | 338 |
| | 6,848 |
|
| 2015 | | 82,258 |
| | 17,576 |
| | 1.5 | % | | 214 |
| | 219 |
| | 18,043 |
|
| 2016 | | 43,935 |
| | 9,346 |
| | 0.8 | % | | 213 |
| | 226 |
| | 9,918 |
|
| 2017 | | 39,638 |
| | 6,791 |
| | 0.6 | % | | 171 |
| | 186 |
| | 7,377 |
|
| 2018 | | 21,837 |
| | 4,559 |
| | 0.4 | % | | 209 |
| | 250 |
| | 5,464 |
|
| 2019 | | 64,978 |
| | 9,509 |
| | 0.8 | % | | 146 |
| | 174 |
| | 11,289 |
|
| 2020 | | 9,854 |
| | 1,387 |
| | 0.1 | % | | 141 |
| | 225 |
| | 2,219 |
|
| 2021 | | 3,839 |
| | 395 |
| | — | % | | 103 |
| | 121 |
| | 466 |
|
| 2022 | | — |
| | — |
| | — | % | | — |
| | — |
| | — |
|
| 2023 | | — |
| | — |
| | — | % | | — |
| | — |
| | — |
|
| Thereafter | | 44,640 |
| | 3,755 |
| | 0.3 | % | | 84 |
| | 118 |
| | 5,287 |
|
| Total / Wtd. Avg. | | 540,207 |
| | $ | 58,571 |
| | 5.0 | % | | $ | 175 |
| | $ | 202 |
| | $ | 67,759 |
|
| | | | | | | | | | | | | |
| | | | | | | | | | | | | |
| Non-Technical | | | | | | | | |
| Available | | 712,658 |
| | — |
| | — | % | | | | | | |
| Month to Month (3) | | 8,582 |
| | $ | 224 |
| | — | % | | $ | 26 |
| | $ | 26 |
| | $ | 224 |
|
| 2014 | | 37,050 |
| | 929 |
| | 0.1 | % | | 25 |
| | 25 |
| | 937 |
|
| 2015 | | 289,497 |
| | 6,416 |
| | 0.5 | % | | 22 |
| | 22 |
| | 6,375 |
|
| 2016 | | 254,417 |
| | 5,598 |
| | 0.5 | % | | 22 |
| | 23 |
| | 5,758 |
|
| 2017 | | 676,069 |
| | 15,076 |
| | 1.3 | % | | 22 |
| | 23 |
| | 15,341 |
|
| 2018 | | 255,465 |
| | 6,821 |
| | 0.6 | % | | 27 |
| | 29 |
| | 7,387 |
|
| 2019 | | 400,272 |
| | 7,482 |
| | 0.6 | % | | 19 |
| | 20 |
| | 8,061 |
|
| 2020 | | 279,887 |
| | 7,953 |
| | 0.7 | % | | 28 |
| | 29 |
| | 8,052 |
|
| 2021 | | 444,531 |
| | 5,900 |
| | 0.5 | % | | 13 |
| | 15 |
| | 6,640 |
|
| 2022 | | 310,894 |
| | 5,684 |
| | 0.5 | % | | 18 |
| | 21 |
| | 6,624 |
|
| 2023 | | 96,478 |
| | 2,195 |
| | 0.2 | % | | 23 |
| | 18 |
| | 1,755 |
|
| Thereafter | | 864,251 |
| | 12,872 |
| | 1.1 | % | | 15 |
| | 18 |
| | 15,932 |
|
| Total / Wtd. Avg. | | 4,630,051 |
| | $ | 77,150 |
| | 6.6 | % | | $ | 20 |
| | $ | 21 |
| | $ | 83,086 |
|
| |
| (1) | For some properties, we calculate square footage based on factors in addition to contractually leased square feet, including available power, required support space and common area. We estimate the total net rentable square feet available for lease based on a number of factors in addition to contractually leased square feet, including available power, required support space and common area. |
| |
| (2) | Annualized rent represents the monthly contractual base rent (defined as cash base rent before abatements) under existing leases as of September 30, 2014 multiplied by 12. |
| |
| (3) | Includes leases, licenses and similar agreements that upon expiration have been automatically renewed on a month-to-month basis. |
Note: Represents consolidated portfolio in addition to our managed portfolio of unconsolidated joint ventures based on our ownership percentage.
|
| | |
| Top 20 Tenants by Annualized Rent | | Financial Supplement |
| Dollars in thousands | Third Quarter 2014 |
|
| | | | | | | | | | | | | | | | | | | | |
| Tenant | | Number of Locations | | Total Occupied Square Feet (1) | | % of Net Rentable Square Feet | | Annualized Rent (2) | | % of Annualized Rent | | Weighted Average Remaining Lease Term in Months |
| 1 | CenturyLink, Inc. (3) | | 42 |
| | 2,356,607 |
| | 11.5 | % | | $ | 88,382 |
| | 7.4 | % | | 74 |
|
| 2 | IBM (4) | | 16 |
| | 586,949 |
| | 2.9 | % | | 79,181 |
| | 6.7 | % | | 87 |
|
| 3 | TelX Group, Inc. | | 12 |
| | 341,202 |
| | 1.7 | % | | 50,870 |
| | 4.3 | % | | 162 |
|
| 4 | Equinix Operating Company, Inc. | | 10 |
| | 847,550 |
| | 4.1 | % | | 38,425 |
| | 3.2 | % | | 152 |
|
| 5 | AT&T | | 22 |
| | 614,772 |
| | 3.0 | % | | 26,312 |
| | 2.2 | % | | 56 |
|
| 6 | Morgan Stanley | | 5 |
| | 173,061 |
| | 0.8 | % | | 25,469 |
| | 2.1 | % | | 78 |
|
| 7 | Deutsche Bank AG | | 3 |
| | 113,461 |
| | 0.6 | % | | 23,071 |
| | 1.9 | % | | 46 |
|
| 8 | JPMorgan Chase & Co. | | 7 |
| | 220,003 |
| | 1.1 | % | | 22,141 |
| | 1.9 | % | | 76 |
|
| 9 | SunGard Availability Services LP | | 9 |
| | 384,894 |
| | 1.9 | % | | 21,367 |
| | 1.8 | % | | 84 |
|
| 10 | Verizon Communications, Inc. | | 35 |
| | 320,703 |
| | 1.6 | % | | 20,330 |
| | 1.7 | % | | 72 |
|
| 11 | NTT Communications Company | | 7 |
| | 225,776 |
| | 1.1 | % | | 20,162 |
| | 1.7 | % | | 85 |
|
| 12 | Facebook, Inc. | | 3 |
| | 128,964 |
| | 0.6 | % | | 18,201 |
| | 1.5 | % | | 48 |
|
| 13 | LinkedIn Corporation | | 2 |
| | 173,766 |
| | 0.9 | % | | 15,633 |
| | 1.3 | % | | 119 |
|
| 14 | TATA Communications (UK) | | 8 |
| | 140,294 |
| | 0.7 | % | | 15,530 |
| | 1.3 | % | | 43 |
|
| 15 | Navisite Europe Limited | | 4 |
| | 88,663 |
| | 0.4 | % | | 13,624 |
| | 1.1 | % | | 93 |
|
| 16 | Nomura International PLC | | 2 |
| | 63,137 |
| | 0.3 | % | | 13,041 |
| | 1.1 | % | | 64 |
|
| 17 | Pfizer, Inc. | | 1 |
| | 97,069 |
| | 0.5 | % | | 11,886 |
| | 1.0 | % | | 39 |
|
| 18 | Amazon | | 9 |
| | 286,575 |
| | 1.4 | % | | 11,616 |
| | 1.0 | % | | 63 |
|
| 19 | Level 3 Communications, LLC | | 44 |
| | 312,471 |
| | 1.5 | % | | 11,548 |
| | 1.0 | % | | 86 |
|
| 20 | Yahoo! Inc. | | 2 |
| | 110,847 |
| | 0.5 | % | | 11,318 |
| | 1.0 | % | | 37 |
|
|
| |
| |
| |
| |
| |
| |
|
| Total / Weighted Average | | 7,586,764 |
| | 37.1 | % | | $ | 538,107 |
| | 45.2 | % | | 86 |
|
| |
| (1) | Occupied square footage is calculated based on leases that commenced on or before September 30, 2014. For some of our properties, we calculate occupancy based on factors in addition to contractually leased square feet, including available power, required support space and common area. |
| |
| (2) | Annualized base rent represents the monthly contractual base rent (defined as cash base rent before abatements) under existing leases as of September 30, 2014 multiplied by 12. |
| |
| (3) | Represents leases with Savvis Communications Corporation and Qwest Communications International, Inc. (or affiliates thereof), which are our direct tenants. CenturyLink, Inc. acquired Qwest in Q2 2011 and Savvis in Q3 2011, and Qwest and Savvis are now wholly-owned subsidiaries of CenturyLink. |
| |
| (4) | Represents leases with IBM and leases with SoftLayer. IBM acquired SoftLayer in July 2013. |
Note: Represents consolidated portfolio in addition to our managed portfolio of unconsolidated joint ventures based on ownership percentage.
|
| | |
| Portfolio Summary | | Financial Supplement |
| As of September 30, 2014 | Third Quarter 2014 |
|
| | | | | | | | | | | | | | |
| 30-Sep-14 | | 30-Jun-14 | | 31-Mar-14 | | 31-Dec-13 | | 30-Sep-13 |
| Number of Properties (1) |
| |
| |
| |
| |
|
| Domestic (2) | 90 |
| | 91 |
| | 91 |
| | 92 |
| | 91 |
|
| International | 27 |
| | 27 |
| | 28 |
| | 28 |
| | 28 |
|
| Unconsolidated joint ventures (1) | 14 |
| | 13 |
| | 13 |
| | 12 |
| | 12 |
|
| Total | 131 |
| | 131 |
| | 132 |
| | 132 |
| | 131 |
|
| | |
| |
| |
| |
|
| Number of Buildings | | |
| |
| |
| |
|
| Domestic | 140 |
| | 141 |
| | 141 |
| | 141 |
| | 142 |
|
| International | 31 |
| | 31 |
| | 32 |
| | 32 |
| | 32 |
|
| Unconsolidated joint ventures | 16 |
| | 15 |
| | 15 |
| | 14 |
| | 14 |
|
| Total | 187 |
| | 187 |
| | 188 |
| | 187 |
| | 188 |
|
| | |
| |
| |
| |
|
| Number of Markets | | |
| |
| |
| |
|
| Domestic | 20 |
| | 20 |
| | 20 |
| | 20 |
| | 20 |
|
| International | 11 |
| | 11 |
| | 11 |
| | 11 |
| | 11 |
|
| Unconsolidated joint ventures | 2 |
| | 2 |
| | 2 |
| | 2 |
| | 2 |
|
| Total | 33 |
| | 33 |
| | 33 |
| | 33 |
| | 33 |
|
|
| |
| |
| |
| |
|
| Net Rentable Square Feet (3) |
| |
| |
| |
| |
|
| Domestic | 17,285,433 |
| | 17,301,247 |
| | 17,177,396 |
| | 17,056,741 |
| | 16,705,106 |
|
| International | 2,844,972 |
| | 2,793,793 |
| | 2,868,163 |
| | 2,830,968 |
| | 2,816,450 |
|
| Unconsolidated joint ventures | 1,833,922 |
| | 1,676,445 |
| | 1,665,868 |
| | 1,511,842 |
| | 1,511,842 |
|
| Total | 21,964,327 |
| | 21,771,485 |
| | 21,711,427 |
| | 21,399,551 |
| | 21,033,398 |
|
|
| |
| |
| |
| |
|
| Active Development Square Feet (4) | | |
| |
| |
| |
|
| Domestic | 1,017,790 |
| | 1,115,679 |
| | 1,067,030 |
| | 1,442,177 |
| | 1,220,888 |
|
| International | 235,902 |
| | 280,211 |
| | 268,328 |
| | 317,504 |
| | 312,014 |
|
| Total | 1,253,692 |
| | 1,395,890 |
| | 1,335,358 |
| | 1,759,681 |
| | 1,532,902 |
|
|
| |
| |
| |
| |
|
| Space Held for Development (5) |
| |
| |
| |
| |
|
| Domestic | 936,302 |
| | 978,328 |
| | 1,094,152 |
| | 1,015,574 |
| | 1,791,277 |
|
| International | 311,384 |
| | 305,210 |
| | 328,092 |
| | 316,111 |
| | 335,748 |
|
| Total | 1,247,686 |
| | 1,283,538 |
| | 1,422,244 |
| | 1,331,685 |
| | 2,127,025 |
|
|
| |
| |
| |
| |
|
| Portfolio occupancy (6) | 93.0 | % | | 92.8 | % | | 92.1 | % | | 92.6 | % | | 93.0 | % |
| Digital Realty's share occupancy (7) | 92.6 | % | | 92.4 | % | | 91.6 | % | | 92.2 | % | | 92.7 | % |
| Same-store portfolio occupancy (8) | 92.2 | % | | 92.0 | % | | 91.3 | % | | 91.9 | % | | 92.3 | % |
| Stabilized "same-capital" pool occupancy (9) | 93.7 | % | | 93.2 | % | | 93.4 | % | | 94.0 | % | | 94.2 | % |
| |
| (1) | Includes 12 properties held in our managed portfolio of unconsolidated joint ventures consisting of 4650 Old Ironsides Drive, Santa Clara, CA, 2950 Zanker Road, San Jose, CA, 4700 Old Ironsides Drive, Santa Clara, CA, 444 Toyama Drive, Sunnyvale, CA, 43915 Devin Shafron Drive (Bldg A), Ashburn, VA, 43790 Devin Shafron Drive (Bldg E), Ashburn, VA, 21551 Beaumeade Circle, Ashburn, VA, 7505 Mason King Court, Manassas, VA, 14901 FAA Boulevard, Fort Worth, TX, 900 Dorothy Drive, Richardson, TX, 33 Chun Choi Street, Hong Kong and 636 Pierce Street, Somerset, NJ; and two properties held in our unconsolidated non-managed joint ventures consisting of 2001 Sixth Avenue, Seattle, WA and 2020 Fifth Avenue, Seattle, WA.. |
| |
| (2) | 43915 Devin Shafron Drive (Bldg A) included in the property count for all periods presented because it was separately contributed to our managed unconsolidated joint venture. Not previously included in our property count. |
| |
| (3) | We estimate the total net rentable square feet available for lease based on a number of factors in addition to contractually leased square feet, including available power, required support space and common areas. |
| |
| (4) | Space under active development includes current Base Building and Data Centers projects in progress. See page 30. |
|
| | |
| Portfolio Summary | | Financial Supplement |
| As of September 30, 2014 | Third Quarter 2014 |
| |
| (5) | Space held for development includes space held for future Data Center development, and excludes space under active development. See page 34. |
| |
| (6) | Represents consolidated portfolio in addition to our managed portfolio of unconsolidated joint ventures and non-managed unconsolidated joint ventures. Occupancy excludes space under active development and space held for development. For some of our properties, we calculate occupancy based on factors in addition to contractually leased square feet, including available power, required support space and common areas. |
| |
| (7) | Represents consolidated portfolio in addition to our managed portfolio of unconsolidated joint ventures based on our ownership percentage. Occupancy excludes space under active development and space held for development. For some of our properties, we calculate occupancy based on factors in addition to contractually leased square feet, including available power, required support space and common areas. |
| |
| (8) | Represents consolidated portfolio of properties that were acquired on or before December 31, 2012. Excludes properties sold or contributed to joint ventures for all periods presented. Occupancy excludes space under active development and space held for development. For some of our properties, we calculate occupancy based on factors in addition to contractually leased square feet, including available power, required support space and common areas. |
| |
| (9) | Represents consolidated portfolio of properties owned as of December 31, 2012 with less than 5% of total rentable square feet under development. Also excludes properties that were undergoing, or were expected to undergo, development activities in 2013-2014 and properties sold or contributed to joint venture. Occupancy excludes space under active development and space held for development. For some of our properties, we calculate occupancy based on factors in addition to contractually leased square feet, including available power, required support space and common areas. |
|
| | |
| Portfolio Overview by Product Type | | Financial Supplement |
| Dollars in thousands | Third Quarter 2014 |
|
| | | | | | | | | | |
| Property | | Annualized Rent (1) | | % of Annualized Rent | | % of Property Type Total |
| |
| |
| |
|
| Corporate Data Center | |
| |
| |
|
| Turn-Key Flex® | | $ | 615,063 |
| | 51.7 | % | | 68.1 | % |
| Powered Base Building® | | 207,837 |
| | 17.5 | % | | 23.0 | % |
| Colocation | | 27,238 |
| | 2.3 | % | | 3.0 | % |
| Non-technical | | 52,721 |
| | 4.4 | % | | 5.9 | % |
| Data Center Total | | $ | 902,859 |
| | 75.9 | % | | 100.0 | % |
| |
| |
| |
|
| Internet Gateway Data Center | |
| |
| |
|
| Turn-Key Flex® | | $ | 123,413 |
| | 10.4 | % | | 44.9 | % |
| Powered Base Building® | | 107,447 |
| | 9.0 | % | | 39.1 | % |
| Colocation | | 31,332 |
| | 2.6 | % | | 11.4 | % |
| Non-technical | | 12,523 |
| | 1.1 | % | | 4.6 | % |
| Internet Gateway Data Center Total | | $ | 274,715 |
| | 23.1 | % | | 100.0 | % |
| |
| |
| |
|
| Non-Data Center | |
| |
| |
|
| Non-technical | | $ | 11,904 |
| | 1.0 | % | | 100.0 | % |
| Non-Data Center Total | | $ | 11,904 |
| | 1.0 | % | | 100.0 | % |
| |
| |
| |
|
| Total | | $ | 1,189,478 |
| | 100.0 | % | |
|
| |
| (1) | Annualized rent represents the monthly contractual base rent (defined as cash base rent before abatements) under existing leases as of September 30, 2014, multiplied by 12. |
Note: Represents consolidated portfolio in addition to our managed portfolio of unconsolidated joint ventures based on our ownership percentage.
|
| | |
| Turn-Key Flex® & Colocation | | Financial Supplement |
Product Overview by Market (1) | Third Quarter 2014 |
|
| | | | | | | | | | | | |
| Market | | IT Load mW Capacity (2) | | Net Rentable
Square Feet (3) | | Occupancy % (4) | | Leased Square Feet |
| | | | | | | | | |
| Northern Virginia | | 60.7 |
| | 768,295 |
| | 96.7 | % | | 742,700 |
|
| Phoenix | | 45.2 |
| | 695,907 |
| | 79.9 | % | | 555,948 |
|
| Dallas | | 43.5 |
| | 679,893 |
| | 96.8 | % | | 658,206 |
|
| Silicon Valley | | 32.7 |
| | 389,564 |
| | 97.7 | % | | 380,716 |
|
| New York | | 30.0 |
| | 533,973 |
| | 94.6 | % | | 505,073 |
|
| Chicago | | 26.6 |
| | 412,824 |
| | 91.0 | % | | 375,583 |
|
| San Francisco | | 22.6 |
| | 384,524 |
| | 83.6 | % | | 321,345 |
|
| Boston | | 21.1 |
| | 393,750 |
| | 91.7 | % | | 361,169 |
|
| Los Angeles | | 13.3 |
| | 238,220 |
| | 91.9 | % | | 219,019 |
|
| Houston | | 13.2 |
| | 155,760 |
| | 81.7 | % | | 127,248 |
|
| Other Markets | | 21.3 |
| | 307,428 |
| | 64.1 | % | | 197,100 |
|
| Total North America | | 330.2 |
| | 4,960,138 |
| | 89.6 | % | | 4,444,107 |
|
| | | | | | | | | |
| London, United Kingdom | | 59.7 |
| | 748,699 |
| | 97.9 | % | | 733,126 |
|
| Other Markets | | 13.8 |
| | 203,099 |
| | 83.7 | % | | 170,053 |
|
| Total Europe | | 73.5 |
| | 951,798 |
| | 94.9 | % | | 903,179 |
|
| | | | | | | | | |
| Singapore | | 12.1 |
| | 175,217 |
| | 86.7 | % | | 151,974 |
|
| Other Markets | | 13.0 |
| | 160,058 |
| | 82.4 | % | | 131,870 |
|
| Total Asia/Pacific | | 25.1 |
| | 335,275 |
| | 84.7 | % | | 283,844 |
|
| | | | | | | | | |
| Total | | 428.8 |
| | 6,247,211 |
| | 90.1 | % | | 5,631,130 |
|
| |
| (1) | Excludes any power associated with Powered Base Building® and Non-Technical product types. |
| |
| (2) | IT Load mW Capacity represents UPS-backed utility power dedicated to Digital Realty's operated data center space. |
| |
| (3) | We estimate the total net rentable square feet available for lease based on a number of factors in addition to contractually leased square feet, including available power, required support space and common area. |
| |
| (4) | Occupancy excludes space under active development and space held for development. For some of our properties, we calculate occupancy based on factors in addition to contractually leased square feet, including available power, required support space and common area. |
Note: Represents consolidated portfolio in addition to our managed portfolio of unconsolidated joint ventures based on our ownership percentage.
|
| | |
| Occupancy Analysis | | Financial Supplement |
| Dollars in thousands | Third Quarter 2014 |
|
| | | | | | | | | | | | | | |
| | | | | | | Occupancy (5) |
| Property | Property Type | Net Rentable Square Feet (1) | Space Under Active Development (2) | Space Held for Development (3) | Annualized
Rent (4) | As of 9/30/14 | As of 6/30/14 |
|
|
|
|
|
|
|
|
|
|
| North America |
|
|
|
|
|
|
|
|
|
|
|
|
|
|
|
|
|
|
|
| Dallas |
|
|
|
|
|
|
|
|
|
| 2323 Bryan Street | Internet Gateway | 453,539 |
| — |
| 23,568 |
| $ | 16,595 |
| 76.4 | % | 75.8 | % |
| 2440 Marsh Lane | Data Center | 135,250 |
| — |
| — |
| 14,203 |
| 96.1 | % | 94.9 | % |
| 1232 Alma Road | Data Center | 105,726 |
| — |
| — |
| 13,704 |
| 98.6 | % | 98.6 | % |
| 2501 S. State Hwy. 121 | Data Center | 829,372 |
| — |
| — |
| 13,472 |
| 98.5 | % | 98.5 | % |
| 4849 Alpha Road | Data Center | 125,538 |
| — |
| — |
| 11,559 |
| 100.0 | % | 100.0 | % |
| 4025 Midway Road | Data Center | 92,386 |
| — |
| 8,204 |
| 10,361 |
| 98.3 | % | 98.4 | % |
| 400 S. Akard | Internet Gateway | 269,563 |
| — |
| — |
| 8,244 |
| 94.7 | % | 86.5 | % |
| 11830 Webb Chapel Road | Data Center | 365,647 |
| — |
| — |
| 8,160 |
| 98.0 | % | 98.0 | % |
| 850 East Collins | Data Center | 121,366 |
| — |
| — |
| 7,859 |
| 87.0 | % | 87.0 | % |
| 900 Quality Way | Data Center | 42,318 |
| 56,840 |
| 15,764 |
| 6,660 |
| 100.0 | % | 100.0 | % |
| 950 East Collins | Data Center | 81,873 |
| 39,413 |
| — |
| 6,290 |
| 100.0 | % | 100.0 | % |
| 1215 Integrity Drive (6) | Data Center | 61,750 |
| 56,126 |
| — |
| 3,998 |
| 96.8 | % | 96.8 | % |
| 904 Quality Way | Data Center | 46,750 |
| — |
| — |
| 979 |
| 100.0 | % | 100.0 | % |
| 17201 Waterview Parkway | Data Center | 61,750 |
| — |
| — |
| 704 |
| 100.0 | % | 100.0 | % |
| 905 Security Row (7) | Data Center | — |
| — |
| — |
| — |
| — | % | N/A |
|
| 1210 Integrity Drive (7) | Data Center | — |
| — |
| — |
| — |
| — | % | N/A |
|
| 907 Security Row (8) | Data Center | — |
| — |
| — |
| — |
| — | % | N/A |
|
| Total |
| 2,792,828 |
| 152,379 |
| 47,536 |
| $ | 122,788 |
| 94.0 | % | 93.1 | % |
|
|
|
|
|
|
|
|
|
|
|
|
|
|
| New York |
|
|
|
| |
|
|
|
|
| 365 S Randolphville Road | Data Center | 264,792 |
| 86,656 |
| — |
| $ | 27,044 |
| 94.2 | % | 94.1 | % |
| 111 Eighth Avenue (9) | Internet Gateway | 116,843 |
| — |
| — |
| 24,395 |
| 100.0 | % | 100.0 | % |
| 3 Corporate Place | Data Center | 276,931 |
| — |
| — |
| 19,764 |
| 100.0 | % | 100.0 | % |
| 60 & 80 Merritt Boulevard | Data Center | 210,168 |
| — |
| 17,598 |
| 17,667 |
| 95.3 | % | 93.8 | % |
| 300 Boulevard East | Data Center | 346,819 |
| — |
| 22,962 |
| 17,173 |
| 93.8 | % | 93.7 | % |
| 410 Commerce Boulevard (10) | Data Center | 27,943 |
| — |
| — |
| 5,217 |
| 100.0 | % | 100.0 | % |
| 701 Union Boulevard | Data Center | — |
| — |
| — |
| 30 |
| — | % | N/A |
|
| 650 Randolph Road | Data Center | — |
| — |
| 127,790 |
| — |
| — | % | N/A |
|
| 3 Corporate Place Annex | Data Center | — |
| 100,515 |
| — |
| — |
| — | % | N/A |
|
| Total |
| 1,243,496 |
| 187,171 |
| 168,350 |
| $ | 111,290 |
| 96.2 | % | 96.0 | % |
|
|
|
|
|
|
|
|
|
|
|
|
|
|
| Northern Virginia |
|
|
|
|
|
|
|
|
|
|
|
|
|
| 43940 Digital Loudoun Plaza (Bldg G) | Data Center | 257,663 |
| 135,048 |
| — |
| $ | 26,500 |
| 100.0 | % | 100.0 | % |
| 43881 Devin Shafron Drive (Bldg B) | Data Center | 180,000 |
| — |
| — |
| 17,794 |
| 99.0 | % | 99.0 | % |
| 43791 Devin Shafron Drive (Bldg D) | Data Center | 135,000 |
| — |
| — |
| 12,461 |
| 99.8 | % | 100.0 | % |
| 43830 Devin Shafron Drive (Bldg F) | Data Center | 101,300 |
| — |
| 11,950 |
| 11,858 |
| 95.6 | % | 95.6 | % |
| 4050 Lafayette Center Drive | Data Center | 42,374 |
| — |
| — |
| 7,061 |
| 99.0 | % | 99.0 | % |
| 4030 Lafayette Center Drive | Data Center | 72,696 |
| — |
| — |
| 5,953 |
| 100.0 | % | 100.0 | % |
| 45901 & 45845 Nokes Boulevard | Data Center | 167,160 |
| — |
| — |
| 4,893 |
| 100.0 | % | 100.0 | % |
| 44470 Chilum Place | Data Center | 95,440 |
| — |
| — |
| 4,529 |
| 100.0 | % | 100.0 | % |
| 4040 Lafayette Center Drive | Data Center | 30,339 |
| — |
| — |
| 3,924 |
| 100.0 | % | N/A |
|
| 21110 Ridgetop Circle | Data Center | 135,513 |
| — |
| — |
| 3,095 |
| 100.0 | % | 100.0 | % |
| 21561 & 21571 Beaumeade Circle | Data Center | 164,453 |
| — |
| — |
| 3,019 |
| 100.0 | % | 100.0 | % |
| 1506 Moran Road | Data Center | 78,295 |
| — |
| — |
| 2,370 |
| 100.0 | % | 100.0 | % |
| 44060 Digital Loudoun Plaza (Bldg K) | Data Center | 36,775 |
| 247,688 |
| — |
| 1,963 |
| 76.5 | % | N/A |
|
| 1807 Michael Faraday Court | Data Center | 19,237 |
| — |
| — |
| 1,848 |
| 100.0 | % | 100.0 | % |
| 251 Exchange Place | Data Center | 70,982 |
| — |
| — |
| 1,740 |
| 100.0 | % | 100.0 | % |
| 43831 Devin Shafron Drive (Bldg C) | Data Center | 117,071 |
| — |
| — |
| 1,609 |
| 100.0 | % | 100.0 | % |
| 8100 Boone Boulevard (11) | Data Center | 17,015 |
| — |
| — |
| 641 |
| 24.8 | % | 24.3 | % |
| Total |
| 1,721,313 |
| 382,736 |
| 11,950 |
| $ | 111,258 |
| 98.3 | % | 98.9% |
|
|
| | |
| Occupancy Analysis | | Financial Supplement |
| Dollars in thousands | Third Quarter 2014 |
|
| | | | | | | | | | | | | | |
| | | | | | | Occupancy (5) |
| Property | Property Type | Net Rentable Square Feet (1) | Space Under Active Development (2) | Space Held for Development (3) | Annualized
Rent (4) | As of 9/30/14 | As of 6/30/14 |
|
|
|
|
|
|
|
|
|
|
|
|
|
|
| Silicon Valley |
|
|
|
|
|
|
|
|
|
|
|
|
|
| 1350 Duane & 3080 Raymond | Data Center | 185,000 |
| — |
| — |
| $ | 10,875 |
| 100.0 | % | 100.0 | % |
| 3011 Lafayette Street | Data Center | 90,780 |
| — |
| — |
| 10,869 |
| 100.0 | % | 100.0 | % |
| 1100 Space Park Drive | Internet Gateway | 165,297 |
| — |
| — |
| 9,925 |
| 100.0 | % | 92.7 | % |
| 1500 Space Park Drive | Data Center | 51,615 |
| — |
| — |
| 9,893 |
| 100.0 | % | 100.0 | % |
| 3105 and 3205 Alfred Street | Data Center | 49,858 |
| — |
| — |
| 9,060 |
| 92.8 | % | 92.8 | % |
| 1525 Comstock Street | Data Center | 42,385 |
| — |
| — |
| 9,049 |
| 100.0 | % | 100.0 | % |
| 2045 & 2055 LaFayette Street | Data Center | 300,000 |
| — |
| — |
| 7,380 |
| 100.0 | % | 100.0 | % |
| 1725 Comstock Street | Data Center | 39,643 |
| — |
| — |
| 7,088 |
| 100.0 | % | 100.0 | % |
| 150 South First Street | Data Center | 179,761 |
| — |
| — |
| 6,559 |
| 95.1 | % | 97.2 | % |
| 2805 Lafayette Street (12) | Data Center | 69,843 |
| 48,137 |
| 19,440 |
| 6,267 |
| 92.5 | % | 86.6 | % |
| 1201 Comstock Street | Data Center | 24,000 |
| — |
| — |
| 4,877 |
| 100.0 | % | 100.0 | % |
| 2334 Lundy Place | Data Center | 130,752 |
| — |
| — |
| 4,661 |
| 100.0 | % | 100.0 | % |
| 2401 Walsh Street | Data Center | 167,932 |
| — |
| — |
| 3,950 |
| 100.0 | % | 100.0 | % |
| 2403 Walsh Street | Data Center | 103,940 |
| — |
| — |
| 2,445 |
| 100.0 | % | 100.0 | % |
| Total |
| 1,600,806 |
| 48,137 |
| 19,440 |
| $ | 102,898 |
| 98.9 | % | 98.2 | % |
|
|
|
|
|
|
|
|
|
|
|
|
|
| Chicago |
|
|
|
|
|
|
|
|
|
|
|
|
|
| 350 E Cermak Road | Internet Gateway | 1,133,739 |
| — |
| — |
| $ | 72,274 |
| 98.9 | % | 98.9 | % |
| 9333, 9355, 9377 Grand Avenue | Data Center | 127,970 |
| 232,708 |
| 175,046 |
| 9,481 |
| 80.3 | % | 94.9 | % |
| 600-780 S. Federal | Internet Gateway | 142,283 |
| — |
| 19,264 |
| 7,718 |
| 89.3 | % | 86.7 | % |
| Total |
| 1,403,992 |
| 232,708 |
| 194,310 |
| $ | 89,473 |
| 96.3 | % | 97.4 | % |
|
|
|
|
|
|
|
|
|
|
|
|
|
| San Francisco |
|
|
|
|
|
|
|
|
|
|
|
|
|
| 200 Paul Avenue | Internet Gateway | 466,912 |
| 14,659 |
| 18,522 |
| $ | 27,675 |
| 91.6 | % | 91.9 | % |
| 365 Main Street | Internet Gateway | 226,981 |
| — |
| — |
| 27,386 |
| 73.5 | % | 73.8 | % |
| 720 2nd Street | Data Center | 121,220 |
| — |
| — |
| 17,050 |
| 93.0 | % | 92.7 | % |
| 360 Spear Street | Data Center | 154,950 |
| — |
| — |
| 7,821 |
| 100.0 | % | 100.0 | % |
| Total |
| 970,063 |
| 14,659 |
| 18,522 |
| $ | 79,932 |
| 88.9 | % | 89.1 | % |
|
| | |
| Occupancy Analysis | | Financial Supplement |
| Dollars in thousands | Third Quarter 2014 |
|
| | | | | | | | | | | | | | |
| | | | | | | Occupancy (5) |
| Property | Property Type | Net Rentable Square Feet (1) | Space Under Active Development (2) | Space Held for Development (3) | Annualized
Rent (4) | As of 9/30/14 | As of 6/30/14 |
|
|
|
|
|
|
|
|
|
|
|
|
|
|
| Phoenix |
|
|
|
|
|
|
|
|
|
|
|
|
|
| 2121 South Price Road | Data Center | 508,173 |
| — |
| — |
| $ | 47,362 |
| 75.1 | % | 75.5 | % |
| 120 E. Van Buren | Internet Gateway | 287,514 |
| — |
| — |
| 21,958 |
| 88.8 | % | 88.1 | % |
| 2055 East Technology Circle | Data Center | 76,350 |
| — |
| — |
| 7,840 |
| 89.7 | % | 89.7 | % |
| 1900 S. Price Road | Data Center | 118,348 |
| — |
| 108,926 |
| 1,450 |
| 100.0 | % | 100.0 | % |
| Total |
| 990,385 |
| — |
| 108,926 |
| $ | 78,610 |
| 83.2 | % | 83.2 | % |
|
|
|
|
|
|
|
|
|
|
|
|
|
|
| Boston |
|
|
|
|
|
|
|
|
|
|
|
|
|
| 128 First Avenue | Data Center | 274,750 |
| — |
| — |
| $ | 23,752 |
| 95.8 | % | 97.0 | % |
| 55 Middlesex Turnpike | Data Center | 101,067 |
| — |
| — |
| 12,420 |
| 96.4 | % | 99.3 | % |
| 100 Quannapowitt Parkway | Data Center | 308,703 |
| — |
| 78,253 |
| 8,673 |
| 87.5 | % | 87.7 | % |
| 115 Second Avenue | Data Center | 66,730 |
| — |
| — |
| 3,985 |
| 100.0 | % | 100.0 | % |
| 105 Cabot Street | Data Center | 34,526 |
| — |
| 71,205 |
| 2,856 |
| 66.4 | % | 59.1 | % |
| 600 Winter Street | Data Center | 30,400 |
| — |
| — |
| 775 |
| 100.0 | % | 100.0 | % |
| Total |
| 816,176 |
| — |
| 149,458 |
| $ | 52,461 |
| 92.0 | % | 92.5 | % |
|
|
|
|
|
|
|
|
|
|
|
|
|
|
| Los Angeles |
|
|
|
|
|
|
|
|
|
|
|
|
|
| 600 West Seventh Street | Internet Gateway | 489,722 |
| — |
| — |
| $ | 24,090 |
| 98.1 | % | 98.1 | % |
| 2260 East El Segundo Boulevard | Data Center | 132,240 |
| — |
| — |
| 10,901 |
| 85.5 | % | 85.5 | % |
| 200 North Nash Street | Data Center | 113,606 |
| — |
| — |
| 2,672 |
| 100.0 | % | 100.0 | % |
| 3015 Winona Avenue | Data Center | 82,911 |
| — |
| — |
| 1,740 |
| 100.0 | % | 100.0 | % |
| 3300 East Birch Street | Data Center | 68,807 |
| — |
| — |
| 1,641 |
| 100.0 | % | 100.0 | % |
| Total |
| 887,286 |
| — |
| — |
| $ | 41,044 |
| 96.8 | % | 96.8 | % |
|
|
|
|
|
|
|
|
|
|
|
|
|
| Houston |
|
|
|
|
|
|
|
|
|
|
|
|
|
| Digital Houston | Data Center | 404,799 |
| — |
| 22,722 |
| $ | 16,722 |
| 91.0 | % | 91.0 | % |
| Total |
| 404,799 |
| — |
| 22,722 |
| $ | 16,722 |
| 91.0 | % | 91.0 | % |
|
|
|
|
|
|
|
|
|
|
|
|
|
|
| Atlanta |
|
|
|
|
|
|
|
|
|
|
|
|
|
| 375 Riverside Parkway | Data Center | 250,191 |
| — |
| — |
| $ | 8,586 |
| 100.0 | % | 100.0 | % |
| 760 Doug Davis Drive | Data Center | 334,306 |
| — |
| — |
| 6,549 |
| 99.9 | % | 100.0 | % |
| 101 Aquila Way | Data Center | 313,581 |
| — |
| — |
| 1,459 |
| 100.0 | % | 100.0 | % |
| Total |
| 898,078 |
| — |
| — |
| $ | 16,594 |
| 100.0 | % | 100.0 | % |
| | | | | | | | |
| Philadelphia |
|
|
|
|
|
|
|
|
|
|
|
| 833 Chestnut Street | Data Center | 642,981 |
| — |
| 62,080 |
| $ | 14,511 |
| 94.2 | % | 94.8 | % |
| Total |
| 642,981 |
| — |
| 62,080 |
| $ | 14,511 |
| 94.2 | % | 94.8 | % |
|
|
|
|
|
|
|
|
|
|
|
|
| Denver |
|
|
|
|
|
|
|
|
|
|
|
| 11900 East Cornell Avenue | Data Center | 285,840 |
| — |
| — |
| $ | 6,454 |
| 94.3 | % | 94.3 | % |
| 8534 Concord Center Drive | Data Center | 85,660 |
| — |
| — |
| 3,898 |
| 100.0 | % | 100.0 | % |
| Total |
| 371,500 |
| — |
| — |
| $ | 10,352 |
| 95.6 | % | 95.6 | % |
|
|
|
|
|
|
|
|
|
|
|
|
| St. Louis |
|
|
|
|
|
|
|
|
|
|
|
| 210 N Tucker Boulevard | Data Center | 258,269 |
| — |
| 77,778 |
| $ | 5,285 |
| 61.2 | % | 61.1 | % |
| 900 Walnut Street | Internet Gateway | 105,776 |
| — |
| 6,490 |
| 4,869 |
| 96.3 | % | 95.8 | % |
| Total |
| 364,045 |
| — |
| 84,268 |
| $ | 10,154 |
| 71.4 | % | 71.2 | % |
|
|
|
|
|
|
|
|
|
|
|
|
| Portland |
|
|
|
|
|
|
|
|
|
|
|
| 3825 NW Aloclek Place | Data Center | 48,574 |
| — |
| — |
| $ | 8,000 |
| 100.0 | % | 100.0 | % |
| Total |
| 48,574 |
| — |
| — |
| $ | 8,000 |
| 100.0 | % | 100.0 | % |
|
| | |
| Occupancy Analysis | | Financial Supplement |
| Dollars in thousands | Third Quarter 2014 |
|
| | | | | | | | | | | | | | |
| | | | | | | Occupancy (5) |
| Property | Property Type | Net Rentable Square Feet (1) | Space Under Active Development (2) | Space Held for Development (3) | Annualized
Rent (4) | As of 9/30/14 | As of 6/30/14 |
|
|
|
|
|
|
|
|
|
|
|
|
| Austin |
|
|
|
|
|
|
|
|
|
|
|
| 7500 Metro Center Drive | Data Center | 60,345 |
| — |
| 25,343 |
| $ | 3,833 |
| 42.2 | % | 41.0 | % |
| 7401 E. Ben White Blvd Building 7 - 9 | Data Center | 203,235 |
| — |
| — |
| 1,908 |
| 100.0 | % | 100.0 | % |
| 8025 North Interstate 35 | Data Center | 62,237 |
| — |
| — |
| 934 |
| 100.0 | % | 100.0 | % |
| 7620 Metro Center Drive | Data Center | 40,836 |
| — |
| — |
| 345 |
| 63.6 | % | 69.6 | % |
| Total |
| 366,653 |
| — |
| 25,343 |
| $ | 7,020 |
| 86.4 | % | 86.9 | % |
|
|
|
|
|
|
|
|
|
|
|
|
| Toronto, Canada |
|
|
|
|
|
|
|
| 371 Gough Road | Data Center | 41,393 |
| 26,524 |
| 29,859 |
| $ | 3,675 |
| 100.0 | % | 100.0 | % |
| 6800 Millcreek Drive | Data Center | 83,758 |
| — |
| — |
| 2,135 |
| 100.0 | % | 100.0 | % |
| Total |
| 125,151 |
| 26,524 |
| 29,859 |
| $ | 5,810 |
| 100.0 | % | 100.0 | % |
|
|
|
|
|
|
|
|
|
|
|
|
| Sacramento |
|
|
|
|
|
|
|
|
|
|
|
| 11085 Sun Center Drive | Data Center | 69,048 |
| — |
| — |
| $ | 2,964 |
| 100.0 | % | 100.0 | % |
| 3065 Gold Camp Drive | Data Center | 40,394 |
| — |
| 23,397 |
| 2,778 |
| 100.0 | % | 100.0 | % |
| Total |
| 109,442 |
| — |
| 23,397 |
| $ | 5,742 |
| 100.0 | % | 100.0 | % |
|
|
|
|
|
|
|
|
|
|
|
|
| Miami |
|
|
|
|
|
|
|
|
|
|
|
| 36 NE 2nd Street | Internet Gateway | 162,140 |
| — |
| — |
| $ | 4,576 |
| 86.1 | % | 86.1 | % |
| 2300 NW 89th Place | Data Center | 64,174 |
| — |
| — |
| 714 |
| 100.0 | % | 100.0 | % |
| Total |
| 226,314 |
| — |
| — |
| $ | 5,290 |
| 90.0 | % | 90.0 | % |
|
|
|
|
|
|
|
|
|
|
|
| Minneapolis/St. Paul |
|
|
|
|
|
|
|
|
|
|
|
| 1500 Towerview Road | Data Center | 328,765 |
| — |
| — |
| $ | 4,571 |
| 100.0 | % | 100.0 | % |
| 1125 Energy Park Drive | Data Center | 78,164 |
| — |
| — |
| 407 |
| 22.2 | % | 22.2 | % |
| Total |
| 406,929 |
| — |
| — |
| $ | 4,978 |
| 85.1 | % | 85.1 | % |
|
|
|
|
|
|
|
|
| Charlotte |
|
|
|
|
|
|
|
|
|
|
|
| 125 North Myers | Internet Gateway | 25,402 |
| — |
| — |
| $ | 1,442 |
| 100.0 | % | 100.0 | % |
| 731 East Trade Street | Internet Gateway | 40,879 |
| — |
| — |
| 1,391 |
| 100.0 | % | 100.0 | % |
| 113 North Myers | Internet Gateway | 29,218 |
| — |
| — |
| 973 |
| 100.0 | % | 100.0 | % |
| Total |
| 95,499 |
| — |
| — |
| $ | 3,806 |
| 100.0 | % | 100.0 | % |
|
| | |
| Occupancy Analysis | | Financial Supplement |
| Dollars in thousands | Third Quarter 2014 |
|
| | | | | | | | | | | | | | |
| | | | | | | Occupancy (5) |
| Property | Property Type | Net Rentable Square Feet (1) | Space Under Active Development (2) | Space Held for Development (3) | Annualized
Rent (4) | As of 9/30/14 | As of 6/30/14 |
| EUROPE |
|
|
|
|
|
|
|
|
|
|
|
|
|
|
|
|
|
|
|
| London, England |
|
|
|
|
|
|
|
|
|
| Unit 21 Goldsworth Park Trading Estate | Data Center | 378,914 |
| — |
| 101,086 |
| $ | 58,825 |
| 98.8 | % | 98.7 | % |
| Watford (13) | Data Center | 133,000 |
| — |
| — |
| 22,172 |
| 97.3 | % | 97.3 | % |
| 3 St. Anne's Boulevard | Data Center | 96,147 |
| — |
| — |
| 19,245 |
| 87.9 | % | 84.9 | % |
| Croydon (14) | Data Center | 120,000 |
| — |
| — |
| 16,661 |
| 100.0 | % | 100.0 | % |
| Mundells Roundabout | Data Center | 113,464 |
| — |
| — |
| 8,515 |
| 100.0 | % | 100.0 | % |
| Cressex 1 | Data Center | 50,847 |
| — |
| — |
| 7,871 |
| 100.0 | % | 100.0 | % |
| Fountain Court | Data Center | 43,468 |
| 40,000 |
| 48,303 |
| 5,274 |
| 79.6 | % | 73.1 | % |
| 2 St. Anne's Boulevard | Data Center | 30,612 |
| — |
| — |
| 3,946 |
| 100.0 | % | 100.0 | % |
| 1 St. Anne's Boulevard | Data Center | 20,219 |
| — |
| — |
| 302 |
| 100.0 | % | 100.0 | % |
| Principal Park, Crawley | Data Center | — |
| 106,400 |
| — |
| — |
| — | % | N/A |
|
| Total |
| 986,671 |
| 146,400 |
| 149,389 |
| $ | 142,811 |
| 97.1 | % | 96.5 | % |
|
|
|
|
|
|
|
|
|
|
| Paris, France |
|
|
|
|
|
|
|
|
|
| 114 Rue Ambroise Croizat | Internet Gateway | 360,920 |
| — |
| — |
| $ | 21,205 |
| 96.0 | % | 96.0 | % |
| 1 Rue Jean-Pierre | Data Center | 104,666 |
| — |
| — |
| 4,531 |
| 100.0 | % | 100.0 | % |
| 127 Rue de Paris | Data Center | 59,991 |
| — |
| — |
| 1,942 |
| 100.0 | % | 100.0 | % |
| Liet-dit ie Christ de Saclay | Data Center | 21,337 |
| — |
| — |
| 647 |
| 100.0 | % | 100.0 | % |
| Total |
| 546,914 |
| — |
| — |
| $ | 28,325 |
| 97.4 | % | 97.4 | % |
|
|
|
|
|
|
|
|
|
|
| Dublin, Ireland |
|
|
|
|
|
|
|
|
|
| Unit 9 Blanchardstown Corporate Center | Data Center | 120,000 |
| — |
| — |
| $ | 10,142 |
| 94.1 | % | 95.2 | % |
| Clonshaugh Industrial Estate (Eircom) | Data Center | 124,500 |
| — |
| — |
| 8,587 |
| 100.0 | % | 100.0 | % |
| Clonshaugh Industrial Estate IE | Data Center | 20,000 |
| — |
| — |
| 1,537 |
| 100.0 | % | 100.0 | % |
| Profile Park | Data Center | 19,662 |
| — |
| 27,430 |
| — |
| — | % | N/A |
|
| Total |
| 284,162 |
| — |
| 27,430 |
| $ | 20,266 |
| 90.6 | % | 97.8 | % |
|
|
|
|
|
|
|
|
|
|
| Amsterdam, Netherlands |
|
|
|
|
|
|
|
|
|
| Paul van Vlissingenstraat 16 | Data Center | 112,472 |
| — |
| — |
| $ | 7,296 |
| 100.0 | % | 100.0 | % |
| Cateringweg 5 | Data Center | 55,972 |
| — |
| — |
| 5,315 |
| 100.0 | % | 100.0 | % |
| Naritaweg 52 | Data Center | 63,260 |
| — |
| — |
| 2,603 |
| 100.0 | % | 100.0 | % |
| Liverpoolweg 10 - The Netherlands | Data Center | 29,986 |
| — |
| — |
| 1,343 |
| 100.0 | % | 100.0 | % |
| Gyroscoopweg 2E-2F | Data Center | 55,585 |
| — |
| — |
| 1,233 |
| 100.0 | % | 100.0 | % |
| De President Business Park | Technology Office | — |
| — |
| — |
| — |
| — | % | N/A |
|
| Total |
| 317,275 |
| — |
| — |
| $ | 17,790 |
| 100.0 | % | 100.0 | % |
|
|
|
|
|
|
|
|
|
|
| Manchester, England |
|
|
|
|
|
|
|
|
|
| Manchester Technopark | Data Center | 38,016 |
| — |
| — |
| $ | 1,946 |
| 100.0 | % | 100.0 | % |
| Total |
| 38,016 |
| — |
| — |
| $ | 1,946 |
| 100.0 | % | 100.0 | % |
|
|
|
|
|
|
|
|
|
|
| Geneva, Switzerland |
|
|
|
|
|
|
|
|
|
| Chemin de l Epinglier 2 | Data Center | 59,190 |
| — |
| — |
| $ | 1,698 |
| 100.0 | % | 100.0 | % |
| Total |
| 59,190 |
| — |
| — |
| $ | 1,698 |
| 100.0 | % | 100.0 | % |
|
|
|
|
|
|
|
|
|
|
| ASIA PACIFIC |
|
|
|
|
|
|
|
|
|
|
|
|
|
|
|
|
|
|
|
| Singapore |
|
|
|
|
|
|
|
|
|
| 29A International Business Park | Data Center | 298,172 |
| 50,425 |
| 21,903 |
| $ | 33,212 |
| 86.6 | % | 89.2 | % |
| Total |
| 298,172 |
| 50,425 |
| 21,903 |
| $ | 33,212 |
| 86.6 | % | 89.2 | % |
|
|
|
|
|
|
|
|
|
|
| Melbourne |
|
|
|
|
|
|
|
|
|
| 98 Radnor Drive | Data Center | 52,988 |
| — |
| — |
| $ | 6,939 |
| 100.0 | % | 100.0 | % |
| Deer Park 2 (72 Radnor Drive) | Data Center | 43,649 |
| 12,553 |
| 37,380 |
| 4,280 |
| 68.4 | % | 9.2 | % |
| Total |
| 96,637 |
| 12,553 |
| 37,380 |
| $ | 11,219 |
| 85.7 | % | 60.9 | % |
|
|
|
|
|
|
|
|
|
|
| Sydney |
|
|
|
|
|
|
|
|
|
| 1-11 Templar Road (15) | Data Center | 40,794 |
| — |
| 45,423 |
| $ | 5,553 |
| 80.4 | % | 71.9 | % |
| 23 Waterloo Road | Data Center | 51,990 |
| — |
| — |
| 1,210 |
| 100.0 | % | 100.0 | % |
| Total |
| 92,784 |
| — |
| 45,423 |
| $ | 6,763 |
| 91.4 | % | 88.1 | % |
|
| | |
| Occupancy Analysis | | Financial Supplement |
| Dollars in thousands | Third Quarter 2014 |
|
| | | | | | | | | | | | | | |
| | | | | | | Occupancy (5) |
| Property | Property Type | Net Rentable Square Feet (1) | Space Under Active Development (2) | Space Held for Development (3) | Annualized
Rent (4) | As of 9/30/14 | As of 6/30/14 |
| NON-DATACENTER PROPERTIES |
|
|
|
|
|
|
|
|
|
|
|
|
|
|
|
|
|
|
|
| 34551 Ardenwood Boulevard | Technology Manufacturing | 307,657 |
| — |
| — |
| $ | 4,629 |
| 50.6 | % | 41.6 | % |
| 2010 East Centennial Circle | Technology Manufacturing | 113,405 |
| — |
| — |
| 3,194 |
| 100.0 | % | 100.0 | % |
| 1 Savvis Parkway | Technology Office | 156,000 |
| — |
| — |
| 3,042 |
| 100.0 | % | 100.0 | % |
| 8201 E. Riverside Drive Building 4 - 6 | Technology Manufacturing | 133,460 |
| — |
| — |
| 1,039 |
| 85.6 | % | 85.6% |
|
| 908 Quality Way | Technology Office | 14,400 |
| — |
| — |
| — |
| 86.1 | % | 86.1 | % |
| 47700 Kato Road & 1055 Page Avenue | Technology Manufacturing | 199,352 |
| — |
| — |
| — |
| — | % | — | % |
| Total |
| 924,274 |
| — |
| — |
| $ | 11,904 |
| 59.7 | % | 56.7 | % |
|
|
|
|
|
|
|
|
|
|
| Consolidated Portfolio Total/Weighted Average |
| 20,130,405 |
| 1,253,692 |
| 1,247,686 |
| $ | 1,174,667 |
| 92.5 | % | 92.3 | % |
|
|
|
|
|
|
|
|
|
|
| MANAGED UNCONSOLIDATED JOINT VENTURES |
|
|
|
|
|
|
|
|
|
|
|
|
|
|
|
|
|
|
|
| Northern Virginia |
|
|
|
|
|
|
|
|
|
| 43915 Devin Shafron Drive (Bldg A) | Data Center | 132,280 |
| — |
| — |
| $ | 17,043 |
| 100.0 | % | 100.0 | % |
| 43790 Devin Shafron Drive (Bldg E) | Data Center | 152,138 |
| — |
| — |
| 3,325 |
| 100.0 | % | 100.0 | % |
| 21551 Beaumeade Circle | Data Center | 152,504 |
| — |
| — |
| 2,150 |
| 100.0 | % | 100.0 | % |
| 7505 Mason King Court | Data Center | 109,650 |
| — |
| — |
| 1,911 |
| 100.0 | % | 100.0 | % |
| Total |
| 546,572 |
| — |
| — |
| $ | 24,429 |
| 100.0 | % | 100.0 | % |
|
|
|
|
|
|
|
|
|
|
| Silicon Valley |
|
|
|
|
|
|
|
|
|
| 4650 Old Ironsides Drive | Data Center | 124,383 |
| — |
| — |
| $ | 4,173 |
| 100.0 | % | 100.0 | % |
| 2950 Zanker Road | Data Center | 69,700 |
| — |
| — |
| 3,151 |
| 100.0 | % | 100.0 | % |
| 4700 Old Ironsides Drive | Data Center | 90,139 |
| — |
| — |
| 2,120 |
| 100.0 | % | 100.0 | % |
| 444 Toyama Drive | Data Center | 42,083 |
| — |
| — |
| 2,000 |
| 100.0 | % | 100.0 | % |
| Total |
| 326,305 |
| — |
| — |
| $ | 11,444 |
| 100.0 | % | 100.0 | % |
|
|
|
|
|
|
|
|
|
|
|
| Hong Kong |
|
|
|
|
|
|
|
|
|
| 33 Chun Choi Street | Data Center | 81,464 |
| — |
| — |
| $ | 11,235 |
| 83.3 | % | 75.9 | % |
| Total |
| 81,464 |
| — |
| — |
| $ | 11,235 |
| 83.3 | % | 75.9 | % |
|
|
|
|
|
|
|
|
|
|
|
| Dallas |
|
|
|
|
|
|
|
|
|
| 14901 FAA Boulevard | Data Center | 263,700 |
| — |
| — |
| $ | 5,318 |
| 100.0 | % | 100.0 | % |
| 900 Dorothy Drive | Data Center | 56,176 |
| — |
| — |
| 1,661 |
| 100.0 | % | 100.0 | % |
| Total |
| 319,876 |
| — |
| — |
| $ | 6,979 |
| 100.0 | % | 100.0 | % |
|
|
|
|
|
|
|
|
|
|
|
| New York |
|
|
|
|
|
|
|
|
|
| 636 Pierce Street | Data Center | 108,336 |
| — |
| — |
| $ | 3,190 |
| 100.0 | % | 100.0 | % |
| Total |
| 108,336 |
| — |
| — |
| $ | 3,190 |
| 100.0 | % | 100.0 | % |
|
|
|
|
|
|
|
|
|
|
| Managed Unconsolidated Portfolio Total/Weighted Average |
| 1,382,553 |
| — |
| — |
| $ | 57,277 |
| 99.0 | % | 98.9 | % |
|
|
|
|
|
|
|
|
|
|
| Managed Portfolio Total/Weighted Average |
| 21,512,958 |
| 1,253,692 |
| 1,247,686 |
| $ | 1,231,944 |
| 92.9 | % | 92.7 | % |
|
|
|
|
|
|
|
|
|
|
| Digital Realty Share Total/Weighted Average (16) |
| 20,431,355 |
| 1,253,692 |
| 1,247,686 |
| $ | 1,189,490 |
| 92.6 | % | 92.4 | % |
|
| | |
| Occupancy Analysis | | Financial Supplement |
| Dollars in thousands | Third Quarter 2014 |
|
| | | | | | | | | | | | | | |
| | | | | | | Occupancy (5) |
| Property | Property Type | Net Rentable Square Feet (1) | Space Under Active Development (2) | Space Held for Development (3) | Annualized
Rent (4) | As of 9/30/14 | As of 6/30/14 |
|
|
|
|
|
|
|
|
|
|
| NON-MANAGED UNCONSOLIDATED JOINT VENTURES |
|
|
|
|
|
|
|
|
|
|
|
|
|
|
|
|
|
|
|
| Seattle |
|
|
|
|
|
|
|
|
|
| 2001 Sixth Avenue | Data Center | 400,369 |
| — |
| — |
| $ | 32,510 |
| 98.5 | % | 98.7 | % |
| 2020 Fifth Avenue | Data Center | 51,000 |
| — |
| — |
| 4,809 |
| 100.0 | % | 100.0 | % |
| Total |
| 451,369 |
| — |
| — |
| $ | 37,319 |
| 98.7 | % | 98.8 | % |
|
|
|
|
|
|
|
|
|
|
| Non-Managed Portfolio Total/Weighted Average |
| 451,369 |
| — |
| — |
| $ | 37,319 |
| 98.7 | % | 98.8 | % |
|
|
|
|
|
|
|
|
|
|
| Portfolio Total/Weighted Average |
| 21,964,327 |
| 1,253,692 |
| 1,247,686 |
| $ | 1,269,263 |
| 93.0 | % | 92.8 | % |
| |
| (1) | We estimate the total net rentable square feet available for lease based on a number of factors in addition to contractually leased square feet, including available power, required support space and common area. |
| |
| (2) | Space under active development includes current Base Building and Data Center projects in progress. See page 30. |
| |
| (3) | Space held for development includes space held for future Data Center development, and excludes space under active development. See page 34. |
| |
| (4) | Annualized base rent represents the monthly contractual base rent (defined as cash base rent before abatements) under existing leases as of September 30, 2014 multiplied by 12. |
| |
| (5) | Occupancy excludes space under active development and space held for development. For some of our properties, we calculate occupancy based on factors in addition to contractually leased square feet, including available power, required support space and common area. |
| |
| (6) | Building formerly referred to as 1215 Datacenter Park. |
| |
| (7) | Building was razed during Q4 2013 and added to the Land Inventory pursuant to our business plan. See page 34. |
| |
| (8) | Building formerly referred to as 1301 International Parkway. |
| |
| (9) | Includes approximately 116,843 rentable square feet from a leasehold interest acquisition. |
| |
| (10) | Includes approximately 27,943 rentable square feet from a leasehold interest acquisition. |
| |
| (11) | Includes approximately 17,105 rentable square feet from a leasehold interest acquisition. |
| |
| (12) | Building formerly referred to as 800 Central Expressway. |
| |
| (13) | Building formerly referred to as The Chess Building. |
| |
| (14) | Building formerly referred to as Unit B Prologis Park. |
| |
| (15) | Building formerly referred to as 1-23 Templar Road. |
| |
| (16) | Represents consolidated portfolio plus our managed portfolio of unconsolidated joint ventures based on our ownership percentage. |
|
| | |
| Development Lifecycle - Committed Active Development | | Financial Supplement |
| Dollars in thousands | Third Quarter 2014 |
|
| | | | | | | | | | | | | | | | | | | | | | | | | | | | | | | | | | | | | | | | | | | |
|
|
|
|
|
|
|
|
|
|
|
|
|
|
|
|
|
|
|
|
|
|
|
|
|
|
|
|
|
|
|
|
|
|
|
|
|
|
|
|
|
|
|
|
|
|
|
|
|
|
|
|
|
|
|
|
|
|
|
|
|
| Base Building Construction |
| Data Center Construction |
|
|
|
|
| Total Active Development |
|
|
|
|
|
|
|
|
|
|
|
|
|
|
|
|
|
|
|
|
|
|
|
|
|
|
|
|
|
|
|
|
|
| A |
| B |
| A + B |
|
|
|
| A |
| B |
| A + B |
|
|
|
|
|
|
| A |
| B |
| A + B |
| Market |
| # of Locations | Total Square Feet | Current Investment (1) |
| Future Funding Req. (2) |
| Total Expected Investment (3) |
| # of Locations | Total Square Feet | kW | Current Investment (1) |
| Future Funding Req. (2) |
| Total Expected Investment (3) | % Leased | Average Expected Completion Period | Est. GAAP Yield. (4) | Est. Stabilized Cash Yield (4) |
| # of Locations | Total Square Feet | Current Investment (1) |
| Future Funding Req. (2) |
| Total Expected Investment (3) |
| Chicago |
| 1 | 204,833 |
| $ | 52,549 |
|
| $ | 1,019 |
|
| $ | 53,568 |
|
| 1 | 27,875 | 2,300 | $14,322 |
| $14,280 |
| $28,601 | —% | 1Q15 |
|
|
| 1 | 232,708 |
| $ | 66,871 |
|
| $ | 15,298 |
|
| $ | 82,169 |
|
| Dallas |
|
|
|
|
|
|
| |
| 3 | 152,379 | 9,375 | 39,180 |
| 61,557 |
| 100,737 | 100.0% | 4Q15 |
|
|
| 3 | 152,379 |
| 39,180 |
|
| 61,557 |
|
| 100,737 |
|
| New York |
| 2 | 155,552 |
| 55,328 |
|
| 5,246 |
|
| 60,574 |
|
| 1 | 31,619 | 1,800 | 15,477 |
| 35,508 |
| 50,985 | 100.0% | 2Q15 |
|
|
| 2 | 187,171 |
| 70,805 |
|
| 40,755 |
|
| 111,559 |
|
| N. Virginia |
| 2 | 236,382 |
| 38,578 |
|
| 721 |
|
| 39,299 |
|
| 2 | 146,354 | 10,800 | 31,452 |
| 84,929 |
| 116,381 | 82.3% | 3Q15 |
|
|
| 2 | 382,736 |
| 70,030 |
|
| 85,650 |
|
| 155,680 |
|
| San Francisco |
|
|
|
|
|
|
|
|
| 1 | 14,659 | 1,200 | 18,439 |
| 3,943 |
| 22,381 | 100.0% | 4Q14 |
|
|
| 1 | 14,659 |
| 18,439 |
|
| 3,943 |
|
| 22,381 |
|
| Silicon Valley |
|
|
|
|
|
|
|
|
| 1 | 48,137 | 4,800 | 49,596 |
| 27,643 |
| 77,239 | 63.8% | 2Q15 |
|
|
| 1 | 48,137 |
| 49,596 |
|
| 27,643 |
|
| 77,239 |
|
| Toronto |
|
|
| |
| |
| |
| 1 | 26,524 | 2,700 | 12,592 |
| 32,840 |
| 45,432 | 100.0% | 3Q15 |
|
|
| 1 | 26,524 |
| 12,592 |
|
| 32,840 |
|
| 45,432 |
|
| North America |
| 5 | 596,767 |
| $ | 146,454 |
|
| $ | 6,986 |
|
| $ | 153,441 |
|
| 10 | 447,547 | 32,975 | $181,058 |
| $260,700 |
| $441,758 | 84.1% |
| 10.7% | 10% |
| 11 | 1,044,314 |
| $ | 327,512 |
|
| $ | 267,686 |
|
| $ | 595,198 |
|
|
|
|
|
|
|
|
|
|
|
|
|
|
|
|
|
|
|
|
|
|
|
|
|
|
|
|
|
|
|
|
|
|
|
|
|
|
|
|
|
|
|
|
|
|
|
|
|
|
|
|
|
|
|
|
|
|
|
|
|
| London |
|
|
| |
| |
| |
| 2 | 146,400 | 13,840 | 128,262 |
| 99,990 |
| 228,252 | 86.3% | 1Q17 |
|
|
| 2 | 146,400 |
| 128,262 |
|
| 99,990 |
|
| 228,252 |
|
| Europe |
|
|
|
|
|
|
|
|
| 2 | 146,400 | 13,840 | $128,262 |
| $99,990 |
| $228,252 | 86.3% |
| 11.0% | 10.2% |
| 2 | 146,400 |
| $ | 128,262 |
|
| $ | 99,990 |
|
| $ | 228,252 |
|
|
|
|
|
|
|
|
|
|
|
|
|
|
|
|
|
|
|
|
|
|
|
|
|
|
|
|
|
|
|
| Melbourne |
|
|
|
|
|
|
|
|
| 1 | 12,553 | 1,440 | $7,437 |
| $13,222 |
| $20,659 | 100.0% | 2Q15 |
|
|
| 1 | 12,553 |
| $ | 7,437 |
|
| $ | 13,222 |
|
| $ | 20,659 |
|
| Singapore |
|
|
|
|
|
|
|
|
| 1 | 50,425 | 6,000 | 56,131 |
| 22,134 |
| 78,265 | 100.0% | 4Q14 |
|
|
| 1 | 50,425 |
| 56,131 |
|
| 22,134 |
|
| 78,265 |
|
| Asia Pacific |
|
|
|
|
|
|
|
|
| 2 | 62,978 | 7,440 | $63,568 |
| $35,355 |
| $98,923 | 100.0% |
| 12.8% | 12.4% |
| 2 | 62,978 |
| $ | 63,568 |
|
| $ | 35,355 |
|
| $ | 98,923 |
|
|
|
|
|
|
|
|
|
|
|
|
|
|
|
|
|
|
|
|
|
|
|
|
|
|
|
|
|
|
|
| Total |
| 5 | 596,767 |
| $ | 146,454 |
|
| $ | 6,986 |
|
| $ | 153,441 |
|
| 14 | 656,925 | 54,255 | $372,888 |
| $396,045 |
| $768,933 | 86.1% |
| 11.1% | 10.3% |
| 15 | 1,253,692 |
| $ | 519,343 |
|
| $ | 403,031 |
|
| $ | 922,373 |
|
| |
| (1) | Represents balances incurred through September 30, 2014. |
| |
| (2) | Represents estimated cost to complete specific scope of work pursuant to contract, budget or approved capital plan. |
| |
| (3) | For Base Building construction, represents the pro rata share of the acquisition and infrastructure costs related to the specific Base Building project. For Data Center construction, represents the pro rata share of the acquisition and infrastructure costs, or Base Building construction costs, applicable to the specific Data Center project plus the total direct investment in the specific Data Center project. |
| |
| (4) | Estimated yields are based on total expected investment amounts and anticipated net operating income from leases signed or other assumptions based on market conditions. These yields are based on current estimates and actual results may vary. |
Note: Square footage is based on current estimates and project plans, and may change upon completion of the project and due to remeasurement.
|
| | |
| Development Lifecycle - In Service | | Financial Supplement |
| Dollars in thousands | Third Quarter 2014 |
|
| | | | | | | | | | | | | | | | | | | | | |
| | | Pre-Stabilized (1) |
| Market | | # of Locations | | Total Square Feet | | kW | | Total Current Investment (2) | | % Leased | | Est. GAAP Yield. (3) | | Est. Stabilized Cash Yield (3) |
| Austin | | 1 | | 34,872 |
| | 2,240 |
| | $ | 36,405 |
| | 0.0 | % | | | | |
| Boston | | 2 | | 24,042 |
| | 1,710 |
| | 23,861 |
| | 34.5 | % | | | | |
| Chicago | | 2 | | 29,019 |
| | 2,402 |
| | 38,341 |
| | 0.0 | % | | | | |
| Dallas | | 1 | | 8,375 |
| | 398 |
| | 4,401 |
| | 0.0 | % | | | | |
| Houston | | 1 | | 26,303 |
| | 2,323 |
| | 26,546 |
| | 0.0 | % | | | | |
| New York | | 3 | | 28,844 |
| | 1,936 |
| | 28,912 |
| | 2.9 | % | | | | |
| Northern Virginia | | 1 | | 8,645 |
| | 560 |
| | 6,601 |
| | 86.6 | % | | | | |
| Phoenix | | 1 | | 64,526 |
| | 4,570 |
| | 61,459 |
| | 2.2 | % | | | | |
| Silicon Valley | | 2 | | 8,848 |
| | 763 |
| | 10,826 |
| | 63.0 | % | | | | |
| St. Louis | | 1 | | 58,985 |
| | 2,506 |
| | 41,861 |
| | 0.0 | % | | | | |
| North America | | 15 | | 292,459 |
| | 19,408 |
| | $ | 279,211 |
| | 8.8 | % | | 10.2 | % | | 9.6 | % |
| | | | | | | | | | | | | | | |
| Dublin | | 1 | | 19,662 |
| | 1,920 |
| | $ | 25,194 |
| | 0.0 | % | | | | |
| London | | 2 | | 15,573 |
| | 1,153 |
| | 20,926 |
| | 0.0 | % | | | | |
| Paris | | 1 | | 12,353 |
| | 930 |
| | 11,674 |
| | 0.0 | % | | | | |
| Europe | | 4 | | 47,588 |
| | 4,003 |
| | $ | 57,794 |
| | 0.0 | % | | 11.2 | % | | 10.6 | % |
| | | | | | | | | | | | | | | |
| Melbourne | | 1 | | 13,793 |
| | 920 |
| | $ | 13,988 |
| | 0.0 | % | | | | |
| Singapore | | 1 | | 20,705 |
| | 1,566 |
| | 23,644 |
| | 0.0 | % | | | | |
| Sydney | | 1 | | 7,609 |
| | 434 |
| | 6,491 |
| | 0.0 | % | | | | |
| Asia Pacific | | 3 | | 42,107 |
| | 2,920 |
| | $ | 44,123 |
| | 0.0 | % | | 19.1 | % | | 18.0 | % |
| | | | | | | | | | | | | | | |
| Total | | 22 | | 382,154 |
| | 26,331 |
| | 381,128 |
| | 6.5 | % | | 11.4 | % | | 10.7 | % |
| |
| (1) | In service inventory requiring lease commencement. |
| |
| (2) | For Data Center construction, represents the pro rata share of the acquisition and infrastructure costs, or Base Building construction costs, applicable to the specific Data Center project plus the total direct investment in the specific Data Center project. |
| |
| (3) | Estimated yields are based on total expected investment amounts and anticipated net operating income from leases signed or other assumptions based on market conditions. These yields are based on current estimates and actual results may vary. |
Note: Square footage is based on current estimates and project plans, and may change upon completion of the project and due to remeasurement.
|
| | |
Construction Projects in Progress - Total Investments | | Financial Supplement |
| Dollars in thousands, except per square foot | Third Quarter 2014 |
|
| | | | | | | | | | | | | | | | | | | | | | |
| Construction Projects in Progress - Total Investments | | Net Rentable
Square Feet(6) | | Acreage | | Current Investment (7) | | Future Investment (8) | | Total Investment | | Total Cost/
Net Rentable Square Foot |
| Development Lifecycle | | | | | | | | | | | | |
| Land Inventory (1) | | N/A | | 178.3 |
| | $ | 146,390 |
| | — |
| | $ | 146,390 |
| | — |
|
| Development CIP | | | | | | | | | | | | |
| Space Held for Development (1) | | 1,247,686 |
| | N/A |
| | $ | 318,795 |
| | — |
| | $ | 318,795 |
| | $ | 256 |
|
| Base Building Construction (2) | | 596,767 |
| | N/A |
| | 146,454 |
| | $ | 6,986 |
| | 153,440 |
| | 257 |
|
| Data Center Construction (3) | | 656,925 |
| | N/A |
| | 372,888 |
| | 396,045 |
| | 768,933 |
| | 1,171 |
|
| Equipment Pool & Other Inventory (4) | | | | N/A |
| | 20,937 |
| | — |
| | 20,937 |
| | — |
|
| Campus, Tenant Improvements & Other (5) | | | | N/A |
| | 17,419 |
| | 4,860 |
| | 22,279 |
| | — |
|
| Total Development CIP | | 2,501,378 |
| | | | $ | 876,494 |
| | $ | 407,890 |
| | $ | 1,284,384 |
| | |
| | | | | | | | | | | | | |
| Enhancement & Other | | | | | | $ | 44,892 |
| | $ | 48,182 |
| | $ | 93,074 |
| | |
| Recurring | | | | | | 13,392 |
| | 18,455 |
| | 31,847 |
| | |
| Total Construction in Progress | | | | | | $ | 1,081,167 |
| | $ | 474,527 |
| | $ | 1,555,695 |
| | |
| |
| (1) | Land Inventory and Space Held for Development reflect cumulative cost spent pending future development. |
| |
| (2) | Base Building Construction consists of ongoing improvements to building infrastructure in preparation for future data center fit-out. |
| |
| (3) | Data Center Construction includes 656,925 square feet of Turn-Key Flex®, Custom Solutions and Powered Base Building® space. |
| |
| (4) | Equipment Pool and Other Inventory represents long-lead time equipment and materials required for timely deployment and delivery of data center fit-out. |
| |
| (5) | Represents improvements in progress as of September 30, 2014 which benefit space recently converted to our operating portfolio and is composed primarily of shared infrastructure projects and first generation tenant improvements. |
| |
| (6) | We estimate the total net rentable square feet available for lease based on a number of factors in addition to contractually leased square feet, including available power, required support space and common area. |
| |
| (7) | Represents balances incurred through September 30, 2014. |
| |
| (8) | Represents estimated cost to complete specific scope of work pursuant to contract, budget or approved capital plan. |
Note: We capitalize interest on active construction work. Base Building Construction, Data Center Construction, Equipment Pool, Campus Improvements, Enhancements and Recurring are considered active construction work.
|
| | |
Historical Capital Expenditures and Investments in Real Estate | | Financial Supplement |
| Dollars in thousands | Third Quarter 2014 |
|
| | | | | | | | | | | | | | | | | | | | | | | | | | | |
| | Three Months Ended | | Nine Months Ended |
| | 30-Sep-14 | | 30-Jun-14 | | 31-Mar-14 | | 31-Dec-13 | | 30-Sep-13 | | 30-Sep-14 | | 30-Sep-13 |
| | | | | | | | | | | | | | |
| Non-Recurring (1) | | | | | | | | | | | | | |
| Development | $ | 159,410 |
| | $ | 172,404 |
| | $ | 185,554 |
| | $ | 204,796 |
| | $ | 247,648 |
| | $ | 517,368 |
| | $ | 721,719 |
|
| Enhancements and Other Non-Recurring | 16,010 |
| | 13,955 |
| | 18,179 |
| | 32,773 |
| | 30,049 |
| | 48,144 |
| | 78,729 |
|
| Total Non-Recurring | $ | 175,420 |
| | $ | 186,359 |
| | $ | 203,733 |
| | $ | 237,569 |
| | $ | 277,697 |
| | $ | 565,512 |
| | $ | 800,448 |
|
| | | | | | | | | | | | | | |
| Recurring (2) | $ | 11,481 |
| | $ | 11,355 |
| | $ | 8,685 |
| | $ | 17,025 |
| | $ | 12,895 |
| | $ | 31,521 |
| | $ | 36,184 |
|
| Recurring | $ | 11,481 |
| | $ | 11,355 |
| | $ | 8,685 |
| | $ | 17,025 |
| | $ | 12,895 |
| | $ | 31,521 |
| | $ | 36,184 |
|
| | | | | | | | | | | | | | |
| Total Direct | $ | 186,901 |
| | $ | 197,714 |
| | $ | 212,418 |
| | $ | 254,594 |
| | $ | 290,592 |
| | $ | 597,033 |
| | $ | 836,632 |
|
| | | | | | | | | | | | | | |
| Capitalized Interest | $ | 5,406 |
| | $ | 4,889 |
| | $ | 5,311 |
| | $ | 7,435 |
| | $ | 6,882 |
| | $ | 15,606 |
| | $ | 18,842 |
|
| Capitalized Overhead | 13,348 |
| | 12,442 |
| | 11,406 |
| | 8,888 |
| | 9,661 |
| | 37,196 |
| | 29,557 |
|
| Total Indirect Capital Expenditures | $ | 18,754 |
| | $ | 17,331 |
| | $ | 16,717 |
| | $ | 16,323 |
| | $ | 16,543 |
| | $ | 52,802 |
| | $ | 48,399 |
|
| | | | | | | | | | | | | | |
| Timing / FX adjustments | 7,765 |
| | (7,946 | ) | | (5,017 | ) | | 33,789 |
| | 594 |
| | (5,198 | ) | | (227 | ) |
| | | | | | | | | | | | | | |
| Total Improvements to and Advances for Investment in Real Estate | $ | 213,420 |
| | $ | 207,099 |
| | $ | 224,118 |
| | $ | 304,706 |
| | $ | 307,729 |
| | $ | 644,637 |
| | $ | 884,804 |
|
| | | | | | | | | | | | | | |
| Consolidated Portfolio Net Rentable Square Feet (3) | 20,431,355 |
| | 20,356,935 |
| | 20,045,559 |
| | 19,887,709 |
| | 19,521,556 |
| | 20,431,355 |
| | 19,521,556 |
|
| |
| (1) | Non-recurring capital expenditures are primarily for development of space and land, excluding acquisition costs. In addition, these expenditures include certain infrequent expenditures for capitalized replacements, upgrades, or other projects which enhance the existing operating portfolio (e.g., electrical, mechanical and building upgrades). |
| |
| (2) | Recurring capital expenditures represent non-incremental building improvements required to maintain current revenues, including second-generation tenant improvements and leasing commissions. Recurring capital expenditures do not include acquisition capital that was taken into consideration when underwriting the purchase of a building, costs which are incurred to bring a building up to Digital Realty's operating standards, or internal leasing commissions. |
| |
| (3) | For some of our properties, we calculate square footage based on factors in addition to contractually leased square feet, including available power, required support space and common area. |
|
| | |
| Development Lifecycle - Held for Development | | Financial Supplement |
| Dollars in thousands | Third Quarter 2014 |
|
| | | | | | | | | | | | | | | | | | | | |
| | | Land Inventory (1) | | Space Held for Development |
| | | | | | | | | | | | | |
| Market | | # of Locations | | Acres | | Current Investment (2) | | # of Locations | | Total Square Feet | | Current Investment (2) |
| Austin | | 1 |
| | 7.2 |
| | $ | 1,879 |
| | 1 |
| | 25,343 |
| | $ | 1,303 |
|
| Boston | | — |
| | — |
| | — |
| | 2 |
| | 149,458 |
| | 43,438 |
|
| Chicago | | — |
| | — |
| | — |
| | 2 |
| | 194,310 |
| | 23,399 |
|
| Dallas | | 4 |
| | 73.2 |
| | 14,957 |
| | 3 |
| | 47,536 |
| | 8,712 |
|
| Houston | | — |
| | — |
| | — |
| | 1 |
| | 22,722 |
| | 3,072 |
|
| New York | | 1 |
| | 34.2 |
| | 41,104 |
| | 3 |
| | 168,350 |
| | 31,242 |
|
| N. Virginia | | 1 |
| | 15.6 |
| | 8,171 |
| | 1 |
| | 11,950 |
| | 2,150 |
|
| Philadelphia | | — |
| | — |
| | — |
| | 1 |
| | 62,080 |
| | 3,700 |
|
| Phoenix | | — |
| | — |
| | — |
| | 1 |
| | 108,926 |
| | 12,167 |
|
| Sacramento | | — |
| | — |
| | — |
| | 1 |
| | 23,397 |
| | 7,226 |
|
| San Francisco | | — |
| | — |
| | — |
| | 1 |
| | 18,522 |
| | 3,026 |
|
| Silicon Valley | | 2 |
| | 9.5 |
| | 14,817 |
| | 1 |
| | 19,440 |
| | 5,574 |
|
| St. Louis | | — |
| | — |
| | — |
| | 2 |
| | 84,268 |
| | 12,326 |
|
| Toronto | | — |
| | — |
| | — |
| | 1 |
| | 29,859 |
| | 6,347 |
|
| North America (3) | | 9 |
| | 139.7 |
| | $ | 80,927 |
| | 21 |
| | 966,161 |
| | $ | 163,682 |
|
| | | | | | | | | | | | | |
| Amsterdam | | 1 |
| | 5.4 |
| | $ | 13,771 |
| | — |
| | — |
| | — |
|
| Dublin | | 1 |
| | 7.5 |
| | 10,937 |
| | 1 |
| | 27,430 |
| | $ | 10,668 |
|
| London | | 1 |
| | 13.4 |
| | 24,209 |
| | 2 |
| | 149,389 |
| | 98,932 |
|
| Europe | | 3 |
| | 26.3 |
| | $ | 48,917 |
| | 3 |
| | 176,819 |
| | $ | 109,600 |
|
| | | | | | | | | | | | | |
| Melbourne | | — |
| | — |
| | $ | — |
| | 1 |
| | 37,380 |
| | $ | 7,144 |
|
| Osaka | | 1 |
| | 3.7 |
| | 12,316 |
| | — |
| | — |
| | — |
|
| Singapore | | — |
| | — |
| | — |
| | 1 |
| | 21,903 |
| | 25,407 |
|
| Sydney | | 1 |
| | 8.6 |
| | 4,230 |
| | 1 |
| | 45,423 |
| | 12,963 |
|
| Asia Pacific | | 2 |
| | 12.3 |
| | $ | 16,545 |
| | 3 |
| | 104,706 |
| | $ | 45,513 |
|
| | | | | | | | | | | | | |
| Total | | 14 |
| | 178.3 |
| | $ | 145,390 |
| | 27 |
| | 1,247,686 |
| | $ | 318,795 |
|
| |
| (1) | Represents properties acquired to support ground-up development. |
| |
| (2) | Represents balances incurred through September 30, 2014. Includes the cost of acquisition as well as cost of improvements since acquisition to prepare for future building construction. |
Note: Square footage is based on current estimates and project plans, and may change upon completion of the project and due to remeasurement.
|
| | |
| Acquisitions/ Dispositions/ Joint Ventures | | Financial Supplement |
| Dollars in thousands | Third Quarter 2014 |
|
| | | | | | | | | | | | | | | | | |
| Acquisitions: | | | | | | | | | | | | | | |
| Property | | Metropolitan Area | | Date Acquired | | Purchase Price | | Acquisition Cap Rate (1) | | Net Rentable Square Feet (2) | | Space Held For Development | | % of Total Net Rentable Square
Feet Occupied (3) |
| |
| |
| |
| |
| |
| |
| |
|
| Total |
|
|
|
|
| $0 |
|
|
| — |
|
| — |
|
| 0.0 | % |
|
| | | | | | | | | | | | | | | | | |
| Dispositions: | | | | | | | | | | | | | | |
| Property | | Metropolitan Area | | Date Sold | | Sale Price | | Disposition Cap Rate (1) | | Net Rentable Square Feet (2) | | Space Held For Development | | % of Total Net Rentable Square
Feet Occupied (3) |
| |
| |
| |
| |
| |
|
| |
|
| |
|
|
| Total |
|
|
|
|
| $0 |
|
|
| — |
|
| — |
|
| 0.0 | % |
|
| | | | | | | | | | | | | | | | | | |
| Joint Ventures: | | | | | | | | | | | | | | |
| Property | | Metropolitan Area | | Date Contributed to Joint Venture | | Contribution Price | | Contribution Cap Rate (1) | | Net Rentable Square Feet (2) | | Space Held For Development | | % of Total Net Rentable Square
Feet Occupied (3) |
| 43915 Devin Shafron Drive (Bldg A) | | Northern Virginia | | Sep 9, 2014 | | $185,500 | | 7.05 | % | | 132,280 |
| | — |
| | 100.0 | % |
| Total |
|
|
|
|
| $185,500 |
|
|
| 132,280 |
|
| — |
|
| 100.0 | % |
| |
| (1) | We calculate the cash capitalization rate on acquisitions, dispositions and joint venture contributions by dividing anticipated annual net operating income by the purchase/sale price/contribution including assumed debt and related pre-payment penalties. Net operating income represents rental revenue and tenant reimbursement revenue from in-place leases, less rental property operating and maintenance expenses, property taxes and insurance expenses, and is not a financial measure calculated in accordance with GAAP. Our calculation of the cash capitalization rate on acquisitions may change, based on our experience operating the properties subsequent to closing of the acquisitions. |
| |
| (2) | We estimate the total net rentable square feet available for lease based on a number of factors in addition to contractually leased square feet, including available power, required support space and common area. |
| |
| (3) | Occupancy excludes space under active development and space held for development. |
|
| | |
| Unconsolidated Joint Ventures ("JVs") | | Financial Supplement |
| Dollars in thousands | Third Quarter 2014 |
|
| | | | | | | | | | | | | | | | | | | |
| | | As of September 30, 2014 |
| | | 2001 Sixth Avenue | 2020 Fifth Avenue | 33 Chun Choi Street (Hong Kong) | Prudential | Griffin | Total |
| Summary Balance Sheet - at the JV's 100% Share | | | | | | | |
| Undepreciated book value of operating real estate | | $ | 118,931 |
| $ | 48,512 |
| $ | 143,519 |
| $ | 441,281 |
| $ | 185,500 |
| $ | 937,743 |
|
| Accumulated depreciation & amortization | | (80,291 | ) | (1,107 | ) | (1,750 | ) | (9,463 | ) | — |
| (92,611 | ) |
| Net Book Value of Operating Real Estate | | $ | 38,640 |
| $ | 47,405 |
| $ | 141,769 |
| $ | 431,818 |
| $ | 185,500 |
| $ | 845,132 |
|
| Other assets | | 4,623 |
| 7,324 |
| 31,209 |
| 63,988 |
| 3,831 |
| 110,975 |
|
| Total Assets | | $ | 43,263 |
| $ | 54,729 |
| $ | 172,978 |
| $ | 495,806 |
| $ | 189,331 |
| $ | 956,107 |
|
| | | | | | | | |
| Debt | | $ | 104,894 |
| $ | 47,000 |
| $ | — |
| $ | 208,000 |
| $ | 102,025 |
| $ | 461,919 |
|
| Other liabilities | | 5,527 |
| 614 |
| 18,475 |
| 89,948 |
| 2,033 |
| 116,597 |
|
| Equity / (deficit) | | (67,158 | ) | 7,115 |
| 154,503 |
| 197,858 |
| 85,273 |
| 377,591 |
|
| Total Liabilities and Equity | | $ | 43,263 |
| $ | 54,729 |
| $ | 172,978 |
| $ | 495,806 |
| $ | 189,331 |
| $ | 956,107 |
|
| | | | | | | | |
| Digital Realty's ownership percentage | | 50.0 | % | 50.0 | % | 50.0 | % | 20.0 | % | 20.0 | % | |
| | | | | | | | |
| Digital Realty's Pro Rata Share of Unconsolidated JV Debt | | $ | 52,447 |
| $ | 23,500 |
| $ | — |
| $ | 41,600 |
| $ | 20,405 |
| $ | 137,952 |
|
|
| | | | | | | | | | | | | | | | | | | |
| | | Nine Months Ended September 30, 2014 |
| Summary Statement of Operations - at the JV's 100% Share | 2001 Sixth Avenue | 2020 Fifth Avenue | 33 Chun Choi Street (Hong Kong) | Prudential | Griffin | Total |
| Rental revenue | | $ | 28,972 |
| $ | 4,198 |
| $ | 2,806 |
| $ | 27,165 |
| $ | 1,303 |
| $ | 64,444 |
|
| Straight-line rent | | 481 |
| 1,964 |
| 2,511 |
| 2,394 |
| 106 |
| 7,456 |
|
| Operating expenses | | (10,167 | ) | (757 | ) | (1,210 | ) | (4,719 | ) | (411 | ) | (17,264 | ) |
| Net Operating Income (NOI) | | $ | 19,286 |
| $ | 5,405 |
| $ | 4,107 |
| $ | 24,840 |
| $ | 998 |
| $ | 54,636 |
|
| | | | | | | | |
| Interest expense | | $ | (5,089 | ) | $ | (1,174 | ) | $ | — |
| $ | (4,026 | ) | $ | (177 | ) | $ | (10,466 | ) |
| Depreciation & amortization | | (4,762 | ) | (626 | ) | (1,907 | ) | (9,563 | ) | (13 | ) | (16,871 | ) |
| Other income / (expense) | | 1 |
| — |
| (207 | ) | (2,677 | ) | (1,065 | ) | (3,948 | ) |
| Total Non-Operating Expenses | | $ | (9,850 | ) | $ | (1,800 | ) | $ | (2,114 | ) | $ | (16,266 | ) | $ | (1,255 | ) | $ | (31,285 | ) |
| | | | | | | | |
| Net Income | | $ | 9,436 |
| $ | 3,605 |
| $ | 1,993 |
| $ | 8,574 |
| $ | (257 | ) | $ | 23,351 |
|
| | | | | | | | |
| Digital Realty's ownership percentage | | 50.0 | % | 50.0 | % | 50.0 | % | 20.0 | % | 20.0 | % |
|
| | | | | | | | |
| Digital Realty's Pro Rata Share of Unconsolidated JV NOI | | $ | 9,643 |
| $ | 2,703 |
| $ | 2,054 |
| $ | 4,968 |
| $ | 200 |
| $ | 19,568 |
|
| | | | | | | | |
| Digital Realty's Earnings (loss) from unconsolidated joint ventures (1) | | $ | 4,830 |
| $ | 1,807 |
| $ | 996 |
| $ | 1,931 |
| $ | (51 | ) | $ | 9,513 |
|
| | | | | | | | |
| Digital Realty's Pro Rata Share of FFO (2) | | $ | 7,054 |
| $ | 2,141 |
| $ | 1,950 |
| $ | 3,844 |
| $ | (48 | ) | $ | 14,941 |
|
| | | | | | | | |
| Digital Realty's Fee Income from Joint Venture | | $ | — |
| $ | — |
| $ | 1,186 |
| $ | 2,212 |
| $ | 60 |
| $ | 3,458 |
|
| |
| (1) | Values represent Digital Realty's basis and may not be comparable to values reflected in the entities' stand alone financial statements calculated on a different basis. |
| |
| (2) | For a definition of FFO, see page 42. |
|
| | |
| External Growth Pipeline | | Financial Supplement |
| Central - Chicago | Third Quarter 2014 |
Master Plan
|
| | | | | | | |
| Property Address | Sq. Ft. | IT Load MW Capacity | Leased % | Development Status |
| 9333 W. Grand Ave., Franklin Park, IL | 123,275 |
| 6.8 |
| 95.2 | % | Active development - data center |
| 9355 W. Grand Ave., Franklin Park, IL | 250,000 |
| 14.4 |
| 12.5 | % | Active development - base building and data center |
| 9377 W. Grand Ave., Franklin Park, IL | 175,000 |
| 10.8 |
| — | % | Planned for future ground-up development |
Asset
| |
| • | Digital Chicago Campus – 9333, 9355 and 9377 W. Grand Avenue, Franklin Park IL |
Background
| |
| • | In May 2012, Digital Realty acquired the three-building, 22-acre campus and created the Digital Chicago Campus. |
| |
| • | Based on strong demand for our Turn-Key Flex® data center product, as well as limited supply in the market, the first phase of construction began with the redevelopment of the 9333 W. Grand Ave. building in August 2012 to accommodate 123,275 rentable square feet and provide 6.8 MW of IT Load. |
| |
| • | As market conditions continued to show limited supply of competitive space along with strong leasing activity in phase one, redevelopment of the 9355 W. Grand Ave. building commenced in June 2013 to accommodate 250,000 rentable square feet and 14.4MW of IT Load in eight 1,800 kW data centers. |
Opportunity
| |
| • | Upon completion, the Digital Chicago Campus will have development potential of 548,275 rentable square feet to support 18 Turn-Key Flex® data centers and provide 32 MW of IT Load. |
| |
| • | Campus utility service is provided by ComEd with 60 MW delivered by multiple 34.5kV services. |
| |
| • | The 9333 W. Grand Ave. building includes four Turn-Key Flex® data centers and is 95.2% leased. |
| |
| • | The second phase, 9355 W. Grand Ave., is currently under active redevelopment, with the first 1,800 kW data center completed and leased, and the second 1,800 kW data center scheduled to deliver Q1-2015. |
| |
| • | The third phase will be a future ground-up development located where the 9377 W. Grand Ave. building is sited today. The site is planned for a 175,000 rentable square foot future development to accommodate 10.8 MW of IT Load in six 1,800 kW Turn-Key Flex® data centers. |
|
| | |
| External Growth Pipeline | | Financial Supplement |
| Central -Dallas | Third Quarter 2014 |
Master Plan
|
| | | | | | | |
| Property Address | Sq. Ft. | IT Load MW Capacity | Leased % | Development Status |
| 850 E. Collins Blvd., Richardson, TX | 121,366 |
| 6.9 |
| 92.0 | % | Completed. 0.6 MW under option expected to increase Leased % to 100% |
| 904 Quality Way, Richardson, TX | 46,750 |
| 4.5 |
| 100.0 | % | Completed |
| 1232 Alma Rd., Richardson, TX | 105,726 |
| 6.8 |
| 100.0 | % | Completed |
| 950 E. Collins Blvd., Richardson, TX | 121,286 |
| 7.2 |
| 100.0 | % | Active Development - data centers |
| 1215 Integrity Drive, Richardson, TX | 117,876 |
| 6.8 |
| 100.0 | % | Active Development - data centers |
| 900 Quality Way, Richardson, TX | 114,922 |
| 7.0 |
| 100.0 | % | Active Development - data centers |
| 907 Security Row, Richardson, TX | 139,000 |
| 8.4 |
| 0.0 | % | Active development - base building and data centers |
| 1210 Integrity Drive & 905 Security Row, Richardson, TX | 466,000 |
| 28.8 |
| 0.0 | % | Planned for future ground-up development |
| 908 Quality Way, Richardson, TX | 66,000 |
| 4.8 |
| 0.0 | % | Planned for future ground-up development |
| 750 E. Collins Boulevard, Richardson, TX | TBD |
| TBD |
| 0.0 | % | Planned for future management office |
Asset
| |
| • | Digital Dallas Campus – 70-acre master-planned property located within the renowned “Telecom Corridor” of Richardson, TX, a suburb of Dallas. |
|
| | |
| External Growth Pipeline | | Financial Supplement |
| Central -Dallas | Third Quarter 2014 |
Background
| |
| • | Originally acquired in 2009 as part of a 60/40 joint venture. Digital Realty subsequently acquired the entire ownership interest in 2011. |
| |
| • | Development has included a mix of redevelopment and ground-up construction of Powered Base Buildings® and multi-tenant data centers, and a Digital Realty owned 122 MW sub-station. |
| |
| • | In five years, Digital Realty has completed or actively developed 767,000 square feet in seven buildings. |
| |
| • | The campus has approximately 29.7 MW of IT Load currently in operation, with approximately 2.4 MW of leased data center space that is under construction and 7.0 MW of leased data center shell space pending commencement of construction. |
Opportunity
| |
| • | The campus has a little over 25 acres of land available at sites highlighted above as "Planned for Future Development" for new one and two-story ground-up development that could support four new buildings and would increase the size of the campus by another 532,000 square feet. |
| |
| • | New buildings planned for future development have the potential to add another 33.6 MW of IT Load to the Digital Dallas Data Campus. |
|
| | |
| External Growth Pipeline | | Financial Supplement |
| East- Northern Virgina | Third Quarter 2014 |
Master Plan
|
| | | | | | | |
| Property Address | Sq. Ft. | IT Load MW Capacity | Leased % | Development Status |
| 43940 Digital Loudoun Plaza (Bldg. G) | 392,711 |
| 25.7 |
| 81.5 | % | Active development - base building and data center with 4.8 MW under option and backlog expected to increase Leased % to 98% |
| 44060 Digital Loudoun Plaza (Bldg. K) | 284,436 |
| 19.2 |
| 43.3 | % | Active development - base building and data centers |
| Digital Loudoun Plaza (Bldg. H) | 244,000 |
| 14.4 |
| 0.0 | % | Planned for future ground-up development |
| Digital Loudoun Plaza (Bldg. J) | 216,000 |
| 14.4 |
| 0.0 | % | Planned for future ground-up development |
Asset
| |
| • | Existing Campus - Digital Ashburn Campus (Buildings A, B, C, D, E and F), Devin Shafron Drive, Ashburn, VA |
| |
| • | Campus Expansion – Digital Ashburn Campus (Buildings G, H, J and K), Digital Loudoun Plaza, Ashburn, VA |
Background
| |
| • | Digital Realty originally acquired three existing shell buildings (Buildings B, C and D) and developed the Digital Ashburn Campus in 2007. |
| |
| • | Based on strong demand for Turn-Key Flex® data centers in the market, the existing campus was expanded through a land acquisition in 2009 and Digital Realty developed three additional single-story buildings (Buildings A, E and F), bringing the combined existing campus to 829,739 rentable square feet. |
| |
| • | The campus was expanded in 2011 with the Loudoun Parkway North land acquisition, bringing the total campus to 98 acres. |
Opportunity
| |
| • | Loudoun Parkway North campus is master-planned for four, two-story buildings (Buildings G, K, H and J), that upon completion, will provide 1,137,147 rentable square feet to support sixty-two Turn-Key Flex® data centers capable of supporting 73.7 MW of IT Load. |
| |
| • | The site is supported by a dedicated sub-station capable of supplying 150 MW of power. |
| |
| • | Building G, the first building on the expanded campus, was designed and constructed in two phases. The first phase is complete and the data center space is 100% leased and includes 10 Turn-Key Flex® data centers which provide |
|
| | |
| External Growth Pipeline | | Financial Supplement |
| East- Northern Virgina | Third Quarter 2014 |
11.25 MW of IT Load. The second phase is under construction and will include 12 Turn-Key Flex® data centers which will provide 14.4 MW of IT Load and is currently 67.3% leased and 32.7% preleased. The combined first and second phases are 81.5% leased. Upon exercise of an existing tenant's options and commencement of backlog for 4.8 MW of Turn-Key Flex® data centers, Building G is expected to be 98% leased. The remaining 2% of vacant space relates to non-technical space expected to be absorbed by existing tenants as they occupy their suites.
| |
| • | Building K’s shell, with capacity for 16 Turn-Key Flex® data centers and 19.2 MW of IT Load, is under construction with the first phase of two Turn-Key Flex® data centers scheduled for delivery in September 2014. Building K has leased 7.9MW of IT Load which is 41% of the IT Load of the building. Including non-technical space the building is 43.3% leased. |
| |
| • | Buildings H and J are each designed to accommodate 14.4 MW of IT Load and are planned for future development based on market demand. |
|
| | |
| External Growth Pipeline | | Financial Supplement |
| East - New York | Third Quarter 2014 |
Master Plan
|
| | | | | | | |
| Property Address | Sq. Ft. | IT Load MW Capacity | Leased % | Development Status |
| 365 S. Randolphville (Existing) | 264,792 |
| 9.0 |
| 93.8 | % | Completed |
| 365 S. Randolphville (Expansion) | 86,656 |
| 5.4 |
| 33.3 | % | Active development - data centers |
| 3 Corporate Place | 276,931 |
| 3.3 |
| 100 | % | Completed |
| 3 Corporate Place Annex | 100,515 |
| 7.2 |
| 0.0 | % | Active development - data centers |
Asset
| |
| • | 3 Corporate Place, Piscataway, NJ |
| |
| • | 365 South Randolphville Road, Piscataway, NJ |
Background
| |
| • | Located in the New York metropolitan market within close proximity to Rutgers University, Digital Piscataway campus is an existing two-building campus recently expanded by 187,171 rentable square feet. |
| |
| • | Completed improvements include a 86,656 rentable square foot PBB expansion of 365 S. Randolphville Road and a free-standing 100,515 rentable square foot PBB expansion at 3 Corporate Place. 365 S. Randolphville is actively developing data centers to meet demand and 3 Corporate is ready to commence construction of data center. |
| |
| • | A private 69KV on-site substation with 2 independent feeds each capable of supporting the entire site load creates a robust supply of power for the site. |
Opportunity
| |
| • | The 86,656 rentable square foot addition to 365 S. Randolphville Road expanded the existing 264,792 rentable square foot building to 351,448 rentable square feet and provide an additional 5.4 MW of IT Load. |
| |
| • | The 100,515 rentable square foot Annex at 3 Corporate Place provided capacity to add an additional 7.2 MW of IT Load. |
| |
| • | Upon completion, the campus will be a premier, state-of-the-art facility positioned to serve the expanding requirements of the financial services industry, and take advantage of significant opportunities in the health care, telecommunications and government sectors in the New York metro area. |
|
| | |
| Reconciliation of Earnings Before Interest, Taxes, Depreciation, and Amortization and Financial Ratios | | Financial Supplement |
| Unaudited and in thousands | Third Quarter 2014 |
|
| | | | | | | | | | | | | | | |
| Reconciliation of Earnings Before Interest, Taxes, Depreciation & Amortization (EBITDA) (1) | Three Months Ended |
| 30-Sep-14 | 30-Jun-14 | 31-Mar-14 | 31-Dec-13 | 30-Sep-13 |
|
|
|
|
|
|
| Net Income Available to Common Stockholders | $ | 109,314 |
| $ | 41,510 |
| $ | 34,186 |
| $ | 42,977 |
| $ | 138,872 |
|
| Interest | 48,169 |
| 49,146 |
| 47,374 |
| 45,996 |
| 47,742 |
|
| Loss from early extinguishment of debt | 195 |
| 293 |
| 292 |
| 608 |
| 704 |
|
| Tax expense (benefit) | 1,178 |
| 1,021 |
| 1,838 |
| (473 | ) | 352 |
|
| Depreciation & amortization | 137,474 |
| 137,092 |
| 130,620 |
| 126,776 |
| 121,198 |
|
| EBITDA | $ | 296,330 |
| $ | 229,062 |
| $ | 214,310 |
| $ | 215,884 |
| $ | 308,868 |
|
| Straight-line rent expense adjustment attributable to prior periods | — |
| — |
| — |
| — |
| 9,155 |
|
| Change in fair value of contingent consideration | (1,465 | ) | 766 |
| (3,403 | ) | (1,749 | ) | (943 | ) |
| Severance accrual and equity acceleration | — |
| 260 |
| 12,430 |
| — |
| — |
|
| Impairment of investments in real estate | 12,500 |
| — |
| — |
| — |
| — |
|
| Gain on sale of property | — |
| (15,945 | ) | — |
| — |
| — |
|
| Gain on contribution of properties to unconsolidated joint venture | (93,498 | ) | — |
| (1,906 | ) | (555 | ) | (115,054 | ) |
| Noncontrolling interests | 2,392 |
| 993 |
| 805 |
| 964 |
| 2,882 |
|
| Preferred stock dividends | 18,455 |
| 18,829 |
| 11,726 |
| 11,726 |
| 11,726 |
|
| Adjusted EBITDA | $ | 234,714 |
| $ | 233,965 |
| $ | 233,962 |
| $ | 226,270 |
| $ | 216,634 |
|
|
| | | | | | | | | | | | | | | |
| Three Months Ended |
| Financial Ratios | 30-Sep-14 | 30-Jun-14 | 31-Mar-14 | 31-Dec-13 | 30-Sep-13 |
|
|
|
|
|
|
|
|
|
|
|
| Total GAAP interest expense | $ | 48,169 |
| $ | 49,146 |
| $ | 47,374 |
| $ | 45,996 |
| $ | 47,742 |
|
| Capitalized interest | 5,406 |
| 4,889 |
| 5,311 |
| 7,435 |
| 6,882 |
|
| Change in accrued interest and other non-cash amounts | 14,003 |
| (23,619 | ) | 15,139 |
| (20,423 | ) | 13,396 |
|
| Cash Interest Expense (2) | $ | 67,578 |
| $ | 30,416 |
| $ | 67,824 |
| $ | 33,008 |
| $ | 68,020 |
|
|
|
|
|
|
|
|
|
|
|
|
| Scheduled debt principal payments | 3,039 |
| 3,005 |
| 3,343 |
| 3,050 |
| 3,148 |
|
| Preferred dividends | 18,455 |
| 18,829 |
| 11,726 |
| 11,726 |
| 11,726 |
|
| Total Fixed Charges (3) | $ | 75,069 |
| $ | 75,869 |
| $ | 67,754 |
| $ | 68,207 |
| $ | 69,498 |
|
|
|
|
|
|
|
| Coverage |
|
|
|
|
|
| Interest coverage ratio (4) | 4.4x |
| 4.3x |
| 4.4x |
| 4.2x |
| 4.0x |
|
| Cash interest coverage ratio (5) | 3.5x |
| 7.7x |
| 3.4x |
| 6.9x |
| 3.2x |
|
| Fixed charge coverage ratio (6) | 3.1x |
| 3.1x |
| 3.5x |
| 3.3x |
| 3.1x |
|
| Cash fixed charge coverage ratio (7) | 2.6x |
| 4.5x |
| 2.8x |
| 4.7x |
| 2.6x |
|
|
|
|
|
|
|
| Leverage |
|
|
|
|
|
| Debt to total enterprise value (8) (9) | 32.8 | % | 34.7 | % | 38.5 | % | 40.9 | % | 38.3 | % |
| Debt plus preferred stock to total enterprise value (10) | 40.2 | % | 42.4 | % | 46.3 | % | 46.8 | % | 44.1 | % |
| Pre-tax income to interest expense (11) | 3.7x |
| 2.2x |
| 2.0x |
| 2.2x |
| 4.2x |
|
| Net Debt to Adjusted EBITDA (12) | 5.0x |
| 5.1x |
| 5.3x |
| 5.4x |
| 5.5x |
|
| |
| (1) | For definition and discussion of EBITDA and Adjusted EBITDA, see page 42. |
| |
| (2) | Cash interest expense is interest expense less amortization of debt discount and deferred financing fees and includes interest that we capitalized. We consider cash interest expense to be a useful measure of interest as it excludes non-cash based interest expense. |
| |
| (3) | Fixed charges consist of GAAP interest expense, capitalized interest, scheduled debt principal payments and preferred dividends. |
|
| | |
| Reconciliation of Earnings Before Interest, Taxes, Depreciation, and Amortization and Financial Ratios | | Financial Supplement |
| Unaudited and in thousands | Third Quarter 2014 |
| |
| (4) | Adjusted EBITDA divided by GAAP interest expense plus capitalized interest. |
| |
| (5) | Adjusted EBITDA divided by cash interest expense. |
| |
| (6) | Adjusted EBITDA divided by fixed charges. |
| |
| (7) | Adjusted EBITDA divided by the sum of cash interest expense, scheduled debt principal payments and preferred dividends. |
| |
| (8) | Mortgage debt and other loans divided by mortgage debt and other loans plus the liquidation value of preferred stock and the market value of outstanding common stock and operating partnership units, assuming the redemption of operating partnership units for shares of our common stock. |
| |
| (9) | Enterprise value defined as market value equity plus debt plus preferred stock plus minority interest less cash and equivalents. |
| |
| (10) | Same as (8), except numerator includes preferred stock. |
| |
| (11) | Calculated as net income plus interest expense divided by GAAP interest expense. |
| |
| (12) | Calculated as total debt at balance sheet carrying value (see page 6) less unrestricted cash and cash equivalents divided by the product of Adjusted EBITDA multiplied by four. |
|
| | |
| Management Statements on Non-GAAP Measures | | Financial Supplement |
| | Third Quarter 2014 |
Funds from Operations (FFO):
We calculate funds from operations, or FFO, in accordance with the standards established by the National Association of Real Estate Investment Trusts, or NAREIT. FFO represents net income (loss) (computed in accordance with GAAP), excluding gains (or losses) from sales of property, impairment charges, real estate related depreciation and amortization (excluding amortization of deferred financing costs) and after adjustments for unconsolidated partnerships and joint ventures. Management uses FFO as a supplemental performance measure because, in excluding real estate related depreciation and amortization and gains and losses from property dispositions and after adjustments for unconsolidated partnerships and joint ventures, it provides a performance measure that, when compared year over year, captures trends in occupancy rates, rental rates and operating costs. We also believe that, as a widely recognized measure of the performance of REITs, FFO will be used by investors as a basis to compare our operating performance with that of other REITs. However, because FFO excludes depreciation and amortization and captures neither the changes in the value of our properties that result from use or market conditions, nor the level of capital expenditures and capitalized leasing commissions necessary to maintain the operating performance of our properties, all of which have real economic effect and could materially impact our financial condition and results from operations, the utility of FFO as a measure of our performance is limited. Other REITs may not calculate FFO in accordance with the NAREIT definition and, accordingly, our FFO may not be comparable to such other REITs’ FFO. Accordingly, FFO should be considered only as a supplement to net income computed in accordance with GAAP as a measure of our performance.
Core Funds from Operations (CFFO):
We present core funds from operations, or CFFO, as a supplemental operating measure because, in excluding certain items that do not reflect core revenue or expense streams, it provides a performance measure that, when compared year over year, captures trends in our core business operating performance. We calculate CFFO by adding to or subtracting from FFO (i) termination fees and other non-core revenues, (ii) significant transaction expenses, (iii) loss from early extinguishment of debt, (iv) costs on redemption of preferred stock, (v) significant property tax adjustments, net and (vi) other non-core expense adjustments. Because certain of these adjustments have a real economic impact on our financial condition and results from operations, the utility of CFFO as a measure of our performance is limited. Other REITs may not calculate CFFO in a consistent manner. Accordingly, our CFFO may not be comparable to other REITs' CFFO. CFFO should be considered only as a supplement to net income computed in accordance with GAAP as a measure of our performance.
Adjusted Funds from Operations (AFFO):
We present adjusted funds from operations, or AFFO, as a supplemental operating measure because, when compared year over year, it assesses our ability to fund dividend and distribution requirements from our operating activities. We also believe that, as a widely recognized measure of the operations of REITs, AFFO will be used by investors as a basis to assess our ability to fund dividend payments in comparison to other REITs, including on a per share and unit basis. We calculate AFFO by adding to or subtracting from FFO (i) non-real estate depreciation, (ii) amortization of deferred financing costs, (iii) amortization of debt discount, (iv) non-cash compensation, (v) loss from early extinguishment of debt, (vi) straight line rents, (vii) fair value of lease revenue amortization, (viii) change in fair value of contingent consideration, (ix) capitalized leasing payroll, (x) recurring tenant improvements, (xi) capitalized leasing commissions and (xii) costs of redeeming our preferred stock. Other REITs may not calculate AFFO in a consistent manner. Accordingly, our AFFO may not be comparable to other REITs’ AFFO. AFFO should be considered only as a supplement to net income computed in accordance with GAAP as a measure of our performance.
EBITDA and Adjusted EBITDA:
We believe that earnings before interest expense, income taxes, depreciation and amortization, or EBITDA, and Adjusted EBITDA (as defined below), are useful supplemental performance measures because they allow investors to view our performance without the impact of non-cash depreciation and amortization or the cost of debt and, with respect to Adjusted EBITDA, straight-line rent expense adjustment attributable to prior periods, change in fair value of contingent consideration, severance accrual and equity acceleration, impairment of investments in real estate, gain on sale of property, gain on contribution of properties to unconsolidated joint venture, noncontrolling interests, and preferred stock dividends. Adjusted EBITDA is EBITDA excluding straight-line rent expense adjustment attributable to prior periods, change in fair value of contingent consideration, severance accrual and equity acceleration, impairment of investments in real estate, gain on sale of property, gain on contribution of properties to unconsolidated joint venture, noncontrolling interests, and preferred stock dividends. In addition, we believe EBITDA and Adjusted EBITDA are frequently used by securities analysts, investors and other interested parties in the evaluation of REITs. Because EBITDA and Adjusted EBITDA are calculated before recurring cash charges including interest expense and income taxes, exclude capitalized costs, such as leasing commissions, and are
|
| | |
| Management Statements on Non-GAAP Measures | | Financial Supplement |
| | Third Quarter 2014 |
not adjusted for capital expenditures or other recurring cash requirements of our business, their utility as a measure of our performance is limited. Other REITs may calculate EBITDA and Adjusted EBITDA differently than
we do; accordingly, our EBITDA and Adjusted EBITDA may not be comparable to such other REITs’ EBITDA and Adjusted EBITDA. Accordingly, EBITDA and Adjusted EBITDA should be considered only as supplements to net income computed in accordance with GAAP as a measure of our financial performance.
Net Operating Income (NOI) and Cash NOI:
Net operating income, or NOI, represents rental revenue and tenant reimbursement revenue less rental property operating and maintenance expenses, property taxes and insurance expenses (as reflected in the statement of operations). NOI is commonly used by stockholders, company management and industry analysts as a measurement of operating performance of the company’s rental portfolio. Cash NOI is NOI less straight-line rents and above and below market rent amortization. Cash NOI is commonly used by stockholders, company management and industry analysts as a measure of property operating performance on a cash basis. However, because NOI and cash NOI exclude depreciation and amortization and capture neither the changes in the value of our properties that result from use or market conditions, nor the level of capital expenditures and capitalized leasing commissions necessary to maintain the operating performance of our properties, all of which have real economic effect and could materially impact our results from operations, the utility of NOI and cash NOI as measures of our performance is limited. Other REITs may not calculate NOI and cash NOI in the same manner we do and, accordingly, our NOI and cash NOI may not be comparable to such other REITs’ NOI and cash NOI. Accordingly, NOI and cash NOI should be considered only as supplements to net income computed in accordance with GAAP as measures of our performance.
|
| | |
| Management Statements on Non-GAAP Measures | | Financial Supplement |
| | Third Quarter 2014 |
|
| | | |
| (Dollars in thousands) | 30-Sep-14 |
| Reconciliation of Net Operating Income (NOI) |
|
|
|
| Operating income | $ | 82,372 |
|
|
|
| Less: |
|
| Fee income | $ | (2,748 | ) |
| Other | (165 | ) |
|
|
| Add: |
|
| Construction management expenses | $ | 60 |
|
| Change in fair value of contingent consideration | (1,465 | ) |
| Depreciation and amortization | 137,474 |
|
| General and administrative | 20,709 |
|
| Severance accrual and equity acceleration | — |
|
| Transactions | 144 |
|
| Impairment in investments in real estate | 12,500 |
|
| Other | 1,588 |
|
|
|
| Net Operating Income | $ | 250,469 |
|
|
|
| Cash Net Operating Income (Cash NOI) |
|
|
|
| Net Operating Income | $ | 250,469 |
|
| Less: |
|
| Straight-line rent revenue | $ | (17,714 | ) |
| Purchase accounting adjustments | (2,370 | ) |
|
|
| Cash Net Operating Income | $ | 230,385 |
|
|
| | |
| Statement Regarding Forward- Looking Statements | | Financial Supplement |
| | Third Quarter 2014 |
This supplemental package contains forward-looking statements within the meaning of the federal securities laws, including information related to trends, our strategy and plans, leasing expectations, weighted average lease terms, the exercise of lease extensions, lease expirations, cap rates, debt maturities, annualized rent at expiration of leases, the effect new leases and increases in rental rates will have on our rental revenue, rent to be received in future periods, our credit ratings, construction and development activity and plans, projected construction costs, estimated yields on investment, supply and demand, expected occupancy, expected square footage and IT load capacity upon completion of development projects, 2014 and 2015 backlog NOI, NAV components, 2014 guidance and underlying assumptions, and other forward-looking financial data. Such statements are based on management’s beliefs and assumptions made based on information currently available to management. Such statements are subject to risks, uncertainties and assumptions and are not guarantees of future performance and may be affected by known and unknown risks, trends, uncertainties and factors that are beyond our control. Should one or more of these risks or uncertainties materialize, or should underlying assumptions prove incorrect, actual results may vary materially from those anticipated, estimated or projected. Some of the risks and uncertainties that may cause our actual results, performance or achievements to differ materially from those expressed or implied by forward-looking statements include, among others, the following:
| |
| • | the impact of current global economic, credit and market conditions |
| |
| • | current local economic conditions in our geographic markets; |
| |
| • | decreases in information technology spending, including as a result of economic slowdowns or recession; |
| |
| • | adverse economic or real estate developments in our industry or the industry sectors that we sell to (including risks relating to decreasing real estate valuations and impairment charges); |
| |
| • | our dependence upon significant tenants; |
| |
| • | bankruptcy or insolvency of a major tenant or a significant number of smaller tenants; |
| |
| • | defaults on or non-renewal of leases by tenants; |
| |
| • | our failure to obtain necessary debt and equity financing; |
| |
| • | risks associated with using debt to fund our business activities, including re-financing and interest rate risks, our failure to repay debt when due, adverse changes in our credit ratings or our breach of covenants or other terms contained in our loan facilities and agreements; |
| |
| • | financial market fluctuations; |
| |
| • | changes in foreign currency exchange rates; |
| |
| • | our inability to manage our growth effectively; |
| |
| • | difficulty acquiring or operating properties in foreign jurisdictions; |
| |
| • | our failure to successfully integrate and operate acquired or developed properties or businesses; |
| |
| • | the suitability of our properties and data center infrastructure, delays or disruptions in connectivity, failure of our physical infrastructure or services or availability of power; |
| |
| • | risks related to joint venture investments, including as a result of our lack of control of such investments; |
| |
| • | delays or unexpected costs in development of properties; |
| |
| • | decreased rental rates, increased operating costs or increased vacancy rates; |
| |
| • | increased competition or available supply of data center space; |
| |
| • | our inability to successfully develop and lease new properties and development space; |
| |
| • | difficulties in identifying properties to acquire and completing acquisitions; |
| |
| • | our inability to acquire off-market properties; |
| |
| • | our inability to comply with the rules and regulations applicable to reporting companies; |
| |
| • | our failure to maintain our status as a REIT; |
| |
| • | possible adverse changes to tax laws; |
| |
| • | restrictions on our ability to engage in certain business activities; |
| |
| • | environmental uncertainties and risks related to natural disasters; |
| |
| • | losses in excess of our insurance coverage; |
| |
| • | changes in foreign laws and regulations, including those related to taxation and real estate ownership and operation; and |
| |
| • | changes in local, state and federal regulatory requirements, including changes in real estate and zoning laws and increases in real property tax rates. |
The risks included here are not exhaustive, and additional factors could adversely affect our business and financial performance. We discussed a number of additional material risks in our annual report on Form 10-K for the year ended December 31, 2013, as amended, and other filings with the Securities and Exchange Commission. Those risks continue to be relevant to our performance and financial condition. Moreover, we operate in a very competitive and rapidly changing
|
| | |
| Statement Regarding Forward- Looking Statements | | Financial Supplement |
| | Third Quarter 2014 |
environment. New risk factors emerge from time to time and it is not possible for management to predict all such risk factors, nor can it assess the impact of all such risk factors on the business or the extent to which any factor, or combination of factors, may cause actual results to differ materially from those contained in any forward-looking statements. We expressly disclaim any responsibility to update forward-looking statements, whether as a result of new information, future events or otherwise.
Note: Certain figures are rounded to the nearest thousand or to a tenth of a percent throughout the document. Subtotals and totals may not equal the amounts reflected due to such rounding.