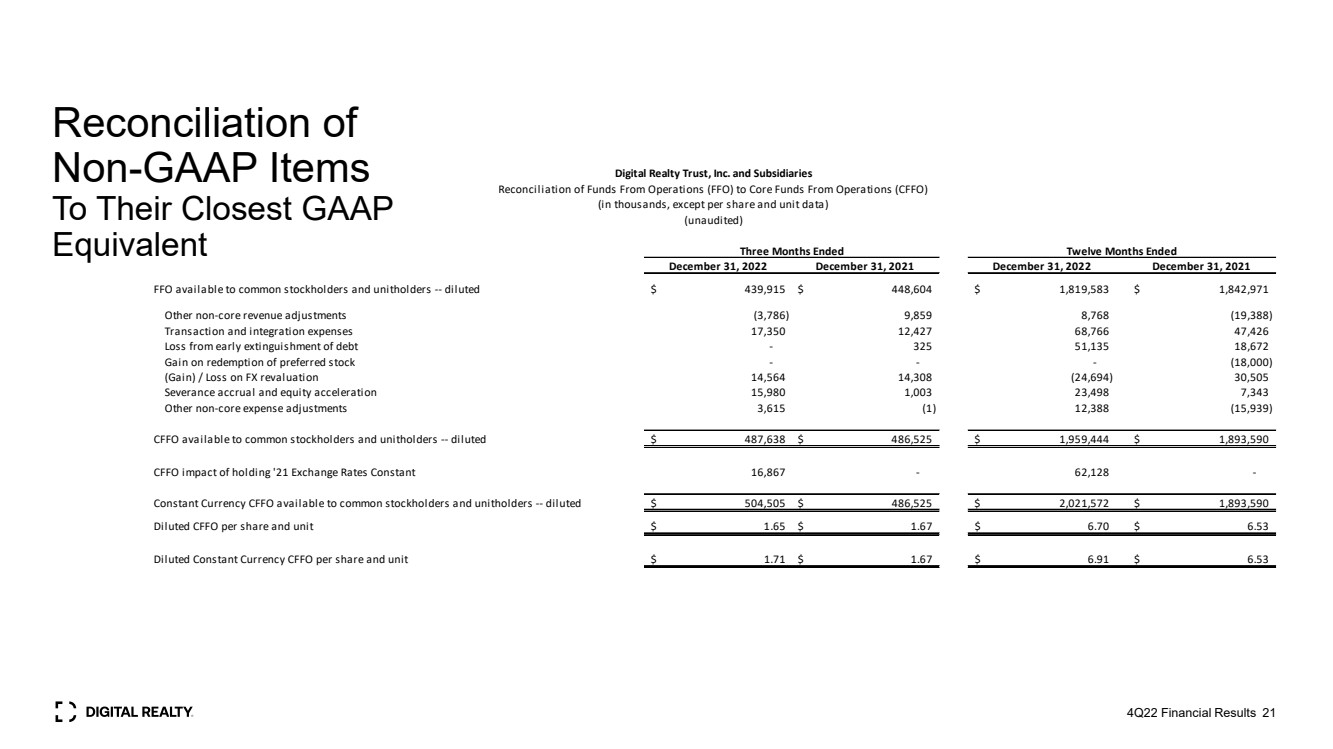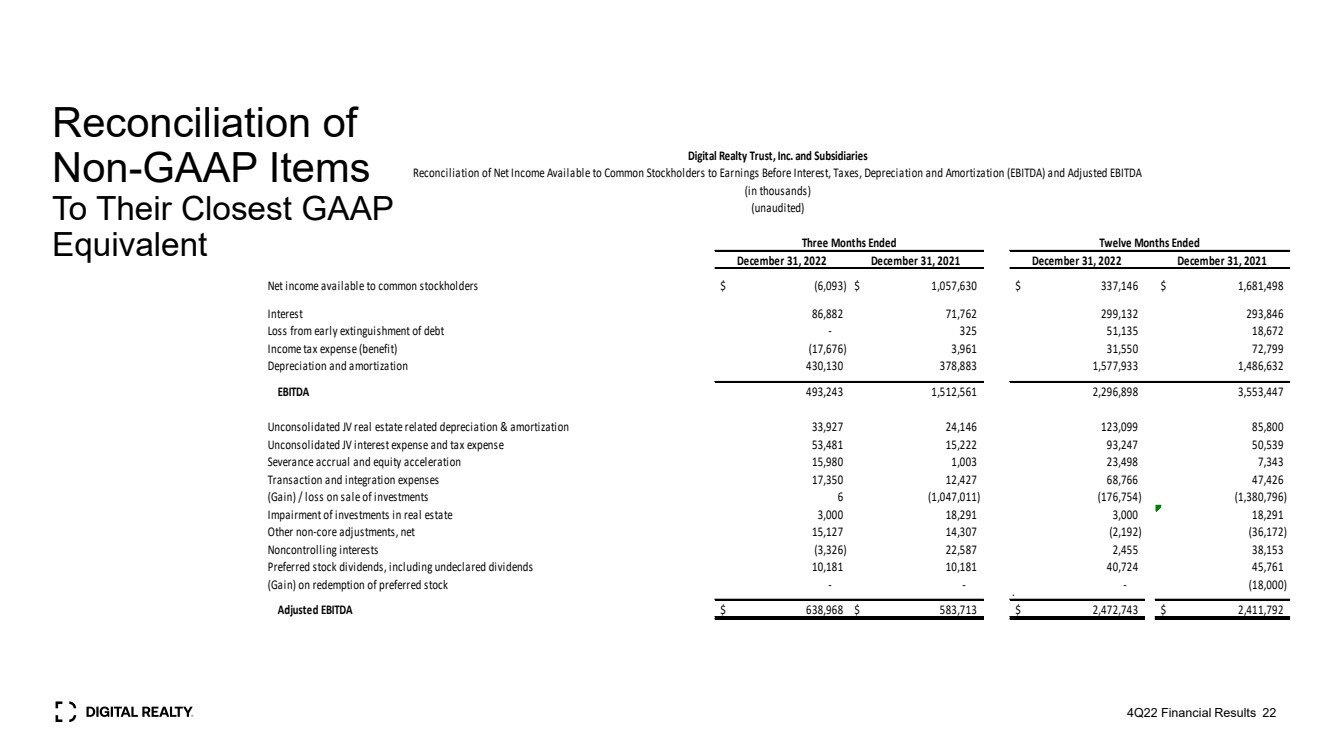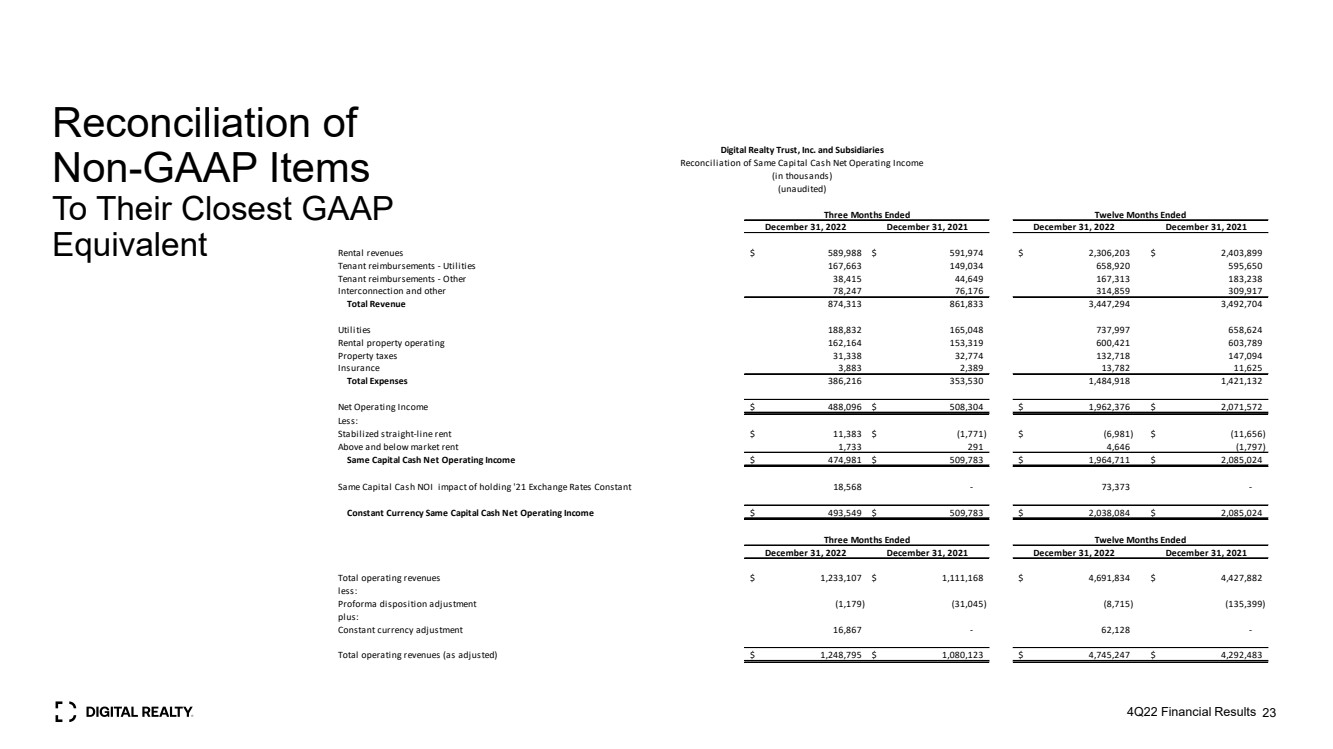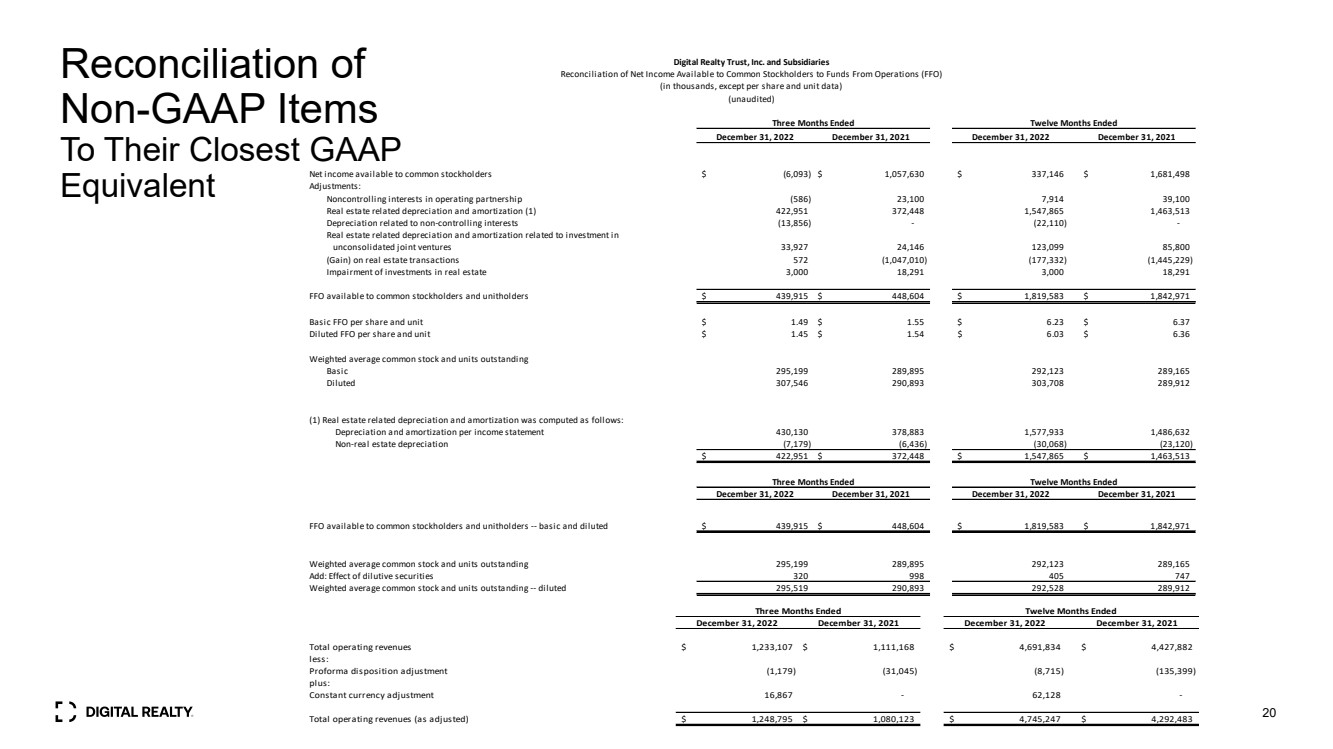
| Reconciliation of Non-GAAP Items To Their Closest GAAP Equivalent 20 December 31, 2022 December 31, 2021 December 31, 2022 December 31, 2021 Total operating revenues $ 1,233,107 $ 1,111,168 $ 4,691,834 $ 4,427,882 less: Proforma disposition adjustment (1,179) (31,045) (8,715) (135,399) plus: Constant currency adjustment 16,867 - 62,128 - Total operating revenues (as adjusted) $ 1,248,795 $ 1,080,123 $ 4,745,247 $ 4,292,483 Three Months Ended Twelve Months Ended December 31, 2022 December 31, 2021 December 31, 2022 December 31, 2021 Net income available to common stockholders $ (6,093) $ 1,057,630 $ 337,146 $ 1,681,498 Adjustments: Noncontrolling interests in operating partnership (586) 23,100 7,914 39,100 Real estate related depreciation and amortization (1) 422,951 372,448 1,547,865 1,463,513 Depreciation related to non-controlling interests (13,856) - (22,110) - Real estate related depreciation and amortization related to investment in unconsolidated joint ventures 33,927 24,146 123,099 85,800 (Gain) on real estate transactions 572 (1,047,010) (177,332) (1,445,229) Impairment of investments in real estate 3,000 18,291 3,000 18,291 FFO available to common stockholders and unitholders $ 439,915 $ 448,604 $ 1,819,583 $ 1,842,971 Basic FFO per share and unit $ 1.49 $ 1.55 $ 6.23 $ 6.37 Diluted FFO per share and unit $ 1.45 $ 1.54 $ 6.03 $ 6.36 Weighted average common stock and units outstanding Basic 295,199 289,895 292,123 289,165 Diluted 307,546 290,893 303,708 289,912 (1) Real estate related depreciation and amortization was computed as follows: Depreciation and amortization per income statement 430,130 378,883 1,577,933 1,486,632 Non-real estate depreciation (7,179) (6,436) (30,068) (23,120) $ 422,951 $ 372,448 $ 1,547,865 $ 1,463,513 December 31, 2022 December 31, 2021 December 31, 2022 December 31, 2021 FFO available to common stockholders and unitholders -- basic and diluted $ 439,915 $ 448,604 $ 1,819,583 $ 1,842,971 Weighted average common stock and units outstanding 295,199 289,895 292,123 289,165 Add: Effect of dilutive securities 320 998 405 747 Weighted average common stock and units outstanding -- diluted 295,519 290,893 292,528 289,912 Three Months Ended Twelve Months Ended Twelve Months Ended Digital Realty Trust, Inc. and Subsidiaries Reconciliation of Net Income Available to Common Stockholders to Funds From Operations (FFO) (in thousands, except per share and unit data) (unaudited) Three Months Ended |