| Global. Connected. Sustainable. 1Q23 FINANCIAL RESULTS April 27, 2023 The meeting place for companies, technologies and data |

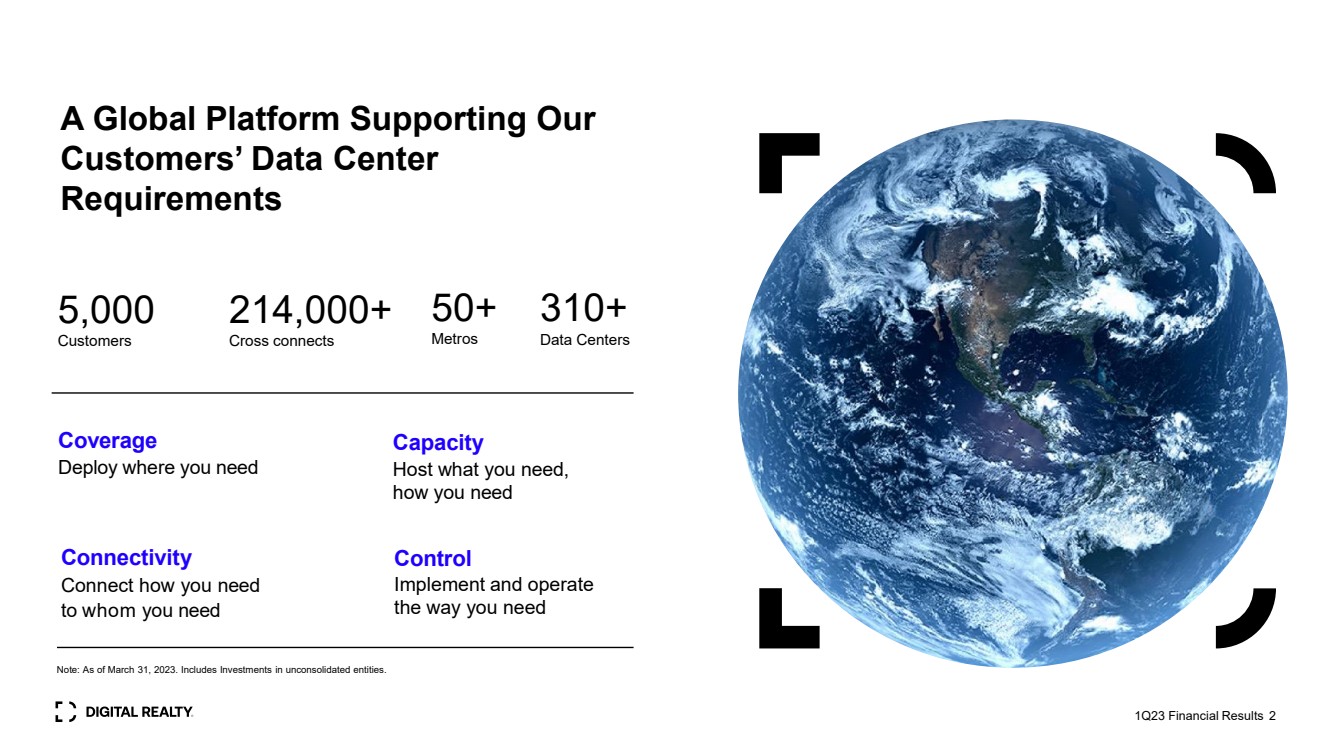
| 5,000 Customers 214,000+ Cross connects 50+ Metros 310+ Data Centers A Global Platform Supporting Our Customers’ Data Center Requirements Capacity Host what you need, how you need Coverage Deploy where you need Connectivity Connect how you need to whom you need Control Implement and operate the way you need Note: As of March 31, 2023. Includes Investments in unconsolidated entities. 1Q23 Financial Results 2 |
| Connected Data Communities Strong 0 -1 MW + IX Bookings 122 new logos $48 million total 1Q bookings from 0-1 MW + record Interconnection 57% of total 1Q bookings from 0-1 MW + Interconnection ~41% of new signed leases contained inflation -linked increases Auto Manufacturer Asset Manager 1Q23 Financial Results 3 |
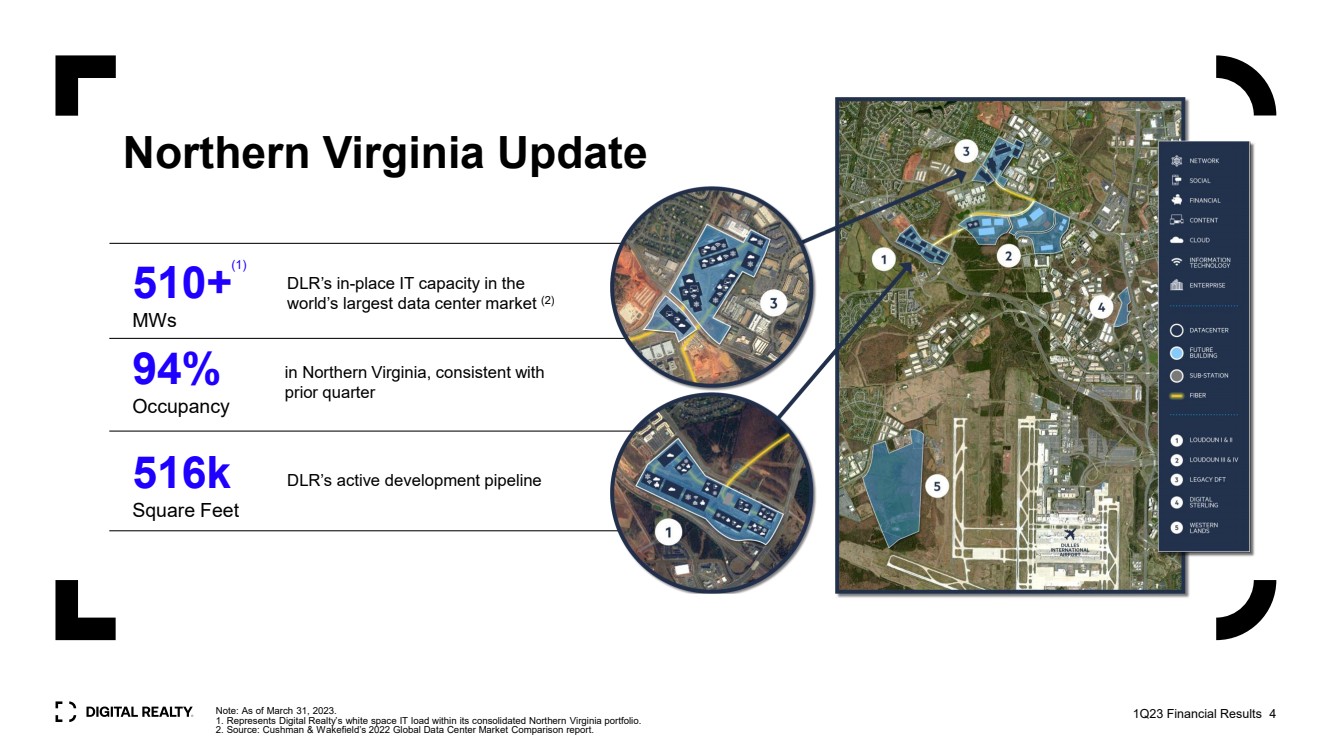
| 510+ MWs DLR’s in-place IT capacity in the world’s largest data center market (2) in Northern Virginia, consistent with prior quarter 94% Occupancy 516k Square Feet DLR’s active development pipeline (1) Northern Virginia Update Note: As of March 31, 2023. 1. Represents Digital Realty’s white space IT load within its consolidated Northern Virginia portfolio. 2. Source: Cushman & Wakefield’s 2022 Global Data Center Market Comparison report. 1Q23 Financial Results 4 |
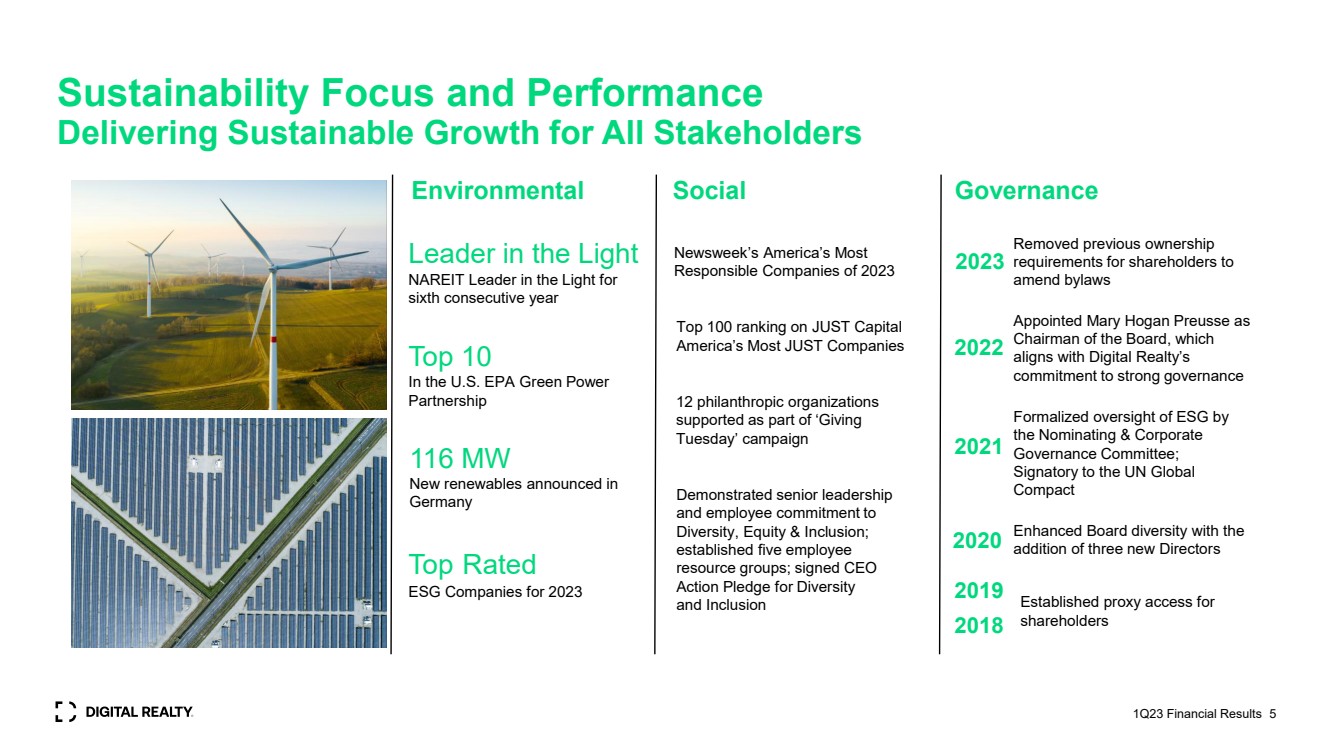
| Leader in the Light NAREIT Leader in the Light for sixth consecutive year 116 MW New renewables announced in Germany Environmental Social Governance Top 10 In the U.S. EPA Green Power Partnership Demonstrated senior leadership and employee commitment to Diversity, Equity & Inclusion; established five employee resource groups; signed CEO Action Pledge for Diversity and Inclusion 12 philanthropic organizations supported as part of ‘Giving Tuesday’ campaign Newsweek’s America’s Most Responsible Companies of 2023 Established proxy access for shareholders Enhanced Board diversity with the addition of three new Directors 2019 2018 2021 Formalized oversight of ESG by the Nominating & Corporate Governance Committee; Signatory to the UN Global Compact 2020 Appointed Mary Hogan Preusse as Chairman of the Board, which aligns with Digital Realty’s commitment to strong governance 2022 Sustainability Focus and Performance Delivering Sustainable Growth for All Stakeholders 1Q23 Financial Results 5 Top Rated ESG Companies for 2023 Top 100 ranking on JUST Capital America’s Most JUST Companies 2023 Removed previous ownership requirements for shareholders to amend bylaws |
| 1Q23 Financial Results 1Q23 Financial Results 6 |

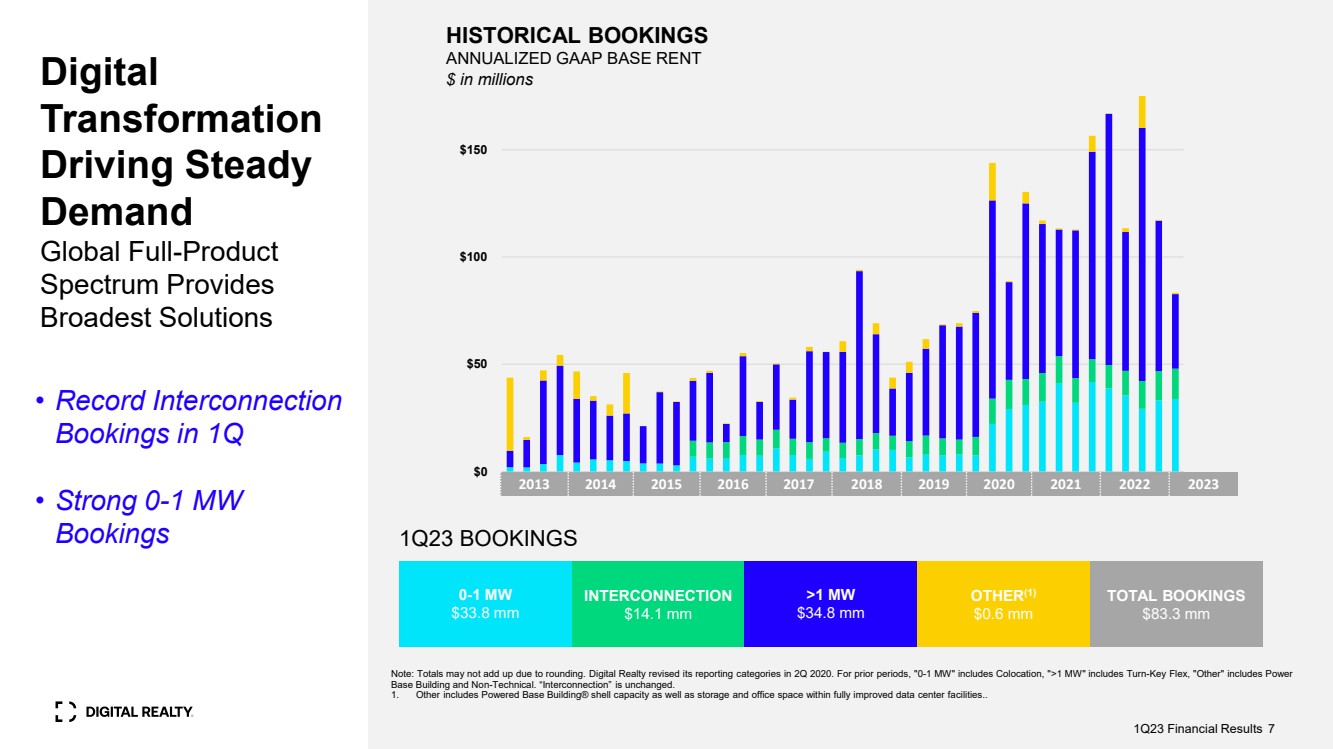
| Note: Totals may not add up due to rounding. Digital Realty revised its reporting categories in 2Q 2020. For prior periods, "0-1 MW" includes Colocation, ">1 MW" includes Turn-Key Flex, "Other" includes Power Base Building and Non-Technical. “Interconnection” is unchanged. 1. Other includes Powered Base Building® shell capacity as well as storage and office space within fully improved data center facilities.. 1Q23 BOOKINGS HISTORICAL BOOKINGS ANNUALIZED GAAP BASE RENT Digital $ in millions Transformation Driving Steady Demand Global Full-Product Spectrum Provides Broadest Solutions 0-1 MW $33.8 mm INTERCONNECTION $14.1 mm >1 MW $34.8 mm OTHER(1) $0.6 mm TOTAL BOOKINGS $83.3 mm 2013 2014 2015 2016 2017 2018 2019 2020 2021 2022 2023 1Q23 Financial Results 7 • Record Interconnection Bookings in 1Q • Strong 0-1 MW Bookings $0 $50 $100 $150 |
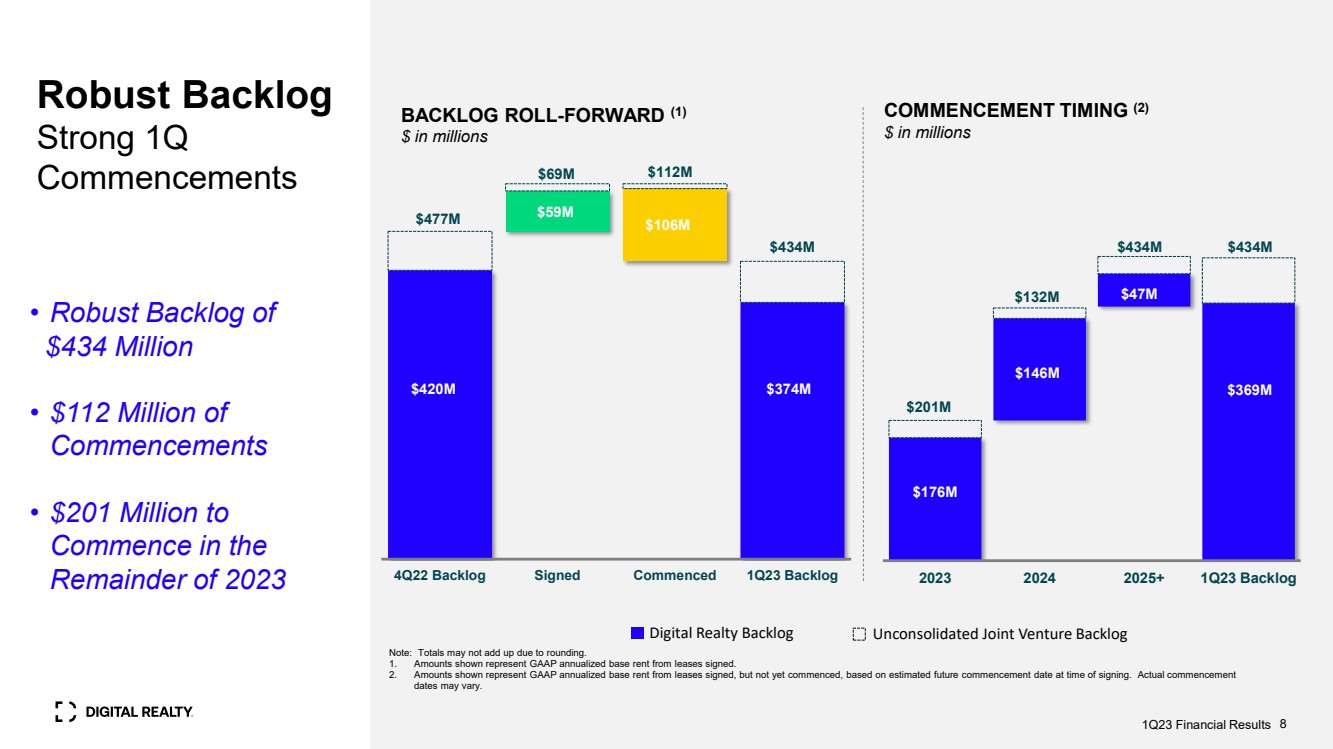
| Note: Totals may not add up due to rounding. 1. Amounts shown represent GAAP annualized base rent from leases signed. 2. Amounts shown represent GAAP annualized base rent from leases signed, but not yet commenced, based on estimated future commencement date at time of signing. Actual commencement dates may vary. Robust Backlog Strong 1Q Commencements BACKLOG ROLL-FORWARD (1) $ in millions Digital Realty Backlog Unconsolidated Joint Venture Backlog COMMENCEMENT TIMING (2) $ in millions • Robust Backlog of $434 Million • $112 Million of Commencements • $201 Million to Commence in the Remainder of 2023 1Q23 Financial Results 8 2023 2024 2025+ 1Q23 Backlog $176M $146M $47M $369M $201M $132M $434M 4Q22 Backlog Signed Commenced 1Q23 Backlog $434M $420M $477M $69M $112M $59M $106M $434M $374M |
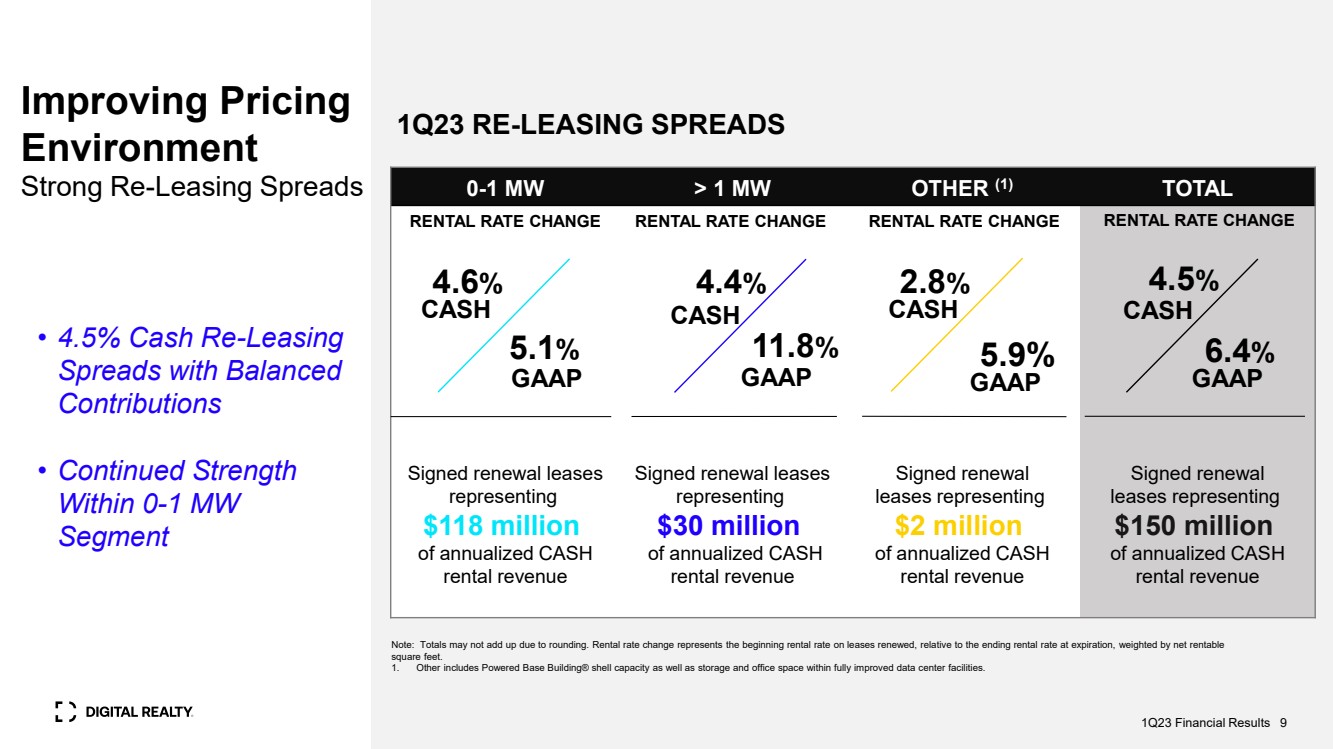
| Improving Pricing Environment Strong Re-Leasing Spreads 1Q23 RE-LEASING SPREADS 0-1 MW > 1 MW OTHER (1) TOTAL Signed renewal leases representing $118 million of annualized CASH rental revenue Signed renewal leases representing $30 million of annualized CASH rental revenue Signed renewal leases representing $2 million of annualized CASH rental revenue Signed renewal leases representing $150 million of annualized CASH rental revenue RENTAL RATE CHANGE RENTAL RATE CHANGE RENTAL RATE CHANGE RENTAL RATE CHANGE 5.1% 4.4% GAAP Note: Totals may not add up due to rounding. Rental rate change represents the beginning rental rate on leases renewed, relative to the ending rental rate at expiration, weighted by net rentable square feet. 1. Other includes Powered Base Building® shell capacity as well as storage and office space within fully improved data center facilities. • 4.5% Cash Re-Leasing Spreads with Balanced Contributions • Continued Strength Within 0-1 MW Segment 4.6% CASH GAAP CASH 11.8% 2.8% CASH 5.9% GAAP 4.5% CASH 6.4% GAAP 1Q23 Financial Results 9 |
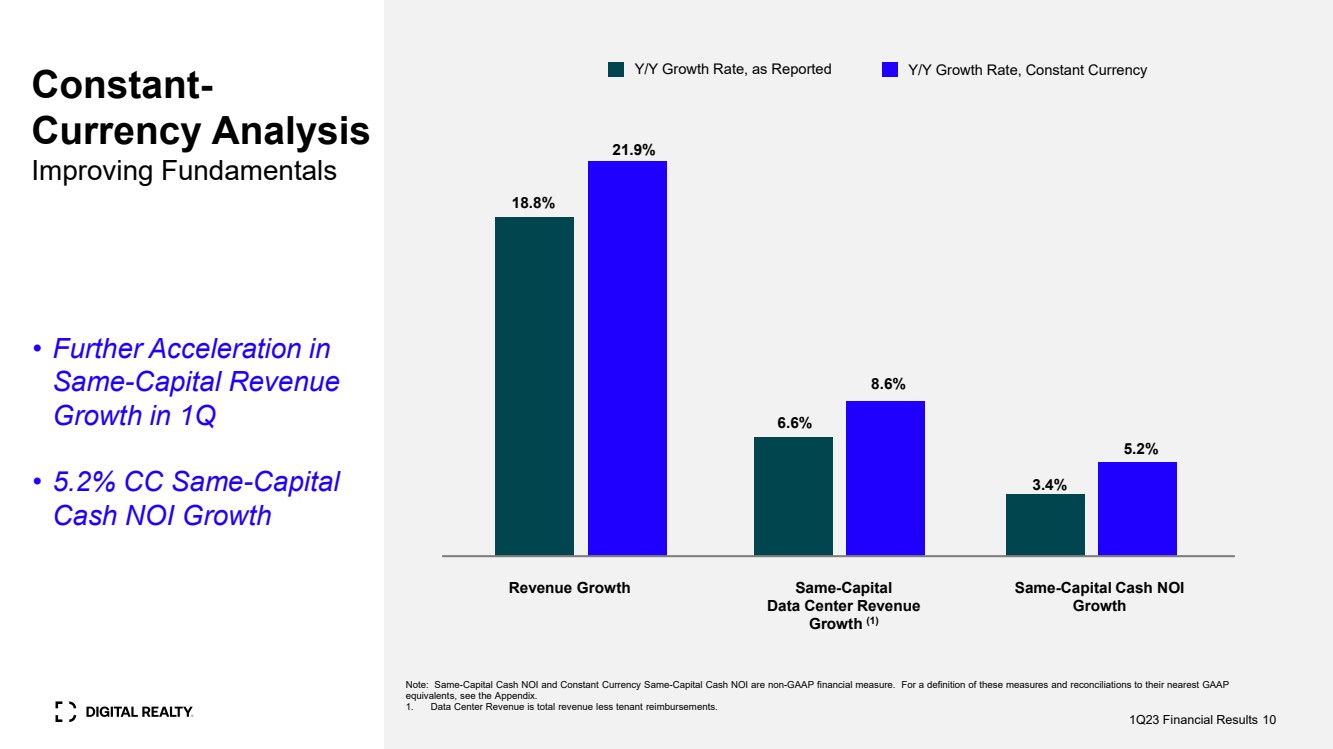
| Constant-Currency Analysis Improving Fundamentals 18.8% 21.9% Revenue Growth Note: Same-Capital Cash NOI and Constant Currency Same-Capital Cash NOI are non-GAAP financial measure. For a definition of these measures and reconciliations to their nearest GAAP equivalents, see the Appendix. 1. Data Center Revenue is total revenue less tenant reimbursements. Y/Y Growth Rate, as Reported Y/Y Growth Rate, Constant Currency • Further Acceleration in Same-Capital Revenue Growth in 1Q • 5.2% CC Same-Capital Cash NOI Growth 1Q23 Financial Results 10 Same-Capital Cash NOI Growth Same-Capital Data Center Revenue Growth (1) 6.6% 8.6% 3.4% 5.2% |
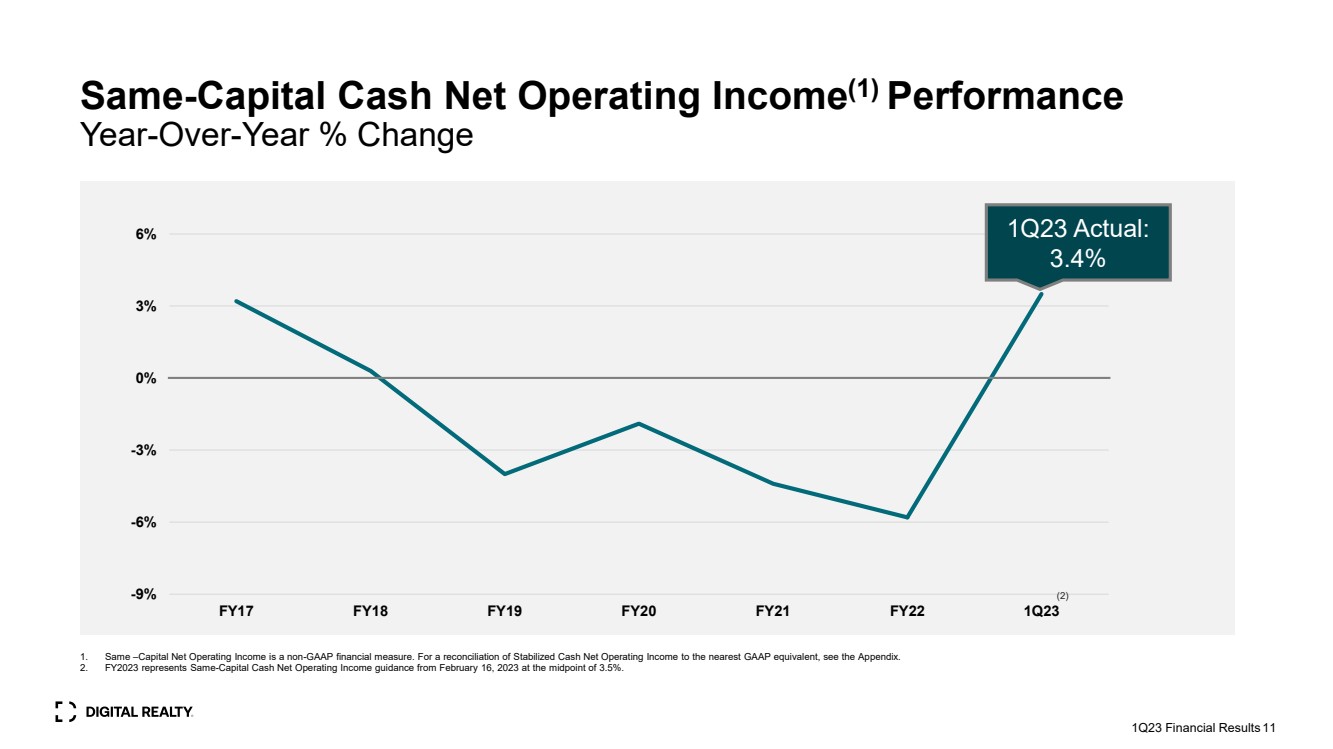
| 11 Same-Capital Cash Net Operating Income(1) Performance Year-Over-Year % Change -9% -6% -3% 0% 3% 6% FY17 FY18 FY19 FY20 FY21 FY22 1Q23 1Q23 Actual: 3.4% 1. Same –Capital Net Operating Income is a non-GAAP financial measure. For a reconciliation of Stabilized Cash Net Operating Income to the nearest GAAP equivalent, see the Appendix. 2. FY2023 represents Same-Capital Cash Net Operating Income guidance from February 16, 2023 at the midpoint of 3.5%. (2) 1Q23 Financial Results |
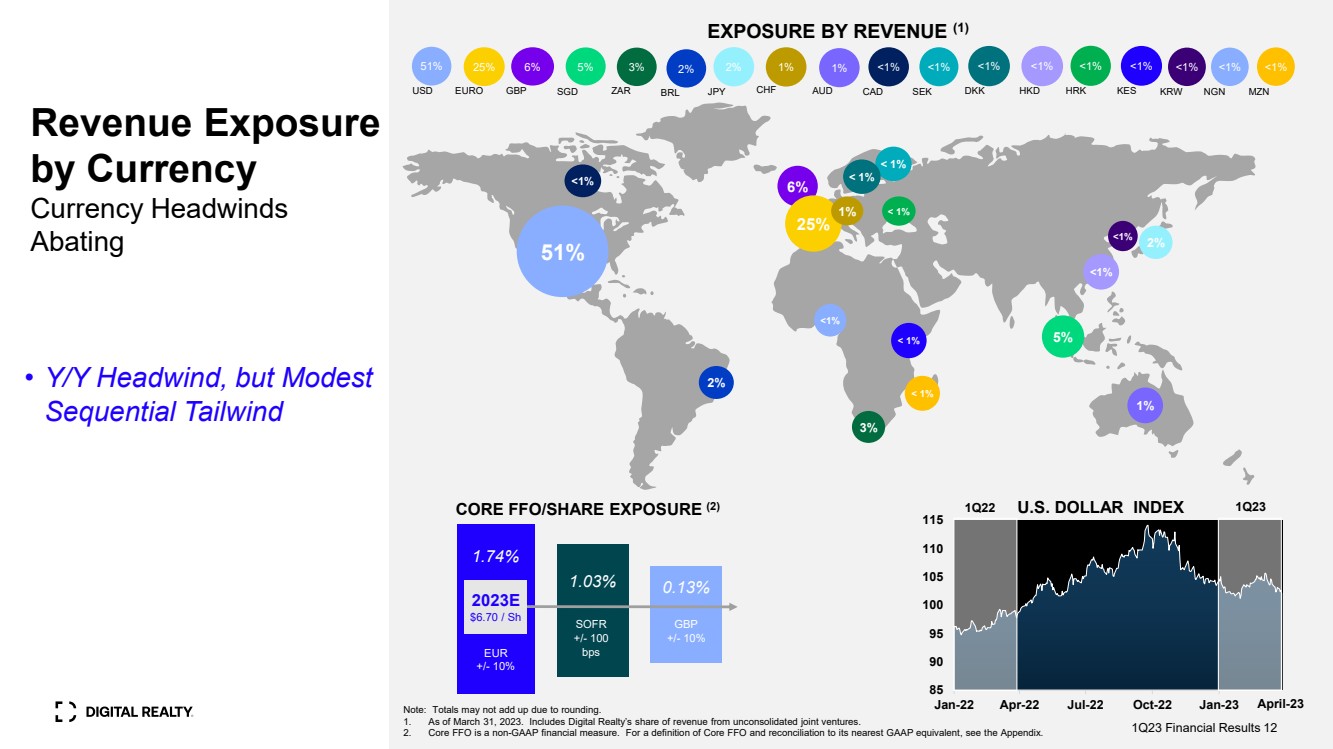
| Revenue Exposure by Currency Currency Headwinds Abating USD EURO GBP ZAR BRL JPY AUD HKD 25% 6% 5% 3% 2% <1% <1% SEK <1% DKK <1% CHF 1% <1% <1% HRK KES 51% 51% <1% 6% 25% 5% 2% 1% < 1% < 1% 1% < 1% < 1% 3% 2023E $6.70 / Sh 1.03% SOFR +/- 100 bps 0.13% GBP +/- 10% 1.74% EUR +/- 10% CORE FFO/SHARE EXPOSURE (2) EXPOSURE BY REVENUE (1) Note: Totals may not add up due to rounding. 1. As of March 31, 2023. Includes Digital Realty’s share of revenue from unconsolidated joint ventures. 2. Core FFO is a non-GAAP financial measure. For a definition of Core FFO and reconciliation to its nearest GAAP equivalent, see the Appendix. 1Q23 Financial Results 12 2% < 1% • Y/Y Headwind, but Modest Sequential Tailwind April-23 <1% SGD 2% 1% CAD MZN <1% <1% KRW NGN <1% <1% <1% 1Q22 1Q23 85 90 95 100 105 110 115 Jan-22 Apr-22 Jul-22 Oct-22 Jan-23 U.S. DOLLAR INDEX |
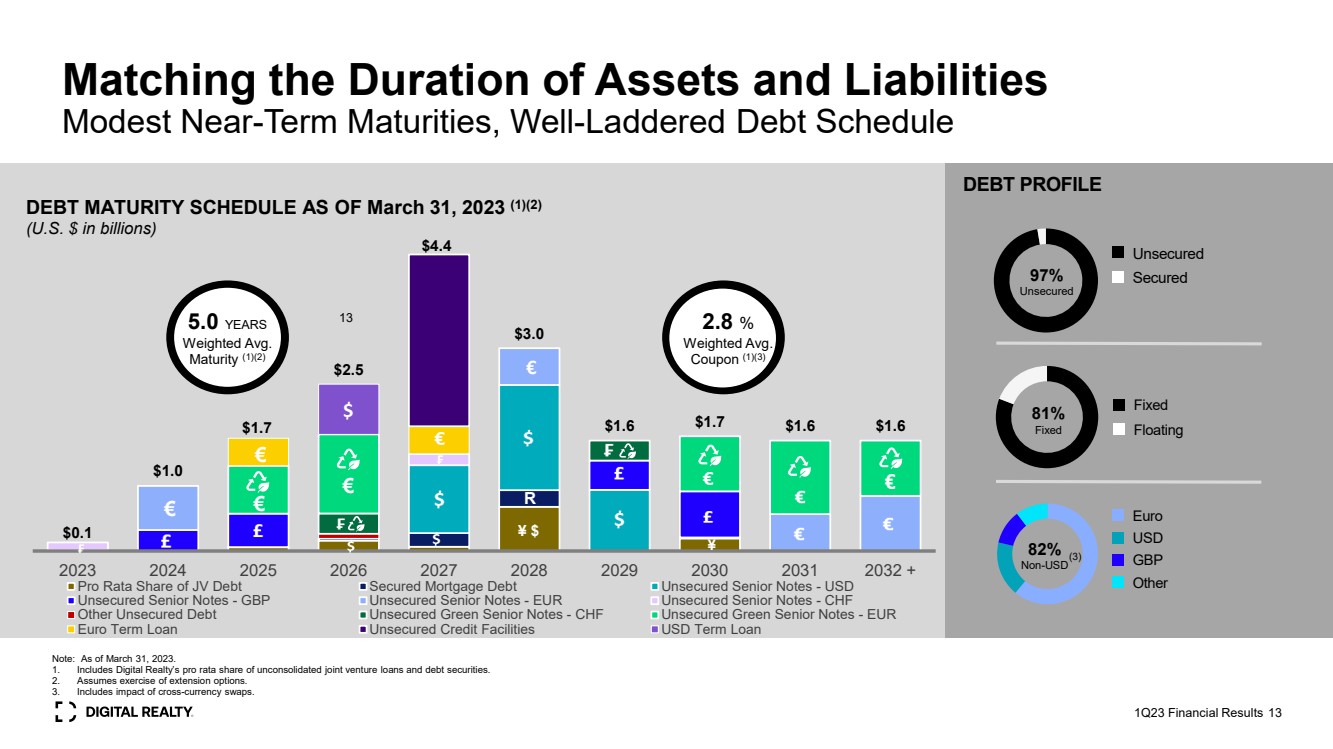
| Matching the Duration of Assets and Liabilities Modest Near-Term Maturities, Well-Laddered Debt Schedule DEBT MATURITY SCHEDULE AS OF March 31, 2023 (1)(2) (U.S. $ in billions) Note: As of March 31, 2023. 1. Includes Digital Realty’s pro rata share of unconsolidated joint venture loans and debt securities. 2. Assumes exercise of extension options. 3. Includes impact of cross-currency swaps. 5.0 YEARS Weighted Avg. Maturity (1)(2) DEBT PROFILE 97% Unsecured Unsecured Secured 82% Non-USD Euro USD GBP Other 81% Fixed Fixed Floating 2.8 % Weighted Avg. Coupon (1)(3) 1Q23 Financial Results 13 (3) $0.1 $1.0 $1.7 $2.5 $4.4 $3.0 $1.6 $1.7 $1.6 $1.6 2023 2024 2025 2026 2027 2028 2029 2030 2031 2032 + Pro Rata Share of JV Debt Secured Mortgage Debt Unsecured Senior Notes - USD Unsecured Senior Notes - GBP Unsecured Senior Notes - EUR Unsecured Senior Notes - CHF Other Unsecured Debt Unsecured Green Senior Notes - CHF Unsecured Green Senior Notes - EUR Euro Term Loan Unsecured Credit Facilities USD Term Loan € € € € R € € ₣ ¥ ¥ $ ₣ $ 13 |
| Q&A Global. Connected. Sustainable. 1Q23 Financial Results 14 |

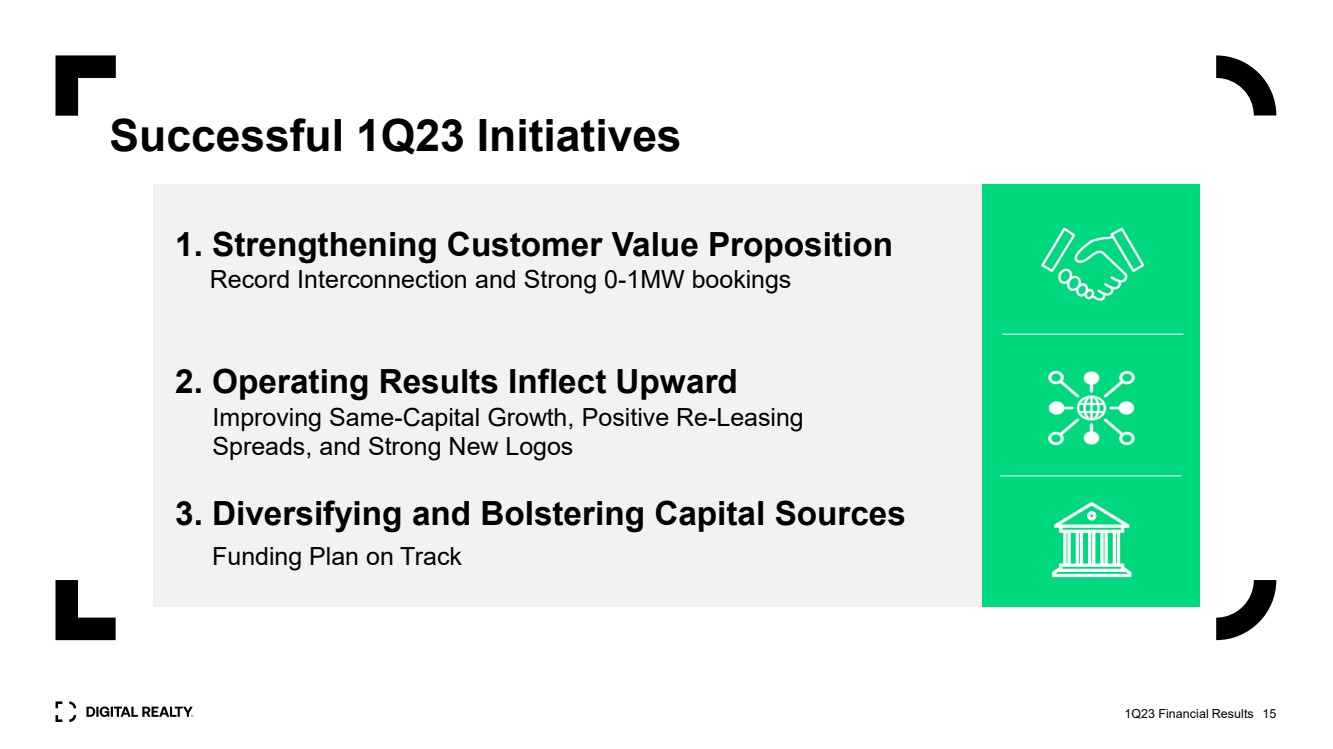
| Successful 1Q23 Initiatives 1. Strengthening Customer Value Proposition Record Interconnection and Strong 0-1MW bookings 2. Operating Results Inflect Upward 3. Diversifying and Bolstering Capital Sources Funding Plan on Track 1Q23 Financial Results 15 Improving Same-Capital Growth, Positive Re-Leasing Spreads, and Strong New Logos |
| Appendix 1Q23 Financial Results 16 |

| Appendix Management Statements on Non-GAAP Measures The information included in this presentation contains certain non-GAAP financial measures that management believes are helpful in understanding our business, as further described below. Our definition and calculation of non-GAAP financial measures may differ from those of other REITs, and, therefore, may not be comparable. The non-GAAP financial measures should not be considered alternatives to net income or any other GAAP measurement of performance and should not be considered an alternative to cash flows from operating, investing or financing activities as a measure of liquidity. Funds From Operations (FFO): We calculate funds from operations, or FFO, in accordance with the standards established by the National Association of Real Estate Investment Trusts, or NAREIT, in the NAREIT Funds From Operations White Paper - 2018 Restatement. FFO represents net income (loss) (computed in accordance with GAAP), excluding gains (or losses) from real estate transactions, impairment of investment in real estate, real estate related depreciation and amortization (excluding amortization of deferred financing costs), unconsolidated JV real estate related depreciation & amortization, non-controlling interests in operating partnership and after adjustments for unconsolidated partnerships and joint ventures. Management uses FFO as a supplemental performance measure because, in excluding real estate related depreciation and amortization and gains and losses from property dispositions and after adjustments for unconsolidated partnerships and joint ventures, it provides a performance measure that, when compared year over year, captures trends in occupancy rates, rental rates and operating costs. We also believe that, as a widely recognized measure of the performance of REITs, FFO will be used by investors as a basis to compare our operating performance with that of other REITs. However, because FFO excludes depreciation and amortization and captures neither the changes in the value of our data centers that result from use or market conditions, nor the level of capital expenditures and capitalized leasing commissions necessary to maintain the operating performance of our data centers, all of which have real economic effect and could materially impact our financial condition and results from operations, the utility of FFO as a measure of our performance is limited. Other REITs may not calculate FFO in accordance with the NAREIT definition and, accordingly, our FFO may not be comparable to other REITs’ FFO. FFO should be considered only as a supplement to net income computed in accordance with GAAP as a measure of our performance. Core Funds from Operations (Core FFO): We present core funds from operations, or Core FFO, as a supplemental operating measure because, in excluding certain items that do not reflect core revenue or expense streams, it provides a performance measure that, when compared year over year, captures trends in our core business operating performance. We calculate Core FFO by adding to or subtracting from FFO (i) other non-core revenues adjustments, (ii) transaction and integration expenses, (iii) loss from early extinguishment of debt, (iv) gain on / issuance costs associated with redeemed preferred stock, (v) severance, equity acceleration, and legal expenses, (vi) gain/loss on FX revaluation, and (vii) other non-core expense adjustments. Because certain of these adjustments have a real economic impact on our financial condition and results from operations, the utility of Core FFO as a measure of our performance is limited. Other REITs may calculate core FFO differently than we do and accordingly, our Core FFO may not be comparable to other REITs’ core FFO. Core FFO should be considered only as a supplement to net income computed in accordance with GAAP as a measure of our performance. EBITDA and Adjusted EBITDA: We believe that earnings before interest, loss from early extinguishment of debt, income taxes, and depreciation and amortization, or EBITDA, and Adjusted EBITDA (as defined below), are useful supplemental performance measures because they allow investors to view our performance without the impact of non-cash depreciation and amortization or the cost of debt and, with respect to Adjusted EBITDA, unconsolidated joint venture real estate related depreciation & amortization, unconsolidated joint venture interest expense and tax, severance, equity acceleration, and legal expenses, transaction and integration expenses, gain on sale / deconsolidation, impairment of investments in real estate, other non-core adjustments, net, non-controlling interests, preferred stock dividends, including undeclared dividends, and issuance costs associated with redeemed preferred stock. Adjusted EBITDA is EBITDA excluding unconsolidated joint venture real estate related depreciation & amortization, unconsolidated joint venture interest expense and tax, severance, equity acceleration, and legal expenses, transaction and integration expenses, gain on sale / deconsolidation, impairment of investments in real estate, other non-core adjustments, net, non-controlling interests, preferred stock dividends, including undeclared dividends, and gain on / issuance costs associated with redeemed preferred stock. In addition, we believe EBITDA and Adjusted EBITDA are frequently used by securities analysts, investors and other interested parties in the evaluation of REITs. Because EBITDA and Adjusted EBITDA are calculated before recurring cash charges including interest expense and income taxes, exclude capitalized costs, such as leasing commissions, and are not adjusted for capital expenditures or other recurring cash requirements of our business, their utility as a measure of our performance is limited. Other REITs may calculate EBITDA and Adjusted EBITDA differently than we do and, accordingly, our EBITDA and Adjusted EBITDA may not be comparable to other REITs’ EBITDA and Adjusted EBITDA. Accordingly, EBITDA and Adjusted EBITDA should be considered only as supplements to net income computed in accordance with GAAP as a measure of our financial performance. Net Operating Income (NOI) and Cash NOI: Net operating income, or NOI, represents rental revenue, tenant reimbursement revenue and interconnection revenue less utilities expense, rental property operating expenses, property taxes and insurance expenses (as reflected in the statement of operations). NOI is commonly used by stockholders, company management and industry analysts as a measurement of operating performance of the company’s rental portfolio. Cash NOI is NOI less straight-line rents and above- and below-market rent amortization. Cash NOI is commonly used by stockholders, company management and industry analysts as a measure of property operating performance on a cash basis. However, because NOI and cash NOI exclude depreciation and amortization and capture neither the changes in the value of our data centers that result from use or market conditions, nor the level of capital expenditures and capitalized leasing commissions necessary to maintain the operating performance of our data centers, all of which have real economic effect and could materially impact our results from operations, the utility of NOI and cash NOI as measures of our performance is limited. Other REITs may calculate NOI and cash NOI differently than we do and, accordingly, our NOI and cash NOI may not be comparable to other REITs’ NOI and cash NOI. NOI and cash NOI should be considered only as supplements to net income computed in accordance with GAAP as measures of our performance. Same–Capital Cash NOI: Same-Capital Cash NOI represents buildings owned as of December 31, of the prior year with less than 5% of total rentable square feet under development. Excludes buildings that were undergoing, or were expected to undergo, development activities in 2022-2023, buildings classified as held for sale, and buildings sold or contributed to joint ventures for all periods presented. Prior period numbers adjusted to reflect current same-capital pool. Constant-Currency Same-Capital Cash NOI: We Calculate Constant-Currency Same-Capital Cash NOI by adjusting the Same-Capital Cash NOI for foreign currency translations. 1Q23 Financial Results 17 |
| Appendix Forward-Looking Statements This information in this presentation contains forward-looking statements within the meaning of the federal securities laws, which are based on current expectations, forecasts and assumptions that involve risks and uncertainties that could cause actual outcomes and results to differ materially. Such forward-looking statements include statements relating to: our economic outlook; our expected investment and expansion activity; our joint ventures; the expected benefits and timing of PlatformDIGITAL®; the Data Gravity Index™; Data Gravity Index DGx™; public cloud services spending; our sustainability initiatives; the expected effect of foreign currency translation adjustments on our financials; anticipated continued demand for our products and services; our liquidity; demand drivers and economic growth outlook; business drivers; our expected development plans and completions, including timing, total square footage, IT capacity and raised floor space upon completion; expected availability for leasing efforts and colocation initiatives; organizational initiatives; our product offerings; our connected data communities; joint venture opportunities; occupancy and total investment; our expected investment in our properties; our estimated time to stabilization and targeted returns at stabilization of our properties; our expected future acquisitions; acquisitions strategy; available inventory and development strategy; the signing and commencement of leases, and related rental revenue; lag between signing and commencement of leases; our 2023 backlog; future rents; our expected same store portfolio growth; our expected growth and stabilization of development completions and acquisitions; lease rollovers and expected rental rate changes; our re-leasing spreads; our expected yields on investments; our expectations with respect to capital investments at lease expiration on existing data center or colocation space; debt maturities; lease maturities; our other expected future financial and other results, and the assumptions underlying such results; our customers’ capital investments; our plans and intentions; future data center utilization, utilization rates, growth rates, trends, supply and demand; datacenter expansion plans; estimated kW/MW requirements; capital expenditures; the effect new leases and increases in rental rates will have on our rental revenues and results of operations; estimates of the value of our development portfolio; our ability to meet our liquidity needs, including the ability to raise additional capital; market forecasts; projected financial information and covenant metrics; Core FFO run rate and NOI growth; other forward looking financial data; leasing expectations; our exposure to tenants in certain industries; our expectations and underlying assumptions regarding our sensitivity to fluctuations in foreign exchange rates; and the sufficiency of our capital to fund future requirements. You can identify forward-looking statements by the use of forward-looking terminology such as “believes,” “expects,” “may,” “will,” “should,” “seeks,” “approximately,” “intends,” “plans,” “pro forma,” “estimates” or “anticipates” or the negative of these words and phrases or similar words or phrases which are predictions of or indicate future events or trends and discussions which do not relate solely to historical matters. Such statements are based on management’s beliefs and assumptions made based on information currently available to management. Such statements are subject to risks, uncertainties and assumptions and are not guarantees of future performance and may be affected by known and unknown risks, trends, uncertainties and factors that are beyond our control. Should one or more of these risks or uncertainties materialize, or should underlying assumptions prove incorrect, actual results may vary materially from those anticipated, estimated or projected. Some of the risks and uncertainties that may cause our actual results, performance or achievements to differ materially from those expressed or implied by forward-looking statements include, among others, the following: reduced demand for data centers or decreases in information technology spending; increased competition or available supply of data center space; decreased rental rates, increased operating costs or increased vacancy rates; the impact on our or our customers’, suppliers’ or business partners’ operations during a pandemic, such as COVID-19; changes in political conditions, geopolitical turmoil, political instability, civil disturbances, restrictive governmental actions or nationalization in the countries in which we operate; the suitability of our data centers and data center infrastructure, delays or disruptions in connectivity or availability of power, or failures or breaches of our physical and information security infrastructure or services; our dependence upon significant customers, bankruptcy or insolvency of a major customer or a significant number of smaller customers, or defaults on or non-renewal of leases by customers breaches of our obligations or restrictions under our contracts with our customers; our inability to successfully develop and lease new properties and development space, and delays or unexpected costs in development of properties; the impact of current global and local economic, credit and market conditions, including impacts of inflation; global supply chain or procurement disruptions, or increased supply chain costs; our inability to retain data center space that we lease or sublease from third parties; information security and data privacy breaches; difficulties managing an international business and acquiring or operating properties in foreign jurisdictions and unfamiliar metropolitan areas; our failure to realize the intended benefits from, or disruptions to our plans and operations or unknown or contingent liabilities related to, our recent acquisitions; our failure to successfully integrate and operate acquired or developed properties or businesses; difficulties in identifying properties to acquire and completing acquisitions; risks related to joint venture investments, including as a result of our lack of control of such investments; risks associated with using debt to fund our business activities, including re-financing and interest rate risks, our failure to repay debt when due, adverse changes in our credit ratings or our breach of covenants or other terms contained in our loan facilities and agreements; our failure to obtain necessary debt and equity financing, and our dependence on external sources of capital; financial market fluctuations and changes in foreign currency exchange rates; adverse economic or real estate developments in our industry or the industry sectors that we sell to, including risks relating to decreasing real estate valuations and impairment charges and goodwill and other intangible asset impairment charges; our inability to manage our growth effectively; losses in excess of our insurance coverage; our inability to attract and retain talent; environmental liabilities, risks related to natural disasters and our inability to achieve our sustainability goals; our inability to comply with rules and regulations applicable to our company; Digital Realty Trust, Inc.’s failure to maintain its status as a REIT for federal income tax purposes; Digital Realty Trust, L.P.’s failure to qualify as a partnership for federal income tax purposes; restrictions on our ability to engage in certain business activities; and changes in local, state, federal and international laws and regulations, including related to taxation, real estate and zoning laws. The risks included here are not exhaustive, and additional factors could adversely affect our business and financial performance. We discussed a number of additional material risks in our annual report on Form 10-K for the year ended December 31, 2022, and other filings with the Securities and Exchange Commission. Those risks continue to be relevant to our performance and financial condition. Moreover, we operate in a very competitive and rapidly changing environment. New risk factors emerge from time to time and it is not possible for management to predict all such risk factors, nor can it assess the impact of all such risk factors on the business or the extent to which any factor, or combination of factors, may cause actual results to differ materially from those contained in any forward-looking statements. We expressly disclaim any responsibility to update forward-looking statements, whether as a result of new information, future events or otherwise. Digital Realty, Digital Realty Trust, the Digital Realty logo, Interxion, Turn-Key Flex, Powered Base Building, PlatformDIGITAL, Data Gravity Index, Data Gravity Index DGx and Connected Data Communities are registered trademarks and service marks of Digital Realty Trust, Inc. in the United States and/or other countries. All other names, trademarks and service marks are the property of their respective owners. 1Q23 Financial Results 18 |
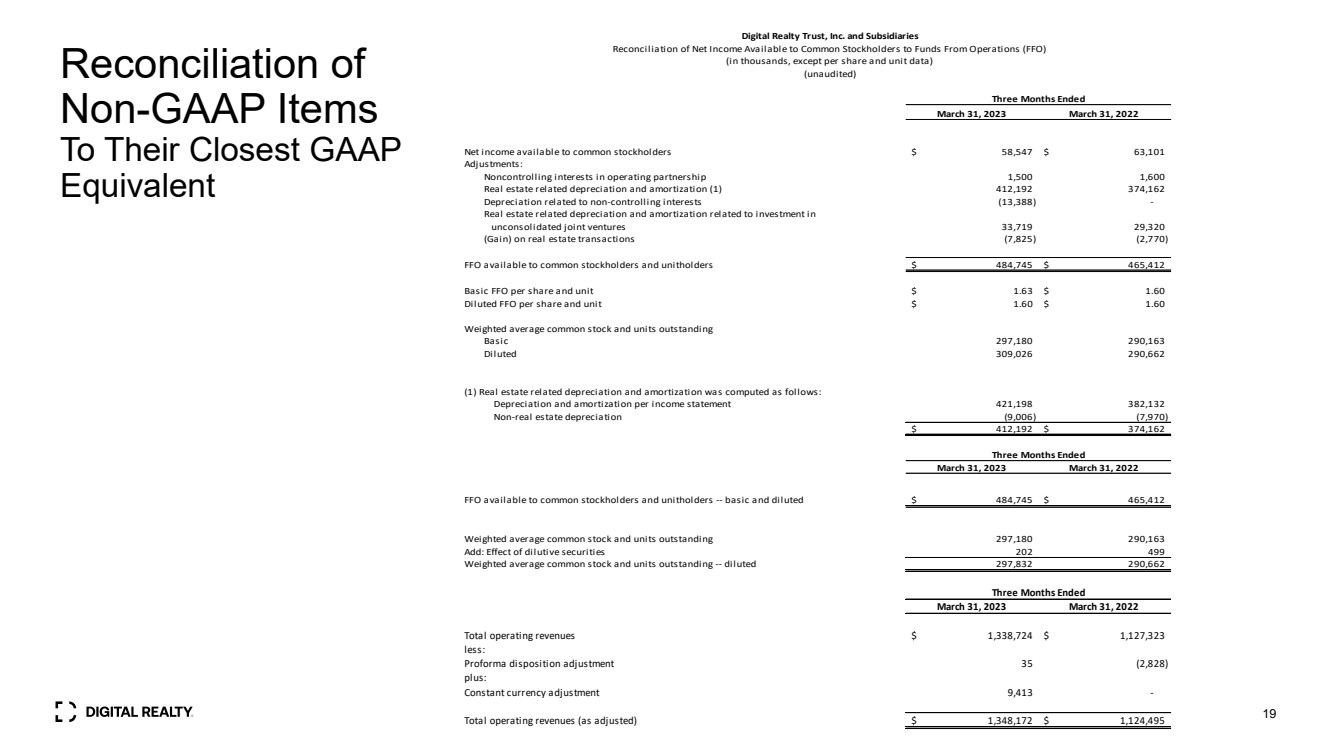
| Reconciliation of Non-GAAP Items To Their Closest GAAP Equivalent 19 March 31, 2023 March 31, 2022 Net income available to common stockholders $ 58,547 $ 63,101 Adjustments: Noncontrolling interests in operating partnership 1,500 1,600 Real estate related depreciation and amortization (1) 412,192 374,162 Depreciation related to non-controlling interests (13,388) - Real estate related depreciation and amortization related to investment in unconsolidated joint ventures 33,719 29,320 (Gain) on real estate transactions (7,825) (2,770) FFO available to common stockholders and unitholders $ 484,745 $ 465,412 Basic FFO per share and unit $ 1.63 $ 1.60 Diluted FFO per share and unit $ 1.60 $ 1.60 Weighted average common stock and units outstanding Basic 297,180 290,163 Diluted 309,026 290,662 (1) Real estate related depreciation and amortization was computed as follows: Depreciation and amortization per income statement 421,198 382,132 Non-real estate depreciation (9,006) (7,970) $ 412,192 $ 374,162 March 31, 2023 March 31, 2022 FFO available to common stockholders and unitholders -- basic and diluted $ 484,745 $ 465,412 Weighted average common stock and units outstanding 297,180 290,163 Add: Effect of dilutive securities 202 499 Weighted average common stock and units outstanding -- diluted 297,832 290,662 Three Months Ended Digital Realty Trust, Inc. and Subsidiaries Reconciliation of Net Income Available to Common Stockholders to Funds From Operations (FFO) (in thousands, except per share and unit data) (unaudited) Three Months Ended March 31, 2023 March 31, 2022 Total operating revenues $ 1,338,724 $ 1,127,323 less: Proforma disposition adjustment 3 5 (2,828) plus: Constant currency adjustment 9,413 - Total operating revenues (as adjusted) $ 1,348,172 $ 1,124,495 Three Months Ended |
| Reconciliation of Non-GAAP Items To Their Closest GAAP Equivalent 1Q23 Financial Results 20 March 31, 2023 March 31, 2022 FFO available to common stockholders and unitholders -- diluted $ 484,745 $ 465,412 Other non-core revenue adjustments (887) 13,916 Transaction and integration expenses 12,267 11,968 Loss from early extinguishment of debt - 51,135 (Gain) / Loss on FX revaluation (6,778) (67,676) Severance accrual and equity acceleration 4,155 2,077 Other non-core expense adjustments - 7,657 CFFO available to common stockholders and unitholders -- diluted $ 493,500 $ 484,490 CFFO impact of holding '22 Exchange Rates Constant 9,413 - Constant Currency CFFO available to common stockholders and unitholders -- diluted $ 502,913 $ 484,490 Diluted CFFO per share and unit $ 1.66 $ 1.67 Diluted Constant Currency CFFO per share and unit $ 1.69 $ 1.67 Digital Realty Trust, Inc. and Subsidiaries Reconciliation of Funds From Operations (FFO) to Core Funds From Operations (CFFO) (in thousands, except per share and unit data) (unaudited) Three Months Ended |

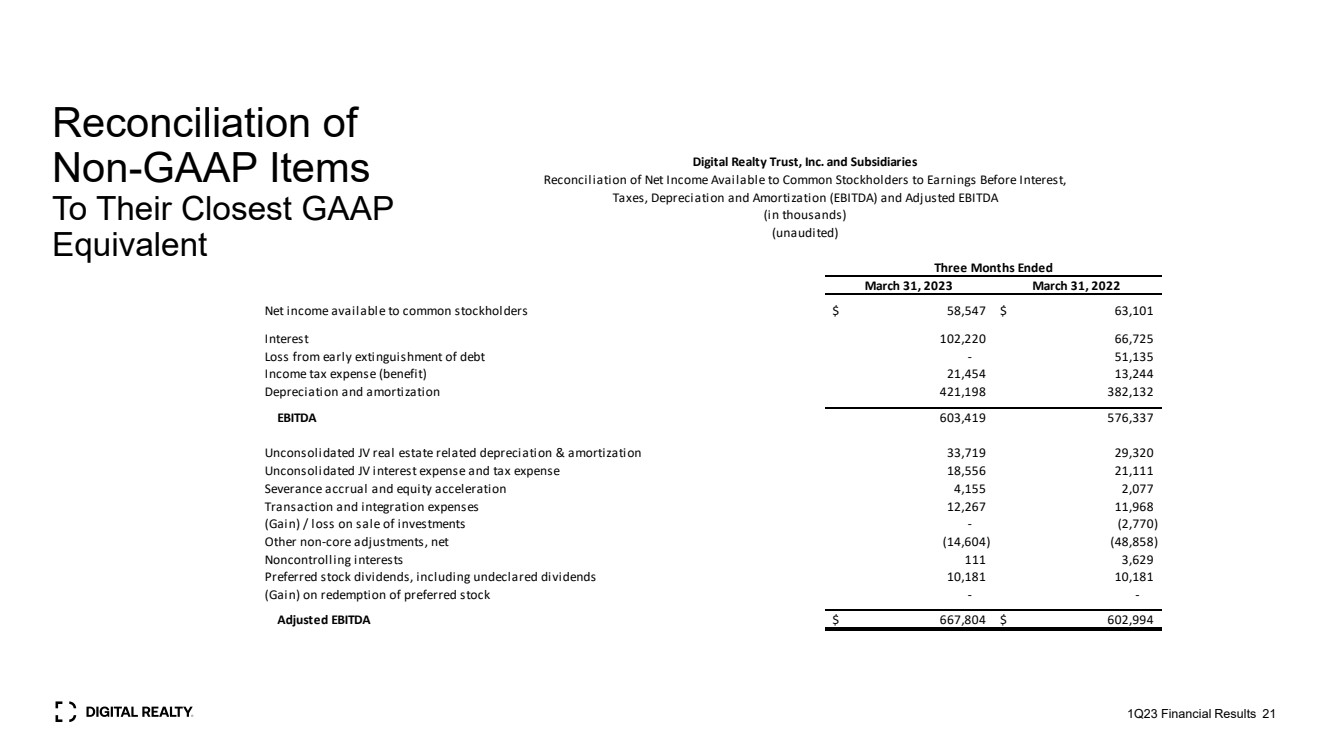
| Reconciliation of Non-GAAP Items To Their Closest GAAP Equivalent 1Q23 Financial Results 21 March 31, 2023 March 31, 2022 Net income available to common stockholders $ 58,547 $ 63,101 Interest 102,220 66,725 Loss from early extinguishment of debt - 51,135 Income tax expense (benefit) 21,454 13,244 Depreciation and amortization 421,198 382,132 EBITDA 603,419 576,337 Unconsolidated JV real estate related depreciation & amortization 33,719 29,320 Unconsolidated JV interest expense and tax expense 18,556 21,111 Severance accrual and equity acceleration 4,155 2,077 Transaction and integration expenses 12,267 11,968 (Gain) / loss on sale of investments - (2,770) Other non-core adjustments, net (14,604) (48,858) Noncontrolling interests 111 3,629 Preferred stock dividends, including undeclared dividends 10,181 10,181 (Gain) on redemption of preferred stock - - Adjusted EBITDA $ 667,804 $ 602,994 Digital Realty Trust, Inc. and Subsidiaries Reconciliation of Net Income Available to Common Stockholders to Earnings Before Interest, (in thousands) (unaudited) Three Months Ended Taxes, Depreciation and Amortization (EBITDA) and Adjusted EBITDA |
| Reconciliation of Non-GAAP Items To Their Closest GAAP Equivalent 1Q23 Financial Results 22 March 31, 2023 March 31, 2022 Rental revenues $ 684,585 $ 639,728 Tenant reimbursements - Utilities 262,406 190,406 Tenant reimbursements - Other 31,471 42,707 Interconnection and other 83,850 81,007 Total Revenue 1,062,312 953,847 Utilities 281,877 205,404 Rental property operating 169,589 155,715 Property taxes 30,257 37,089 Insurance 4,038 3,556 Total Expenses 485,761 401,764 Net Operating Income $ 576,551 $ 552,083 Less: Stabilized straight-line rent $ 998 $ (3,449) Above and below market rent 1,704 694 Same Capital Cash Net Operating Income $ 573,848 $ 554,838 Same Capital Cash NOI impact of holding '22 Exchange Rates Constant 10,014 - Constant Currency Same Capital Cash Net Operating Income $ 583,862 $ 554,838 Three Months Ended Digital Realty Trust, Inc. and Subsidiaries Reconciliation of Same Capital Cash Net Operating Income (in thousands) (unaudited) |

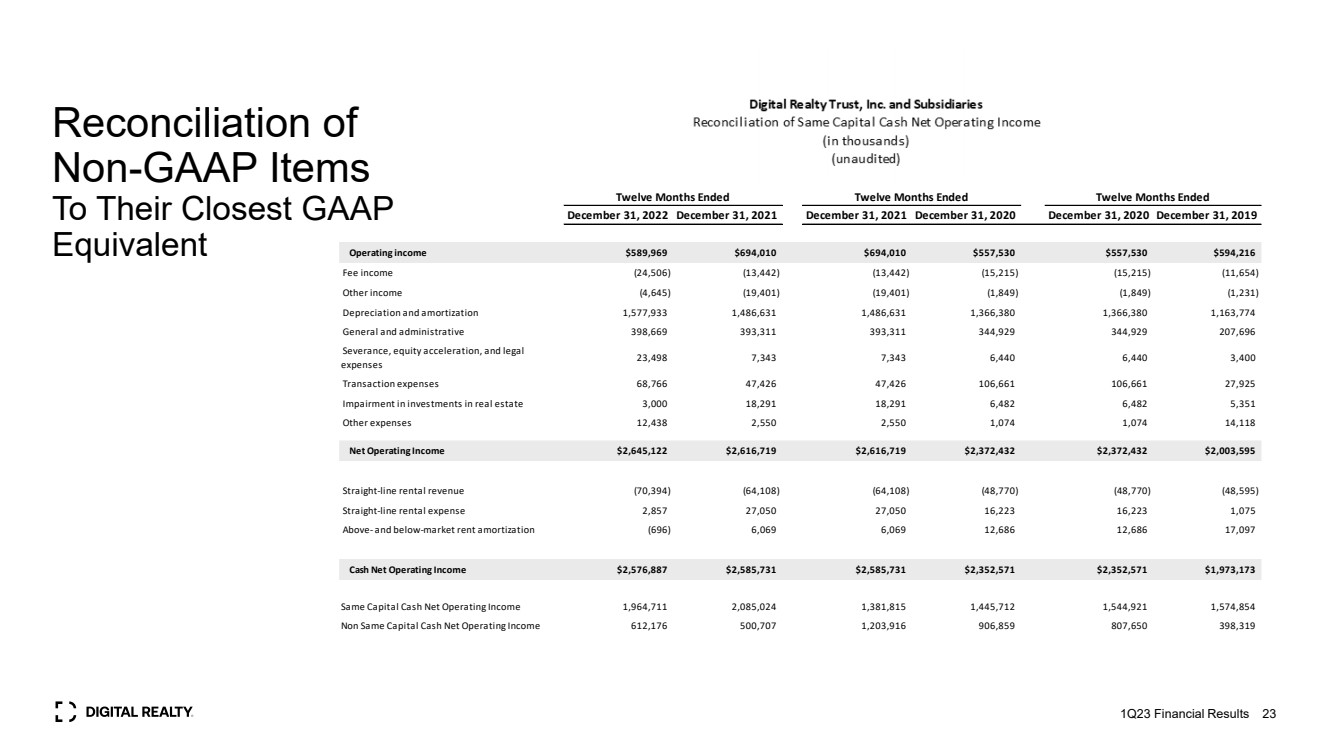
| 1Q23 Financial Results 23 Reconciliation of Non-GAAP Items To Their Closest GAAP Equivalent December 31, 2022 December 31, 2021 December 31, 2021 December 31, 2020 December 31, 2020 December 31, 2019 Operating income $589,969 $694,010 $694,010 $557,530 $557,530 $594,216 Fee income (24,506) (13,442) (13,442) (15,215) (15,215) (11,654) Other income (4,645) (19,401) (19,401) (1,849) (1,849) (1,231) Depreciation and amortization 1,577,933 1,486,631 1,486,631 1,366,380 1,366,380 1,163,774 General and administrative 398,669 393,311 393,311 344,929 344,929 207,696 Severance, equity acceleration, and legal expenses 23,498 7,343 7,343 6,440 6,440 3,400 Transaction expenses 68,766 47,426 47,426 106,661 106,661 27,925 Impairment in investments in real estate 3,000 18,291 18,291 6,482 6,482 5,351 Other expenses 12,438 2,550 2,550 1,074 1,074 14,118 Net Operating Income $2,645,122 $2,616,719 $2,616,719 $2,372,432 $2,372,432 $2,003,595 Straight-line rental revenue (70,394) (64,108) (64,108) (48,770) (48,770) (48,595) Straight-line rental expense 2,857 27,050 27,050 16,223 16,223 1,075 Above- and below-market rent amortization (696) 6,069 6,069 12,686 12,686 17,097 Cash Net Operating Income $2,576,887 $2,585,731 $2,585,731 $2,352,571 $2,352,571 $1,973,173 Same Capital Cash Net Operating Income 1,964,711 2,085,024 1,381,815 1,445,712 1,544,921 1,574,854 Non Same Capital Cash Net Operating Income 612,176 500,707 1,203,916 906,859 807,650 398,319 Twelve Months Ended Twelve Months Ended Twelve Months Ended |
| 1Q23 Financial Results 24 Reconciliation of Non-GAAP Items To Their Closest GAAP Equivalent December 31, 2019 December 31, 2018 December 31, 2018 December 31, 2017 December 31, 2017 December 31, 2016 $594,216 $549,787 $549,787 $451,295 $451,295 $497,286 (11,654) (7,841) (7,841) (6,372) (6,372) (6,285) (1,231) (1,924) (1,924) (1,031) (1,031) (33,197) 1,163,774 1,186,896 1,186,896 842,464 842,464 699,324 207,696 160,363 160,363 156,711 156,711 146,526 3,400 3,304 3,304 4,730 4,730 6,207 27,925 45,327 45,327 76,048 76,048 20,491 5,351 — — 28,992 28,992 — 14,118 2,818 2,818 3,077 3,077 213 $2,003,595 $1,938,730 $1,938,730 $1,555,914 $1,555,914 $1,330,565 (50,273) (40,423) (40,423) (16,564) (16,564) (24,254) 1,075 9,878 9,878 12,075 12,075 22,341 17,097 26,533 26,533 1,840 1,840 (8,313) $1,971,495 $1,934,718 $1,934,718 $1,553,266 $1,553,266 $1,320,339 1,540,650 1,604,864 1,076,981 1,073,225 923,556 895,059 430,845 329,854 857,737 480,041 629,710 425,280 Twelve Months Ended Twelve Months Ended Twelve Months Ended Operating income Fee income Other income Depreciation and amortization General and administrative Severance, equity acceleration, and legal expenses Transaction expenses Impairment in investments in real estate Other expenses Net Operating Income Straight-line rental revenue Straight-line rental expense Above- and below-market rent amortization Cash Net Operating Income Same Capital Cash Net Operating Income Non Same Capital Cash Net Operating Income |

| Thank you |