Use these links to rapidly review the document
TABLE OF CONTENTS
INDEX TO CONSOLIDATED FINANCIAL STATEMENTS
As filed with the Securities and Exchange Commission on July 29, 2004
Registration No. 333-
UNITED STATES
SECURITIES AND EXCHANGE COMMISSION
Washington, D.C. 20549
FORM S-1
REGISTRATION STATEMENT
UNDER
THE SECURITIES ACT OF 1933
THE KENAN ADVANTAGE GROUP, INC.
(Exact name of registrant as specified in its charter)
| Delaware | 4213 | 34-1950439 | ||
| (State or other jurisdiction of incorporation or organization) | (Primary Standard Industrial Classification Code Number) | (I.R.S. Employer Identification Number) |
4895 Dressler Road, Canton, Ohio 44718, (330) 491-0474
(Address, including zip code, and telephone number, including area code, of registrant's principal executive offices)
Dennis A. Nash, President and Chief Executive Officer
The Kenan Advantage Group, Inc.
4895 Dressler Road, Canton, Ohio 44718
(330) 491-0474
(Name, address, including zip code, and telephone number, including area code, of agent for service)
Copies to:
| Paul Jacobs, Esq. Roy L. Goldman, Esq. Fulbright & Jaworski L.L.P. 666 Fifth Avenue New York, New York 10103 Telephone (212) 318-3000 Fax (212) 318-3400 | Kris F. Heinzelman, Esq. George A. Stephanakis, Esq. Cravath, Swaine & Moore LLP Worldwide Plaza 825 Eighth Avenue New York, New York 10019 Telephone (212) 474-1000 Fax (212) 474-3700 |
Approximate date of commencement of proposed sale to public:
As soon as practicable after this Registration Statement becomes effective.
If any of the securities being registered on this Form are to be offered on a delayed or continuous basis pursuant to Rule 415 under the Securities Act of 1933, as amended (the "Securities Act"), check the following box. o
If this Form is filed to register additional securities for an offering pursuant to Rule 462(b) under the Securities Act, please check the following box and list the Securities Act registration statement number of the earlier effective registration statement for the same offering. o
If this Form is a post-effective amendment filed pursuant to Rule 462(c) under the Securities Act, check the following box and list the Securities Act registration statement number of the earlier effective registration statement for the same offering. o
If this Form is a post-effective amendment filed pursuant to Rule 462(d) under the Securities Act, check the following box and list the Securities Act registration statement number of the earlier effective registration statement for the same offering. o
If delivery of the prospectus is expected to be made pursuant to Rule 434, please check the following box. o
CALCULATION OF REGISTRATION FEE
| Title of Each Class of Securities to be Registered | Proposed Maximum Aggregate Offering Price(1) | Amount of Registration Fee | ||
|---|---|---|---|---|
| Common stock, $0.0001 par value per share | $92,000,000 | $11,657 | ||
- (1)
- Estimated solely for the purpose of calculating the registration fee pursuant to Rule 457(o) under the Securities Act. The proposed maximum aggregate offering price includes amounts attributed to shares of common stock that the underwriters may purchase to cover over-allotments, if any.
The Registrant hereby amends this Registration Statement on such date or dates as may be necessary to delay its effective date until the Registrant shall file a further amendment which specifically states that this Registration Statement shall thereafter become effective in accordance with Section 8(a) of the Securities Act or until the Registration Statement shall become effective on such date as the Commission, acting pursuant to said Section 8(a), may determine.
SUBJECT TO COMPLETION, DATED JULY 29, 2004
The information in this prospectus is not complete and may be changed. We and the selling stockholders may not sell these securities until the registration statement filed with the Securities and Exchange Commission is effective. This prospectus is not an offer to sell these securities and it is not soliciting an offer to buy these securities in any state where the offer or sale is not permitted.
Shares
Common Stock
We are selling shares of our common stock.
Prior to this offering, there has been no public market for our common stock. The initial public offering price of the common stock is expected to be between $ and $ per share. We will apply to have the shares of our common stock approved for quotation on The Nasdaq National Market under the symbol "TKAG."
The underwriters have an option to purchase from the selling stockholders identified in this prospectus up to an additional shares of common stock to cover over-allotments of shares. We will not receive any of the proceeds from any shares of common stock sold by the selling stockholders.
Investing in our common stock involves risks. See "Risk Factors" beginning on page 10.
| | Price to Public | Underwriting Discounts and Commissions | Proceeds to KAG | ||||||
|---|---|---|---|---|---|---|---|---|---|
| Per Share | $ | $ | $ | ||||||
| Total | $ | $ | $ | ||||||
Delivery of the shares of common stock will be made on or about , 2004.
Neither the Securities and Exchange Commission nor any state securities commission has approved or disapproved of these securities or determined if this prospectus is truthful or complete. Any representation to the contrary is a criminal offense.
Credit Suisse First Boston | UBS Investment Bank |
| KeyBanc Capital Markets | ||
| Legg Mason Wood Walker Incorporated | ||
| Stephens Inc. | ||
The date of this prospectus is , 2004.
2003 STATISTICS*
- •
- 21 billion gallons of refined petroleum products delivered
- •
- 57.5 million gallons per day
- •
- 2.4 million gallons per hour
- •
- 40,000 gallons per minute
- •
- 1 load (9,000 gallons) every 12 seconds
- •
- 700 gallons per second
- *
- On a pro forma basis after giving effect to the acquisition of the fuels delivery operations of Beneto, Inc. and Carl Klemm, Inc. in 2003.
You should rely only on the information contained in this document or to which we have referred you. We have not authorized anyone to provide you with information that is different from that contained in this prospectus. This document may only be used where it is legal to sell these securities. The information in this prospectus may only be accurate on the date of this prospectus regardless of the time of delivery of this prospectus.
Market and industry data and other statistical information used throughout this prospectus are based on independent industry publications, government publications and other published independent sources. The most recent government data available regarding the petroleum industry is for 2002. Some data are also based on our good faith estimates, which are derived from management's knowledge of the industry and independent sources. Although we believe that these sources are reliable, we have not independently verified the information and cannot guarantee its accuracy and/or completeness. Similarly, we believe our internal research is reliable, but it has not been verified by any independent sources.
Dealer Prospectus Delivery Obligation
Until , 2004 (the 25th day after the date of this prospectus), all dealers that effect transactions in these securities, whether or not participating in this offering, may be required to deliver a prospectus. This is in addition to the dealer's obligation to deliver a prospectus when acting as an underwriter and with respect to unsold allotments or subscriptions.
i
This summary highlights information contained elsewhere in this prospectus but might not contain all of the information that is important to you. Before investing in our common stock, you should read the entire prospectus carefully, including the "Risk Factors" section and our historical and pro forma consolidated financial statements and the notes thereto included elsewhere in this prospectus.
We conduct our business primarily through our operating subsidiaries, each of which is a direct or indirect wholly owned subsidiary of The Kenan Advantage Group, Inc. For purposes of this prospectus, unless the context otherwise requires, all references herein to "our company," "Kenan Advantage," "KAG," "we," "us" and "our" refer to The Kenan Advantage Group, Inc. and its consolidated subsidiaries and their predecessors. Whenever we refer to information being provided as pro forma or on a pro forma basis, we are presenting the information assuming that our acquisitions of the fuels delivery operations of Beneto, Inc. and Carl Klemm, Inc., which we completed in May 2003 and June 2003, respectively, had occurred on January 1, 2003. Unless otherwise indicated, the information contained in this prospectus assumes that the underwriters' over-allotment option is not exercised.
We are the largest independent fuels delivery carrier in North America. We make regular, local deliveries of refined petroleum products, such as gasoline, diesel and aviation fuels, to our customers. We believe our short-haul, "last mile" delivery of refined petroleum products from pipelines and refineries to gasoline stations, fuel marketers and other end users is a vital link in the country's energy distribution network. In 2002, this network distributed approximately 260 billion gallons of refined petroleum products that were consumed in the United States during that year. On a pro forma basis, we delivered approximately 21 billion gallons of refined petroleum products in 2003 to our customers using our network of 77 terminals and 93 satellite operations. With approximately $365 million in revenue and approximately $416 million in pro forma revenue for 2003, and approximately $104 million in revenue for the three months ended March 31, 2004, we are approximately six times larger than our next largest competitor.
Our customer base includes most of the major oil companies, as well as truck stop chains, convenience stores, hypermarkets, aviation fuel marketers and other national and regional petroleum marketers. For most of our customers, we operate under contracts that have specified minimum levels of business. Each of our ten largest customers for 2003 has been a customer of ours for more than ten years. We are the only independent fuels delivery carrier with a nationwide network, with operations in 32 states and the ability to deliver within all 48 states of the continental United States, as well as Canada. Our nationwide network allows us to offer our national and regional customers broad distribution capabilities that are difficult for our smaller competitors to replicate. In addition, we seek to expand the services we offer our customers by providing value-added logistics solutions such as real-time delivery monitoring, inventory and supply source management, fleet scheduling and integrated billing and payment. These services, together with our nationwide footprint, make us a nationwide single source provider of supply chain solutions for petroleum and petrochemical products. We believe that with our size, capabilities, scope of services and geographic reach, we are well-positioned to capitalize on both our customers' continued outsourcing of their fuels delivery operations and our industry's trend towards consolidation.
We have grown substantially through strategic acquisitions and internal growth. Prior to 1992, we provided fuels delivery services primarily in northeastern Ohio. By 1998, we had expanded throughout Ohio and into Michigan, Kentucky, West Virginia and western Pennsylvania. Since 2000, we have expanded from 14 to 32 states and expanded our infrastructure with six acquisitions and 17 private fleet conversions, through which we have taken ownership of our customers' private fleets and service the business they previously had serviced on their own. This expansion has allowed us to build the only independent national fuels delivery carrier in our industry. Between 1992 and 2003, we grew our revenue, organically and through acquisitions, from approximately $7 million to approximately
1
$416 million on a pro forma basis, representing a compound annual growth rate of approximately 45%. We believe our size, capabilities and geographic scope will allow us to increase operating efficiencies for ourselves and our customers and improve driver productivity, as well as enable us to increase our revenue by expanding the services we provide to our customers and by capitalizing on industry trends.
The nationwide consumption of refined petroleum products, such as gasoline, diesel and aviation fuels, drives the underlying demand for delivery of these products from refiners to fuel marketers and other end users. Historically, consumption of gasoline and other refined petroleum products has been very stable, exhibiting compounded annual growth of approximately 1.4% from 1980 through 2002. The Energy Information Administration of the U.S. Department of Energy estimates that retail demand for refined petroleum products will increase between 2002 and 2025 at a compounded annual growth rate of 1.6%, a 44% increase over the total period. Unlike trucking companies that service the more cyclical retail and manufacturing sectors, demand for fuels delivery service is non-cyclical, although the industry experiences increased seasonal demand in periods of heightened driving activity in certain areas of the country.
We estimate, based on industry sources, that approximately 264 billion gallons of refined petroleum products were consumed during 2003. We believe that substantially all of these 264 billion gallons were transported by truck at some point in the distribution process and, based on our revenue per gallon, represent a market in excess of $6 billion. Of this market, we estimate that 60% to 70%, or approximately 158 billion to 185 billion gallons, is still handled by the in-house private fleets of the major oil companies and other petroleum marketers. As major oil companies have renewed their focus on their core operations of oil and gas exploration, production, refining and marketing over the past few years, several have made the decision to outsource a number of their non-core functions, including their fuels delivery and logistics needs, in order to reduce costs and lower overhead. We are seeing this outsourcing trend take several forms. For example, some major oil companies and other petroleum marketers may choose to outsource a portion, or all, of their fuels delivery and logistics operations, while others may choose to outsource the logistics function only and retain control over their own private fleets. We believe an independent carrier with the infrastructure and technology capable of reliably serving the major petroleum marketers on a national and regional basis will be well-positioned to benefit from both of these outsourcing trends.
The remaining 30% to 40% of the market is highly fragmented, served by more than 1,000 small regional or local carriers. Because our industry is characterized by stringent customer requirements relating to safety, significant insurance requirements and substantial federal and state regulatory requirements relating to safety, driver training, equipment and product handling, many of these companies are facing increased pressure from escalating insurance and operating costs, which has created a difficult environment for smaller carriers with lesser financial resources. As a result, many of these small regional and local carriers are being forced to exit the industry or partner with a larger company better equipped to meet these strict customer, insurance and regulatory requirements. In addition to the recent consolidation among the major oil companies, hypermarkets and super regional and national chains have emerged to replace many of the independent convenience stores and service stations served by many of our competitors. As our customers consolidate, we believe they will increasingly seek a delivery services provider with the size, infrastructure, capabilities, scope of services and geographic reach to service their entire operation, and, as a result, smaller carriers will face increasing pressure to consolidate.
Our industry is characterized by high barriers to entry, such as the time and cost required to develop the capabilities necessary to handle hazardous material, the resources required to recruit and train drivers, substantial industry regulatory and insurance requirements and the significant capital investments required to build a fleet of equipment and establish a network of terminals.
2
In addition, unlike most trucking companies, our core fuels delivery business has an average one-way trip length of approximately 35 miles. This shorter length of haul minimizes our exposure to the difficulties of recruiting and retaining a high quality workforce, because we are able to offer our drivers scheduled shifts that allow them to return home each day and allow them regularly scheduled days off. Furthermore, the new hours-of-service regulations that may reduce the productivity of other trucking companies are not expected to have an impact on our operations, because our scheduled shifts and scheduled time off already comply with these new regulations. Finally, unlike most other trucking companies, we service most of our customers under contracts that specify minimum levels of business.
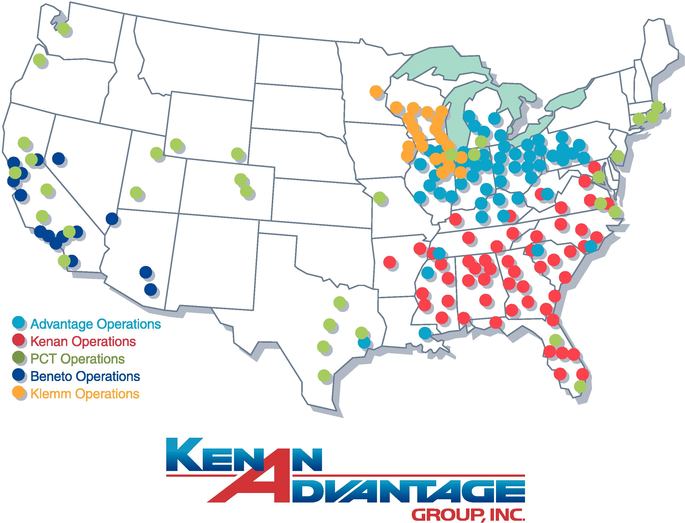
Leading Market Position. We are the largest independent fuels delivery carrier in North America and the only carrier with a nationwide network. With approximately $416 million in pro forma revenue for 2003 and approximately $104 million in revenue for the three months ended March 31, 2004, we are approximately six times larger than our next largest competitor. Our national footprint, with locations in 32 states that allows us to operate in all 48 states in the continental United States, enables us to serve customers with both national and regional shipping requirements and provides us with a significant network of operations. Our extensive network of 77 terminals and 93 satellite operations provides us with the flexibility to successfully handle volume fluctuations, which benefits our customers by helping to eliminate service disruptions and the need to use backup carriers at higher rates during peak periods. We believe that our geographic diversity, capabilities, industry reputation, broad offering of value-added logistics services and proprietary technology will increase our leading market position as our industry consolidates and our customers continue to outsource their fuels delivery operations.
Commitment to Safety and Quality Leads to Strong Industry Reputation. We believe our customers' satisfaction and the success of our company is largely a result of our commitment to safety and quality. Our drivers, as the interface with the customer, play a critical role in helping us build and enhance our customer relationships. We dedicate significant time and resources to ensure our drivers have the proper experience and training, are supported by qualified field and terminal staff, have access to well-maintained equipment, operate in a safe and secure environment and are satisfied with their jobs. Our driver training exceeds federal and state requirements. Our commitment to safety and quality service has resulted in strong relationships with our customers. We provide delivery and logistics services to all of the ten largest petroleum marketers in the United States, including Amerada Hess, BP, ChevronTexaco, Citgo, ExxonMobil, Marathon Ashland, Shell, Sunoco and 7-Eleven. The strength of our reputation and our high rate of overall customer retention is evidenced by the fact that each of our ten largest customers for 2003 has been a customer of ours for more than ten years. We believe our industry reputation has made us the preferred partner of major oil companies and petroleum marketers, as well as the preferred employer of drivers and independent owner-operators.
Industry-Leading Technology. We have developed and are currently implementing proprietary technology aimed at enhancing the efficiency of our operations and lowering our customers' costs. Our technology consists of hardware and software designed specifically for the petroleum transport sector, including the same fleet scheduling software package used by the major oil companies. Our technology enables us to provide customers with a seamless interface throughout their supply chains. For example, we have developed real-time analysis tools that allow us to continuously track our customers' inventory levels in order to minimize their inventory costs and optimize our delivery schedule and truck utilization. Our customers value this technology because it provides them with real-time data to help them lower their inventory costs. We are also developing tools to transmit delivery information to internal billing systems to ensure accuracy and timeliness of billing.
Partner of Choice in a Consolidating Industry. As a result of our size and scope of operations relative to our competitors, as well as our strong industry reputation and our industry-leading technology, we believe we are the carrier of choice to acquire and integrate smaller carriers, as well as
3
to execute private fleet conversions for major oil companies and other petroleum marketers. Because our size allows us to benefit from economies of scale in purchasing items such as fuel, tires and insurance coverage, as well as in training drivers, we believe we are well-positioned to continue strategically acquiring and integrating smaller carriers who find the current operating environment difficult. In addition, we are the only carrier in the industry providing full-service fuels delivery and logistics services to customers on a regional and national basis, and we believe we are the partner of choice for large petroleum marketers, such as the major oil companies, that are considering outsourcing their petroleum delivery and logistics needs.
Experienced Management Team. We have an experienced management team with an average of over 24 years in the industry. In 1991, our chief executive officer and chief financial officer founded the company that is now known as The Kenan Advantage Group. Our management team has extensive experience and a proven track record of growing our company organically, integrating strategic acquisitions, establishing the foundation necessary to service significant new customers and developing new business with existing customers. We believe our management team's experience in identifying, consummating and integrating acquisitions, as well as obtaining outsource contracts and converting private transportation fleets, affords us a competitive advantage in a consolidating industry.
Capitalize on the Current Trend of Private Fleet Conversion. We believe there will continue to be significant revenue growth opportunities as major oil companies and other petroleum marketers increase their focus on core businesses and consider outsourcing non-core operations, such as fuels delivery and logistics. Because the delivery and logistics infrastructure maintained by our customers is difficult to manage and requires substantial internal expertise and resources, including capital spending and management focus, we believe an increasing number of petroleum marketers will choose to sell their internal truck fleets and outsource the delivery services currently provided by those fleets. With our ability to implement industry-leading safety and security programs, hiring and training programs, and key technology and other enhanced value-added systems such as inventory tracking and supply source management, we believe our outsourced delivery and logistics services offer an attractive opportunity to petroleum marketers seeking a viable, cost-effective option for reliable delivery across a large number of locations.
Make Selective Acquisitions. We intend to continue growing through the acquisition of high-quality regional and local petroleum carriers. Overall, the fuels delivery and logistics services market is highly fragmented, consisting of over 1,000 regional and local carriers smaller than us. Many of these smaller or regional players are facing increased pressure from escalating insurance and operating costs, increasing customer demands for additional services and a stricter regulatory environment, and we believe this has created a very favorable environment for strategic acquirors. We have developed a defined process to effectively integrate new acquisitions without adversely affecting operations. Since 2000, we have completed six acquisitions, and we believe there are additional strategically attractive targets that would both complement our existing operations in high fuels consumption markets such as Texas, California and New England as well as expand our geographic reach.
Deliver Value-Added Services to Our Customers. We offer a wide array of value-added services and features that complement the core delivery services we provide to our customers. Our advanced technology will enable us to extend our service offerings into areas we believe are critical to our customers through a variety of technology-based solutions, including web-based access to information in our fully integrated transportation management system. These solutions allow us to market value-added services to our customers, such as real-time delivery monitoring, inventory and supply source management, fleet scheduling, driver performance monitoring and integrated billing and payment. We believe we are the only provider in our industry capable of supplying all of these solutions to our customers.
4
Provide Logistics Outsourcing Solutions. As our customers continue to focus on their core businesses, we believe they will increasingly rely on their primary carriers to provide comprehensive supply chain solutions. We intend to offer bulk transportation solutions to our customers by providing products and services such as scheduling services, best buy or optimal sourcing, fuel capital management, quality assurance and carrier settlement, brokerage services and real-time data. As a logistics provider, we will be able to purchase transportation services from both our company and other carriers, then package that transportation with other value-added services we provide. By managing the logistics function of our customers, we will be able to deliver a high-value solution to our customers while allowing our company to complement our core operations with a more flexible, non asset-based business model.
Opportunistically Serve Existing Customers in Other Product Categories. Many of our existing customers also have delivery needs for other petroleum and non-petroleum based products, such as chemicals, lubricants, plastics and cement. We intend to expand into delivery of those products exhibiting similar characteristics to our core fuels delivery business, primarily those characterized by dedicated short-haul routes with no backhaul or requirement for the driver to make an overnight trip. In addition to refined petroleum products, approximately 7.0% of our pro forma revenue for 2003 and 7.6% of our revenue for the three months ended March 31, 2004 was derived from delivery services for the petrochemical industry, which we estimate has a total market size of approximately $5.7 billion. We believe continued growth in the petrochemical industry, along with expansion into delivery or logistics services for other related products, will provide additional growth opportunities for our company.
We are a Delaware corporation formed in 2001. Our principal executive offices are located at 4895 Dressler Road, Canton, Ohio 44718, and our telephone number is (330) 491-0474. We are a holding company with no significant assets or operations other than direct or indirect ownership of 100% of the stock of our subsidiaries. Our website is located at www.thekag.com. Information contained on our website does not constitute a part of this prospectus.
5
Common stock offered | shares | |
Common stock to be outstanding after the offering | shares (1) | |
Over-allotment option granted | shares, to be sold by the selling stockholders | |
Use of proceeds | We expect to use approximately $40.0 million of the net proceeds of this offering to repay our outstanding subordinated indebtedness, including accrued interest and a prepayment penalty, and the remaining approximately $33.4 million for general corporate purposes, including working capital, capital expenditures, repayment of debt and possible future acquisitions. | |
Proposed Nasdaq National Market symbol | "TKAG" | |
Risk Factors | An investment in our common stock involves a high degree of risk. You should carefully consider the risk factors set forth under "Risk Factors" beginning on page 10 and the other information contained in this prospectus prior to making an investment decision regarding our common stock. |
- (1)
- The number of shares of common stock to be outstanding after this offering gives effect to (i) the issuance of shares of common stock as a dividend to effect a for 1 stock split of our common stock (assuming an initial public offering price of $ per share, the midpoint of the range set forth on the cover page of this prospectus), effective immediately prior to the date set forth on the cover page of this prospectus and (ii) the automatic conversion to common stock of all outstanding shares of our preferred stock upon the closing of this offering, assuming an initial public offering price of $ per share, the midpoint of the range set forth on the cover page of this prospectus.
The number of shares to be outstanding after the offering excludes:
- •
- shares of common stock issuable upon the exercise of options outstanding under our equity compensation plans, having a weighted average exercise price of $ per share;
- •
- shares of common stock reserved for future grant under our equity compensation plans;
- •
- shares of common stock issuable upon the exercise of outstanding warrants, at an exercise price of $ per share;
- •
- shares of common stock issuable upon the exercise of outstanding options at an exercise price of $ per share, which options will only become exercisable if (i) our stock price is equal to or greater than $ (assuming an initial public offering price of $ , the midpoint of the range set forth on the cover page of this prospectus) 180 days after the date of this prospectus or (ii) prior to that date we are sold for a price per share that would result in certain of our current stockholders achieving an internal rate of return of 30% or more (the "Contingent Options"); and
- •
- shares of common stock issuable upon the exercise of outstanding warrants, at an exercise price of $ per share, which warrants will only become exercisable if and to the extent the Contingent Options become exercisable.
See "Description of Capital Stock."
6
Summary Financial Information and Other Data
The following table sets forth our summary financial information and other data. The historical statement of operations data for the years ended December 31, 2001, 2002 and 2003 are derived from, and should be read in conjunction with, our audited financial statements and related notes appearing elsewhere in this prospectus. The pro forma statement of operations and other data for 2003 show what our results of operations and other data might have been had we acquired the petroleum delivery operations of Beneto, Inc. and Carl Klemm, Inc. on January 1, 2003. The historical statement of operations data for the three months ended March 31, 2003 and March 31, 2004 and the historical balance sheet data as of March 31, 2004 are derived from our unaudited financial statements. In management's opinion, these unaudited financial statements have been prepared on substantially the same basis as the audited financial statements and include all adjustments, consisting only of normal recurring adjustments, necessary for a fair presentation of the financial data for the periods presented. The results of operations for the interim period are not necessarily indicative of the operating results for the entire year or any future period. The unaudited pro forma financial data is presented for informational purposes only and does not purport to be indicative of our operating results that would have occurred had the acquisition of the fuels delivery operations of Beneto and Klemm actually occurred as of January 1, 2003, nor does it purport to be indicative of our future operating results following the acquisitions.
The information contained in this table should also be read in conjunction with "Use of Proceeds," "Capitalization," "Selected Historical Financial Information," "Unaudited Pro Forma Financial Data," "Management's Discussion and Analysis of Financial Condition and Results of Operations" and the consolidated financial statements and accompanying notes thereto, all included elsewhere in this prospectus.
| | Year Ended December 31,(1) | Three Months Ended March 31,(1) | |||||||||||||||||||
|---|---|---|---|---|---|---|---|---|---|---|---|---|---|---|---|---|---|---|---|---|---|
| | 2001(2) | Historical 2002 | 2003(3) | Pro Forma 2003(4) | 2003 | 2004(5) | |||||||||||||||
| | | | | | (Unaudited) | ||||||||||||||||
| | (Dollars in thousands, except per share data) | ||||||||||||||||||||
| Statement of Operations Data: | |||||||||||||||||||||
Net Revenues | $ | 201,619 | $ | 269,254 | $ | 364,910 | $ | 415,621 | $ | 72,097 | $ | 103,624 | |||||||||
| Operating Costs: | |||||||||||||||||||||
| Wages and employee benefits | 113,086 | 147,155 | 211,542 | 243,992 | 40,619 | 60,744 | |||||||||||||||
| Fuel and other operating costs | 37,084 | 53,260 | 72,672 | 81,759 | 14,943 | 20,768 | |||||||||||||||
| Insurance and claims | 7,531 | 14,775 | 19,495 | 21,318 | 3,884 | 5,354 | |||||||||||||||
| Taxes and licenses | 2,509 | 3,263 | 4,268 | 4,848 | 823 | 1,216 | |||||||||||||||
| General and administrative | 12,522 | 15,972 | 20,082 | 22,137 | 4,088 | 5,527 | |||||||||||||||
| Depreciation and amortization | 11,674 | 13,514 | 19,074 | 22,146 | 3,732 | 5,623 | |||||||||||||||
| Total operating costs | 184,406 | 247,939 | 347,133 | 396,200 | 68,089 | 99,232 | |||||||||||||||
| Income from operations | 17,213 | 21,315 | 17,777 | 19,421 | 4,008 | 4,392 | |||||||||||||||
| Other income (expenses): | |||||||||||||||||||||
| Interest expense | (10,657 | ) | (11,648 | ) | (12,841 | ) | (14,149 | ) | (3,035 | ) | (3,270 | ) | |||||||||
| Change in fair value of detachable stock warrants(6) | — | — | (13,687 | ) | (13,687 | ) | — | — | |||||||||||||
| Management fee to related party(7) | (402 | ) | (511 | ) | (550 | ) | (550 | ) | (138 | ) | (138 | ) | |||||||||
| Interest income and other expenses, net | (240 | ) | 16 | (765 | ) | (699 | ) | 247 | (256 | ) | |||||||||||
| Income (loss) before income taxes | 5,914 | 9,172 | (10,066 | ) | (9,664 | ) | 1,082 | 728 | |||||||||||||
| Income taxes | 2,673 | 3,589 | 1,533 | 1,609 | 432 | 288 | |||||||||||||||
| Net income (loss) | $ | 3,241 | $ | 5,583 | $ | (11,599 | ) | $ | (11,273 | ) | $ | 650 | $ | 440 | |||||||
| Net income (loss) per share | |||||||||||||||||||||
| Basic | |||||||||||||||||||||
| Diluted | |||||||||||||||||||||
7
| | Year Ended December 31,(1) | Three Months Ended March 31,(1) | |||||||||||||||||
|---|---|---|---|---|---|---|---|---|---|---|---|---|---|---|---|---|---|---|---|
| | 2001(2) | Historical 2002 | 2003(3) | Pro Forma 2003(4) | 2003 | 2004(5) | |||||||||||||
| | | | | | (Unaudited) | ||||||||||||||
| | (Dollars in thousands, except per mile data) | ||||||||||||||||||
Other Data: | |||||||||||||||||||
Adjusted net income(8) | $ | 3,241 | $ | 5,583 | $ | 2,088 | $ | 2,414 | $ | 650 | $ | 440 | |||||||
| Adjusted EBITDA(9) | $ | 28,578 | $ | 34,492 | $ | 36,382 | $ | 41,164 | $ | 7,851 | $ | 9,908 | |||||||
| Net cash provided by operating activities | $ | 18,440 | $ | 14,213 | $ | 22,249 | $ | 26,955 | $ | 6,677 | $ | 13,701 | |||||||
| Net cash (used in) investing activities | $ | (95,769 | ) | $ | (11,459 | ) | $ | (61,845 | ) | $ | (61,845 | ) | $ | (4,305 | ) | $ | (4,486 | ) | |
| Net cash provided by (used in) financing activities | $ | 81,892 | $ | (4,706 | ) | $ | 41,963 | $ | 41,963 | $ | (2,297 | ) | $ | (6,475 | ) | ||||
Number of Loads | 1,206,273 | 1,475,174 | 2,003,366 | 2,277,224 | 386,848 | 569,515 | |||||||||||||
| Miles Driven | 106,676,722 | 138,064,494 | 183,926,450 | 207,024,158 | 36,801,466 | 51,045,818 | |||||||||||||
| Revenue Per Mile | $ | 1.89 | $ | 1.95 | $ | 1.98 | $ | 2.01 | $ | 1.96 | $ | 2.03 | |||||||
| Number of Tractors (10)(11) | 1,117 | 1,292 | 1,595 | 1,595 | 1,231 | 1,594 | |||||||||||||
| Number of Trailers (10) | 1,812 | 1,818 | 2,579 | 2,579 | 1,865 | 2,638 | |||||||||||||
| Number of Company Drivers (10) | 1,535 | 2,101 | 2,953 | 2,953 | 2,213 | 2,823 | |||||||||||||
| Number of Owner-Operators (10) | 277 | 278 | 472 | 472 | 322 | 520 | |||||||||||||
As of March 31, 2004 | ||||||||
|---|---|---|---|---|---|---|---|---|
| | Actual | Pro Forma(12) | Pro Forma As Adjusted(13) | |||||
| | (Dollars in thousands) | |||||||
| Balance Sheet Data: | ||||||||
| Working capital | $ | 2,559 | $ | 14,261 | ||||
| Total assets | 296,312 | 302,003 | ||||||
| Total indebtedness, including current maturities(14) | 156,930 | 166,667 | ||||||
| Total stockholders' equity(15) | 46,001 | 43,747 | ||||||
- (1)
- Effective May 1, 2001, we completed the acquisition of Kenan Transport Company, a publicly-traded company founded in 1949 that had become the largest independent fuels delivery carrier in the industry (based on revenues), with operations focused in the southeast United States. Effective May 31, 2003, we acquired the fuels delivery operations of Beneto, Inc. ("Beneto"), which operates primarily in California, and effective June 30, 2003, we acquired substantially all the assets of Carl Klemm, Inc. ("Klemm"), which operates primarily in Wisconsin and Illinois. Because the results of operations of these entities are included in our financial results from the respective dates of acquisition, a comparison of our period-to-period financial results may not necessarily be meaningful. See "Unaudited Pro Forma Financial Data," which shows what our results of operations might have been had we acquired the Beneto and Klemm operations on January 1, 2003, and Note 2 to our consolidated financial statements included elsewhere in this prospectus.
- (2)
- Includes the results of operations of Kenan Transport Company from May 1, 2001. See "Certain Relationships and Related Transactions—The Kenan Acquisition" and Note 2 to our consolidated financial statements included elsewhere in this prospectus.
- (3)
- Includes the results of operations of the fuels delivery operations of Beneto from May 31, 2003 and Klemm from June 30, 2003. See "Unaudited Pro Forma Financial Data" and Note 2 to our consolidated financial statements included elsewhere in this prospectus.
- (4)
- Gives effect to the acquisition of the fuels delivery operations of Beneto and Klemm, including the incurrence of $50.0 million of indebtedness to finance the acquisitions (including the transaction costs), as if the acquisitions had occurred on January 1, 2003. See "Unaudited Pro Forma Financial Data" and Note 2 to our consolidated financial statements included elsewhere in this prospectus.
- (5)
- Includes the actual results of operations of the fuels delivery operations of Beneto and Klemm described in note 1 above for the entire period.
- (6)
- Represents the non-cash charge related to the change in fair value of warrants issued to holders of our subordinated debt. The holders of these warrants have the right, which will terminate upon the closing of this offering, to require us to repurchase these warrants for an amount in cash based upon the fair market value of the underlying shares at any time beginning April 30, 2006 and earlier upon the occurrence of certain events. See "Description of Capital Stock—Warrants" and Note 3 to our consolidated financial statements included elsewhere in this prospectus.
- (7)
- For a description of the management fees paid to Sterling Investment Partners Advisors, LLC, RFE Management Corporation and Sterling Ventures Limited, all of which are affiliates of two of our principal stockholders, see "Certain Relationships and Related Transactions."
- (8)
- Represents net income excluding, in the year ended December 31, 2003 (actual and pro forma), the non-cash charge of $13,687,000 related to the change in fair value of warrants issued to holders of our subordinated debt. This non-cash charge is not deductible for income tax purposes and therefore did not affect our tax provision. We believe this figure is useful in allowing management and our investors to compare our annual operating results without the accounting effect attributable to put rights attached to our warrants that will terminate following the closing of this offering. See note 6 above. However,
8
adjusted net income is not a measure of financial performance under U.S. generally accepted accounting principles ("GAAP") and should be considered in addition to, but not as a substitute for, other measures of financial performance reported in accordance with GAAP, such as net income.
- Adjusted net income is calculated in the following manner for each of the periods presented:
| | | Year Ended December 31,(1) | Three Months Ended March 31,(1) | ||||||||||||||||
|---|---|---|---|---|---|---|---|---|---|---|---|---|---|---|---|---|---|---|---|
| | | 2001 | 2002 | 2003 | Pro Forma 2003(4) | 2003 | 2004(5) | ||||||||||||
| | | (Dollars in thousands) | |||||||||||||||||
| Net income (loss) | $ | 3,241 | $ | 5,583 | $ | (11,599 | ) | $ | (11,273 | ) | $ | 650 | $ | 440 | |||||
| Change in fair value of detachable stock warrants | — | — | 13,687 | 13,687 | — | — | |||||||||||||
| Adjusted net income | $ | 3,241 | $ | 5,583 | $ | 2,088 | $ | 2,414 | $ | 650 | $ | 440 | |||||||
- (9)
- Adjusted EBITDA represents net income (loss) plus income taxes, interest expense and depreciation and amortization and non-operating non-cash charges. Adjusted EBITDA is presented herein because we believe it to be relevant and useful information to our investors because it is used by our management to evaluate our operating performance compared to that of other companies in our industry, as the calculation of Adjusted EBITDA eliminates the effects of financing, income taxes, the accounting effects of capital spending and other non-operating non-cash charges, which items may vary for different companies for reasons unrelated to overall operating performance. Adjusted EBITDA is also used by our lenders in evaluating our financial performance. When analyzing our operating performance, however, investors should use Adjusted EBITDA in addition to, not as an alternative for, operating income, net income and cash flow from operating activities, as those terms are defined by GAAP. Investors should also note that our presentation of Adjusted EBITDA may not be comparable to similarly titled measures used by other companies.
- Adjusted EBITDA is calculated in the following manner for each of the periods presented:
| | | Year Ended December 31,(1) | Three Months Ended March 31,(1) | ||||||||||||||||
|---|---|---|---|---|---|---|---|---|---|---|---|---|---|---|---|---|---|---|---|
| | | 2001(2) | 2002 | 2003(3) | Pro Forma 2003(4) | 2003 | 2004(5) | ||||||||||||
| | | (Dollars in thousands) | |||||||||||||||||
| Net income (loss) | $ | 3,241 | $ | 5,583 | $ | (11,599 | ) | $ | (11,273 | ) | $ | 650 | $ | 440 | |||||
| Income taxes | 2,673 | 3,589 | 1,533 | 1,609 | 432 | 288 | |||||||||||||
| Change in fair value of detachable stock warrants | — | — | 13,687 | 13,687 | — | — | |||||||||||||
| Interest expense | 10,657 | 11,648 | 12,841 | 14,149 | 3,035 | 3,270 | |||||||||||||
| Depreciation and amortization | 11,674 | 13,514 | 19,074 | 22,146 | 3,733 | 5,623 | |||||||||||||
| (Gain) loss on disposal of equipment | 333 | 158 | 846 | 846 | 1 | 287 | |||||||||||||
| Adjusted EBITDA | $ | 28,578 | $ | 34,492 | $ | 36,382 | $ | 41,164 | $ | 7,851 | $ | 9,908 | |||||||
- (10)
- As of last day of period.
- (11)
- Excludes tractors owned by owner-operators.
- (12)
- As adjusted to reflect the amendment and restatement of our credit facility on July 13, 2004, including the effect of a charge of $2,254,000 (net of applicable tax benefit of $1,502,000) relating to the write-off of unamortized loan costs associated with the refinanced senior debt.
- (13)
- As adjusted to reflect the amendment and restatement of our credit facility described in note 12 above and our sale of shares of common stock at a price of $ per share, the midpoint of the range set forth on the cover page of this prospectus, and our use of proceeds, net of the underwriting discounts and commissions, to repay $ of outstanding indebtedness, including a prepayment fee of $392,500. In connection with the repayment of debt, we will write off deferred financing costs of $171,200 resulting from the early extinguishment of the subordinated notes. As a result of the prepayment fee and the write off, we will incur a charge of $338,200 (net of applicable tax benefit of $225,500). The increase in stockholders' equity also includes $17,930,000, which represents the carrying value of the put price for the warrants described in note 6 above, which put right expires upon the closing of this offering. See "Use of Proceeds" and "Capitalization."
- (14)
- Net of unamortized discount of $2,583,000 with respect to our subordinated notes that are being repaid with the proceeds of this offering.
- (15)
- Each share of our preferred stock is convertible into shares of common stock at any time after issuance, subject to adjustment. Each share of preferred stock outstanding will, upon the closing of this offering, automatically convert into the number of shares of common stock equal to the sum of (a) shares of common stock converted at the original conversion rate plus (b) the number of shares of common stock equal to the liquidation value per share divided by the initial public offering price of our common stock (the "adjustment feature"). The adjustment feature represents a beneficial conversion option to the existing holders of convertible preferred stock that will be recorded as a preferred stock dividend of approximately $ upon the closing of this offering (assuming an initial public offering price of $ , the midpoint of the range set forth on the cover page of this prospectus).
9
You should carefully consider the risks described below before investing in our common stock. Although the risks described below are all of the risks that we believe are material, they are not the only risks relating to our business and our common stock. Additional risks and uncertainties not currently known to us or that we currently deem to be immaterial may also materially and adversely affect our business operations. Any of the following risks could materially adversely affect our business, financial condition or results of operations. The trading price of our common stock could decline due to any of these risks, and you may lose all or part of your investment.
Risks Relating to Our Business
Our business is subject to general economic and other factors that are largely out of our control and could affect our operations and profitability.
Our business is dependent on various economic and other factors over which we have no control, such as the availability of qualified drivers, changes in fuel and insurance prices, including changes in fuel taxes, excess capacity in the trucking industry, changes in license and regulation fees, changes in regulatory requirements, rising healthcare costs, interest rate fluctuations and downturns in our customers' business cycles. As a result, we may experience periods of overcapacity, declining prices and lower profit margins in the future. Our revenues and operating income could be materially adversely affected if we are unable to pass through to our customers the full amount of increased transportation costs. Our ten largest customers accounted for approximately 56.3% and 49.3% of our revenues in 2003 and the three months ended March 31, 2004, respectively, and we expect that they will continue to account for a significant portion of our revenues in the future. If these customers experience fluctuations in their business activity due to an economic downturn, work stoppages or other factors over which we have no control, the volume of petroleum products transported by us on behalf of those customers may decrease and our operating results could be adversely affected. Furthermore, customers encountering adverse economic conditions may have difficulty in paying for our services, and if they file for protection under the bankruptcy laws we may have to return certain payments they made to us.
We operate in a highly competitive industry, and competitive pressures may adversely affect our operations and profitability.
Numerous competitive factors could impair our ability to maintain our current level of revenues and profitability and adversely affect our financial condition. These factors include the following:
- •
- we compete with many other fuels delivery service providers, particularly smaller regional competitors, some of which may have more equipment in, or stronger ties to, the geographic regions in which they operate or other competitive advantages;
- •
- some of our competitors periodically reduce their prices to gain business, which may limit our ability to maintain or increase prices, implement new pricing strategies or maintain significant growth in our business;
- •
- many customers periodically accept bids from multiple carriers, and this process may depress prices or result in the loss of some business to competitors;
- •
- many customers are looking to reduce the number of carriers they use, and in some instances we may not be selected to provide services;
- •
- the current trend of consolidation in the fuels delivery industry could create other large carriers with greater financial resources than we have and other competitive advantages relating to their size;
10
- •
- the development of alternative power sources for cars and trucks could reduce demand for gasoline; and
- •
- advances in technology require increased investments to maintain competitiveness, and we may not have the financial resources to invest in technology improvements or our customers may not be willing to accept higher prices to cover the cost of these investments.
If we are unable to address these competitive pressures, our operations and profitability may be adversely affected.
Our continued growth is dependent upon major oil companies and other petroleum marketers continuing to outsource petroleum delivery to retail outlets.
Historically, major oil companies and other petroleum marketers have delivered petroleum to their service stations through proprietary fleets. With the advent of deregulation, which eliminated tariff rates and promoted price competition, and facing high labor costs, these companies have begun over the past several years to outsource delivery of refined petroleum products to retail outlets. Our strategy is to grow in part by taking advantage of continued outsourcing opportunities. However, we estimate that major oil companies and other petroleum marketers still deliver 60% to 70% of all refined petroleum products delivered in the United States using in-house fleets. These companies may choose not to continue to outsource delivery of petroleum products to retail outlets in the future. If these companies do not continue to expand their outsourcing of delivery of refined petroleum products, or if they reduce the amount of refined petroleum product delivery currently outsourced, our business, results of operations and financial condition could be materially adversely affected.
Our growth will depend in part upon making acquisitions, which are subject to the uncertainties of evaluating potential liabilities, integration risks and other difficulties.
Our recent growth is due in part to acquisitions of regional fuels delivery companies. We expect our continued growth to depend in part upon our ability to acquire regional competitors in strategically desirable locations and to integrate them successfully into our existing operations.
Successful acquisitions require an assessment of a number of factors, many of which are beyond our control. These factors include operating costs and potential environmental and other liabilities of acquired companies and the extent to which such acquired companies would retain existing customers and add profitable routes to our geographic scope of coverage. Such assessments are inexact and their accuracy is inherently uncertain. In connection with our assessments, we perform a review, which we believe is generally consistent with industry practices, of the companies to be acquired. However, such a review will not reveal all existing or potential problems. In addition, our review may not permit us to become sufficiently familiar with the companies to fully assess their deficiencies and capabilities.
In seeking acquisitions, we may be required to compete with other potential acquirors, some of which may have substantially greater financial and other resources than those available to us. We are unable to predict whether and when any prospective acquisition candidate will become available or the likelihood that any acquisition will be completed on acceptable terms. Further, if we make future acquisitions, we may issue shares of capital stock that dilute other stockholders, incur debt, assume significant liabilities and create additional expenses related to intangible assets, any of which might reduce our reported earnings or earnings per share. In addition, any financing that we might need for these acquisitions may only be available to us on terms that restrict our business and acquisition-related accounting charges may adversely affect our balance sheet and results of operations.
Additionally, we may encounter difficulties in integrating acquired companies into our existing operations and business because they may have substantially different operating characteristics or be in different geographic locations than our existing operations. Once integrated, acquired businesses may
11
not achieve levels of revenues, profitability or productivity comparable to our existing business or otherwise perform as expected. Also, acquisitions may involve difficulties in the retention of personnel, diversion of management's attention, risks of the customers of acquired companies allocating all or a portion of their business to our competitors while they evaluate the impact of the acquisition, unexpected legal liabilities, and tax and accounting issues. Any inability on our part to consummate and integrate future acquisitions successfully may have a material adverse effect on our results of operations and financial condition.
Our debt levels may limit our flexibility in obtaining additional financing and in pursuing other business opportunities.
We have a significant amount of debt. As of March 31, 2004, on a pro forma basis after giving effect to the amendment and restatement of our credit agreement in July 2004, this offering and our use of the proceeds to repay outstanding indebtedness, our consolidated indebtedness would have been $130.0 million, consisting principally of obligations under our secured credit facility. In addition to the amount then outstanding, we could have borrowed an additional $34.1 million in revolving loans under our credit facility (net of outstanding letters of credit). Following this offering, we will continue to have the ability to incur new debt, subject to limitations in our credit facility. Our level of indebtedness could have important consequences to us, including the following:
- •
- our ability to obtain additional financing, if necessary, for working capital, capital expenditures, acquisitions or other purposes may be impaired or such financing may not be available on favorable terms;
- •
- we will need a substantial portion of our cash flow to make principal and interest payments on our indebtedness, reducing the funds that would otherwise be available for our operations and future business opportunities;
- •
- our debt level may make us more vulnerable than our competitors with less debt to competitive pressures or a downturn in our business or the economy generally;
- •
- our debt level may limit our flexibility in responding to changing business and economic conditions; and
- •
- substantially all of our debt has a variable rate of interest, which increases our vulnerability to interest rate fluctuations.
Our ability to service our indebtedness will depend upon, among other things:
- •
- our future financial and operating performance and cash flows, which will be affected by prevailing economic conditions and financial, business, regulatory and other factors, some of which are beyond our control; and
- •
- the future availability of borrowings under our credit facility or any successor facility, the availability of which may depend on, among other things, our complying with certain covenants.
If our operating results and cash flows are not sufficient to service our current or future indebtedness, we will be forced to take actions such as reducing or delaying our business activities, acquisitions, investments and/or capital expenditures, selling assets, restructuring or refinancing our indebtedness, or seeking additional equity capital or bankruptcy protection. We may not be able to effect any of these remedies on satisfactory terms, or at all.
If new debt is added to our current debt levels, the related risks that we now face could intensify.
12
Our debt agreements contain operating and financial restrictions which may restrict our business and financing activities.
The operating and financial restrictions and covenants in our credit facility and any future financing agreements could adversely affect our ability to finance future operations or capital needs or to engage, expand or pursue our business activities. For example, our credit facility restricts our ability to:
- •
- declare dividends and redeem or repurchase capital stock;
- •
- prepay, redeem or purchase debt;
- •
- make loans and investments;
- •
- incur additional indebtedness or amend our debt and other material agreements;
- •
- make capital expenditures; and
- •
- engage in mergers, acquisitions and asset sales.
Our ability to comply with the covenants and restrictions contained in our debt instruments may be affected by events beyond our control, including prevailing economic, financial and industry conditions. If market or other economic conditions deteriorate, our ability to comply with these covenants may be impaired. If we breach any of the restrictions, covenants, ratios or tests in our debt agreements, a significant portion of our indebtedness may become immediately due and payable, and our lenders' commitments to make further loans to us may terminate. We might not have, or be able to obtain, sufficient funds to make these accelerated payments. In addition, our obligations under our credit facility are secured by substantially all of our assets, and if we are unable to repay our indebtedness under our credit facility, the lenders could seek to foreclose on such assets. Any of these outcomes could have a negative impact on our results of operations.
We may be adversely impacted by fluctuations in the price and availability of fuel.
We require large amounts of diesel fuel to operate our tractors. In 2001, 2002 and 2003 and the three months ended March 31, 2003 and 2004, fuel (including fuel taxes but net of fuel surcharge) represented approximately 6.9%, 8.0%, 7.8%, 8.5% and 7.8%, respectively, of our total operating costs. The market price for fuel, which is currently at its highest price in over a decade, can be extremely volatile and can be affected by a number of economic and political factors. In particular, the continued deterioration of the political climate in the Middle East and certain parts of Africa have contributed to significant increases in fuel prices. In addition, changes in federal or state regulations can impact the price of fuel, as well as increase the amount we pay in fuel taxes. We incorporate a fuel surcharge clause in substantially all of our customer contracts to pass most additional fuel costs above a specified level on to our customers. However, we may not be able to do so in the future. Even where we are able to include fuel surcharges in our customer contracts, such surcharges only apply when the price of fuel exceeds specified levels. The amount of the fuel surcharge each month is typically based on the average price of fuel for the prior month; accordingly, our recovery of fuel costs in excess of the levels specified in our contracts lags the actual increase in fuel prices, and we may never be fully reimbursed for increases in fuel prices above the levels specified in our contracts. We currently do not hedge our fuel purchases to protect against fluctuations in fuel prices that are not covered by fuel surcharges, and therefore are at risk to the extent that changes in the market price of fuel are not covered by the fuel surcharge provisions of our customer contracts. In addition, our customers may negotiate rates or contracts that minimize or eliminate our ability to continue passing on fuel price increases to our customers. If fuel prices increase and we are unable to pass the increased cost to our customers, the additional expense could have a material adverse effect on our business, results of operations and financial condition.
13
Our operations may also be adversely affected by any limit on the availability of fuel. Continued disruptions in the political climate in key oil producing regions in the world, particularly in the event of wars or other armed conflicts, could severely limit the availability of fuel in the United States. In the event our customers face significant difficulty in obtaining fuel, our business, results of operations and financial condition would be materially adversely affected.
We have exposure to certain claims not covered by insurance, and we may not be able to pass on to our customers any increases in the costs of our insurance.
The primary insurable risks associated with our business are bodily injury and property damage, workers' compensation claims, medical claims and cargo loss and damage. We currently self-insure for the first $1,000,000 of our claims exposure resulting from these risks, except for medical claims and cargo loss and damage, where our self-retention is $150,000 per individual (in the case of medical claims) and $150,000 per claim (in the case of cargo loss and damage). In general, the maximum value of the cargo we haul per vehicle is approximately $20,000 and, therefore, we are effectively self-insured for cargo loss and damage. Prior to May 1, 2004, our $1,000,000 self-insurance was $500,000. If the number or severity of claims for which we are self-insured increases, our operating results could be adversely affected. Our self-insured retentions require us to make estimates of expected loss amounts and accrue such estimates as expenses. Changes in estimates may materially and adversely affect our financial results. In addition, our insurance does not cover claims for punitive damages. As a result of the increase in our self-insured retention, it is likely that we will increase our claims accrual as a result of a possible increase in our claims expense.
We also maintain insurance with third party insurance carriers above the amounts for which we self-insure, and we are therefore subject to changing conditions and pricing in the insurance marketplace. Insurance carriers have recently begun to raise rates for many transportation companies. The cost or availability of various types of insurance may change dramatically in the future. If our insurance carriers were to increase our premiums, we would be required to either absorb the increase in premium costs and/or raise our self-insured retention, which could significantly increase our insurance and claims expense. To the extent these costs cannot be passed on to our customers in increased rates or insurance surcharges in customer contracts, increases in our insurance and claims expense could reduce our future profitability.
In addition, our insurance carriers and the states in which we operate require us to post either letters of credit or surety bonds to collateralize our self-insured retention. We currently have letters of credit of $15.9 million outstanding to satisfy these obligations. If our insurance carriers or the states in which we operate require us to increase the amount of collateral we provide in the future, we could face increased costs, including the payment of additional fees to the providers of letters of credit. Since our letters of credit are considered debt under the financial covenants for our financing arrangements, increases in the amount of letters of credit we have outstanding to collateralize our self-insurance obligations will reduce borrowing availability under our credit agreement and reduce our capacity for additional borrowings.
We have significant ongoing capital requirements.
Our business requires substantial ongoing capital investment, particularly for tractors, trailers, terminals and technology. Our capital expenditures were approximately $12.8 million, $18.4 million and $4.0 million in 2002, 2003 and the first quarter of 2004, respectively, and we expect to make capital expenditures of approximately $18.0 million during the remainder of 2004. We expect that operating leases, borrowings under our revolving credit facility, proceeds from this offering and cash flow from operations will be our primary sources of financing for capital expenditures. If we are unable to enter into leases, raise sufficient capital, borrow sufficient funds on terms that are acceptable to us or generate sufficient cash from operations to finance our capital expenditures, we may be forced to limit
14
our growth and operate existing equipment for significant periods of time, each of which could have a material adverse effect on our business, results of operations and financial condition.
We may face difficulty in purchasing new equipment on a timely basis. Any delay in delivery of equipment could impair our ability to serve our customers, and, to the extent that we must obtain equipment from alternative sources at increased prices, could result in a significant increase in our anticipated capital expenditures and, accordingly, have a material adverse effect on our business, results of operations and financial condition.
Our business may be adversely affected by seasonal factors and harsh weather conditions.
Our business is subject to seasonal trends common in the refined petroleum products delivery industry. We typically face reduced demand for refined petroleum products delivery services in the northern portion of the United States during the winter months and on the west coast during the first five months of the calendar year. At the same time, we face increased demand for fuels delivery services in Florida during the winter months. Further, operating costs and earnings are generally adversely affected by inclement weather conditions. These factors generally result in lower operating results during the first and fourth quarters of the year and cause our operating results to fluctuate from quarter to quarter. Our operating expenses also have been somewhat higher in the winter months, primarily due to decreased fuel efficiency, increased utility costs and increased maintenance costs for tractors and trailers in colder months. An occurrence of unusually harsh or long-lasting inclement weather could have an adverse effect on our operations and profitability.
We operate in a highly regulated industry, and increased costs of compliance with, or liability for violation of, existing or future regulations could significantly increase our costs of doing business.
As an interstate motor carrier, we are subject to regulation by the U.S. Department of Transportation (the "DOT"). To a large degree, intrastate motor carrier operations are subject to state regulations that mirror federal regulations. Federal and state regulatory authorities exercise broad powers, governing activities such as the authorization to engage in motor carrier operations, safety, financial reporting and certain mergers, consolidations and acquisitions. There are additional regulations specifically relating to the trucking industry, including testing and specification of equipment and product handling requirements. Our industry is also subject to regulatory and legislative changes, such as increasingly stringent environmental regulations, regulations which govern the amount of time a driver may drive in any specific period, regulations mandating modification of trailers to eliminate wetlines, regulations requiring on-board black box recording devices, occupational safety and health regulations, limits on vehicle weight and size, regulations relating to security and ergonomics and regulations mandating drug testing of drivers. Compliance with current and future regulations could substantially impair equipment productivity, require changes in our operating practices, negatively affect the level of service we provide our customers and increase our costs. New, more restrictive laws and regulations may be adopted that materially and adversely affect our productivity and efficiency. Additionally, we may not be able to recover any or all increased costs of compliance from our customers and our business and financial condition may be materially and adversely affected by future changes in applicable laws and regulations.
Our failure to maintain required certificates, permits or licenses, or to comply with applicable laws or regulations, could result in substantial fines or possible revocation of our authority to conduct our operations. An incurrence of such fines or the revocation of such authority in turn could restrict our ability to conduct our business effectively and to provide competitive customer services, which could have an adverse impact on our business, results of operations and financial condition.
The U.S. Environmental Protection Agency has issued regulations that require progressive reductions in exhaust emissions from certain diesel engines through 2007. New emissions standards
15
under the regulations and a judicial consent decree went into effect for certain engines beginning in October 2002. In addition, the regulations require subsequent reductions in the sulfur content of diesel fuel beginning in June 2006 and the introduction of emissions after-treatment devices on newly-manufactured engines and vehicles beginning with the model year 2007. Each of these requirements could result in higher prices for tractors and diesel engines and increased fuel and maintenance costs. These adverse effects, combined with the uncertainty as to the reliability of the vehicles equipped with newly-designed diesel engines and the residual values that will be realized from the disposition of these vehicles, could increase our costs and have a material adverse effect on our business, results of operations and financial condition.
From time to time, various additional legislative proposals, including proposals to increase federal, state or local taxes applicable to motor fuels, have been proposed and we expect that additional initiatives will be introduced in the future. We cannot predict whether, or in what form, any increase in such taxes applicable to us will be enacted and whether any such increase would materially adversely affect our business, results of operations and financial condition.
Our operations involve hazardous materials and could result in significant environmental liabilities and costs.
Our activities, which involve the transportation, storage and disposal of fuels and other hazardous substances and wastes, are subject to various federal, state and local health and safety laws and regulations relating to the protection of the environment, including, among others, those governing the transportation, management and disposal of hazardous materials, vehicle emissions, underground and above ground storage tanks and the cleanup of contaminated sites. Our operations involve risks of fuel spillage or seepage, hazardous waste disposal and other activities that are potentially damaging to the environment. If we are involved in a spill or other accident involving hazardous substances, or if we are found to be in violation of or liable under applicable laws or regulations, it could significantly increase our cost of doing business.
Most of our truck terminals are located in industrial areas, where groundwater or other forms of environmental contamination may have occurred. Contaminants have been detected at some of our present or former sites in connection with historical operations. Under environmental laws, we could be held responsible for the costs relating to any contamination at those or other of our past or present facilities and at third-party waste disposal sites, including cleanup costs, fines and penalties and personal injury and property damages. Under some of these laws, such as the Comprehensive Environmental Response Compensation and Liability Act (also known as the Superfund law) and comparable state statutes, liability for the entire cost of the cleanup of contaminated sites can be imposed upon any current or former owner or operator, or upon any party who sent waste to the site, regardless of the lawfulness of any disposal activities or whether a party owned or operated a contaminated property at the time of the release of hazardous substances. From time to time, we have incurred remedial costs and regulatory penalties with respect to spills and releases at our facilities and, notwithstanding the existence of our environmental management program, we cannot assure you that such obligations will not be incurred in the future. The discovery of additional contamination or the imposition of additional obligations or liabilities in the future could result in a material adverse effect on our financial condition, results of operations or our business reputation.
Environmental laws and regulations are complex, change frequently and have tended to become more stringent over time. If we fail to comply with applicable environmental laws and regulations, we could also be subject to substantial fines or penalties and to civil and criminal liability. As a result, our costs of complying with current or future environmental laws or liabilities arising from such laws may have a material adverse affect on our business, results of operations or financial condition.
16
Our reputation and financial results could be harmed in the event of accidents or incidents.
We are exposed to liabilities that are unique to the services we provide. Such liabilities may relate to an accident or incident involving one of our trucks (including a truck operated on our behalf by one of our owner-operators), and could involve significant potential claims of injured employees and other third parties. We are also subject to substantial exposure to workers' compensation claims, whether or not injuries occur in the context of a traffic accident. The amount of our insurance coverage may not be adequate to cover potential claims or liabilities and we may be forced to bear substantial costs due to one or more accidents. Substantial claims resulting from an accident in excess of our related insurance coverage would harm our financial condition and operating results. See "—We may be liable for the payment of uninsured claims arising from recent accidents involving our tanker trucks." In addition, our results of operations would be adversely affected if the premiums for our liability and workers' compensation claims were to increase substantially. Moreover, any accident or incident involving us, even if we are fully insured or not held to be liable, could negatively affect our reputation among customers and the public, thereby making it more difficult for us to compete effectively, and could significantly affect the cost and availability of insurance in the future. Because we provide "last mile" fuels delivery services, we generally perform our services in more crowded areas, which increases the possibility of an accident involving our trucks.
We may be liable for the payment of uninsured claims arising from recent accidents involving our tanker trucks.
On January 13, 2004, one of our tanker trucks ran off an overpass onto a major highway outside Baltimore, Maryland, triggering an explosion and crash involving several other vehicles. The accident resulted in four fatalities. The National Transportation Safety Board is currently investigating the accident. We anticipate that claims will be made against us as a result of the accident. We are self-insured for the first $500,000 of such claims, and our insurance will cover up to $30.0 million of such claims in excess of our self-insured retention. We cannot predict the extent of claims not covered by our insurance policies and any such claims may have a material adverse effect on our financial condition, operating results and cash flows.
In 2002, one of our tanker trucks was involved in an accident in which a driver of another vehicle died. The plaintiff filed an action in December 2003 after mandatory mediation failed. Our insurance carrier is defending this action. We are self-insured for the first $250,000 of such claim, and our insurance will cover the remainder of the claim in excess of our self-insured retention. In July 2004, the plaintiff filed a motion for leave to amend its complaint to add a claim for punitive damages. Punitive damages are not covered by our insurance policies, and any successful claim for punitive damages could have a material adverse effect on our financial condition, results of operations and cash flows.
Difficulty in attracting and retaining drivers could negatively affect our operations and limit our growth.
There is substantial competition for qualified personnel, particularly drivers, in the trucking industry. Furthermore, in certain geographic areas, such as the Northeast, the shortage of qualified drivers is more acute than other areas. We operate in many of these geographic areas where there is a shortage of drivers. Any shortage of drivers could result in temporary under-utilization of our equipment, difficulty in meeting our customers' demands and increased compensation levels, each of which could have a material adverse effect on our business, results of operations and financial condition. A loss of qualified drivers could lead to an increased frequency in the number of accidents, potential claims exposure and, indirectly, insurance costs.
Difficulty in attracting qualified drivers could also require us to limit our growth. Our strategy is to grow in part by taking advantage of the continuing outsourcing of petroleum delivery by the major oil companies and converting private fleets. However, we may have difficulty finding qualified drivers
17
quickly when presented with an outsourcing opportunity, which could result in our inability to accept or service this business or could require us to increase the wages we pay in order to attract drivers. For example, in 2003 we had difficulty in attracting qualified drivers to service the new business outsourced to us by ChevronTexaco on the west coast, which increased our initial costs related to this additional business and delayed our ability to service this new business fully. In converting private fleets, some of the drivers in those fleets may not meet our standards, which would require us to find qualified drivers to replace them. If we are unable to find and retain such qualified drivers on terms acceptable to us, we may be forced to forego opportunities to expand or maintain our business.
Loss of owner-operators could affect our operations and profitability.
We rely on the services of independent drivers, known as owner-operators, to service some of our customers, particularly in geographic areas in which we do not have a substantial presence or concentration of customers. A reduction in the number of owner-operators, whether due to capital requirements related to the expense of obtaining, operating and maintaining equipment or for other reasons, could have a negative effect on our operations and profitability. Contracts with owner-operators may be terminated by either party on short notice. Significant increases in the operating costs for which owner-operators are responsible under their contracts, such as the costs of fuel and equipment, could cause them to seek a higher percentage of our revenue if we are unable to increase our rates commensurately, which could adversely affect our results of operations.
The loss or bankruptcy of one or more significant customers may adversely affect our business.
We are dependent upon a limited number of large customers. Our ten largest customers accounted for approximately 48.1% and 56.3%, respectively, of our total revenues during 2002 and 2003 and 46.8% and 49.3%, respectively, of our total revenues during the three months ended March 31, 2003 and 2004. In particular, our two largest customers in 2003 accounted for 10.9% and 6.8%, respectively, of our total revenues during 2003 (9.5% and 7.3%, respectively, on a pro forma basis giving effect to the acquisitions of the fuels delivery operations of Beneto, Inc. and Carl Klemm, Inc. as if those acquisitions had occurred on January 1, 2003) and 9.3% and 7.0%, respectively, of our total revenues during the three months ended March 31, 2004, compared to 11.6% and 5.5%, respectively, of our total revenues in the first quarter of 2003. Our largest customer in each of these periods was Citgo, through which we also serviced 7-Eleven. The loss of one or more of our major customers, or a material reduction in services performed for such customers, would have a material adverse effect on our results of operations. In addition, if one or more of our customers were to seek protection under the bankruptcy laws, we might not receive payment for services rendered and, under certain circumstances, might have to return payments made by these customers during the 90 days prior to the bankruptcy filing. For example, two customers that accounted for 3.3% of our revenues in 2001 declared bankruptcy in 2001 and are now seeking the return of an aggregate of $2.7 million of payments made to us. If we were to lose one or more of our key customers, we might not be able to capture additional volume from other customers to offset the fixed costs historically covered by the lost revenue.
If we lose key members of our senior management, our business may be adversely affected.
Our ability to implement our business strategy successfully and to operate profitably depends in large part on the continued employment of our senior management team, led by Dennis Nash, our president and chief executive officer, and Carl Young, our chief financial officer. If Mr. Nash, Mr. Young or the other members of senior management become unable or unwilling to continue in their present positions, our business or financial results could be adversely affected.
18
We have recorded a significant amount of goodwill, and any significant reduction in goodwill would have an adverse effect on our financial condition and results of operations.
Our acquisitions have resulted in significant increases in goodwill. Goodwill, which relates to the excess of cost over the fair value of the net assets of the businesses acquired, was approximately $107 million at March 31, 2004, representing 36% of our total assets. In the future, goodwill may increase as a result of additional acquisitions we may do. Goodwill is recorded at fair value on the date of acquisition and is reviewed at least annually for impairment. Impairment may result from, among other things, deterioration in the performance of the acquired business, adverse market conditions, adverse changes in applicable laws or regulations, including changes that restrict the activities of the acquired business, and a variety of other circumstances. The amount of any impairment must be written off. Any future determination requiring the write-off of a significant portion of the goodwill recorded on our balance sheet would have an adverse effect on our financial condition and results of operations.
If our relationship with our employees were to deteriorate, we may be faced with unionization efforts, labor shortages, disruptions or stoppages, which could adversely affect our business and reduce our operating margins and income.
Our operations rely heavily on our employees, and any labor shortage, disruption or stoppage caused by poor relations with our employees could reduce our operating margins and income. While only 13 of our employees were subject to collective bargaining agreements until July 31, 2004, unions have traditionally been active in the U.S. trucking industry. Our workforce has been subject to union organization efforts from time to time, and we could be subject to future unionization efforts as our operations expand. Unionization of our workforce could result in higher compensation and working condition demands that could increase our operating costs or constrain our operating flexibility. In addition, we are from time to time subject to wage and hour claims relating to overtime pay where our drivers work more than eight hours in a day but less than 40 hours in a week. We believe we are exempt from overtime pay rules under regulations of the DOT. However, we cannot assure you that this exemption will not be rescinded or that a court will not determine otherwise, in which event our operating costs would increase. We are currently under audit in the State of Texas on this matter.
If we fail to develop, integrate or upgrade our information technology systems, we may lose customers or incur costs beyond our expectations.
Increasingly, we compete for customers based upon the flexibility and sophistication of our technologies supporting our service. The failure of hardware or software that supports our information technology systems, the loss of data contained in the systems, or the inability of our customers to access or interact with our website, could significantly disrupt our operations and cause us to lose customers. If our information technology systems are unable to handle additional volume for our operations as our business and scope of service grow, our service levels and operating efficiency will decline. In addition, we expect customers to continue to demand more sophisticated fully-integrated information systems. If we fail to hire and retain qualified personnel to implement and maintain our information technology systems or if we fail to upgrade or replace these systems to handle increased volumes, meet the demands of our customers and protect against disruptions of our operations, we may lose customers, which could seriously harm our business.
To compete effectively, we must anticipate and adapt to technology changes. We may choose new technologies that later prove to be inadequate, or may be forced to implement new technologies, at substantial cost, to remain competitive. In addition, competitors may implement new technologies before we do, allowing such competitors to provide lower priced or enhanced services and superior quality compared to those we provide. This development could have a material adverse impact on our ability to compete.
19
Our ability to raise capital in the future may be limited and our failure to raise capital when needed could prevent us from executing our growth strategy.
We believe that our existing cash and cash equivalents and existing amounts available under our revolving credit facility, together with the net proceeds available to us from this offering, will be sufficient to meet our anticipated cash needs for at least the next 12 months. The timing and amount of our working capital and capital expenditure requirements may vary significantly depending on numerous factors, including:
- •
- the need to adapt to changing technical and regulatory requirements;
- •
- the existence of opportunities for expansion; and
- •
- access to and availability of sufficient management, technical, marketing and financial personnel.
If our capital resources are insufficient to satisfy our liquidity requirements, we may seek to sell additional equity securities or debt securities or obtain debt financing. The sale of additional equity securities or convertible debt securities would result in additional dilution to our stockholders. Additional debt would result in increased expenses and could result in covenants that would restrict our operations. We have not made arrangements to obtain additional financing, and financing, if required, may not be available in amounts or on terms acceptable to us, if at all.
Our business may be adversely affected by terrorist attacks and anti-terrorism measures.
In the aftermath of the terrorist attacks of September 11, 2001, federal, state and municipal authorities have implemented and are implementing various security measures, including checkpoints and travel restrictions on large trucks and additional security planning and training obligations on shippers of hazardous materials. Such measures may have costs associated with them which we are forced to bear. While we believe we are in compliance with these new regulations, if existing requirements are interpreted differently by governmental authorities or additional new security measures are required, the timing of our deliveries may be disrupted and we may fail to meet the needs of our customers or incur increased expenses to do so. We cannot assure you that such developments will not have a material adverse effect on our operating results.
In addition, further terrorist attacks or other acts of violence may affect the financial markets, in general, or our business, financial condition and results of operations, in particular. Any such attacks may be directed towards our physical facilities or those of our customers. In addition, these events could result in increased volatility in the U.S. and world financial markets and economy, which could adversely affect our ability to raise additional capital.
Risks Relating to Our Common Stock and the Offering
There is no existing market for our common stock, and a trading market that will provide you with adequate liquidity may not develop. The price of our common stock may fluctuate significantly, and you could lose all or part of your investment.
Prior to this offering, there has been no public market for our common stock. We cannot predict the extent to which investor interest will lead to the development of an active and liquid trading market in our common stock on The Nasdaq National Market or otherwise. If an active trading market does not develop, you may have difficulty selling any of our common stock that you buy.
The initial public offering price for the shares will be determined by negotiations between us and the representatives of the underwriters and may not be indicative of the market price of the common stock that will prevail in the trading market. The market price of our common stock may decline below
20
the initial public offering price. The market price of our common stock may also be influenced by many factors, some of which are beyond our control, including:
- •
- our quarterly or annual earnings or those of other companies in our industry;
- •
- loss of a large customer;
- •
- announcements by us or our competitors of significant contracts or acquisitions;
- •
- changes in accounting standards, policies, guidance, interpretations or principles;
- •
- general economic conditions;
- •
- the failure of securities analysts to cover our common stock after this offering or changes in financial estimates by analysts;
- •
- future sales of our common stock; and
- •
- the other factors described in these "Risk Factors."
In recent years, the stock market has experienced extreme price and volume fluctuations. This volatility has had a significant impact on the market price of securities issued by many companies, including companies in our industry. The changes frequently appear to occur without regard to the operating performance of these companies. The price of our common stock could fluctuate based upon factors that have little or nothing to do with our company, and these fluctuations could materially reduce our stock price.
In the past, some companies that have had volatile market prices for their securities have been subject to securities class action suits filed against them. If a suit were to be filed against us, regardless of the outcome, it could result in substantial legal costs and a diversion of our management's attention and resources. This could have a material adverse effect on our business, results of operations and financial condition.
Future sales of our common stock in the public market may depress our stock price.
The market price of our common stock could decline as a result of sales by our existing stockholders of a large number of shares of our common stock in the market after this offering or the perception that such sales may occur. These sales might also make it more difficult for us to sell additional equity securities at a time and price that we deem appropriate.
There will be approximately shares of common stock outstanding immediately after this offering, after giving effect to the conversion of all outstanding shares of our preferred stock into shares of our common stock, assuming an initial public offering price of $ , the midpoint of the range set forth on the cover page of this prospectus. In addition, there will be shares of common stock issuable upon exercise of all outstanding options and warrants, of which are currently exercisable. All of the shares sold in this offering will be freely tradable without restriction or further registration under the Securities Act of 1933, as amended, except for shares purchased by our "affiliates" as defined in Rule 144 under the Securities Act. The remaining shares of common stock outstanding immediately after this offering will be available for sale in the public market as follows:
- •
- shares will become eligible for sale in the public market beginning 180 days after the date of this prospectus; and
- •
- shares will become eligible for sale in the public market at various times beginning 180 days after the date of this prospectus, following the expiration of a one-year holding period from the date of their initial issuance.
21
The foregoing assumes the effectiveness of the lock-up agreements described in "Underwriting" under which our executive officers, directors and holders of shares of our common stock and holders of certain outstanding options and warrants have agreed not to dispose of their shares of common stock or shares issuable upon exercise of warrants or options, which lock-ups are subject to specified exceptions. Credit Suisse First Boston LLC and UBS Securities LLC may, in their sole discretion and at any time without notice, release all or any portion of the securities subject to the lock-up agreements.
Stockholders holding approximately outstanding shares of these restricted securities will have registration rights that could allow those holders to sell their shares freely through a registration statement filed under the Securities Act.
In addition, after this offering, we will have shares of common stock reserved for issuance under our equity compensation plans, of which options to purchase shares are outstanding. We intend to file a Form S-8 registration statement after this offering to register all of the shares of common stock issuable under our equity compensation plans. Registration of these shares of our common stock would generally permit their resale into the market immediately, subject to satisfaction of any vesting restrictions imposed by us.
We may sell additional shares of common stock in subsequent public offerings. We may also issue additional shares of common stock to finance future acquisitions. We cannot predict the size of future issuances of common stock or the effect, if any, that future issuances and sales of our common stock will have on the market price of our common stock. Sales of substantial amounts of our common stock, including shares issued in connection with an acquisition, or the perception that such sales could occur, may adversely affect prevailing market prices for our common stock.
We currently do not intend to pay dividends on our common stock.
We do not expect to pay dividends on our common stock in the foreseeable future. We are a holding company with no independent operations and no significant assets other than the stock of our subsidiaries. We therefore are dependent upon the receipt of dividends or other distributions from our subsidiaries to pay dividends. In addition, our credit facility restricts our ability to pay dividends. Accordingly, if you purchase shares in this offering, the price of our common stock must appreciate in order to realize a gain on your investment. This may not occur.
You will suffer an immediate and substantial dilution in the net tangible book value of the common stock you purchase.
Substantially all prior investors have paid substantially less per share than the price in this offering. The initial offering price is expected to be substantially higher than the net tangible book value per share of the outstanding common stock immediately after this offering. Accordingly, based on an assumed initial public offering price of $ per share, the midpoint of the range set forth on the cover page of this prospectus, purchasers of common stock in this offering will experience immediate and substantial dilution of approximately $ per share in net tangible book value of the common stock. In addition, there are options outstanding to purchase shares of common stock, at a weighted average exercise price of $ per share, and warrants to purchase shares of common stock, at an exercise price of $ per share. If all of these options and warrants were exercised on the date of the closing of this offering, investors purchasing shares in this offering would suffer total dilution of $ per share.
We will incur increased costs as a result of being a public company.
As a public company, we will incur significant legal, accounting and other expenses that we did not incur as a private company. In addition, the Sarbanes-Oxley Act of 2002, as well as new rules
22
subsequently implemented by the Securities and Exchange Commission and Nasdaq, have required changes in corporate governance practices of public companies. We expect these new rules and regulations to increase our legal and financial compliance costs and to make some activities more time-consuming and costly. For example, as a result of becoming a public company, we plan to add a number of independent directors in order that our board consist of a majority of independent directors, create additional board committees and adopt policies regarding internal controls and disclosure controls and procedures. In addition, we will incur additional costs associated with our public company reporting requirements. We also expect these new rules and regulations to make it more difficult and more expensive for us to obtain director and officer liability insurance and we may be required to accept reduced policy limits and coverage or incur substantially higher costs to obtain the same or similar coverage. As a result, it may be more difficult for us to attract and retain qualified persons to serve on our board of directors or as executive officers. We are currently evaluating and monitoring developments with respect to these new rules, and we cannot predict or estimate the amount of additional costs we may incur or the timing of such costs.
A few significant stockholders control the direction of our business. If the ownership of our common stock continues to be highly concentrated, it will prevent you and other stockholders from influencing significant corporate decisions.
Following the completion of this offering, RFE Investment Partners, or RFE, and Sterling Investment Partners, or Sterling, and their respective principals will beneficially own approximately % and %, respectively, of the outstanding shares of our common stock, assuming an initial public offering price of $ , the midpoint of the range set forth on the cover page of this prospectus. As a result, these stockholders, if they choose to act together, will have significant influence over, and may in fact control, the outcome of all matters requiring stockholder approval, including the election of directors, amendment of our certificate of incorporation and approval of significant corporate transactions. The directors elected by these stockholders will be able to significantly influence our management and policies. This control may have the effect of delaying or preventing changes in control or changes in management, or limiting the ability of our other stockholders to approve transactions that they may deem to be in their best interest. In addition, RFE and Sterling will continue to have representatives serving as members of our board of directors. In addition, RFE and affiliates of Sterling will continue to provide us with financial advisory and management consulting services following the completion of this offering and they will be entitled to receive annual fees of $550,000 for these services in the future. For additional information regarding our relationship with RFE and Sterling, you should read the section of this prospectus entitled "Certain Relationships and Related Transactions."
RFE Investment Partners, Sterling Investment Partners and their designees on our board of directors may have interests that conflict with our interests.
RFE, Sterling and their designees on our board of directors may have interests that conflict with, or are different from, our own. Conflicts of interest between RFE, Sterling and us may arise, and such conflicts of interest may not be resolved in a manner favorable to us, including potential competitive business activities, corporate opportunities, indemnity arrangements, registration rights, sales or distributions by RFE or Sterling of our common stock and the exercise by RFE and Sterling of their ability to control our management and affairs. Our certificate of incorporation does not contain any provisions designed to facilitate resolution of actual or potential conflicts of interest, or to ensure that potential business opportunities that may become available to both RFE or Sterling and us will be reserved for or made available to us. Pertinent provisions of law will govern any such matters if they arise. In addition, RFE and Sterling and their director designees could delay or prevent an acquisition or merger even if the transaction would benefit other stockholders.
23
Our certificate of incorporation and Delaware law may discourage takeovers and business combinations that our stockholders may consider in their best interests, which could negatively affect our stock price.
Our certificate of incorporation and the Delaware General Corporation Law contain provisions that may delay or prevent an attempt by a third party to acquire control of us. These provisions include the requirements of Section 203 of the Delaware General Corporation Law. In general, Section 203 prohibits, for a period of three years, designated types of business combinations, including mergers, between us and any third party that owns 15% or more of our common stock. This provision does not apply if:
- •
- our board of directors approves of the transaction before the third party acquires 15% of our stock;
- •
- the third party acquires at least 85% of our stock at the time its ownership goes past the 15% level; or
- •
- our board of directors and two-thirds of the shares of our common stock not held by the third party vote in favor of the transaction.
Our certificate of incorporation also authorizes us to issue up to shares of preferred stock in one or more different series with terms fixed by the board of directors. Stockholder approval is not necessary to issue preferred stock in this manner. Issuance of these shares of preferred stock could have the effect of making it more difficult and more expensive for a person or group to acquire control of us, and could effectively be used as an anti-takeover device. Following the closing of this offering, no shares of our preferred stock will be outstanding.
These provisions may prevent our stockholders from receiving the benefit from any premium to the market price of our common stock offered by a bidder in a takeover context. Even in the absence of a takeover attempt, the existence of these provisions may adversely affect the prevailing market price of our common stock if they are viewed as discouraging takeover attempts in the future.
24
CAUTIONARY STATEMENT
REGARDING FORWARD-LOOKING STATEMENTS
This prospectus contains "forward-looking statements" that reflect our current estimates, expectations and projections about our future results, performance, prospects and opportunities. Forward-looking statements include, among other things, the information concerning our possible future results of operations, business and growth strategies, financing plans, expectations that regulatory developments or other matters will not have a material adverse effect on our business or financial condition, our competitive position and the effects of competition, the projected growth of the industry in which we operate, and the benefits and synergies to be obtained from our completed and any future acquisitions, and statements of management's goals and objectives, and other similar expressions concerning matters that are not historical facts. Words such as "may," "will," "should," "could," "would," "predicts," "potential," "continue," "expects," "anticipates," "future," "intends," "plans," "believes," "estimates" and similar expressions, as well as statements in future tense, identify forward-looking statements.
Forward-looking statements should not be read as a guarantee of future performance or results, and will not necessarily be accurate indications of the times at, or by which, such performance or results will be achieved. Forward-looking information is based on information available at the time and/or management's good faith belief with respect to future events, and is subject to risks and uncertainties that could cause actual performance or results to differ materially from those expressed in the statements. Important factors that could cause such differences include, but are not limited to:
- •
- general economic and business conditions;
- •
- industry trends;
- •
- increases in our leverage;
- •
- changes in our business strategy, development plans or cost savings plans;
- •
- our ability to integrate acquired businesses;
- •
- the loss of one or more of our major customers;
- •
- competition;
- •
- availability of qualified personnel;
- •
- restrictive covenants in our credit facility;
- •
- changes in, or the failure to comply with, the extensive government regulations applicable to our industry; and
- •
- other factors discussed under the headings "Risk Factors," "Management's Discussion and Analysis of Financial Conditions and Results of Operations" and "Business."
In light of these risks, uncertainties and assumptions, our actual results of operations and execution of our business strategy could differ materially from those expressed in, or implied by, the forward-looking statements, and you should not place undue reliance upon them. In addition, past financial and/or operating performance is not necessarily a reliable indicator of future performance and you should not use our historical performance to anticipate results or future period trends. We can give no assurances that any of the events anticipated by the forward-looking statements will occur or, if any of them do, what impact they will have on our results of operations and financial condition.
Forward-looking statements speak only as of the date the statements are made. We assume no obligation to update forward-looking statements to reflect actual results, changes in assumptions or changes in other factors affecting forward-looking information except to the extent required by
25
applicable securities laws. If we do update one or more forward-looking statements, no inference should be drawn that we will make additional updates with respect thereto or with respect to other forward-looking statements.
All forward-looking statements attributable to us or persons acting on our behalf are expressly qualified in their entirety by the cautionary statements included in this prospectus.
26
Our net proceeds from our sale of shares of common stock in this offering are estimated to be $73.4 million, based on an assumed initial public offering price of $ , the midpoint of the range set forth on the cover page of this prospectus, and after deducting estimated underwriting discounts and commissions and estimated offering expenses that are payable by us in connection with the offering. We intend to use these net proceeds for:
- •
- the repayment of our outstanding 12.5% senior subordinated notes due 2009 in the aggregate principal amount of $39.25 million, plus a prepayment penalty of $392,500 and accrued interest to the date of repayment; and
- •
- the remainder for general corporate purposes, including working capital, capital expenditures, repayment of debt and possible acquisitions.
As of March 31, 2004, we had (i) $27.0 million of Tranche A term loans outstanding, (ii) $93.3 million of Tranche B term loans outstanding and (iii) no revolving credit loans outstanding under our credit facility. The revolving credit portion of the facility was originally due to expire on April 30, 2006. Tranche A term loans were originally to be repaid in quarterly installments with a final maturity on April 30, 2006 and Tranche B term loans were originally to be repaid in quarterly installments with a final maturity on April 30, 2007.
On July 13, 2004, we amended and restated our credit facility described above. Under the amended and restated credit facility, at July 13, 2004 we had outstanding (i) $130.0 million of term loans and (ii) no revolving credit loans. The revolving credit portion of the facility expires on October 30, 2008 (June 30, 2009, if our subordinated notes are repaid or refinanced prior to July 30, 2008). Term loans are repaid in quarterly installments with a final maturity on October 30, 2008 (June 30, 2010, if our subordinated notes are repaid or refinanced prior to July 30, 2008). Outstanding loans bear interest at a rate equal to, at our option, either: (1) in the case of Eurodollar loans, the sum of the LIBOR rate for loans in an amount substantially equal to the amount of borrowing and for the period of borrowing selected by us plus a margin of (a) 3.5% in the case of term loans and (b) between 2.5% and 3.5% in the case of revolving credit loans, depending on our total leverage ratio (as defined in the credit facility) or (2) in the case of base rate loans, the higher of (a) the administrative agent's prime or base rate or (b) one-half percent plus the latest overnight federal funds rate plus (i) 2.5% in the case of term loans and (b) between 1.5% and 2.5% in the case of revolving credit loans, depending on our total leverage ratio.
Although we are continually evaluating acquisition opportunities, we have not entered into any binding commitments or agreements with respect to future acquisitions. Pending use of the proceeds, we will invest the net proceeds of this offering in short-term money market and money market equivalent securities.
If the over-allotment option is exercised, we will not receive any of the proceeds from the sale of common stock by the selling stockholders.
We have not paid any dividends on our common stock and do not intend to pay any dividends on our common stock in the foreseeable future. We currently intend to retain our future earnings, if any, to repay debt or to finance the further expansion and continued growth of our business. In addition, our ability to pay cash dividends is restricted under the terms of the our credit facility. Future dividends, if any, will be determined by our board of directors.
27
If you invest in our common stock, your interest will be diluted to the extent of the difference between the public offering price per share of our common stock and the pro forma net tangible book value per share of our common stock after giving effect to this offering. Net tangible book value dilution per share represents the difference between the amount per share paid by purchasers of common stock in this offering and the pro forma net tangible book value per share of common stock immediately after completion of this offering.
Our net tangible book value as of March 31, 2004 was $(65,494,000), or $( ) per share of common stock. On March 31, 2004, after giving effect to the conversion of all outstanding shares of our preferred stock into shares of our common stock (assuming an initial public offering price of $ per share, the midpoint of the range set forth on the cover page of this prospectus) and the addition of the carrying value of our detachable stock warrants resulting from the expiration of the put option relating to such warrants, our net tangible book value was $ , or $ per share of common stock. We have calculated this amount by:
- •
- subtracting our total liabilities from our total tangible assets; and
- •
- then dividing the difference by the adjusted number of shares of common stock outstanding.
If we give effect to our sale of shares of common stock in this offering at an assumed initial public offering price of $ per share, the midpoint of the range set forth on the cover page of this prospectus, after deducting the estimated underwriting discounts and commissions and the estimated offering expenses payable by us, our adjusted net tangible book value as of March 31, 2004 would have been $ , or $ per share. This amount represents an immediate dilution of $ per share to new investors. The following table illustrates this per share dilution:
| Assumed initial public offering price per share of common stock | $ | |||||
| Net tangible book value per share as of March 31, 2004 after giving effect to the conversion of preferred stock into common stock | $ | |||||
| Increase in net tangible book value per share attributable to new investors in this offering | ||||||
| Net tangible book value per share after this offering | ||||||
| Dilution per share to new investors | $ | |||||
28
The following table summarizes on the basis described above, as of March 31, 2004, the difference between the number of shares of common stock purchased from us, the total consideration paid to us, and the average price per share paid by existing stockholders and by new investors, at an assumed initial public offering price of $ per share, the midpoint of the range set forth on the cover page of this prospectus, before deducting underwriting discounts and commissions and estimated offering expenses payable by us:
| | Shares Purchased | Total Consideration | | |||||||||
|---|---|---|---|---|---|---|---|---|---|---|---|---|
| | Average Price Per Share | |||||||||||
| | Number | Percent | Amount | Percent | ||||||||
| Existing stockholders(1)(2) | % | $ | 45,558,000 | % | $ | |||||||
| New investors | ||||||||||||
| Total | 100.0 | % | 100.0 | % | ||||||||
- (1)
- Includes shares of common stock to be issued upon conversion of the outstanding preferred stock, assuming an initial public offering price of $ per share, the midpoint of the range set forth on the cover page of this prospectus.
- (2)
- If the underwriters exercise their over-allotment option in full, the number of shares of common stock held by existing investors will decrease to , or % of the total number of shares of common stock to be outstanding immediately after this offering and the number of shares held by new investors will increase to , or % of the total number of shares of common stock to be outstanding immediately after this offering.
The tables above assume no exercise of stock options or warrants outstanding on March 31, 2004. As of March 31, 2004, there were options outstanding to purchase shares of common stock, at a weighted average exercise price of $ per share (excluding the Contingent Options) and warrants to purchase shares of common stock at an exercise price of $ per share, excluding the warrants that will become exercisable only if the Contingent Options become exercisable. To the extent any of these options or warrants are exercised, there will be further dilution to new investors. If all of these outstanding options and warrants had been exercised as of March 31, 2004, net tangible book value per share after this offering would have been $ and total dilution per share to new investors would have been $ . In addition, we may grant additional options or warrants or issue other equity securities in the future that may be dilutive to investors in this offering.
29
The following table sets forth our consolidated cash and cash equivalents and capitalization as of March 31, 2004 on an historical basis, on a pro forma basis after giving effect to the amendment and restatement of our credit facility (including the effect of the write-off of unamortized loan costs) on July 13, 2004 and the borrowings thereunder as if such amendment and restatement had occurred on March 31, 2004 and on a pro forma as adjusted basis to give effect to:
- •
- the offering and the application of proceeds therefrom, assuming we sell shares of our common stock in this offering at an assumed initial public offering price of $ per share, the midpoint of the range set forth on the cover page of this prospectus,
- •
- the conversion of all outstanding shares of our preferred stock into shares of our common stock (assuming an initial public offering price of $ per share, the midpoint of the range set forth on the cover page of this prospectus), including the recording of a preferred stock dividend of approximately $ million (assuming an initial public offering price of $ , the midpoint of the range set forth on the cover page of this prospectus) as a result of the beneficial conversion feature of our preferred stock; and
- •
- the reclassification from liabilities to a component of stockholders' equity of $17.9 million, representing the fair value of our detachable stock warrants, resulting from the expiration of the put option relating to such warrants.
30
This table should be read in conjunction with our audited consolidated financial statements, including the notes thereto, "Use of Proceeds," "Selected Historical Financial Information" and "Management's Discussion and Analysis of Financial Condition and Results of Operations," included elsewhere in this prospectus.
| | As of March 31, 2004 | ||||||||||
|---|---|---|---|---|---|---|---|---|---|---|---|
| | Historical | Pro Forma | Pro Forma As Adjusted | ||||||||
| | (Dollars in thousands) | ||||||||||
| Cash and cash equivalents | $ | 8,563 | $ | 14,261 | $ | ||||||
| Debt: | |||||||||||
| Prior credit facility | |||||||||||
| Tranche A term loans | 27,000 | — | — | ||||||||
| Tranche B term loans | 93,263 | — | — | ||||||||
| Revolving credit loans | — | — | — | ||||||||
| Amended and restated credit facility | |||||||||||
| Term loans | — | 130,000 | 130,000 | ||||||||
| Revolving credit loans | — | — | — | ||||||||
| Subordinated notes(1) | 36,667 | 36,667 | — | ||||||||
| Total debt (including current maturities) | 156,930 | 166,667 | 130,000 | ||||||||
| Other liabilities: | |||||||||||
| Detachable stock warrants, subject to put option(2) | 17,930 | 17,930 | — | ||||||||
| Stockholders' equity: | |||||||||||
| Series A preferred stock, $0.001 par value, 3,352 shares authorized and outstanding, actual; no shares outstanding as adjusted | 2,900 | 2,900 | — | ||||||||
| Series B preferred stock, $0.001 par value, 40,000 shares authorized, 39,926 shares outstanding, actual; no shares outstanding as adjusted | 39,926 | 39,926 | — | ||||||||
| Series C preferred stock, $0.001 par value, 1,280 shares authorized and outstanding, actual; no shares outstanding as adjusted | 1,500 | 1,500 | — | ||||||||
| Series D preferred stock, $0.001 par value, 8,000 shares authorized, no shares outstanding, actual or as adjusted | — | — | — | ||||||||
| Preferred stock, $0.001 par value, 7,368 shares authorized, no shares outstanding actual or as adjusted | — | — | — | ||||||||
| Common stock, $0.0001 par value, 7,000,000 shares authorized, shares outstanding, actual, shares outstanding as adjusted | — | — | |||||||||
| Additional paid-in capital | 1,232 | 1,232 | |||||||||
| Retained earnings(3) | 443 | (1,811 | ) | ||||||||
| Total stockholder's equity | 46,001 | 43,747 | |||||||||
| Total capitalization | $ | 220,861 | $ | 228,344 | $ | ||||||
- (1)
- Net of unamortized discount of $2,583,000.
- (2)
- Represents the fair value (the "Put Price") of warrants to purchase an aggregate of 6,731 shares of series D preferred stock at an exercise price of $0.01 per share (which upon the closing of this offering will represent the right to purchase shares of common stock at an exercise price of $ per share, assuming an initial public offering price of $ , the midpoint of the range set forth on the cover page of this prospectus) and warrants to purchase (upon certain defined events) an aggregate of shares of common stock at an exercise price of $ per share. The holders of
31
these warrants have the right, which terminates upon the closing of this offering, to require us to repurchase these warrants for an amount in cash based upon the fair market value of the underlying shares at any time beginning April 30, 2006 and earlier upon the occurrence of certain events. Upon the closing of this offering, the put option will expire and the instruments will be reclassified from total liabilities to a component of stockholders' equity. See "Description of Capital Stock—Warrants" and Note 3 to our consolidated financial statements included elsewhere in this prospectus.
- (3)
- In connection with the amendment and restatement of our credit facility in July 2003, we wrote off $3,756,000 of unamortized loan costs, for which we recorded a charge of $2,254,000 (net of applicable tax benefit of $1,502,000).
In connection with the payment in full of our subordinated notes, we must pay a prepayment fee of $392,500 and write off deferred financing costs of $171,200 resulting from the early extinguishment of the subordinated notes. As a result, we will record a charge of $338,200 (net of applicable tax benefit of $225,500).
Each share of our preferred stock is convertible into shares of common stock at any time after issuance, subject to adjustment. Each share of preferred stock outstanding will, upon the closing of this offering, automatically convert into the number of shares of common stock equal to the sum of (a) shares of common stock converted at the original conversion rate plus (b) the number of shares of common stock equal to the liquidation value per share divided by the initial public offering price of our common stock (the "adjustment feature"). The adjustment feature represents a beneficial conversion option to the existing holders of convertible preferred stock that will be recorded as a preferred stock dividend of approximately $ million (assuming an initial public offering price of $ , the midpoint of the range set forth on the cover page of this prospectus) upon the closing of this offering.
32
SELECTED HISTORICAL FINANCIAL INFORMATION
The following table presents, as of the dates and for the periods indicated, our selected historical financial information as discussed below. The historical statement of operations data for the years ended December 31, 2001, 2002 and 2003 and the historical balance sheet data as of December 31, 2002 and 2003 are derived from our audited financial statements included elsewhere in this prospectus. The historical statement of operations data for the years ended December 31, 1999 and 2000 and the historical balance sheet data as of December 31, 1999, 2000 and 2001 are derived from our audited financial statements that are not included herein. The historical statement of operations data for the three months ended March 31, 2003 and March 31, 2004 and the historical balance sheet data as of March 31, 2004 are derived from our unaudited financial statements. In management's opinion, these unaudited financial statements have been prepared on substantially the same basis as the audited financial statements and include all adjustments, consisting only of normal recurring adjustments, necessary for a fair presentation of the financial data for the periods presented. The results of operations for the interim period are not necessarily indicative of the operating results for the entire year or any future period.
The information contained in this table should also be read in conjunction with "Capitalization," "Unaudited Pro Forma Financial Data," "Management's Discussion and Analysis of Financial Condition and Results of Operations" and the consolidated financial statements and accompanying notes thereto included elsewhere in this prospectus.
| | Year Ended December 31,(1) | Three Months Ended March 31,(1) | ||||||||||||||||||||||
|---|---|---|---|---|---|---|---|---|---|---|---|---|---|---|---|---|---|---|---|---|---|---|---|---|
| | 1999 | 2000(2) | 2001(3) | 2002 | 2003(4) | 2003 | 2004(5) | |||||||||||||||||
| | | | | | | (unaudited) | ||||||||||||||||||
| | (Dollars in thousands, except per share data) | |||||||||||||||||||||||
| Statement of Operations Data: | ||||||||||||||||||||||||
| Net Revenues | $ | 48,946 | $ | 77,941 | $ | 201,619 | $ | 269,254 | $ | 364,910 | $ | 72,097 | $ | 103,624 | ||||||||||
| Operating Costs: | ||||||||||||||||||||||||
| Wages and employee benefits | 25,337 | 42,889 | 113,086 | 147,155 | 211,542 | 40,619 | 60,744 | |||||||||||||||||
| Fuel and other operating costs | 8,309 | 15,284 | 37,084 | 53,260 | 72,672 | 14,943 | 20,768 | |||||||||||||||||
| Insurance and claims | 1,415 | 1,697 | 7,531 | 14,775 | 19,495 | 3,884 | 5,354 | |||||||||||||||||
| Taxes and licenses | 555 | 712 | 2,509 | 3,263 | 4,268 | 823 | 1,216 | |||||||||||||||||
| General and administrative | 3,232 | 5,555 | 12,522 | 15,972 | 20,082 | 4,088 | 5,527 | |||||||||||||||||
| Depreciation and amortization | 2,717 | 4,121 | 11,674 | 13,514 | 19,074 | 3,732 | 5,623 | |||||||||||||||||
| Total operating costs | 41,565 | 70,258 | 184,406 | 247,939 | 347,133 | 68,089 | 99,232 | |||||||||||||||||
| Income from operations | 7,381 | 7,683 | 17,213 | 21,315 | 17,777 | 4,008 | 4,392 | |||||||||||||||||
| Other income (expenses): | ||||||||||||||||||||||||
| Interest expense | (4,597 | ) | (5,787 | ) | (10,657 | ) | (11,648 | ) | (12,841 | ) | (3,035 | ) | (3,270 | ) | ||||||||||
| Change in fair value of detachable stock warrants (6) | — | — | — | — | (13,687 | ) | — | — | ||||||||||||||||
| Management fee to related party(7) | (250 | ) | (250 | ) | (402 | ) | (511 | ) | (550 | ) | (138 | ) | (138 | ) | ||||||||||
| Interest income and other expenses, net | 324 | 269 | (240 | ) | 16 | (765 | ) | 247 | (256 | ) | ||||||||||||||
| Income (loss) before income taxes | 2,858 | 1,915 | 5,914 | 9,172 | (10,066 | ) | 1,082 | 728 | ||||||||||||||||
| Income taxes | 1,165 | 831 | 2,673 | 3,589 | 1,533 | 432 | 288 | |||||||||||||||||
| Net income (loss) | $ | 1,693 | $ | 1,084 | $ | 3,241 | $ | 5,583 | $ | (11,599 | ) | $ | 650 | $ | 440 | |||||||||
| Net income (loss) per share: | ||||||||||||||||||||||||
| Basic | ||||||||||||||||||||||||
| Diluted | ||||||||||||||||||||||||
33
| Other Data: | ||||||||||||||||||||||||
| Adjusted net income(8) | $ | 1,693 | $ | 1,084 | $ | 3,241 | $ | 5,583 | $ | 2,088 | $ | 650 | $ | 440 | ||||||||||
| Adjusted EBITDA(9) | $ | 10,068 | $ | 11,764 | $ | 28,578 | $ | 34,492 | $ | 36,382 | $ | 7,851 | $ | 9,908 | ||||||||||
| Net cash provided by operating activities | $ | 2,034 | $ | 3,856 | $ | 18,440 | $ | 14,213 | $ | 22,249 | $ | 6,677 | $ | 13,701 | ||||||||||
| Net cash (used in) investing activities | $ | (5,047 | ) | $ | (18,098 | ) | $ | (95,769 | ) | $ | (11,459 | ) | $ | (61,845 | ) | $ | (4,305 | ) | $ | (4,486 | ) | |||
| Net cash provided by (used in) financing activities | $ | 540 | $ | 14,440 | $ | 81,892 | $ | (4,706 | ) | $ | 41,963 | $ | (2,297 | ) | $ | (6,475 | ) | |||||||
| Number of Loads | 268,528 | 406,545 | 1,206,273 | 1,475,174 | 2,003,366 | 386,848 | 569,515 | |||||||||||||||||
| Miles Driven | 28,292,486 | 43,389,395 | 106,676,722 | 138,064,494 | 183,926,450 | 36,801,466 | 51,045,818 | |||||||||||||||||
| Revenue Per Mile | $ | 1.73 | $ | 1.80 | $ | 1.89 | $ | 1.95 | $ | 1.98 | $ | 1.96 | $ | 2.03 | ||||||||||
| Number of Tractors(10)(11) | 226 | 311 | 1,117 | 1,292 | 1,595 | 1,231 | 1,594 | |||||||||||||||||
| Number of Trailers(10) | 377 | 543 | 1,812 | 1,818 | 2,579 | 1,865 | 2,638 | |||||||||||||||||
| Number of Terminals and Satellite Operations(10) | 33 | 43 | 144 | 144 | 170 | 144 | 170 | |||||||||||||||||
| Number of Company Drivers(10) | 384 | 433 | 1,535 | 2,101 | 2,953 | 2,213 | 2,823 | |||||||||||||||||
| Number of Owner-Operators(10) | 179 | 237 | 277 | 278 | 472 | 322 | 520 | |||||||||||||||||
As of December 31, | As of March 31, | |||||||||||||||||
|---|---|---|---|---|---|---|---|---|---|---|---|---|---|---|---|---|---|---|
| | 1999 | 2000 | 2001 | 2002 | 2003 | 2004 | ||||||||||||
| | (Dollars in thousands) | |||||||||||||||||
| | | | | | | (unaudited) | ||||||||||||
| Balance Sheet Data: | ||||||||||||||||||
| Working capital (deficit) | $ | (1,091 | ) | $ | (1,772 | ) | $ | 3,671 | $ | 2,275 | $ | 430 | $ | 2,559 | ||||
| Total assets | 66,156 | 88,683 | 231,963 | 230,733 | 297,882 | 296,312 | ||||||||||||
| Total indebtedness, including current maturities(12) | 41,507 | 50,364 | 123,586 | 119,355 | 159,785 | 156,930 | ||||||||||||
| Total stockholders' equity | 16,193 | 21,027 | 50,544 | 55,361 | 45,371 | 46,001 | ||||||||||||
- (1)
- Effective March 1, 2000, we acquired J. McDaniel Inc., which operates primarily in Indiana and Illinois. Effective July 7, 2000, we acquired the fuels delivery operations of Emery Transportation, which operates in southern Ohio. Effective May 1, 2001, we completed the acquisition of Kenan Transport Company, a publicly-traded company founded in 1949 that had become the largest independent fuels delivery carrier in the industry (based on revenues), with operations focused in the southeast United States. Effective May 31, 2003, we acquired the fuels delivery operations of Beneto, Inc. ("Beneto"), which operates primarily in California, and effective June 30, 2003, we acquired substantially all the assets of Carl Klemm, Inc. ("Klemm"), a fuels delivery carrier that operates primarily in Wisconsin and Illinois. Because the results of operations of these entities are included in our financial results from the respective dates of acquisition, a comparison of our period-to-period financial results may not necessarily be meaningful. See "Unaudited Pro Forma Financial Data", which shows what our results of operations might have been had we acquired the Beneto and Klemm operations on January 1, 2003, and Note 2 to our consolidated financial statements included elsewhere in this prospectus.
- (2)
- Includes the results of operations of J. McDaniel Inc. from April 1, 2000 and the fuels delivery operations of Emery Transportation from July 7, 2000.
- (3)
- Includes the results of operations of Kenan Transport Company from May 1, 2001. See "Certain Relationships and Related Transactions—The Kenan Acquisition" and Note 2 to our consolidated financial statements included elsewhere in this prospectus.
- (4)
- Includes the results of operations of the fuels delivery operations of Beneto from May 31, 2003 and Klemm from June 30, 2003. See "Unaudited Pro Forma Financial Data" and Note 2 to our consolidated financial statements included elsewhere in this prospectus.
- (5)
- Includes the actual results of operations of the fuels delivery operations of Beneto and Klemm described in note 1 above for the entire period.
- (6)
- Represents the non-cash charge related to the change in fair value of warrants issued to holders of our subordinated debt. The holders of these warrants have the right, which will terminate at the closing of this offering, to require us to repurchase these warrants for an amount in cash based upon the fair market value of the underlying shares at any time beginning April 30, 2006 and earlier upon the occurrence of certain events. This right terminates upon the closing of this offering. See "Description of Capital Stock—Warrants" and Note 3 to our consolidated financial statements included elsewhere in this prospectus.
- (7)
- For a description of the management fees paid to Sterling Investment Partners Advisors, LLC, RFE Management Corporation and Sterling Ventures Limited, all of which are affiliates of our principal stockholders, see "Certain Relationships and Related Transactions."
- (8)
- Represents net income excluding, in the year ended December 31, 2003, the non-cash charge of $13,687,000 related to the change in fair value of warrants issued to holders of our subordinated debt. This non-cash charge is not deductible for income tax purposes and therefore did not affect our tax provision. We believe this figure is useful in allowing management
34
and our investors to compare our annual operating results without the accounting effect attributable to put rights attached to our warrants that will terminate following the closing of this offering. See note 6 above. However, adjusted net income is not a measure of financial performance under GAAP and should be considered in addition to, but not as a substitute for, other measures of financial performance reported in accordance with GAAP, such as net income.
- Adjusted net income is calculated in the following manner for each of the periods presented:
| | | Year Ended December 31,(1) | Three Months Ended March 31,(1) | |||||||||||||||||||
|---|---|---|---|---|---|---|---|---|---|---|---|---|---|---|---|---|---|---|---|---|---|---|
| | | 1999 | 2000(2) | 2001(3) | 2002 | 2003(4) | 2003 | 2004(5) | ||||||||||||||
| | | (In thousands) | ||||||||||||||||||||
| Net income (loss) | $ | 1,693 | $ | 1,084 | $ | 3,241 | $ | 5,583 | $ | (11,599 | ) | $ | 650 | $ | 440 | |||||||
| Change in fair value of detachable stock warrants | — | — | — | — | 13,687 | — | — | |||||||||||||||
| Adjusted net income | $ | 1,693 | $ | 1,084 | $ | 3,241 | $ | 5,583 | $ | 2,088 | $ | 650 | $ | 440 | ||||||||
- (9)
- Adjusted EBITDA represents net income (loss) plus income taxes, interest expense and depreciation and amortization and non-operating non-cash charges. Adjusted EBITDA is presented herein because we believe it to be relevant and useful information to our investors because it is used by our management to evaluate our operating performance compared to that of other companies in our industry, as the calculation of Adjusted EBITDA eliminates the effects of financing, income taxes, the accounting effects of capital spending and other non-operating non-cash charges, which items may vary for different companies for reasons unrelated to overall operating performance. Adjusted EBITDA is also used by our lenders in evaluating our financial performance. When analyzing our operating performance, however, investors should use Adjusted EBITDA in addition to, not as an alternative for, operating income, net income and cash flow from operating activities, as those terms are defined by GAAP. Investors should also note that our presentation of Adjusted EBITDA may not be comparable to similarly titled measures used by other companies.
- Adjusted EBITDA is calculated in the following manner for each of the periods presented:
| | | Year Ended December 31,(1) | Three Months Ended March 31,(1) | |||||||||||||||||||
|---|---|---|---|---|---|---|---|---|---|---|---|---|---|---|---|---|---|---|---|---|---|---|
| | | 1999 | 2000(2) | 2001(3) | 2002 | 2003(4) | 2003 | 2004(5) | ||||||||||||||
| | | (In thousands) | ||||||||||||||||||||
| Net income (loss) | $ | 1,693 | $ | 1,084 | $ | 3,241 | $ | 5,583 | $ | (11,599 | ) | $ | 650 | $ | 440 | |||||||
| Income taxes | 1,165 | 831 | 2,673 | 3,589 | 1,533 | 432 | 288 | |||||||||||||||
| Change in fair value of detachable stock warrants | — | — | — | — | 13,687 | — | — | |||||||||||||||
| Interest expense | 4,597 | 5,787 | 10,657 | 11,648 | 12,841 | 3,035 | 3,270 | |||||||||||||||
| Depreciation and amortization | 2,717 | 4,121 | 11,674 | 13,514 | 19,074 | 3,733 | 5,623 | |||||||||||||||
| (Gain) loss on disposal of equipment | (104 | ) | (59 | ) | 333 | 158 | 846 | 1 | 287 | |||||||||||||
| Adjusted EBITDA | $ | 10,068 | $ | 11,764 | $ | 28,578 | $ | 34,492 | $ | 36,382 | $ | 7,851 | $ | 9,908 | ||||||||
- (10)
- As of last day of period.
- (11)
- Excludes tractors owned by owner-operators.
- (12)
- Net of unamortized discount of $1,333,000, $1,316,000, $3,530,000, $3,055,000, $2,700,000 and $2,583,000 at December 31, 1999, 2000, 2001, 2002 and 2003 and March 31, 2004, respectively, with respect to our subordinated notes that are being repaid with the proceeds of this offering.
35
UNAUDITED PRO FORMA FINANCIAL DATA
On May 31, 2003, we completed the acquisition of the fuels delivery operations of Beneto, Inc. The total purchase price was $32.9 million. We used $33.0 million of borrowings under our credit facility to pay the purchase price, fund working capital and pay transaction costs.
On June 29, 2003, we completed the acquisition of substantially all the assets of Carl Klemm, Inc., d/b/a Klemm Tank Lines. The total purchase price was $18.4 million (including a contingent payment of $2.74 million that was earned as of December 31, 2003, and was paid in 2004). We issued shares of our common stock, valued at $ per share, and used $17.0 million of borrowings under our credit facility to pay the purchase price (excluding the contingent payment) and pay transaction costs. In addition, we will be obligated to pay up to an additional $2.0 million if the earnings before interest, taxes, depreciation and amortization of Klemm exceed specified amounts for the year ended December 31, 2004. Based on performance to date, we expect to pay the entire $2.0 million.
The following unaudited pro forma financial data and explanatory notes have been prepared to give effect to our acquisition of the fuels delivery operations of Beneto and Klemm as if the acquisitions and related financing activities had occurred on January 1, 2003. The acquisitions were accounted for by the purchase method of accounting and the purchase prices were allocated to the assets acquired and liabilities assumed based upon their estimated fair values at the respective dates of acquisition. The historical consolidated financial information has been adjusted to give effect to pro forma adjustments that are (i) factually supportable, (ii) directly attributable to the acquisitions and (iii) expected to have a continuing impact on the consolidated financial statements. The historical financial information of Beneto and Klemm has been adjusted to conform to our accounting policies and financial statement presentation. A pro forma consolidated balance sheet as of December 31, 2003 is not presented, as our historical consolidated balance sheet as of December 31, 2003, included elsewhere in this prospectus, includes the effect of the acquisitions on the balance sheet.
The following pro forma unaudited financial data should be read in conjunction with our historical consolidated financial statements and the fuels delivery operations of Beneto and Klemm, including the respective notes thereto, which are included elsewhere in this prospectus.
The unaudited pro forma financial data is presented for informational purposes only and does not purport to be indicative of our operating results that would have occurred had the acquisition of the fuels delivery operations of Beneto and Klemm actually occurred as of January 1, 2003, nor does it purport to be indicative of our future operating results following the acquisitions.
36
THE KENAN ADVANTAGE GROUP, INC.
UNAUDITED PRO FORMA CONSOLIDATED STATEMENT OF OPERATIONS
FOR THE YEAR ENDED DECEMBER 31, 2003
| | Historical | | | |||||||||||||||
|---|---|---|---|---|---|---|---|---|---|---|---|---|---|---|---|---|---|---|
| | Pro Forma Adjustments | Pro Forma | ||||||||||||||||
| | KAG(1) | Beneto(2) | Klemm(3) | |||||||||||||||
| | (In thousands) | |||||||||||||||||
| Net Revenues | $ | 364,910 | $ | 26,715 | $ | 23,996 | $ | 415,621 | ||||||||||
| Operating Costs: | ||||||||||||||||||
| Wages and employee benefits | 211,542 | 16,315 | 16,135 | 243,992 | ||||||||||||||
| Fuel and other operating costs | 72,672 | 5,421 | 3,666 | 81,759 | ||||||||||||||
| Insurance and claims | 19,495 | 1,130 | 693 | 21,318 | ||||||||||||||
| Taxes and licenses | 4,268 | 351 | 229 | 4,848 | ||||||||||||||
| General and administrative | 20,082 | 1,180 | 875 | 22,137 | ||||||||||||||
| Depreciation and amortization | 19,074 | 1,703 | 1,063 | 306 | (a) | 22,146 | ||||||||||||
| Total operating costs | 347,133 | 26,100 | 22,661 | 306 | 396,200 | |||||||||||||
| Income from operations | 17,777 | 615 | 1,335 | (306 | ) | 19,421 | ||||||||||||
| Other income (expenses): | ||||||||||||||||||
| Interest expense | (12,841 | ) | — | (187 | ) | (1,121 | )(b) | (14,149 | ) | |||||||||
| Change in fair value of detachable stock warrants (4) | (13,687 | ) | — | — | (13,687 | ) | ||||||||||||
| Management fee to related party | (550 | ) | — | — | (550 | ) | ||||||||||||
| Interest income and other expenses, net | (765 | ) | — | 66 | (699 | ) | ||||||||||||
| Income (loss) before income taxes | (10,066 | ) | 615 | 1,214 | (1,427 | ) | (9,664 | ) | ||||||||||
| Income taxes | 1,533 | — | — | 76 | (c) | 1,609 | ||||||||||||
| Net income (loss) | $ | (11,599 | ) | $ | 615 | $ | 1,214 | $ | (1,503 | ) | $ | (11,273 | ) | |||||
- (1)
- Includes the results of operations of Beneto and Klemm from May 31, 2003 and June 30, 2003, respectively.
- (2)
- Represents results of operations from January 1, 2003 through May 30, 2003.
- (3)
- Represents results of operations from January 1, 2003 through June 29, 2003.
- (4)
- Represents the change in fair value of warrants issued to holders of our subordinated debt. The holders of these warrants have the right, which terminates upon the closing of this offering, to require us to repurchase these warrants for an amount in cash based upon the fair market value of the underlying shares at any time beginning April 30, 2006 and earlier upon the occurrence of certain events. See "Description of Capital Stock—Warrants" and Note 3 to our consolidated financial statements included elsewhere in this prospectus.
- (a)
- Adjustment to conform the Beneto and Klemm historical depreciation expense to the straight-line method, and to record the incremental amortization expense associated with the non-compete agreements and trade name intangible asset, as well as amortization of financing costs.
- (b)
- Adjustment to record the incremental interest expense associated with the additional $50.0 million of term loan borrowings at an average interest rate of 5.84%, which represents our average interest rate for the January 1 through May 31, 2003 period in the case of the $33.0 million borrowed in connection with the Beneto acquisition and 5.84%, which represents our average interest rate for the January 1 through June 29, 2003 period in the case of the $17.0 million borrowed in connection with the Klemm acquisition.
- (c)
- Adjustment required to achieve an effective pro forma tax rate of 40.0% (as calculated on income before income taxes and change in fair value of detachable stock warrants).
37
MANAGEMENT'S DISCUSSION AND ANALYSIS OF FINANCIAL CONDITION
AND RESULTS OF OPERATIONS
The following is a discussion and analysis of our financial condition and results of operations for the years ended December 31, 2001, 2002 and 2003 and for the three months ended March 31, 2003 and 2004. You should read this discussion and analysis together with our consolidated financial statements and notes to those consolidated financial statements included elsewhere in this prospectus. This discussion contains forward-looking statements that are based on management's current expectations, estimates and projections about our business and operations. Our actual results may differ from those currently anticipated and expressed in such forward-looking statements as a result of a number of factors, including those described under the caption "Risk Factors" and elsewhere in this prospectus.
Overview
We are the largest independent fuels delivery carrier in North America. We make regular, local deliveries of refined petroleum products, such as gasoline, diesel and aviation fuels, to our customers. We believe our short-haul, "last mile" delivery of refined petroleum products from pipelines and refineries to gasoline stations, fuel marketers and other end users is a vital link in the country's energy distribution network. In 2002, this network distributed approximately 260 billion gallons of refined petroleum products that were consumed in the United States during that year. On a pro forma basis, we delivered approximately 21 billion gallons of refined petroleum products in 2003 to our customers using our network of 77 terminals and 93 satellite operations.
Our customer base includes most of the major oil companies, as well as truck stop chains, convenience stores, hypermarkets, aviation fuel marketers and other national and regional petroleum marketers. For most of our customers, we operate under contracts that have specified minimum levels of business. Each of our ten largest customers for 2003 has been a customer of ours for more than ten years. We are the only independent fuels delivery carrier with a nationwide network, with operations in 32 states and the ability to deliver within all 48 states of the continental United States, as well as Canada. Our nationwide network allows us to offer our national and regional customers broad distribution capabilities that are difficult for our smaller competitors to replicate. In addition, we seek to expand the services we offer our customers by providing value-added logistics solutions such as real-time delivery monitoring, inventory and supply source management, fleet scheduling and integrated billing and payment. These services, together with our nationwide footprint, make us a nationwide single source provider of supply chain solutions for petroleum and petrochemical products. We believe that with our size, capabilities, scope of services and geographic reach, we are well-positioned to capitalize on both our customers' continued outsourcing of their fuels delivery operations and our industry's trend towards consolidation.
The nationwide consumption of refined petroleum products, such as gasoline, diesel and aviation fuels, drives the underlying demand for delivery of these products from refiners to fuel marketers and other end users. Historically, consumption of gasoline and other refined petroleum products has been very stable, exhibiting annual growth of approximately 1.4% from 1980 through 2002. The Energy Information Administration of the U.S. Department of Energy estimates that retail demand for refined petroleum products will increase between 2002 and 2025 at a compounded annual growth rate of 1.6%, a 44% increase over the total period. Unlike trucking companies that service the more cyclical retail and manufacturing sectors, demand for fuels delivery service is non-cyclical, although the industry experiences increased seasonal demand in periods of heightened driving activity in certain areas of the country.
We derive substantially all of our revenue from regular, local deliveries of refined petroleum products to our customers on a contract basis using our network of terminals and satellite operations. The revenue for our service varies depending on the length of haul and number of gallons hauled.
38
Our operating costs primarily consist of (1) wages and employee benefits, (2) fuel and other operating costs, (3) insurance and claims, (4) taxes and licenses, (5) general and administrative costs and (6) depreciation and amortization costs. The following sets forth the components of these expenses:
• Wages and employee benefits for our drivers and terminal and maintenance personnel are the largest component of our operating costs. While the majority of these costs vary with volume levels, portions of these costs, such as those associated with maintenance and terminal operation, are relatively fixed. Recent increases in expenditures for employee benefits have been driven by an increase in our healthcare costs. In January 2004, we switched to a new healthcare provider, which we believe will allow us to better control our healthcare expenses in the future.
• Fuel and other operating costs include the cost of fuel (net of fuel surcharge), equipment maintenance, equipment rent, operating supplies, such as tires, and other terminal expenses. Other terminal expenses include rent, communication and utilities expenses, which include line-based and cellular telephone communications, as well as electricity, water, heat and sewer services provided to our facilities. We incorporate a fuel surcharge clause in substantially all of our customer contracts to pass additional fuel costs above a specified level on to our customers. The amount of the fuel surcharge each month is based on the average price of fuel for the prior month; accordingly, our recovery of fuel costs in excess of the levels specified in our contracts lags the actual changes in fuel prices by one month, and we may never be fully reimbursed for increases in fuel prices above the levels specified in our contracts.
• Insurance and claims consist of costs associated with insurance premiums, cargo claims and the self-insured portion of claims for property damage and bodily injury. Effective May 1, 2004, our self-insurance increased to $1,000,000 per claim from $500,000 per claim. As a result, we expect our claims expense to increase as a result of the increased level of self-insurance. We, together with the entire trucking industry, continue to experience higher insurance premiums and increasing deductibles. Our self-insurance increased from $250,000 to $500,000 per claim effective May 1, 2003.
• Taxes and licenses costs consist of federal highway use taxes, vehicle registrations, license and permit fees and personal property taxes assessed against our equipment.
• General and administrative expense consists primarily of wages and employee benefits for administrative personnel, travel and entertainment expenses, provision for uncollectible receivables, professional fees and other expenses.
• Depreciation and amortization expense includes the depreciation of the cost of fixed assets over the life assigned to the individual assets and amortization of deferred financing fees and other intangible assets.
A significant portion of the increase in our revenue and operating costs in 2002 and 2003 and the first quarter of 2004 resulted from acquisitions we completed in April 2001 and the second quarter of 2003, respectively. The remainder of the increase in our revenue during these periods was primarily the result of price increases and increases in volume from existing customers. The remainder of the increase in our operating costs during these periods was principally the result of increasing healthcare costs, increased workers' compensation expense and insurance claims due to an increased number and severity of accidents, increasing insurance premiums and increasing fuel prices not fully offset by fuel surcharges. The principal factors affecting net income are our operating costs, principally wages and benefits and fuel costs, as well as interest rates and the level of our outstanding debt.
Acquisitions
We have grown substantially through strategic acquisitions and internal growth. Prior to 1992, we provided fuels delivery services primarily in northeastern Ohio. By 1998, we had expanded throughout Ohio and into Michigan, Kentucky, West Virginia and western Pennsylvania. Since 2000, we have
39
expanded from 14 to 32 states and expanded our infrastructure with six acquisitions and 17 private fleet conversions, through which we have taken ownership of our customers' private fleets and service the business they previously had serviced on their own. This expansion has allowed us to build the only independent national fuels delivery carrier in our industry.
On May 1, 2001, we completed the acquisition of Kenan Transport Company, a publicly-traded company founded in 1949 that had become the largest independent fuels delivery carrier in the industry, with operations focused in the southeast United States. We used cash of $87.5 million, net of cash acquired, to acquire Kenan Transport. We funded this acquisition with term loan borrowings of $46.1 million under our credit facility, and the proceeds from the issuance of subordinated notes and detachable stock warrants of $26.0 million and preferred stock of $24.6 million. In February 1998, Kenan Transport acquired Petro Chemical Transport, or PCT, the private in-house fleet of Citgo. The PCT acquisition significantly expanded Kenan Transport's national presence and service area, and provided us with a remote inventory control and logistics system operating in Dallas, Texas, that forms the base for our current technology services. This system enabled PCT to monitor product inventories electronically for customer retail locations and dispatch delivery of product on an as-needed basis.
On May 31, 2003, we acquired the fuels delivery operations of Beneto, Inc., or Beneto, which operated primarily in California. The total purchase price was $32.9 million. We funded this acquisition with $33.0 million of borrowings under our credit facility to pay the purchase price, fund working capital and pay transaction costs.
On June 29, 2003, we completed the acquisition of substantially all the assets of Carl Klemm, Inc., d/b/a Klemm Tank Lines, or Klemm, a fuels delivery carrier that operates primarily in Wisconsin and Illinois. The total purchase price was $18.4 million (including a contingent payment of $2.74 million that was earned as of December 31, 2003 and was paid in 2004). We issued shares of our common stock, valued at $ per share, and used $17.0 million of borrowings under our credit facility to pay the purchase price (excluding the contingent payment) and pay transaction costs. In addition, we will be obligated to pay up to an additional $2.0 million if Klemm's earnings before interest, taxes, depreciation and amortization exceed specified amounts for the year ended December 31, 2004. Based on performance to date, we expect to pay the entire $2.0 million.
Because the results of operations of Kenan Transport, Klemm and Beneto are included in our financial results from the respective dates of acquisition, a comparison of our period-to-period financial results may not necessarily be meaningful. See "Unaudited Pro Forma Financial Data," which shows what our results of operations might have been had we acquired the Beneto and Klemm operations on January 1, 2003, and Note 2 to our consolidated financial statements included elsewhere in this prospectus.
Critical Accounting Policies
Our discussion and analysis of our financial condition and results of operations are based upon our consolidated financial statements, which have been prepared in conformity with U.S. generally accepted accounting principles ("GAAP"). In preparing these financial statements, we are required to make certain estimates, judgments and assumptions. These estimates, judgments and assumptions affect the reported amounts of our assets and liabilities, including the disclosure of contingent assets and liabilities, at the date of the financial statements and the reported amounts of our revenues and expenses during the periods presented. We evaluate these estimates and assumptions on an ongoing basis. We base our estimates and assumptions on historical experience and on various other factors that we believe to be reasonable at the time the estimates and assumptions are made. However, future events and their effects cannot be predicted with absolute certainty. Therefore, the determination of estimates requires the exercise of judgment. Actual results inevitably will differ from these estimates and assumptions under different circumstances or conditions, and such differences may be material to
40
the financial statements. We believe the following critical accounting policies affect our more significant judgments and estimates used in the preparation of our consolidated financial statements.
Property and Equipment—Property, plant and equipment expenditures, including tractor and trailer improvements that extend the useful lives of such equipment, are capitalized and recorded at cost. For financial statement purposes, these assets are depreciated using the straight-line method over the estimated useful lives of the assets to an estimated salvage value. Generally, annual depreciable lives are 39 years for buildings and building-related improvements, 3-15 years for tractors and trailers, 5-10 years for shop and garage equipment, 5-10 years for furniture and fixtures and 3-10 years for other equipment. Tractor and trailer improvements, which are non-recurring in nature and extend the lives of the related assets, are capitalized and depreciated over the period of extension, generally 3-15 years, based on the type and extent of these improvements. Normal and recurring maintenance and repairs are charged directly to expense as incurred. We estimate the useful lives of these assets based on historical trends and the age of the assets when placed in service, and any changes in the actual lives could result in material changes in the net book value of these assets. Additionally, we estimate the salvage values of these assets based on historical sales of disposals, and any changes in the actual salvage values could also affect the net book value of these assets.
Furthermore, we evaluate the recoverability of our long-lived assets under Statement of Financial Accounting Standards ("SFAS") No. 144,Accounting for the Impairment or Disposal of Long-Lived Assets, whenever adverse events or changes in the business climate indicate that the expected undiscounted future cash flows from the related asset may be less than previously anticipated. If the net book value of the related asset exceeds the undiscounted future cash flows of the asset, the carrying amount would be reduced to the fair value and an impairment loss would be recognized. This analysis requires us to make significant estimates and assumptions in projecting future cash flows, and changes in fact and circumstances could result in material changes in the amount of any write-offs for impairment.
Claims and Insurance Accruals—Claims and insurance costs, which primarily result from property damage, bodily injury, medical claims and workers' compensation, are accrued using current information and future estimates to arrive at an estimated value of claims, less recovery and mitigation credits. These estimated values are based on assumptions related to the rates of growth in medical costs, general inflation, the normal elapsed time required to adjudicate and settle claims and a predicted pattern of injury severity for claims incurred. In developing liability reserves, we rely on professional third party claims administrators, insurance company estimates and the judgment of our own safety department personnel. This analysis requires us to make significant estimates, and changes in facts and circumstances could result in material changes in the accident claims reserves. The accuracy of our assumptions relating to claims and insurance costs may be affected by a number of factors. Based on the nature of our business, there may be temporary reductions or increases in the number of incidents, the severity of the incident and the amount of coverage provided by insurance. Other factors outside of our control that may contribute to casualty costs include weather severity in different parts of the country and equipment technology and performance. Our accrued liabilities for claims as of December 31, 2002 and 2003 and March 31, 2004 amounted to $8.1 million, $9.7 million and $9.8 million, respectively. In the event that actual costs for claims and insurance exceed our original estimates, we will incur expenses in future periods. In addition, we may adjust our underlying assumptions on which the estimated claim value is based. Any of these events could have a material effect on our financial results for future periods. Effective May 1, 2004, our self-insurance for property damage and bodily injury increased to $1,000,000 per claim from $500,000 per claim. As a result, it is likely that we will increase our claims accrual as a result of a possible increase in our claims expense.
Allowance for Doubtful Accounts—We maintain allowances for doubtful accounts for estimated losses resulting from the inability of our customers to make required payments. The allowance for all potentially uncollectible receivables is based on a combination of historical data, cash payment trends,
41
specific customer issues, write-off trends, general economic conditions and other factors. We continuously monitor these factors to arrive at the estimate for the amount of accounts receivable that may be ultimately uncollectible. Changes in facts and circumstances and the economic environment could result in material changes in the allowance for uncollectible receivables. Our allowance for doubtful accounts as of December 31, 2002 and 2003 and March 31, 2004 amounted to $1.6 million, $1.6 million and $1.7 million, respectively, and represented 6.2%, 4.3% and 4.8%, respectively, of our accounts receivable balances. Actual results may differ materially from our current estimates.
Goodwill—We amortized goodwill over 40 years prior to our adoption of SFAS No. 142,Goodwill and Other Intangible Assets, on January 1, 2002. Following our adoption of SFAS 142, we no longer amortize goodwill; however, we were required to perform an initial impairment review in 2002, which did not result in an impairment charge. SFAS 142 also requires that an annual impairment review be performed, which requires us to place a fair value on the reporting unit of our business. This requires us to select appropriate methods of valuation for our business such as using discounted estimated cash flows and relative market multiples for comparable businesses and to assess assumptions inherent in such methods on an annual basis. In addition, whenever events or changes in circumstances indicate that the carrying value of goodwill and other intangible assets might not be recoverable, we will perform an impairment review.
The judgments we make in determining whether our goodwill is impaired will directly affect our reported operating income, since any time we determine that any of this asset is impaired, we will be required to recognize a charge in our statement of operations for the relevant period equal to the decline in value of such assets. Our goodwill totaled $94.0 million at December 31, 2002, $107.2 million at December 31, 2003 and $107.2 million at March 31, 2004.
Commitments and Contingencies—From time to time, in the course of our business, we become involved in legal proceedings. We evaluate contingent liabilities, including threatened or pending litigation, in accordance with SFAS No. 5,Accounting for Contingencies, and record accruals when the outcome of these matters is deemed probable and the liability is reasonably estimable. Professional fees related to legal claims are included in general and administrative expenses in our consolidated statements of operations. We make these assessments based on the facts and circumstances and in some instances based in part on the advice of outside counsel. The analysis is based upon potential results, assuming a combination of litigation and settlement strategies. As discussed in Note 10 to our consolidated financial statements included elsewhere in this prospectus, we do not believe that currently pending proceedings will have a material adverse effect on our consolidated financial condition. It is possible, however, that future results of operations for any particular period could be materially affected by changes in our assumptions related to these proceedings.
Revenue Recognition—We recognize revenue on the date of product delivery to the consignee and when collectibility is reasonably assured.
42
Results of Operations
The following table sets forth information concerning our results of operations for the years ended December 31, 2001, 2002 and 2003, and for the three months ended March 31, 2003 and 2004, also expressed as a percentage of our net revenues for the respective periods. Our results of operations for 2001 include Kenan Transport's operating results from May 1, 2001. Our results of operations for 2003 include the fuels delivery operating results of Beneto from May 31, 2003 and Klemm from June 30, 2003.
| | Year Ended December 31, | Three Months Ended March 31, | ||||||||||||||||||||||||
|---|---|---|---|---|---|---|---|---|---|---|---|---|---|---|---|---|---|---|---|---|---|---|---|---|---|---|
| | 2001 | 2002 | 2003 | 2003 | 2004 | |||||||||||||||||||||
| | | | | | | | (Unaudited) | |||||||||||||||||||
| | (Dollars in thousands) | |||||||||||||||||||||||||
| Net Revenues | $ | 201,619 | 100.0 | % | $ | 269,254 | 100.0 | % | $ | 364,910 | 100.0 | % | $ | 72,097 | 100.0 | % | $ | 103,624 | 100.0 | % | ||||||
Operating Costs: | ||||||||||||||||||||||||||
| Wages and employee benefits | 113,086 | 56.1 | 147,155 | 54.7 | 211,542 | 58.0 | 40,619 | 56.3 | 60,744 | 58.6 | ||||||||||||||||
| Fuel and other operating costs | 37,084 | 18.4 | 53,260 | 19.8 | 72,672 | 19.9 | 14,943 | 20.7 | 20,768 | 20.0 | ||||||||||||||||
| Insurance and claims | 7,531 | 3.7 | 14,775 | 5.5 | 19,495 | 5.3 | 3,884 | 5.4 | 5,354 | 5.2 | ||||||||||||||||
| Taxes and licenses | 2,509 | 1.3 | 3,263 | 1.2 | 4,268 | 1.2 | 823 | 1.1 | 1,216 | 1.2 | ||||||||||||||||
| General and administrative | 12,522 | 6.2 | 15,972 | 5.9 | 20,082 | 5.5 | 4,088 | 5.7 | 5,527 | 5.4 | ||||||||||||||||
| Depreciation and amortization | 11,674 | 5.8 | 13,514 | 5.0 | 19,074 | 5.2 | 3,732 | 5.2 | 5,623 | 5.4 | ||||||||||||||||
| Total operating costs | 184,406 | 91.5 | 247,939 | 92.1 | 347,133 | 95.1 | 68,089 | 94.4 | 99,232 | 95.8 | ||||||||||||||||
| Income from operations | 17,213 | 8.5 | 21,315 | 7.9 | 17,777 | 4.9 | 4,008 | 5.6 | 4,392 | 4.2 | ||||||||||||||||
Other income (expenses): | ||||||||||||||||||||||||||
| Interest expense | (10,657 | ) | (5.3 | ) | (11,648 | ) | (4.3 | ) | (12,841 | ) | (3.5 | ) | (3,035 | ) | (4.2 | ) | (3,270 | ) | (3.2 | ) | ||||||
| Change in fair value of detachable stock warrants | — | — | — | — | (13,687 | ) | (3.8 | ) | — | — | — | — | ||||||||||||||
| Management fee to related party | (402 | ) | (0.2 | ) | (511 | ) | (0.2 | ) | (550 | ) | (0.2 | ) | (138 | ) | (0.2 | ) | (138 | ) | (0.1 | ) | ||||||
| Interest income and other expenses, net | (240 | ) | (0.1 | ) | 16 | 0.0 | (765 | ) | (0.2 | ) | 247 | 0.3 | (256 | ) | (0.2 | ) | ||||||||||
| Income (loss) before income taxes | 5,914 | 2.9 | 9,172 | 3.4 | (10,066 | ) | (2.8 | ) | 1,082 | 1.5 | 728 | 0.7 | ||||||||||||||
| Income taxes | 2,673 | 1.3 | 3,589 | 1.3 | 1,533 | 0.4 | 432 | 0.6 | 288 | 0.3 | ||||||||||||||||
| Net income (loss) | $ | 3,241 | 1.6 | % | $ | 5,583 | 2.1 | % | $ | (11,599 | ) | (3.2 | )% | $ | 650 | 0.9 | % | $ | 440 | 0.4 | % | |||||
Three Months Ended March 31, 2004 Compared to Three Months Ended March 31, 2003
Net Revenues. Our revenues were $103.6 million in the first quarter of 2004, an increase of $31.5 million, or 43.7%, from $72.1 million in the first quarter of 2003. The fuels delivery operations of Beneto and Klemm, which we acquired in May and June 2003, respectively, accounted for $17.5 million and $13.6 million of our revenues in the first quarter of 2004, representing 55.6% and 43.2% of the increase in our revenues. The remaining increase of $0.4 million was primarily the result of price increases and increases in volume from existing customers. Excluding the revenues contributed by Beneto and Klemm, we were able to increase our revenues slightly in the first quarter of 2004 compared to the same period in 2003 despite the fact that one customer, which accounted for approximately 3.5% of our revenue in the first quarter of 2003, liquidated in late 2003 and was not a customer in the first quarter of 2004, and another customer, which accounted for 2.0% of our revenue in the first quarter of 2003, was not a customer in the first quarter of 2004.
Operating Costs. Our operating costs were $99.2 million in the first quarter of 2004, an increase of $31.1 million, or 45.7%, from $68.1 million in the comparable period in 2003. This increase in operating costs resulted primarily from the inclusion of three months of the fuels delivery operation of Beneto and Klemm not reflected in 2003. The operations of Beneto and Klemm accounted for $16.7 million and $12.5 million of our operating costs in 2004, representing 53.7% and 40.2% of the increase in our operating costs in 2004. Operating costs represented 95.8% of revenues in the first quarter of 2004 compared to 94.4% of revenues in the first quarter of 2003. The increase in operating costs as a percentage of revenue was primarily the result of increases in wages and employee benefits,
43
including workers' compensation costs, resulting in part from operating inefficiencies due to the need for a rapid scale-up of operations to service certain business awarded to us in mid-2003, and increased depreciation and amortization.
Wages and employee benefits for our drivers and terminal and maintenance personnel are the largest component of our operating costs, constituting 61.2% and 59.7% of our operating costs in the first quarter of 2004 and 2003, respectively. Wages and employee benefits were $60.7 million in the three months ended March 31, 2004, an increase of $20.1 million, or 49.5%, from $40.6 million in the first quarter of 2003. Beneto and Klemm accounted for $10.7 million and $9.1 million of our 2004 wage and employee benefits, respectively, representing in aggregate 98.5% of the total increase in wages and employee benefits. The remainder of the increase resulted primarily from increased personnel hired in connection with our expanded business, increases in healthcare costs, increased workers' compensation expense and general wage inflation. Wages and employee benefits represented 58.6% of our revenues in the first quarter of 2004, compared to 56.3% of our revenues in the same period in 2003. Wages and employee benefits increased as a percentage of our revenues in the first quarter of 2004 primarily as a result of the higher wage base in California, where Beneto is located, the increased use of owner-operators, primarily at Klemm, increased healthcare costs and workers' compensation costs and general wage inflation.
Our fuel and other operating costs were $20.8 million in the three months ended March 31, 2004, an increase of $5.8 million, or 39.0%, from $15.0 million in the first quarter of 2003. Our fuel costs in 2004 were $7.8 million, an increase of $2.0 million, or 34.5%, from $5.8 million in 2003. The increase in fuel costs in 2004 was primarily the result of the acquisition of Beneto and Klemm, which accounted for $1.9 million of the increase, as well as increased fuel prices. Our fuel costs are net of fuel surcharge of $3.1 million and $2.2 million for the first quarter of 2004 and 2003, respectively. Other operating costs were $13.0 million in the three months ended March 31, 2004, an increase of $3.8 million, or 42.9%, from $9.2 million in the same period in 2003. Beneto and Klemm accounted for $3.4 million, or 89.8% of this increase; the remainder of the increase was the result of our growth. Fuel and other operating costs represented 20.0% of our revenues in the first quarter of 2004, compared to 20.7% of our revenues in the same period of 2003.
Our insurance and claims costs were $5.4 million in the three months ended March 31, 2004, an increase of $1.5 million, or 37.8%, from $3.9 million in the three months ended March 31, 2003. Beneto and Klemm accounted for $0.6 million and $0.5 million of our first quarter 2004 insurance and claims costs, respectively, representing in aggregate 74.4% of the total increase in insurance and claim costs. The remainder of the increase in our insurance and claims costs in the period was primarily a result of increased insurance premiums due to continuing pressure in the re-insurance market and increased claims costs. Insurance and claims costs represented 5.2% of our revenues in the first quarter of 2004, compared to 5.4% of our revenues in the same period of 2003. The decrease in insurance and claims costs as a percentage of revenues was principally the result of lower insurance costs at Beneto and Klemm.
Taxes and licenses costs were $1.2 million in the first quarter of 2004, an increase of $0.4 million, or 47.8%, from $0.8 million in the same period in 2003. The increase resulted primarily from the inclusion of the Beneto and Klemm operations in 2004, and our increased number of tractors and trailers resulting from our expanded business. Taxes and licenses costs represented 1.2% of revenues in 2004 and 1.1% of revenues in 2003.
General and administrative expense was $5.5 million in three months ended March 31, 2004, an increase of $1.4 million, or 35.2%, from $4.1 million in the first quarter of 2003. The addition of Beneto and Klemm accounted for $1.2 million, or 84.6%, of that increase, with the remainder principally due to increased personnel dedicated to our logistics services. As a percentage of revenues, general and administrative expense decreased to 5.4% in the first quarter of 2004 from 5.7% in the same period in 2003, as our integration of back office personnel continued.
44
Depreciation and amortization expense was $5.6 million in the three months ended March 31, 2004, an increase of $1.9 million, or 50.7%, from $3.7 million in the same period of 2003. Beneto and Klemm accounted for $0.9 million and $0.5 million, respectively, of our first quarter 2004 depreciation and amortization expense. Depreciation and amortization expense represented 5.4% of our revenues in the first quarter of 2004 compared to 5.2% of our revenues in the same period in 2003. The increase in depreciation and amortization expense both in absolute dollars and as a percentage of revenue resulted from the increased number of tractors and trailers we operated, as well as amortization of additional deferred financing fees relating to the additional $50.0 million we borrowed to finance the Beneto and Klemm acquisitions.
Other Income and Expense Items. Interest expense was $3.3 million in the first quarter of 2004, an increase of $0.2 million, or 7.7%, from $3.0 million in the same period of 2003. The increase resulted primarily from increased borrowings in connection with our acquisition of Beneto and Klemm during 2004, partially offset by lower interest rates and repayments of outstanding principal on our term loans. We paid management fees to affiliates of two of our principal stockholders aggregating $137,500 in the first quarter of 2003 and 2004. We incurred a loss on the sale of obsolete equipment of $287,000 in the first quarter of 2004.
Income Taxes. Income taxes were $288,000 in the first quarter of 2004, compared to $432,000 in the first quarter of 2003. The decrease was primarily due to lower taxable income in the first quarter of 2004 compared to the same period in 2003. Our effective tax rate in the first quarter of 2004 was 39.6%, compared with an effective tax rate of 39.9% in the first quarter of 2003.
Net Income (Loss). As a result of net changes in the foregoing items, we had a net income of $440,000 in the three months ended March 31, 2004 compared to net income of $650,000 in the first quarter of 2003.
Year Ended December 31, 2003 Compared to Year Ended December 31, 2002
Net Revenues. Our revenues were $364.9 million in 2003, an increase of $95.7 million, or 35.5%, from $269.3 million in 2002. This increase in revenues resulted primarily from the inclusion of seven months of the fuels delivery operations of Beneto and six months of Klemm in 2003 following their acquisition. Beneto and Klemm accounted for $40.4 million and $27.0 million, respectively, of our revenues in 2003, representing 42.3% and 28.2%, respectively, of the increase in our revenues. The remainder of the increase was primarily the result of price increases, increases in volume from existing customers and new business. The increase in revenues came despite the fact that our revenues from one customer, which ceased to be a customer in 2003 following the sale of its truck stop business, decreased $8.1 million in 2003 compared to 2002, and our revenues from two customers that ceased to be customers in 2003 decreased $8.5 million in 2003 compared to 2002.
Operating Costs. Our operating costs were $347.1 million in 2003, an increase of $99.2 million, or 40.0%, from $247.9 million in 2002. This increase in operating costs resulted primarily from the inclusion of seven months of the fuels delivery operations of Beneto and six months of the fuels delivery operations of Klemm in 2003 following their acquisition. Beneto and Klemm accounted for $37.1 million and $25.0 million, respectively, of our operating costs in 2003, representing 37.4% and 25.2%, respectively, of the increase in our operating costs. Operating costs represented 95.1% of revenues in 2003 compared to 92.1% of revenues in 2002. The increase in operating costs as a percentage of revenue was primarily the result of increases in wages and employee benefits, resulting in part from operating inefficiencies due to the need for a rapid scale-up of operations in order to service certain business awarded to us in mid-2003, fuel and other operating expenses, additional insurance and claims cost, general and administrative costs as well as depreciation.
Wages and employee benefits for our drivers and terminal and maintenance personnel are the largest component of our operating costs, constituting 59.4% and 60.9% of our operating costs in 2002
45
and 2003, respectively. Wages and employee benefits were $211.5 million in 2003, an increase of $64.4 million, or 43.8%, from $147.2 million in 2002. Beneto and Klemm accounted for $24.4 million and $18.1 million of our 2003 wage and employee benefits, respectively, representing in aggregate 66.0% of the total increase in wages and employee benefits. The remainder of the increase resulted primarily from increased personnel hired in connection with our expanded business, increases in healthcare costs, increased workers' compensation expense related to accidents and general wage inflation. Wages and employee benefits represented 58.0% of our revenues in 2003, compared to 54.7% of our revenues in 2002. Wages and employee benefits increased as a percentage of our revenues in 2003 primarily as a result of the higher wage base in California, where Beneto is located, the increased use of owner-operators, primarily at Klemm, increased healthcare costs and workers' compensation costs and general wage inflation.
Our fuel and other operating costs were $72.7 million in 2003, an increase of $19.4 million, or 36.4%, from $53.3 million in 2002. Our fuel costs in 2003 were $27.1 million, an increase of $7.3 million, or 36.7%, from $19.8 million in 2002. The increase in fuel costs in 2003 was primarily the result of the acquisition of the fuels delivery operations of Beneto and Klemm, which accounted for $4.3 million of the increase, as well as increased fuel prices. Our fuel costs are net of a fuel surcharge of $9.5 million and $4.0 million for 2003 and 2002, respectively. Other operating costs were $45.6 million in 2003, an increase of $12.1 million, or 36.3%, from $33.5 million in 2002. Beneto and Klemm accounted for $6.6 million, or 54.3%, of this increase; the remainder of the increase was the result of our growth. Fuel and other operating costs represented 19.9% of our revenues in 2003, compared to 19.8% of our revenues in 2002. The slight increase in fuel and other operating costs as a percentage of revenues was principally the result of the increase in fuel prices throughout 2003.
Our insurance and claims costs were $19.5 million in 2003, an increase of $4.7 million, or 31.9%, from $14.8 million in 2002. Beneto and Klemm accounted for $1.4 million and $1.0 million, or 29.8% and 20.9%, respectively, of the increase in our 2003 insurance and claims costs. Excluding Beneto and Klemm, our insurance and claims costs increased $2.3 million, or 15.7%, primarily as a result of increased insurance premiums due to continuing pressure in the re-insurance market and increased claims costs. Insurance and claims costs represented 5.3% of our revenues in 2003, compared to 5.5% of our revenues in 2002. The decrease in insurance and claims costs as a percentage of revenues was principally the result of overall lower deductible costs at Klemm and Beneto.
Taxes and licenses costs were $4.3 million in 2003, an increase of $1.0 million, or 30.8%, from $3.3 million in 2002. The increase resulted primarily from the inclusion of the Beneto and Klemm operations for seven and six months, respectively, in 2003, and our increased number of tractors and trailers resulting from our expanded business. Taxes and licenses costs represented 1.2% of revenues in each of 2002 and 2003.
General and administrative expense was $20.1 million in 2003, an increase of $4.1 million, or 25.7%, from $16.0 million in 2002. The addition of Beneto and Klemm accounted for $2.6 million, or 62.6%, of that increase, with the remainder due to the growth of our historical operations. As a percentage of revenues, general and administrative expense decreased to 5.5% in 2003 from 5.9% in 2002, as our integration of back office personnel continued.
Depreciation and amortization expense was $19.1 million in 2003, an increase of $5.6 million, or 41.1%, from $13.5 million in 2002. Beneto and Klemm accounted for $2.2 million and $0.8 million, respectively, of our 2003 depreciation and amortization expense. Depreciation and amortization expense represented 5.2% of our 2003 revenues compared to 5.0% of our 2002 revenues. The increase in depreciation and amortization expense both in absolute dollars and as a percentage of revenue resulted from the increased number of tractors and trailers we operated, as well as amortization of additional deferred financing fees relating to the additional $50.0 million we borrowed to finance the Beneto and Klemm acquisitions.
46
Other Income and Expense Items. Interest expense was $12.8 million in 2003, an increase of $1.2 million, or 10.2%, from $11.6 million in 2002. The increase resulted primarily from increased borrowings in connection with our acquisition of Beneto and Klemm during 2003, partially offset by lower interest rates and repayments of outstanding principal on our term loans. In 2003, we recorded a non-cash charge of $13.7 million, representing the increase in the fair market value of warrants held by the holders of our subordinated debt, which warrants are subject to a put option under certain circumstances. We paid management fees to affiliates of two of our principal stockholders aggregating $550,000 and $511,000 in 2003 and 2002, respectively. See "Certain Relationships and Related Transactions."
Income Taxes. Income taxes were $1.5 million in 2003, as the non-cash charge of $13.7 million resulting from the increase in the fair market value of warrants held by the holders of our subordinated debt that we recorded is not deductible for income tax purposes. Income taxes were $3.6 million in 2002, representing an effective tax rate of 39.1%. The decrease in income taxes in 2003 compared to 2002 was primarily due to lower taxable income in 2003, partially offset by a higher effective tax rate of 42.3% on our $3.6 million of income we were deemed to have earned for income tax purposes.
Net Income (Loss). As a result of net changes in the foregoing items, we had a net loss of $11.6 million in 2003, compared to net income of $5.6 million in 2002. Excluding the non-cash charge of $13.7 million resulting from the increase in fair value of our stock warrants, we would have had net income of $2.1 million in 2003.
Year Ended December 31, 2002 Compared to Year Ended December 31, 2001
Net Revenues. Our revenues were $269.3 million in 2002, an increase of $67.6 million, or 33.5%, from $201.6 million in 2001. This increase in revenues resulted primarily from the inclusion of a full year of Kenan Transport's operations in 2002 compared to eight months in 2001. Kenan Transport accounted for $167.9 million and $100.4 million of our 2002 and 2001 revenues, respectively. Kenan Transport's revenues for the 12 months ended December 31, 2001 were $153.7 million. The remainder of the increase was primarily the result of price increases, an increase in volume from existing customers and new business.
Operating Costs. Our operating costs were $247.9 million in 2002, an increase of $63.5 million, or 34.5%, from $184.4 million in 2001. This increase in operating costs resulted primarily from the inclusion of a full year of Kenan Transport's operations in 2002 compared to eight months in 2001. Kenan Transport accounted for $154.2 million and $90.7 million of our 2002 and 2001 operating costs, respectively. Kenan Transport's operating costs for the 12 months ended December 31, 2001 were $141.4 million. Operating costs represented 92.1% of revenues in 2002 compared to 91.5% of revenues in 2001. The increase in operating costs as a percentage of revenues was primarily the result of increased fuel and other operating expenses, and increased insurance and claims expense.
Wages and employee benefits for our drivers and terminal and maintenance personnel are the largest component of our operating costs, constituting 59.4% and 61.3% of our operating costs in 2002 and 2001, respectively. Wages and employee benefits were $147.2 million in 2002, an increase of $34.1 million, or 30.1%, from $113.1 million in 2001. The increase in wages and employee benefits resulted primarily from the inclusion of a full year of Kenan Transport's operations in 2002 compared to eight months in 2001. Kenan Transport accounted for $85.4 million and $51.3 million of our 2002 and 2001 wages and employee benefits, respectively. Kenan Transport's wages and employee benefits for the 12 months ended December 31, 2001 were $75.9 million. The remainder of the increase was principally due to wage inflation and increases in healthcare costs. Wages and employee benefits represented 54.7% of our revenues in 2002 compared to 56.1% of our revenues in 2001. The decrease in wages and employee benefits as a percentage of revenues was primarily the result of the expanded revenue base and lower fixed costs for employee benefits.
47
Our fuel and other operating costs were $53.3 million in 2002, an increase of $16.2 million, or 43.6%, from $37.1 million in 2001. Our fuel costs in 2002 were $19.8 million, an increase of $7.0 million, or 54.8%, from $12.8 million in 2001. The increase in fuel costs resulted primarily from the inclusion of a full year of Kenan Transport's operations in 2002 compared to eight months in 2001, partially offset by lower average fuel prices in the first half of 2002. Other operating costs were $33.5 million in 2002, an increase of $9.2 million, or 37.7%, from $24.3 million in 2001. Kenan Transport accounted for substantially all of this increase. Kenan Transport accounted for $37.6 million and $21.9 million of our 2002 and 2001 fuel and other operating costs, respectively. Kenan Transport's fuel and other operating costs for the 12 months ended December 31, 2001 were $36.3 million. Fuel and other operating costs represented 19.8% of our revenues in 2002, compared to 18.4% of our revenues in 2001. The increase in fuel and other operating costs as a percentage of revenues was principally the result our expanded operations, increased maintenance expenses and lower fuel surcharges, partially offset by lower average fuel prices in the first half of 2002.
Our insurance and claims costs were $14.8 million in 2002, an increase of $7.2 million, or 96.2%, from $7.5 million in 2001. Insurance and claims costs represented 5.5% of our revenues in 2002, compared to 3.7% of our revenues in 2001. The increase both in absolute dollars and as a percentage of revenue resulted primarily from the inclusion of a full year of Kenan Transport's operations in 2002 compared to eight months in 2001, combined with higher insurance premiums due to a tight insurance market, an increase in the amount of insurance we carried due to our expanded operations and an increase in claims cost due to a higher deductible beginning in May 2002.
Taxes and licenses costs were $3.3 million in 2002, an increase of $0.8 million, or 30.1%, from $2.5 million in 2001. The increase resulted primarily from the inclusion of a full year of Kenan Transport's operations in 2002 compared to eight months in 2001, combined with an increased number of tractors and trailers. Taxes and licenses costs represented 1.2% of our revenues in 2002, compared to 1.3% of our revenues in 2001.
General and administrative expense was $16.0 million in 2002, an increase of $3.5 million, or 27.5%, from $12.5 million in 2001. The increase resulted primarily from the inclusion of a full year of Kenan Transport's operations in 2002 compared to eight months in 2001, as well as an increase in the number of back office personnel needed to support our expanded operations, wage inflation and increases in healthcare costs, partially offset as we integrated Kenan Transport's back office operations into ours and eliminated duplicate personnel throughout late 2001 and 2002. As a percentage of revenues, general and administrative expense decreased to 5.9% in 2002 from 6.2% in 2001, as we integrated back office personnel following the Kenan Transport acquisition and eliminated duplicate personnel.
Depreciation and amortization expense was $13.5 million in 2002, an increase of $1.8 million, or 15.8%, from $11.7 million in 2001. The increase resulted primarily from the inclusion of a full year of Kenan Transport's operations in 2002 compared to eight months in 2001, as well inclusion of a full year of amortization of deferred financing fees relating to the borrowings to finance the Kenan Transport acquisition. The increase was partially offset by the fact that in 2001 we amortized $2.1 million of goodwill. Pursuant to SFAS No. 142, we stopped amortizing goodwill effective January 1, 2002. Depreciation and amortization expense represented 5.0% of our 2002 revenues compared to 5.8% of our 2001 revenues. The decrease in depreciation and amortization expense was primarily the result of the fact that in 2001 we amortized $2.1 million of goodwill. On a pro forma basis excluding the amortization of goodwill in 2001, depreciation and amortization expense would have represented 6.5% of our 2001 revenues.
Other Income and Expense Items. Interest expense was $11.6 million in 2002, an increase of $1.0 million, or 9.3%, from $10.7 million in 2001. The increase resulted primarily from increased borrowings in connection with our acquisition of Kenan Transport, partially offset by declining interest
48
rates during 2002. Management fees to affiliates of two of our principal stockholders were $511,000 in 2002, compared to $402,000 in 2001. The increase was due to the fact that the management fee was increased following our acquisition of Kenan Transport. See "Certain Relationships and Related Transactions."
Income Taxes. Income taxes were $3.6 million in 2002, representing an effective tax rate of 39.1%, compared to $2.7 million in 2001, representing an effective tax rate of 45.2%. The decrease in the effective tax rate was primarily due to the fact that goodwill amortization, which is deductible for tax purposes, is no longer amortized for financial reporting purposes beginning January 1, 2002.
Net Income. As a result of the foregoing, our net income was $5.6 million in 2002, an increase of $2.3 million, or 72.3%, from $3.2 million in 2001.
Liquidity and Capital Resources
Net cash generated by operating activities was $22.2 million, $14.2 million and $18.4 million in 2003, 2002 and 2001, respectively. Cash was provided by operating activities in 2003 despite our net loss of $11.6 million primarily due to depreciation and amortization of $19.1 million, a non-cash charge relating to the change in fair value of warrants of $13.7 million and an increase in accrued expenses and other liabilities, partially offset by an increase in accounts receivable, deferred income taxes and other assets. Cash provided by operating activities exceeded net income of $5.6 million in 2002 due primarily to increased operating results, depreciation and amortization of $13.5 million and an increase in deferred income taxes, partially offset by an increase in accounts receivable and a decrease in other assets, accounts payable and accrued expenses and other liabilities. Cash provided by operating activities exceeded net income of $3.2 million in 2001 primarily due to increased operating results, depreciation and amortization of $11.7 million, an increase in deferred income taxes and a decrease in accounts receivable, partially offset by a decrease in prepaid expenses and other current assets and an increase in accounts payable. Net cash generated by operating activities totaled $13.0 million for the three months ended March 31, 2004 and $6.7 million for the same period in 2003. The increase was primarily due to increased depreciation expense, decreased accounts receivable and prepaid expenses and increased accrued expenses. Cash generated from operating activities is typically used for working capital purposes, to repay debt and to fund capital expenditures. We utilize a revolving credit facility in lieu of maintaining large cash reserves. We believe that it is better to reduce debt and minimize our interest expense than to maintain cash balances and incur increased interest expense.
Our business requires substantial ongoing capital investments, particularly for replacement of revenue equipment such as tractors and trailers. In 2001, 2002 and 2003 and the first quarter of 2004, we spent $9.1 million, $12.8 million, $18.4 million and $4.0 million on purchases of equipment and improvements, respectively. Our purchases of tractors and trailers in this period (excluding the tractors
49
and trailers acquired in the 2003 acquisitions of the fuels delivery operations of Beneto and Klemm and in the 2001 acquisition of Kenan Transport) were as follows:
| | Year Ended December 31, | Three Months Ended March 31, | |||||||||||||
|---|---|---|---|---|---|---|---|---|---|---|---|---|---|---|---|
| | 2001 | 2002 | 2003 | 2003 | 2004 | ||||||||||
| | (Dollars in thousands) | ||||||||||||||
| Tractors | $ | 4,419 | $ | 5,486 | $ | 8,427 | $ | 1,515 | $ | 1,462 | |||||
| Trailers | 2,878 | 5,126 | 7,999 | 2,505 | 969 | ||||||||||
| Other(1) | 1,787 | 2,154 | 1,986 | 290 | 1,563 | ||||||||||
| $ | 9,084 | $ | 12,766 | $ | 18,412 | $ | 4,310 | $ | 3,994 | ||||||
- (1)
- Other includes leasehold improvements, service vehicles, shop and garage equipment, data processing equipment, and furniture and fixtures.
We have budgeted capital expenditures of $22.0 million for 2004, principally for the purchase of tractors and trailers. Historically, our capital needs have been funded primarily through cash provided by operations, borrowings under our working capital facility and operating leases. We generated cash proceeds from the sale of used tractors and trailers and other equipment of $2.6 million, $1.3 million, $0.8 million and $0.2 million in 2003, 2002, 2001 and the three months ended March 31, 2004, respectively.
In 2003, we used cash of $46.0 million, net of cash acquired, to acquire the fuels delivery operations of Beneto and Klemm. We funded these acquisitions with term loan borrowings of $50.0 million under our credit facility. In 2001, we used cash of $87.5 million, net of cash acquired, to acquire Kenan Transport. We funded this acquisition with term loan borrowings of $46.1 million under our credit facility and the proceeds from the issuance of subordinated notes and detachable stock warrants of $26.0 million and preferred stock of $24.6 million. We repaid $8.7 million, $3.8 million, $5.8 million, $2.5 million and $1.8 million of term loan borrowings under our credit facility in 2003, 2002, 2001 and the three months ended March 31, 2004 and 2003, respectively.
We broadly define liquidity as our ability to generate sufficient cash flow from operating activities to meet our obligations and commitments. In addition, liquidity includes the ability to obtain appropriate debt and equity financing and to convert into cash those assets that are no longer required to meet existing strategic and financial objectives. Therefore, liquidity cannot be considered separately from capital resources that consist of current or potentially available funds for use in achieving long-range business objectives and meeting debt service commitments. Our principal capital resources consist of our $50.0 million revolving credit facility and our accounts receivable.
Our short-term and long-term liquidity needs will arise primarily from:
- •
- capital expenditures, which were $18.4 million in 2003, and are expected to be approximately $22.0 million in 2004, of which we expended $4.0 million through March 31, 2004;
- •
- interest expense, which was $12.8 million in 2003. We expect our interest expense to decrease in 2004 as a result of our use of a portion of the proceeds of this offering to repay the $39.25 million principal amount of outstanding subordinated notes, which bear interest at 12.5% per year;
- •
- principal repayments of debt and capital leases, which, after giving effect to the amendment and restatement of our credit agreement but without giving effect to this offering, are scheduled to be $650,000 for the last six months of 2004, $1.3 million in each of 2005, 2006 and 2007, $124.2 million in 2008 and $39.3 million in 2009. However, we expect to prepay all of our outstanding subordinated notes, which aggregate $39.25 million. See "Use of Proceeds";
50
- •
- operating lease payments, which were $5.8 million in 2003 and are scheduled to total $7.3 million in 2004, $6.3 million in 2005, $4.5 million in 2006, $2.7 million in 2007, $1.3 million in 2008 and $0.3 million thereafter; and
- •
- working capital requirements as may be needed to support business growth.
The following table provides a summary, as of December 31, 2003, without giving effect to the amendment and restatement of our credit facility and this offering, of our contractual obligations related to long-term debt, leases and other commercial commitments:
| | Payments due by period | ||||||||||||||
|---|---|---|---|---|---|---|---|---|---|---|---|---|---|---|---|
| Contractual Obligations | Total | Less than 1 year | 1-3 years | 3-5 years | More than 5 years | ||||||||||
| | (Dollars in thousands) | ||||||||||||||
| Long-Term Debt Obligations(1) | $ | 162,000 | $ | 11,075 | $ | 30,925 | $ | 80,750 | $ | 39,250 | |||||
| Capital Lease Obligations | 485 | 485 | — | — | — | ||||||||||
| Operating Lease Obligations | 22,329 | 7,310 | 10,803 | 3,941 | 275 | ||||||||||
| Other Long-Term Liabilities Reflected on Our Balance Sheet | 4,740 | 2,740 | 2,000 | — | — | ||||||||||
| Total(1) | $ | 189,554 | $ | 21,610 | $ | 43,728 | $ | 84,691 | $ | 39,525 | |||||
- (1)
- On July 13, 2004, we amended and restated our credit facility. After giving effect to this offering, term loans under the facility are payable in quarterly installments totaling $650,000 for the remainder of 2004, $1.3 million in each of 2005, 2006, 2007 and 2008, $62.4 million in 2009 and $61.8 million in 2010; provided that all amounts outstanding must be paid on October 30, 2008 if our subordinated notes have not been repaid or refinanced prior to July 30, 2008.
Of the $21.6 million due in 2004, $5.5 million had been paid as of March 31, 2004. Our obligations with respect to our long-term debt shown above will be affected by the use of proceeds from this offering. See "Use of Proceeds."
In addition to the contractual commitments listed above, in connection with our acquisition of the fuels delivery operations of Klemm, we agreed to pay an earn-out of between $1.0 million and $2.7 million in 2004, and between $1.0 million and $2.0 million in 2005, based on Klemm's earnings before interest, taxes, depreciation and amortization, or EBITDA, for 2003 and 2004, respectively, being above a specified minimum level. Based on Klemm's EBITDA in 2003, we paid the sellers $2.7 million in 2004. Based on performance to date, we expect to pay the entire $2.0 million.
Prior Credit Agreements
In December 1998, we entered into a revolving credit and term loan facility with Canadian Imperial Bank of Commerce, or CIBC, as administrative agent, and certain other lenders, which provided for term loans of $32.0 million, a $10.0 million acquisition line of credit and a revolving credit facility of $6.0 million. The proceeds of the term loans were used to finance the acquisition of our predecessor, Advantage Management Group, by certain of our current equity holders. Concurrent with our acquisition of Kenan Transport in April 2001, we amended and restated this credit facility to increase the amount of term loans to $90.0 million and availability under our revolving credit facility to $15.0 million. We amended this agreement again in 2003 to finance our acquisitions of the fuels delivery operations of Beneto and Klemm and to increase availability under our revolving credit facility to $20.0 million. As of December 31, 2003 and March 31, 2004, we had (i) $29.3 million and $27.0 million, respectively, of Tranche A term loans outstanding, (ii) $93.5 million and $93.2 million, respectively, of Tranche B term loans outstanding and (iii) $3.5 million and $0 million, respectively, of revolving credit loans outstanding under our credit facility. The term loans were payable in quarterly
51
installments totaling $11.1 million in 2004; $13.3 million in 2005; $17.6 million in 2006; and $80.8 million in 2007. Our credit facility provided us with a $20.0 million revolving credit facility, with a $15.0 million letter of credit subfacility. Availability under the revolving credit facility was restricted to 85% of our eligible accounts receivable (as defined in the credit facility) and was reduced by the amount of outstanding letters of credit. At March 31, 2004, we had $12.4 million of letters of credit outstanding and no borrowings under the revolving credit facility. Availability under our revolving credit facility (net of outstanding letters of credit) was $7.6 million at March 31, 2004. In May 2004, we amended the credit facility to increase our revolving credit facility to $27.0 million, and our letter of credit subfacility to $22.0 million. The revolving credit facility was originally due to expire on April 30, 2006.
Outstanding loans under the April 2001 credit facility bore interest at a rate equal to, at our option, either: (1) in the case of Eurodollar loans, the sum of the LIBOR rate for loans in an amount substantially equal to the amount of borrowing and for the period of borrowing selected by us plus a margin of (a) between 2.75% and 3.50% in the case of Tranche A term loans and revolving credit loans, depending on our consolidated leverage ratio (as defined in the credit facility) and (b) 4.00% in the case of Tranche B term loans or (2) the higher of (a) CIBC's prime or base rate or (b) one-half percent plus the latest overnight federal funds rate plus (i) between 1.75% and 2.50% in the case of Tranche A term loans and revolving credit loans, depending on our leverage ratio and (ii) 3.00% in the case of Tranche B term loans. At March 31, 2004, the interest rate on Tranche A and Tranche B Eurodollar borrowings under the credit facility was 4.79% and 5.49%, respectively. There were no base rate borrowings at March 31, 2004. Interest was payable quarterly in the case of base rate loans and on maturity dates or every three months, whichever is shorter, in the case of Eurodollar loans. We were required to pay a fee of 0.75% per year for the unused portion of the revolving credit facility and between 2.0% and 2.75% per year on outstanding letters of credit. We were required to use either 50% or 75% of our excess cash flow (as defined in the credit facility) each year, depending on our consolidated leverage ratio, as well as the proceeds of debt and equity financings, to prepay outstanding terms loans under the credit facility. The credit facility, which was guaranteed by all of our subsidiaries and collateralized by substantially all of our assets, required us to maintain certain financial ratio covenants. The credit facility limited our ability to incur debt, to sell or dispose of assets, to create or incur liens, to make additional acquisitions, to pay dividends, to purchase or redeem our stock and to merge or consolidate with any other entity and provided the lender with the right to require the payment of all amounts outstanding under the credit facility if a change in control of KAG occurs.
Existing Credit Facility
On July 13, 2004, we amended and restated our credit facility described above to increase the amount of term loans outstanding under the facility to $130.0 million and to increase availability under the revolving credit facility to $50.0 million, with a letter of credit subfacility of $30.0 million. The revolving credit portion of the facility expires on October 30, 2008 (June 30, 2009, if our subordinated notes are repaid or refinanced prior to July 30, 2008). Term loans are payable in quarterly installments totaling $650,000 for the remainder of 2004, $1.3 million in each of 2005, 2006, 2007 and 2008, $62.4 million in 2009 and $61.8 million in 2010; provided that all amounts outstanding must be paid on October 30, 2008 if our subordinated notes have not been repaid or refinanced prior to July 30, 2008. The credit facility permits us to increase the amount of term loans or revolving credit availability thereunder by up to $75.0 million at any time prior to July 13, 2008, subject to our satisfying specified conditions. At July 13, 2004, we had $130.0 million of term loans and no revolving loans outstanding under the credit facility. In addition, at that date we had $15.9 million of letters of credit outstanding, which reduces availability under the revolving credit facility.
Outstanding loans bear interest at a rate equal to, at our option, either: (1) in the case of Eurodollar loans, the sum of the LIBOR rate for loans in an amount substantially equal to the amount
52
of borrowing and for the period of borrowing selected by us plus a margin of (a) 3.5% in the case of term loans and (b) between 2.5% and 3.5% in the case of revolving credit loans, depending on our total leverage ratio (as defined in the credit facility) or (2) in the case of base rate loans, the higher of (a) CIBC's prime or base rate or (b) one-half percent plus the latest overnight federal funds rate plus (i) 2.5% in the case of term loans and (b) between 1.5% and 2.5% in the case of revolving credit loans, depending on our total leverage ratio. Interest is payable quarterly in the case of base rate loans and on maturity dates or every three months, whichever is shorter, in the case of Eurodollar loans. We are required to pay a fee of 0.75% per year for the unused portion of the revolving credit facility and between 2.5% and 3.5% per year on outstanding letters of credit. We are required to use either 50% or 75% of our excess cash flow (as defined in the credit facility) each year, depending on our total leverage ratio, as well as the proceeds of debt and equity financings, to prepay outstanding terms loans under the credit facility. The credit facility, which is guaranteed by all of our subsidiaries and collateralized by substantially all of our assets, requires us to maintain certain financial ratio covenants. The credit facility limits our ability to incur debt, to sell or dispose of assets, to create or incur liens, to make additional acquisitions, to pay dividends, to purchase or redeem our stock and to merge or consolidate with any other entity and provides the lender with the right to require the payment of all amounts outstanding under the credit facility if a change in control of KAG occurs.
Subordinated Notes
In December 1998, we issued $13.25 million of our 12.5% senior subordinated notes and detachable stock purchase warrants to purchase preferred stock and, under certain circumstances, common stock. These warrants were valued at approximately $1.7 million, based upon their estimated fair value of the proceeds from the notes on the issuance date, which was recorded as original issue discount. In April 2001, we issued an additional $26.0 million of these notes and additional detachable stock purchase warrants to purchase preferred stock and, under certain circumstances, common stock. These warrants were valued at approximately $2.6 million, based upon their estimated fair value of the proceeds from the notes on the issuance date, which was recorded as original issue discount. The senior subordinated notes bear interest at the rate of 12.5%, are guaranteed by all of our subsidiaries and are due on April 30, 2009. In connection with the issuance of the notes in December 1998 and April 2001, we issued detachable warrants to the purchasers of the notes. The warrantholders have a put option to sell the warrants back to us for a cash price based on the fair market value of the preferred stock for which such warrants are exercisable upon the occurrence of certain events. For financial reporting purposes, the aggregate fair value of the warrants, including the put option, was estimated to be $4.2 million, $17.9 million and $17.9 million at December 31, 2002 and 2003 and at March 31, 2004, respectively, and is classified as "detachable stock warrants, subject to put option" on our balance sheet. This put option will terminate upon the consummation of this offering, and the put price will be reclassified from liabilities to a component of stockholders' equity. We intend to use a portion of the proceeds of this offering to repay these notes, plus the required prepayment penalty of $392,500 and accrued interest. See "Use of Proceeds" and "Description of Capital Stock—Warrants."
Based on our current level of operations and our anticipated growth, we believe that cash flow from operations and other available sources of liquidity, including borrowings under our revolving credit facility, will be sufficient to fund our operations for the next 12 months and for our currently anticipated needs beyond that period.
Inflation
The primary raw material we use is fuel, and fuel costs are subject to regional, national, international and business cycle influences. In the past, we have been able to pass along significant and sustained increases in fuel costs to customers through a fuel surcharge. There is no guarantee that this
53
will be possible in the future. See "Risk Factors—We may be adversely impacted by fluctuations in the price and availability of fuel."
Seasonality
Our business is subject to seasonal trends common in the refined petroleum products delivery industry. We typically face reduced demand for refined petroleum products delivery services in the northern portion of the United States during the winter months and on the west coast during the first five months of the calendar year. At the same time, we face increased demand for fuels delivery services in Florida during the winter months. Further, operating costs and earnings are generally adversely affected by inclement weather conditions. These factors generally result in lower operating results during the first and fourth quarters of the year and cause our operating results to fluctuate from quarter to quarter. Our operating expenses also have been somewhat higher in the winter months, due primarily to decreased fuel efficiency, increased utility costs and increased maintenance costs for tractors and trailers in colder months.
Recent Accounting Pronouncements
In June 2002, the Financial Accounting Standards Board (FASB) issued SFAS No. 146,Accounting for Costs Associated with Exit or Disposal Activities,which addresses financial accounting and reporting for costs associated with exit or disposal activities. The provisions of this statement, which are effective for exit or disposal activities that are initiated after December 31, 2002, require expenses to be recorded when the liability is incurred, rather than when management commits and announces a plan to exit, dispose or restructure a business. The adoption of SFAS 146 did not have a material impact on our financial condition, results of operations or cash flows.
In May 2003, the FASB issued SFAS No. 150,Accounting for Financial Instruments with Characteristics of Both Liabilities and Equity.This statement establishes standards for classifying and measuring as liabilities certain financial instruments that embody obligations of the issuer and have characteristics of both liabilities and equity. Instruments that are indexed to and potentially settled in an issuer's own shares that are not within the scope of SFAS 150 remain subject to existing guidance. SFAS 150 became effective in 2003. The adoption of SFAS 150 did not result in a significant impact on our results of operations, financial condition or cash flows as our detachable stock warrants, subject to put option, were historically accounted for as a liability under existing accounting guidance.
Quantitative and Qualitative Disclosures About Market Risk
Our market risk is affected primarily by changes in interest rates. We are exposed to the impact of interest rate changes primarily through our variable-rate borrowings under our credit facility. Significant increases in interest rates could adversely affect our operating margins, our results of operations and our ability to service our indebtedness. Based on our average variable interest rate debt outstanding during 2003, a 1% change in our variable interest rates would have increased our interest expense by $1.3 million.
We have in the past utilized interest rate swaps to reduce our exposure to market risk from changes in interest rates, and may again do so in the future. The principal objective of such contracts is to minimize the risks and/or costs associated with our variable rate debt. All derivative instruments held by us are designated as hedges and, accordingly, the gains and losses from changes in derivative fair values are recognized as comprehensive income as required by SFAS 133. Gains and losses upon settlement are recognized in the statement of operations or recorded as part of the underlying asset or liability as appropriate. We are exposed to credit-related losses in the event of nonperformance by counterparties to these financial instruments; however, counterparties to these agreements are major
54
financial institutions, and the risk of loss due to nonperformance is considered by management to be minimal. We do not hold or issue interest rate swaps for trading purposes.
We had two open interest rate swap agreements as of December 31, 2003, both of which expired on March 31, 2004. The intent of these agreements was to reduce interest rate risk by swapping an unknown variable interest rate for a fixed rate. These agreements were not renewed when they expired. The following is a summary of the economic terms of each agreement as of December 31, 2003:
| | LaSalle | CIBC | ||
|---|---|---|---|---|
| Notional amount | $14,625,000 | $13,500,000 | ||
| Fixed rate paid | 4.035% | 4.04% | ||
| Variable rate received | 1.1625% | 1.1625% | ||
| Effective date | March 25, 2002 | March 25, 2002 | ||
| Expiration date | March 31, 2004 | March 31, 2004 |
We are required under our amended and restated credit facility to enter into interest rate swap agreements with respect to at least $65.0 million of our term loans by January 9, 2005 or such later date as CIBC determines. We currently are not party to any interest rate swap agreements.
55
Overview
�� In 2002, approximately 260 billion gallons of refined petroleum products were consumed in the United States. Refined petroleum products include gasoline, kerosene, distillate fuel oil, which includes diesel fuel, heating oils and lubricating oil. Approximately two-thirds of all refined petroleum products consumed were for transportation purposes, including gasoline, which made up 46% of all refined petroleum products consumed in 2002. Our operations are focused on the delivery of all types of refined petroleum products, although our business is focused principally on those products used in transportation. In 2002, we transported approximately 14 billion gallons of refined petroleum products, or 5% of the total transported refined petroleum products consumed for purposes of transportation. Approximately 93.0% of our 2003 pro forma revenues and 92.4% of our revenues for the three months ended March 31, 2004 were derived from delivery of refined petroleum products for transportation.
| U.S. Petroleum Products Supplied by Type | U.S. Petroleum Products Consumption by Use | |
2002 Total = 264 billion gallons | 2002 Total = 264 billion gallons | |
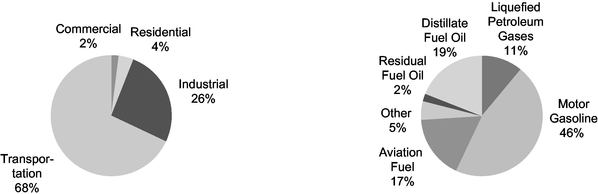 | ||
Source: Energy Information Administration, U.S. Department of Energy
Refined petroleum products are derived from crude oils. After being produced, crude oil is transported to refineries, where it is processed into refined petroleum products. From these refineries, refined petroleum products are moved over long distances to terminals, generally via pipeline or barge. These products are then picked up from these terminals by tank trucks such as ours and delivered to petroleum marketers such as gasoline stations. In some cases, tank trucks will pick up products at the refinery and deliver them locally to the end user.
Refined Petroleum Products Distribution
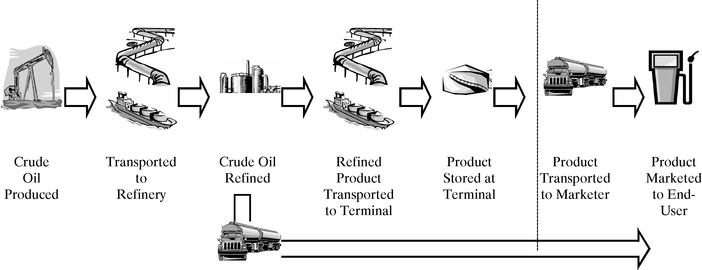
56
Demand for Fuels Delivery Services
The nationwide consumption of refined petroleum products, such as gasoline, diesel and aviation fuels, drives the underlying demand for delivery of these products from refiners to fuel marketers and other end users. Historically, consumption of gasoline and other refined petroleum products has been very stable, exhibiting compounded annual growth of approximately 1.4% from 1980 through 2002. The Energy Information Administration of the U.S. Department of Energy estimates that retail demand for refined petroleum products will increase between 2002 and 2025 at a compounded annual growth rate of 1.6%, a 44% increase over the total period.
Fuels Delivery Industry
Our industry transports refined petroleum products over the "last mile" of the country's energy distribution network, delivering these products from pipelines and local refineries to gasoline stations, fuel marketers and other end users. Our industry is characterized by high barriers to entry, such as the time and cost required to develop the capabilities necessary to handle hazardous material, the resources required to recruit and train drivers, substantial industry regulatory and insurance requirements and the significant capital investments required to build a fleet of equipment and establish a network of terminals. Unlike trucking companies that service the more cyclical retail and manufacturing sectors, demand for fuels delivery service is non-cyclical, although the industry experiences increased seasonal demand in periods of heightened driving activity in certain areas of the country.
In addition, unlike most trucking companies, our core fuels delivery business has an average one-way trip length of approximately 35 miles. This shorter length of haul minimizes our exposure to the difficulties of recruiting and retaining a high quality workforce, because we are able to offer our drivers scheduled shifts that allow them to return home each day and allow them regularly scheduled days off. Furthermore, the new hours-of-service regulations that may reduce the productivity of other trucking companies are not expected to have an impact on our operations, because our scheduled shifts and scheduled time off already comply with these new regulations. Finally, unlike most other trucking companies, we service most of our customers under contracts that specify minimum levels of business.
Market Size and Composition
We estimate, based on industry sources, that approximately 264 billion gallons of refined petroleum products were consumed during 2003. We believe that substantially all of these 264 billion gallons were transported by truck at some point in the distribution process and, based on our revenue per gallon, represent a market in excess of $6 billion. Of this market, we estimate that 60% to 70%, or approximately 158 billion to 185 billion gallons, is still handled by in-house private fleets of the major oil companies and other petroleum marketers. The remaining approximately 30% to 40% of the market is highly fragmented, served by more than 1,000 small regional or local carriers.
Private Fleets of Major Oil Companies
Historically, refined petroleum products have been transported from the refinery to gas stations and convenience stores by the "in-house" private fleets of major oil companies such as BP, ChevronTexaco, ConocoPhillips, ExxonMobil, Marathon Ashland, Shell and Sunoco. Maintenance of a transportation infrastructure by major oil companies is time consuming and requires substantial internal expertise and resources, including capital investment and management attention. In addition, distribution using private fleets is costly, driven primarily by labor expenses. As the major oil companies have renewed their focus on their core operations of oil and gas exploration, production, refining and marketing over the past few years, several have made the decision to outsource a number of their non-core functions, including their fuels delivery and logistics needs, in order to reduce costs and lower overhead. We are seeing this outsourcing trend take many forms. For example, major oil companies
57
and other petroleum marketers may choose to outsource a portion, or all, of their fuels delivery and logistics operations, while others may choose to outsource the logistics function only and retain control over their own private fleets.
This outsourcing trend has already been widely adopted in Europe, where the majority of fuels delivery is handled by third party outsourcing partners. In the United States, the trend to outsource these fleets is at a preliminary stage. This outsourcing trend is evidenced by the fact that despite the increase in the consumption of refined petroleum products, the number of tanker trucks operated by the major oil companies, as reflected in industry statistics, decreased from 1,276 in 2002 to 1,162 in 2003, an approximately 9% decrease. We believe this outsourcing trend is likely to continue for several reasons. First, dedicated fuels delivery companies such as KAG can provide the required transportation services more economically than the major oil companies due to lower cost structures. Second, the development of national and regional fuels delivery companies has made it easier for major oil companies to outsource their petroleum deliveries through only a few companies. As a result, we believe that as this trend gains momentum, there is a strong likelihood that a significant portion of the current private fleet volume may be outsourced over the next five years.
We believe that an independent carrier with the infrastructure and the technology capable of reliably serving the major petroleum marketers on a national and regional basis will be well-positioned to benefit from these outsourcing trends.
Regional and Local Carriers
The remaining 30% to 40% of the market not served by the major oil companies and other petroleum marketers is highly fragmented, characterized by intense competition among over 1,000 small regional and local carriers and small private fleets. Because the fuels delivery and logistics industry is characterized by stringent customer requirements relating to safety, significant insurance requirements and substantial federal and state regulatory requirements relating to safety, driver training, equipment and product handling, many of these companies are facing increased pressure from escalating insurance and operating costs, which has created a difficult environment for smaller carriers with lesser financial resources. As a result, many of these small regional and local carriers are being forced to exit the industry or partner with a larger company better equipped to meet these strict customer, insurance and regulatory requirements. In addition to the recent consolidation among the major oil companies, hypermarkets and super regional and national chains have emerged to replace many of the independent convenience stores and service stations served by many of our competitors. As our customers consolidate, we believe they will increasingly seek a delivery services provider with the size, infrastructure, capabilities, scope of services and geographic reach to service their entire operation, and, as a result, smaller carriers will face increasing pressure to consolidate.
Retail Petroleum Marketers
The retail petroleum marketers consist of five distinct segments, as follows:
- •
- Major Oil Companies. Major oil companies, such as BP, ChevronTexaco, ConocoPhillips, ExxonMobil, Marathon Ashland, Shell and Sunoco, currently represent approximately 25% of the retail market through company-owned or dealer operated outlets. The major oil companies comprise the strongest segment of the market financially, given their status as divisions of multinational corporations. The major oil companies, however, have seen a slight deterioration in market share over the past few years with the emergence of hypermarkets and other regional and national chains. The major oil companies generally focus company store growth in major metropolitan areas or heavily populated states, while divesting company owned assets in less populated rural markets.
58
- •
- Convenience Stores. Convenience stores currently represent approximately 15% of the retail market and include pure-play convenience store operators such as 7-Eleven, Mac's, QuikTrip, RaceTrac and Wawa. Convenience stores have experienced significant volatility over the past few years, which we believe is mostly the result of the significant merger and acquisition activity of the 1990's and fuel pricing and market share pressures from the hypermarket segment.
- •
- Hypermarkets. Hypermarkets currently represent approximately 10% of the retail market and include grocery stores such as Gateway and Kroger and warehouse retailers like Costco and Sam's Club. Although a relatively new domestic business model that focuses on high volume and lower gross margins, hypermarkets have experienced significant market share growth over the past five years.
- •
- Jobbers. Jobbers, which are small companies with fleets of up to approximately 20 tractors that transport refined petroleum products from the refinery to more rural gas stations and convenience stores not covered by the fleets of major oil companies, and independent oil companies currently represent approximately 37% of the retail market. Like the major oil companies, jobbers have also experienced significant competitive pressures from hypermarkets. As jobbers focus on strengthening the competitiveness of core business operations, many are also considering outsourcing their proprietary fleets.
- •
- Truck Stops. Truck stops currently represent approximately 13% of the retail market. This segment has seen the rapid growth of five major chains that now control approximately 45% to 50% of the total truck stop market. Ownership of the remaining outlets, however, is highly fragmented. With trucking firmly entrenched as the primary mode for the movement of freight within the United States, we expect this market to continue to experience steady growth moving forward.
Among petroleum marketers, hypermarkets and super regional and national chains have emerged to replace many of the independent convenience stores and service stations served by many of our competitors. As our customers consolidate, we believe that they will increasingly seek a fuels delivery provider with the size, capabilities, scope of services and geographic reach to serve their entire operations. As a result of these factors, we believe that smaller carriers face increasing pressure to consolidate.
59
Our Company
We are the largest independent fuels delivery carrier in North America. We make regular, local deliveries of refined petroleum products, such as gasoline, diesel and aviation fuels, to our customers. We believe our short-haul, "last mile" delivery of refined petroleum products from pipelines and refineries to gasoline stations, fuel marketers and other end users is a vital link in the country's energy distribution network. In 2002, this network distributed approximately 260 billion gallons of refined petroleum products that were consumed in the United States during that year. On a pro forma basis, we delivered approximately 21 billion gallons of refined petroleum products in 2003 to our customers using our network of 77 terminals and 93 satellite operations. With approximately $365 million in revenue and approximately $416 million in pro forma revenue for 2003, and approximately $104 million in revenue for the three months ended March 31, 2004, we are approximately six times larger than our next largest competitor.
Our customer base includes most of the major oil companies, as well as truck stop chains, convenience stores, hypermarkets, aviation fuel marketers and other national and regional petroleum marketers. For most of our customers, we operate under contracts that have specified minimum levels of business. Each of our ten largest customers for 2003 has been a customer of ours for more than ten years. We are the only independent fuels delivery carrier with a nationwide network, with operations in 32 states and the ability to deliver within all 48 states of the continental United States, as well as Canada. Our nationwide network allows us to offer our national and regional customers broad distribution capabilities that are difficult for our smaller competitors to replicate. In addition, we seek to expand the services we offer our customers by providing value-added logistics solutions such as real-time delivery monitoring, inventory and supply source management, fleet scheduling and integrated billing and payment. These services, together with our nationwide footprint, make us a nationwide single source provider of supply chain solutions for petroleum and petrochemical products. We believe that with our size, capabilities, scope of services and geographic reach, we are well-positioned to capitalize on both our customers' continued outsourcing of their fuels delivery operations and our industry's trend towards consolidation.
We have grown substantially through strategic acquisitions and internal growth. Prior to 1992, we provided fuels delivery services primarily in northeastern Ohio. By 1998, we had expanded throughout Ohio and into Michigan, Kentucky, West Virginia and western Pennsylvania. Since 2000, we have expanded from 14 to 32 states and expanded our infrastructure with six acquisitions and 17 private fleet conversions, through which we have taken ownership of our customers' private fleets and service the business they previously had serviced on their own. This expansion has allowed us to build the only independent national fuels delivery carrier in our industry. Between 1992 and 2003, we grew our revenue, organically and through acquisitions, from approximately $7 million to approximately $416 million on a pro forma basis, representing a compound annual growth rate of approximately 45%. We believe our size, capabilities and geographic scope will allow us to increase operating efficiencies for ourselves and our customers and improve driver productivity, as well as enable us to increase our revenue by expanding the services we provide to our customers and by capitalizing on industry trends.
Our Strengths
Leading Market Position. We are the largest independent fuels delivery carrier in North America and the only carrier with a nationwide network. With approximately $416 million in pro forma revenue for 2003 and approximately $104 million in revenue for the three months ended March 31, 2004, we are approximately six times larger than our next largest competitor. Our national footprint, with locations in 32 states that allows us to operate in all 48 states in the continental United States, enables us to serve customers with both national and regional shipping requirements and provides us with a
60
significant network of operations. Our extensive network of 77 terminals and 93 satellite operations provides us with the flexibility to successfully handle volume fluctuations, which benefits our customers by helping to eliminate service disruptions and the need to use backup carriers at higher rates during peak periods. We believe that our geographic diversity, capabilities, industry reputation, broad offering of value-added logistics services and proprietary technology will increase our leading market position as our industry consolidates and our customers continue to outsource their fuels delivery operations.
Commitment to Safety and Quality Leads to Strong Industry Reputation. We believe our customers' satisfaction and the success of our company is largely a result of our commitment to safety and quality. Our drivers, as the interface with the customer, play a critical role in helping us build and enhance our customer relationships. We dedicate significant time and resources to ensure our drivers have the proper experience and training, are supported by qualified field and terminal staff, have access to well-maintained equipment, operate in a safe and secure environment and are satisfied with their jobs. Our driver training exceeds federal and state requirements. Our commitment to safety and quality service has resulted in strong relationships with our customers. We provide delivery and logistics services to all of the ten largest petroleum marketers in the United States, including Amerada Hess, BP, ChevronTexaco, Citgo, ExxonMobil, Marathon Ashland, Shell, Sunoco and 7-Eleven. The strength of our reputation and our high rate of overall customer retention is evidenced by the fact that each of our ten largest customers for 2003 has been a customer of ours for more than ten years. We believe our industry reputation has made us the preferred partner of major oil companies and petroleum marketers, as well as the preferred employer of drivers and independent owner-operators.
Industry-Leading Technology. We have developed and are currently implementing proprietary technology aimed at enhancing the efficiency of our operations and lowering our customers' costs. Our technology consists of hardware and software designed specifically for the petroleum transport sector, including the same fleet scheduling software package used by the major oil companies. Our technology enables us to provide customers with a seamless interface throughout their supply chains. For example, we have developed real-time analysis tools that allow us to continuously track our customers' inventory levels in order to minimize their inventory costs and optimize our delivery schedule and truck utilization. Our customers value this technology because it provides them with real-time data to help them lower their inventory costs. We are also developing tools to transmit delivery information to internal billing systems to ensure accuracy and timeliness of billing.
Partner of Choice in a Consolidating Industry. As a result of our size and scope of operations relative to our competitors, as well as our strong industry reputation and our industry-leading technology, we believe we are the carrier of choice to acquire and integrate smaller carriers, as well as to execute private fleet conversions for major oil companies and other petroleum marketers. Because our size allows us to benefit from economies of scale in purchasing items such as fuel, tires and insurance coverage, as well as in training drivers, we believe we are well-positioned to continue strategically acquiring and integrating smaller carriers who find the current operating environment difficult. In addition, we are the only carrier in the industry providing full-service fuels delivery and logistics services to customers on a regional and national basis, and we believe we are the partner of choice for large petroleum marketers, such as the major oil companies, that are considering outsourcing their petroleum delivery and logistics needs.
Experienced Management Team. We have an experienced management team with an average of over 24 years in the industry. In 1991, our chief executive officer and chief financial officer founded the company that is now known as The Kenan Advantage Group. Our management team has extensive experience and a proven track record of growing our company organically, integrating strategic acquisitions, establishing the foundation necessary to service significant new customers and developing new business with existing customers. We believe our management team's experience in identifying,
61
consummating and integrating acquisitions, as well as obtaining outsource contracts and converting private transportation fleets, affords us a competitive advantage in a consolidating industry.
Our Strategy
Capitalize on the Current Trend of Private Fleet Conversion. We believe there will continue to be significant revenue growth opportunities as major oil companies and other petroleum marketers increase their focus on core businesses and consider outsourcing non-core operations, such as fuels delivery and logistics. Because the delivery and logistics infrastructure maintained by our customers is difficult to manage and requires substantial internal expertise and resources, including capital spending and management focus, we believe an increasing number of petroleum marketers will choose to sell their internal truck fleets and outsource the delivery services currently provided by those fleets. With our ability to implement industry-leading safety and security programs, hiring and training programs, and key technology and other enhanced value-added systems such as inventory tracking and supply source management, we believe our outsourced delivery and logistics services offer an attractive opportunity to petroleum marketers seeking a viable, cost-effective option for reliable delivery across a large number of locations.
Make Selective Acquisitions. We intend to continue growing through the acquisition of high-quality regional and local petroleum carriers. Overall, the fuels delivery and logistics services market is highly fragmented, consisting of over 1,000 regional and local carriers smaller than us. Many of these smaller or regional players are facing increased pressure from escalating insurance and operating costs, increasing customer demands for additional services and a stricter regulatory environment, and we believe this has created a very favorable environment for strategic acquirors. We have developed a defined process to effectively integrate new acquisitions without adversely affecting operations. Since 2000, we have completed six acquisitions, and we believe there are additional strategically attractive targets that would both complement our existing operations in high fuels consumption markets such as Texas, California and New England as well as expand our geographic reach.
Deliver Value-Added Services to Our Customers. We offer a wide array of value-added services and features that complement the core delivery services we provide to our customers. Our advanced technology will enable us to extend our service offerings into areas we believe are critical to our customers through a variety of technology-based solutions, including web-based access to information in our fully integrated transportation management system. These solutions allow us to market value-added services to our customers, such as real-time delivery monitoring, inventory and supply source management, fleet scheduling, driver performance monitoring and integrated billing and payment. We believe we are the only provider in our industry capable of supplying all of these solutions to our customers.
Provide Logistics Outsourcing Solutions. As our customers continue to focus on their core businesses, we believe they will increasingly rely on their primary carriers to provide comprehensive supply chain solutions. We intend to offer bulk transportation solutions to our customers by providing products and services such as scheduling services, best buy or optimal sourcing, fuel capital management, quality assurance and carrier settlement, brokerage services and real-time data. As a logistics provider, we will be able to purchase transportation services from both our company and other carriers, then package that transportation with other value-added services we provide. By managing the logistics function of our customers, we will be able to deliver a high-value solution to our customers while allowing our company to complement our core operations with a more flexible, non asset-based business model.
Opportunistically Serve Existing Customers in Other Product Categories. Many of our existing customers also have delivery needs for other petroleum and non-petroleum based products, such as chemicals, lubricants, plastics and cement. We intend to expand into delivery of those products
62
exhibiting similar characteristics to our core fuels delivery business, primarily those characterized by dedicated short-haul routes with no backhaul or requirement for the driver to make an overnight trip. In addition to refined petroleum products, approximately 7.0% of our pro forma revenue for 2003 and 7.6% of our revenue for the three months ended March 31, 2004 was derived from delivery services for the petrochemical industry, which we estimate has a total market size of approximately $5.7 billion. We believe continued growth in the petrochemical industry, along with expansion into delivery or logistics services for other related products, may provide additional growth opportunities for our company.
Development of Our Company
Advantage Tank Lines Inc. was founded in 1991 by Dennis Nash, our president and chief executive officer, and Carl Young, our chief financial officer. During the 1990s Advantage Tank Lines expanded from its Cleveland/Canton/Akron operating area into central and western Ohio, Michigan, Kentucky, West Virginia and western Pennsylvania. Beginning in 1995, Advantage Tank Lines began to expand its operations beyond transportation of refined petroleum products to include short-haul transport of petrochemicals and lubricants on behalf of petrochemical companies that typically outsource short-haul transportation requirements. In 1997, Advantage Management Group, Inc., or Advantage, was formed by Messrs. Nash and Young as a combination of Advantage Tank Lines and North Canton Transfer, which was founded by Mr. Young in 1982. By the end of 1998, Advantage had broadened its scope of operations to include short-haul transportation of petrochemicals in Pennsylvania, North Carolina, South Carolina and Texas.
In 1998, the founders of Advantage determined that in order to expand into new regions of the country to take advantage of the industry's outsourcing and consolidation trends, they would need additional equity and debt capital. In December 1998, Advantage was acquired in a transaction led by the principals of Sterling Investment Partners, and in which RFE Investment Partners played a major role, that provided Advantage with the expansion capital that it required. Following the acquisition, Advantage expanded its operations into Indiana and Illinois with the March 2000 acquisition of McDaniel Transportation. Advantage also consolidated its southern Ohio market with the July 2000 acquisition of Emery Transportation. In January 2001, Advantage expanded the geographic scope of its operations in the Midwest and Mid South regions of the country with the private fleet conversion of GENI Transport, the former private fleet of Williams Energy based in Memphis, Tennessee.
The Kenan Advantage Group was formed in April 2001 when Advantage acquired Kenan Transport Company, a publicly-traded company founded in 1949 that had become the largest independent fuels delivery carrier in the industry, with operations focused in the Southeast United States. In February 1998, Kenan Transport acquired Petro Chemical Transport, or PCT, the private in-house fleet of Citgo. The PCT acquisition significantly expanded Kenan Transport's national presence and service area, and provided us with a remote inventory control and logistics system operating in Dallas, Texas, that forms the base for our current technology services. This system enables PCT to monitor product inventories electronically for customer retail locations and dispatch delivery of product on an as-needed basis.
In May 2003, we acquired the fuels delivery operations of Beneto, Inc., which operates primarily in California, and in June 2003 we purchased substantially all the assets of Carl Klemm, Inc., d/b/a Klemm Tank Lines, a fuels delivery carrier that operates primarily in Wisconsin and Illinois. We are now the largest independent nationwide petroleum carrier in the United States. With approximately $365 million in revenue for 2003, and with approximately $416 million in pro forma revenue for the same period and approximately $104 million in revenue for the three months ended March 31, 2004, we are approximately six times larger than our next largest competitor.
63
Fuels Delivery Services
We are a critical link in our customers' supply chain, transporting primarily motor fuels from terminals and refineries to retail locations such as gas stations, truck stops and convenience stores. Through our network of 77 terminals and 93 satellite operations and our fleet of over 2,000 tractors and 2,600 tank trailers, we deliver over 7,200 loads per day, totaling over 21 billion gallons of gasoline a year, to our customers. We deliver product to our customers 24 hours a day, 365 days a year. The nature of our business entails almost continuous involvement with customers to ensure appropriate product levels are delivered in a highly reliable, safe and timely fashion.
Unlike most trucking companies, our routes are primarily short-haul in nature, with the average round trip by our drivers—i.e., from the terminal to the product pickup location to the delivery location and back to the terminal—being less than 100 miles. Our drivers typically make three to four round trips per day in the same general locale and typically return home every night.
Technology and Logistics Services
We have developed and are currently implementing advanced, proprietary technology aimed at enhancing the efficiency of our operations and lowering our customers' costs. Our advanced technology consists of hardware and software designed specifically for the petroleum transport sector, including the same fleet scheduling software package used by the major oil companies. Our technology enables us to provide customers with a seamless interface throughout their supply chains.
We offer a wide array of value-added services and features that complement the core delivery services we provide to our customers. Our technology will enable us to extend our service offerings into areas we believe are critical to our customers, including web-based access to information in our fully integrated transportation management system. These solutions allow us to market value-added services to our customers, such as real-time delivery monitoring, inventory and supply source management, fleet scheduling, driver performance monitoring and integrated billing and payment. We believe we are the only provider in our industry able to supply all of these solutions to our customers. We believe the value-added services we offer our customers will allow us to integrate ourselves more deeply into our customers' operations and make it more difficult for our customers to switch carriers.
We provide access to our systems through multiple gateways that offer our customers maximum flexibility and immediate access to information. We also employ systems and technology in an effort to provide our customers with improved inventory and supply chain management options, scheduling optimization to reduce costs and improve delivery efficiency and real time pick up and delivery information. Our technologies include:
- •
- Electronic Data Interchange (EDI)—For our customers who prefer to exchange information electronically, we provide a number of EDI options with flexible formats and communication alternatives. Through this system, our customers can transmit or receive orders, pick up and delivery information as well as other customized information.
- •
- Online Billing—This technology allows our customers and other business partners to view billing and invoice information, as well as view and retrieve POD and bill of lading documents.
- •
- eChain Customer—A secure web interface portal where our customers may add/modify/review their order information, enter sales and inventory information, view both historical and projected sales and inventory information on-line, receive pick up and delivery confirmation and download and print reports. We continue to add other capabilities to this site based on customer requests.
- •
- Aspen Retail—Our truck scheduling system that takes all of our available delivery resources and all of our customer order requirements and matches them to provide pick up and delivery
64
- •
- Interactive Voice Response (IVR)—Through our IVR telephone system, customers can add/modify/review/delete orders, enter/modify/review sales and inventory information, receive order and delivery updates and transfer to a Customer Service Representative at any time.
- •
- On-Board Computer (OBC) System—We plan to commence installing our next generation of on-board computers in our trucks beginning in August 2004. The computer will be tied to a wireless communications network to allow real time information to pass to and from our drivers, schedulers and supporting systems. With these OBC's:
- •
- drivers will be able to maintain and access their DOT logs electronically;
- •
- road fuel tax reporting can be done electronically;
- •
- drivers and schedulers will be able to communicate electronically;
- •
- driver safety and performance can be monitored;
- •
- route tracking and vehicle location can be monitored; and
- •
- engine performance can be monitored.
- •
- MIDIS Handheld Computer System—Our fleet will also be outfitted with the Mobile Integrated Data Information System (MIDIS) beginning in 2004. MIDIS is a real time pick up and delivery confirmation system that will run both on the on board computers or on any Java enabled handheld device with GPS monitoring capabilities. The system has store and forward capability to ensure no data is lost in transmission if the wireless service provider loses connection to the device. Timely and accurate pickup and delivery information has become an increasingly important requirement for both our customers and KAG to reduce costs, accelerate receivables, enhance equipment usage and improve supply chain visibility. MIDIS was developed by us and is specifically designed for use by bulk liquid carriers and/or their customers. We plan to license this application to other companies in the bulk liquid transportation sector.
schedules for our drivers that are cost optimized and meet our customers delivery requirements safely, efficiently and on-time.
Terminal and Satellite Operations
We currently own or lease 77 terminals and maintain 93 satellite operations, located in 32 states. Each location services an average radius of approximately 150 miles within a geographic region. Our terminals are led by a terminal manager, who is assisted by a team of experienced operations supervisors. Their responsibilities include the following:
- •
- monitoring all activity to ensure compliance with our safety policies;
- •
- recruiting, hiring and retention of drivers;
- •
- training on a continuous basis regarding the use of equipment, safety, changes of regulation and other pertinent information;
- •
- soliciting new customers and maintaining relationships with existing customers;
- •
- order taking, either electronically or by phone and assigning deliveries as necessary to keep customers at pre-determined levels of inventory;
- •
- monitoring customer inventory levels;
- •
- coordinating the use of drivers and equipment to accommodate the optimal delivery schedule;
- •
- providing delivery information via mail, fax or Internet to many of our customers on a timely basis;
65
- •
- managing all personnel issues, including driver productivity and optimal staffing;
- •
- responding to operating emergencies such as injuries, property damage and vehicular accidents; and
- •
- coordinating with our garages for necessary equipment maintenance.
As we expand our logistics services, we intend to centralize load scheduling and dispatch and focus terminal operations on driver hiring and training, customer service and equipment maintenance. The locations of our terminals is set forth under "—Properties" below.
Satellite operations are locations where trucks and drivers are located but we have no management on site. These satellite operations tend to cover regions where demand for our services has not yet reached a level where a terminal is cost-effective. Satellites are also established to improve our efficiency due to changes regarding the location of product availability and are often located at truck stops or garage facilities where fuel and maintenance are available.
Drivers and Owner-Operators
At March 31, 2004, we utilized 3,343 drivers, of which 2,823 were our employees and 520 were owner-operators.
Owner-operators are independent contractors who, through an exclusive contract with KAG, own their own tractors and drive exclusively for us. We generally pay owner-operators on a percentage of revenue basis. The owner-operator pays all tractor operating expenses such as fuel, maintenance and physical damage insurance. Our owner-operators must meet specified guidelines for driving experience, safety, tank truck experience and physical examinations in accordance with DOT regulations.
Driver Recruitment and Retention
We believe our drivers, as the interface to our customers, play a critical role in helping us build and enhance our customer relationships. We dedicate significant resources to recruiting and retaining our drivers and owner-operators. Our drivers and owner-operators are hired in accordance with specific guidelines regarding safety records, driving experience and a personal evaluation by our staff. We employ only qualified tank truck drivers with a minimum of two years of highway tractor-trailer experience. These drivers are required to attend a rigorous training program conducted by us. We dedicate significant time and resources to ensure our drivers have the proper experience and training, are supported by qualified field and terminal staff, have access to well-maintained equipment, operate in a safe and secure environment and are satisfied with their jobs. Our driver training exceeds federal and state requirements.
Driver recruitment and retention is a primary focus for all operations personnel. Each terminal manager has direct responsibility for hiring drivers.
Unlike most trucking companies, our core fuels delivery business has an average one-way trip length of approximately 35 miles. This shorter length of haul minimizes our exposure to the difficulties of recruiting and retaining a high quality workforce, because we are able to offer our drivers scheduled shifts that allow them to return home each day and allow them regularly scheduled days off. Furthermore, the new hours-of-service regulations that may reduce the productivity of other trucking companies are not expected to have an impact on our operations, because our scheduled shifts and scheduled time off already comply with these new regulations.
66
Other Personnel
As of March 31, 2004, we employed 722 support personnel, including 114 employed at our corporate office in Canton, Ohio. Our field operations consist of 608 employees, including 134 mechanics and 474 other support, clerical and administrative personnel.
Where appropriate, the field management is responsible for hiring mechanics, customer service personnel and other support personnel. We provide our employees with health, dental, vision, life, and other insurance coverage subject to certain premium sharing and deductible provisions.
Customer Service, Quality Assurance and Billing
Our Quality Assurance Program is designed to enable the achievement of superior customer service through the development and implementation of standardized operating procedures for each area within our company. The procedures provide guidance in such areas as marketing, contracting, dispatch and terminal operations, driver hiring, safety and training, trailer operations, tractor operations, administrative functions, payroll, settlements, insurance, data processing and fuel tax administration.
We are currently in the process of centralizing the billing function for all customers at our Canton, Ohio headquarters in order to gain better quality control over the billing and invoicing processes.
Tractors and Trailers
As of March 31, 2004, we operated a fleet of 2,072 tractors and 2,638 tank trailers. We owned or leased 1,594 of the tractors and owned all of the tank trailers, with the remainder of the tractors owned by owner-operators. The majority of these tank trailers are multi-compartment, petroleum trailers. The balance of the fleet is made up of single compartment trailers, dry bulk trailers and specialty use equipment. The petroleum transport units typically have a capacity of 9,000 gallons and are designed to meet DOT specifications for transporting hazardous materials. A new tractor costs approximately $70,000 (net of trade-in), and has a typical useful life of seven to nine years. A new trailer costs approximately $60,000, and has a typical useful life of 15 to 25 years.
We provide preventative maintenance for our equipment. Our maintenance facilities are registered with the DOT and are qualified to perform trailer inspections and repairs for our fleet. We also rely on unaffiliated repair shops for many major repairs.
The following table shows the age of trailers and tractors we operated that were in service as of March 31, 2004. All numbers are approximated as of such date:
| | Owned | | | |||||||||||
|---|---|---|---|---|---|---|---|---|---|---|---|---|---|---|
| | Less than 3 years | 3-5 years | 6-10 years | 11-15 years | 15-20 years | Leased (1) | Total | |||||||
| Tractors(2) | 201 | 641 | 525 | 15 | — | 212 | 1,594 | |||||||
| Trailers(2) | 116 | 425 | 845 | 645 | 607 | — | 2,638 | |||||||
- (1)
- These tractors were leased new, and the lease terms ranged from one to four years.
- (2)
- Age based upon original date of manufacture; tractor/trailer may be substantially refurbished.
67
We conduct our marketing activities at both the national and local levels. We target national accounts to expand our business by leveraging our geographic scope. We employ geographically dispersed sales executives who market our services primarily to national accounts. These sales executives have extensive experience in marketing specialized fuels delivery services. One senior executive officer is assigned to each national account to oversee the relationship and provide support to the sales executive. The corporate sales staff also concentrates on developing dedicated logistics opportunities. Our senior management is actively involved in the marketing process, especially in marketing to national accounts. In addition, significant portions of our marketing activities are conducted locally by our regional managers, terminal managers and dispatchers who act as local customer service representatives. These managers and dispatchers maintain regular contact with customers and are well-positioned to identify the changing transportation needs of customers in their respective geographic areas. Each terminal manager develops an annual marketing plan in conjunction with the regional sales manager. Our drivers, through their daily interface with our customers, also play an important role in our marketing activities.
In addition to our direct contact with customers, we utilize customer letters, brochures and our website to market ourselves. We also actively participate in various trade associations, including the American Trucking Association, the National Tank Truck Carriers Association and the Society of Independent Gasoline Marketers Association.
Customers and Contracts
We provide services to substantially all the major oil companies and retail marketers of gasoline in the United States. Major customers include Amerada Hess, BP, ChevronTexaco, Circle K, Citgo, ExxonMobil, Marathon Ashland, Owens Corning, QuikTrip, Ryder, Shell Oil, 7-Eleven, Sunoco, Tower Energy and TravelCenters of America. Our customer relationships are long-standing and have grown over time as a result of consistently high service levels. The majority of our major customers, including each of our 10 largest customers in 2003, have been doing business with us for ten years or more. In 2003, our two largest customers accounted for 10.9% and 6.8%, respectively, of our total revenues during 2003 (9.5% and 7.3%, respectively, on a pro forma basis giving effect to the acquisitions of the fuels delivery operations of Beneto, Inc. and Carl Klemm, Inc. as if those acquisitions had occurred on January 1, 2003), and 9.3% and 7.0%, respectively, of our total revenues during the three months ended March 31, 2004, compared to 11.6% and 5.5%, respectively, of our total revenues in the first quarter of 2003. In 2002, our two largest customers accounted for approximately 15.8% and 6.3% of our revenues, respectively. Our ten largest customers accounted for approximately 48.1% and 56.3%, respectively, of our total revenues during 2002 and 2003 and 46.8% and 49.3%, respectively, of our total revenues during the three months ended March 31, 2003 and 2004. Our largest customer in each of these periods was Citgo, through which we also serviced 7-Eleven.
We service most of our customers under contracts. These contracts generally contain specified minimum volumes, based either on gallons transported, locations serviced, trucks used or revenues generated, with volume discounts. The contracts generally have initial terms of three to five years, with automatic annual renewals thereafter, subject to the right of either party to elect not to renew based on advance notice. The contracts generally can only be terminated by our customers for material breaches by us, although some of our contracts are terminable at will.
Administration
From the corporate offices in Canton, Ohio, management monitors each terminal's operating performance, safety and training record and customer service efforts. Terminal managers ensure the terminals remain in strict compliance with safety, maintenance, customer service and other operating
68
procedures. Senior corporate executives and safety department personnel conduct unannounced visits to verify terminal compliance. We strive to achieve uniform service and safety at all terminals, while simultaneously affording terminal managers the freedom to focus on generating business in their respective regions.
Competition
The fuels delivery business is extremely competitive and fragmented. We compete primarily with regional tank truck carriers and private carriers in various states. Competition is based primarily on rates and service. Management believes that we enjoy significant competitive advantages over other independent fuels delivery companies because of our overall fleet size, national geographic coverage and value-added logistics services.
Our largest competitors include Coastal Transport Co., Inc. and United Petroleum Transports, which serve the Southwest region of the United States, Florida Rock and Tank Lines, which serves the Southeast region of the United States, Dupre Transport, which services the Southwest and Southeast regions of the United States, Eagle Transport, which services the mid-Atlantic and Southeast regions of the United States and Penn Tank Lines, which services the Northeast, Midwest and Southeast regions of the United States; however, we are approximately six times larger (measured by revenue) than our next largest competitor, and are larger (measured by revenue) than all of the foregoing competitors combined.
We also compete with other motor carriers for the services of our drivers and owner-operators. Our overall size and our reputation for good relations with employees have enabled us to attract a sufficient number of qualified professional drivers and owner-operators.
Risk Management and Insurance/Safety
The primary insurable risks associated with our business are bodily injury and property damage, workers' compensation claims, medical claims and cargo loss and damage. We maintain insurance against these risks and are subject to liability as a self-insurer to the extent of the deductible under each policy. We currently maintain liability insurance for bodily injury and property damage in the amount of $40.0 million per incident, with a $1,000,000 per incident deductible. There is no aggregate limit on this coverage. We currently maintain a $1,000,000 per incident deductible for workers' compensation insurance coverage. We are insured over our deductible up to the statutory requirement by state. We are effectively self insured for damage or loss to the equipment and for cargo losses. We currently self-insure medical claims up to $150,000 per individual, but are insured for claims in excess of that amount.
We employ a safety and insurance staff of 38 professionals. In addition, we employ specialists to perform compliance checks and conduct safety tests throughout our operations. We conduct a number of safety programs designed to promote compliance with rules and regulations and to reduce accidents and cargo claims. These programs include training programs, driver recognition programs, safety awards, an ongoing substance abuse prevention program, driver safety meetings, distribution of safety bulletins to drivers and participation in national safety associations.
Environmental Matters
Our activities, which involve the transportation, storage and disposal of fuels and other hazardous substances and wastes, are subject to various federal, state and local health and safety laws and regulations relating to the protection of the environment, including, among others, those governing the transportation, management and disposal of hazardous materials, vehicle emissions, underground and above ground storage tanks and the cleanup of contaminated sites. Our operations involve risks of fuel spillage or seepage, hazardous waste disposal and other activities that are potentially damaging to the
69
environment. If we are involved in a spill or other accident involving hazardous substances, or if we are found to be in violation of or liable under applicable laws or regulations, it could significantly increase our cost of doing business.
Most of our truck terminals are located in industrial areas, where groundwater or other forms of environmental contamination may have occurred. Contaminants have been detected at some of our present or former sites in connection with historical operations. Under environmental laws, we could be held responsible for the costs relating to any contamination at those or other of our past or present facilities and at third-party waste disposal sites, including cleanup costs, fines and penalties and personal injury and property damages. Under some of these laws, such as the Comprehensive Environmental Response Compensation and Liability Act (also known as the Superfund law) and comparable state statutes, liability for the entire cost of the cleanup of contaminated sites can be imposed upon any current or former owner or operator, or upon any party who sent waste to the site, regardless of the lawfulness of any disposal activities or whether a party owned or operated a contaminated property at the time of the release of hazardous substances. From time to time, we have incurred remedial costs and regulatory penalties with respect to chemical or wastewater spills and releases at our facilities, as well as spills resulting from accidents, and, notwithstanding the existence of our environmental management program, we cannot assure you that such obligations will not be incurred in the future. We are currently involved in remediation activities at several of our terminals. The discovery of additional contamination or the imposition of additional obligations or liabilities in the future could result in a material adverse effect on our financial condition, results of operations or our business reputation. See "Risk Factors—Risks Related to Our Business—Operations involving hazardous materials could create environmental liabilities" for a discussion of certain risks of our being associated with transporting hazardous substances.
Environmental laws and regulations are complex, change frequently and have tended to become more stringent over time. If we fail to comply with applicable environmental laws and regulations, we could also be subject to substantial fines or penalties and to civil and criminal liability. As a result, our costs of complying with current or future environmental laws or liabilities arising from such laws may have a material adverse affect on our business, results of operations or financial condition.
Facility managers are responsible for environmental compliance. Self-audits conducted by our safety staff are required to assess operations, safety training and procedures, equipment and grounds maintenance, emergency response capabilities and waste management. We may also contract with an independent environmental consulting firm that conducts periodic, unscheduled, compliance assessments which focus on conditions with the potential to result in releases of hazardous substances or petroleum, and which also include screening for evidence of past spills or releases. Our safety staff develops policies and procedures, including periodic audits of our terminals and historical operations, in an effort to avoid circumstances that could lead to future environmental exposure.
Regulation
As a motor carrier, we are subject to federal and state regulation. There are additional regulations specifically relating to the tank truck industry, including testing and specifications of equipment and product handling requirements. The trucking industry is subject to possible regulatory and legislative changes that may affect the economics of the industry by requiring changes in operating practices or by changing the demand for common or contract carrier services or the cost of providing services. Some of these possible changes may include increasingly stringent environmental regulations, changes in the hours-of-service regulations which govern the amount of time a driver may drive in any specific period of time, on-board black box recording devices or limits on vehicle weight and size.
The Federal Motor Carrier Act of 1980 served to increase competition among motor carriers and limit the level of regulation in the industry. The Federal Motor Carrier Act also enabled applicants to
70
obtain Interstate Commerce Commission, or ICC, operating authority more readily and allowed interstate motor carriers such as ourselves greater freedom to change their rates each year without ICC approval. The law also removed many route and commodity restrictions on the transportation of freight. A series of federal acts, including the Negotiated Rates Act of 1993, the Trucking Industry Regulatory Reform Act of 1994 and the ICC Termination Act of 1995, further reduced regulation applicable to interstate operations of motor carriers such as ourselves, and resulted in transfer of interstate motor carrier registration responsibility to the Federal Highway Administration of the DOT. On February 13, 1998, the Federal Highway Administration published proposed new rules governing registration to operate by interstate motor carriers. At this point in time adopted changes have not adversely affected interstate motor carrier operations. During 1999, the Federal Motor Carrier Safety Improvement Act of 1999 took effect establishing the Federal Motor Carrier Safety Administration effective January 1, 2000. This agency's principal assignment is to regulate and maintain safety within the ranks of motor carriers.
Interstate motor carrier operations are subject to safety requirements prescribed by the DOT. To a large degree, intrastate motor carrier operations are subject to safety and hazardous material transportation regulations that mirror federal regulations. Such matters as weight and dimension of equipment are also subject to federal and state regulations. DOT regulations mandate drug testing of drivers. To date, the DOT's national commercial driver's license and drug testing requirements have not adversely affected the availability of qualified drivers to us. Alcohol testing rules were adopted by the DOT in February 1994 and became effective in January 1995 for employers with 50 or more drivers. These rules require certain tests for alcohol levels in drivers and other safety personnel. These rules have not adversely affected the availability of qualified drivers.
Title VI of The Federal Aviation Administration Authorization Act of 1994, which became effective on January 1, 1995, largely deregulated intrastate transportation by motor carriers. This Act generally prohibits individual states, political subdivisions thereof and combinations of states from regulating price, entry, routes or service levels of most motor carriers. However, the states retained the right to continue to require certification of carriers, based upon two primary fitness criteria—safety and insurance—and retained certain other limited regulatory rights. Prior to January 1, 1995, we held intra-state authority in several states. Since that date, we have either been "grandfathered in" or have obtained the necessary certification to continue to operate in those states. In states in which we were not previously authorized to operate intrastate, we have obtained certificates or permits allowing us to operate.
From time to time, various legislative proposals are introduced, including proposals to increase federal, state or local taxes, including taxes on motor fuels. We cannot predict whether, or in what form, any increase in such taxes applicable to us will be enacted.
Legal Proceedings
On January 13, 2004, one of our tanker trucks ran off an overpass onto a major highway outside Baltimore, Maryland, triggering an explosion and crash involving several other vehicles. The accident resulted in four fatalities. The National Transportation Safety Board is currently investigating the accident. We anticipate that claims will be made against us as a result of the accident. We are self-insured for the first $500,000 of this claim, and our insurance will cover up to $30.0 million of this claim in excess of our self-insured retention. We cannot predict the extent of claims not covered by our insurance policies and cannot assure you that this claim will not have a material adverse effect on our operating results.
In 2002, one of our tanker trucks was involved in an accident in which a driver of another vehicle died. The plaintiff filed an action in December 2003 after mandatory mediation failed. Our insurance carrier is defending this action. We are self-insured for the first $250,000 of such claim, and our
71
insurance will cover the remainder of the claim in excess of our self-insured retention. In July 2004, the plaintiff filed a motion for leave to amend its complaint to add a claim for punitive damages. Punitive damages are not covered by our insurance policies, and any successful claim for punitive damages could have a material adverse effect on our financial condition, results of operations and cash flows.
In April 2004, one of our former drivers and his spouse commenced an action against us, several major oil companies and others seeking unspecified damages (including punitive damages against the major oil companies) for injuries allegedly suffered for exposure to benzene containing products. Our insurance carrier is defending this action.
We are subject to routine litigation arising in the ordinary course of business, none of which is expected to have a material adverse effect on our consolidated financial position, results of operations or cash flows.
72
Properties
As of June 30, 2004, our terminals and/or offices were located in the following cities:
| State | City | Owned/ Leased | ||
|---|---|---|---|---|
| Alabama | Birmingham | Leased | ||
| Alabama | Theodore | Leased | ||
| Arizona | Phoenix | Leased | ||
| Arizona | Tucson | Leased | ||
| California | Bakersfield | Leased | ||
| California | French Camp | Leased | ||
| California | Fresno | Leased | ||
| California | Gilroy | Leased | ||
| California | Long Beach | Leased | ||
| California | Martinez | Leased | ||
| California | Rialto | Leased | ||
| California | San Diego | Leased | ||
| California | San Jose | Leased | ||
| California | South San Francisco | Leased | ||
| California | Van Nuys | Leased | ||
| California | Vernon | Leased | ||
| California | West Sacramento | Leased | ||
| Florida | Cape Canaveral | Leased | ||
| Florida | Fort Lauderdale | Owned | ||
| Florida | Jacksonville | Owned | ||
| Florida | Orlando | Owned | ||
| Florida | Tampa | Owned | ||
| Georgia | Doraville | Owned | ||
| Georgia | Macon | Owned | ||
| Georgia | Savannah | Owned | ||
| Illinois | Decatur | Leased | ||
| Illinois | Huntley | Leased | ||
| Illinois | Newton | Leased | ||
| Illinois | Rockford | Leased | ||
| Illinois | Tremont | Leased | ||
| Illinois | Wood River | Leased | ||
| Indiana | Clermont | Leased | ||
| Kentucky | Ashland | Leased | ||
| Kentucky | Louisville | Leased | ||
| Kentucky | Paducah | Leased | ||
| Maryland | Baltimore | Leased | ||
| Michigan | Taylor | Leased | ||
| Mississippi | Collins | Leased | ||
| Nevada | North Las Vegas | Leased | ||
| Nevada | Sparks | Leased | ||
| North Carolina | Apex | �� | Owned | |
| North Carolina | Chapel Hill | Leased | ||
| North Carolina | Charlotte | Owned | ||
| North Carolina | Greensboro | Owned | ||
| North Carolina | Selma | Owned | ||
| North Carolina | Wilmington | Owned | ||
| Ohio | Canton | Leased | ||
| Ohio | Columbus | Leased | ||
| Ohio | Leetonia | Leased | ||
| Ohio | Monroe | Leased | ||
| Ohio | North Canton | Leased | ||
| Ohio | Norwich | Leased | ||
| Ohio | Toledo | Leased | ||
| Pennsylvania | Parker | Leased | ||
| Pennsylvania | Seneca | Leased | ||
| Pennsylvania | Warren | Leased | ||
| South Carolina | Charleston | Owned | ||
| South Carolina | Cheraw | Owned | ||
| South Carolina | Lexington | Owned | ||
| South Carolina | North Augusta | Owned | ||
| South Carolina | Spartanburg | Owned | ||
| Tennessee | Chattanooga | Leased | ||
| Tennessee | Knoxville | Leased | ||
| Tennessee | Memphis | Leased | ||
| Tennessee | Memphis | Leased | ||
| Tennessee | Nashville | Leased | ||
| Texas | Carrollton | Leased | ||
| Virginia | Chesapeake | Owned | ||
| Virginia | Fairfax | Leased | ||
| Virginia | Richmond | Owned | ||
| Virginia | Richmond | Leased | ||
| Virginia | Roanoke | Owned | ||
| Wisconsin | Green Bay | Leased | ||
| Wisconsin | McFarland | Leased | ||
| Wisconsin | Milwaukee | Leased | ||
| Wisconsin | Portage | Leased | ||
| Wisconsin | West Allis | Leased |
We also have satellite operations in the following states: California, Colorado, Connecticut, Florida, Georgia, Illinois, Indiana, Kentucky, Louisiana, Maryland, Massachusetts, Michigan, Missouri, Nevada, New Hampshire, New Jersey, New York, Ohio, Oregon, Pennsylvania, Texas, Utah, Virginia, Washington and Wyoming.
73
The following table sets forth certain information with respect to the members of our board of directors and our executive officers and key employees:
| Name | Age | Position | ||
|---|---|---|---|---|
| Dennis A. Nash | 50 | President, Chief Executive Officer and Director | ||
| Carl Young | 53 | Chief Financial Officer and Director | ||
| Lee Shaffer | 65 | Chairman of the Board, President of Kenan Transport | ||
| Douglas Allen | 52 | Chief Operating Officer | ||
| Rex Molder | 62 | Executive Vice President | ||
| Bruce Blaise | 42 | Vice President, Sales and Marketing | ||
| James Cundey | 55 | Vice President, Logistics Projects | ||
| William Downey | 57 | Vice President, Security | ||
| Gerald Hoover | 50 | Vice President, Finance | ||
| Richard J. Molder | 37 | Vice President, Fleet Services | ||
| Becky Perlaky | 45 | Vice President, Safety and Compliance | ||
| Kevin Spencer | 45 | Vice President, Logistics Resource Group | ||
| James Appleton | 38 | Chief Financial Officer, Klemm Tank Lines | ||
| Greg Klimek | 43 | President, Klemm Tank Lines | ||
| Jerry McDaniel | 39 | President, McDaniel Transportation | ||
| James H. Reid | 56 | President, Petro Chemical Transport | ||
| Ron Ritchie | 44 | Vice President, Logistics and Marketing, Petro Chemical Transport | ||
| Dennis Waller | 49 | Executive Vice President, Kenan Transport Company | ||
| Dennis Kupchik | 56 | Director | ||
| M. William Macey, Jr. | 50 | Director | ||
| Douglas L. Newhouse | 50 | Director | ||
| James A. Parsons | 48 | Director |
Our directors hold office until the earlier of their death, resignation, removal or disqualification or until their successors have been elected and qualified. Officers serve at the discretion of the board of directors. There are no family relationships among any of our directors or executive officers.
Dennis A. Nash has served as president and chief executive officer and a director of KAG and its predecessors since 1991. Before founding Advantage Tank Lines in 1991, he held various operational positions, the last being vice president of sales and marketing, at Leaseway Transportation from 1976 to 1991.
Carl Young has served as chief financial officer and a director of KAG and its predecessors since 1991. Before founding Advantage Tank Lines in 1991, he held the position of owner and president at North Canton Transfer, a predecessor company, from 1982. Prior thereto, Mr. Young was a certified public accountant.
Lee Shaffer has served as chairman of the board of directors since the acquisition of Kenan Transport in April 2001. He has served as the president of Kenan Transport since 1975, and was chief executive officer of Kenan Transport from July 1996 to April 2001 and chief operating officer from 1975 to July 1996.
Douglas Allen joined us as chief operating officer in March 2004. Mr. Allen was president of Allen Consulting from October 2002 through February 2004. Mr. Allen served as senior vice president-operations and chief operating officer of Quality Distribution, Inc. from December 2000 until September 2002 and as vice president—operations of Yellow Freight Systems from 1977 to December 2000.
74
Rex Molder has served as executive vice president of KAG and its predecessors since 1993. Prior to joining Advantage Tank Lines in 1993, he served in various capacities, most recently as executive vice president, at Leaseway Transportation from 1983 to 1993. Mr. Molder is the uncle of Richard J. Molder.
Bruce Blaise has served as vice president, sales and marketing since 2001. Prior to joining us, Mr. Blaise served in various capacities at Miller Transporters from August 1985 to January 2001, most recently as vice president of sales and marketing.
James Cundey joined KAG as vice president, logistics projects in April 2003. Prior thereto he was employed in various capacities at BP for 31 years, most recently as U.S. National Transportation Manager.
William Downey has served as vice president, security since joining KAG in May 2002. From 1999 until May 2002, he was executive director of safety and security for the eighth largest school district in Ohio. In 1999, he retired from the Federal Bureau of Investigation after approximately 30 years of service, including as a supervisory senior resident agent.
Gerald Hoover has served as vice president, finance of KAG since 2001. From 1990 to 2001 he served as general manager of Cleveland Energy Resources, a public utilities company. Mr. Hoover is a certified public accountant.
Richard J. Molder has served as vice president, fleet services of KAG since 2003, and in various operational capacities with KAG and its predecessors from 1993 to 2003. Prior to joining Advantage Tank Lines in 1993, he served in various capacities, most recently as operations manager, at Leaseway Transportation from 1984 to 1993. Mr. Molder is the nephew of Rex Molder, our executive vice president.
Becky Perlaky has served as vice president, safety and compliance of KAG and its predecessors since January 1994. Prior to joining us, she was employed by Leaseway Transportation from 1978 to 1994 as claims and safety manager.
Kevin Spencer has served as vice president, Logistics Resource Group since 2003, after serving as vice president, business development from 1998 to 2003. Between 1992 and 1998 he held various operational positions with KAG. Prior to joining us, he was employed by Leaseway Transportation from 1975 to 1992, most recently as manager of central dispatch.
James Appleton has served as chief financial officer of Klemm Tank Lines and its predecessor since June 1997. He joined Klemm in March 1993 as controller. Prior to joining Klemm, he worked as a certified public accountant from December 1988 through February 1993.
Greg Klimek has served as president of Klemm Tank Lines since 1999. He was vice president from 1992 until 1999. We acquired this business in June 2003.
Jerry McDaniel has served as president of McDaniel Transportation since 1985. We acquired McDaniel Transportation in April 2001.
James H. Reid has served as the president of Petro Chemical Transport since 1998, when it was acquired by Kenan Transport. He was president of CITGO Pipeline & Products, Tulsa, Oklahoma, from 1993 to 1998.
Ron Ritchie has served as vice president of logistics and marketing for Petro Chemical Transport since 1998. Prior to joining us, he was employed by Citgo Transportation from 1981 to 1998, most recently as vice president of logistics and marketing for PCT.
75
Dennis Waller has served as executive vice president of Kenan Transport Company since November 2003. Mr. Waller has been employed at Kenan Transport in various capacities since 1979, including regional operations manager.
Dennis Kupchik has been a director of KAG and its predecessors since December 1999. He has served as the president of Kupchik and Company, a transportation consulting company, since January 1993 with projects involving truckload, dry bulk and chemical motor carriers. Mr. Kupchik was also a member of the Board of Managers of the American Passenger Rail Co. from 1995 to 1999.
M. William Macey, Jr. has been a director of KAG and its predecessors since December 1998 and is a co-founder and managing partner of Sterling Investment Partners, L.P., a private equity fund investing in middle-market companies. Prior to co-founding Sterling Investment Partners in December 1999, Mr. Macey was a partner and co-founder of Sterling Ventures Limited, or SVL, a company formed in 1991 to sponsor private equity investments. Prior to co-founding SVL, Mr. Macey was a managing director of Asian Oceanic Group, an international merchant bank headquartered in Hong Kong, from 1990 to 1991. Previously, Mr. Macey was a managing director in the mergers and acquisitions group of Smith Barney, Harris Upham & Co.
Douglas L. Newhouse has been a director of KAG and its predecessors since December 1998 and is co-founder and managing partner of Sterling Investment Partners. Prior to co-founding Sterling Investment Partners in December 1999, Mr. Newhouse was a partner and co-founder of SVL. Prior to co-founding SVL in 1991, Mr. Newhouse was president of Middex Capital Corp., which specialized in the acquisition of middle market companies, from 1990 to 1991. Prior to his employment with Middex, Mr. Newhouse was a senior vice president in the corporate finance department of Lehman Brothers.
James A. Parsons has been a director of KAG and its predecessors since December 1998 and since 1986 has been a managing director of RFE Investment Partners, a private equity investment firm focusing on the acquisition of smaller, middle-market companies primarily in the specialized business services, healthcare services and niche manufacturing sectors. Prior to joining RFE, Mr. Parsons was vice president of Michigan Capital & Service, Inc., the private equity subsidiary of NBD Bancorp, Inc.
Board of Directors and Committees of the Board
Within 90 days following this offering, we will appoint at least one additional director who will satisfy the independence requirements of The Nasdaq National Market, and within one year following this offering, we will appoint one or more additional directors who will satisfy these independence requirements. Following the appointment of these directors and the resignation of one or more of our existing directors who are not considered independent under Nasdaq rules, at least a majority of our directors will satisfy the independence requirements of The Nasdaq National Market.
Our board currently has an audit committee and a compensation committee. Messrs. Kupchik and Newhouse serve as members of the audit committee and Messrs. Newhouse and Parsons serve as members of the compensation committee. After this offering and the appointment of the additional directors, our board will designate new committees to assist it with its responsibilities. Those committees are described below.
Audit Committee
Following the appointment of at least two new directors after this offering, our board will designate a new audit committee that will consist of at least three directors, one of whom is expected to be Mr. Kupchik, who served on our pre-offering audit committee. Two of the directors to be appointed following completion of this offering are also expected to be members of our new audit committee. Each member of the audit committee will be financially literate at the time such member is appointed. The composition of the audit committee will satisfy the independence requirements of The
76
Nasdaq National Market and the SEC. No audit committee member will receive from us any compensation other than that paid with respect to such member's service as a director, including service on committees.
The audit committee will have at least four regular meetings each year. The results of each meeting will be reported at the next regular meeting of our board. The audit committee will have responsibility for overseeing:
- •
- our accounting and financial reporting processes;
- •
- the reliability of our financial statements;
- •
- the effective evaluation and management of our financial risks;
- •
- our compliance with laws and regulations; and
- •
- the maintenance of an effective and efficient audit of our financial statements by a qualified and independent auditor.
To fulfill these responsibilities, the audit committee will:
- •
- be aware of the current areas of greatest financial risk to us and ensure that management is effectively assessing and managing risks;
- •
- ensure that we establish and maintain effective disclosure controls and procedures to promote timely, accurate, compliant and meaningful disclosure in our periodic reports filed with the SEC;
- •
- periodically review with the independent auditors their assessment as to the adequacy of our structure of internal controls over financial accounting and reporting, and their qualitative judgments as to the accounting principles employed and related disclosures by us and the conclusions expressed in our financial reports;
- •
- review our accounting policies and practices to ensure they meet the requirements with respect to the FASB, the SEC and the American Institute of Certified Public Accountants;
- •
- select, evaluate and, if necessary, replace our independent auditors;
- •
- actively engage in dialogue with the independent auditors with respect to any disclosed relationships or services that may impact the objectivity or independence of the independent auditors;
- •
- meet with the independent auditors and the senior management to review the scope and methodology of the proposed audit;
- •
- establish procedures to ensure rapid and current disclosures of material changes in condition or operations;
- •
- discuss with management policies and practices regarding earnings press releases, as well as financial information and earnings guidelines provided to analysts and rating agencies; and
- •
- establish procedures for the receipt, retention and treatment of complaints we receive regarding our internal accounting controls or auditing matters and confidential, anonymous submission by employees of their concerns regarding our internal accounting controls and auditing matters.
Nominating and Governance Committee
After this offering, our board will designate a nominating and governance committee that will consist of at least three directors. The composition of the nominating and governance committee will
77
satisfy the independence requirements of The Nasdaq National Market. The nominating and governance committee will:
- •
- identify individuals qualified to serve as our directors;
- •
- nominate qualified individuals for election to our board of directors at annual meetings of stockholders;
- •
- recommend to our board the directors to serve on each of our board committees; and
- •
- recommend to our board a set of corporate governance guidelines.
To fulfill these responsibilities, the nominating and governance committee will:
- •
- review periodically the composition of our board;
- •
- identify and recommend director candidates for our board;
- •
- recommend to our board nominees for election as directors;
- •
- recommend to our board the composition of the committees of the board;
- •
- review periodically our corporate governance guidelines and recommend governance issues that should be considered by our board;
- •
- review periodically our code of conduct and obtain confirmation from management that the policies included in the code of conduct are understood and implemented;
- •
- review related party transactions;
- •
- consider with management public policy issues that may affect us;
- •
- review periodically our committee structure and operations and the working relationship between each committee and the board; and
- •
- consider, discuss and recommend ways to improve our board's effectiveness.
Compensation Committee
After this offering, our board will designate a new compensation committee that will consist of at least three directors. The composition of the compensation committee will satisfy the independence requirements of The Nasdaq National Market. The nominating and governance committee will recommend to our board nominees for the compensation committee. The primary responsibility of the compensation committee will be to develop and oversee the implementation of our philosophy with respect to the compensation of our officers. In that regard, the compensation committee will:
- •
- develop and maintain a compensation policy and strategy that creates a direct relationship between pay levels and corporate performance;
- •
- recommend compensation and benefit plans to our board for approval;
- •
- review and approve annually corporate and personal goals and objectives to serve as the basis for the chief executive officer's compensation, evaluate the chief executive officer's performance in light of the goals and, based on such evaluation, determine the chief executive officer's compensation;
- •
- determine the annual total compensation for our named executive officers;
- •
- with respect to our equity-based compensation plans, approve the grant of stock options and other equity-based incentives as permitted under our compensation plans;
- •
- review and recommend to our board compensation for non-employee directors; and
78
- •
- review and recommend to our board employment agreements, severance arrangements and change of control plans that provide for benefits upon a change in control, or other provisions for our executive officers and directors.
Executive Compensation
The following table sets forth all compensation paid by us to our chief executive officer and our three other executive officers during 2003. We refer to these executives as the "named executive officers" elsewhere in this prospectus.
Summary Compensation Table
| | | | Long-Term Compensation | | ||||
|---|---|---|---|---|---|---|---|---|
| Name and Principal Position | Annual Salary | Bonus | Securities Underlying Options | All Other Compensation | ||||
| Dennis A. Nash President and Chief Executive Officer | ||||||||
Carl Young Chief Financial Officer | ||||||||
Lee Shaffer President of Kenan Transport | ||||||||
Rex Molder Executive Vice President |
The following table shows information about the grants of options to purchase our common stock to our named executive officers in 2003.
Option Grants Table
| | Individual Grants | | | |||||||||
|---|---|---|---|---|---|---|---|---|---|---|---|---|
| | | % of Total Options Granted to Employees In Fiscal Year | | | Potential Realizable Value at Assumed Annual Rates of Stock Price Appreciation for Option Term(1) | |||||||
| | Number of Securities Underlying Options Granted | | | |||||||||
| | Exercise or Base Price ($/sh.) | | ||||||||||
| Name | Expiration Date | |||||||||||
| 5%($) | 10%($) | |||||||||||
| Dennis A. Nash | ||||||||||||
| Carl Young | ||||||||||||
| Lee Shaffer | ||||||||||||
| Rex Molder | ||||||||||||
- (1)
- Potential realizable values for stock options are computed by (a) multiplying the number of shares of common stock subject to a given option by the assumed initial public offering price, which is the midpoint of the range set forth on the cover page of this prospectus, since our common stock was not traded in an established market prior to this offering; (b) assuming that the aggregate stock value derived from that calculation compounds at an annual 5% or 10% rate shown in the table for the entire ten-year term of the option; and (c) subtracting from that result the aggregate option exercise price. The 5% or 10% assumed annual rates of the stock price appreciation are mandated by the rules of the Securities and Exchange Commission and do not represent our estimate or projection of future common stock prices.
79
The following table shows information about the value of our named executive officers' unexercised options as of December 31, 2003. None of our named executive officers exercised options in 2003.
Aggregated Option Exercises in Last Fiscal Year and Fiscal Year-End Option Values
| | Number of Securities Underlying Unexercised Options at Fiscal Year End | Value of Unexercised in the Money Options at Fiscal Year End(1) | |||||||
|---|---|---|---|---|---|---|---|---|---|
| Name | |||||||||
| Exercisable | Unexercisable | Exercisable | Unexercisable | ||||||
| Dennis A. Nash | (2 | ) | (2 | ) | |||||
| Carl Young | (2 | ) | (2 | ) | |||||
| Lee Shaffer | |||||||||
| Rex Molder | |||||||||
- (1)
- The dollar values have been calculated by determining the difference between the fair market value of the securities underlying the options at December 31, 2003 and the exercise prices of the options. Solely for purposes of determining the value of the options at December 31, 2003, we have assumed that the fair market value of the common stock issuable upon exercise of options was $ , the assumed initial public offering price, which is the midpoint of the range set forth on the cover page of this prospectus, since our common stock was not traded on an established market prior to this offering.
- (2)
- Consists of options to purchase shares of common stock at a price per share of $ . These options will only become exercisable if our stock price is equal to or greater than $ (assuming an initial public offering price of $ , the midpoint of the range set forth on the cover page of this prospectus) on the six month anniversary of the closing of this offering or if prior to that date we are sold for a price per share that would result in certain of our current stockholders achieving an internal rate of return of 30% or more.
Employment Agreements
On April 30, 2001, Advantage Management Group, Inc. entered into employment agreements with Dennis A. Nash as chief executive officer and Carl Young as chief financial officer, and Kenan Transport entered into an employment agreement with Lee Shaffer as chairman of the board. Under their respective employment agreements, Messrs. Nash, Young and Shaffer were each entitled to receive initial annual salaries of $ , subject in each case to increases each year at the discretion of the board of directors. Messrs. Nash, Young and Shaffer's salary for 2004 is $ . Messrs. Nash, Young and Shaffer are also entitled to receive bonuses from time to time in such amounts as the board of directors may determine. In addition, Mr. Shaffer received a lump sum payment of $88,630, less applicable withholding taxes, following the closing of our acquisition of Kenan Transport.
The employment agreements of each of Messrs. Nash, Young and Shaffer provide for an initial term that expired on December 31, 2003. Each of the employment agreements referred to above automatically renewed for a one-year term 90 days before the expiration of the initial term and will renew for successive one-year terms unless either party to such employment agreement furnishes the other 90 days' prior written notice of its intent not to renew the agreement.
In addition, each of the employment agreements referred to above provides for severance payments to be made if the employment of any of Messrs. Nash, Young or Shaffer is terminated by us
80
without "justifiable cause." "Justifiable cause" refers to the occurrence of one or more of the following specified events:
- •
- the executive's willful failure or refusal to perform his duties under, or breach of, his employment agreement where such conduct or breach shall not have ceased or been remedied within thirty (30) days following written warning from us;
- •
- the executive's conviction (which, through lapse of time or otherwise, is not subject to appeal) of, pleading guilty to or confession of any crime or offense involving money or other property of ours or which constitutes a felony in the jurisdiction involved;
- •
- the executive's performance of any act or his failure to act, for which if the executive were prosecuted and convicted, a crime or offense involving money or property of ours, or which would constitute a felony in the jurisdiction involved, would have occurred;
- •
- any unauthorized disclosure by the executive to any person, firm or corporation other than us and our directors, officers and employees, of any confidential information or trade secret of ours, which disclosure is either willful or grossly negligent;
- •
- any attempt by the executive to secure any personal profit in connection with our business;
- •
- the executive's engagement in a fraudulent act to our material damage;
- •
- the executive's engagement in conduct or activities materially damaging to our property, business or reputation;
- •
- the executive's illegal use of controlled substances;
- •
- any act or omission by the executive involving malfeasance or negligence in the performance of the executive's duties to our material detriment, as determined in good faith by the board of directors, which has not been corrected or stopped by the executive within thirty (30) days after written notice from us; or
- •
- the entry of an order of a court that remains in effect and is not discharged for a period of at least sixty (60) days, which enjoins or otherwise limits or restricts the performance by the executive under his employment agreement, relating to any contract, agreement or commitment made by or applicable to the executive in favor of any former employer or any other person.
If the employment of any of Messrs. Nash, Young or Shaffer is terminated with "justifiable cause," he will be entitled to receive only his salary and benefits accrued through the date of termination. In the event we terminate the employment of any of Messrs. Nash, Young or Shaffer without "justifiable cause," he will be entitled to:
- •
- receive monthly payments equal to one-twelfth of his then annual salary for the remainder of the term of his employment agreement; and
- •
- continue to participate, at our expense, in our health insurance and disability insurance programs, to the extent permitted under those programs, until the earlier of the date on which he begins employment with a new employer that provides substantially similar benefits or the end of the term of his employment agreement.
Each of the employment agreements referred to above includes a noncompetition and nonsolicitation provision applicable:
- •
- for a period of one year from the date of termination if the executive is terminated for justifiable cause;
- •
- for a period of three years following the executive's voluntary termination of his employment; or
81
- •
- for the remainder of the term of the agreement, if we terminate the executive's employment other than for justifiable cause or disability, unless we fail to pay severance or expense amounts to the executive as required by the agreement, in which case the noncompetition and nonsolicitation provisions will no longer apply.
2001 Equity Compensation Plan
Under The Kenan Advantage Group, Inc. 2001 Equity Compensation Plan, we may grant options to purchase shares of our common stock and restricted shares of our common stock to our employees, consultants and advisors who perform services for us and non-employee members of the board. We have reserved shares of common stock for issuance under the plan. Options to purchase an aggregate of shares of common stock are outstanding under the plan.
The compensation committee of our board of directors administers the plan. The compensation committee selects the participants who will receive awards and determines the terms and conditions of such awards.
Options, stock purchase rights and restricted stock granted under this plan are generally not transferable by the participants, and each option and right is exercisable, during the lifetime of the participant, only by such participant. Options granted under the plan must generally be exercised within three months of the optionee's termination of employment, or within one year after such employee's termination by death or disability, but in no event later than the expiration of the option term.
In the event of certain corporate transactions, such as a merger or sale of substantially all our assets, the plan provides that each outstanding option or right will be assumed or an equivalent option or right will be substituted for it by the successor corporation or its parent or subsidiary. If, however, the successor corporation refuses to assume or substitute for the options or rights, the grantee will fully vest in and have the right to exercise the option or right, including shares that would not otherwise become vested or exercisable.
Compensation Committee Interlocks and Insider Participation
The current members of the compensation committee are Messrs. Douglas Newhouse and James Parsons. No member of the compensation committee was, during 2003, an officer or employee of KAG; however, Mr. Newhouse is a managing member of Sterling Investment Partners Advisors LLC and a principal stockholder of Sterling Ventures Limited, both of which receive management fees from us, and Mr. Parsons is president of RFE Management, which receives management fees from us. See "Certain Relationships and Related Transactions." None of our executive officers serves as a member of the compensation committee or board of directors of any other entity that has an executive officer serving as a member of our board of directors or compensation committee.
82
PRINCIPAL AND SELLING STOCKHOLDERS
The following table sets forth certain information regarding the beneficial ownership of our common stock as of , 2004, and as adjusted to reflect the sale of shares offered hereby, by:
- •
- each person known by us to be a beneficial owner of more than 5.0% of our outstanding common stock;
- •
- each of our directors;
- •
- each of our named executive officers;
- •
- all directors and executive officers as a group; and
- •
- each selling stockholder.
The amounts and percentage of common stock beneficially owned are reported on the basis of regulations of the SEC governing the determination of beneficial ownership of securities. Under the rules of the SEC, a person is deemed to be a "beneficial owner" of a security if that person has or shares "voting power," which includes the power to vote or to direct the voting of such security, or "investment power," which includes the power to dispose of or to direct the disposition of such security. A person is also deemed to be a beneficial owner of any securities of which that person has a right to acquire beneficial ownership within 60 days. Under these rules, more than one person may be deemed a beneficial owner of the same securities and a person may be deemed a beneficial owner of securities as to which he has no economic interest. The number of shares of common stock outstanding used in calculating the percentage for each listed person includes the shares of common stock underlying options or warrants held by such person that are, or within 60 days after the date of this prospectus will become, exercisable, but excludes shares of common stock underlying options or warrants held by any other person.
Except as indicated by footnote, the persons named in the table below have sole voting and investment power with respect to all shares of common stock shown as beneficially owned by them, subject to community property laws where applicable.
Percentage of beneficial ownership after the transaction is based on shares of common stock outstanding after giving effect to the shares of our common stock to be issued upon conversion of the outstanding shares of our preferred stock, assuming an initial public offering price of $ , the midpoint of the range set forth on the cover page of this prospectus, and shares of common stock outstanding after completion of this offering. The table assumes that the underwriters' over-allotment option is not exercised and excludes any shares purchased in this offering by the respective beneficial owners.
| Name of Beneficial Owner | Shares of Common Stock Before Offering | Percentage of Class Before Offering | Number of Shares Being Sold(1) | Shares of Common Stock After Offering | Percentage of Class After Offering | |||||
|---|---|---|---|---|---|---|---|---|---|---|
| Five Percent Stockholders, Directors and Persons Named in Summary Compensation Table | ||||||||||
| Azalea Mall, LLC(2) | ||||||||||
| Massachusetts Mutual Life Insurance Company(3) | ||||||||||
| RFE Investment Partners VI, L.P.(4) | ||||||||||
| RSTW Partners III L.P.(5) | ||||||||||
| Sterling Investment Partners, L.P.(6) | ||||||||||
| Dennis Kupchik |
83
| M. William Macey, Jr.(7) | ||||||||||
| Rex Molder(8) | ||||||||||
| Dennis A. Nash(9) | ||||||||||
| Douglas L. Newhouse(10) | ||||||||||
| James A. Parsons(11) | ||||||||||
| Lee Shaffer(12) | ||||||||||
| Carl Young(9) | ||||||||||
| All executive officers and directors as a group (9 persons)(13) | ||||||||||
| Other Selling Stockholders |
- (1)
- The selling stockholders have granted to the underwriters an option, exercisable within 30 days from the date of this prospectus, to purchase up to an additional shares of common stock. The shares listed in this column will only be sold if the underwriters exercise the over-allotment option.
- (2)
- The business address of Azalea Mall, LLC is c/o Aetna Life Insurance Company, 151 Farmington Avenue, Hartford, Connecticut 06156.
- (3)
- Includes shares held by MassMutual Corporate Investors ("MMCI") and shares held by MassMutual Participation Investors ("MMPI"), each a Massachusetts business trust affiliated with Massachusetts Mutual Life Insurance Company ("MMLIC"), and shares, shares and shares issuable upon the exercise of warrants owned by MMLIC, MMCI and MMPI, respectively. Does not include shares, shares and shares issuable upon the exercise of warrants owned by MMLIC, MMCI and MMPI, respectively, that will only become exercisable if the Contingent Options described in note 9 below become exercisable. The business address for each of MMLIC, MMCI and MMPI is 1295 State Street, Springfield, Massachusetts 01111.
- (4)
- Includes shares held by RFE VI SBIC, L.P., an affiliate of RFE Investment Partners VI, L.P. The business address of each of RFE Investment Partners VI, L.P. and RFE VI SBIC, L.P. is 36 Grove Street, New Canaan, Connecticut 06840.
- (5)
- Includes shares issuable upon the exercise of warrants owned by RSTW Partners III, L.P. Does not include shares issuable upon the exercise of warrants owned by RSTW Partners III, L.P. that will only become exercisable if the Contingent Options described in note 9 below become exercisable. The business address of RSTW Partners III, L.P. is c/o Rice Sangalis Toole & Wilson, 5847 San Felipe, Suite 4350, Houston, Texas 77057.
- (6)
- Does not include shares owned by Messrs. Macey and Newhouse, who are members of the general partner of Sterling Investment Partners, or shares owned by the other members of the general partner of Sterling Investment Partners. The business address of Sterling Investment Partners, L.P. is 276 Post Road West, Westport, Connecticut 06880.
- (7)
- Includes shares held by Sterling Investment Partners and shares held by Mr. Macey's wife. As a member of the general partner of Sterling Investment Partners, Mr. Macey may be deemed to be beneficial owner of the shares owned by Sterling Investment Partners. Mr. Macey disclaims beneficial ownership of the shares of common stock owned by Sterling Investment Partners, other than the shares attributable to his limited and general partnership interests therein, and the shares owned by his wife.
84
- (8)
- Consists of shares issuable upon the exercise of options that are exercisable within 60 days of the date of this prospectus.
- (9)
- Includes shares issuable upon the exercise of options that are exercisable within 60 days of the date of this prospectus, but does not include shares that will only become exercisable if (i) our stock price is equal to or greater than $ (assuming an initial public offering price of $ , the midpoint of the range set forth on the cover page of this prospectus) on the six month anniversary of the closing of this offering, or (ii) prior to that date if we are sold for a price per share that results in certain of our current investors achieving an internal rate of return of 30% or more. See "Description of Capital Stock—Contingent Options."
- (10)
- Includes shares held by Sterling Investment Partners. As a member of the general partner of Sterling Investment Partners, Mr. Newhouse may be deemed to be beneficial owner of the shares owned by Sterling Investment Partners. Mr. Newhouse disclaims beneficial ownership of the shares of common stock owned by Sterling Investment Partners, other than the shares attributable to his limited and general partnership interests therein.
- (11)
- Consists of shares held by RFE Investment Partners and RFE VI SBIC, L.P. As a managing partner of RFE Investment Partners and RFE VI SBIC, L.P., Mr. Parsons may be deemed to be the beneficial owner of the shares owned by these entities. Mr. Parsons disclaims beneficial ownership of the shares of common stock owned by these entities, other than the shares attributable to his limited and general partnership interests therein.
- (12)
- Includes shares held by Shaffer Family LLC, a limited liability company of which Mr. Shaffer has sole voting and dispositive power, and shares issuable upon the exercise of options that are exercisable within 60 days of the date of this prospectus.
- (13)
- Includes shares issuable upon the exercise of options that are exercisable within 60 days of the date of this prospectus, shares owned by Sterling Investment Partners, shares owned by Mr. Macey's wife, shares owned by RFE Investment Partners, shares owned by RFE VI SBIC, L.P. and shares owned by Shaffer Family LLC. See notes 7, 8, 10, 11 and 12 above.
85
CERTAIN RELATIONSHIPS AND RELATED TRANSACTIONS
The Kenan Acquisition
In 2001, Advantage Management Holdings Corp. ("Advantage"), a Delaware corporation engaged through its subsidiaries in the business of providing logistics and transportation services to the petroleum and chemical industries, agreed to acquire Kenan Transport Company, a North Carolina corporation also engaged in the business of providing logistics and transportation services to the petroleum industry. In connection with the acquisition, Advantage reorganized by creating a new holding company, KTC/AMG Holdings Corp. ("KTC/AMG"), a Delaware corporation, to own the businesses of Advantage and Kenan Transport.
The acquisition and reorganization were accomplished pursuant to the following transactions:
- •
- Pursuant to an agreement and plan of merger, dated as of April 19, 2001, among KTC/AMG, AMHC Acquisition Corp. ("AMHC Acquisition"), a Delaware corporation and wholly-owned subsidiary of KTC/AMG, and Advantage, AMHC Acquisition was merged with and into Advantage. Advantage was the surviving corporation in the merger and became a subsidiary of KTC/AMG. After the merger, which was completed and became effective on April 30, 2001, the stockholders of Advantage became stockholders of KTC/AMG.
- •
- Pursuant to a stockholders' agreement, dated as of April 30, 2001, Sterling Investment Partners, L.P. ("Sterling Investment Partners"), RFE Investment Partners ("RFE") and other investors purchased shares of our preferred stock.
- •
- Pursuant to an agreement and plan of merger, dated as of January 25, 2001, among Advantage, KTC/AMG, Kenan Transport and KTC Acquisition Corporation ("KTC Acquisition"), a North Carolina corporation and wholly-owned subsidiary of KTC/AMG, KTC Acquisition was merged with and into Kenan Transport. Kenan Transport was the surviving corporation in the merger and became a subsidiary of KTC/AMG. The stockholders of Kenan Transport received $35 cash per share in exchange for their Kenan Transport stock. After the merger, which was completed and became effective on April 30, 2001, KTC/AMG was renamed The Kenan Advantage Group, Inc.
We amended and restated our then existing credit facility to obtain part of the financing for the acquisition of Kenan Transport. Our obligations to these lenders are secured by a security interest in all of the assets of, and a pledge of the stock of, all of our subsidiaries. In addition, on April 30, 2001, we entered into a note purchase agreement with RSTW Partners III, L.P. ("RSTW"), Massachusetts Mutual Life Insurance Company and two of its affiliates, MassMutual Corporate Investors and MassMutual Participation Investors (collectively, the "MassMutual Investors"). The note purchase agreement amended and restated a 1998 note purchase agreement between Advantage Management Group, Inc., one of our subsidiaries ("AMG"), and RSTW, and provided for the issuance of $26,000,000 of our 12.5% senior subordinated notes due 2009 to RSTW and the Mass Mutual Investors and the issuance of an additional $13,250,000 of our 12.5% senior subordinated notes due 2009 to RSTW in an amendment, restatement and modification of notes AMG had issued to RSTW in 1998 and 2000. Payment of the subordinated notes is guaranteed by all of our subsidiaries. We intend to use a portion of the proceeds of this offering to repay all the outstanding subordinated notes. See "Use of Proceeds." Pursuant to the note purchase agreement, we paid RSTW a closing fee of $260,000 and an amendment/restructuring fee of $100,000, and paid a fee of $260,000 to the MassMutual Investors.
In addition, under a warrant purchase agreement dated April 30, 2001, RSTW and the MassMutual Investors purchased warrants to purchase an aggregate of 3,844 shares of our series D preferred stock (which upon the closing of this offering will represent the right to purchase shares of common stock, assuming an initial public offering price of $ , the midpoint of the range set forth on the cover page of this prospectus) plus up to shares of our common stock
86
upon the exercise of the Contingent Options, for an aggregate purchase price of $200.00. In addition, warrants previously held by RSTW Partners were converted into warrants to purchase an aggregate of 2,887 shares of our series D preferred stock (which upon the closing of this offering will represent the right to purchase shares of common stock, assuming an initial public offering price of $ , the midpoint of the range set forth on the cover page of this prospectus) plus up to shares of our common stock upon the exercise of the Contingent Options. RSTW and the MassMutual Investors also have a put right, which terminates upon a qualified public offering, to require us to repurchase these warrants for an amount in cash based upon the fair market value of the underlying shares at any time beginning April 30, 2006 and earlier upon the occurrence of certain events. This right terminates upon the closing of this offering. The payment of the put price of the warrants is guaranteed by all of our subsidiaries.
Pursuant to the stockholders' agreement, we issued and sold an aggregate of 26,276 shares of series B preferred stock (convertible into shares of common stock, assuming an initial public offering price of $ , the midpoint of the range set forth on the cover page of this prospectus) for an aggregate consideration of approximately $26.3 million to an investor group organized by Sterling Investment Partners and RFE.
The stockholders' agreement provides certain of our securityholders with the right to designate candidates for election to our board of directors, as follows:
- •
- Sterling Investment Partners has the right to designate two candidates, one of whom will serve as the chairman of the board of directors if Lee Shaffer is no longer serving as the chairman;
- •
- RFE Investment Partners has the right to designate two candidates; and
- •
- each of Dennis Nash, Carl Young and Lee Shaffer has the right to be nominated for election as a director, as long as he is an officer or employee of KAG, except that if neither Mr. Nash nor Mr. Young is employed by us but they together beneficially own at least 10% of our common stock (on an as-converted fully diluted basis), then Messrs. Nash and Young may nominate one of themselves to be elected as a director provided such nominee does not work for a competitor of ours.
Under the stockholders' agreement, each stockholder has agreed to vote its shares in favor of these candidates. M. William Macey, Jr. and Douglas L. Newhouse are Sterling's designees to our board of directors; Dennis Kupchik and James A. Parsons are RFE's designees.
The stockholders' agreement provides certain of our securityholders with "tag-along" rights and rights of first offer with respect to proposed transfers of our securities, as well as preemptive rights with respect to additional issuances of our securities. The stockholders' agreement will terminate upon the completion of this offering.
We paid affiliates of each of RFE and Sterling Investment Partners a financial advisory fee of $875,000 in consideration of the time and effort devoted by each of them in structuring the reorganization and the Kenan Transport acquisition, and reimbursed each of them for their reasonable out-of-pocket expenses incurred in connection with such transactions. We paid each of Messrs. Nash and Young transaction fees of $250,000 in connection with the acquisition of Kenan Transport.
Management Agreements
On April 30, 2001, we entered into management agreements with each of Sterling Investment Partners Advisors, LLC ("Sterling Advisors") and RFE Management Corporation ("RFE Management"), and an amended and restated management agreement with Sterling Ventures Limited. Sterling Advisors and Sterling Ventures are affiliates of Sterling Investment Partners and Messrs. Macey and Newhouse, and RFE Management is an affiliate of RFE. In their respective management
87
agreements, Sterling Advisors, RFE Management and Sterling Ventures agreed to consult with our board of directors and management on business and financial matters, including:
- •
- developing and implementing corporate strategy;
- •
- budgeting future corporate investments;
- •
- developing acquisition and divestiture strategies; and
- •
- subsequent debt and equity financings.
Under the management agreements, we are paying a management fee of $150,000 per year to each of Sterling Advisors and RFE Management, and a management fee of $250,000 per year to Sterling Ventures. We are also required to reimburse each of Sterling Advisors, RFE Management and Sterling Ventures for their reasonable travel and other direct out-of-pocket expenses. Under each of the three management agreements, the management fee is not paid on a current basis, but will accrue, during any period when we are in default of the payment of our term or revolving credit loans under our amended and restated credit agreement or our 12.5% senior subordinated notes due 2009.
Each of the management agreements provides for an initial term that expired on April 30, 2004. Each management agreement automatically renewed through April 30, 2005, and will automatically renew for successive one-year terms as long as our stockholders as of April 30, 2001, other than stockholders who are our employees, own at least 20% of our common stock on an as converted basis. The management agreements with Sterling Advisors and Sterling Ventures will terminate upon or after the completion of this offering if no Sterling designee remains a member of our board of directors, and the management agreement with RFE Management will terminate upon or after the completion of this offering if no RFE designee remains a member of our board of directors.
Buy/Sell Agreement
On January 1, 2003, we entered into a buy/sell agreement with Messrs. Nash, Shaffer and Young that provides that upon the death of any of Messrs. Nash, Shaffer and Young, we will purchase all shares of our preferred stock owned by his estate or any permitted transferee to whom he has transferred the preferred stock (and, in the case of Mr. Shaffer, Shaffer Family LLC) at a price of $2,000 per share. We have purchased life insurance in the amount of $3,000,000 per individual to satisfy our obligations under this agreement. If the purchase price exceeds the life insurance proceeds under our "key-man insurance policy" with respect to the decedent, we will pay the balance of the purchase price in monthly principal installments of $10,000 plus accrued interest at the minimum applicable federal rate. The buy/sell agreement will terminate upon the completion of this offering.
Lease Properties
We lease our corporate headquarters in Canton, Ohio from Freedom Investment, Inc., a corporation in which each of Messrs. Nash and Young has a 25% ownership interest. Mr. Nash serves as president of Freedom Investments and Mr. Young serves as vice president. The annual rent under the leases aggregates $410,400 ($406,800 in 2004) and the leases expire in 2009. In addition, we are responsible for paying taxes, insurance and maintenance.
We lease a terminal in Green, Ohio from NCT Development, Inc., a corporation in which Mr. Young has a 50% ownership interest. Mr. Young serves as President of NCT Development. The annual rent under the lease is $94,332 ($92,610 in 2004) and the lease expires in 2009. In addition, we are responsible for paying taxes, insurance and maintenance.
Other Transactions
We paid transaction fees of $281,250, $281,250, $87,500, and $87,500 to each of RFE Management, Sterling Advisors, Dennis Nash and Carl Young, respectively, in connection with our acquisition of the fuels delivery operations of Beneto, Inc. and Carl Klemm, Inc.
88
Upon the closing of this offering, our authorized capital stock will consist of shares, consisting of shares of common stock, $.0001 par value, and shares of preferred stock, $.001 par value.
Immediately prior to this offering, there are:
- •
- shares of our common stock outstanding, which are held of record by seven stockholders;
- •
- 3,352 shares of series A preferred stock outstanding, convertible into shares of common stock, assuming an initial public offering price of $ , the midpoint of the range set forth on the cover page of this prospectus, which are held of record by two stockholders;
- •
- 39,926 shares of series B preferred stock outstanding, convertible into shares of common stock, assuming an initial public offering price of $ , the midpoint of the range set forth on the cover page of this prospectus, which are held of record by 20 stockholders;
- •
- 1,280 shares of series C preferred stock outstanding, convertible into shares of common stock, assuming an initial public offering price of $ , the midpoint of the range set forth on the cover page of this prospectus, which are held of record by two stockholders; and
- •
- no shares of series D preferred stock outstanding.
Upon the closing of this offering, after giving effect to the issuance of shares of common stock offered by us in this offering and the automatic conversion of our preferred stock into shares of common stock, assuming an initial public official price of $ , the midpoint of the range set forth on the cover page of this prospectus, shares of common stock will be issued and outstanding and no shares of preferred stock will be issued and outstanding.
The following description summarizes information about our capital stock. This information does not purport to be complete and is subject to, and qualified in its entirety by reference to, the terms of our certificate of incorporation and bylaws, which are included as exhibits to the registration statement of which this prospectus forms a part, and the provisions of applicable Delaware law, the state in which we are incorporated.
Common Stock
Holders of common stock are entitled to one vote for each share held on all matters submitted to a vote of stockholders and do not have cumulative voting rights in connection with the election of directors. Accordingly, holders of a majority of the shares of common stock entitled to vote in any election of directors may elect all of the directors standing for election.
Holders of common stock are entitled to receive any dividends that may be declared by our board of directors, subject to any preferential dividend rights of outstanding preferred stock. In the event of our liquidation, dissolution or winding up, holders of common stock will be entitled to receive proportionately any of our assets remaining after the payment of liabilities and subject to the prior rights of any outstanding preferred stock.
Holders of common stock have no preemptive, subscription, redemption or conversion rights. The outstanding shares of common stock are, and the shares of common stock offered by us in this offering, when issued, will be, validly issued, fully paid and non-assessable. The rights and privileges of holders of common stock are subject to any series of preferred stock that we may issue in the future, as described below.
89
Preferred Stock
Upon the completion of this offering, all of our outstanding shares of preferred stock will convert into shares of common stock, assuming an initial public offering price of $ , the midpoint of the range set forth on the cover page of this prospectus. These shares of preferred stock will no longer be issued or outstanding after completion of this offering.
Our certificate of incorporation authorizes our board of directors, without further action by the stockholders, to issue shares of preferred stock from time to time in one or more series, to fix the number of shares constituting any series and to fix the designations and any of the preferences or rights of the shares of that series. The designations, preferences or rights of different series of preferred stock may differ with respect to dividend rates, redemption provisions, amounts payable on dissolution or liquidation, sinking fund provisions, conversion provisions, voting rights and other matters.
The issuance of preferred stock could decrease the amount of earnings and assets available for distribution to holders of common stock or adversely affect the rights and powers, including voting rights, of the holders of common stock. It may also have the effect of delaying, deferring or preventing a change in control of KAG. We have no current plans to issue any shares of preferred stock.
Contingent Options
In December 1998, our predecessor issued to each of Messrs. Nash and Young an option to purchase shares of our common stock at an exercise price of $ per share. These options become exercisable on the earlier to occur of October 1, 2008 or a liquidity event that results in the holders of our series B preferred stock realizing an internal rate of return, calculated annually in arrears, equal to at least 30%, assuming such holder disposed of all its shares on the date of the liquidity event. The options define a "liquidity event" as the earlier to occur of:
- •
- the expiration of the agreement certain of our stockholders have signed agreeing not to dispose of their shares without the consent of the representatives of the underwriters; or
- •
- a sale of KAG.
The option will terminate upon the earliest to occur of (i) a liquidity event occurs that does not result in holders of our series B preferred stock realizing a 30% internal rate of return, (ii) December 31, 2008 or (iii) termination of employment for justifiable cause (as defined in the optionee's employment agreement) or upon the optionee voluntarily terminating his employment.
If the options become exercisable as a result of a liquidity event but upon exercise the internal rate of return of the holders of the series B preferred stock is reduced below 30%, then the option shall only be exercisable to the extent the rate of return is not reduced below 30%.
Warrants
In connection with the purchase of our subordinated notes, we issued to the holders of the subordinated notes, for a nominal price, warrants to purchase an aggregate of 6,731 shares of series D preferred stock at an exercise price of per share (the "Series D Warrants"), and contingent warrants to purchase an aggregate of shares of our common stock at an exercise price of $ (the "Contingent Warrants"). Upon the closing of this offering, the Series D Warrants will represent the right to purchase shares of common stock at an exercise price of $ per share, assuming an initial public offering price of $ , the midpoint of the range set forth on the cover page of this prospectus. The warrant agreement pursuant to which the Series D Warrants and the Contingent Warrants were issued contains affirmative and negative covenants of KAG which will cease to be in effect upon the consummation of this offering for as long as KAG is a "reporting company" under the Securities Exchange Act of 1934. The holders of the warrants are entitled to certain
90
registration rights with respect to the shares of the common stock underlying such warrants. See "—Registration Rights."
The warrant exercise price may be paid in cash, by cancellation of indebtedness of KAG owing to the warrant holders or by cancellation of the warrant (valued according to a formula described in the warrant agreement). During the term of the warrants, in the event that KAG pays any cash dividend or cash distribution on any of its capital stock, we are required to pay to the holders of the warrants a fee equal to the amount of such dividend or distribution multiplied by the number of shares of common stock for which the warrants are then exercisable.
The warrant agreement also provides the holders of the warrants with an option to sell the shares of common stock issued or issuable pursuant to the warrants to us upon the occurrence of certain specified events, which option terminates upon the consummation of this offering. The warrants contain certain anti-dilution provisions providing for adjustments of the exercise price and number of shares of common stock or underlying securities which may be purchased upon exercise in the event of any recapitalization, reclassification, stock dividend, stock split or similar transactions, or upon certain issuances of our capital stock at a per share price less than the exercise price or the market price of the common stock.
The Contingent Warrants are only exercisable to the extent the Contingent Options described above become exercisable. See "—Contingent Options."
Registration Rights
After this offering, the holders of shares of common stock (including shares of common stock issuable on exercise of outstanding warrants or conversion of preferred stock) will be entitled to rights with respect to the registration of the sale of those shares under the Securities Act as follows:
- •
- Demand Registration Rights: At any time after the closing of this offering, holders of two-thirds of the shares of common stock then owned by former holders of series B preferred stock (the "Sterling Investors") may request that we register the sale of 25% or more of the shares then owned by them. At any time on or after six months following the closing of the offering, each of RSTW and the MassMutual Investors may request that we register the sale of 25% or more of the shares owned by them.
- •
- Piggyback Registration Rights: The holders of these shares can request that we register the sale of their shares any time we are filing a registration statement to register securities for our own account, with various exceptions, including the registration statement relating to this offering. These registration opportunities are unlimited but in limited situations the underwriters may reduce the number of shares that the holders of our registration rights may include in our registration statement.
These registration rights terminate, as to any stockholder, on the date on which registration would no longer be required for the immediate public sale of all of the shares of common stock subject to the registration rights held by that stockholder, except that the registration rights for shares of common stock that have become eligible for transfer under Rule 144 will not terminate until those shares have actually been sold in compliance with Rule 144.
We will bear all expenses, other than selling expenses, incurred in the registration process. The registration rights agreement includes indemnification provisions customary for an agreement of this type.
91
Anti-Takeover Effects of Delaware Laws and our Certificate of Incorporation and Bylaws
Our certificate of incorporation and the Delaware General Corporation Law (the "DGCL") contain provisions that may delay or prevent an attempt by a third party to acquire control of us. These provisions include the requirements of Section 203 of the DGCL. In general, Section 203 prohibits, for a period of three years, designated types of business combinations, including mergers, between us and any third party that owns 15% or more of our common stock. This provision does not apply if:
- •
- our board of directors approves of the transaction before the third party acquires 15% of our stock;
- •
- the third party acquires at least 85% of our stock at the time its ownership goes past the 15% level; or
- •
- our board of directors and two-thirds of the shares of our common stock not held by the third party vote in favor of the transaction.
Our certificate of incorporation also authorizes us to issue up to shares of preferred stock in one or more different series with terms fixed by the board of directors. Stockholder approval is not necessary to issue preferred stock in this manner. Issuance of these shares of preferred stock could have the effect of making it more difficult for a person or group to acquire control of us. Following the closing of this offering, no shares of our preferred stock will be outstanding. While our board of directors has no current intentions or plans to issue any preferred stock, issuance of these shares could also be used as an anti-takeover device.
These provisions may prevent our stockholders from receiving the benefit from any premium to the market price of our common stock offered by a bidder in a takeover context. Even in the absence of a takeover attempt, the existence of these provisions may adversely affect the prevailing market price of our common stock if they are viewed as discouraging takeover attempts in the future.
Indemnification of Officers and Directors
The DGCL authorizes corporations to limit or eliminate the personal liability of directors to corporations and their stockholders for monetary damages and breaches of directors' fiduciary duties. Our certificate of incorporation provides that, to the fullest extent permitted by the DGCL, as it now exists or as it may be amended in the future, a director will not be personally liable to us or our stockholders for monetary damages for the breach of any fiduciary duty as a director, except for liability:
- •
- for any breach of the director's duty of loyalty to us or our stockholders;
- •
- for acts or omissions not in good faith or that involve intentional misconduct or a knowing violation of law;
- •
- under Section 174 of the DGCL, as it now exists or as it may be amended in the future;
- •
- for any transaction from which the director derived an improper personal benefit.
Our bylaws provide that we will indemnify each of our directors and officers, and may indemnify any other person, who:
- •
- was or is a party or is threatened to be made a party to any threatened, pending or completed legal proceeding (other than an action by or in our right) by reason of the fact that he or she is or was a director, officer, employee or agent of ours, or is or was serving at our request as a director, officer, employee or agent of another entity, against amounts (including attorneys' fees) actually and reasonably incurred by him or her in connection with such legal proceeding if he or she acted in good faith and in a manner he or she reasonably believed to be in or not opposed
92
- •
- was or is a party or is threatened to be made a party to any threatened, pending or completed legal proceeding by or in our right to procure a judgment in our favor by reason of the fact that he or she is or was a director, officer, employee or agent of ours, or is or was serving at our request as a director, officer, employee or agent of another entity, against amounts (including attorneys' fees) actually and reasonably incurred by him or her in connection with the defense or settlement of such legal proceeding if he or she acted in good faith and in a manner he or she reasonably believed to be in or not opposed to our best interests and except that we will not indemnify any such person in respect of any matter as to which he or she shall have been adjudged to be liable to us unless and only to the extent that the Delaware Court of Chancery or the court in which such action or suit was brought determines that he or she is fairly and reasonably entitled to indemnity.
to our best interests, and, with respect to any criminal action or proceeding, had no reasonable cause to believe his or her conduct was unlawful; and
We have entered into separate indemnification agreements with each of our directors and executive officers that may be broader than the specific indemnification provisions contained in the DGCL. These indemnification agreements require us, among other things, to indemnify our directors and officers against liabilities that may arise by reason of their status or service as directors or officers, other than liabilities arising from willful misconduct. These indemnification agreements also require us to advance any expenses incurred by the directors and officers as a result of any proceeding against them as to which they could be indemnified and to obtain directors' and officers' insurance if available on reasonable terms.
We carry directors' and officers' insurance providing indemnification to our directors and officers for some liabilities. We believe that the indemnification provisions of our certificate of incorporation and bylaws and this insurance coverage are useful to attract and retain qualified directors and executive officers.
There is no currently pending material litigation or proceeding involving any of our directors, officers or employees for which indemnification is sought.
Listing
We have applied to list our common stock on The Nasdaq National Market under the symbol "TKAG."
Transfer Agent and Registrar
The transfer agent and registrar for our common stock will be .
93
SHARES ELIGIBLE FOR FUTURE SALE
Upon completion of this offering, shares of common stock will be outstanding. The number of shares of common stock to be outstanding after completion of this offering gives effect to the shares of common stock to be issued upon conversion of the outstanding shares of our preferred stock, assuming an initial public offering price of $ per share, the midpoint of the range set forth on the cover page of this prospectus, but excludes:
- •
- shares of common stock issuable upon the exercise of options outstanding under our equity incentive plans, having a weighted average exercise price of $ per share;
- •
- shares of common stock reserved for future grant under our equity incentive plans;
- •
- shares of common stock issuable upon the exercise of outstanding warrants, at an exercise price of $ per share;
- •
- shares of common stock issuable upon exercise of the Contingent Options, at an exercise price of $ per share; and
- •
- shares of common stock issuable upon the exercise of outstanding warrants, at an exercise price of $ per share, which warrants will only become exercisable if the Contingent Options become exercisable.
Of the shares to be outstanding after completion of this offering, the shares of common stock sold in the offering will be freely tradable without restriction or further registration under the Securities Act, except for any shares which may be acquired by an "affiliate" of ours, as that term is defined in Rule 144 under the Securities Act, which will be subject to the resale limitations of Rule 144. The remaining shares of common stock outstanding will be "restricted securities," as that term is defined in Rule 144, and may in the future be sold without restriction under the Securities Act to the extent permitted by Rule 144 or any applicable exemption under the Securities Act.
In general, under Rule 144 as currently in effect, a person (or persons whose shares are aggregated) who has beneficially owned shares of our common stock for at least one year from the date such securities were acquired from us or an affiliate of ours would be entitled to sell within any three-month period a number of shares that does not exceed the greater of one percent of the then outstanding shares of the common stock (approximately shares immediately after this offering) and the average weekly trading volume of the common stock on The Nasdaq National Market during the four calendar weeks preceding a sale by such person. Sales under Rule 144 are also subject to certain manner-of-sale provisions, notice requirements and the availability of current public information about us. Under Rule 144, however, a person who has held restricted securities for a minimum of two years from the later of the date such securities were acquired from us or an affiliate of ours and who is not, and for the three months prior to the sale of such restricted securities has not been, an affiliate of ours, is free to sell such shares of common stock without regard to volume, manner-of-sale and the other limitations contained in Rule 144. The foregoing summary of Rule 144 is not intended to be a complete discussion thereof.
Commencing 90 days after the date of this prospectus, approximately outstanding restricted securities will be eligible for sale under Rule 144 subject to applicable volume limitation, manner of sale and notice requirements set forth in applicable SEC rules and of the restricted securities will be saleable without regard to these restrictions under Rule 144(k).
Our officers and directors, Sterling Investment Partners L.P., RFE Investment Partners and certain other stockholders who will collectively hold after this offering shares of common stock have agreed that they will not offer, sell, contract to sell, pledge or otherwise dispose of, directly or indirectly, any shares of our common stock or securities convertible into or exchangeable or exercisable for any shares of our common stock, enter into a transaction that would have the same effect, or enter
94
into any swap, hedge or other arrangement that transfers, in whole or in part, any of the economic consequences of ownership of our common stock, whether any of these transactions are to be settled by delivery of our common stock or other securities, in cash or otherwise, or publicly disclose the intention to make any offer, sale, pledge or disposition, or to enter into any transaction, swap, hedge or other arrangement, without, in each case, the prior written consent of Credit Suisse First Boston LLC and UBS Securities LLC for a period of 180 days after the date of this prospectus.
Promptly upon completion of the offering, we intend to file a registration statement on Form S-8 with the SEC to register shares of our common stock reserved for issuance or sale under our equity compensation plans. This registration statement will become effective immediately upon filing, and any shares of common stock thereafter granted under our equity compensation plans will be freely tradable without restriction under the Securities Act, unless such shares are held by an affiliate of ours. We have outstanding options to purchase a total of shares of our common stock, of which were vested.
Beginning 180 days after the closing of this offering, the holders of shares of our common stock (including shares of common stock issuable on exercise of outstanding warrants), or their transferees, will be entitled to rights with respect to the registration of the sale of those shares under the Securities Act. See "Description of Capital Stock—Registration Rights." Shares that selling stockholders sold under a registration statement would thereafter be freely tradable without restriction under the Securities Act subject to the Rule 144 limitations applicable to any affiliates who purchased them.
Prior to the offering, there has been no established market for our common stock, and no predictions can be made about the effect, if any, that market sales of shares of common stock or the availability of such shares for sale will have on the market price prevailing from time to time. Nevertheless, the actual sale of, or the perceived potential for the sale of, common stock in the public market may have an adverse effect on the market price for the common stock.
95
UNITED STATES FEDERAL INCOME TAX CONSIDERATIONS
General
The following is a summary of the material United States federal income tax considerations related to the ownership and disposition of our common stock that may be relevant to you if you acquire our common stock pursuant to this offering. This summary is based on the Internal Revenue Code of 1986, as amended (the "Code"), existing and proposed Treasury regulations promulgated under the Code and administrative and judicial interpretations of the Code, all as of the date of this prospectus and all of which are subject to change, possibly with retroactive effect. The Internal Revenue Service is referred to as "IRS" in this summary.
This summary discusses only the tax consequences to the initial investors who purchase our common stock pursuant to the initial offering and does not discuss the tax consequences applicable to subsequent purchasers of our common stock. This summary deals only with common stock held as capital assets within the meaning of Section 1221 of the Code. It does not discuss all of the tax considerations that may be relevant to holders of our common stock in light of their particular circumstances or to holders of common stock subject to special rules, such as financial institutions, regulated investment companies, holders subject to the alternative minimum tax, insurance companies, pension funds, tax-exempt organizations, partnerships or other pass-through entities, dealers in securities or currencies, traders who elect to mark to market their securities or persons holding the common stock as part of a hedging or constructive sale transaction, "straddle," conversion transaction, or other integrated transaction, or holders of the common stock whose functional currency is not the United States dollar. In addition, this summary does not discuss any United States tax consequences to a Non-U.S. Holder (as defined below) that is a controlled foreign corporation, passive foreign investment company, foreign personal holding company, corporation that accumulates earnings to avoid U.S. federal income tax, or a U.S. expatriate. This summary does not address any state, local or non-United States tax considerations, or tax considerations under other federal tax laws (such as estate and gift tax laws).
We have not requested a ruling from the IRS on the tax consequences of owning our common stock. As a result, the IRS could disagree with portions of this discussion. Persons considering the purchase of our common stock should consult with their own tax advisors about the application of the United States federal income tax laws to their particular situations, as well as any tax considerations under other United States federal tax laws, and the laws of any state, local or foreign jurisdiction.
As used in this prospectus, the term "U.S. Holder" means a beneficial owner of common stock that is, for United States federal income tax purposes:
- •
- a citizen or individual resident of the United States;
- •
- a corporation, partnership or other entity treated as a corporation, created in or under the laws of the United States or of any political subdivision thereof;
- •
- an estate the income of which is subject to United States federal income taxation regardless of its source; or
- •
- a trust if a court within the United States is able to exercise primary supervision over the administration of the trust and one or more U.S. persons have the authority to control all substantial decisions of the trust, or a trust that has a valid election in effect under applicable United States Treasury Regulations to be treated as a U.S. person.
As used in this prospectus, the term "Non-U.S. Holder" means a beneficial owner of common stock that is an individual, corporation, trust or estate that is not a U.S. Holder.
96
If an entity treated as a partnership for U.S. federal income tax purposes holds shares of common stock, the tax treatment of a partner will generally depend on the status of the partner and upon the activity of the partnership. If you are a partner of a partnership holding shares of common stock, we suggest you consult your own tax advisor.
Distributions to U.S. Holders
If distributions are paid on the shares of our common stock, these distributions generally will constitute dividends for U.S. federal income tax purposes to the extent paid from our current or accumulated earnings and profits, as determined under U.S. federal income tax principles, and will constitute a tax-free return of capital that is applied against your tax basis in the common stock to the extent these distributions exceed those earnings and profits. Distributions in excess of our current and accumulated earnings and profits and your tax basis in the common stock will be treated as a gain from the sale or exchange of the common stock, the treatment of which is discussed below. For the tax years 2004 through 2008, certain U.S. Holders are subject to a maximum tax rate on dividends equal to 15%, which corresponds to the maximum tax rate for long-term capital gains. However, under current law for tax years beginning after December 31, 2008, dividends will be taxed at the same rate as other items of ordinary income.
Distributions to Non-U.S. Holders
Dividends paid to a Non-U.S. Holder that are not effectively connected with the conduct of a U.S. trade or business of the Non-U.S. Holder generally will be subject to U.S. federal withholding tax at a 30% rate or, if an income tax treaty applies and certain certification requirements described below are satisfied, a lower rate specified by the treaty. Non-U.S. Holders should consult their tax advisors regarding their entitlement to benefits under a relevant tax treaty.
Withholding generally is imposed on the gross amount of a distribution, regardless of whether we have sufficient earnings and profits to cause the distribution to be a dividend for U.S. federal income tax purposes. However, we may elect to withhold on less than the gross amount of the distribution if we determine that the distribution is not paid out of our current or accumulated earnings and profits, based on our reasonable estimates.
A Non-U.S. Holder eligible for a reduced rate of U.S. federal withholding tax under a tax treaty may obtain a refund of any excess amounts withheld by filing an appropriate claim for a refund together with the required information with the IRS.
Dividends that are effectively connected with a Non-U.S. Holder's conduct of a trade or business within the United States and, if a tax treaty applies, attributable to a Non-U.S. Holder's U.S. permanent establishment, are exempt from U.S. federal withholding tax if the Non-U.S. Holder furnishes to us or our paying agent the appropriate IRS form and other applicable requirements are met. However, dividends exempt from U.S. federal withholding tax because they are "effectively connected" or attributable to a U.S. permanent establishment under an applicable tax treaty are subject to U.S. federal income tax on a net income basis at the regular graduated U.S. federal income tax rates. Any such effectively connected dividends received by a foreign corporation may, under certain circumstances, be subject to an additional "branch profits tax" at a 30% rate or a lower rate specified by an applicable tax treaty.
Gain on Disposition of Common Stock by U.S. Holders
A U.S. Holder will recognize gain or loss on the sale or exchange of our common stock to the extent of the difference between the amount realized on such sale or exchange and the holder's adjusted tax basis in such shares. Such gain or loss generally will constitute long-term capital gain or loss if the holder has held such shares for more than one year. Individual U.S. Holders are subject to a
97
maximum tax rate of 15% on long-term capital gain (increased to 20% for years after 2008). The deductibility of capital losses by a U.S. Holder is subject to limitations.
Gain on Disposition of Common Stock by Non-U.S. Holders
A Non-U.S. Holder generally will not be subject to U.S. federal income tax with respect to gain recognized on a sale or other disposition of our common stock unless one of the following applies:
- •
- The gain is effectively connected with a Non-U.S. Holder's conduct of a trade or business within the United States and, if a tax treaty applies, the gain is attributable to a Non-U.S. Holder's U.S. permanent establishment. In such case, the Non-U.S. Holder will, unless an applicable tax treaty provides otherwise, generally be taxed on its net gain derived from the sale at regular graduated U.S. federal income tax rates, and in the case of a foreign corporation, may also be subject to the branch profits tax described above;
- •
- A Non-U.S. Holder who is an individual holds our common stock as a capital asset, is present in the United States for 183 or more days in the taxable year of the sale or other disposition, and certain other conditions are met. In such a case, the Non-U.S. Holder will be subject to a flat 30% tax on the gain derived from the sale, which may be offset by certain U.S. capital losses; or
- •
- We are or have been a "United States real property holding corporation" (a "USRPHC") for United States federal income tax purposes at any time during the shorter of the five-year period ending on the date of the sale or other disposition and the period such Non-U.S. Holder held our common stock (the shorter period hereinafter referred to as the "lookback period"); provided that if our common stock is regularly traded on an established securities market, this rule will generally not cause any gain to be taxable unless the Non-U.S. Holder owned more than 5% of our common stock at some time during the lookback period. We do not believe that we are a USRPHC and do not expect to become one in the future. However, we could become a USRPHC as a result of future changes in assets or operations.
Information Reporting and Backup Withholding Tax
The amount of dividends paid to each U.S. Holder will be reported annually to the IRS and to each U.S. Holder. A U.S. Holder may be subject to backup withholding (currently at a rate of 28%) with respect to dividends on, and the proceeds from the sale or redemption of, common stock, unless such holder (a) is an entity that is exempt from withholding (including, among others, corporations and certain tax-exempt organizations) and when required, demonstrates this fact, or (b) provides the payor with its correct taxpayer identification number, which, for an individual, is ordinarily his or her social security number, and otherwise complies with applicable requirements of the backup withholding rules.
Generally, we must report annually to the IRS and to each Non-U.S. Holder the amount of dividends paid to, and the tax withheld with respect to, each Non-U.S. Holder. These reporting requirements apply regardless of whether withholding was reduced or eliminated by an applicable tax treaty. Copies of this information also may be available under the provisions of a specific tax treaty or agreement with the tax authorities in the country in which the Non-U.S. Holder resides or is established.
In general, backup withholding will not apply to dividends paid to a Non-U.S. Holder and to proceeds from the disposition of our common stock paid to a Non-U.S. Holder if the holder has provided the required certification that it is a Non-U.S. Holder and neither we nor our paying agents have actual knowledge or reason to know that the holder is a United States person.
Under United States Treasury Regulations, the payment of proceeds from the disposition of our common stock by a Non-U.S. Holder made to or through a foreign office of a broker to its customer generally are not subject to information reporting or backup withholding. However, if the broker is a
98
U.S. person, a controlled foreign corporation for U.S. federal income tax purposes, a foreign person 50% or more of whose gross income from certain periods is effectively connected with a United States trade or business, or a foreign partnership with significant United States ownership, then information reporting (but not backup withholding) will be required, unless the broker has in its records documentary evidence that the beneficial owner of the payment is not a U.S. person or is otherwise entitled to an exemption, and other applicable certification requirements are met (and the broker has no actual knowledge to the contrary). Information reporting and backup withholding generally will apply to proceeds of a disposition of our common stock effected at a United States office of any United States or foreign broker, unless the broker has in its records documentary evidence that the beneficial owner of the payment is not a U.S. person or is otherwise entitled to an exemption, and other applicable certification requirements are met.
Backup withholding does not represent an additional income tax. Any amounts withheld from a payment to a holder under the backup withholding rules will be allowed as a credit against the holder's United States federal income tax liability and may entitle the holder to a refund, provided that the required information or returns are timely furnished by the holder to the IRS.
The foregoing discussion of certain U.S. federal income tax considerations is for general information only and is not tax advice. Accordingly, each prospective investor should consult with his own tax adviser regarding U.S. federal, state, local and non-U.S. income and other tax consequences of the acquisition, holding and disposing of our common stock.
99
We, the selling stockholders and the underwriters named below have entered into an underwriting agreement dated , 2004 with respect to the shares of common stock being offered. Under the terms and subject to the conditions contained in the underwriting agreement, we have agreed to sell to the underwriters named below, for whom Credit Suisse First Boston LLC and UBS Securities LLC are acting as representatives, the following respective numbers of shares of common stock:
| Underwriter | Number of Shares | ||
|---|---|---|---|
| Credit Suisse First Boston LLC | |||
| UBS Securities LLC | |||
| KeyBanc Capital Markets, a division of McDonald Investments Inc. | |||
| Legg Mason Wood Walker, Incorporated | |||
| Stephens Inc. | |||
| Total | |||
The underwriting agreement provides that the underwriters are severally obligated to purchase all the shares of common stock in the offering if any are purchased, other than those shares covered by the over-allotment option described below. The underwriting agreement also provides that if an underwriter defaults the purchase commitments of non-defaulting underwriter may be increased or the offering may be terminated.
The selling stockholders have granted to the underwriters a 30-day option to purchase on a pro rata basis up to additional shares at the initial public offering price less the underwriting discounts and commissions. The option may be exercised only to cover any over-allotments of common stock.
The underwriters propose to offer the shares of common stock initially at the public offering price on the cover page of this prospectus and to selling group members at that price less a selling concession of $ per share. The underwriters and selling group members may allow a discount of $ per share on sales to other broker/dealers. After the initial public offering, the underwriters may change the public offering price and concession and discount to broker/dealers.
The following table summarizes the compensation and estimated expenses we and, if the over-allotment option is exercised, the selling stockholders will pay with respect to the shares of common stock we and, if the over-allotment option is exercised, the selling stockholders are offering:
| | Per Share | Total | ||||
|---|---|---|---|---|---|---|
| Underwriting discounts and commissions paid by us | $ | $ | ||||
| Underwriting discounts and commissions paid by the selling stockholders | $ | $ | ||||
| Expenses payable by us | $ | $ | ||||
The selling stockholders will not pay any offering expenses.
The representatives have informed us that the underwriters do not expect discretionary sales to exceed 5% of the number of shares being offered.
We have agreed that we will not offer, sell, contract to sell, pledge or otherwise dispose of, directly or indirectly, or file with the SEC a registration statement under the Securities Act relating to, any shares of our common stock or securities convertible into or exchangeable or exercisable for any shares of our common stock, or publicly disclose the intention to make any offer, sale, pledge, disposition or filing, without the prior written consent of Credit Suisse First Boston LLC and UBS Securities LLC for
100
a period of 180 days after the date of this prospectus, except issuances pursuant to the exercise of an option or warrant or the exchange of a security outstanding on the date of this prospectus of which the underwriters have been advised in writing, the issuance of options under our existing stock plans and the issuance, in one or more transactions, of up to 15%, in the aggregate, of our outstanding common stock (or options, warrants or convertible securities in respect thereof) as consideration in bona fide merger or acquisition transactions, provided that the common stock (or such options, warrants and convertible securities) so issued is subject to the terms of a lock-up agreement having provisions that are substantially the same as the agreements described in the following paragraph.
Our officers and directors and certain other stockholders, who will collectively hold after this offering shares of common stock, have agreed that they will not offer, sell, contract to sell, pledge or otherwise dispose of, directly or indirectly, any shares of our common stock or securities convertible into or exchangeable or exercisable for any shares of our common stock, enter into a transaction that would have the same effect, or enter into any swap, hedge or other arrangement that transfers, in whole or in part, any of the economic consequences of ownership of our common stock, whether any of these transactions are to be settled by delivery of our common stock or other securities, in cash or otherwise, or publicly disclose the intention to make any offer, sale, pledge or disposition, or to enter into any transaction, swap, hedge or other arrangement, without, in each case, the prior written consent of Credit Suisse First Boston LLC and UBS Securities LLC for a period of 180 days after the date of this prospectus. However, transfers pursuant to bona fide gifts and transfers in connection with a sale of KAG do not require the prior consent of Credit Suisse First Boston LLC and UBS Securities LLC.
Additionally, the foregoing stockholders have also agreed that they will not, for a period of six months after the date of this prospectus, make any demand for or exercise any right with respect to the registration of our common stock or securities convertible into or exchangeable for any shares of our common stock without the prior written consent of Credit Suisse First Boston LLC and UBS Securities LLC.
The underwriters have reserved for sale at the initial public offering price up to shares of the common stock for our employees and directors and other persons associated with us who have expressed an interest in purchasing common stock in the offering. The number of shares available for sale to the general public in the offering will be reduced to the extent these persons purchase the reserved shares. Any reserved shares not so purchased will be offered by the underwriters to the general public on the same terms as the other shares.
We and the selling stockholders have agreed to indemnify the underwriters against liabilities under the Securities Act, or contribute to payments that the underwriters may be required to make in that respect.
We will apply to list the shares of common stock on The Nasdaq National Market.
From time to time, certain of the underwriters and their affiliates have provided, and will continue to provide, investment banking and other services to us and certain existing stockholders, for which they receive customary fees and commissions. Additionally, an affiliate of KeyBanc Capital Markets, a division of McDonald Investments Inc., is a lender under our existing credit facility.
Prior to this offering, there has been no public market for the common stock. The initial public offering price will be determined by negotiations between the underwriters and our board of directors. Among the factors to be considered in determining the initial public offering price will be our future prospects and those of our industry in general, our sales, earnings and certain other financial operating information in recent periods, the price-earnings ratios, price-sales ratios, market prices of securities and certain financial and operating information of companies engaged in activities similar to ours, the ability of our management, the general condition of the securities markets at the time of the offering
101
and the information in this prospectus and otherwise available to the underwriters. The estimated public offering price range listed on the cover page of this preliminary prospectus may change as a result of market conditions and other factors.
We offer no assurances that the initial public offering price will correspond to the price at which the common stock will trade in the public market subsequent to this offering or that an active trading market for the common stock will develop and continue after the offering.
In connection with the offering the underwriters may engage in stabilizing transactions, over-allotment transactions, syndicate covering transactions and penalty bids in accordance with Regulation M under the Exchange Act.
- •
- Stabilizing transactions permit bids to purchase the underlying security so long as the stabilizing bids do not exceed a specified maximum.
- •
- Over-allotment involves sales by the underwriters of shares in excess of the number of shares the underwriters are obligated to purchase, which creates a syndicate short position. The short position may be either a covered short position or a naked short position. In a covered short position, the number of shares over-allotted by the underwriters is not greater than the number of shares that they may purchase in the over-allotment option. In a naked short position, the number of shares involved is greater than the number of shares in the over-allotment option. The underwriters may close out any covered short position by either exercising their over-allotment option and/or purchasing shares in the open market.
- •
- Syndicate covering transactions involve purchases of the common stock in the open market after the distribution has been completed in order to cover syndicate short positions. In determining the source of shares to close out the short position, the underwriters will consider, among other things, the price of shares available for purchase in the open market as compared to the price at which they may purchase shares through the over-allotment option. If the underwriters sell more shares than could be covered by the over-allotment option, a naked short position, the position can only be closed out by buying shares in the open market. A naked short position is more likely to be created if the underwriters are concerned that there could be downward pressure on the price of the shares in the open market after pricing that could adversely affect investors who purchase in the offering.
- •
- Penalty bids permit the representatives to reclaim a selling concession from a syndicate member when the common stock originally sold by the syndicate member is purchased in a stabilizing or syndicate covering transaction to cover syndicate short positions.
These stabilizing transactions, syndicate covering transactions and penalty bids may have the effect of raising or maintaining the market price of our common stock or preventing or retarding a decline in the market price of the common stock. As a result the price of our common stock may be higher than the price that might otherwise exist in the open market. These transactions may be effected on The Nasdaq National Market and, if commenced, may be discontinued at any time.
A prospectus in electronic format may be made available on the web sites maintained by one or more of the underwriters, or selling group members, if any, participating in this offering, and one or more of the underwriters participating in this offering may distribute the prospectus electronically. The representatives may agree to allocate a number of shares to underwriters and selling group members for sale to their online brokerage account holders. Internet distributions will be allocated by the underwriters and selling group members that will make internet distributions on the same basis as other allocations.
102
Resale Restrictions
The distribution of the common stock in Canada is being made only on a private placement basis exempt from the requirement that we and the selling stockholders prepare and file a prospectus with the securities regulatory authorities in each province where trades of common stock are made. Any resale of the common stock in Canada must be made under applicable securities laws, which will vary depending on the relevant jurisdiction and which may require resales to be made under available statutory exemptions or under a discretionary exemption granted by the applicable Canadian securities regulatory authority. Purchasers are advised to seek legal advice prior to any resale of the common stock.
Representations of Purchasers
By purchasing common stock in Canada and accepting a purchase confirmation, a purchaser is representing to us, the selling stockholders and the dealer from whom the purchase confirmation is received that:
- •
- the purchaser is entitled under applicable provincial securities laws to purchase the common stock without the benefit of a prospectus qualified under those securities laws,
- •
- where required by law, that the purchaser is purchasing as principal and not as agent, and
- •
- the purchaser has reviewed the text above under "Resale Restrictions."
Rights of Action—Ontario Purchasers Only
Under Ontario securities legislation, a purchaser who purchases a security offered by this prospectus during the period of distribution will have a statutory right of action for damages, or while still the owner of the shares, for rescission against us and the selling stockholders in the event that this prospectus contains a misrepresentation. A purchaser will be deemed to have relied on the misrepresentation. The right of action for damages is exercisable not later than the earlier of 180 days from the date the purchaser first had knowledge of the facts giving rise to the cause of action and three years from the date on which payment is made for the shares. The right of action for rescission is exercisable not later than 180 days from the date on which payment is made for the shares. If a purchaser elects to exercise the right of action for rescission, the purchaser will have no right of action for damages against us or the selling stockholders. In no case will the amount recoverable in any action exceed the price at which the shares were offered to the purchaser and if the purchaser is shown to have purchased the securities with knowledge of the misrepresentation, we and the selling stockholders will have no liability. In the case of an action for damages, we and the selling stockholders will not be liable for all or any portion of the damages that are proven to not represent the depreciation in value of the shares, as a result of the misrepresentation relied upon. These rights are in addition to, and without derogation from, any other rights or remedies available at law to an Ontario purchaser. The foregoing is a summary of the rights available to an Ontario purchaser. Ontario purchasers should refer to the complete text of the relevant statutory provisions.
Enforcement of Legal Rights
All of our directors and officers as well as the experts named herein and the selling stockholders may be located outside of Canada and, as a result, it may not be possible for Canadian purchasers to effect service of process within Canada upon us or those persons. All or a substantial portion of our assets and the assets of those persons may be located outside of Canada and, as a result, it may not be possible to satisfy a judgment against us or those persons in Canada or to enforce a judgment obtained in Canadian courts against us or those persons outside of Canada.
103
Taxation and Eligibility for Investment
Canadian purchasers of common stock should consult their own legal and tax advisors with respect to the tax consequences of an investment in the common stock in their particular circumstances and about the eligibility of the common stock for investment by the purchaser under relevant Canadian legislation.
The validity of the shares of common stock offered by this prospectus will be passed upon for us by Fulbright & Jaworski L.L.P., New York, New York. The underwriters have been represented by Cravath, Swaine & Moore LLP, New York, New York.
Ernst & Young LLP, independent registered public accounting firm, have audited our consolidated financial statements as of December 31, 2002 and 2003, and for each of the three years in the period ended December 31, 2003, as set forth in their report. We have included our financial statements in the prospectus and elsewhere in the registration statement in reliance on Ernst & Young LLP's report, given on their authority as experts in accounting and auditing.
Ernst & Young LLP, independent registered public accounting firm, have also audited the financial statements of the fuels delivery operations of Beneto, Inc. as of December 31, 2001 and 2002, and for each of the three years in the period ended December 31, 2002; and the financial statements of Carl Klemm, Inc. as of September 30, 2002 and for the year then ended, as set forth in their reports. We have included these financial statements in the prospectus and elsewhere in the registration statement in reliance on Ernst & Young LLP's report, given on their authority as experts in accounting and auditing.
WHERE YOU CAN FIND MORE INFORMATION
We have filed with the SEC a registration statement on Form S-1 under the Securities Act to register the shares offered by this prospectus. The term "registration statement" means the original registration statement and any and all amendments thereto, including the schedules and exhibits to the original registration statement or any amendment. This prospectus is part of that registration statement. This prospectus does not contain all of the information set forth in the registration statement or the exhibits to the registration statement. For further information with respect to us and the shares we are offering pursuant to this prospectus, you should refer to the registration statement and its exhibits. Statements contained in this prospectus as to the contents of any contract, agreement or other document referred to are not necessarily complete, and you should refer to the copy of that contract or other documents filed as an exhibit to the registration statement. You may read or obtain a copy of the registration statement at the SEC's public reference room at 450 Fifth Street, N.W., Washington, D.C. 20549. You may obtain information on the operation of the public reference room and their copy charges by calling the SEC at 1-800-SEC-0330. The SEC maintains a website that contains registration statements, reports, proxy information statements and other information regarding registrants that file electronically with the SEC. The address of the website is http://www.sec.gov.
We are not yet subject to the information and periodic reporting requirements of the Securities Exchange Act of 1934, as amended. Upon completion of this offering, we will become subject to such information and periodic reporting requirements.
We intend to furnish holders of the shares of common stock offered in this offering with written annual reports containing audited consolidated financial statements together with a report by our independent certified public accountants, and make available to our stockholders quarterly reports for the first three quarters of each year containing unaudited interim financial statements.
104
INDEX TO CONSOLIDATED FINANCIAL STATEMENTS
F-1
REPORT OF INDEPENDENT REGISTERED PUBLIC ACCOUNTING FIRM
Board of Directors and Stockholders
The Kenan Advantage Group, Inc.
We have audited the accompanying consolidated balance sheets of The Kenan Advantage Group, Inc. (the Company) as of December 31, 2002 and 2003, and the related consolidated statements of operations, stockholders' equity and cash flows for each of the three years in the period ended December 31, 2003. These financial statements are the responsibility of the Company's management. Our responsibility is to express an opinion on these financial statements based on our audits.
We conducted our audits in accordance with the standards of the Public Company Accounting Oversight Board (United States). Those standards require that we plan and perform the audit to obtain reasonable assurance about whether the financial statements are free of material misstatement. An audit includes examining, on a test basis, evidence supporting the amounts and disclosures in the financial statements. An audit also includes assessing the accounting principles used and significant estimates made by management, as well as evaluating the overall financial statement presentation. We believe that our audits provide a reasonable basis for our opinion.
In our opinion, the consolidated financial statements referred to above present fairly, in all material respects, the consolidated financial position of The Kenan Advantage Group, Inc. at December 31, 2002 and 2003, and the consolidated results of their operations and their cash flows for each of the three years in the period ended December 31, 2003, in conformity with U.S. generally accepted accounting principles.
As explained in Note 1 to the consolidated financial statements, effective January 1, 2002, the Company adopted Statement of Financial Accounting Standards No. 142,Goodwill and Other Intangible Assets.
/s/ Ernst & Young LLP
March 19, 2004
Akron, Ohio
F-2
The Kenan Advantage Group, Inc.
Consolidated Balance Sheets
(Amounts in Thousands, except share and per share data)
| | December 31, | |||||||
|---|---|---|---|---|---|---|---|---|
| | 2002 | 2003 | ||||||
| Assets | ||||||||
| Current assets: | ||||||||
| Cash and cash equivalents | $ | 3,456 | $ | 5,823 | ||||
| Accounts receivable, less allowance of $1,644 and $1,554 at December 31, 2002 and 2003, respectively | 25,011 | 34,968 | ||||||
| Supplies | 1,415 | 2,882 | ||||||
| Deferred income taxes | 3,211 | 5,502 | ||||||
| Prepaid expenses and other current assets | 4,520 | 7,939 | ||||||
| Total current assets | 37,613 | 57,114 | ||||||
Property and equipment, net | 95,542 | 126,914 | ||||||
| Other assets: | ||||||||
| Goodwill | 93,978 | 107,243 | ||||||
| Deferred financing costs, net of amortization | 3,523 | 4,400 | ||||||
| Other non-current assets | 77 | 2,211 | ||||||
| 97,578 | 113,854 | |||||||
| Total assets | $ | 230,733 | $ | 297,882 | ||||
Liabilities and stockholders' equity | ||||||||
| Current liabilities: | ||||||||
| Revolving credit line | $ | — | $ | 3,500 | ||||
| Accounts payable | 7,813 | 12,706 | ||||||
| Accrued expenses | 17,979 | 28,918 | ||||||
| Current portion of capital lease obligations | 1,221 | 485 | ||||||
| Current portion of long-term debt | 8,325 | 11,075 | ||||||
| Total current liabilities | 35,338 | 56,684 | ||||||
Long-term debt, net of current portion | 109,320 | 148,225 | ||||||
| Capital lease obligations, net of current portion | 489 | — | ||||||
| Other non-current liabilities | 5,084 | 4,574 | ||||||
| Deferred income taxes | 20,898 | 25,098 | ||||||
| Detachable stock warrants, subject to put option | 4,243 | 17,930 | ||||||
| Total liabilities | 175,372 | 252,511 | ||||||
Stockholders' equity: | ||||||||
| Convertible preferred stock | 44,326 | 44,326 | ||||||
| Common stock, at $0.0001 par value, 7,000,000 shares authorized at December 31, 2002 and 2003; and 200,800 and 240,800 shares issued and outstanding at December 31, 2002 and 2003, respectively | — | — | ||||||
| Additional paid-in capital | 200 | 1,232 | ||||||
| Retained earnings | 11,601 | 2 | ||||||
| Accumulated other comprehensive loss | (766 | ) | (189 | ) | ||||
| Total stockholders' equity | 55,361 | 45,371 | ||||||
| Total liabilities and stockholders' equity | $ | 230,733 | $ | 297,882 | ||||
See accompanying notes.
F-3
The Kenan Advantage Group, Inc.
Consolidated Statements of Operations
(Amounts in Thousands, except share and per share data)
| | Years ended December 31, | ||||||||||
|---|---|---|---|---|---|---|---|---|---|---|---|
| | 2001 | 2002 | 2003 | ||||||||
| Net revenues | $ | 201,619 | $ | 269,254 | $ | 364,910 | |||||
| Operating costs: | |||||||||||
| Wages and employee benefits | 113,086 | 147,155 | 211,542 | ||||||||
| Fuel and other operating expenses | 37,084 | 53,260 | 72,672 | ||||||||
| Insurance and claims | 7,531 | 14,775 | 19,495 | ||||||||
| Taxes and licenses | 2,509 | 3,263 | 4,268 | ||||||||
| General and administrative | 12,522 | 15,972 | 20,082 | ||||||||
| Depreciation and amortization | 11,674 | 13,514 | 19,074 | ||||||||
| 184,406 | 247,939 | 347,133 | |||||||||
| Income from operations | 17,213 | 21,315 | 17,777 | ||||||||
Other income (expenses): | |||||||||||
| Interest expense | (10,657 | ) | (11,648 | ) | (12,841 | ) | |||||
| Change in fair value of detachable stock warrants | — | — | (13,687 | ) | |||||||
| Management fee to related party | (402 | ) | (511 | ) | (550 | ) | |||||
| Other, net | (240 | ) | 16 | (765 | ) | ||||||
| (11,299 | ) | (12,143 | ) | (27,843 | ) | ||||||
| (Loss) income before income taxes | 5,914 | 9,172 | (10,066 | ) | |||||||
| Income taxes | 2,673 | 3,589 | 1,533 | ||||||||
| Net (loss) income | $ | 3,241 | $ | 5,583 | $ | (11,599 | ) | ||||
| Net (loss) income per share—basic | $ | 16.14 | $ | 27.80 | $ | (52.48 | ) | ||||
| Net (loss) income per share—diluted | $ | 0.70 | $ | 0.99 | $ | (52.48 | ) | ||||
| Weighted average number of shares—basic | 200,800 | 200,800 | 221,022 | ||||||||
| Weighted average number of shares—diluted | 4,646,718 | 5,643,674 | 221,022 | ||||||||
See accompanying notes.
F-4
The Kenan Advantage Group, Inc.
Consolidated Statements of Stockholders' Equity
(Amounts in Thousands, except share data)
| | Convertible Preferred Stock | | | | | | | |||||||||||||||||
|---|---|---|---|---|---|---|---|---|---|---|---|---|---|---|---|---|---|---|---|---|---|---|---|---|
| | Common Stock | | | | | |||||||||||||||||||
| | | | Accumulated Other Comprehensive Loss | | ||||||||||||||||||||
| | Shares | Stated Value | Shares | Par Value | Additional Paid-in Capital | Retained Earnings | Total | |||||||||||||||||
| Balance at January 1, 2001 | 18,282 | $ | 18,050 | 200,800 | $ | — | $ | 200 | $ | 2,777 | $ | — | $ | 21,027 | ||||||||||
| Issuance of Class B Convertible Preferred stock | 26,276 | 26,276 | — | — | — | — | — | 26,276 | ||||||||||||||||
| Net income and comprehensive income | — | — | — | — | — | 3,241 | — | 3,241 | ||||||||||||||||
| Balance at December 31, 2001 | 44,558 | 44,326 | 200,800 | — | 200 | 6,018 | — | 50,544 | ||||||||||||||||
| Net income | — | — | — | — | — | 5,583 | — | 5,583 | ||||||||||||||||
| Change in fair value of interest rate swaps, net of tax of $489 | — | — | — | — | — | — | (766 | ) | (766 | ) | ||||||||||||||
| Comprehensive income | 4,817 | |||||||||||||||||||||||
| Balance at December 31, 2002 | 44,558 | 44,326 | 200,800 | — | 200 | 11,601 | (766 | ) | 55,361 | |||||||||||||||
| Issuance of common stock | — | — | 40,000 | — | 1,000 | — | — | 1,000 | ||||||||||||||||
| Net loss | — | — | — | — | — | (11,599 | ) | — | (11,599 | ) | ||||||||||||||
| Changes in fair value of interest rate swaps, net of tax of $369 | — | — | — | — | — | — | 577 | 577 | ||||||||||||||||
| Comprehensive loss | (10,022 | ) | ||||||||||||||||||||||
| Compensation expense related to stock options | — | — | — | — | 32 | — | 32 | |||||||||||||||||
| Balance at December 31, 2003 | 44,558 | $ | 44,326 | 240,800 | $ | — | $ | 1,232 | $ | 2 | $ | (189 | ) | $ | 45,371 | |||||||||
See accompanying notes.
F-5
The Kenan Advantage Group, Inc.
Consolidated Statements of Cash Flows
(Amounts in Thousands)
| | Years ended December 31, | |||||||||||
|---|---|---|---|---|---|---|---|---|---|---|---|---|
| | 2001 | 2002 | 2003 | |||||||||
| Operating activities | ||||||||||||
| Net (loss) income | $ | 3,241 | $ | 5,583 | $ | (11,599 | ) | |||||
| Adjustments to reconcile net (loss) income to net cash provided by operating activities: | ||||||||||||
| Depreciation and amortization | 11,674 | 13,514 | 19,074 | |||||||||
| Accretion of debt discount | 373 | 475 | 355 | |||||||||
| Compensation expense related to stock options | — | — | 32 | |||||||||
| Change in fair value of detachable stock warrants | — | — | 13,687 | |||||||||
| Loss on disposal of equipment | 333 | 158 | 846 | |||||||||
| Deferred income taxes | 2,233 | 3,148 | 1,540 | |||||||||
| Change in assets and liabilities, net of effect of acquisitions: | ||||||||||||
| Accounts receivable | 2,392 | (1,198 | ) | (5,740 | ) | |||||||
| Supplies | 381 | (406 | ) | (813 | ) | |||||||
| Prepaid expenses and other current assets | (3,024 | ) | (91 | ) | (813 | ) | ||||||
| Other assets | (634 | ) | (3,592 | ) | (1,227 | ) | ||||||
| Accounts payable | 1,582 | (918 | ) | 1,914 | ||||||||
| Accrued expenses and other liabilities | (111 | ) | (2,460 | ) | 4,993 | |||||||
| Net cash provided by operating activities | 18,440 | 14,213 | 22,249 | |||||||||
Investing activities | ||||||||||||
| Purchases of equipment | (9,084 | ) | (12,766 | ) | (18,412 | ) | ||||||
| Proceeds from sale of equipment | 844 | 1,307 | 2,560 | |||||||||
| Cash paid for acquisitions, net of cash acquired | (87,529 | ) | — | (45,993 | ) | |||||||
| Net cash used in investing activities | (95,769 | ) | (11,459 | ) | (61,845 | ) | ||||||
Financing activities | ||||||||||||
| Draw (payments) on revolving credit line, net | (5,050 | ) | — | 3,500 | ||||||||
| Proceeds from issuance of long-term debt | 70,023 | — | 50,000 | |||||||||
| Payments on long-term debt | (5,765 | ) | (3,825 | ) | (8,700 | ) | ||||||
| Debt issuance costs | (3,895 | ) | — | (1,612 | ) | |||||||
| Payments on capital lease obligations | (608 | ) | (881 | ) | (1,225 | ) | ||||||
| Proceeds from issuance of preferred stock | 24,600 | — | — | |||||||||
| Proceeds from issuance of detachable stock warrants | 2,587 | — | — | |||||||||
| Net cash provided by (used in) financing activities | 81,892 | (4,706 | ) | 41,963 | ||||||||
| Net increase (decrease) in cash and cash equivalents | 4,563 | (1,952 | ) | 2,367 | ||||||||
| Cash and cash equivalents at the beginning of the year | 845 | 5,408 | 3,456 | |||||||||
| Cash and cash equivalents at the end of the year | $ | 5,408 | $ | 3,456 | $ | 5,823 | ||||||
See accompanying notes.
F-6
The Kenan Advantage Group, Inc.
Notes to Consolidated Financial Statements
Years ended December 31, 2001, 2002 and 2003
(Dollars in Thousands, except for share and per share amounts)
1. Significant Accounting Policies
Description of Business
The Kenan Advantage Group and Subsidiaries (the Company) provides transportation services for petroleum-based products throughout most of the continental United States. The company operates in one operating segment, the transportation of fuels and other petroleum-based products.
Principles of Consolidation
The consolidated financial statements include the accounts and operations of The Kenan Advantage Group and its wholly owned subsidiaries. All intercompany accounts and transactions are eliminated upon consolidation.
Revenue Recognition
The Company recognizes revenue on the date of product delivery to consignee and when collectibility is reasonably assured. Related expenses are recognized as incurred.
Advertising Costs
The Company expenses advertising costs as they are incurred. Total advertising costs were $439, $467 and $617 for the years ended December 31, 2001, 2002 and 2003, respectively.
Cash Equivalents
The Company considers all highly liquid investments with a maturity of three months or less when purchased to be cash equivalents.
Property and Equipment
Equipment and leasehold improvements are stated at cost, net of accumulated depreciation and amortization. Equipment refurbishment costs that extend the equipment's useful life are capitalized, whereas maintenance and repairs are charged to expense as incurred. Depreciation and amortization are provided on the straight-line method over the estimated useful lives of the assets as follows:
| Asset | Estimated Useful Life | |
|---|---|---|
| Buildings | 39 years | |
| Tractors | 3–5 years | |
| Trailers | 5–15 years | |
| Shop and garage equipment | 5–10 years | |
| Service cars and equipment | 3–5 years | |
| Office furniture and fixtures | 5–10 years | |
| Leasehold improvements | 5–10 years |
Depreciation expense was $8,934, $12,671 and $17,772 for the years ended December 31, 2001, 2002 and 2003, respectively.
F-7
The Kenan Advantage Group, Inc.
Notes to Consolidated Financial Statements (Continued)
Years ended December 31, 2001, 2002 and 2003
(Dollars in Thousands, except for share and per share amounts)
1. Significant Accounting Policies (Continued)
Long-lived assets, other than goodwill, are reviewed utilizing relevant cash flow and profitability information if facts and circumstances indicate that a potential impairment of carrying value exists. The asset would be considered impaired when the future net undiscounted cash flows generated by the asset are less than its carrying value. An impairment loss would be recognized based on the amount by which the carrying value of the asset exceeds its fair value. No impairment charges were necessary to be recorded in 2001, 2002 or 2003.
Goodwill
Effective January 1, 2002, the Company adopted SFAS No. 142,Goodwill and Other Intangible Assets. Under the provisions of SFAS No. 142, the Company was required to perform a goodwill impairment test at the time of the adoption of the new standard and to test goodwill for impairment on an annual basis thereafter. The Company conducts its annual impairment assessment as of October 31. Under the provisions of SFAS No. 142 and SFAS No. 131,Disclosures about Segments of an Enterprise, the Company has identified a single reporting unit. For purposes of impairment testing, the Company determines the fair value of its reporting unit using discounted cash flows models and relative market multiples for comparable businesses. The Company compares the fair value of its reporting unit to its respective carrying value, including related goodwill. These tests resulted in no impairment of goodwill in 2002 and 2003.
In accordance with SFAS No. 142, the Company discontinued the amortization of goodwill effective January 1, 2002, at which time accumulated amortization was $3,934. Had goodwill amortization not been recorded in 2001, net income would have increased by $1,344 to $4,585. All of the Company's goodwill is deductible for tax purposes.
The changes in the carrying amount of goodwill for the year ended December 31, 2002 and 2003 are as follows:
| | 2002 | 2003 | |||||
|---|---|---|---|---|---|---|---|
| Balance at January 1 | $ | 91,184 | $ | 93,978 | |||
| Additions | 2,794 | 13,265 | |||||
| Balance at December 31 | $ | 93,978 | $ | 107,243 | |||
The increase in goodwill in 2003 is due to the acquisitions that are further described in Note 2.
The additions to goodwill in 2002 relate to the finalization of the purchase price allocation related to the Kenan Transport Company and Subsidiary (KTC) acquisition as follows: (a) the Company increased its Claims Payable liability by $1,384 (net of tax effect of $734) as actual experience related to pre-acquisition contingencies differed from the original reserve estimates; (b) employment termination negotiations were finalized for three former employees of KTC for which the Company recorded a severance liability of $367; (c) in 2002 the Company paid $414 of residual value guarantees related to capital leases acquired in the KTC acquisition that were not adjusted to fair value in the preliminary purchase price allocation; (d) $145 was paid in 2002 for legal and settlement costs related
F-8
The Kenan Advantage Group, Inc.
Notes to Consolidated Financial Statements (Continued)
Years ended December 31, 2001, 2002 and 2003
(Dollars in Thousands, except for share and per share amounts)
1. Significant Accounting Policies (Continued)
to pre-acquisition labor contingencies; (e) fair value adjustment of acquired assets of $233; and (f) in 2002 the Company paid other direct transaction costs of $251 related to the acquisition.
Intangible Assets Subject to Amortization
The Company has the following assets subject to amortization at December 31:
| | 2002 | 2003 | ||||||||||
|---|---|---|---|---|---|---|---|---|---|---|---|---|
| | Gross Carrying Amount | Accumulated Amortization | Gross Carrying Amount | Accumulated Amortization | ||||||||
| Deferred financing costs | $ | 5,477 | $ | 1,954 | $ | 7,454 | $ | 3,054 | ||||
| Trade name | — | — | 300 | 58 | ||||||||
| Non-compete agreements | — | — | 900 | 90 | ||||||||
| $ | 5,477 | $ | 1,954 | $ | 8,654 | $ | 3,202 | |||||
Deferred financing costs represent costs incurred in connection with executing the Company's debt agreements. The amounts are being amortized over the terms of the related debt, which ranges from five to eight years. The trade name is being amortized over 3 years, and the non-compete agreements are being amortized over the lives of the respective agreements (5 years).
Amortization expense for finite-lived intangible assets subject to amortization was $665, $843 and $1,248 for the years ended December 31, 2001, 2002 and 2003, respectively; and is estimated to be $1,654 for 2004 and 2005, $1,509 for 2006, $368 for 2007 and $35 for 2008.
Supplies
Supplies of fuel, tires, and parts are stated at the lower of cost (first-in, first-out method) or market.
Claims Payable
Claims payable represent the estimated cost of open claims that are retained and paid by the Company under its programs for workers' compensation, bodily injury and property damage. These estimates are based upon historical information along with certain assumptions about future cash flows. Changes in assumptions for such things as medical costs, environmental hazards, and legal actions, as well as changes in actual experience could cause these estimates to change. Any such changes would be recorded in operations in the period in which the change occurs. In the accompanying consolidated statements of operations, workers' compensation costs are included in wages and employee benefits expenses, and other claims costs are included in insurance and claims expense. The claims payable liabilities included in the accompanying balance sheets are $8,147 and $9,710 as of December 31, 2002 and 2003, respectively.
F-9
The Kenan Advantage Group, Inc.
Notes to Consolidated Financial Statements (Continued)
Years ended December 31, 2001, 2002 and 2003
(Dollars in Thousands, except for share and per share amounts)
1. Significant Accounting Policies (Continued)
Accrued Expenses
Accrued expenses consist of the following:
| | December 31, | |||||
|---|---|---|---|---|---|---|
| | 2002 | 2003 | ||||
| Claims payable, current portion | $ | 4,318 | $ | 5,136 | ||
| Compensation-related obligations | 11,278 | 16,184 | ||||
| Accrued interest | 1,361 | 2,226 | ||||
| Other accrued expenses | 1,022 | 5,372 | ||||
| $ | 17,979 | $ | 28,918 | |||
Stock-Based Compensation
The Company has elected to account for stock-based awards to its employees using the intrinsic value method in Accounting Principles Board Opinion (APB) No. 25,Accounting for Stock Issued to Employees, and related interpretations. Under APB No. 25, compensation expense is not recognized in the Company's financial statement if the exercise price of the stock options granted equals or is greater than the market price of the underlying stock on the date of grant.
The alternative policy in SFAS No. 123,Accounting for Stock-Based Compensation, provides that compensation expense be recognized based on the fair value of options awarded, determined by an option pricing model. If the Company had recognized compensation expense using the fair value method under SFAS No. 123 rather than APB 25, the effect on net income would have been as follows:
| | Years ended December 31, | ||||||||||
|---|---|---|---|---|---|---|---|---|---|---|---|
| | 2001 | 2002 | 2003 | ||||||||
| Net (loss) income as reported | $ | 3,241 | $ | 5,583 | $ | (11,599 | ) | ||||
| Add stock-based employee compensation expense, net of related taxes | — | — | 32 | ||||||||
| Deduct stock-based employee compensation expense determined under fair value based methods for all awards, net of related taxes | (250 | ) | (275 | ) | (240 | ) | |||||
| Pro forma net (loss) income | $ | 2,991 | $ | 5,308 | $ | (11,599 | ) | ||||
| Net (loss) income per share: | |||||||||||
| Basic—as reported | $ | 16.14 | $ | 27.80 | $ | (52.48 | ) | ||||
| Basic—pro forma | $ | 14.90 | $ | 26.43 | $ | (53.42 | ) | ||||
Diluted—as reported | $ | 0.70 | $ | 0.99 | $ | (52.48 | ) | ||||
| Diluted—pro forma | $ | 0.64 | $ | 0.94 | $ | (53.42 | ) | ||||
F-10
The Kenan Advantage Group, Inc.
Notes to Consolidated Financial Statements (Continued)
Years ended December 31, 2001, 2002 and 2003
(Dollars in Thousands, except for share and per share amounts)
1. Significant Accounting Policies (Continued)
The fair value was estimated at the date of grant using a Black-Scholes option pricing model with the following weighted average assumptions:
| | Years ended December 31, | ||||||
|---|---|---|---|---|---|---|---|
| | 2001 | 2002 | 2003 | ||||
| Risk-free interest rate | 5.5 | % | 3.9 | % | 4.0 | % | |
| Volatility | 65.0 | % | 61.0 | % | 59.0 | % | |
| Option life in years | 4 | 4 | 4 | ||||
| Dividend yield | — | — | — | ||||
Financial Instruments
The carrying value of accounts receivable and accounts payable are a reasonable estimate of their fair value due to the short-term nature of these instruments. The Company's Tranche A and B term loans have variable interest rates, therefore the carrying value approximates fair value at December 31, 2002 and 2003. The Senior Subordinated Notes have a fixed interest rate; however, due to the fact that there is no current market for these instruments, the fair value of these notes is not determinable. The carrying amount of the detachable stock warrant, subject to put option, approximates its fair value.
The Company uses interest rate swaps to reduce its exposure to market risks resulting from fluctuations in interest rates. The interest rate swaps are accounted for under SFAS No. 133 which requires that all derivative instruments be recognized in the financial statements and measured at fair value.
The interest rate swaps are accounted for as cash flow hedges, and changes in fair value are deferred and recorded in stockholders' equity as a component of accumulated other comprehensive loss. Any ineffectiveness associated with the interest rate swaps is recognized immediately in earnings. The Company does not enter into financial instruments for trading or speculative purposes.
Concentration of Credit Risk
The Company sells services and extends credit based on an evaluation of the customer's financial condition, without requiring collateral. The company's policy is to identify all specific customers that are considered a probable collection risk based upon the customer's financial condition, payment history, credit rating and other relevant factors and to reserve for the portion of those outstanding balances that collection does not appear likely. If the financial condition of the Company's customers were to deteriorate, resulting in an inability to make payments, additional allowances may be required.
In 2003, the Company wrote off $634 of uncollectible accounts, recognized $544 in bad debt expense and had an allowance for bad debts of $1,554. In 2002, the Company wrote off $118 of uncollectible accounts, recognized $952 in bed debt expense and had an allowance for bad debts of $1,644. Finally, in 2001, the Company wrote off $616 of uncollectible accounts, recognized $1,346 in bad debt expense and had an allowance for bad debts of $810.
F-11
The Kenan Advantage Group, Inc.
Notes to Consolidated Financial Statements (Continued)
Years ended December 31, 2001, 2002 and 2003
(Dollars in Thousands, except for share and per share amounts)
1. Significant Accounting Policies (Continued)
Sales to the Company's ten largest customers represented approximately 45% of total revenue in 2001, 48% in 2002 and 56% in 2003, with the largest customer representing approximately 10%, 16% and 11% of total revenue in 2001, 2002 and 2003, respectively.
Income Taxes
Deferred income taxes are provided for the temporary differences between the financial reporting basis and tax basis of the Company's assets and liabilities.
Net (Loss) Income Per Share
Basic net (loss) income per share is computed by dividing income available to common stockholders by the weighted-average number of common shares outstanding for the period. Diluted net (loss) income per share reflects the potential dilution that could occur if securities or other contracts to issue common stock were exercised or converted into common stock. No adjustments were necessary to reported net income in the calculation of net (loss) income available to common stockholders—basic and diluted. The following table sets forth the computation of basic net (loss) income per share and diluted net (loss) income per share:
| | Years ended December 31, | ||||||||||
|---|---|---|---|---|---|---|---|---|---|---|---|
| | 2001 | 2002 | 2003 | ||||||||
| Numerator: | |||||||||||
| Net (loss) income | $ | 3,241 | $ | 5,583 | $ | (11,599 | ) | ||||
Denominator: | |||||||||||
| Weighted average number of shares | 200,800 | 200,800 | 221,022 | ||||||||
| Effect of dilutive securities | 309,974 | 309,974 | — | ||||||||
| Effect of convertible securities | 4,135,944 | 5,132,900 | — | ||||||||
| Weighted average number of shares—diluted | 4,646,718 | 5,643,674 | 221,022 | ||||||||
| Net (loss) income per share—basic | $ | 16.14 | $ | 27.80 | $ | (52.48 | ) | ||||
| Net (loss) income per share—diluted | $ | 0.70 | $ | 0.99 | $ | (52.48 | ) | ||||
Upon successful completion of an initial public offering, the conversion of the Company's Convertible Preferred Stock is subject to the adjustment feature described in Note 6.
Due to the charge related to the change in the fair value of the warrants in 2003, shares totaling 5,543,479 were not included in the fully diluted computation for 2003 because they would have been antidilutive. Therefore diluted and basic net loss per share are the same for 2003.
New Accounting Pronouncements
In June 2002, the Financial Accounting Standards Board (FASB) issued SFAS No. 146Accounting for Costs Associated with Exit or Disposal Activities, which addresses financial accounting and reporting for costs associated with exit or disposal activities. The provisions of this statement, which are effective
F-12
The Kenan Advantage Group, Inc.
Notes to Consolidated Financial Statements (Continued)
Years ended December 31, 2001, 2002 and 2003
(Dollars in Thousands, except for share and per share amounts)
1. Significant Accounting Policies (Continued)
for exit or disposal activities that are initiated after December 31, 2002, require expenses to be recorded when the liability is incurred, rather than when management commits and announces a plan to exit, dispose or restructure a business. The adoption of SFAS No. 146 did not have a material impact on the Company's financial position, results of operations or cash flows.
In May 2003, the FASB issued SFAS No. 150,Accounting for Financial Instruments with Characteristics of both Liabilities and Equity. This statement establishes standards for classifying and measuring certain financial instruments that embody obligations of the issuer and have characteristics of both liabilities and equity. Instruments that are indexed to and potentially settled in an issuer's own shares that are not within the scope of SFAS No. 150 remain subject to existing guidance. SFAS No. 150 is effective for the Company for interim periods beginning after June 15, 2003. The adoption of SFAS No. 150 did not result in a significant impact on the Company's results of operations, financial position or cash flows as the Company's detachable stock warrants, subject to put option, were historically accounted for as a liability under existing accounting guidance.
Use of Estimates
The preparation of financial statements in conformity with accounting principles generally accepted in the United States requires management to make estimates and assumptions that affect the amounts reported in the financial statements and the accompanying notes. Actual results could differ from those estimates.
Reclassifications
Certain 2002 and 2001 amounts have been reclassified to conform to the 2003 presentation.
2. Business Acquisitions
On May 31, 2003, the Company acquired certain assets and assumed certain liabilities of the trucking business of Beneto Tank Lines, Inc. (Beneto) for aggregate consideration of $32,890, consisting of $31,366 in cash and a note payable to the former owner of $1,524. Beneto provides transportation services for petroleum-based products primarily in California, Nevada and Arizona.
On June 29, 2003, the Company acquired the assets and assumed certain liabilities of Carl Klemm Tank Lines, Inc. (Klemm) for consideration of $18,367, consisting of $17,367 in cash (including contingent consideration of $2,740 to be paid in 2004) and $1,000 in the Company's common stock (40,000 shares at $25 per share). Klemm provides transportation services for petroleum-based products primarily in Wisconsin, Illinois and Indiana. Under the terms of the Klemm acquisition agreement, the Company is required to make additional payments up to $4,740, contingent upon the achievement of specified operating results through fiscal 2004 ($2,740 in 2003 and $2,000 in 2004). The specified operating results for 2003 were met. The contingent payments are accounted for as additional consideration in connection with the acquisition.
The assets acquired and liabilities assumed for each of the acquisitions were recorded at their estimated fair values on the acquisition date and the excess of the purchase price over the fair value of the net assets acquired of $5,585 and $7,680 was recorded as goodwill for Beneto and Klemm,
F-13
The Kenan Advantage Group, Inc.
Notes to Consolidated Financial Statements (Continued)
Years ended December 31, 2001, 2002 and 2003
(Dollars in Thousands, except for share and per share amounts)
2. Business Acquisitions (Continued)
respectively. The purchase price allocations for each of the acquired companies are preliminary pending the valuation of certain acquired identifiable intangible assets. The Company expects to complete these valuations in first half of 2004.
The following table summarizes the preliminary estimated fair values of the assets acquired and the liabilities assumed as of the dates of the respective acquisitions:
| | Beneto May 31, 2003 | Klemm June 29, 2003 | |||||
|---|---|---|---|---|---|---|---|
| Assets: | |||||||
| Current assets | $ | 2,725 | $ | 5,026 | |||
| Property and equipment | 24,635 | 9,199 | |||||
| Identifiable intangible assets subject to amortization | 800 | 400 | |||||
| Goodwill | 5,585 | 7,680 | |||||
| Total assets acquired | 33,745 | 22,305 | |||||
| Total liabilities assumed | 855 | 3,938 | |||||
| Net assets acquired | $ | 32,890 | $ | 18,367 | |||
The following unaudited pro forma condensed financial information presents the combined results of operations of the Company, as if the Beneto and Klemm acquisitions had occurred at the beginning of the periods presented. The unaudited pro forma condensed financial information does not purport to be indicative of the actual results that would have been reported if the acquisitions had occurred as of the beginning of the period presented or the actual results that may be reported in the future:
| | Pro Forma Results of Operations for the Year Ended December 31, | ||||||
|---|---|---|---|---|---|---|---|
| | 2002 | 2003 | |||||
| Revenue | $ | 384,254 | $ | 415,621 | |||
| Operating expenses | 353,705 | 396,200 | |||||
| Operating income | $ | 30,549 | $ | 19,421 | |||
| Net (loss) income | $ | 9,311 | $ | (11,273 | ) | ||
| Net income (loss) per share—basic | $ | 46.37 | $ | (51,00 | ) | ||
| Net income (loss) per share—diluted | $ | 1.65 | $ | (51.00 | ) | ||
On April 30, 2001, the Company acquired Kenan Transport Company and Subsidiary (KTC) for aggregate consideration of $93,955 consisting of cash of $90,757 and the Company's Series B convertible preferred stock valued at $1,676, adjusted for cash acquired of $4,478 and debt assumed of $6,000. The net cash consideration was financed with additional borrowings under the Company's Senior Credit Agreement and Senior Subordinated Credit Agreement, with proceeds from the issuance of 24,600 shares of the Company's Series B convertible preferred stock for $1,000 per share, totaling $24,600, and with acquired cash. The $6,000 of KTC debt assumed was paid-off on the acquisition date
F-14
The Kenan Advantage Group, Inc.
Notes to Consolidated Financial Statements (Continued)
Years ended December 31, 2001, 2002 and 2003
(Dollars in Thousands, except for share and per share amounts)
2. Business Acquisitions (Continued)
with incremental borrowings under the Senior Credit Agreement. KTC, a public company before the acquisition, provides transportation services for petroleum-based products in the Southeast United States. KTC's wholly-owned subsidiary, Petro-Chemical Transport, Inc. provides transportation services for petroleum-based products in the Southeast, Midwest, and the West Coast. The assets acquired and liabilities assumed were recorded at their estimated fair values on the acquisition date and the excess of the purchase price over the fair value of net assets acquired of $41,320 was recorded as goodwill.
The following table summarizes the fair value of the assets acquired and the liabilities assumed in connection with the KTC acquisition:
| | KTC April 30, 2001 | |||
|---|---|---|---|---|
| Assets: | ||||
| Current assets | $ | 25,162 | ||
| Property and equipment | 73,947 | |||
| Goodwill | 41,320 | |||
| Total assets acquired | 140,429 | |||
| Total liabilities assumed | 46,474 | |||
| Net assets acquired | $ | 93,955 | ||
The Company also acquired GENI Transport, Inc. (GENI) from Williams Energy on January 1, 2001, for $1,250 in cash. The assets acquired and liabilities assumed were recorded at their estimated fair values on the acquisition date and the excess of the purchase price over the fair value of net assets acquired of $975 was recorded as goodwill. The fair value of the assets acquired and liabilities assumed in connection with the GENI acquisitions are as follows: (a) property and equipment of $588, and (b) current liabilities of $1,563.
Each of the acquisitions have been accounted for under the purchase method of accounting, and the consolidated statements of operations of the Company include the results of operations of the acquired businesses for the period subsequent to the effective dates of the respective acquisitions.
F-15
The Kenan Advantage Group, Inc.
Notes to Consolidated Financial Statements (Continued)
Years ended December 31, 2001, 2002 and 2003
(Dollars in Thousands, except for share and per share amounts)
3. Long-Term Debt
Long-term debt consists of the following:
| | December 31, | |||||
|---|---|---|---|---|---|---|
| | 2002 | 2003 | ||||
| Senior Amended and Restated Credit Agreement—Tranche A Term Loan, bearing interest at rates that vary at the Company's election each fiscal quarter ranging from either LIBOR plus 3.5% or Prime plus 2.5% (4.9% and 4.67% weighted average rates at December 31, 2002 and 2003, respectively), payable quarterly. Principal to be repaid in quarterly installments totaling $10,125, $12,375, and $6,750 in 2004, 2005, and 2006, respectively. | $ | 37,125 | $ | 29,250 | ||
Senior Amended and Restated Credit Agreement—Original Tranche B Term Loan, bearing interest at rates which vary at the Company's election each fiscal quarter ranging from either LIBOR plus 4.0% or Prime plus 3.0% (5.75% and 5.14% weighted average rates at December 31, 2002 and 2003, respectively), payable quarterly. Principal to be repaid in 20 installments on the last day of each calendar quarter with total payments of $450 in 2004 and 2005 increasing to $10,350 in 2006 and $32,625 in 2007. | 44,325 | 43,875 | ||||
Senior Amended and Restated Credit Agreement—Additional Tranche B Term Loan, bearing interest at rates which vary at the Company's election each fiscal quarter ranging from either LIBOR plus 4.0% or Prime plus 3.0% (5.14% weighted average rate at December 31, 2003), payable quarterly. Principal to be repaid in 20 installments on the last day of each calendar quarter with total payments of $500 in each of 2004 through 2006 increasing to $48,125 in 2007. | — | 49,625 | ||||
Senior Subordinated Notes, net of unamortized original issue discount of $3,055 and $2,700 at December 31, 2002 and 2003, respectively, bearing interest at 12.5% per annum payable quarterly. Total principal is due on April 30, 2009. | 36,195 | 36,550 | ||||
| Total | 117,645 | 159,300 | ||||
| Less current portion | 8,325 | 11,075 | ||||
| Long-term debt | $ | 109,320 | $ | 148,225 | ||
The Company substantially financed the acquisition of Beneto and Klemm by amending its Senior Credit Agreement and executing an Amended and Restated Credit Agreement (the Senior Restated Agreement). The amendments to the Senior Credit Agreement increased the Company's total availability by creating an additional Tranche B term loan of $50,000 and increased the amount available under the Revolving Credit Line to $20,000.
The Revolving Credit Line provides for borrowings up to $20,000 under a revolving line-of-credit expiring at April 30, 2006. Borrowings on this facility bear interest, payable quarterly, at rates that vary upon the Company's election ranging from LIBOR plus 3.5% to Prime plus 2.5% (6.50% weighted average rate at December 31, 2003). Availability under this facility is restricted to 85% of the
F-16
The Kenan Advantage Group, Inc.
Notes to Consolidated Financial Statements (Continued)
Years ended December 31, 2001, 2002 and 2003
(Dollars in Thousands, except for share and per share amounts)
3. Long-Term Debt (Continued)
Company's eligible accounts receivable, further reduced by outstanding letters of credit. At December 31, 2003, $3,500 was outstanding and a commitment fee of 0.5% is payable quarterly on the unused availability of $4.1 million. Outstanding letters of credit at December 31, were $6,675 and $12,432 for 2002 and 2003, respectively.
The Senior Restated Agreement contains restrictive covenants including the maintenance of current and tangible asset ratios, certain financial ratios regarding leverage, fixed charges and interest coverage, and limitations on operating leases and indebtedness and payments of dividends. As of December 31, 2003, the Company was in compliance with all of its debt covenant requirements. The Senior Restated Agreement is guaranteed by all of the Company's subsidiaries and collateralized by substantially all of its assets.
The Company paid the Senior Lender an annual agency fee to administer the Senior Credit Agreement of $75 in 2001 and $50 in 2002 and 2003.
The Company substantially financed the acquisition of KTC on April 30, 2001 by amending its Senior Credit Agreement and executing an Amended and Restated Credit Agreement (the First Senior Restated Agreement) to provide for additional availability and by issuing additional Senior Subordinated Notes under its Senior Subordinated Debt Agreement. The amendments to the First Senior Credit Agreement increased the Company's total availability by creating Tranche A and B term loans of $45,000 each and a $15,000 Revolving Credit Line.
Also on April 30, 2001, the Company issued $26,000 of Senior Subordinated Notes and modified the terms of the existing $13,250 of Senior Subordinated Notes to conform with the terms of the new notes. The total $39,250 of Senior Subordinated Notes bear interest at the rate of 12.5% per annum and the total outstanding amount is due on April 30, 2009. Interest is payable in arrears on the last business day of each calendar quarter. The proceeds from the issuance of these notes were used to partially finance the acquisition of KTC. The Senior Subordinated Notes are guaranteed by all of the Company's subsidiaries.
In connection with the issuance of the 2001 Senior Subordinated Notes, the Company issued detachable warrants to the lenders (the 2001 Warrants). The 2001 Warrants have certain anti-dilution provisions and provide the lenders the option to purchase 3,844 shares of the Company's Series D convertible preferred stock at $0.01 per share. The warrants also provide, upon certain defined events, for the warrant option to include up to 25,149 shares of the Company's common stock for $0.001 per share. The 2001 Warrants were valued at approximately $2,587 based on their estimated fair value of the proceeds of the 2001 Senior Subordinated Notes on the issuance date which was recorded as an Original Issue Discount (OID).
Also, in connection with the issuance of the $12,000 and $1,250 in Senior Subordinated Notes in 1998 and 2000, respectively, the Company issued detachable stock warrants to the lender. The warrants carry certain anti-dilution provisions and provide the lender the option to purchase 2,887 shares of the Company's Series D convertible preferred stock at $0.01 per share. These warrants also provide, upon certain defined events, for the warrant option to include up to 18,888 shares of the Company's common stock for $0.001 per share. These warrants were valued at approximately $1,656 based upon their estimated fair value of the proceeds from the notes on the issuance date, which was recorded as an
F-17
The Kenan Advantage Group, Inc.
Notes to Consolidated Financial Statements (Continued)
Years ended December 31, 2001, 2002 and 2003
(Dollars in Thousands, except for share and per share amounts)
3. Long-Term Debt (Continued)
OID. In connection with the modification of the terms of the 1998 and 2000 Senior Subordinated Notes, as described above, the terms of these warrants were modified to conform with the terms of the 2001 warrants. The conversion features of the Company's Series D preferred stock are described in Note 6.
At issuance, the fair value of the warrants was estimated based upon management's assumptions applied to future earnings of the Company and related values assigned to other series of the Company's preferred stock. The resulting OID is being amortized over the life of the notes as non-cash imputed interest. The OID is based on an effective interest rate on the notes ranging from 14.6% to 15.3%.
The warrants may be exercised at any time through April 30, 2011, and the warrant holder has a put option to sell the warrant shares to the Company for cash at a price based on a fair market value of the Series D convertible preferred stock, as determined by an independent third party appraisal on the date of exercise, beginning with the earlier of (i) April 30, 2006; (ii) a change in control of the Company; (iii) the sale of the Company or a substantial change in the type of business conducted by the Company; (iv) the Company's default of the Subordinated Debt Agreement; or (v) the date of full repayment of the subordinated notes. Upon exercise, the put option is required to be settled in cash. If not exercised prior, the put option would expire upon the Company's successful completion of an initial public offering. At December 31, 2003 and 2002, the Company has reserved for future issuance shares of Series D Convertible Preferred Stock and common stock sufficient to satisfy execution of the warrants.
For financial reporting purposes, the aggregate fair value of the warrants, including the put option, was estimated to be $4,243 and $17,930 at December 31, 2002 and 2003, respectively, and is classified as "detachable stock warrants, subject to put option" within total liabilities on the accompanying consolidated balance sheets. The fair market value of the warrants including the put option is reassessed periodically based upon management's assumptions applied to future earnings of the Company and related values assigned to other series of the Company's preferred stock. Any change in the fair value is recorded through earnings, and a change in the fair value of the Company's equity would have a corresponding change in the fair value of the warrants. The underlying agreements do not limit the maximum fair value that could be assigned to the warrants. In 2003, the Company recorded a non-cash charge of $13,687 as a result of the increased fair value of the detachable stock warrants subject to the put option. There were no changes in the fair value of the detachable stock warrants in 2001 or 2002.
In March 2002, the Company entered into two interest rate swap agreements with major commercial banks to fix the variable interest rate on its Tranche A term loan. These agreements require the Company to pay a fixed interest rate to the counterparties while receiving a floating interest based on LIBOR. The interest rate swaps fix the Company's interest cost at a rate of 7.54% on a notional amount of $28,125 as of December 31, 2003. The agreements will mature on March 31, 2004, and qualify as cash flow hedges. There is no ineffectiveness associated with these hedges as the interest payment dates and interest reset dates of the interest swaps match the terms of the hedged item. If the Company made different interest rate elections, as permitted under the terms of the Tranche A term loan, hedge ineffectiveness may exist and would be measured using the hypothetical derivative method.
F-18
The Kenan Advantage Group, Inc.
Notes to Consolidated Financial Statements (Continued)
Years ended December 31, 2001, 2002 and 2003
(Dollars in Thousands, except for share and per share amounts)
3. Long-Term Debt (Continued)
Any hedge ineffectiveness would be recognized as a charge to operations in the period of the change in interest election. The fair market value of the interest rate swaps are recorded as a non-current liability with the offsetting adjustment to other comprehensive loss in the consolidated balance sheets. The change in the fair value was a charge of $1,255 ($766 net of tax) and a credit of $946 ($577 net of tax) for the year ended December 31, 2002 and 2003.
Maturities of long-term debt for the next five years are: $11,075 in 2004, $13,325 in 2005, $17,600 in 2006, $80,750 in 2007, $0 in 2008, and $39,250 thereafter. Interest paid was approximately $12,836, $12,448 and $9,931 in 2003, 2002 and 2001, respectively.
4. Equipment and Leasehold Improvements
Equipment and leasehold improvements consist of the following:
| | December 31, | |||||
|---|---|---|---|---|---|---|
| | 2002 | 2003 | ||||
| Land | $ | 3,947 | $ | 3,947 | ||
| Buildings | 11,022 | 11,132 | ||||
| Tractors | 46,656 | 67,349 | ||||
| Trailers | 51,880 | 76,674 | ||||
| Shop and garage equipment | 2,470 | 1,501 | ||||
| Service cars and equipment | 849 | 2,135 | ||||
| Office furniture and fixtures | 2,168 | 3,589 | ||||
| Leasehold improvements | 728 | 834 | ||||
| 119,720 | 167,161 | |||||
| Less accumulated depreciation | 24,178 | 40,247 | ||||
| Property and equipment, net | $ | 95,542 | $ | 126,914 | ||
5. Income Taxes
The components of the provision for income taxes were as follows for the years ended December 31:
| | 2001 | 2002 | 2003 | |||||||
|---|---|---|---|---|---|---|---|---|---|---|
| Current—State | $ | 440 | $ | 441 | $ | (7 | ) | |||
| Deferred—Federal | 2,233 | 3,148 | 1,540 | |||||||
| Total provision for income taxes | $ | 2,673 | $ | 3,589 | $ | 1,533 | ||||
F-19
The Kenan Advantage Group, Inc.
Notes to Consolidated Financial Statements (Continued)
Years ended December 31, 2001, 2002 and 2003
(Dollars in Thousands, except for share and per share amounts)
5. Income Taxes (Continued)
A reconciliation of statutory federal income taxes and the amount reported as income tax expense for the year ended December 31 follows:
| | 2001 | 2002 | 2003 | |||||||
|---|---|---|---|---|---|---|---|---|---|---|
| Federal statutory income taxes | $ | 2,070 | $ | 3,210 | $ | (4,060 | ) | |||
| Change in fair value of detachable stock warrant | — | — | 5,324 | |||||||
| Goodwill | 193 | — | — | |||||||
| State and local income taxes | 286 | 287 | 209 | |||||||
| Meals and entertainment | 88 | 99 | 85 | |||||||
| Other | 36 | (7 | ) | (25 | ) | |||||
| Provision for income taxes | $ | 2,673 | $ | 3,589 | $ | 1,533 | ||||
| Effective income tax rate | 45 | % | 39 | % | N/A | |||||
The significant components of deferred income tax assets and liabilities were as follows:
| | December 31, | ||||||
|---|---|---|---|---|---|---|---|
| | 2002 | 2003 | |||||
| Deferred tax assets: | |||||||
| Self insurance reserves | $ | 3,178 | $ | 3,768 | |||
| Other accrued expenses | 1,574 | 2,724 | |||||
| Tax loss and minimum tax carryforward | 7,946 | 9,784 | |||||
| Other | 509 | 121 | |||||
| Total deferred tax assets | 13,207 | 16,397 | |||||
Deferred tax liabilities: | |||||||
| Goodwill amortization | 4,397 | 6,325 | |||||
| Depreciation | 24,447 | 27,157 | |||||
| Other | 2,050 | 2,511 | |||||
| Total deferred tax liabilities | 30,894 | 35,993 | |||||
| Net deferred tax liabilities | $ | 17,687 | $ | 19,596 | |||
At December 31, 2003, the Company has Federal net operating loss carryforwards of approximately $23 million available to offset future taxable income through 2020. As of December 31, 2003 and 2002, the Company has also recorded a deferred tax asset for a minimum tax credit carryover of $479. The Company has recorded deferred tax assets attributable to state net operating loss carryforwards of $1,410 and $985, as of December 31, 2003 and 2002, respectively. Income taxes paid during 2003, 2002 and 2001 were approximately $176, $625 and $65, respectively.
F-20
The Kenan Advantage Group, Inc.
Notes to Consolidated Financial Statements (Continued)
Years ended December 31, 2001, 2002 and 2003
(Dollars in Thousands, except for share and per share amounts)
6. Preferred Stock
The Company's preferred stock at December 31, 2002 and 2003 consists of the following:
| Preferred Stock Class | Shares Authorized | Shares Issued and Outstanding | Stated Value | ||||
|---|---|---|---|---|---|---|---|
| Series A Convertible Preferred Stock | 3,352 | 3,352 | $ | 2,900 | |||
| Series B Convertible Preferred Stock | 40,000 | 39,926 | 39,926 | ||||
| Series C Convertible Preferred Stock | 1,280 | 1,280 | 1,500 | ||||
| Series D Convertible Preferred Stock | 8,000 | — | — | ||||
| Series E Convertible Preferred Stock | — | — | — | ||||
| Undesignated Preferred Stock | 7,368 | — | — | ||||
| 60,000 | 44,558 | $ | 44,326 | ||||
All preferred stock has a par value of $0.001.
Series A, B and D Convertible Preferred Stock (Founders' Preferred Stock) shares have a liquidation preference over Series C Convertible Preferred Stock and common shares. Series A and B Convertible Preferred shares at per share liquidation values of $865.15 and $1,000, respectively, carry a liquidation preference over the Series D Convertible Preferred shares. Series D Convertible Preferred shares carry a liquidation value of $853.46 per share and the per share liquidation amount of Series C Convertible Preferred shares is the lesser of $1,172 or the quotient determined by dividing 14.86% of the remaining amount, if any, available for distribution after payment of the respective liquidation amounts of the Founders' Preferred Stock by the number Series C Convertible Preferred shares then outstanding.
All preferred shares are convertible into common shares at any time after issuance on a 1:100 basis, subject to adjustment. All shares of preferred stock outstanding are automatically converted, subject to the conversion provisions, upon a qualifying initial public offering of the Company's equity securities (the "Adjustment Feature"). Upon completion of an initial public offering, all convertible preferred stock shares will automatically convert to the number of common shares equal to the sum of (a) number of common shares converted at the original 1:100 conversion rate; and (b) the number of shares equal to the applicable liquidation value per share divided by the initial public offering price. The Adjustment Feature represents a beneficial conversion option to the existing convertible preferred stock holders that will be recorded as a preferred stock dividend upon successful completion of an initial public offering. At December 31, 2003 and 2002, the Company has reserved for future issuance common shares sufficient to effect conversion of the preferred stock.
All preferred shares have voting rights equal to common shares on a basis as if the preferred shares were converted to the Company's common stock subject to the related conversion rights and price. There is no stated dividend rate on the preferred shares, and dividends are payable, when and if declared on the Company's common stock, to the holders of the preferred stock as if the preferred stock were converted to the Company's common stock subject to the related conversion rights and price.
F-21
The Kenan Advantage Group, Inc.
Notes to Consolidated Financial Statements (Continued)
Years ended December 31, 2001, 2002 and 2003
(Dollars in Thousands, except for share and per share amounts)
7. Management Fee
The Company pays an annual management fee for investment advisory banking services to a company affiliated with certain Stockholders. Approximately $402, $511 and $550 was paid in 2001, 2002 and 2003, respectively under this arrangement. Also see Note 10.
8. Retirement Plans
The Company sponsors several 401(k) plans and profit sharing plans covering substantially all employees. Under the plans, the Company contributes amounts that match certain percentages of the participants' voluntary contributions. Company contributions charged to expense totaled $2,429, $2,558 and $3,164 for the years ended December 31, 2001, 2002 and 2003, respectively.
9. Stock Options
The Company can grant options to purchase the Company's common shares to senior management under various stock option and contingent stock option plans ratified by the Stockholders. The options generally become exercisable over four years and have a contractual life of ten years.
Information relating to the Company's outstanding options is as follows:
| | Options Outstanding | Weighted Average Exercise Price | Weighted Average Grant Date Fair Value | ||||||
|---|---|---|---|---|---|---|---|---|---|
| Balance at January 1, 2001 | 546,500 | $ | 1.35 | $ | 0.70 | ||||
| Granted | 286,493 | 10.00 | 5.39 | ||||||
| Balance at December 31, 2001 | 832,993 | $ | 4.33 | $ | 2.31 | ||||
| Forfeited | (25,000 | ) | 10.00 | 5.39 | |||||
| Balance at December 31, 2002 | 807,993 | $ | 4.15 | $ | 2.22 | ||||
| Granted | 86,150 | 10.00 | 7.80 | ||||||
| Forfeited | (31,550 | ) | 10.00 | 5.52 | |||||
| Balance at December 31, 2003 | 862,593 | $ | 4.52 | $ | 2.65 | ||||
The following table summarizes options outstanding and exercisable by exercise prices at December 31, 2003:
| Exercise Prices | Number of Options Outstanding | Weighted- Average Remaining Contractual Life (years) | Number of Options Exercisable | |||
|---|---|---|---|---|---|---|
| $1.00 | 525,100 | 5.3 | 203,100 | |||
| 10.00 | 337,493 | 7.4 | 130,746 | |||
| 862,593 | 6.1 | 333,846 | ||||
F-22
The Kenan Advantage Group, Inc.
Notes to Consolidated Financial Statements (Continued)
Years ended December 31, 2001, 2002 and 2003
(Dollars in Thousands, except for share and per share amounts)
9. Stock Options (Continued)
Options exercisable were 73,900, 268,473 and 333,846 at December 31, 2001, 2002 and 2003, respectively. As of December 31, 2003, none of the options have been exercised and the Company had 100,746, 127,696 and 49,746 common shares reserved for future grants as of December 31, 2001, 2002 and 2003, respectively.
In 2003, the Company granted 76,150 options with exercise prices that were less than the fair value of the Company's stock on the date of grant. The remaining options granted in 2003 were granted with exercise prices equal to the estimated market value of the Company's stock at the date of grant. Compensation expense of $32, net of tax, was recognized in 2003. The Company will recognize the remaining compensation expense on a straight-line basis over the options' four-year vesting period.
10. Commitments and Contingencies
Lease Commitments
The Company leases certain tractors under agreements classified as capital leases. Leased assets included in equipment at December 31, 2003 totaled $740, net of accumulated amortization of $333. Leased assets included in equipment at December 31, 2002 totaled $2,604, net of accumulated amortization of $862.
The Company is committed under operating leases for two buildings from related parties. Under these leases, the Company is obligated to pay all insurance, real estate taxes, utilities, and repairs and maintenance relating to the property being leased. In addition, the Company is committed under various other operating lease arrangements for facilities, machinery, vehicles, and office equipment. The minimum annual lease payments under these capital and operating lease arrangements are as follows at December 31, 2003:
| | | Operating Leases | ||||||||||
|---|---|---|---|---|---|---|---|---|---|---|---|---|
| | Capital Leases | Related Party | Other | Total | ||||||||
| 2004 | $ | 490 | $ | 527 | $ | 6,783 | $ | 7,800 | ||||
| 2005 | — | 499 | 5,850 | 6,349 | ||||||||
| 2006 | — | 494 | 3,960 | 4,454 | ||||||||
| 2007 | — | 410 | 2,272 | 2,682 | ||||||||
| 2008 | — | 375 | 884 | 1,259 | ||||||||
| Thereafter | — | 33 | 242 | 275 | ||||||||
| Total minimum lease payments | 490 | $ | 2,338 | $ | 19,991 | $ | 22,819 | |||||
| Amounts representing interest | 5 | |||||||||||
| Present value of future minimum lease payments | 485 | |||||||||||
| Less current maturities | 485 | |||||||||||
| Non-current capital lease obligations | $ | — | ||||||||||
F-23
The Kenan Advantage Group, Inc.
Notes to Consolidated Financial Statements (Continued)
Years ended December 31, 2001, 2002 and 2003
(Dollars in Thousands, except for share and per share amounts)
10. Commitments and Contingencies (Continued)
Rental expense is charged to "Fuel and other operating expenses" on the consolidated statements of income. Actual rental expense is as follows:
| | Related Party | Other | Total | ||||||
|---|---|---|---|---|---|---|---|---|---|
| 2001 | $ | 210 | $ | 2,371 | $ | 2,581 | |||
| 2002 | 336 | 2,784 | 3,120 | ||||||
| 2003 | 312 | 4,081 | 4,393 | ||||||
Litigation
In the ordinary course of business, the Company is the subject of, or party to, pending or threatened litigation, assessments, and claims. While it is not possible to predict with certainty the outcome of such matters individually or in the aggregate, management believes that the ultimate result will not have a material adverse effect on the consolidated financial position, results of operations or cash flows of the Company.
On January 13, 2004, one of the Company's tanker trucks ran off an overpass onto a major highway outside Baltimore, Maryland, triggering an explosion and crash involving several other vehicles. The accident resulted in four fatalities. The National Transportation Safety Board is currently investigating the accident. Management anticipates that claims will be made against the Company as a result of the accident. The Company is self-insured for the first $500,000 of this incident, and insurance will cover up to $30 million of any claims in excess of its self-insured retention. The Company cannot predict the extent of claims not covered under its insurance policies and cannot provide any assurance that this claim will not have a material effect on its operating results.
Environmental Matters
The Company's activities involve the handling and transportation of bulk fuels and other petroleum-based products, many of which are classified as hazardous materials. The Company's terminal operations engage in the discharge of stormwater that may contain hazardous substances, and from time to time the Company stores diesel fuel and other petroleum products at terminals. As such, the Company is subject to environmental, health and safety laws and regulation by the U.S. federal, state and local government authorities. Environmental laws and regulations are complex, change frequently and have tended to become more stringent over time. There can be no assurance that such laws and regulations will not change in a manner that could impose material costs to the Company. From time to time, the Company has incurred remedial costs with respect to spills and releases at its facilities and, notwithstanding the existence of its environmental management program, the Company cannot assure that such obligations will not be incurred in the future.
The Company has environmental management programs that it carries out in conjunction with its safety program. Facility managers are responsible for environmental compliance. Self-audits are required to address operations, safety training and procedures, equipment and grounds maintenance, emergency response capabilities, and wastewater management.
F-24
The Kenan Advantage Group, Inc.
Notes to Consolidated Financial Statements (Continued)
Years ended December 31, 2001, 2002 and 2003
(Dollars in Thousands, except for share and per share amounts)
11. Subsequent Events (unaudited)
On July 13, 2004, the Company amended its credit facility to increase the amount of term loans outstanding under the facility to $130 million and to increase availability under the revolving credit facility to $50 million, with a letter of credit subfacility of $30 million. The revolving credit portion of the facility expires on October 30, 2008 (June 30, 2009 if the Company's subordinated notes are repaid or refinanced prior to July 30, 2008). Term loans are payable in quarterly installments totaling $650,000 for the remainder of 2004, $1.3 million in each of 2005, 2006, 2007 and 2008, $62.4 million in 2009 and $61.8 million in 2010, provided that all amounts outstanding must be paid on October 30, 2008 if the Company's subordinated notes have not been repaid or refinanced prior to July 30, 2008. The credit facility permits the Company to increase the amount of term loans or revolving credit availability thereunder by up to $75 million at any time prior to July 13, 2008, subject to the Company satisfying specified conditions.
Outstanding loans bear interest at a rate equal to, at the Company's option, either: (1) in the case of Eurodollar loans, the sum of the interest rate in the London interbank market for loans in an amount substantially equal to the amount of borrowing and for the period of borrowing selected by the Company plus a margin of (a) 3.5% in the case of term loans and (b) between 2.5% and 3.5% in the case of revolving credit loans, depending on the Company's total leverage coverage ratio (as defined in the credit facility) or (2) in the case of base rate loans, the higher of (a) CIBC's prime or base rate or (b) one-half percent plus the latest overnight federal funds rate plus (i) 2.5% in the case of term loans and (b) between 1.5% and 2.5% in the case of revolving credit loans, depending on our total leverage ratio. Interest is payable quarterly in the case of base rate loans and on maturity dates or every three months, whichever is shorter, in the case of Eurodollar loans. The Company is required to pay a fee of 0.75% per year for the unused portion of the revolving credit facility and between 2.5% and 3.5% per year on outstanding letters of credit. The Company is required to use either 50% or 75% of its excess cash flow (as defined in the credit facility) each year, depending on the Company's total leverage ratio, as well as the proceeds of debt and equity financings, to prepay outstanding term loans under the credit facility. The credit facility, which is guaranteed by all of the Company's subsidiaries and collateralized by substantially all of the Company's assets, requires the Company to maintain certain financial ratio covenants. The credit facility limits the Company's ability to incur debt, to see or dispose of assets, to create or incur liens, to make additional acquisitions, to pay dividends, to purchase or redeem the Company's stock and to merge or consolidate with any other entity and provides the lender with the right to require the payment of all amounts outstanding under the credit facility if a change in control of the Company occurs.
In connection with this refinancing, approximately $3.8 million of existing financing fees have been written off in July 2004.
In addition, on July 12, 2004, the Company's Board of Directors approved the filing of a registration statement on Form S-1 and initiated the process of an initial public offering.
F-25
The Kenan Advantage Group, Inc.
Condensed Consolidated Balance Sheets
(Amounts in Thousands, except share and per share data)
| | December 31, 2003 | March 31, 2004 | |||||
|---|---|---|---|---|---|---|---|
| | | (Unaudited) | |||||
| Assets | |||||||
| Current assets: | |||||||
| Cash and cash equivalents | $ | 5,823 | $ | 8,563 | |||
| Accounts receivable, less allowance of $1,554 and $1,676 at December 31, 2003 and March 31, 2004 (unaudited), respectively | 34,968 | 33,406 | |||||
| Supplies | 2,882 | 2,958 | |||||
| Deferred income taxes | 5,502 | 6,988 | |||||
| Prepaid expenses and other current assets | 7,939 | 6,215 | |||||
| Total current assets | 57,114 | 58,130 | |||||
Property and equipment, net | 126,914 | 124,666 | |||||
| Other assets: | |||||||
| Goodwill | 107,243 | 107,243 | |||||
| Deferred financing costs, net of amortization | 4,400 | 4,252 | |||||
| Other non-current assets | 2,211 | 2,021 | |||||
| 113,854 | 113,516 | ||||||
| Total assets | $ | 297,882 | $ | 296,312 | |||
| Liabilities and stockholders' equity | |||||||
| Current liabilities: | |||||||
| Revolving credit line | $ | 3,500 | $ | — | |||
| Accounts payable | 12,706 | 14,730 | |||||
| Accrued expenses | 28,918 | 29,203 | |||||
| Current portion of capital lease obligations | 485 | — | |||||
| Current portion of long-term debt | 11,075 | 11,638 | |||||
| Total current liabilities | 56,684 | 55,571 | |||||
Long-term debt, net of current portion | 148,225 | 145,292 | |||||
| Other non-current liabilities | 4,574 | 4,574 | |||||
| Deferred income taxes | 25,098 | 26,944 | |||||
| Detachable stock warrants, subject to put option | 17,930 | 17,930 | |||||
| Total liabilities | 252,511 | 250,311 | |||||
Stockholders' equity: | |||||||
| Convertible preferred stock | 44,326 | 44,326 | |||||
| Common stock, at par value of $.001, 7,000,000 shares authorized at December 31, 2003 and March 31, 2004, and 240,800 shares issued and outstanding at December 31, 2003 and March 31, 2004 | — | — | |||||
| Additional paid-in capital | 1,232 | 1,232 | |||||
| Retained earnings | 2 | 443 | |||||
| Accumulated other comprehensive loss | (189 | ) | — | ||||
| Total stockholders' equity | 45,371 | 46,001 | |||||
| Total liabilities and stockholders' equity | $ | 297,882 | $ | 296,312 | |||
See accompanying notes.
F-26
The Kenan Advantage Group, Inc.
Condensed Consolidated Statements of Operations
Unaudited
(Amounts in Thousands, Except Share and Per Share Data)
| | Three Months Ended March 31, | |||||||
|---|---|---|---|---|---|---|---|---|
| | 2003 | 2004 | ||||||
| Net revenues | $ | 72,097 | $ | 103,624 | ||||
Operating costs: | ||||||||
| Wages and employee benefits | 40,619 | 60,744 | ||||||
| Fuel and other operating expenses | 14,943 | 20,768 | ||||||
| Insurance and claims | 3,884 | 5,354 | ||||||
| Taxes and licenses | 823 | 1,216 | ||||||
| General and administrative | 4,087 | 5,527 | ||||||
| Depreciation and amortization | 3,733 | 5,623 | ||||||
| 68,089 | 99,232 | |||||||
| Income from operations | 4,008 | 4,392 | ||||||
Other income (expenses): | ||||||||
| Interest expense | (3,035 | ) | (3,270 | ) | ||||
| Management fee to related party | (138 | ) | (138 | ) | ||||
| Other, net | 247 | (256 | ) | |||||
| (2,926 | ) | (3,664 | ) | |||||
| Income before income taxes | 1,082 | 728 | ||||||
| Income taxes | 432 | 288 | ||||||
| Net income | $ | 650 | $ | 440 | ||||
| Net income per share—basic | $ | 3.24 | $ | 1.83 | ||||
| Net income per share—diluted | $ | 0.12 | $ | 0.08 | ||||
| Weighted average number of shares—basic | 200,800 | 240,800 | ||||||
| Weighted average number of shares—diluted | 5,643,674 | 5,824,076 | ||||||
See accompanying notes.
F-27
The Kenan Advantage Group, Inc.
Condensed Consolidated Statements of Cash Flows
Unaudited
(Amounts in Thousands)
| | Three Months Ended March 31, | ||||||||
|---|---|---|---|---|---|---|---|---|---|
| | 2003 | 2004 | |||||||
| Operating activities | |||||||||
| Net income | $ | 650 | $ | 440 | |||||
| Adjustments to reconcile net income to net cash provided by operating activities: | |||||||||
| Depreciation and amortization | 3,733 | 5,623 | |||||||
| Accretion of debt discount | 114 | (20 | ) | ||||||
| Loss on disposal of equipment | 1 | 287 | |||||||
| Deferred income taxes | 2,599 | 324 | |||||||
| Change in assets and liabilities: | |||||||||
| Accounts receivable | (3,028 | ) | 1,562 | ||||||
| Supplies | (406 | ) | (76 | ) | |||||
| Prepaid expenses and other current assets | (215 | ) | 1,724 | ||||||
| Other assets | (2,260 | ) | 137 | ||||||
| Accounts payable | (803 | ) | 2,024 | ||||||
| Accrued expenses and other liabilities | 6,292 | 1,676 | |||||||
| Net cash provided by operating activities | 6,677 | 13,701 | |||||||
Investing activities | |||||||||
| Purchases of equipment | (4,310 | ) | (3,994 | ) | |||||
| Proceeds from sale of equipment | 5 | 248 | |||||||
| Cash paid for acquisitions | — | (740 | ) | ||||||
| Net cash used in investing activities | (4,305 | ) | (4,486 | ) | |||||
Financing activities | |||||||||
| Payments on revolving credit line, net | — | (3,500 | ) | ||||||
| Payments on long-term debt | (1,800 | ) | (2,490 | ) | |||||
| Payments on capital lease obligations | (497 | ) | (485 | ) | |||||
| Net cash used in financing activities | (2,297 | ) | (6,475 | ) | |||||
| Net increase in cash and cash equivalents | 75 | 2,740 | |||||||
| Cash and cash equivalents at the beginning of the period | 3,456 | 5,823 | |||||||
| Cash and cash equivalents at the end of the period | $ | 3,531 | $ | 8,563 | |||||
See accompanying notes.
F-28
The Kenan Advantage Group, Inc.
Notes to Condensed Consolidated Financial Statements
Three months ended March 31, 2003 and 2004
Unaudited
(Dollars in Thousands, except for share and per share amounts)
1. Significant Accounting Policies
Basis of Presentation
The accompanying condensed consolidated financial statements have been prepared by The Kenan Advantage Group, Inc. (the "Company"), without audit, pursuant to the rules and regulations of the Securities and Exchange Commission (the "Commission"). The information furnished in the unaudited condensed consolidated financial statements includes normal recurring adjustments and reflects all adjustments, which are, in the opinion of management, necessary for a fair presentation of such financial statements. Certain information and footnote disclosures normally included in financial statements prepared in accordance with accounting principles generally accepted in the United States have been condensed or omitted pursuant to the Commission's rules and regulations. Although the Company believes that the disclosures are adequate to make the information presented not misleading, it is suggested that these condensed consolidated financial statements be read in conjunction with the audited consolidated financial statements and the notes thereto included elsewhere in this prospectus.
The operating results for the three months ended March 31, 2004 are not necessarily indicative of the results that may be expected for the entire fiscal year.
Financial Instruments
The carrying value of accounts receivable and accounts payable are a reasonable estimate of their fair value due to the short-term nature of these instruments. The Company's Tranche A and B term loans have variable interest rates, therefore the carrying value approximates fair value at December 31, 2003 and March 31, 2004. The Senior Subordinated Notes have a fixed interest rate; however, due to the fact that there is no current market for these instruments, the fair value of these notes is not determinable. The carrying amount of the detachable stock warrant, subject to put option, approximates its fair value.
The Company uses interest rate swaps to reduce its exposure to market risks resulting from fluctuations in interest rates. The interest rate swaps are accounted for under SFAS No. 133 which requires that all derivative instruments be recognized in the financial statements and measured at fair value.
The interest rate swaps are accounted for as cash flow hedges, and changes in fair value are deferred and recorded in stockholders' equity as a component of accumulated other comprehensive loss. Any ineffectiveness associated with the interest rate swaps is recognized immediately in earnings. The Company does not enter into financial instruments for trading or speculative purposes. The interest rate swaps expired on March 31, 2004, and they were not renewed.
Concentration of Credit Risk
The Company sells services and extends credit based on a evaluation of the customer's financial condition, without requiring collateral. The company's policy is to identify all specific customers that are considered a probable collection risk based upon the customer's financial condition, payment history, credit rating and other relevant factors and to reserve for the portion of those outstanding
F-29
The Kenan Advantage Group, Inc.
Notes to Condensed Consolidated Financial Statements (Continued)
Three months ended March 31, 2003 and 2004
Unaudited
(Dollars in Thousands, except for share and per share amounts)
1. Significant Accounting Policies (Continued)
balances that collection does not appear likely. If the financial condition of the Company's customers were to deteriorate, resulting in an inability to make payments, additional allowances may be required.
For the quarter ended March 31, 2004, the Company wrote off $15 of uncollectible accounts, recognized $137 in bad debt expense and had an allowance for bad debts of $1,676. For the quarter ended March 31, 2003, the Company wrote off $331 of uncollectible accounts, recognized $129 in bad debt expense and had an allowance for bad debts of $1,442.
Stock-Based Compensation
The Company has elected to account for stock-based awards to its employees using the intrinsic value method in Accounting Principles Board Opinion (APB) No. 25,Accounting for Stock Issued to Employees, and related interpretations. Under APB No. 25, compensation expense is not recognized in the Company's financial statements if the exercise price of the stock options granted equals or is greater than the market price of the underlying stock on the date of grant.
The alternative policy in SFAS No. 123,Accounting for Stock-Based Compensation, provides that compensation expense be recognized based on the fair value of options awarded, determined by an option pricing model. If the Company had recognized compensation expense using the fair value method under SFAS No. 123 rather than APB 25, the effect on net income would have been as follows:
| | Three months ended March 31, | |||||||
|---|---|---|---|---|---|---|---|---|
| | 2003 | 2004 | ||||||
| Net income as reported | $ | 650 | $ | 440 | ||||
| Add stock-based employee compensation expense, net of related taxes | — | 18 | ||||||
| Deduct stock-based employee compensation expense determined under fair value based methods for all awards, net of related taxes | (73 | ) | (79 | ) | ||||
| Pro forma net income | $ | 577 | $ | 379 | ||||
| Net income per share: | ||||||||
| Basic—as reported | $ | 3.24 | $ | 1.83 | ||||
| Basic—pro forma | $ | 2.87 | $ | 1.57 | ||||
Diluted—as reported | $ | 0.12 | $ | 0.08 | ||||
| Diluted—pro forma | $ | 0.10 | $ | 0.07 | ||||
2. Business Acquisitions
On May 31, 2003, the Company acquired certain assets and assumed certain liabilities of the trucking business of Beneto Tank Lines, Inc. (Beneto) for aggregate consideration of $32,890, consisting
F-30
The Kenan Advantage Group, Inc.
Notes to Condensed Consolidated Financial Statements (Continued)
Three months ended March 31, 2003 and 2004
Unaudited
(Dollars in Thousands, except for share and per share amounts)
2. Business Acquisitions (Continued)
of $31,366 in cash and a note payable to the former owner of $1,524. Beneto provides transportation services for petroleum-based products primarily in California, Nevada and Arizona.
On June 29, 2003, the Company acquired the assets and assumed certain liabilities of Carl Klemm Tank Lines, Inc. (Klemm) for consideration of $18,367, consisting of $17,367 in cash (including contingent consideration of $2,740 to be paid in 2004) and $1,000 in the Company's common stock (40,000 shares at $25 per share). Klemm provides transportation services for petroleum-based products primarily in Wisconsin, Illinois and Indiana. Under the terms of the Klemm acquisition agreement, the Company is required to make additional payments up to $4,740, contingent upon the achievement of specified operating results through fiscal 2004 ($2,740 in 2003 and $2,000 in 2004). The specified operating results for 2003 were met and $740 of the $2,740 was paid in the first quarter of 2004. The contingent payments are accounted for as additional consideration in connection with the acquisition.
The assets acquired and liabilities assumed for each of the acquisitions were recorded at their estimated fair values on the acquisition date and the excess of the purchase price over the fair value of the net assets acquired of $5,585 and $7,680 was recorded as goodwill for Beneto and Klemm, respectively. The purchase price allocations for each of the acquired companies are preliminary pending the valuation of certain acquired identifiable intangible assets. The Company expects to complete these valuations in the second quarter of 2004.
The following unaudited pro forma condensed financial information presents the combined results of operations of the Company, as if the Beneto and Klemm acquisitions had occurred at the beginning of the periods presented. The unaudited pro forma condensed financial information does not purport to be indicative of the actual results that would have been reported if the acquisitions had occurred as of the beginning of the period presented or the actual results that may be reported in the future:
| | Results of Operations for the Three Months Ended March 31, | |||||
|---|---|---|---|---|---|---|
| | 2003 (Pro Forma) | 2004 (Actual) | ||||
| Revenue | $ | 99,633 | $ | 103,624 | ||
| Operating expenses | 94,623 | 99,232 | ||||
| Operating Income | $ | 5,010 | $ | 4,392 | ||
| Net Income | $ | 850 | $ | 440 | ||
| Net income per share—basic | $ | 4.23 | $ | 1.83 | ||
| Net income per share—diluted | $ | 0.16 | $ | 0.08 | ||
Each of the acquisitions have been accounted for under the purchase method of accounting, and the consolidated statements of operations of the Company include the results of operations of the acquired businesses for the period subsequent to the effective dates of the respective acquisitions.
F-31
The Kenan Advantage Group, Inc.
Notes to Condensed Consolidated Financial Statements (Continued)
Three months ended March 31, 2003 and 2004
Unaudited
(Dollars in Thousands, except for share and per share amounts)
3. Comprehensive Income
Comprehensive income is as follows:
| | Three months ended March 31, | |||||
|---|---|---|---|---|---|---|
| | 2003 | 2004 | ||||
| Net income | $ | 650 | $ | 440 | ||
| Change in fair value of interest rate swaps, net of tax | (192 | ) | 189 | |||
| Comprehensive income | $ | 458 | $ | 629 | ||
4. Net Income Per Share
Basic net income per share is computed by dividing income available to common stockholders by the weighted-average number of common shares outstanding for the period. Diluted net income per share reflects the potential dilution that could occur if securities or other contracts to issue common stock were exercised or converted into common stock. No adjustments were necessary to reported net income in the calculation of net income available to common stockholders—basic and diluted.
The following table sets forth the computation of basic net income per share and diluted net income per share:
| | Three months ended March 31, | ||||||
|---|---|---|---|---|---|---|---|
| | 2003 | 2004 | |||||
| Numerator: | |||||||
| Net income | $ | 650 | $ | 440 | |||
Denominator: | |||||||
| Weighted average number of shares | 200,800 | 240,800 | |||||
| Effect of dilutive securities | 309,974 | 450,376 | |||||
| Effect of convertible securities | 5,132,900 | 5,132,900 | |||||
| Weighted average number of shares—diluted | 5,643,674 | 5,824,076 | |||||
Net income per share—basic | $ | 3.24 | $ | 1.83 | |||
| Net income per share—diluted | $ | 0.12 | $ | 0.08 | |||
5. Claims Payable
Claims payable represent the estimated cost of open claims that are retained and paid by the Company under its programs for workers' compensation, bodily injury and property damage. These estimates are based upon historical information along with certain assumptions about future cash flows. Changes in assumptions for such things as medical costs, environmental hazards, and legal actions, as
F-32
The Kenan Advantage Group, Inc.
Notes to Condensed Consolidated Financial Statements (Continued)
Three months ended March 31, 2003 and 2004
Unaudited
(Dollars in Thousands, except for share and per share amounts)
5. Claims Payable (Continued)
well as changes in actual experience could cause these estimates to change. Any such changes would be recorded in operations in the period in which the change occurs. In the accompanying consolidated statements of operations, workers' compensation costs are included in wages and employee benefits expenses, and other claims costs are included in insurance and claims expense. The claims payable liabilities included in the accompanying balance sheets are $9,710 and $9,784 as of December 31, 2003 and March 31, 2004 (unaudited), respectively.
On January 13, 2004, one of the Company's tanker trucks ran off an overpass onto a major highway outside Baltimore, Maryland, triggering an explosion and crash involving several other vehicles. The accident resulted in four fatalities. The National Transportation Safety Board is currently investigating the accident. The Company anticipates that claims will be made against it as a result of the accident. The Company is self-insured for the first $500,000 of this claim, and insurance will cover up to $30 million of this claim in excess of self-insured retention. The Company cannot predict the extent of claims not covered by insurance policies and cannot provide any assurance that this claim will not have a material adverse effect on operating results.
6. Accrued Expenses
Accrued expenses consist of the following:
| | December 31, 2003 | March 31, 2004 | ||||
|---|---|---|---|---|---|---|
| | | (Unaudited) | ||||
| Claims payable, current portion | $ | 5,136 | $ | 5,210 | ||
| Compensation-related obligations | 16,184 | 16,418 | ||||
| Accrued interest | 2,226 | 2,385 | ||||
| Other accrued expenses | 5,372 | 5,190 | ||||
| $ | 28,918 | $ | 29,203 | |||
F-33
The Kenan Advantage Group, Inc.
Notes to Condensed Consolidated Financial Statements (Continued)
Three months ended March 31, 2003 and 2004
Unaudited
(Dollars in Thousands, except for share and per share amounts)
7. Long-Term Debt
Long-term debt consists of the following:
| | December 31, 2003 | March 31, 2004 | |||||
|---|---|---|---|---|---|---|---|
| | | (Unaudited) | |||||
| Senior Amended and Restated Credit Agreement: | |||||||
| Tranche A Term Loan | $ | 29,250 | $ | 27,000 | |||
| Original Tranche B Term Loan | 43,875 | 43,763 | |||||
| Additional Tranche B Term Loan | 49,625 | 49,500 | |||||
| Senior Subordinated Notes, net of unamortized original issue discount | 36,550 | 36,667 | |||||
| Total | 159,300 | 156,930 | |||||
| Less current portion | 11,075 | 11,638 | |||||
| Long-term debt | $ | 148,225 | $ | 145,292 | |||
In 2003, the Company substantially financed the acquisition of Beneto and Klemm by amending its Senior Credit Agreement and executing an Amended and Restated Credit Agreement (the Senior Restated Agreement). The amendments to the Senior Credit Agreement increased the Company's total availability by creating an additional Tranche B term loan of $50,000 and increased the amount available under the Revolving Credit Line to $20,000.
The Revolving Credit Line provides for borrowings up to $20,000 under a revolving line-of-credit expiring at April 30, 2006. Borrowings on this facility bear interest, payable quarterly, at rates that vary upon the Company's election ranging from LIBOR plus 3.5% to Prime plus 2.5% (6.50% and 6.5% weighted average rate at December 31, 2003 and March 31, 2004, respectively). Availability under this facility is restricted to 85% of the Company's eligible accounts receivable, further reduced by outstanding letters of credit. At March 31, 2004, there was no amount outstanding and a commitment fee of 0.5% is payable quarterly on the unused availability of $7,568 million. Outstanding letters of credit at March 31, 2004 were $12,431.
The Senior Restated Agreement contains restrictive covenants including the maintenance of current and tangible asset ratios, certain financial ratios regarding leverage, fixed charges and interest coverage, and limitations on operating leases and indebtedness and payments of dividends. As of March 31, 2004, the Company was in compliance with all of its debt covenant requirements.
8. Interest Rate Swaps
In March 2002, the Company entered into two interest rate swap agreements with major commercial banks to fix the variable interest rate on its Tranche A term loan. These agreements require the Company to pay a fixed interest rate to the counterparties while receiving a floating interest based on LIBOR. The interest rate swaps fix the Company's interest cost at a rate of 7.54% on a notional amount of $28,125 as of December 31, 2003. The agreements matured on March 31, 2004, and qualified as cash flow hedges. The interest rate swaps were not renewed upon expiration.
F-34
The Kenan Advantage Group, Inc.
Notes to Condensed Consolidated Financial Statements (Continued)
Three months ended March 31, 2003 and 2004
Unaudited
(Dollars in Thousands, except for share and per share amounts)
8. Interest Rate Swaps (Continued)
There was no ineffectiveness associated with these hedges as the interest payment dates and interest reset dates of the interest swaps matched the terms of the hedged item. The fair market value of the interest rate swaps were recorded as a non-current liability with the offsetting adjustment to other comprehensive loss in the consolidated balance sheets.
9. Commitments and Contingencies
Litigation
In the ordinary course of business, the Company is the subject of, or party to, pending or threatened litigation, assessments, and claims. While it is not possible to predict with certainty the outcome of such matters individually or in the aggregate, management believes that the ultimate result will not have a material adverse effect on the consolidated financial position, results of operations or cash flows of the Company.
Environmental Matters
The Company's activities involve the handling and transportation of bulk fuels and other petroleum-based products, many of which are classified as hazardous materials. The Company's terminal operations engage in the discharge of stormwater that may contain hazardous substances, and from time to time the Company stores diesel fuel and other petroleum products at terminals. As such, the Company is subject to environmental, health and safety laws and regulation by the U.S. federal, state and local government authorities. Environmental laws and regulations are complex, change frequently and have tended to become more stringent over time. There can be no assurance that such laws and regulations will not change in a manner that could impose material costs to the Company. From time to time, the Company has incurred remedial costs with respect to spills and releases at its facilities and, notwithstanding the existence of its environmental management program, the Company cannot assure that such obligations will not be incurred in the future.
The Company has environmental management programs that it carries out in conjunction with its safety program. Facility managers are responsible for environmental compliance. Self-audits are required to address operations, safety training and procedures, equipment and grounds maintenance, emergency response capabilities, and wastewater management.
10. Subsequent Events
On July 13, 2004, the Company amended its credit facility to increase the amount of term loans outstanding under the facility to $130 million and to increase availability under the revolving credit facility to $50 million, with a letter of credit subfacility of $30 million. The revolving credit portion of the facility expires on October 30, 2008 (June 30, 2009 if the Company's subordinated notes are repaid or refinanced prior to July 30, 2008). Term loans are payable in quarterly installments totaling $650,000 for the remainder of 2004, $1.3 million in each of 2005, 2006, 2007 and 2008, $62.4 million in 2009 and $61.8 million in 2010, provided that all amounts outstanding must be paid on October 30, 2008 if the Company's subordinated notes have not been repaid or refinanced prior to July 30, 2008. The credit
F-35
The Kenan Advantage Group, Inc.
Notes to Condensed Consolidated Financial Statements (Continued)
Three months ended March 31, 2003 and 2004
Unaudited
(Dollars in Thousands, except for share and per share amounts)
10. Subsequent Events (Continued)
facility permits the Company to increase the amount of term loans or revolving credit availability thereunder by up to $75 million at any time prior to July 13, 2008, subject to the Company satisfying specified conditions.
Outstanding loans bear interest at a rate equal to, at the Company's option, either: (1) in the case of Eurodollar loans, the sum of the interest rate in the London interbank market for loans in an amount substantially equal to the amount of borrowing and for the period of borrowing selected by the Company plus a margin of (a) 3.5% in the case of term loans and (b) between 2.5% and 3.5% in the case of revolving credit loans, depending on the Company's total leverage coverage ratio (as defined in the credit facility) or (2) in the case of base rate loans, the higher of (a) CIBC's prime or base rate or (b) one-half percent plus the latest overnight federal funds rate plus (i) 2.5% in the case of term loans and (b) between 1.5% and 2.5% in the case of revolving credit loans, depending on our total leverage ratio. Interest is payable quarterly in the case of base rate loans and on maturity dates or every three months, whichever is shorter, in the case of Eurodollar loans. The Company is required to pay a fee of 0.75% per year for the unused portion of the revolving credit facility and between 2.5% and 3.5% per year on outstanding letters of credit. The Company is required to use either 50% or 75% of its excess cash flow (as defined in the credit facility) each year, depending on the Company's total leverage ratio, as well as the proceeds of debt and equity financings, to prepay outstanding term loans under the credit facility. The credit facility, which is guaranteed by all of the Company's subsidiaries and collateralized by substantially all of the Company's assets, requires the Company to maintain certain financial ratio covenants. The credit facility limits the Company's ability to incur debt, to see or dispose of assets, to create or incur liens, to make additional acquisitions, to pay dividends, to purchase or redeem the Company's stock and to merge or consolidate with any other entity and provides the lender with the right to require the payment of all amounts outstanding under the credit facility if a change in control of the Company occurs.
In connection with this refinancing, approximately $3.8 million ($2.3 million, net of tax) of existing financing fees have been written off in July 2004.
In addition, on July 12, 2004, the Company's Board of Directors approved the filing of a registration statement on Form S-1 and initiated the process of an initial public offering.
F-36
REPORT OF INDEPENDENT REGISTERED PUBLIC ACCOUNTING FIRM
Board of Directors and Stockholders
The Kenan Advantage Group, Inc.
We have audited the accompanying balance sheets of the Fuels Delivery Operations of Beneto, Inc. (as defined in Note 1) as of December 31, 2001 and 2002 and the related statements of income, changes in parent company investment and cash flows for each of the three years in the period ended December 31, 2002. These financial statements are the responsibility of the management of Beneto, Inc. Our responsibility is to express an opinion on these financial statements based on our audits.
We conducted our audits in accordance with the standards of the Public Company Accounting Oversight Board (United States). Those standards require that we plan and perform the audit to obtain reasonable assurance about whether the financial statements are free of material misstatement. An audit includes examining, on a test basis, evidence supporting the amounts and disclosures in the financial statements. An audit also includes assessing the accounting principles used and significant estimates made by management, as well as evaluating the overall financial statement presentation. We believe that our audits provide a reasonable basis for our opinion.
In our opinion, the financial statements referred to above present fairly, in all material respects, the financial position of the Fuels Delivery Operations of Beneto, Inc. at December 31, 2001 and 2002, and the results of its operations and its cash flows for each of the three years in the period ended December 31, 2002 in conformity with U.S. generally accepted accounting principles.
/s/ Ernst & Young LLP
March 24, 2004
Akron, Ohio
F-37
Fuels Delivery Operations of Beneto, Inc.
Balance Sheets
(In Thousands)
| | December 31, | ||||||
|---|---|---|---|---|---|---|---|
| | 2001 | 2002 | |||||
| Assets | |||||||
| Current assets: | |||||||
| Accounts receivable, net | $ | 7,402 | $ | 6,041 | |||
| Prepaid expenses | 1,327 | 2,033 | |||||
| Total current assets | 8,729 | 8,074 | |||||
| Property and equipment, net | 24,420 | 25,796 | |||||
| Restricted assets due from parent | 2,807 | 3,011 | |||||
| Total assets | $ | 35,956 | $ | 36,881 | |||
Liabilities and parent company investment | |||||||
| Current liabilities: | |||||||
| Accounts payable | $ | 2,484 | $ | 402 | |||
| Salaries and wages | 1,801 | 2,048 | |||||
| Freight and casualty claims payable | 774 | 1,498 | |||||
| Total current liabilities | 5,059 | 3,948 | |||||
| Deferred compensation | 2,807 | 3,011 | |||||
| Parent company investment | 28,090 | 29,922 | |||||
| Total liabilities and parent company investment | $ | 35,956 | $ | 36,881 | |||
See accompanying notes to financial statements.
F-38
Fuels Delivery Operations of Beneto, Inc.
Statements of Income
(In Thousands)
| | Year ended December 31, | |||||||||
|---|---|---|---|---|---|---|---|---|---|---|
| | 2000 | 2001 | 2002 | |||||||
| Revenue | $ | 50,039 | $ | 57,546 | $ | 71,232 | ||||
Operating expenses: | ||||||||||
| Salaries, wages and benefits | 26,093 | 31,201 | 38,847 | |||||||
| Operating supplies and expenses | 15,833 | 16,987 | 18,995 | |||||||
| Purchased transportation | 452 | 578 | 761 | |||||||
| Operating taxes and licenses | 974 | 958 | 1,003 | |||||||
| Insurance and claims | 1,425 | 1,603 | 2,272 | |||||||
| Provision for depreciation | 3,519 | 3,703 | 4,051 | |||||||
| Loss on sale of property and equipment | 79 | 67 | 226 | |||||||
| 48,375 | 55,097 | 66,155 | ||||||||
| Income before state income taxes | 1,664 | 2,449 | 5,077 | |||||||
| State income taxes | 133 | 196 | 406 | |||||||
| Net income | $ | 1,531 | $ | 2,253 | $ | 4,671 | ||||
See accompanying notes to financial statements.
F-39
Fuels Delivery Operations of Beneto, Inc.
Statements of Changes in Parent Company Investment
(In Thousands)
| Balance at January 1, 2000 | $ | 23,812 | |||
| Net income | 1,531 | ||||
| Net equity transfers to Beneto, Inc. | — | ||||
| Balance at December 31, 2000 | — | ||||
| Net income | 2,253 | ||||
| Net equity transfers from Beneto, Inc. | — | ||||
| Balance at December 31, 2001 | 28,090 | ||||
| Net income | 4,671 | ||||
| Net equity transfers to Beneto, Inc. | (2,839 | ) | |||
| Balance at December 31, 2002 | $ | 29,922 | |||
See accompanying notes to financial statements.
F-40
Fuels Delivery Operations of Beneto, Inc.
Statements of Cash Flows
(In Thousands)
| | Year ended December 31, | |||||||||||
|---|---|---|---|---|---|---|---|---|---|---|---|---|
| | 2000 | 2001 | 2002 | |||||||||
| Cash flows from operating activities | ||||||||||||
| Net income | $ | 1,531 | $ | 2,253 | $ | 4,671 | ||||||
| Adjustments to reconcile net income to net cash provided by operating activities: | ||||||||||||
| Depreciation | 3,519 | 3,703 | 4,051 | |||||||||
| Loss on sale of revenue equipment | 79 | 67 | 226 | |||||||||
| Changes in assets and liabilities: | ||||||||||||
| Accounts receivable | (1,307 | ) | (2,048 | ) | 1,361 | |||||||
| Prepaid expenses and other current assets | 1,167 | (1,051 | ) | (706 | ) | |||||||
| Accounts payable | 58 | 35 | (194 | ) | ||||||||
| Accrued expenses and other liabilities | 134 | 676 | 972 | |||||||||
| Net cash provided by operating activities | 5,181 | 3,635 | 10,381 | |||||||||
Cash flows from investing activities | ||||||||||||
| Purchases of property and equipment | (3,439 | ) | (5,871 | ) | (7,542 | ) | ||||||
| Net cash used in investing activities | (3,439 | ) | (5,871 | ) | (7,542 | ) | ||||||
Cash flows from financing activities | ||||||||||||
| Net intercompany activity | (1,742 | ) | 2,236 | (2,839 | ) | |||||||
| Net cash (used in) provided by financing activities | (1,742 | ) | 2,236 | (2,839 | ) | |||||||
| Change in cash and cash equivalents | — | — | — | |||||||||
| Cash and cash equivalents at beginning of period | — | — | — | |||||||||
| Cash and cash equivalents at end of period | $ | — | $ | — | $ | — | ||||||
See accompanying notes to financial statements.
F-41
Fuels Delivery Operations of Beneto, Inc.
Notes to Financial Statements
Years ended December 31, 2000, 2001 and 2002
(in Thousands)
1. Basis of Presentation
The Fuels Delivery Operations of Beneto, Inc. (the Fuels Delivery Segment or the Company) has historically operated as a division of Beneto, Inc. (the Parent). The Fuels Delivery Segment is a regional carrier of bulk petroleum products for major oil companies with operations on the west coast of the United States.
The information contained in these financial statements has been derived from the historical financial records of the Parent. These financial statements reflect an estimate of what the historical assets, liabilities and operations would have been if the Fuels Delivery Segment had been organized as a separate legal entity, owning certain net assets of the Parent. Historically, the Parent provided certain general and administrative services to the Fuels Delivery Segment including executive services and benefits, information technology, legal, treasury and human resources. The costs related to these services have been allocated to the Fuels Delivery Segment using management's internally developed methodology primarily based on employee headcount. Management believes that this is a reasonable method for allocating these indirect corporate expenses. The allocation is not necessarily representative of the operating expenses that would have been incurred had the Fuels Delivery Segment operated on a stand-alone basis for the periods presented, nor is it representative of the costs expected to be incurred in subsequent periods. For the years ended December 31, 2000, 2001 and 2002, total operating expenses include $1,448, $916 and $1,540 of allocated corporate costs, respectively included in operating supplies and expenses.
2. Significant Accounting Policies
Revenue Recognition
The Company recognizes revenue on the date of product delivery to consignee. Related expenses are recognized as incurred.
Advertising Costs
The Company expenses advertising costs as they are incurred. Total advertising costs were $45, $43 and $54 for the years ended December 31, 2000, 2001 and 2002, respectively.
Property and equipment
Property and equipment is stated at cost. Expenditures for repairs and maintenance are charged to operations as incurred, while expenditures for additions and improvements are capitalized. Depreciation is computed using the straight-line method over the estimated useful lives of the assets as follows:
| Asset | Estimated Useful Life | |
|---|---|---|
| Tractors | 3–5 years | |
| Trailers | 5–15 years | |
| Shop and garage equipment | 5–10 years | |
| Service cars and equipment | 3–5 years | |
| Office furniture and fixtures | 5–10 years |
F-42
Fuels Delivery Operations of Beneto, Inc.
Notes to Financial Statements (Continued)
Years ended December 31, 2000, 2001 and 2002
(in Thousands)
2. Significant Accounting Policies (Continued)
Impairment of Long-Lived Assets
The Company periodically reviews long-lived assets used in operations when indicators of impairment are present. When the undiscounted future cash flows estimated to be generated by those assets are less than the assets' carrying amount, impairment losses are recorded to write down the related assets to fair market value. No impairment charges were necessary in 2000, 2001 or 2002.
In August 2001, the Financial Accounting Standards Board (FASB) issued Statement of Financial Accounting Standards (SFAS) No. 144,Accounting for the Impairment or Disposal of Long-Lived Assets, which addresses financial accounting and reporting for the impairment or disposal of long-lived assets. SFAS No. 144 supersedes SFAS No. 121,Accounting for the Impairment of Long-Lived Assets and for Long-Lived Assets to be Disposed Of, and the accounting and reporting provisions of the Accounting Principles Board (APB) Opinion No. 30,Reporting the Results of Operations for Disposal of a Segment of a Business. The adoption of the new standard on January 1, 2002 did not effect the Company's financial position, cash flows or results of operations.
Supplies
Purchases of fuel, tires, and parts are expensed as incurred.
Deferred Compensation
The Parent maintains a deferred compensation plan that provides certain employees with discretionary Company contributions. Continuous employment through age 60 is required for vesting, however accelerated vesting occurs if 50% or more of Beneto, Inc. is sold. Upon termination, the agreement requires the Company to pay vested employees the applicable amount over a ten year period. The liability, and corresponding assets, have been allocated to the Fuels Delivery Segment based on employees specifically identified with the Fuels Delivery Segment.
Restricted Assets due from Parent
Restricted assets due from parent represent investments held by Beneto, Inc. that have been allocated as collateral for the Company's deferred compensation liability. These assets were assigned in a manner similar to the corresponding liability, and are recorded at fair value.
Freight and Casualty Claims Payable
Claims payable represent the estimated cost of open claims that are retained and paid by the Company under its programs for workers' compensation, bodily injury and property damage. These estimates are based upon historical information along with certain assumptions about future cash flows. Changes in assumptions for such things as medical costs, environmental hazards, and legal actions, as well as changes in actual experience could cause these estimates to change. In the accompanying statements of income, workers' compensation and group medical costs are included in wages and employee benefits expenses, and other claims costs are included in insurance and claims expense.
F-43
Fuels Delivery Operations of Beneto, Inc.
Notes to Financial Statements (Continued)
Years ended December 31, 2000, 2001 and 2002
(in Thousands)
2. Significant Accounting Policies (Continued)
Financial Instruments
The carrying value of the Company's financial instruments, consisting primarily of accounts receivable and accounts payable, approximates the fair value of these instruments at December 31, 2001 and 2002.
Concentrations of Credit Risk
The Company sells services and extends credit based on an evaluation of the customer's financial condition, without requiring collateral. Exposure to losses on receivables is principally dependent on each customer's financial condition. On a regular basis, the Company evaluates its accounts receivable and establishes the allowance for doubtful accounts based on a combination of specific customer circumstances, credit conditions and historical write-offs and collections. The allowance for doubtful accounts was $40 and $60 at December 31, 2001 and 2002, respectively.
The Company's ten largest customers represented approximately 98%, 92% and 95% of total revenues in 2000, 2001 and 2002, respectively. In 2002, the Company's four largest customers represented 36%, 23%, 18% and 11%, respectively. The Company's three largest customers represented 43%, 23% and 13% in 2001 and 46%, 21% and 16% in 2000, respectively.
Use of Estimates in the Financial Statements
The preparation of financial statements in conformity with accounting principles generally accepted in the United States requires management to make estimates and assumptions that affect the reported amounts of revenues and expenses during the period, the reported amounts of assets and liabilities, and disclosure of contingent assets and liabilities at the date of the financial statements. Actual results could differ from these estimates.
Income Taxes
The shareholders of the Parent have elected to be taxed under the provisions of Subchapter S of the Internal Revenue Code. As such, taxable income of the Company is included in the individual tax returns of the shareholders, and the statement of income does not include any provisions for federal income taxes. State taxes have been recorded based on statutory rates in states in which the Company operates.
New Accounting Pronouncements
In June 2001, the FASB issued SFAS No. 143,Accounting for Asset Retirement Obligations. This standard is effective for fiscal years beginning after June 15, 2002. The adoption of SFAS No. 143 is not expected to have a material effect on the Company's financial position, results of operations or cash flows.
F-44
Fuels Delivery Operations of Beneto, Inc.
Notes to Financial Statements (Continued)
Years ended December 31, 2000, 2001 and 2002
(in Thousands)
2. Significant Accounting Policies (Continued)
New Accounting Pronouncements (continued)
In July 2002, the FASB issued SFAS No. 146,Accounting for Costs Associated with Exit or Disposal Activities. SFAS No. 146 will be effective for the Company for disposal activities initiated after December 31, 2002. The adoption of the standard is not expected to have a material effect on the Company's financial position, results of operations or cash flows.
In January 2003, the FASB released Interpretation No. 46,Consolidation of Variable Interest Entities. The interpretation was subsequently revised in December 2003. The interpretation addresses whether equity investments should be consolidated based on guidelines associated with what party has financial risks and controlling financial interest. Application of the interpretation is required in financial statements for periods ending after December 15, 2003. The interpretation will not have a material effect on the Company's financial position, results of operations or cash flows.
3. Property and Equipment
Property and equipment consists of the following:
| | December 31, | ||||||
|---|---|---|---|---|---|---|---|
| | 2001 | 2002 | |||||
| Revenue equipment | $ | 33,918 | $ | 38,417 | |||
| Shop and garage equipment | 219 | 219 | |||||
| Service cars and equipment | 1,031 | 1,063 | |||||
| Office furniture and fixtures | 1,016 | 1,061 | |||||
| Assets in process | 2,014 | 126 | |||||
| 38,198 | 40,886 | ||||||
| Less accumulated depreciation | (13,778 | ) | (15,090 | ) | |||
| Property and equipment, net | $ | 24,420 | $ | 25,796 | |||
4. Related Party Transactions
Included in the Company's statement of income are expenditures for rent paid to the Company's Parent and certain shareholders of $591, $599 and $628 for the years ended December 31, 2000, 2001 and 2002, respectively. If the Fuels Delivery Segment had operated independently from the Parent, rent expense would have been approximately $1,300 for each of the years presented.
5. Retirement Plans
The Parent sponsors and the Company's employees participate in a 401(k) plan covering substantially all employees. Under the plan, the Company contributes amounts that match certain percentages of the participant's voluntary contributions. Expenditures related to this plan were $444, $472 and $661 for the years ended December 31, 2000, 2001 and 2002, respectively.
F-45
Fuels Delivery Operations of Beneto, Inc.
Notes to Financial Statements (Continued)
Years ended December 31, 2000, 2001 and 2002
(in Thousands)
6. Contingencies
In the ordinary course of business, the Company is the subject of, or party to, pending or threatened litigation, assessments and claims. While it is not possible to predict with certainty the outcome of such matters individually or in the aggregate, management believes that the ultimate result will not have a material effect on the financial position, results of operations or cash flows of the Company.
7. Supplemental Cash Flow Information
In conjunction with the purchase of new revenue equipment, the Company will periodically receive value for the trade-in of used revenue equipment as a reduction to the total cash consideration paid for the new equipment. The value of assets traded-in in these monetary transactions was $1,469, $1,023 and $1,171 in the years ended December 31, 2000, 2001 and 2002, respectively.
For the years ended December 31, 2000, 2001 and 2002, the Company recorded obligations in accounts payable of $1,118, $2,014 and $126, respectively, for equipment received, but not placed in service. Cash payments for this equipment were made in each of the respective subsequent periods.
8. Subsequent Event
On May 31, 2003, certain assets (primarily revenue equipment and prepaid insurance) were acquired and certain liabilities (wage and benefit related liabilities) were assumed of the Fuels Delivery Segment by The Kenan Advantage Group, Inc. for aggregate consideration of approximately $32.9 million consisting of $31.4 million is cash and a note payable to one of the shareholders of the Parent in the amount of $1.5 million.
F-46
Fuels Delivery Operations of Beneto, Inc.
Condensed Balance Sheets
(In Thousands)
| | December 31, 2002 | March 31, 2003 | |||||
|---|---|---|---|---|---|---|---|
| | | (Unaudited) | |||||
| Assets | |||||||
| Current assets: | |||||||
| Accounts receivable, net | $ | 6,041 | $ | 5,679 | |||
| Prepaid expenses | 2,033 | 1,414 | |||||
| Total current assets | 8,074 | 7,093 | |||||
Property and equipment, net | 25,796 | 24,694 | |||||
| Restricted assets due from parent | 3,011 | 3,097 | |||||
| Total assets | $ | 36,881 | $ | 34,884 | |||
| Liabilities and parent company investment | |||||||
| Current liabilities: | |||||||
| Accounts payable | $ | 402 | $ | 1,235 | |||
| Salaries and wages | 2,048 | 1,399 | |||||
| Freight and casualty claims payable | 1,498 | 1,723 | |||||
| Total current liabilities | 3,948 | 4,357 | |||||
Deferred compensation | 3,011 | 3,097 | |||||
Parent company investment | 29,922 | 27,430 | |||||
| Total liabilities and parent company investment | $ | 36,881 | $ | 34,884 | |||
See accompanying notes to financial statements.
F-47
Fuels Delivery Operations of Beneto, Inc.
Condensed Statements of Income
Unaudited
(In Thousands)
| | Three Months Ended March 31, | |||||||
|---|---|---|---|---|---|---|---|---|
| | 2002 | 2003 | ||||||
| Revenue | $ | 15,959 | $ | 16,165 | ||||
Operating expenses: | ||||||||
| Salaries, wages and benefits | 8,989 | 8,918 | ||||||
| Operating supplies and expenses | 4,321 | 4,466 | ||||||
| Purchased transportation | 180 | 160 | ||||||
| Operating taxes and licenses | 248 | 211 | ||||||
| Insurance and claims | 519 | 659 | ||||||
| Provision for depreciation | 1,025 | 968 | ||||||
| Gain on sale of property and equipment | (6 | ) | (4 | ) | ||||
| 15,276 | 15,378 | |||||||
Income before state income taxes | 683 | 787 | ||||||
| State income taxes | 55 | 63 | ||||||
| Net income | $ | 628 | $ | 724 | ||||
See accompanying notes to financial statements.
F-48
Fuels Delivery Operations of Beneto, Inc.
Condensed Statements of Cash Flows
Unaudited
(In Thousands)
| | Three Months Ended March 31, | ||||||||
|---|---|---|---|---|---|---|---|---|---|
| | 2002 | 2003 | |||||||
| Cash flows from operating activities | |||||||||
| Net income | $ | 628 | $ | 724 | |||||
| Adjustments to reconcile net income to net cash provided by operating activities: | |||||||||
| Provision for depreciation | 1,025 | 968 | |||||||
| Gain on sale of property and equipment | (6 | ) | (4 | ) | |||||
| Changes in assets and liabilities: | |||||||||
| Accounts receivable | (1,024 | ) | 362 | ||||||
| Prepaid expenses and other current assets | 493 | 619 | |||||||
| Accounts payable | 1,338 | 958 | |||||||
| Accrued expenses and other liabilities | (601 | ) | (424 | ) | |||||
| Net cash provided by operating activities | 1,853 | 3,203 | |||||||
Cash flows from investing activities | |||||||||
| Purchases of property and equipment | (3,637 | ) | (53 | ) | |||||
| Proceeds from sale of equipment | — | 65 | |||||||
| Net cash (used in) provided by investing activities | (3,637 | ) | 12 | ||||||
Cash flows from financing activities | |||||||||
| Net intercompany activity | 1,784 | (3,215 | ) | ||||||
| Net cash provided by (used in) financing activities | 1,784 | (3,215 | ) | ||||||
| Change in cash and cash equivalents | — | — | |||||||
| Cash and cash equivalents at beginning of period | — | — | |||||||
| Cash and cash equivalents at end of period | $ | — | $ | — | |||||
See accompanying notes to financial statements.
F-49
Fuels Delivery Operations of Beneto, Inc.
Notes to Condensed Financial Statements
Three Months ended March 31, 2002 and 2003
Unaudited
(in Thousands)
1. Nature of Business and Significant Accounting Policies
Basis of Presentation
The Fuels Delivery Operations of Beneto, Inc. (the Fuels Delivery Segment or the Company) has historically operated as a division of Beneto, Inc. (Parent). The Fuels Delivery Segment is a regional carrier of bulk petroleum products for major oil companies on the west coast of the United States.
The information contained in these condensed financial statements has been derived from the historical financials records of the Parent. These condensed financial statements reflect an estimate of what the historical assets, liabilities and operations would have been if the Fuels Delivery Segment had been organized as a separate legal entity, owning certain net assets of the Parent. Historically, the Parent provided certain general and administrative services to the Fuels Delivery Segment including executive services and benefits, information technology, legal, treasury and human resources. The costs related to these services have been allocated to the Fuels Delivery Segment using management's internally developed methodology primarily based on employee headcount. Management believes this is a reasonable method for allocating these indirect corporate expenses. The allocation is not necessarily representative of the operating expenses that would have been incurred had the Fuels Delivery Segment operated on a stand-alone basis for the periods presented, nor is it representative of the costs expected to be incurred in subsequent periods. For the three months ended March 31, 2002 and 2003, total operating expenses include $268 and $271 of allocated corporate costs, respectively included in operating supplies and expenses.
The accompanying condensed financial statements have been prepared, without audit, pursuant to the rules and regulations of the Securities and Exchange Commission (the Commission). The information furnished in the condensed financial statements includes normal recurring adjustments and reflects all adjustments, which are, in the opinion of management, necessary for a fair presentation of such financial statements. Certain information and footnote disclosures normally included in financial statements prepared in accordance with U.S. generally accepted accounting principles have been condensed or omitted pursuant to the Commission's rules and regulations. Although the Company believes that the disclosures are adequate to make the information presented not misleading, it is suggested that these condensed financial statements be read in conjunction with the audited financial statements and the notes thereto included elsewhere in this prospectus.
The operating results for the three months ended March 31, 2002 and 2003 are not necessarily indicative of the results that may be expected for the entire year.
Revenue Recognition
The Company recognizes revenue on the date of product delivery to consignee. Related expenses are recognized as incurred.
Income Taxes
The shareholders of the Parent have elected to be taxed under the provisions of Subchapter S of the Internal Revenue Code. As such, taxable income of the Company is included in the individual tax returns of the shareholders, and the statement of income does not include any provisions for federal income taxes. State taxes have been recorded based on statutory rates in states in which the Company operates.
F-50
Fuels Delivery Operations of Beneto, Inc.
Notes to Condensed Financial Statements (Continued)
Three Months ended March 31, 2002 and 2003
Unaudited
(in Thousands)
1. Nature of Business and Significant Accounting Policies (Continued)
Freight and Casualty Claims Payable
Claims payable represent the estimated cost of open claims that are retained and paid by the Company under its programs for workers' compensation, bodily injury and property damage. These estimates are based upon historical information along with certain assumptions about future cash flows. Changes in assumptions for such things as medical costs, environmental hazards, and legal actions, as well as changes in actual experience could cause these estimates to change. In the accompanying statements of income, workers' compensation and group medical costs are included in wages and employee benefits expenses, and other claims costs are included in insurance and claims expense.
Concentrations of Credit Risk
The Company sells services and extends credit based on an evaluation of the customer's financial condition, without requiring collateral. Exposure to losses on receivables is principally dependent on each customer's financial condition. On a regular basis, the Company evaluates its accounts receivable and establishes the allowance for doubtful accounts based on a combination of specific customer circumstances, credit conditions and historical write-offs and collections. The allowance for doubtful accounts was $40 and $60 at December 31, 2002 and March 31, 2003, respectively.
2. Related Party Transactions
Included in the Company's statement of income are expenditures for rent paid to the Company's former Parent and certain of its shareholders of $153 and $159 for the three months ended March 31, 2002 and 2003, respectively. If the Fuels Delivery Segment had operated independently from its former parent, rent expense would have been approximately $325 for each of the periods presented.
3. Contingencies
In the ordinary course of business, the Company is the subject of, or party to, pending or threatened litigation, assessments and claims. While it is not possible to predict with certainty the outcome of such matters individually or in the aggregate, management believes that the ultimate result will not have a material effect on the financial position, results of operations or cash flows of the Company.
4. Supplemental Cash Flow Information
In conjunction with the purchase of new revenue equipment, the Company will periodically receive value for the trade-in of used revenue equipment as a reduction to the total cash consideration paid for the new equipment. The value of assets traded-in in these monetary transactions was $31 and $405 in the three months ended March 31, 2002 and 2003, respectively.
5. Subsequent Event
On May 31, 2003, certain assets (primarily revenue equipment and prepaid insurance) were acquired and certain liabilities (wage and benefit related liabilities) were assumed of the Fuels Delivery Segment by The Kenan Advantage Group, Inc. for aggregate consideration of approximately $32.9 million consisting of $31.4 million in cash and a note payable to one of the shareholders of the Parent in the amount of $1.5 million.
F-51
REPORT OF INDEPENDENT REGISTERED PUBLIC ACCOUNTING FIRM
Board of Directors and Stockholders
The Kenan Advantage Group, Inc.
We have audited the accompanying balance sheet of Carl Klemm, Inc. as of September 30, 2002, and the related statement of income, changes in stockholders' equity and cash flows for the year then ended. These financial statements are the responsibility of the Company's management. Our responsibility is to express an opinion on these financial statements based on our audit.
We conducted our audit in accordance with the standards of the Public Company Accounting Oversight Board (United States). Those standards require that we plan and perform the audit to obtain reasonable assurance about whether the financial statements are free of material misstatement. An audit includes examining, on a test basis, evidence supporting the amounts and disclosures in the financial statements. An audit also includes assessing the accounting principles used and significant estimates made by management, as well as evaluating the overall financial statement presentation. We believe that our audit provides a reasonable basis for our opinion.
In our opinion, the financial statements referred to above present fairly, in all material respects, the financial position of Carl Klemm, Inc. as of September 30, 2002, and the results of its operations and cash flows for the year then ended in conformity with U.S. generally accepted accounting principles.
/s/ ERNST & YOUNG LLP
August 6, 2003
Akron, Ohio
F-52
Carl Klemm, Inc.
Balance Sheet
September 30, 2002
| Assets | ||||
| Current assets: | ||||
| Cash | $ | 393,570 | ||
| Accounts receivable, less allowance for doubtful accounts of $50,000 | 3,964,923 | |||
| Prepaid supplies | 490,915 | |||
| Prepaid expenses | 458,019 | |||
| Total current assets | 5,307,427 | |||
Property and equipment: | ||||
| Tractors and trailers | 12,970,466 | |||
| Other vehicles | 292,292 | |||
| Office equipment and computers | 713,842 | |||
| Shop equipment | 311,487 | |||
| Leasehold improvements | 64,182 | |||
| 14,352,269 | ||||
| Less accumulated depreciation | 4,293,223 | |||
| Property and equipment, net | 10,059,046 | |||
Other assets: | ||||
| Federal tax deposit | 30,930 | |||
| Goodwill, less accumulated amortization of $838,649 | 2,512,949 | |||
| Total other assets | 2,543,879 | |||
| Total assets | $ | 17,910,352 | ||
Liabilities and stockholders' equity | ||||
| Current liabilities: | ||||
| Note payable—line of credit | $ | 1,050,000 | ||
| Current maturities of long-term debt | 2,000,000 | |||
| Accounts payable | 2,773,579 | |||
| Advance from affiliate | 27,000 | |||
| Accrued expenses | 885,613 | |||
| Total current liabilities | 6,736,192 | |||
Long-term debt, less current maturities | 6,950,931 | |||
| Total liabilities | 13,687,123 | |||
Stockholders' equity: | ||||
| Common stock, $100 par value; authorized 1,000 shares; issued and outstanding 190 shares | 19,000 | |||
| Retained earnings | 4,204,229 | |||
| Total stockholders' equity | 4,223,229 | |||
| Total liabilities and stockholders' equity | $ | 17,910,352 | ||
See accompanying notes to financial statements.
F-53
Carl Klemm, Inc.
Statement of Income
Year ended September 30, 2002
| Revenue | $ | 41,763,519 | |||
Direct operating expenses | 37,204,835 | ||||
| Administrative and general expenses | 2,435,648 | ||||
| 39,640,483 | |||||
| Operating income | 2,123,036 | ||||
Other income (expense): | |||||
| Interest income | 9,283 | ||||
| Interest expense | (518,071 | ) | |||
| Miscellaneous income | 105,570 | ||||
| Gain on sale of property and equipment | 135,246 | ||||
| (267,972 | ) | ||||
| Net income | $ | 1,855,064 | |||
See accompanying notes to financial statements.
F-54
Carl Klemm, Inc.
Statement of Changes in Stockholders' Equity
| | Common Stock | | | |||||||||
|---|---|---|---|---|---|---|---|---|---|---|---|---|
| | Number of Shares | Par Value | Retained Earnings | Total | ||||||||
| Balance at September 30, 2001 | 190 | $ | 19,000 | $ | 2,529,019 | $ | 2,548,019 | |||||
| Net income | — | — | 1,855,064 | 1,855,064 | ||||||||
| Distributions to stockholders | — | — | (179,854 | ) | (179,854 | ) | ||||||
| Balance at September 30, 2002 | 190 | $ | 19,000 | $ | 4,204,229 | $ | 4,223,229 | |||||
See accompanying notes to financial statements.
F-55
Carl Klemm, Inc.
Statement of Cash Flows
Year ended September 30, 2002
| Operating activities | ||||||
| Net income | $ | 1,855,064 | ||||
| Adjustments to reconcile net income to net cash provided by (used in) operating activities: | ||||||
| Depreciation | 1,671,941 | |||||
| Amortization | 223,373 | |||||
| Gain on sale of property and equipment | (135,246 | ) | ||||
| Changes in operating assets and liabilities: | ||||||
| Accounts receivable | 20,080 | |||||
| Prepaid expenses | (209,562 | ) | ||||
| Inventory | (125,306 | ) | ||||
| Accounts payable | 629,317 | |||||
| Accrued expenses | 11,393 | |||||
| Payment of federal tax deposit | (30,930 | ) | ||||
| Net cash provided by operating activities | 3,910,124 | |||||
Investing activities | ||||||
| Proceeds from sale of property and equipment | 282,450 | |||||
| Purchase of property and equipment | (3,547,165 | ) | ||||
| Net cash used in investing activities | (3,264,715 | ) | ||||
Financing activities | ||||||
| Advance from affiliate | 4,000 | |||||
| Net borrowings on revolving credit agreements | (19,246 | ) | ||||
| Proceeds from long-term debt | 1,325,000 | |||||
| Principal payments on long-term debt | (1,479,650 | ) | ||||
| Distributions to stockholders | (179,854 | ) | ||||
| Net cash used in financing activities | (349,750 | ) | ||||
| Increase in cash | 295,659 | |||||
| Cash at beginning of year | 97,911 | |||||
| Cash at end of year | $ | 393,570 | ||||
| Supplemental disclosure of cash flow information | ||||||
| Cash payments for interest | $ | 513,826 | ||||
| Supplemental schedule of noncash investing and financing activities | ||||||
| Net book value of asset traded | $ | 40,744 | ||||
| Long-term debt refinanced | $ | 8,559,970 | ||||
See accompanying notes to financial statements.
F-56
Carl Klemm, Inc.
Notes to Financial Statements
September 30, 2002
1. Nature of Business and Significant Accounting Policies
Nature of Business
The Company is a regional carrier of bulk petroleum products for major oil companies and local petroleum retailers. The Company also transports liquid chemical products for various industries. The Company grants unsecured credit to its customers under terms customary to the industry.
Revenue Recognition
The Company recognizes revenue as earned on the date of product delivery to consignee. Related expenses are recognized as incurred.
Advertising Costs
The Company expenses advertising costs as they are incurred. Total advertising costs were $48,190 for the year ended September 30, 2002.
Cash and Cash Equivalents
The Company considers all highly liquid instruments with a maturity of three months or less when purchased to be cash equivalents
Prepaid Supplies
Prepaid supplies of fuel, tires and parts are stated at the lower of cost (first-in, first out) or market.
Property and equipment
Property and equipment is stated at cost. Depreciation is computed using straight-line and accelerated methods over the estimated useful lives of the assets as follows:
| Asset | Estimated Useful Life | |
|---|---|---|
| Tractors | 5–7 years | |
| Trailers | 10 years | |
| Vehicles | 5 years | |
| Office equipment and computers | 5 years | |
| Shop equipment | 5 years | |
| Leasehold improvements | 15 years |
Repairs and maintenance expenditures that are not considered improvements and do not extend the useful life of property are charged to expense as incurred. Expenditures for improvements and major renewals are capitalized.
The Company periodically reviews its property and equipment used in operations when indicators of impairment are present. Impairment losses are recorded to write down the related assets to fair market value when the undiscounted future cash flows estimated to be generated by those assets are less than the assets' carrying amount. No impairment charges were necessary to be recorded in 2002.
F-57
Carl Klemm, Inc.
Notes to Financial Statements (Continued)
September 30, 2002
1. Nature of Business and Significant Accounting Policies (Continued)
Effective October 1, 2002, the Company adopted Statement of Financial Accounting Standards (SFAS) No. 144,Accounting for the Impairment or Disposal of Long-Lived Assets. Long-lived assets, other than goodwill, are reviewed utilizing relevant cash flow and profitability information if facts and circumstances indicate that a potential impairment of carrying value exists. The asset would be considered impaired when the future net undiscounted cash flows generated by the assets are less than its carrying value. An impairment loss would be recognized based on the amount by which the carrying value of the asset exceeds its fair value. The Company does not expect the adoption of SFAS No. 144 to have a significant impact on its financial position, results of operations or cash flows.
Income Taxes
The Company has elected to be taxed under the provisions of Subchapter S of the Internal Revenue Code. Accordingly, the financial statements do not include a provision for income taxes because the Company does not incur federal or state income taxes. Instead, its earnings and losses are included in the stockholders' personal income tax returns and are taxed based on their personal tax strategies.
The Company reports certain items for income tax purposes on a basis different from that reflected in the accompanying financial statements. The principal differences are related to the depreciation of certain assets on accelerated methods and reserves and accruals not currently deductible for income tax purposes. The tax liabilities relating to the reversal of temporary differences in future years will be the responsibility of the stockholders unless the S corporation election is terminated, at which time deferred income taxes applicable to the temporary differences would be recorded by the Company through an adjustment to income from continuing operations.
It is the Company's intent to distribute funds to the stockholders to satisfy their personal tax liabilities as a result of the Company's income being included on the stockholders' personal income tax returns.
Goodwill
Goodwill represents the excess of the purchase price over the net asset acquired and is amortized on a straight-line basis over 15 years.
Effective October 1, 2002, the Company adopted SFAS No. 142,Goodwill and Other Intangible Assets. SFAS No. 142 eliminates the amortization of goodwill and indefinite lived intangible assets. The Statement also requires an initial goodwill impairment assessment in the year of adoption and annual impairment tests thereafter. The Company has not completed the initial transitional impairment review; however, they do not expect any impairment charges to be necessary to be recorded. As of September 30, 2002, the Company had net unamortized goodwill of $2,512,949. Goodwill amortization was $223,373 for 2002 and will be zero for 2003.
Financial Instruments
The carrying value of accounts receivable and accounts payable are a reasonable estimate of their fair value due to the short term nature of these instruments. The carrying value of the Company's
F-58
Carl Klemm, Inc.
Notes to Financial Statements (Continued)
September 30, 2002
1. Nature of Business and Significant Accounting Policies (Continued)
variable rate debt approximates its fair value. The carrying value of the Company's fixed rate debt approximates its fair value given the fact that no market exists for the instrument.
Concentration of Credit Risk
The Company sells services and extends credit based on an evaluation of the customer's financial condition, without requiring collateral. Exposure to losses on receivables is principally dependent on each customer's financial condition. The Company monitors its exposure for credit losses and maintains allowances for anticipated losses. The allowance for doubtful accounts was $50,000 as of September 30, 2002.
Use of Estimates
Management uses estimates and assumptions in preparing financial statements. Those estimates and assumptions affect the reported amounts of assets and liabilities, the disclosure of contingent assets and liabilities and the reported revenues and expenses. Actual results could differ from those estimates.
2. Change in Ownership
On January 12, 1999, G&J Acquisition, Inc. acquired 100% of the outstanding common stock (190 shares) of the Company from the sole stockholder for $4,723,000, which exceeded the fair value of the Company's net assets on that date by $3,351,598, which has been recorded as goodwill. The transaction was accounted for under the purchase method of accounting in accordance with Accounting Principles Board Opinion No. 16.
3. Note Payable—Line of Credit
In accordance with a line of credit agreement with a bank, the Company can borrow up to $1,250,000 on a demand basis. Borrowings under this agreement provide for interest at the bank's prime rate less 0.65% (4.1% at September 30, 2002) and are secured by a general business security agreement, an assignment of life insurance and the personal guarantees of the stockholders. The balance outstanding as of September 30, 2002 was $1,050,000.
F-59
Carl Klemm, Inc.
Notes to Financial Statements (Continued)
September 30, 2002
4. Long-Term Debt
Long-term debt consists of the following:
| | 2002 | ||
|---|---|---|---|
| Note payable to bank, bearing interest at 4.10%* per annum, secured by a general business security agreement, personal guarantees and life insurance policies on the stockholders, payable in monthly installments of $120,741 including interest, due February, 2005. | 5,139,350 | ||
Note payable to bank, bearing interest at 6.00% per annum, secured by a general business security agreement, personal guarantees and life insurance policies on the stockholders, payable in monthly installments of $52,942 including interest, due February, 2005. | 2,212,623 | ||
Note payable to bank, bearing interest at 4.10%* per annum, secured by a general business security agreement, personal guarantees and life insurance policies on the stockholders, payable in monthly installments of interest only, due February, 2003 (see Note 11). | 1,325,000 | ||
Note payable to former stockholder, bearing interest at 6.00% per annum, secured by the personal guarantees of the stockholders, payable in monthly installments of $7,749 including interest, due December, 2005. | 273,958 | ||
| 8,950,931 | |||
| Less current maturities | 2,000,000 | ||
| $ | 6,950,931 | ||
- *
- Bank's prime rate less 0.65%.
Aggregate maturities on long-term debt for the years ending September 30 are as follows:
| 2003 | $ | 2,000,000 | |
| 2004 | 2,230,000 | ||
| 2005 | 4,690,000 | ||
| 2006 | 31,000 | ||
| $ | 8,951,000 | ||
In conjunction with the notes payable to bank and the revolving credit agreement, the Company has agreed, among other things to: (1) limit the amount of capital acquisitions, (2) maintain certain tangible net worth and debt-to-equity ratios, (3) maintain specific current and debt service coverage ratios and (4) limit the amount of liens, except those in favor of the bank.
The Company was in violation of certain of these covenants as of September 30, 2002; however, these violations have been waived by the lender.
F-60
Carl Klemm, Inc.
Notes to Financial Statements (Continued)
September 30, 2002
5. Related Parties
The Company is related to Highway Transport, Inc. and K.A.K. Enterprises through common ownership. Balances at September 30, 2002 and activity for the year then ended with respect to these related parties are summarized below:
| Advance from affiliate | $ | 27,000 | |
| Direct and general expenses paid to related company | 173,800 |
6. Accrued Expenses
Accrued expenses consist of the following:
| | 2002 | ||
|---|---|---|---|
| Salaries and wages | $ | 668,495 | |
| Payroll taxes and other withholdings | 9,369 | ||
| Interest | 38,200 | ||
| Profit sharing | 64,132 | ||
| Property taxes | 25,000 | ||
| Other | 80,417 | ||
| $ | 885,613 | ||
7. Operating Leases
The Company leases its facilities from K.A.K. Enterprises, a related party, for a gross monthly rent of $14,500 per month under various leases, which expire in December, 2005. The Company is responsible for insurance and normal maintenance on these facilities. Lease expense under these leases was $174,000 for the year ended September 30, 2002.
The Company also leases storage facilities from unrelated parties at various locations on a month-to-month basis. Lease expense under these leases was $81,946 for the year ended September 30, 2002.
The Company leases tractors and trailers from various leasing companies with various expiration dates through May, 2006. The Company is responsible for insurance and all maintenance and operating expenses on the equipment. The Company also leases tractors and trailers under various month-to-month operating leases. Lease expense was $1,702,980 for the year ended September 30, 2002.
Certain tractor and trailer leases contain purchase options at prevailing market-based rates at the end of the lease term.
Future minimum lease payments for the years ending September 30 are as follows:
| 2003 | $ | 1,386,000 | |
| 2004 | 1,046,000 | ||
| 2005 | 705,000 | ||
| 2006 | 101,000 |
F-61
Carl Klemm, Inc.
Notes to Financial Statements (Continued)
September 30, 2002
8. Commitments and Contingencies
The Company has outstanding letters of credit with a bank, as required by the Company's insurance provider and the Wisconsin Department of Registration for commercial vehicles. As of September 30, 2002, the letters of credit approximated $587,000.
9. Profit-Sharing Plan
The Company sponsors a qualified, contributory 401(k) profit-sharing plan which covers substantially all employees. The Company's contribution to the Plan is discretionary and is currently based on 25% of employee contributions up to 6% of an employee's salary. Company contributions to the Plan for the year ended September 30, 2002 were $64,132.
10. Major Customers
Sales to the Company's top ten customers represented approximately 33% of total revenues with the largest customer representing approximately 12% of total revenues for the year ended September 30, 2002.
The following is information pertaining to the customer as of and for the year ended September 30, 2002:
| Revenues | $ | 5,139,668 | |
| Accounts receivable | 416,263 |
11. Subsequent Events
In February, 2003, the note payable for $1,325,000 discussed in Note 4 matured and was extended through February 2004. The terms of the extension included monthly installments of principal and interest.
On March 6, 2003, the Company purchased certain assets of U.S. Oil Co., Inc. (USO), a Wisconsin corporation. USO is engaged in the business of owning a fleet of transport tractors and trailers and using these vehicles to transport petroleum products to customers throughout the Midwest. This acquisition will strengthen the Company's strategic position in the Midwest. The purchase price of the assets was $1,600,000 and was financed through borrowings from a bank.
On June 27, 2003, substantially all assets and certain liabilities of the Company were purchased by Kenan Advantage Group (KAG) to expand its presence in the upper Midwest region. The aggregate consideration for the acquisition by KAG was approximately $21.5 million, consisting of $14 million in cash, $1 million in equity of the acquiring company and approximately $6.5 million in contingent purchase price. Proceeds from the purchase were used to satisfy all outstanding obligations.
F-62
Carl Klemm, Inc.
Condensed Balance Sheets
| | September 30, 2002 | March 31, 2003 | |||||
|---|---|---|---|---|---|---|---|
| | | (Unaudited) | |||||
| Assets | |||||||
| Current assets: | |||||||
| Cash | $ | 393,570 | $ | 45,181 | |||
| Accounts receivable, net | 3,964,923 | 3,964,980 | |||||
| Prepaid supplies | 490,915 | 465,616 | |||||
| Prepaid expenses | 458,019 | 9,790 | |||||
| Total current assets | 5,307,427 | 4,485,567 | |||||
Property and equipment: | |||||||
| Tractors and trailers | 12,970,466 | 14,906,280 | |||||
| Other vehicles | 292,292 | 318,549 | |||||
| Office equipment and computers | 713,842 | 734,508 | |||||
| Shop equipment | 311,487 | 330,554 | |||||
| Leasehold improvements | 64,182 | 64,182 | |||||
| 14,352,269 | 16,354,073 | ||||||
| Less accumulated depreciation | 4,293,223 | 5,249,406 | |||||
| Property and equipment, net | 10,059,046 | 11,104,667 | |||||
Other assets: | |||||||
| Federal tax deposit | 30,930 | 30,930 | |||||
| Goodwill, less accumulated amortization of $838,649 | 2,512,949 | 2,847,281 | |||||
| Total other assets | 2,543,879 | 2,878,211 | |||||
| Total assets | $ | 17,910,352 | $ | 18,468,445 | |||
Liabilities and stockholders' equity | |||||||
| Current liabilities: | |||||||
| Note payable—line of credit | $ | 1,050,000 | $ | 50,000 | |||
| Current maturities of long-term debt | 2,000,000 | 2,000,000 | |||||
| Accounts payable | 2,773,579 | 2,226,315 | |||||
| Advance from affiliate | 27,000 | — | |||||
| Accrued expenses | 885,613 | 1,258,786 | |||||
| Total current liabilities | 6,736,192 | 5,535,101 | |||||
Long-term debt, less current maturities | 6,950,931 | 7,600,782 | |||||
| Total liabilities | 13,687,123 | 13,135,883 | |||||
Stockholders' equity: | |||||||
| Common stock, $100 par value; authorized 1,000 shares; issued and outstanding 190 shares | 19,000 | 19,000 | |||||
| Retained earnings | 4,204,229 | 5,313,562 | |||||
| Total stockholders' equity | 4,223,229 | 5,332,562 | |||||
| Total liabilities and stockholders' equity | $ | 17,910,352 | $ | 18,468,445 | |||
See accompanying notes to financial statements.
F-63
Carl Klemm, Inc.
Condensed Statement of Income
Six Months Ended March 31, 2002 and 2003
Unaudited
| | Six Months Ended March 31, | |||||||
|---|---|---|---|---|---|---|---|---|
| | 2002 | 2003 | ||||||
| Revenue | $ | 19,347,983 | $ | 23,556,382 | ||||
Direct operating expenses | 17,463,298 | 21,125,168 | ||||||
| Administrative and general expenses | 1,029,099 | 1,196,650 | ||||||
| 18,492,397 | 22,321,818 | |||||||
| Operating income | 855,586 | 1,234,564 | ||||||
Other income (expense): | ||||||||
| Interest income | 1,555 | 10,247 | ||||||
| Interest expense | (300,101 | ) | (180,568 | ) | ||||
| Miscellaneous income | (51,745 | ) | 55,642 | |||||
| Gain on sale of property and equipment | 44,947 | 39,448 | ||||||
| (305,344 | ) | (75,231 | ) | |||||
| Net income | $ | 550,242 | $ | 1,159,333 | ||||
See accompanying notes to financial statements.
F-64
Carl Klemm, Inc.
Condensed Statement of Cash Flows
Six Months Ended March 31, 2002 and 2003
Unaudited
| | Six Months Ended March 31, | ||||||||
|---|---|---|---|---|---|---|---|---|---|
| | 2002 | 2003 | |||||||
| Operating activities | |||||||||
| Net income | $ | 550,242 | $ | 1,159,333 | |||||
| Adjustments to reconcile net income to net cash provided by operating activities: | |||||||||
| Depreciation | 767,750 | 965,750 | |||||||
| Amortization | 111,687 | 5,667 | |||||||
| Gain on sale of property and equipment | (44,947 | ) | (39,448 | ) | |||||
| Changes in operating assets and liabilities: | |||||||||
| Accounts receivable | 254,267 | (57 | ) | ||||||
| Prepaid expenses | 74,278 | 448,229 | |||||||
| Prepaid supplies | (35,664 | ) | 25,299 | ||||||
| Accounts payable | 38,758 | (547,264 | ) | ||||||
| Accrued expenses | 100,950 | 373,173 | |||||||
| Net cash provided by operating activities | 1,817,321 | 2,390,682 | |||||||
Investing activities | |||||||||
| Proceeds from sale of property and equipment | 157,950 | 66,190 | |||||||
| Purchase of property and equipment | (967,119 | ) | (778,112 | ) | |||||
| Cash paid for acquisition | — | (1,600,000 | ) | ||||||
| Net cash used in investing activities | (809,169 | ) | (2,311,922 | ) | |||||
Financing activities | |||||||||
| Payment of advance from affiliate | — | (27,000 | ) | ||||||
| Payments of net borrowings on revolving credit agreements | (319,247 | ) | (1,000,000 | ) | |||||
| Proceeds from long-term debt | — | 1,600,000 | |||||||
| Principal payments on long-term debt | (706,825 | ) | (950,149 | ) | |||||
| Distributions to stockholders | (80,000 | ) | (50,000 | ) | |||||
| Net cash used in financing activities | (1,106,072 | ) | (427,149 | ) | |||||
| Decrease in cash | (97,920 | ) | (348,389 | ) | |||||
| Cash at beginning of period | 97,920 | 393,570 | |||||||
| Cash at end of period | $ | — | $ | 45,181 | |||||
See accompanying notes to financial statements.
F-65
Carl Klemm, Inc.
Notes to Condensed Financial Statements
Six Months Ended March 31, 2002 and 2003
Unaudited
1. Nature of Business and Significant Accounting Policies
Basis of Presentation
The accompanying condensed financial statements have been prepared, without audit, pursuant to the rules and regulations of the Securities and Exchange Commission (the Commission). The information furnished in the condensed financial statements includes normal recurring adjustments and reflects all adjustments, which are, in the opinion of management, necessary for a fair presentation of such financial statements. Certain information and footnote disclosures normally included in financial statements prepared in accordance with accounting principles generally accepted in the United States have been condensed or omitted pursuant to the Commission's rules and regulations. Although the Company believes that the disclosures are adequate to make the information presented not misleading, it is suggested that these condensed financial statements be read in conjunction with the audited consolidated financial statements and the notes thereto included elsewhere in this prospectus.
The operating results for the six months ended March 31, 2002 and 2003 are not necessarily indicative of the results that may be expected for the entire fiscal year.
Nature of Business
The Company is a regional carrier of bulk petroleum products for major oil companies and local petroleum retailers. The Company also transports liquid chemical products for various industries.
Revenue Recognition
The Company recognizes revenue as earned on the date of product delivery to consignee. Related expenses are recognized as incurred.
Income Taxes
The Company has elected to be taxed under the provisions of Subchapter S of the Internal Revenue Code. Accordingly, the financial statements do not include a provision for income taxes because the Company does not incur federal or state income taxes. Instead, its earnings and losses are included in the stockholders' personal income tax returns and are taxed based on their personal tax strategies.
The Company reports certain items for income tax purposes on a basis different from that reflected in the accompanying financial statements. The principal differences are related to the depreciation of certain assets on accelerated methods and reserves and accruals not currently deductible for income tax purposes. The tax liabilities relating to the reversal of temporary differences in future years will be the responsibility of the stockholders unless the S corporation election is terminated, at which time deferred income taxes applicable to the temporary differences would be recorded by the Company through an adjustment to income from continuing operations.
It is the Company's intent to distribute funds to the stockholders to satisfy their personal tax liabilities as a result of the Company's income being included on the stockholders' personal income tax returns.
F-66
Carl Klemm, Inc.
Notes to Condensed Financial Statements
Six Months Ended March 31, 2002 and 2003
Unaudited (Continued)
1. Nature of Business and Significant Accounting Policies (Continued)
Goodwill
Goodwill represents the excess of the purchase price over the net asset acquired.
Effective October 1, 2002, the Company adopted SFAS No. 142,Goodwill and Other Intangible Assets. SFAS No. 142 eliminates the amortization of goodwill and indefinite lived intangible assets. The Statement also requires an initial goodwill impairment assessment in the year of adoption and annual impairment tests thereafter. No impairment charges were necessary as a result of the completion of the initial transitional impairment review.
Goodwill amortization was $111,686 and $0 for the six months ended March 31, 2002 and 2003, respectively. Had goodwill not been amortized during the six months ended March 31, 2002, net income would have been $661,929. The change in the carrying amount of goodwill from September 30, 2002 relates to the acquisition described in Note 2.
Financial Instruments
The carrying value of accounts receivable and accounts payable are a reasonable estimate of their fair value due to the short term nature of these instruments. The carrying value of the Company's variable rate debt approximates its fair value. The carrying value of the Company's fixed rate debt approximates its fair value given the fact that no market exists for the instrument.
Concentration of Credit Risk
The Company sells services and extends credit based on an evaluation of the customer's financial condition, without requiring collateral. Exposure to losses on receivables is principally dependent on each customer's financial condition. The Company monitors its exposure for credit losses and maintains allowances for anticipated losses. The allowance for doubtful accounts was $50,000 and $65,000 as of September 30, 2002 and March 31, 2003, respectively.
2. Acquisitions
On March 6, 2003, the Company purchased certain assets of U.S. Oil Co., Inc. (USO), a Wisconsin corporation. USO, through its privately owned fleet of transport tractors and trailers, provided petroleum transportation services to customers throughout the Midwest. This acquisition will strengthen the Company's strategic position in the Midwest. The purchase price of the assets was $1,600,000 and was financed through borrowings from a bank.
The assets acquired were recorded at their estimated fair values on the acquisition date and the excess of the purchase price over the fair value of net assets acquired of $340,000 was recorded as goodwill.
3. Note Payable—Line of Credit
In accordance with a line of credit agreement with a bank, the Company can borrow up to $1,250,000 on a demand basis. Borrowings under this agreement provide for interest at the bank's prime rate less 0.65% (4.1% at September 30, 2002 and 3.6% at March 31, 2003) and are secured by a
F-67
Carl Klemm, Inc.
Notes to Condensed Financial Statements
Six Months Ended March 31, 2002 and 2003
Unaudited (Continued)
3. Note Payable—Line of Credit (Continued)
general business security agreement, an assignment of life insurance and the personal guarantees of the stockholders. The balance outstanding as of September 30, 2002 and March 31, 2003 was $1,050,000 and $50,000, respectively.
4. Long-Term Debt
Long-term debt consists of the following:
| | September 30, 2002 | March 31, 2003 | ||||
|---|---|---|---|---|---|---|
| | | (Unaudited) | ||||
| Note payable to bank, bearing interest at prime plus 0.65% per annum, due February, 2005 | $ | 5,139,350 | $ | 4,482,331 | ||
Note payable to bank, bearing interest at 6.00% per annum, due February, 2005 | 2,212,623 | 1,958,187 | ||||
Note payable to bank, bearing interest at prime plus 0.65% per annum, due February, 200. | 1,325,000 | 1,325,000 | ||||
Note payable to bank, bearing interest at 30 day libor, plus 2.25% (3.62%) per annum, due March, 2006 | — | 1,600,000 | ||||
Note payable to former stockholder, bearing interest at 6.00% per annum, due December, 2005 | 273,958 | 235,264 | ||||
| 8,950,931 | 9,600,782 | |||||
| Less current maturities | 2,000,000 | 2,000,000 | ||||
| $ | 6,950,931 | $ | 7,600,782 | |||
In February, 2003, the note payable for $1,325,000 matured and was extended through February 2004. The terms of the extension included monthly installments of principal and interest.
In conjunction with the notes payable to bank and the revolving credit agreement, the Company has agreed, among other things to: (1) limit the amount of capital acquisitions, (2) maintain certain tangible net worth and debt-to-equity ratios, (3) maintain specific current and debt service coverage ratios and (4) limit the amount of liens, except those in favor of the bank.
The Company was in violation of certain of these covenants as of September 30, 2002; however, these violations have been waived by the lender. As of March 31, 2003, the Company was in compliance with these covenants.
5. Related Parties
The Company is related to Highway Transport, Inc. and K.A.K. Enterprises through common ownership. Advances from affiliates were $27,000 and $0 at September 30, 2002 and March 31, 2003, respectively. Direct and general expenses paid to the related party were $86,400 and $92,400 for the six months ended March 31, 2002 and 2003, respectively.
F-68
Carl Klemm, Inc.
Notes to Condensed Financial Statements
Six Months Ended March 31, 2002 and 2003
Unaudited (Continued)
6. Accrued Expenses
Accrued expenses consist of the following:
| | September 30, 2002 | March 31, 2003 | ||||
|---|---|---|---|---|---|---|
| | | (Unaudited) | ||||
| Salaries and wages | $ | 668,495 | $ | 828,764 | ||
| Payroll taxes and other withholdings | 9,369 | 73,191 | ||||
| Interest | 38,200 | 38,200 | ||||
| Profit sharing | 64,132 | 113,132 | ||||
| Property taxes | 25,000 | 16,139 | ||||
| Other | 80,417 | 189,360 | ||||
| $ | 885,613 | $ | 1,258,786 | |||
7. Commitments and Contingencies
The Company has outstanding letters of credit with a bank, as required by the Company's insurance provider and the Wisconsin Department of Registration for commercial vehicles. As of September 30, 2002 and March 31, 2003, the letters of credit approximated $587,000 and $951,582, respectively.
8. Major Customers
Sales to the Company's top ten customers represented approximately 29.1% and 31.4% of total revenues with the largest customer representing approximately 11.3% and 11.2% of total revenues for the six months ended March 31, 2002 and 2003, respectively. Outstanding accounts receivable for this customer at September 30, 2002 and March 31, 2003 were $375,463 and $371,050, respectively. Total revenues relating to this customer for the six months ended March 31, 2002 and 2003 were $2,188,049 and $2,639,376, respectively.
9. Subsequent Event
On June 29, 2003, substantially all assets and certain liabilities of the Company were purchased by The Kenan Advantage Group (KAG) to expand its presence in the upper Midwest region. The aggregate consideration for the acquisition by KAG was approximately $21.5 million, consisting of $14 million in cash, $1 million in equity of the acquiring company and approximately $6.5 million in contingent purchase price. Proceeds from the purchase were used to satisfy all outstanding obligations.
F-69
Part II
Information Not Required in Prospectus
Item 13. Other Expenses of Issuance and Distribution.
The following table sets forth the various expenses, other than underwriting discounts and commissions, payable by the Registrant in connection with the sale of common stock being registered. All of the amounts shown are estimated except the Securities and Exchange Commission registration fee, the National Association of Securities Dealers, Inc. ("NASD") filing fee and The Nasdaq Stock Market's National Market listing fee.
| | Amount to Be Paid | ||
|---|---|---|---|
| SEC registration fee | $ | 11,657 | |
| NASD filing fee | $ | 12,000 | |
| Nasdaq National Market listing fee* | $ | ||
| Printing and engraving expenses* | $ | ||
| Legal fees and expenses* | $ | ||
| Accounting fees and expenses* | $ | ||
| Blue sky fees and expenses* | $ | ||
| Transfer agent and registrar fees* | $ | ||
| Miscellaneous fees and expenses* | $ | ||
| Total | $ | ||
- *
- To be completed by amendment.
Item 14. Indemnification of Directors and Officers.
Section 145(a) of the General Corporation Law of the State of Delaware (the "DGCL") provides that a Delaware corporation may indemnify any person who was or is a party or is threatened to be made a party to any threatened, pending or completed action, suit or proceeding, whether civil, criminal, administrative or investigative (other than an action by or in the right of the corporation), by reason of the fact that he is or was a director, officer, employee or agent of the corporation or is or was serving at the request of the corporation as a director, officer, employee or agent of another corporation or enterprise, against expenses, judgments, fines and amounts paid in settlement actually and reasonably incurred by him in connection with such action, suit or proceeding if he acted in good faith and in a manner he reasonably believed to be in or not opposed to the best interests of the corporation, and, with respect to any criminal action or proceeding, had no reasonable cause to believe his conduct was unlawful.
Section 145(b) provides that a Delaware corporation may indemnify any person who was or is a party or is threatened to be made a party to any threatened, pending or completed action or suit by or in the right of the corporation to procure a judgment in its favor by reason of the fact that such person acted in any of the capacities set forth above, against expenses actually and reasonably incurred by him in connection with the defense or settlement of such action or suit if he acted under standards similar to those discussed above, except that no indemnification may be made in respect of any claim, issue or matter as to which such person shall have been adjudged to be liable to the corporation unless and only to the extent that the court in which such action or suit was brought shall determine that despite the adjudication of liability, such person is fairly and reasonably entitled to be indemnified for such expenses which the Court shall deem proper.
II-1
Section 145 further provides that to the extent a director or officer of a corporation has been successful in the defense of any action, suit or proceeding referred to in subsections (a) and (b) or in the defense of any claim, issue or matter therein, he shall be indemnified against expenses actually and reasonably incurred by him in connection therewith; that indemnification provided for by Section 145 shall not be deemed exclusive of any other rights to which the indemnified party may be entitled; and that the corporation may purchase and maintain insurance on behalf of a director or officer of the corporation against any liability asserted against him or incurred by him in any such capacity or arising out of his status as such whether or not the corporation would have the power to indemnify him against such liabilities under such Section 145.
Article VII of the Registrant's bylaws provide that the Registrant shall indemnify any director or officer of the corporation, and may indemnify any other person, who (a) was or is a party or is threatened to be made a party to any threatened, pending or completed action, suit or proceeding, whether civil, criminal, administrative or investigative (other than an action by or in the right of the corporation) by reason of the fact that he or she is or was a director, officer, employee or agent of the corporation, or is or was serving at the request of the corporation as a director, officer, employee or agent of another corporation, partnership, joint venture, trust or other enterprise, against expenses (including attorneys' fees), judgments, fines, and amounts paid in settlement actually and reasonably incurred by him or her in connection with such action, suit or proceeding if he or she acted in good faith and in a manner he or she reasonably believed to be in or not opposed to the best interests of the corporation, and, with respect to any criminal action or proceeding, had no reasonable cause to believe his or her conduct was unlawful, and (b) was or is a party or is threatened to be made a party to any threatened, pending or completed action or suit by or in the right of the corporation to procure a judgment in its favor by reason of the fact that he or she is or was a director, officer, employee or agent of the corporation, or is or was serving at the request of the corporation as a director, officer, employee or agent of another corporation, partnership, joint venture, trust or other enterprise against expenses (including attorneys' fees) actually and reasonably incurred by him or her in connection with the defense or settlement of such action or suit if he or she acted in good faith and in a manner he or she reasonably believed to be in or not opposed to the best interests of the corporation and except that no indemnification shall be made in respect of any claim, issue or matter as to which such person shall have been adjudged to be liable to the corporation unless and only to the extent that the Delaware Court of Chancery or the court in which such action or suit was brought shall determine upon application that, despite the adjudication of liability but in view of all the circumstances of the case, such person is fairly and reasonably entitled to indemnity for such expenses which the Delaware Court of Chancery or such other court shall deem proper.
Section 102(b)(7) of the DGCL provides that a certificate of incorporation may contain a provision eliminating or limiting the personal liability of a director to the corporation or its stockholders for monetary damages for breach of fiduciary duty as a director provided that such provision shall not eliminate or limit the liability of a director: (i) for any breach of the director's duty of loyalty to the corporation or its stockholders; (ii) for acts or omissions not in good faith or which involve intentional misconduct or a knowing violation of law; (iii) under Section 174 of the DGCL; or (iv) for any transaction from which the director derived an improper personal benefit.
Article Tenth of the Registrant's certificate of incorporation, as amended, provides that, to the fullest extent permitted by the DGCL, as it now exists or as it may hereafter be amended, a director of the corporation shall not be personally liable to the corporation or its stockholders for monetary damages for the breach of any fiduciary duty as a director, except for liability (i) for any breach of the director's duty of loyalty to the corporation or its stockholders, (ii) for acts or omissions not in good faith or that involve intentional misconduct or a knowing violation of law, (iii) under Section 174 of the DGCL, as the same exists or hereafter may be amended, or (iv) for any transaction from which the director derived an improper personal benefit.
II-2
In addition, the Registrant has entered into indemnification agreements, in the form attached as Exhibit 10.19 hereto, with its directors and executive officers which would require the Registrant, among other things, to indemnify them against certain liabilities which may arise by reason of their status or service, other than liabilities arising from willful misconduct of a culpable nature.
The Registrant maintains directors' and officers' liability insurance for its officers and directors.
The underwriting agreement filed as Exhibit 1.1 to this Registration Statement contains provisions indemnifying officers and directors of the Registrant against liabilities arising under the Securities Act or otherwise.
Item 15. Recent Sales of Unregistered Securities.
Set forth below in chronological order is certain information regarding securities issued by the Registrant since April 30, 2001 in transactions that were not registered under the Securities Act of 1933, as amended (the "Securities Act"), including the consideration, if any, received by the Registrant for such issuances.
(a) At various times since April 30, 2001, the Registrant has granted stock options under its 2001 Equity Compensation Plan covering an aggregate of shares of the Registrant's common stock to individuals, including employees and consultants of the Registrant.
(b) Pursuant to a stockholders' agreement, dated as of April 30, 2001, the Registrant issued and sold an aggregate of 26,276 shares of its series B preferred stock to a group of accredited investors, for aggregate consideration of approximately $26.3 million.
(d) Pursuant to a warrant purchase agreement, dated as of April 30, 2001, a group of accredited investors comprised of RSTW Partners III, L.P. and Massachusetts Mutual Life Insurance Company and two of its affiliates purchased warrants to purchase an aggregate of 3,844 shares of the Registrant's series D preferred stock and contingent warrants to purchase an aggregate of shares of Registrant's common stock for an aggregate purchase price of $200.00. In addition, warrants previously held by RSTW Partners III, L.P. were converted into warrants to purchase an aggregate of 2,887 shares of the Registrant's series D preferred stock and contingent warrants to purchase an aggregate of shares of Registrant's common stock.
(e) On June 29, 2003, in connection with our acquisition of substantially all of the assets of Carl Klemm, Inc., d/b/a Klemm Tank Lines, we issued 40,000 shares of our common stock at a price of $25.00 per share to pay a portion of the $18.4 million total purchase price.
Each of the above-described transactions were exempt from registration (i) pursuant to Section 4(2) of the Securities Act, or Regulation D promulgated thereunder, as transactions not involving a public offering or (ii) in the case of stock options, as transactions not involving a sale of securities. With respect to each transaction listed above, no general solicitation was made by either the Registrant or any person acting on its behalf; the securities sold are subject to transfer restrictions; and the certificates for the shares or warrants contained an appropriate legend stating such securities have not been registered under the Securities Act and may not be offered or sold absent registration or pursuant to an exemption therefrom. No underwriters were involved in connection with any of the sales of securities referred to in this Item 15.
II-3
Item 16. Exhibits and Financial Statement Schedules.
- (a)
- Exhibits.
| Exhibit No. | Description | |
|---|---|---|
| 1.1* | Form of Underwriting Agreement. | |
3.1 | Certificate of Incorporation, as amended. | |
3.2 | Bylaws. | |
4.1* | Specimen stock certificate. | |
5.1* | Opinion of Fulbright & Jaworski L.L.P. | |
10.1* | Employment Agreement, dated as of April 30, 2001, between Kenan Transport Company and Lee Shaffer. | |
10.2* | Employment Agreement, dated as of April 30, 2001, between Advantage Management Group, Inc. and Carl Young. | |
10.3* | Employment Agreement, dated as of April 30, 2001, between Advantage Management Group, Inc. and Dennis Nash. | |
10.4 | Management Agreement, dated as of April 30, 2001, by and among Sterling Investment Partners Advisors, LLC, KTC/AMG Holdings Corp., Advantage Management Group, Inc. and KTC Acquisition Corp. | |
10.5 | Amended and Restated Management Agreement, dated as of April 30, 2001, by and among Sterling Ventures Limited (as successor-in-interest to Sterling Capital Group LLC), KTC/AMG Holdings Corp., Advantage Management Group, Inc. and KTC Acquisition Corp. | |
10.6 | Management Agreement, dated as of April 30, 2001, by and among RFE Management Corporation, KTC/AMG Holdings Corp., Advantage Management Group, Inc. and KTC Acquisition Corp. | |
10.7* | Second Amended and Restated Credit Agreement, dated as of July 13, 2004, among Advantage Management Group, Inc., Kenan Transport Company, The Kenan Advantage Group, Inc., the lenders from time to time parties thereto, CIBC World Markets Corp. and Canadian Imperial Bank of Commerce. | |
10.8 | Note Purchase Agreement, dated as of April 30, 2001, by and among Advantage Management Group, Inc., Kenan Transport Company, The Kenan Advantage Group, Inc., RSTW Partners III, L.P., Massachusetts Mutual Life Insurance Company, MassMutual Corporate Investors and MassMutual Participation Investors. | |
10.9 | First Amendment and Consent, dated as of September 30, 2002, to the Note Purchase Agreement, among Advantage Management Group, Inc., KTC Acquisition Corp., RSTW Partners III, L.P., Massachusetts Mutual Life Insurance Company, MassMutual Corporate Investors and MassMutual Participation Investors. | |
10.10 | Second Amendment and Consent, dated as of May 30, 2003, to the Note Purchase Agreement, among Advantage Management Group, Inc., Kenan Transport Company, The Kenan Advantage Group, Inc., RSTW Partners III, L.P., Massachusetts Mutual Life Insurance Company, MassMutual Corporate Investors and MassMutual Participation Investors. |
II-4
10.11 | Third Amendment, dated as of December 31, 2003, to the Note Purchase Agreement, among Advantage Management Group, Inc., Kenan Transport Company, The Kenan Advantage Group, Inc., RSTW Partners III, L.P., Massachusetts Mutual Life Insurance Company, MassMutual Corporate Investors and MassMutual Participation Investors. | |
10.12 | Fourth Amendment, dated as of July 13, 2004, to the Note Purchase Agreement, among Advantage Management Group, Inc., Kenan Transport Company, The Kenan Advantage Group, Inc., RSTW Partners III, L.P., Massachusetts Mutual Life Insurance Company, MassMutual Corporate Investors and MassMutual Participation Investors. | |
10.13 | Warrant Purchase Agreement, dated of April 30, 2001, by and among KTC/AMG Holdings Corp., RSTW Partners III, L.P., Massachusetts Mutual Life Insurance Company, MassMutual Corporate Investors and MassMutual Participation Investors. | |
10.14 | Lease, effective as of March 1, 1999, by and between Freedom Investment, Inc. and Advantage Management Group, Inc. | |
10.15* | Lease, effective as of November 1, 2003, by and between Freedom Investment, Inc. and Kenan Advantage Group, Inc. | |
10.16 | The Kenan Advantage Group, Inc. 2001 Equity Compensation Plan. | |
10.17* | Amended and Restated Contingent Senior Management Option Agreement, dated as of April 30, 2001, between Advantage Management Holdings Corp., KTC/AMG Holdings Corp. and Dennis Nash. | |
10.18* | Amended and Restated Contingent Senior Management Option Agreement, dated as of April 30, 2001, between Advantage Management Holdings Corp., KTC/AMG Holdings Corp. and Carl Young. | |
10.19* | Form of Indemnification Agreement between The Kenan Advantage Group, Inc. and each director and executive officer. | |
10.20 | Registration Rights Agreement, dated as of April 30, 2001, by and among KTC/AMG Holdings Corp. and the investors named therein. | |
10.21 | Stockholders' Agreement, dated as of April 30, 2001, by and among KTC/AMG Holdings Corp. and the stockholders named therein. | |
10.22 | Form of Lock-up Agreement executed by certain stockholders of The Kenan Advantage Group, Inc. | |
21.1 | Subsidiaries of the Registrant. | |
23.1* | Consent of Fulbright & Jaworski L.L.P. (included in Exhibit 5.1). | |
23.2 | Consent of Ernst & Young LLP, Independent Registered Public Accounting Firm. | |
24.1 | Power of Attorney (on signature page). |
- *
- To be filed by amendment.
- (b)
- Financial statement schedules.
All financial statement schedules are omitted because they are inapplicable, not required or the information is indicated elsewhere in the consolidated financial statements or the notes thereto.
II-5
Item 17. Undertakings.
A. Insofar as indemnification for liabilities arising under the Securities Act of 1933 may be permitted to directors, officers, and controlling persons of the Registrant pursuant to the provisions described above in Item 14, or otherwise, the Registrant has been advised that in the opinion of the Securities and Exchange Commission such indemnification is against public policy as expressed in the Securities Act of 1933 and is, therefore, unenforceable. In the event that a claim for indemnification against such liabilities (other than the payment by the Registrant of expenses incurred or paid by a director, officer or controlling person of the Registrant in the successful defense of any action, suit or proceeding) is asserted against the Registrant by such director, officer or controlling person in connection with the securities being registered, the Registrant will, unless in the opinion of its counsel the matter has been settled by controlling precedent, submit to a court of appropriate jurisdiction the question of whether such indemnification by it is against public policy as expressed in the Securities Act of 1933 and will be governed by the final adjudication of such issue.
B. The undersigned Registrant hereby undertakes to provide to the underwriters at the closing specified in the underwriting agreement, certificates in such denominations and registered in such names as required by the underwriters to permit prompt delivery to each purchaser.
C. The undersigned Registrant hereby undertakes that:
1. For purposes of determining any liability under the Securities Act of 1933, the information omitted from the form of prospectus filed as part of this Registration Statement in reliance upon Rule 430A and contained in a form of prospectus filed by the registrant pursuant to Rule 424(b)(1) or (4) or 497(h) under the Securities Act shall be deemed to be part of this registration statement as of the time it was declared effective.
2. For the purpose of determining any liability under the Securities Act of 1933, each post-effective amendment that contains a form of prospectus shall be deemed to be a new registration statement relating to the securities offered therein, and the offering of such securities at that time shall be deemed to be the initialbona fide offering thereof.
II-6
Pursuant to the requirements of the Securities Act of 1933, as amended, the registrant has duly caused this registration statement to be signed on its behalf by the undersigned, thereunto duly authorized in the City of Canton, State of Ohio, on July 29, 2004.
| THE KENAN ADVANTAGE GROUP, INC. (Registrant) | |||
By: | /s/ DENNIS A. NASH Name: Dennis A. Nash Title: President and Chief Executive Officer | ||
KNOW ALL PERSONS BY THESE PRESENTS, that each person whose signature appears below constitutes and appoints each of Dennis A. Nash and Carl Young as his true and lawful attorney-in-fact and agent, each acting alone, with full power of substitution and resubstitution, for him and in his name, place and stead, in any and all capacities, to sign any and all amendments (including post-effective amendments) to this registration statement, and to file the same, with all exhibits thereto, and other documents in connection therewith, with the Securities and Exchange Commission, granting unto each said attorney-in-fact and agent full power and authority to do and perform each and every act and thing requisite and necessary to be done in and about the premises, as fully to all intents and purposes as he might or could do in person, and hereby ratifies and confirms all that any said attorney-in-fact and agent, each acting alone, or his substitute or substitutes, may lawfully do or cause to be done by virtue hereof. Pursuant to the requirements of the Securities Act of 1933, as amended, this registration statement has been signed by the following persons in the capacities and on the dates indicated.
| Signature | Title | Date | ||
|---|---|---|---|---|
| /s/ DENNIS A. NASH Dennis A. Nash | President, Chief Executive Officer and Director (Principal Executive Officer) | July 29, 2004 | ||
/s/ CARL YOUNG Carl Young | Chief Financial Officer and Director (Principal Financial and Accounting Officer) | July 29, 2004 | ||
/s/ DENNIS KUPCHIK Dennis Kupchik | Director | July 29, 2004 | ||
/s/ M. WILLIAM MACEY, JR. M. William Macey, Jr. | Director | July 29, 2004 | ||
/s/ DOUGLAS L. NEWHOUSE Douglas L. Newhouse | Director | July 29, 2004 |
II-7
/s/ JAMES A. PARSONS James A. Parsons | Director | July 29, 2004 | ||
/s/ LEE SHAFFER Lee Shaffer | Chairman of the Board | July 29, 2004 |
II-8