Exhibit 99.1

| A.G. EDWARDS CONFERENCE — MAY 15, 2007 |

| Agenda U-Store-It objectives 1 Corporate overview 3 Organizational structure 6 Portfolio overview 11 Financial overview 14 U — S T O R E — I T T R U S T 1 |

| U-Store-It objectivesU-Store-It will seek to grow the business both internally and externallyInternal growth opportunities — Improve physical occupancy — Rate increases to existing tenants — Target reduction in the use of tenant discounts — Improve control over expense growth; increase marginsExternal growth opportunities — Remain an opportunistic acquirer in target markets — Continue to explore joint venture and development opportunitiesU-Store-It has an on-going portfolio evaluation program to help prune the portfolio and determine target dispositions U - S T O R E — I T T R U S T 2 |

| Agenda U-Store-It objectives 1 Corporate overview 3 Organizational structure 6 Portfolio overview 11 Financial overview 14 U — S T O R E — I T T R U S T 3 |

| Introduction to U-Store-It Trust Company snapshot Key financials ($ millions)U-Store-It is a self-administered and self-managed REIT focused on the Financials 2004A 2005A 2006A ownership, operation, acquisition and development of self-storage facilities in Revenue $91.9 $147.6 $213.1 the United States Operating expenses 65.9 113.5 173.9 NOI 55.9 92.1 126.5The company is the sixth largest owner and operator of self-storage facilities in EBITDA 61.6 73.6 104.2 the United States Other statistics Statistic MultipleFounded in July 2004 as the successor to the Amsdell family’s self-storage Price/2007E FFO $1.06 17.0x operations, YSI commenced trading as a public REIT after the Company’s IPO in October 2004 following the merger with Amsdell Partners, Inc. and High Tide Price/2008E FFO 1.20 15.0 LLC EBITDA/interest expense 2.2x Fixed charge coverage 1.9xWith operations in 27 states across the US, the diverse portfolio has its main presence in California, Florida, Texas, Ohio, Illinois, Arizona, Tennessee, Colorado, Connecticut and New Jersey Public market overview Facility overview ($ in millions, except per share data)402 facilities Share price (as of 05/08/07) $18.05 Common shares outstanding 57.427 states Common share equivalents1 5.2 Total shares outstanding 62.6223,543 units Market value of equity $1,130.6 Plus: Total debt 894.325.5 mm rentable Total market capitalization $2,024.9 sq. ft. Less: Cash and cash equivalents (5.6) Firm value $2,019.3 1 Includes options and operating partnership units, $55.0 million of minority interest Source: Company filings (03/31/2007) accounted for in operating partnership units. Assumes treasury stock method for dilutive impact of stock options U — S T O R E — I T T R U S T 4 |

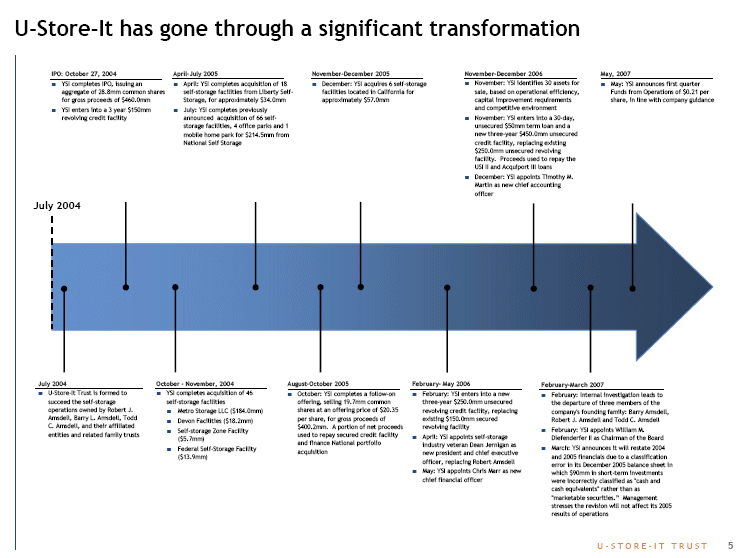
| U-Store-It has gone through a significant transformation IPO: October 27, 2004 April-July 2005 November-December 2005 November-December 2006 May, 2007YSI completes IPO, issuing anApril: YSI completes acquisition of 18December: YSI acquires 6 self-storageNovember: YSI identifies 30 assets forMay: YSI announces first quarter aggregate of 28.8mm common shares self-storage facilities from Liberty Self- facilities located in California for sale, based on operational efficiency, Funds from Operations of $0.21 per for gross proceeds of $460.0mm Storage, for approximately $34.0mm approximately $57.0mm capital improvement requirements share, in line with company guidanceYSI enters into a 3 year $150mmJuly: YSI completes previously and competitive environment revolving credit facility announced acquisition of 66 self-November: YSI enters into a 30-day, storage facilities, 4 office parks and 1 unsecured $50mm term loan and a mobile home park for $214.5mm from new three-year $450.0mm unsecured National Self Storage credit facility, replacing existing $250.0mm unsecured revolving facility. Proceeds used to repay the USI II and Acquiport III loansDecember: YSI appoints Timothy M. Martin as new chief accounting officer July 2004 July 2004 October — November, 2004 August-October 2005 February- May 2006 February-March 2007U-Store-It Trust is formed toYSI completes acquisition of 46October: YSI completes a follow-onFebruary: YSI enters into a newFebruary: Internal investigation leads to succeed the self-storage self-storage facilities offering, selling 19.7mm common three-year $250.0mm unsecured the departure of three members of the operations owned by Robert J.Metro Storage LLC ($184.0mm) shares at an offering price of $20.35 revolving credit facility, replacing company’s founding family: Barry Amsdell, Amsdell, Barry L. Amsdell, Todd per share, for gross proceeds of existing $150.0mm secured Robert J. Amsdell and Todd C. AmsdellDevon Facilities ($18.2mm) C. Amsdell, and their affiliated $400.2mm. A portion of net proceeds revolving facilitySelf-storage Zone FacilityFebruary: YSI appoints William M. entities and related family trusts used to repay secured credit facilityApril: YSI appoints self-storage ($5.7mm) Diefenderfer II as Chairman of the Board and finance National portfolio industry veteran Dean Jernigan asFederal Self-Storage FacilityMarch: YSI announces it will restate 2004 acquisition new president and chief executive ($13.9mm) and 2005 financials due to a classification officer, replacing Robert Amsdell error in its December 2005 balance sheet inMay: YSI appoints Chris Marr as new which $90mm in short-term investments chief financial officer were incorrectly classified as “cash and cash equivalents” rather than as “marketable securities.” Management stresses the revision will not affect its 2005 results of operations U — S T O R E — I T T R U S T 5 |

| Agenda U-Store-It objectives 1 Corporate overview 3 Organizational structure 6 Portfolio overview 11 Financial overview 14 U — S T O R E — I T T R U S T 6 |

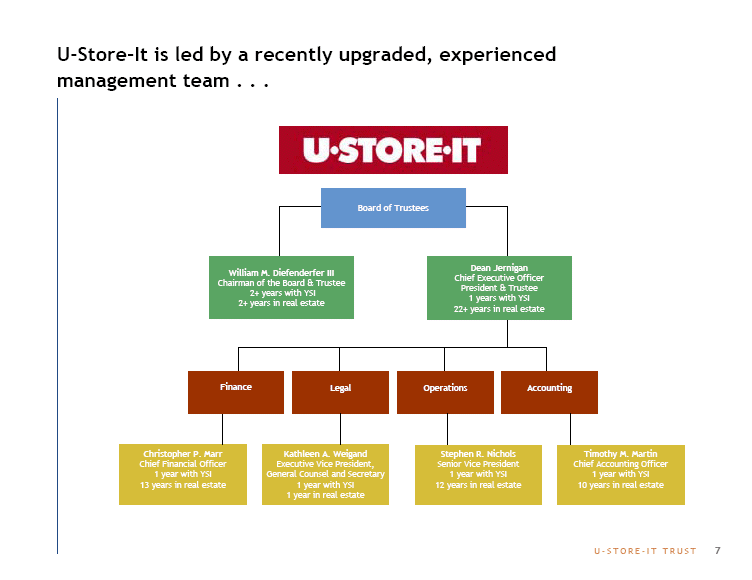
| U-Store-It is led by a recently upgraded, experienced management team . . . Board of Trustees Dean Jernigan William M. Diefenderfer III Chief Executive Officer Chairman of the Board & Trustee President & Trustee 2+ years with YSI 1 years with YSI 2+ years in real estate 22+ years in real estate Finance Legal Operations Accounting Christopher P. Marr Kathleen A. Weigand Stephen R. Nichols Timothy M. Martin Chief Financial Officer Executive Vice President, Senior Vice President Chief Accounting Officer 1 year with YSI General Counsel and Secretary 1 year with YSI 1 year with YSI 13 years in real estate 1 year with YSI 12 years in real estate 10 years in real estate 1 year in real estate U — S T O R E — I T T R U S T 7 |

| . . . and is overseen by a predominantly independent board of trustees Independent trustees Independent trustees Age YSI Committee(s) Affiliation(s) Title William M. 61 Audit Committee Diefenderfer, Hoover, Boyle & Wood Partner Diefenderfer III SLM Corporation Director The Student Loan Marketing Director Association Inc Enumerate Solutions Inc Vice Chairman of the Board of Directors Thomas A. Commes 64 Compensation Committee Agilysys Inc Director (Chairperson) Applied Industrial Technologies Inc Director Audit Committee Pella Corporation Director Nominating & Governance Committee John C. Dannemiller 68 Nominating & Governance The Lamson & Session Co Director Committee (Chairperson) Director Compensation Committee The Cleveland Clinic Foundation — Western Region Harold S. Haller 68 Compensation Committee Harold S. Haller & Company Founder Nominating & Governance Committee Marianne M. Keler 52 Audit Committee Nominating & Governance Committee David J. LaRue 45 Audit Committee Forest City Commercial Group President and Chief (Chairperson) Operating Officer Cleveland School of the Arts Director Greater Cleveland Sports Commission Director Company trustees Company trustee Age Affiliation(s) Title Dean Jernigan 61 Thomas and Betts Director U — S T O R E — I T T R U S T 8 |

| U-Store-It Trust ownership and corporate structure Top institutional and insider holders Corporate structure (%) Common Institutional holder Position outstanding Public Cohen & Steers Capital Management, Inc. 5,610,154 9.77% shareholders Vanguard Group, Inc. 3,080,889 5.37 Brahman Capital Corp. 2,716,100 4.73 100% Heitman/PRA Securities Advisors, Inc. 2,488,573 4.33 Wellington Management Co. LLP 2,145,350 3.74 Security Capital Management Group (U.S.) 1,968,040 3.43 U-Store-It Trust Barclays Global Investors NA (CA) 1,934,258 3.37 LaSalle Investment Management Securities LP 1,898,424 3.31 Goldman Sachs Asset Management LP (U.S.) 1,704,653 2.97 Franklin Advisers, Inc. 1,665,170 2.90 Total top 10 institutional holders 25,211,611 43.92% Total institutional ownership 49,423,698 86.09% 90.9% OP unit (%) Common holders Insider Position outstanding Amsdell Loretta Family Irrevocable Trust 3,921,850 6.83% 9.1% Amsdell Robert J Family Irrevocable Trust 3,921,850 6.83 Todd C. Amsdell 466,839 0.81 U-Store-It Operating Robert J. Amsdell 365,919 0.64 Partnership Dean Jernigan 251,745 0.44 Properties U — S T O R E — I T T R U S T 9 |

| U-Store-It has integrated real estate operations Acquisitions/ dispositions Management/ Development/ 3rd party services redevelopment/ approvals/ land planning YSI is a full service REIT Information Finance/ technology accounting Legal U — S T O R E — I T T R U S T 10 |

| Agenda U-Store-It objectives 1 Corporate overview 3 Organizational structure 6 Portfolio overview 11 Financial overview 14 U — S T O R E — I T T R U S T 11 |

| U-Store-It has a national footprint... Store distribution (03/31/2007) Newly acquired 1 Existing 6 Wisconsin 4 2 Massachusetts New York Rhode Island 1 17 Michigan Connecticut 2 2 1 Pennsylvania 14 New Jersey Nevada 4 30 5 27 9 Ohio Delaware Utah Indiana 5 Colorado Illinois Maryland Virginia California 8 12 2 15 43 5 21 North Carolina Tennessee 1 10 8 Arizona 6 18 South Carolina New Mexico 3 Mississippi Alabama Georgia 5 3 Top 5 markets Louisiana 3 15 28 6 Number of Total rentable 6 State facilities square feet (mm) Texas 3 California 58 3.9 52 Florida 55 4.0 Texas 43 2.7 Florida Ohio 34 2.0 Illinois 27 1.6 Total properties: 402 Newly acquired properties1: 63 Total square feet: 25.5mm 1 Represents properties acquired 2006 to 2007 year to date U — S T O R E — I T T R U S T 12 |

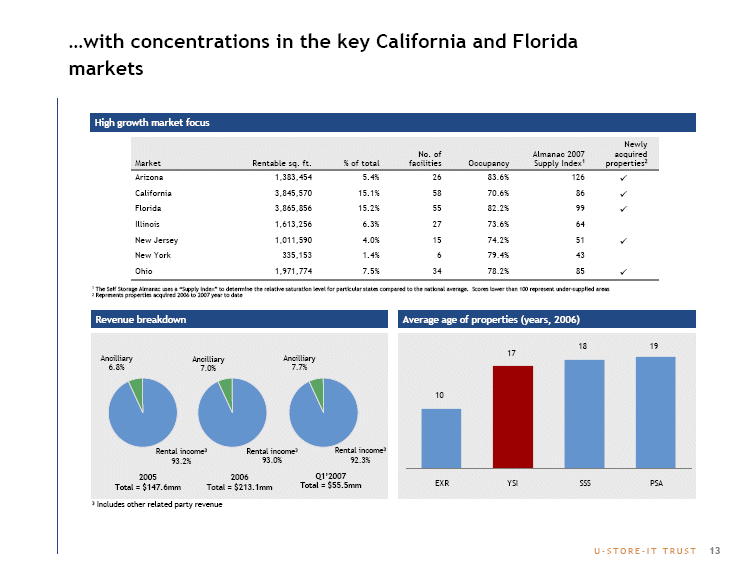
| ...with concentrations in the key California and Florida markets High growth market focus Newly No. of Almanac 2007 acquired Market Rentable sq. ft. % of total facilities Occupancy Supply Index1 properties2 Arizona 1,383,454 5.4% 26 83.6% 1269 California 3,845,570 15.1% 58 70.6% 869 Florida 3,865,856 15.2% 55 82.2% 999 Illinois 1,613,256 6.3% 27 73.6% 64 New Jersey 1,011,590 4.0% 15 74.2% 519 New York 335,153 1.4% 6 79.4% 43 Ohio 1,971,774 7.5% 34 78.2% 859 1 The Self Storage Almanac uses a “Supply Index” to determine the relative saturation level for particular states compared to the national average. Scores lower than 100 represent under-supplied areas 2 Represents properties acquired 2006 to 2007 year to date Revenue breakdown Average age of properties (years, 2006) 18 19 17 Ancilliary Ancilliary Ancilliary 6.8% 7.0% 7.7% 10 Rental income3 Rental income3 Rental income3 93.2% 93.0% 92.3% 2005 2006 Q1’2007 Total = $55.5mm EXR YSI SSS PSA Total = $147.6mm Total = $213.1mm 3 Includes other related party revenue U — S T O R E — I T T R U S T 13 |

| Agenda U-Store-It objectives 1 Corporate overview 3 Organizational structure 6 Portfolio overview 11 Financial overview 14 U — S T O R E — I T T R U S T 14 |

| U-Store-It First Quarter 2007 ResultsFunds from Operations (FFO) reported at $0.21/share, in line with the Company’s guidanceIncludes $1 million in fees associated with the restatement and inquirySame store growth over the same quarter of last year:Net Operating Income (NOI) growth of 2%In place annual rent per square foot grew 4.1%Portfolio OccupancyQuarter End: 78.2%Average: 77.9%Same Store OccupancyQuarter End: 79.7%Average: 79.6% U — S T O R E — I T T R U S T 15 |

| U-Store-It maintains stable operating and cashflow metrics Average rent/sq. ft. ($) Cash flow available after debt service1 ($ millions) $10.47 $10.33 $10.65 $10.13 $10.04 $58.1 21.4 % CAGR $37.8 $41.2 $26.7 $28.9 2002 2003 2004 2005 2006 2002 2003 2004 2005 2006 1 EBITDA less interest expense Average occupancy (%) NOI ($mm) 82.1% 84.0% 82.2% 79.9% 80.2% $126.5 25.8 % GR: CA $92.1 $50.5 $52.7 $55.9 2002 2003 2004 2005 2006 2002 2003 2004 2005 2006 Focus on operations and brand enhancement helps YSI maintain a stable operating profile while growing NOI U — S T O R E — I T T R U S T 16
|

| U-Store-It has a well-staggered maturity schedule Balance sheet (as of March 31, 2007, $ millions) Maturity schedule (as of March 31, 2007, $ millions) Weighted Weighted avg. avg. Mortgage notes ($585.2mm) Line of credit ($107.5mm1) 03/31/2007 interest rate maturity Unsecured debt Term loan ($200.0mm) Line of credit $107.5 6.47% 2009 Unsecured term loan 200.0 6.47 2009 Total unsecured debt $307.5 6.47% 2009 Secured debt Fixed rate mortgages $585.2 5.41% 2011 Fixed rate mortgage debt premium 1.4 5.41 NA $200.0 Promissory notes 0.1 5.97 NA Total secured debt $586.8 5.41% Total debt $894.3 5.77% Total fixed rate debt 65.6% Total variable rate debt 34.4 Select credit ratios (as of March 31, 2007) $107.5 $267.5 3/31/2007 Total debt/total adjusted book capitalization 50.3% Total secured debt/GAV 34.0 $112.6 $89.7 $91.0 Total debt/total assets 56.2 $16.5 $8.0 Secured debt/EBITDA 5.4x Unencumbered NOI/total NOI 37.3% 2007 2008 2009 2010 2011 2012+ EBITDA/Interest expense 2.2x Note: Excludes $1.4mm of mortgage debt premium and $0.1mm of promissory notes 1 Total availability on the line of credit of $250.0mm U — S T O R E — I T T R U S T 17
|

| Summary credit statistics Summary credit statistics 2004A 2005A 2006A 3/31/07 Debt/total adjusted book capitalization 43.6% 42.6% 49.7% 50.3% Total secured debt/GAV 54.4% 57.5% 32.1% 32.1% Total debt/total assets 49.0% 45.3% 54.4% 55.6% Secured debt/EBITDA 10.6x 12.1x 6.8x 4.5x Unencumbered NOI/total NOI 37.3% 46.2% EBITDA/Interest expense 1.5x 1.7x 1.9x 2.4x U — S T O R E — I T T R U S T 18 |