INVESTOR PRESENTATION November 2018
Forward Looking Statements Certain statements made during this presentation are forward-looking statements that are subject to risks and uncertainties. Forward-looking statements generally include the words “believe,” “expect,” “anticipate,” “plan,” “estimate,” “project,” “will,” “intend” or other similar expressions. Forward-looking statements include, without limitation, statements regarding, industry outlook, results of operations, cash flows, business strategies, growth and value opportunities, capital and other expenditures, financing plans, expense reduction initiatives and projected dispositions. Factors that could cause actual results to materially differ from those contained in the forward-looking statements include, without limitation, those risks and uncertainties discussed in the Company’s most recent Annual Report on Form 10-K, quarterly report on Form 10-Q and current reports on Form 8-K, which have been filed with the Securities and Exchange Commission, all of which you should carefully review. The forward-looking statements made are based on our beliefs, assumptions and expectations of future performance, taking into account all information currently available to us. Actual results could differ materially from the forward-looking statements made during this presentation. The forward-looking statements made during this presentation are subject to the safe harbor of the Private Securities Litigation Reform Act of 1995. Any forward-looking statement speaks only as of the date on which it is made. Although the Company believes the expectations reflected in such forward-looking statements are based upon reasonable assumptions, it can give no assurance that the expectations will be attained or that any deviation will not be material. All information in this presentation is as of the date of this presentation, and the Company undertakes no obligation to update any forward-looking statement to conform the statement to actual results or changes in the Company's expectations. This presentation contains statistics and other data that has been obtained or compiled from information made available by third-party service providers. 2
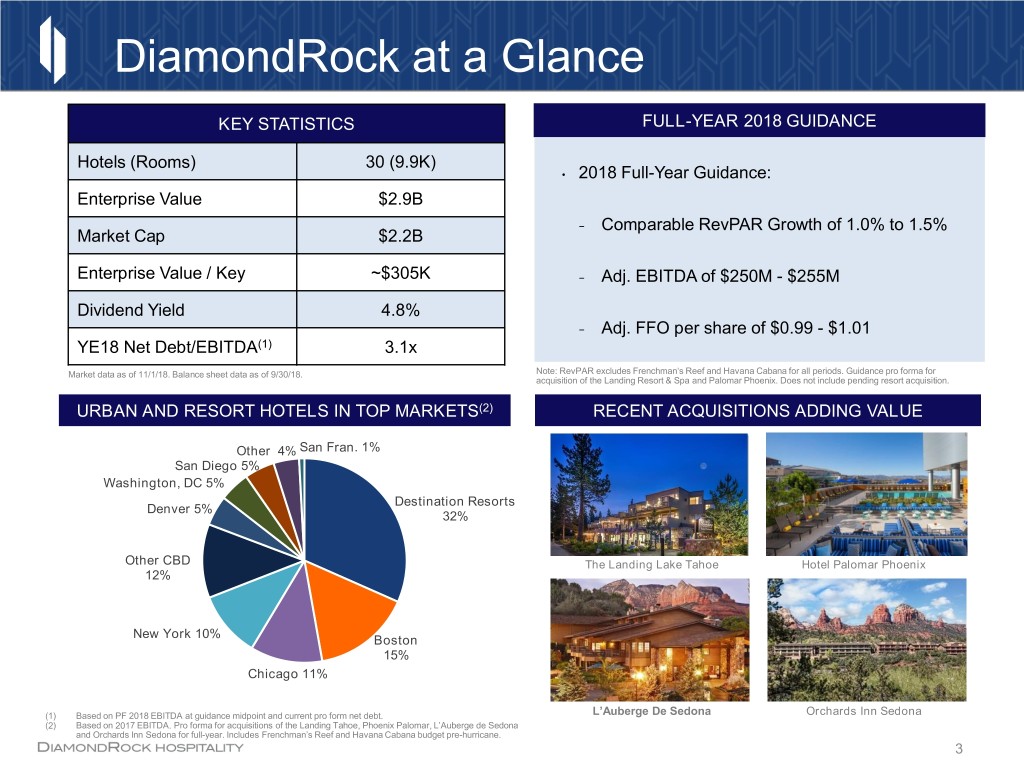
DiamondRock at a Glance KEY STATISTICS FULL-YEAR 2018 GUIDANCE Hotels (Rooms) 30 (9.9K) • 2018 Full-Year Guidance: Enterprise Value $2.9B − Comparable RevPAR Growth of 1.0% to 1.5% Market Cap $2.2B Enterprise Value / Key ~$305K − Adj. EBITDA of $250M - $255M Dividend Yield 4.8% − Adj. FFO per share of $0.99 - $1.01 YE18 Net Debt/EBITDA(1) 3.1x Market data as of 11/1/18. Balance sheet data as of 9/30/18. Note: RevPAR excludes Frenchman’s Reef and Havana Cabana for all periods. Guidance pro forma for acquisition of the Landing Resort & Spa and Palomar Phoenix. Does not include pending resort acquisition. URBAN AND RESORT HOTELS IN TOP MARKETS(2) RECENT ACQUISITIONS ADDING VALUE Other 4% San Fran. 1% San Diego 5% Washington, DC 5% Destination Resorts Denver 5% 32% Other CBD The Landing Lake Tahoe Hotel Palomar Phoenix 12% New York 10% Boston 15% Chicago 11% (1) Based on PF 2018 EBITDA at guidance midpoint and current pro form net debt. L’Auberge De Sedona Orchards Inn Sedona (2) Based on 2017 EBITDA. Pro forma for acquisitions of the Landing Tahoe, Phoenix Palomar, L’Auberge de Sedona and Orchards Inn Sedona for full-year. Includes Frenchman’s Reef and Havana Cabana budget pre-hurricane. 3

Demand Remains Robust YTD Q3 Total US +3.1% +1.7% 2019 US RevPAR Forecasts Resorts +4.4% +2.6% STR: 2.6% PWC: 2.6% Luxury +4.9% +3.3% PKF: 2.6% Upper +2.1% +1.9% Upscale Source: STR. Q3 and YTD September 2018 RevPAR. 4
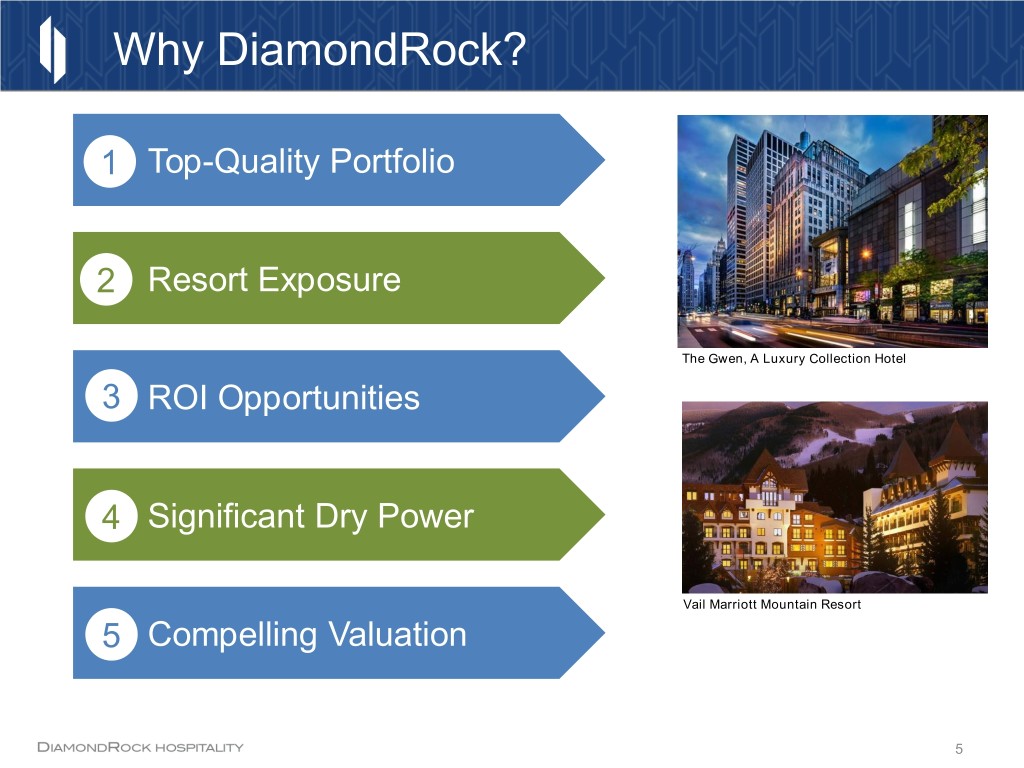
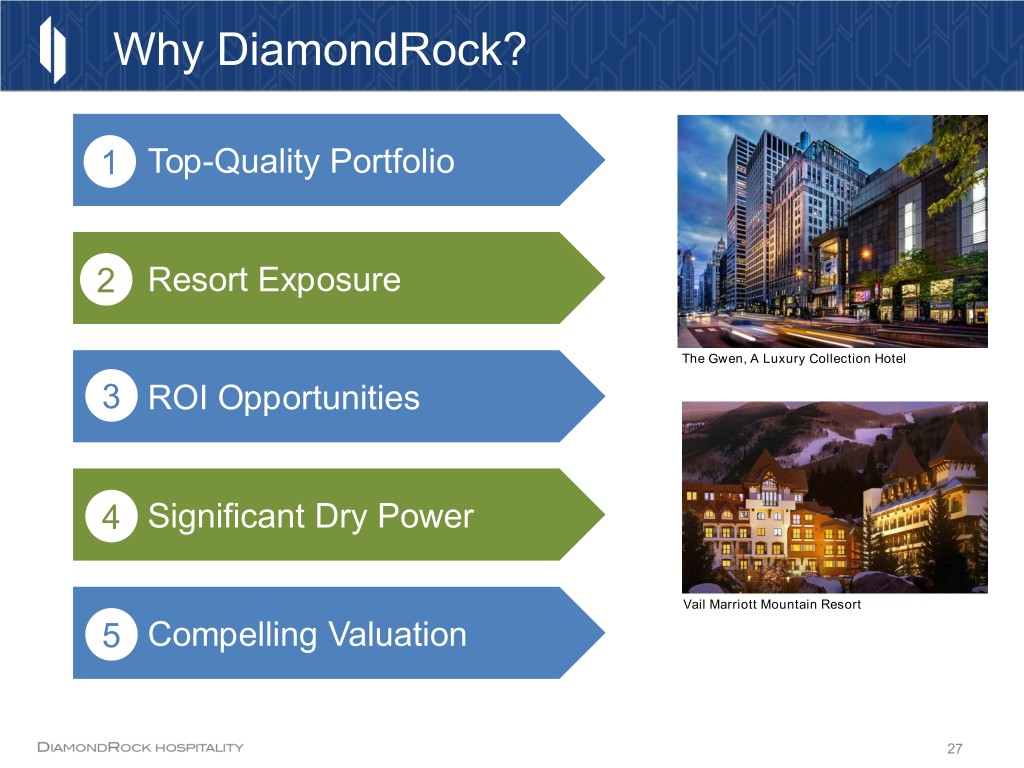
Why DiamondRock? 1 Top-Quality Portfolio 2 Resort Exposure The Gwen, A Luxury Collection Hotel 3 ROI Opportunities 4 Significant Dry Power Vail Marriott Mountain Resort 5 Compelling Valuation 5
Top Quality Portfolio

High Quality Portfolio in Key Gateway Markets Approximately 2/3 of DRH’s portfolio EBITDA is concentrated in top, gateway markets. 7
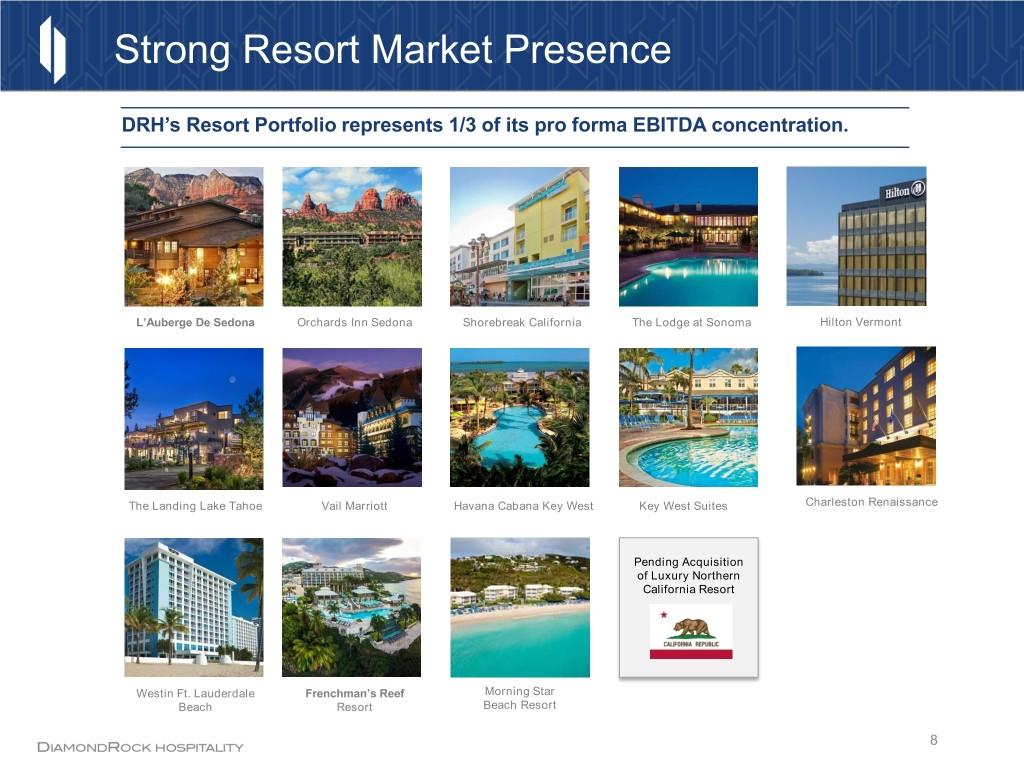
Strong Resort Market Presence DRH’s Resort Portfolio represents 1/3 of its pro forma EBITDA concentration. L’Auberge De Sedona Orchards Inn Sedona Shorebreak California The Lodge at Sonoma Hilton Vermont The Landing Lake Tahoe Vail Marriott Havana Cabana Key West Key West Suites Charleston Renaissance Pending Acquisition of Luxury Northern California Resort Westin Ft. Lauderdale Frenchman’s Reef Morning Star Beach Resort Beach Resort 8
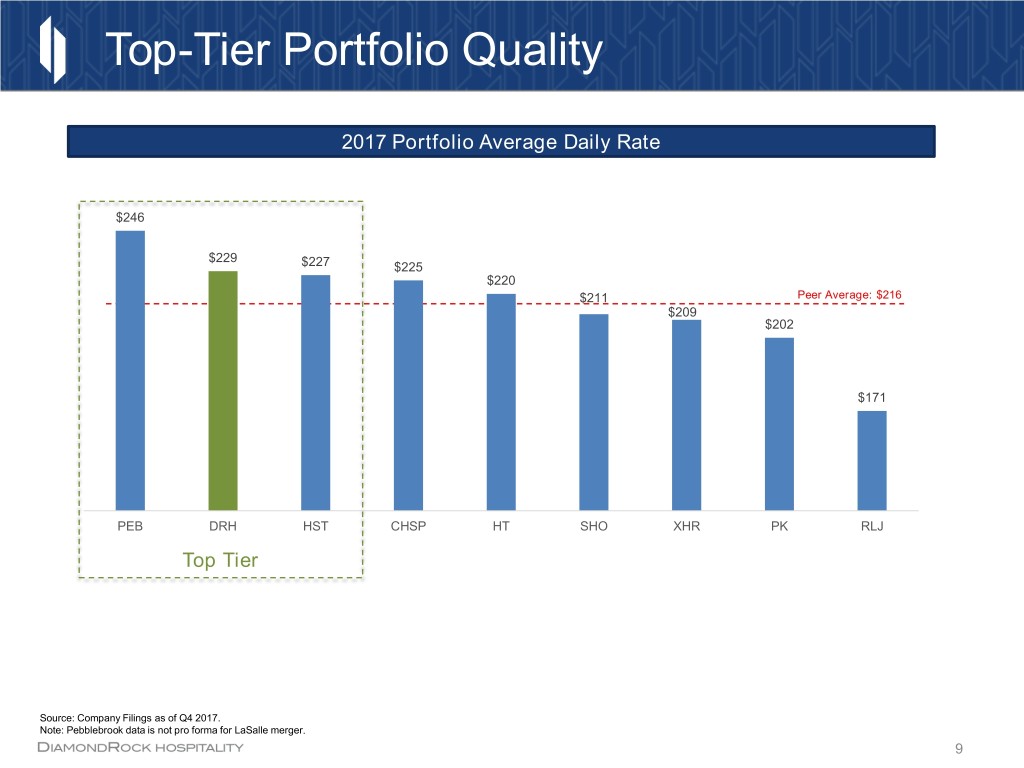
Top-Tier Portfolio Quality 2017 Portfolio Average Daily Rate $246 $229 $227 $225 $220 $211 Peer Average: $216 $209 $202 $171 PEB DRH HST CHSP HT SHO XHR PK RLJ Top Tier Source: Company Filings as of Q4 2017. Note: Pebblebrook data is not pro forma for LaSalle merger. 9
Resort Exposure
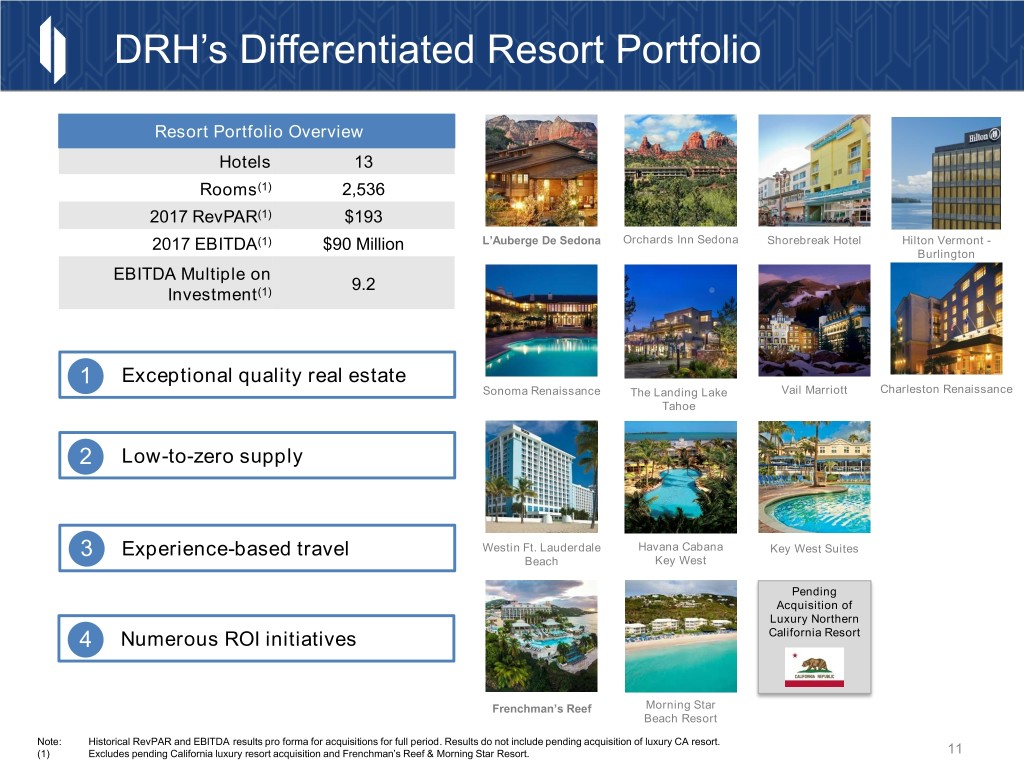
DRH’s Differentiated Resort Portfolio Resort Portfolio Overview Hotels 13 Rooms(1) 2,536 2017 RevPAR(1) $193 2017 EBITDA(1) $90 Million L’Auberge De Sedona Orchards Inn Sedona Shorebreak Hotel Hilton Vermont - Burlington EBITDA Multiple on 9.2 Investment(1) 1 Exceptional quality real estate Sonoma Renaissance The Landing Lake Vail Marriott Charleston Renaissance Tahoe 2 Low-to-zero supply 3 Experience-based travel Westin Ft. Lauderdale Havana Cabana Key West Suites Beach Key West Pending Acquisition of Luxury Northern 4 Numerous ROI initiatives California Resort Frenchman’s Reef Morning Star Beach Resort Note: Historical RevPAR and EBITDA results pro forma for acquisitions for full period. Results do not include pending acquisition of luxury CA resort. (1) Excludes pending California luxury resort acquisition and Frenchman’s Reef & Morning Star Resort. 11
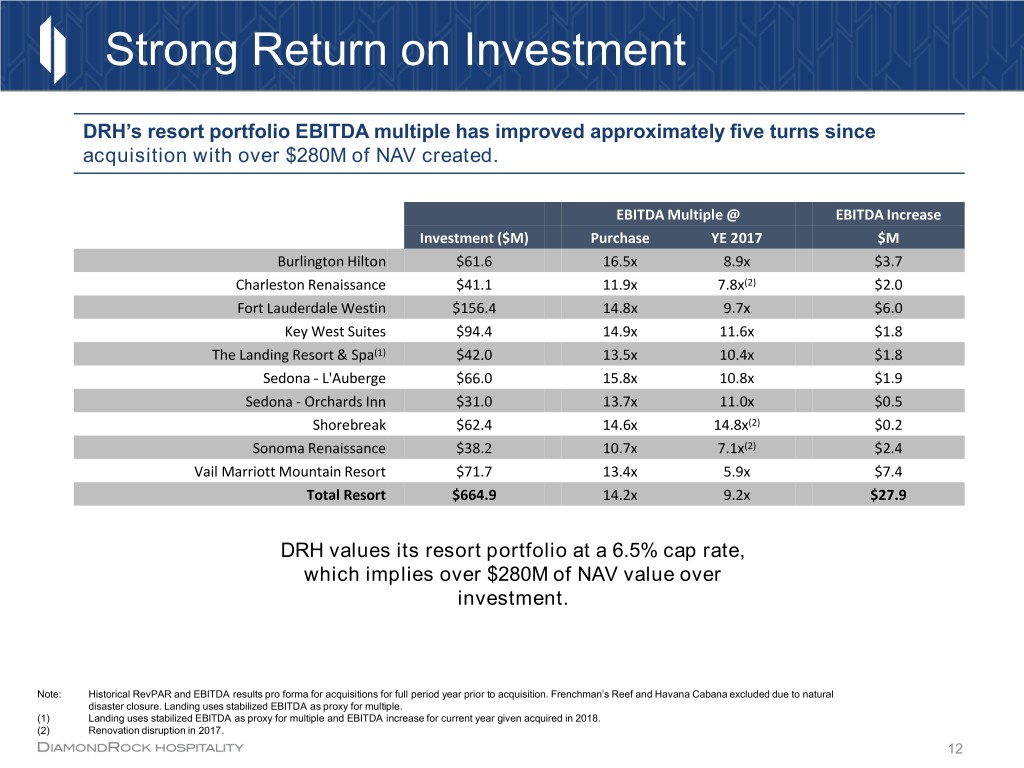
Strong Return on Investment DRH’s resort portfolio EBITDA multiple has improved approximately five turns since acquisition with over $280M of NAV created. EBITDA Multiple @ EBITDA Increase Investment ($M) Purchase YE 2017 $M Burlington Hilton $61.6 16.5x 8.9x $3.7 Charleston Renaissance $41.1 11.9x 7.8x(2) $2.0 Fort Lauderdale Westin $156.4 14.8x 9.7x $6.0 Key West Suites $94.4 14.9x 11.6x $1.8 The Landing Resort & Spa(1) $42.0 13.5x 10.4x $1.8 Sedona - L'Auberge $66.0 15.8x 10.8x $1.9 Sedona - Orchards Inn $31.0 13.7x 11.0x $0.5 Shorebreak $62.4 14.6x 14.8x(2) $0.2 Sonoma Renaissance $38.2 10.7x 7.1x(2) $2.4 Vail Marriott Mountain Resort $71.7 13.4x 5.9x $7.4 Total Resort $664.9 14.2x 9.2x $27.9 DRH values its resort portfolio at a 6.5% cap rate, which implies over $280M of NAV value over investment. Note: Historical RevPAR and EBITDA results pro forma for acquisitions for full period year prior to acquisition. Frenchman’s Reef and Havana Cabana excluded due to natural disaster closure. Landing uses stabilized EBITDA as proxy for multiple. (1) Landing uses stabilized EBITDA as proxy for multiple and EBITDA increase for current year given acquired in 2018. (2) Renovation disruption in 2017. 12
Unique ROI Opportunities
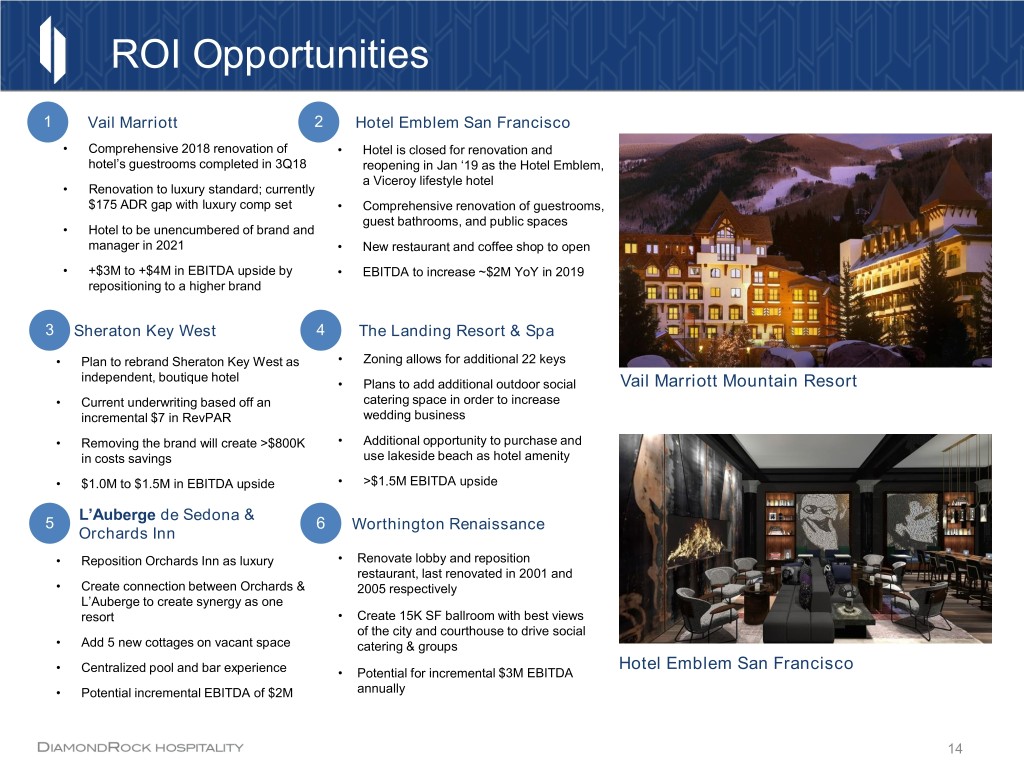
ROI Opportunities 1 Vail Marriott 2 Hotel Emblem San Francisco • Comprehensive 2018 renovation of • Hotel is closed for renovation and hotel’s guestrooms completed in 3Q18 reopening in Jan ‘19 as the Hotel Emblem, a Viceroy lifestyle hotel • Renovation to luxury standard; currently $175 ADR gap with luxury comp set • Comprehensive renovation of guestrooms, guest bathrooms, and public spaces • Hotel to be unencumbered of brand and manager in 2021 • New restaurant and coffee shop to open • +$3M to +$4M in EBITDA upside by • EBITDA to increase ~$2M YoY in 2019 repositioning to a higher brand 3 Sheraton Key West 4 The Landing Resort & Spa • Plan to rebrand Sheraton Key West as • Zoning allows for additional 22 keys independent, boutique hotel • Plans to add additional outdoor social Vail Marriott Mountain Resort • Current underwriting based off an catering space in order to increase incremental $7 in RevPAR wedding business • Removing the brand will create >$800K • Additional opportunity to purchase and in costs savings use lakeside beach as hotel amenity • $1.0M to $1.5M in EBITDA upside • >$1.5M EBITDA upside L’Auberge de Sedona & 5 6 Worthington Renaissance Orchards Inn • Reposition Orchards Inn as luxury • Renovate lobby and reposition restaurant, last renovated in 2001 and • Create connection between Orchards & 2005 respectively L’Auberge to create synergy as one resort • Create 15K SF ballroom with best views of the city and courthouse to drive social • Add 5 new cottages on vacant space catering & groups Hotel Emblem San Francisco • Centralized pool and bar experience • Potential for incremental $3M EBITDA • Potential incremental EBITDA of $2M annually 14
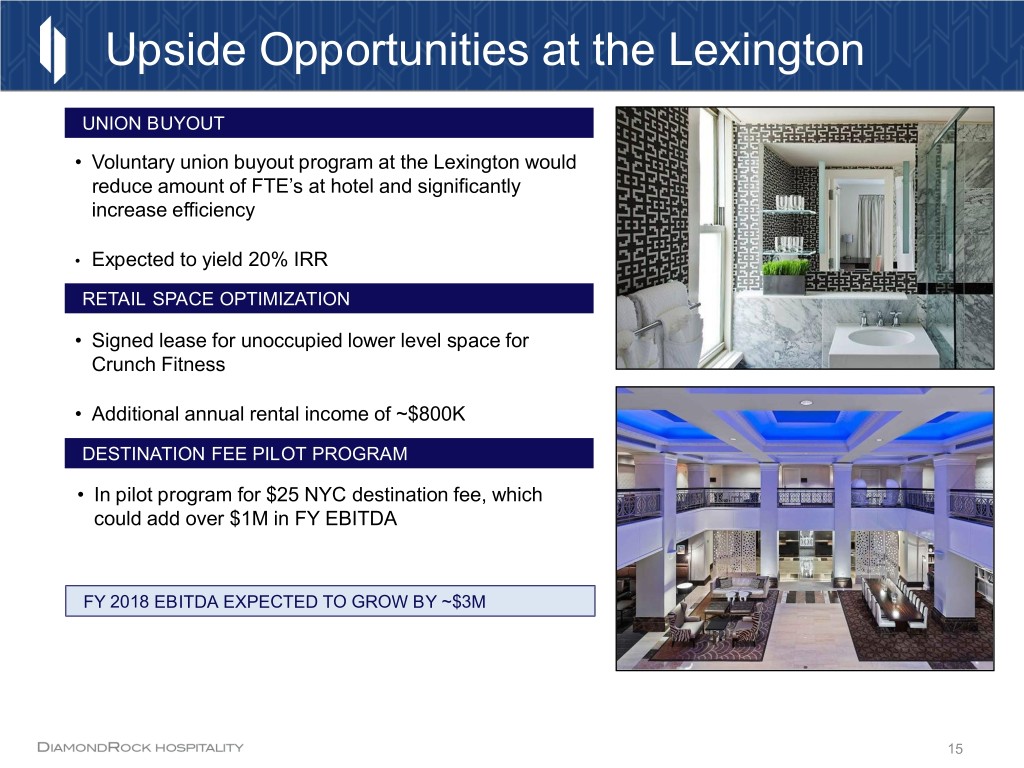
Upside Opportunities at the Lexington UNION BUYOUT • Voluntary union buyout program at the Lexington would reduce amount of FTE’s at hotel and significantly increase efficiency • Expected to yield 20% IRR RETAIL SPACE OPTIMIZATION • Signed lease for unoccupied lower level space for Crunch Fitness • Additional annual rental income of ~$800K DESTINATION FEE PILOT PROGRAM • In pilot program for $25 NYC destination fee, which could add over $1M in FY EBITDA FY 2018 EBITDA EXPECTED TO GROW BY ~$3M 15

Frenchman’s Reef Resort & Morning Star Beach Resort Key Facts & Figures Q2 2020 Projected Reopening $20M+ Brand Support $30M USVI Support $350+ Stabilized ADR $25M Stabilized EBITDA 16
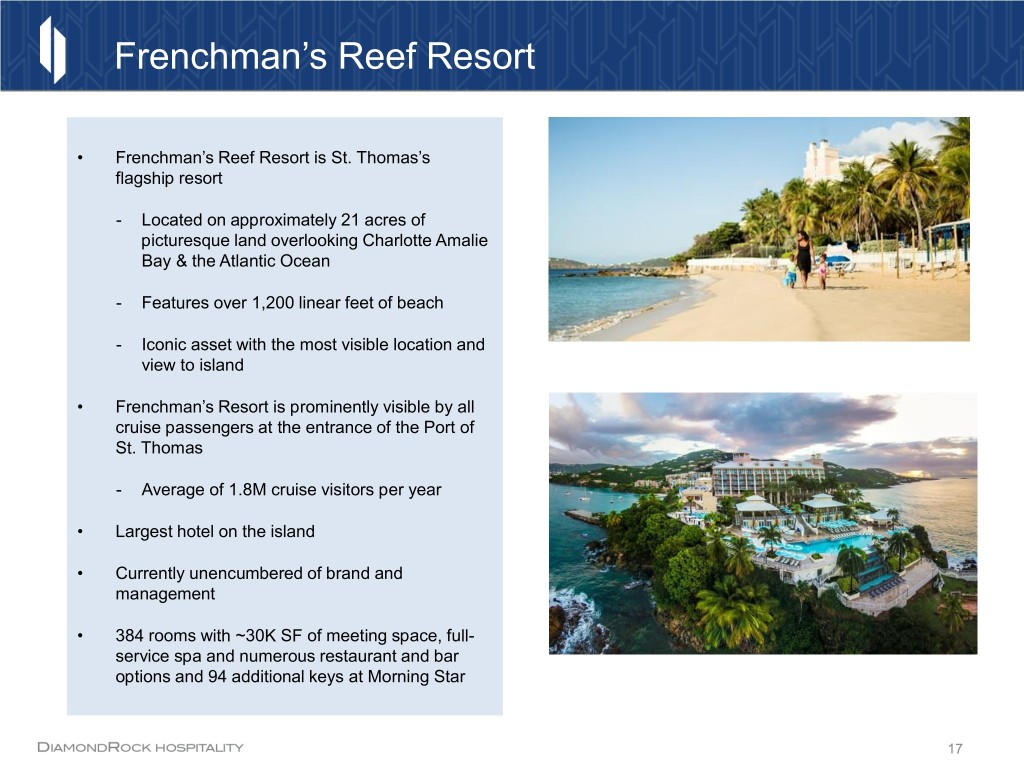
Frenchman’s Reef Resort • Frenchman’s Reef Resort is St. Thomas’s flagship resort - Located on approximately 21 acres of picturesque land overlooking Charlotte Amalie Bay & the Atlantic Ocean - Features over 1,200 linear feet of beach - Iconic asset with the most visible location and view to island • Frenchman’s Resort is prominently visible by all cruise passengers at the entrance of the Port of St. Thomas - Average of 1.8M cruise visitors per year • Largest hotel on the island • Currently unencumbered of brand and management • 384 rooms with ~30K SF of meeting space, full- service spa and numerous restaurant and bar options and 94 additional keys at Morning Star 17
Significant Dry Powder
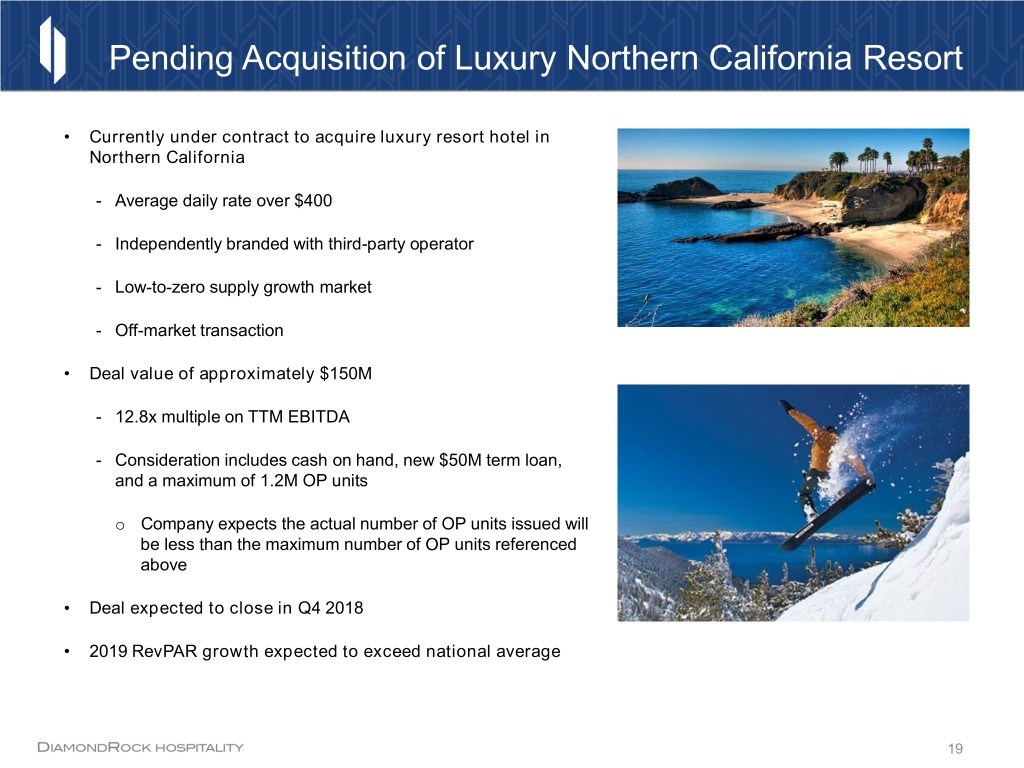
Pending Acquisition of Luxury Northern California Resort • Currently under contract to acquire luxury resort hotel in Northern California - Average daily rate over $400 - Independently branded with third-party operator - Low-to-zero supply growth market - Off-market transaction • Deal value of approximately $150M - 12.8x multiple on TTM EBITDA - Consideration includes cash on hand, new $50M term loan, and a maximum of 1.2M OP units o Company expects the actual number of OP units issued will be less than the maximum number of OP units referenced above • Deal expected to close in Q4 2018 • 2019 RevPAR growth expected to exceed national average 19
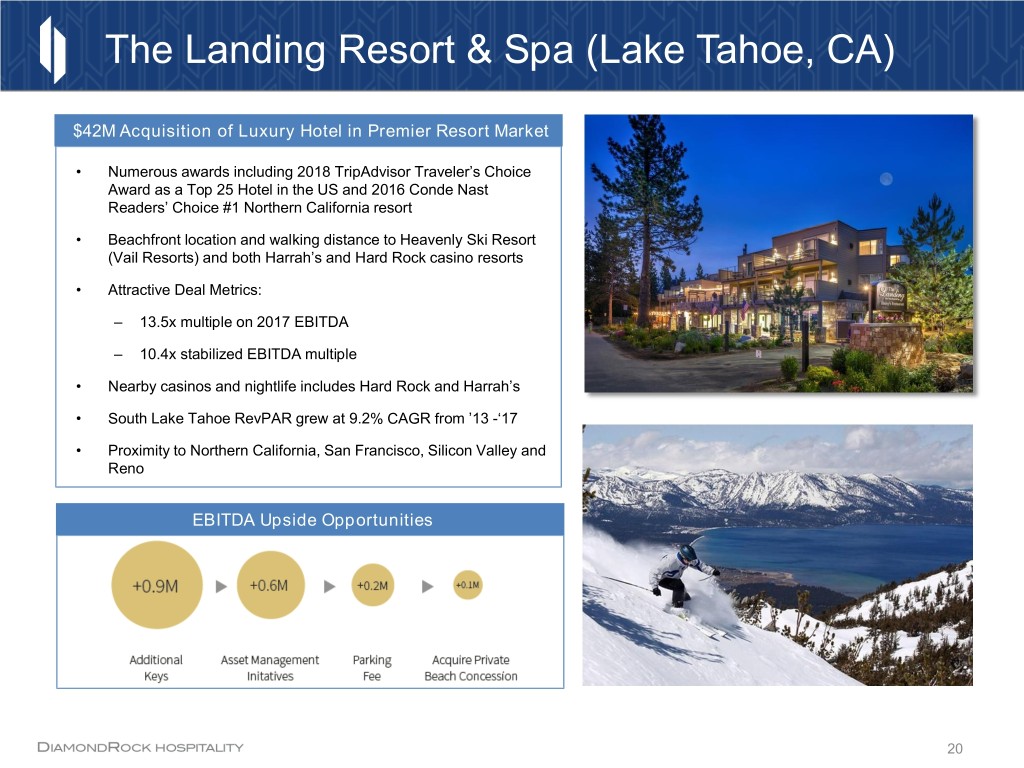
The Landing Resort & Spa (Lake Tahoe, CA) $42M Acquisition of Luxury Hotel in Premier Resort Market • Numerous awards including 2018 TripAdvisor Traveler’s Choice Award as a Top 25 Hotel in the US and 2016 Conde Nast Readers’ Choice #1 Northern California resort • Beachfront location and walking distance to Heavenly Ski Resort (Vail Resorts) and both Harrah’s and Hard Rock casino resorts • Attractive Deal Metrics: ‒ 13.5x multiple on 2017 EBITDA ‒ 10.4x stabilized EBITDA multiple • Nearby casinos and nightlife includes Hard Rock and Harrah’s • South Lake Tahoe RevPAR grew at 9.2% CAGR from ’13 -‘17 • Proximity to Northern California, San Francisco, Silicon Valley and Reno EBITDA Upside Opportunities 20
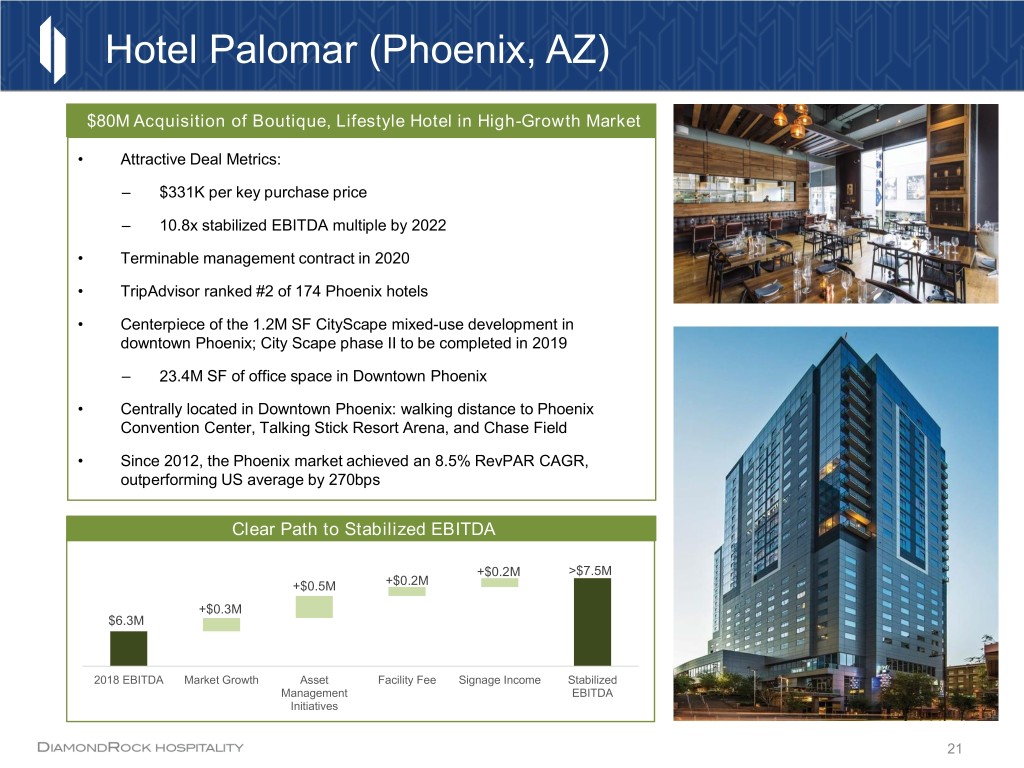
Hotel Palomar (Phoenix, AZ) $80M Acquisition of Boutique, Lifestyle Hotel in High-Growth Market • Attractive Deal Metrics: ‒ $331K per key purchase price ‒ 10.8x stabilized EBITDA multiple by 2022 • Terminable management contract in 2020 • TripAdvisor ranked #2 of 174 Phoenix hotels • Centerpiece of the 1.2M SF CityScape mixed-use development in downtown Phoenix; City Scape phase II to be completed in 2019 ‒ 23.4M SF of office space in Downtown Phoenix • Centrally located in Downtown Phoenix: walking distance to Phoenix Convention Center, Talking Stick Resort Arena, and Chase Field • Since 2012, the Phoenix market achieved an 8.5% RevPAR CAGR, outperforming US average by 270bps Clear Path to Stabilized EBITDA +$0.2M >$7.5M +$0.5M +$0.2M +$0.3M $6.3M 2018 EBITDA Market Growth Asset Facility Fee Signage Income Stabilized Management EBITDA Initiatives 21
Compelling Valuation
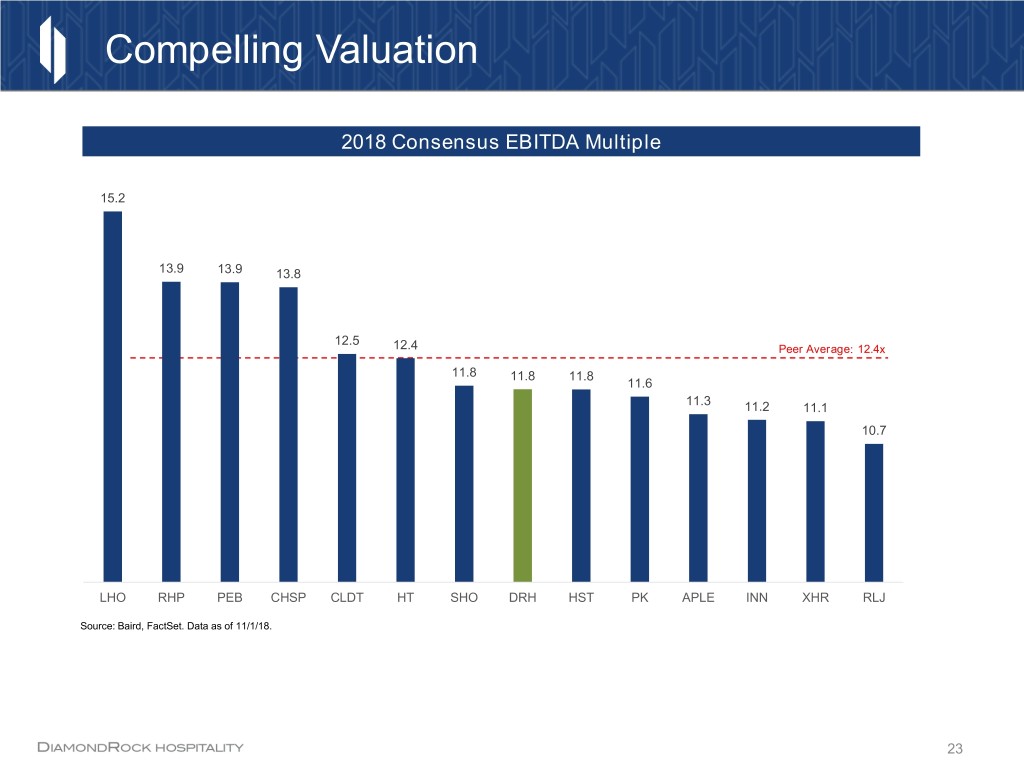
Compelling Valuation 2018 Consensus EBITDA Multiple 15.2 13.9 13.9 13.8 12.5 12.4 Peer Average: 12.4x 11.8 11.8 11.8 11.6 11.3 11.2 11.1 10.7 LHO RHP PEB CHSP CLDT HT SHO DRH HST PK APLE INN XHR RLJ Source: Baird, FactSet. Data as of 11/1/18. 23
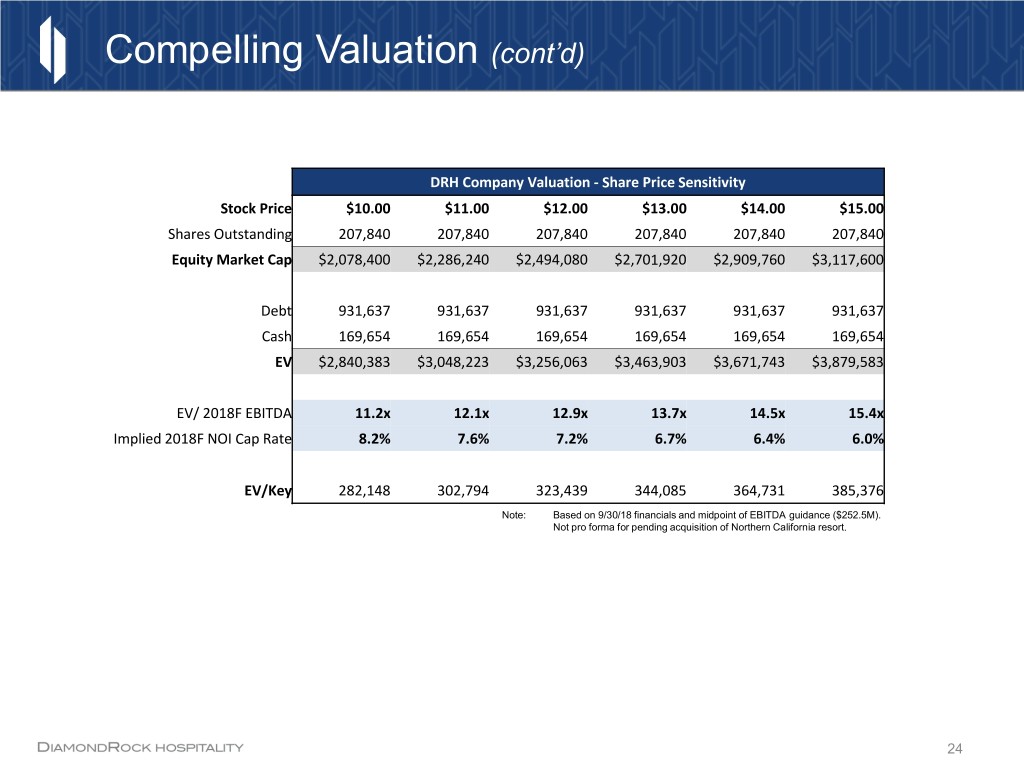
Compelling Valuation (cont’d) DRH Company Valuation - Share Price Sensitivity Stock Price $10.00 $11.00 $12.00 $13.00 $14.00 $15.00 Shares Outstanding 207,840 207,840 207,840 207,840 207,840 207,840 Equity Market Cap $2,078,400 $2,286,240 $2,494,080 $2,701,920 $2,909,760 $3,117,600 Debt 931,637 931,637 931,637 931,637 931,637 931,637 Cash 169,654 169,654 169,654 169,654 169,654 169,654 EV $2,840,383 $3,048,223 $3,256,063 $3,463,903 $3,671,743 $3,879,583 EV/ 2018F EBITDA 11.2x 12.1x 12.9x 13.7x 14.5x 15.4x Implied 2018F NOI Cap Rate 8.2% 7.6% 7.2% 6.7% 6.4% 6.0% EV/Key 282,148 302,794 323,439 344,085 364,731 385,376 Note: Based on 9/30/18 financials and midpoint of EBITDA guidance ($252.5M). Not pro forma for pending acquisition of Northern California resort. 24
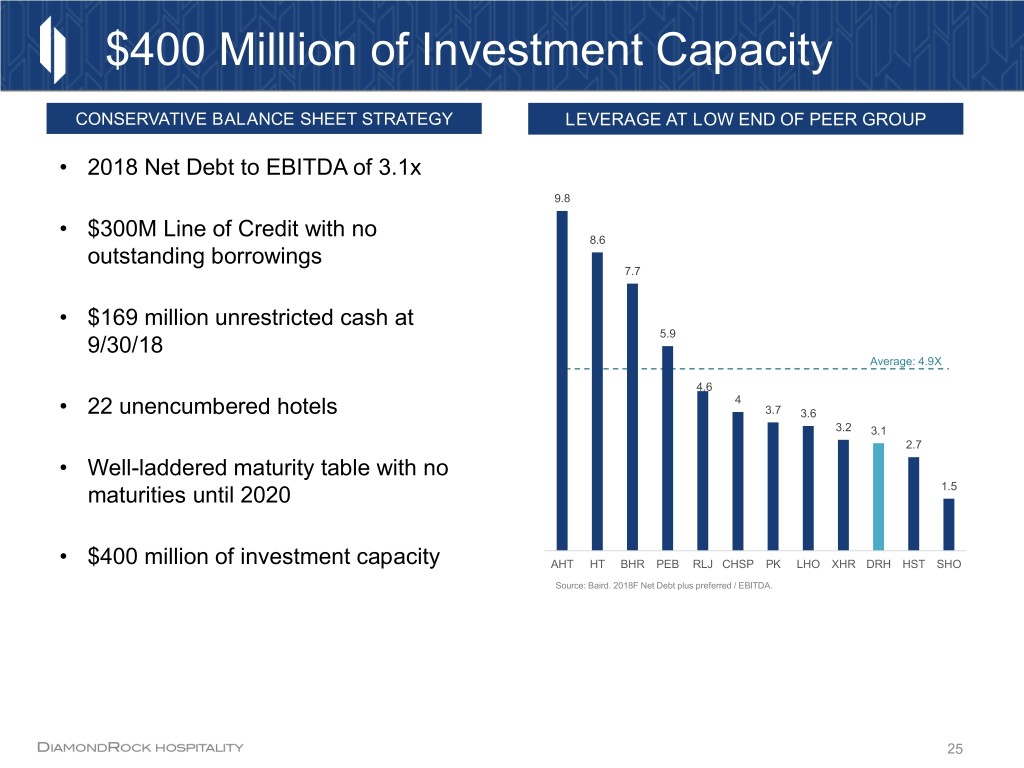
$400 Milllion of Investment Capacity CONSERVATIVE BALANCE SHEET STRATEGY LEVERAGE AT LOW END OF PEER GROUP • 2018 Net Debt to EBITDA of 3.1x 9.8 • $300M Line of Credit with no 8.6 outstanding borrowings 7.7 • $169 million unrestricted cash at 5.9 9/30/18 Average: 4.9X 4.6 4 • 22 unencumbered hotels 3.7 3.6 3.2 3.1 2.7 • Well-laddered maturity table with no maturities until 2020 1.5 • $400 million of investment capacity AHT HT BHR PEB RLJ CHSP PK LHO XHR DRH HST SHO Source: Baird. 2018F Net Debt plus preferred / EBITDA. 25
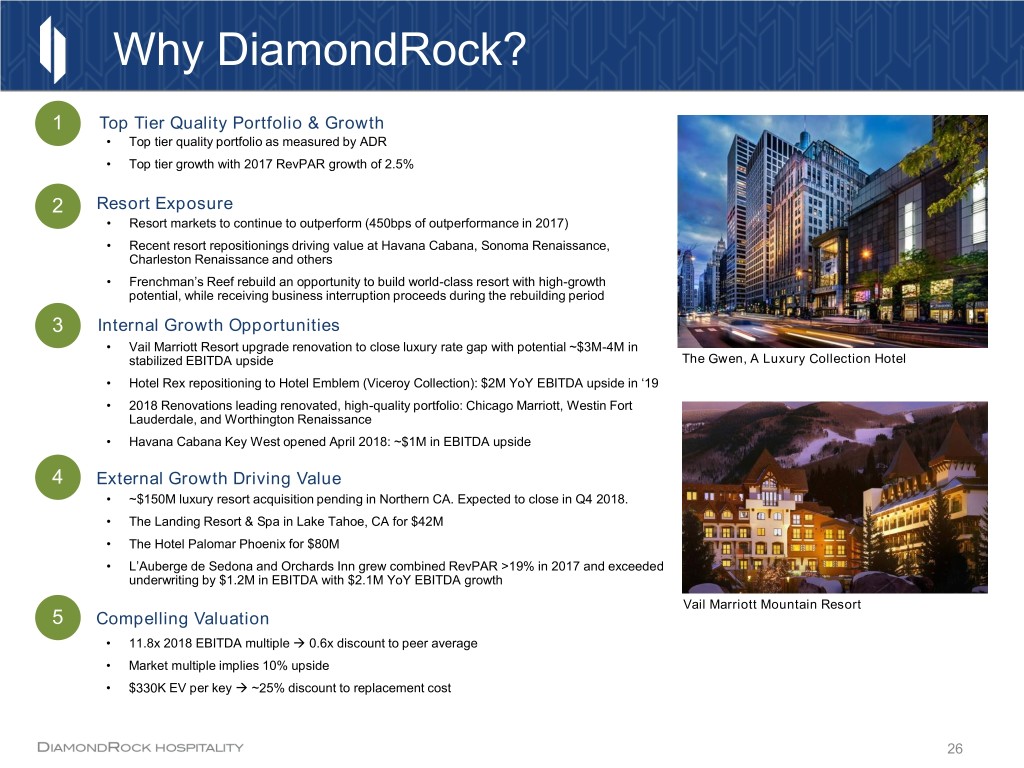
Why DiamondRock? 1 Top Tier Quality Portfolio & Growth • Top tier quality portfolio as measured by ADR • Top tier growth with 2017 RevPAR growth of 2.5% 2 Resort Exposure • Resort markets to continue to outperform (450bps of outperformance in 2017) • Recent resort repositionings driving value at Havana Cabana, Sonoma Renaissance, Charleston Renaissance and others • Frenchman’s Reef rebuild an opportunity to build world-class resort with high-growth potential, while receiving business interruption proceeds during the rebuilding period 3 Internal Growth Opportunities • Vail Marriott Resort upgrade renovation to close luxury rate gap with potential ~$3M-4M in stabilized EBITDA upside The Gwen, A Luxury Collection Hotel • Hotel Rex repositioning to Hotel Emblem (Viceroy Collection): $2M YoY EBITDA upside in ‘19 • 2018 Renovations leading renovated, high-quality portfolio: Chicago Marriott, Westin Fort Lauderdale, and Worthington Renaissance • Havana Cabana Key West opened April 2018: ~$1M in EBITDA upside 4 External Growth Driving Value • ~$150M luxury resort acquisition pending in Northern CA. Expected to close in Q4 2018. • The Landing Resort & Spa in Lake Tahoe, CA for $42M • The Hotel Palomar Phoenix for $80M • L’Auberge de Sedona and Orchards Inn grew combined RevPAR >19% in 2017 and exceeded underwriting by $1.2M in EBITDA with $2.1M YoY EBITDA growth Vail Marriott Mountain Resort 5 Compelling Valuation • 11.8x 2018 EBITDA multiple 0.6x discount to peer average • Market multiple implies 10% upside • $330K EV per key ~25% discount to replacement cost 26
Why DiamondRock? 1 Top-Quality Portfolio 2 Resort Exposure The Gwen, A Luxury Collection Hotel 3 ROI Opportunities 4 Significant Dry Power Vail Marriott Mountain Resort 5 Compelling Valuation 27
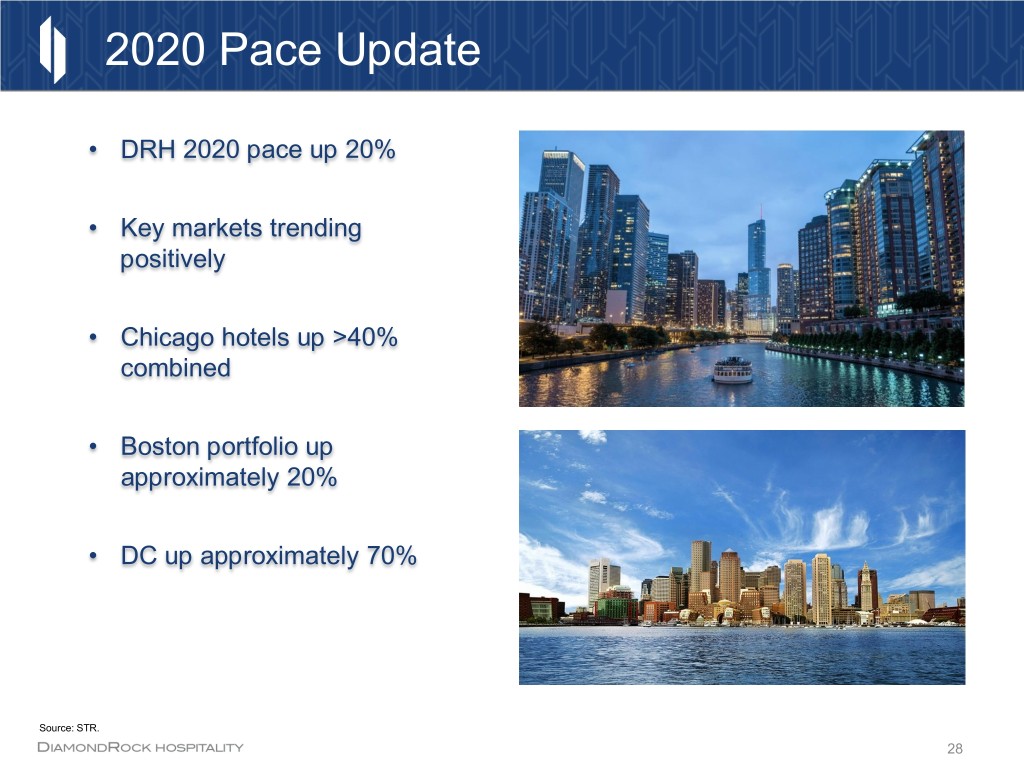
2020 Pace Update • DRH 2020 pace up 20% • Key markets trending positively • Chicago hotels up >40% combined • Boston portfolio up approximately 20% • DC up approximately 70% Source: STR. 28
Appendix
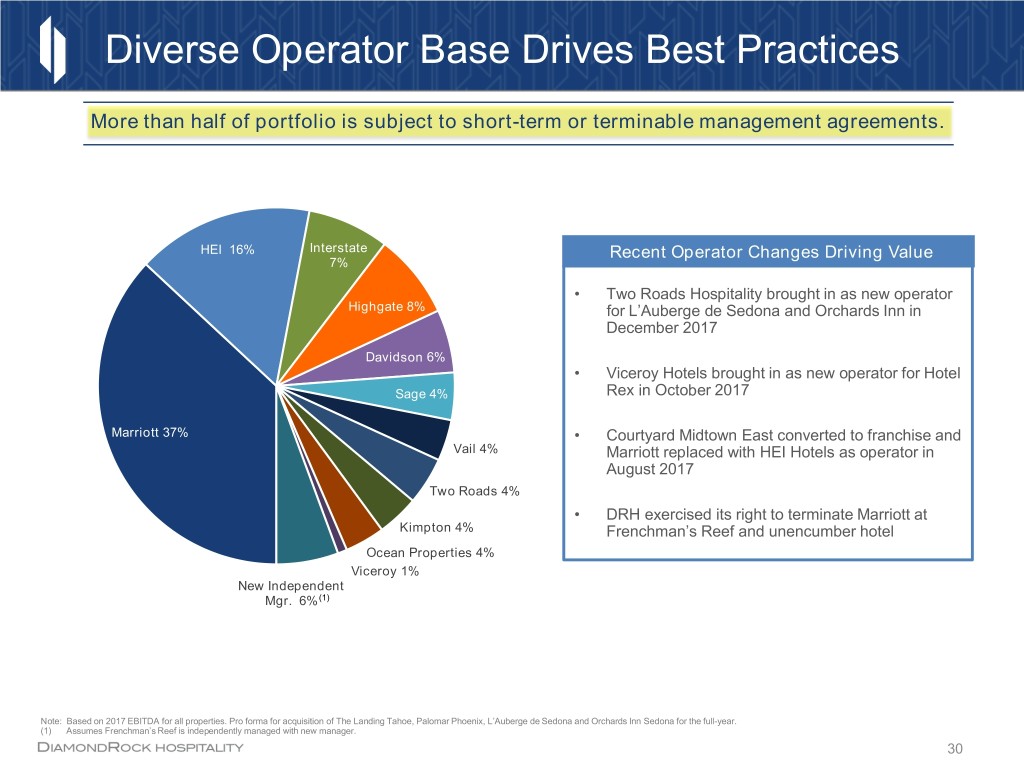
Diverse Operator Base Drives Best Practices More than half of portfolio is subject to short-term or terminable management agreements. HEI 16% Interstate Recent Operator Changes Driving Value 7% • Two Roads Hospitality brought in as new operator Highgate 8% for L’Auberge de Sedona and Orchards Inn in December 2017 Davidson 6% • Viceroy Hotels brought in as new operator for Hotel Sage 4% Rex in October 2017 Marriott 37% • Courtyard Midtown East converted to franchise and Vail 4% Marriott replaced with HEI Hotels as operator in August 2017 Two Roads 4% • DRH exercised its right to terminate Marriott at Kimpton 4% Frenchman’s Reef and unencumber hotel Ocean Properties 4% Viceroy 1% New Independent Mgr. 6% (1) Note: Based on 2017 EBITDA for all properties. Pro forma for acquisition of The Landing Tahoe, Palomar Phoenix, L’Auberge de Sedona and Orchards Inn Sedona for the full-year. (1) Assumes Frenchman’s Reef is independently managed with new manager. 30
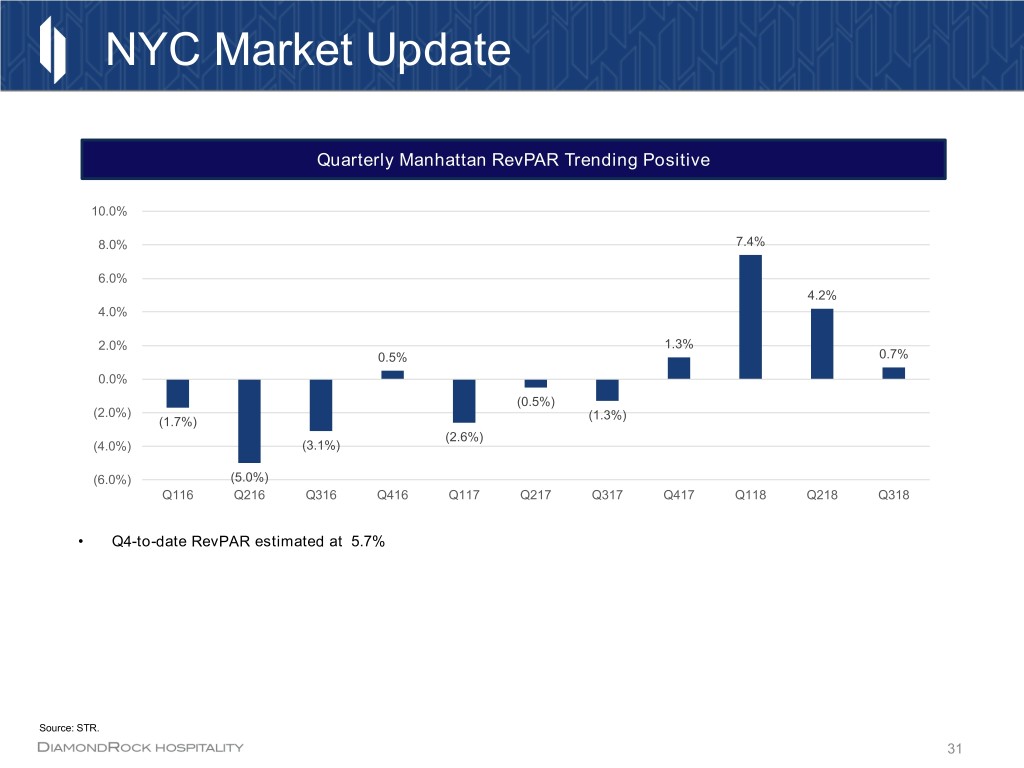
NYC Market Update Quarterly Manhattan RevPAR Trending Positive 10.0% 8.0% 7.4% 6.0% 4.2% 4.0% 2.0% 1.3% 0.5% 0.7% 0.0% (0.5%) (2.0%) (1.3%) (1.7%) (2.6%) (4.0%) (3.1%) (6.0%) (5.0%) Q116 Q216 Q316 Q416 Q117 Q217 Q317 Q417 Q118 Q218 Q318 • Q4-to-date RevPAR estimated at 5.7% Source: STR. 31

NYC Supply Outlook • Supply in NYC remains elevated, but DRH submarkets have minimal supply • DRH’s primary submarket of Midtown East has no new supply in 2018-19 with total pipeline of rooms at 1% ‒ Less than 1% supply CAGR over last three years • Waldorf Astoria (1,413 rooms) came offline Q117 ‒ 10% of Midtown East rooms removed during renovation and 7% reduction long-term • Recently enacted Airbnb law to significantly mitigate Airbnb shadow supply • New legislation moving forward that would significantly limit new hotel development • Would require developers to receive a special permit to build new hotels in light manufacturing zones and would require union hotel staff Source: STR, CBRE. 32
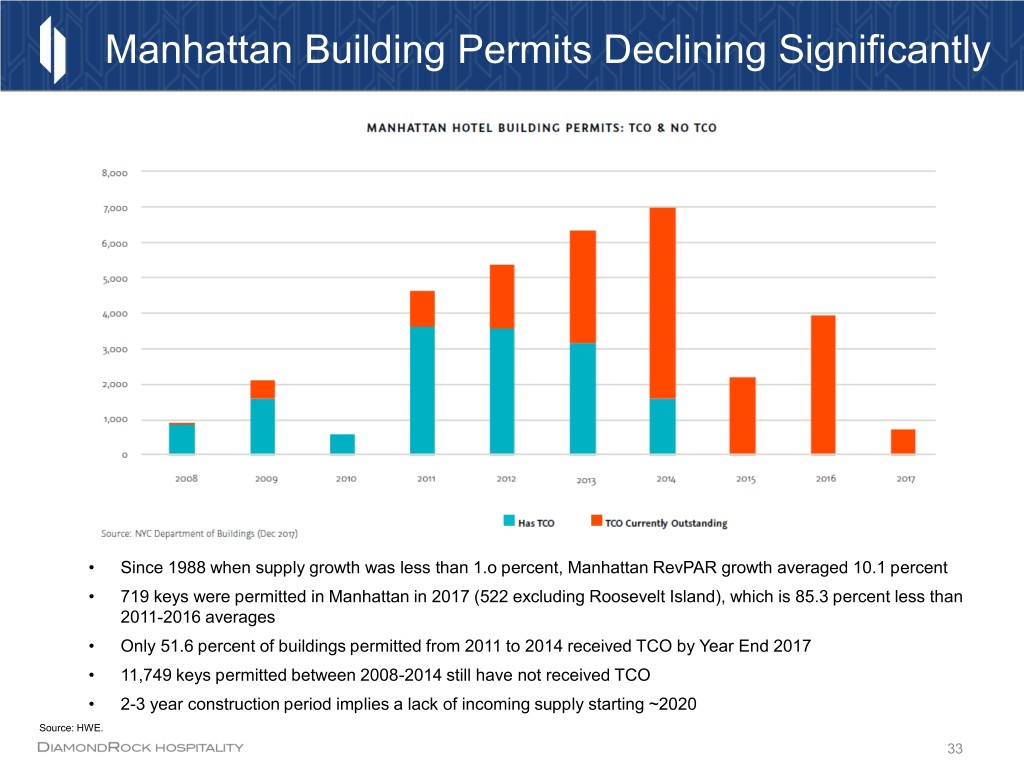
Manhattan Building Permits Declining Significantly • Since 1988 when supply growth was less than 1.o percent, Manhattan RevPAR growth averaged 10.1 percent • 719 keys were permitted in Manhattan in 2017 (522 excluding Roosevelt Island), which is 85.3 percent less than 2011-2016 averages • Only 51.6 percent of buildings permitted from 2011 to 2014 received TCO by Year End 2017 • 11,749 keys permitted between 2008-2014 still have not received TCO • 2-3 year construction period implies a lack of incoming supply starting ~2020 Source: HWE. 33

Chicago Outperforming in 2018 • The Chicago Marriott and the Gwen are up a combined 11% YTD 2018 ‒ Combined group pace up ~15% in Q4 2018 • Chicago Marriott completed final stage of $110M renovation in Q1 2018 ‒ Average guest satisfaction score of a renovated room is 20 points higher than the pre-renovation room score ‒ ~500 basis points of market share gain over last twelve months Chicago Marriott Downtown Magnificent Mile • The Gwen continues to ramp following the completion of its comprehensive $27M renovation and conversion to the Luxury Collection ‒ 31% RevPAR growth YTD and 18 points of market share gain YTD ‒ Top 10 TripAdvisor Ranking in Chicago following reno • Chicago citywides up nearly 25% in 2018 The Gwen, Luxury Collection 34


