|
Exhibit (c)(1)
Confidential – For Discussion Purposes Only
Project Chronos
November 21, 2016
|
Chronos Market Backdrop
Confidential – For Discussion Purposes Only
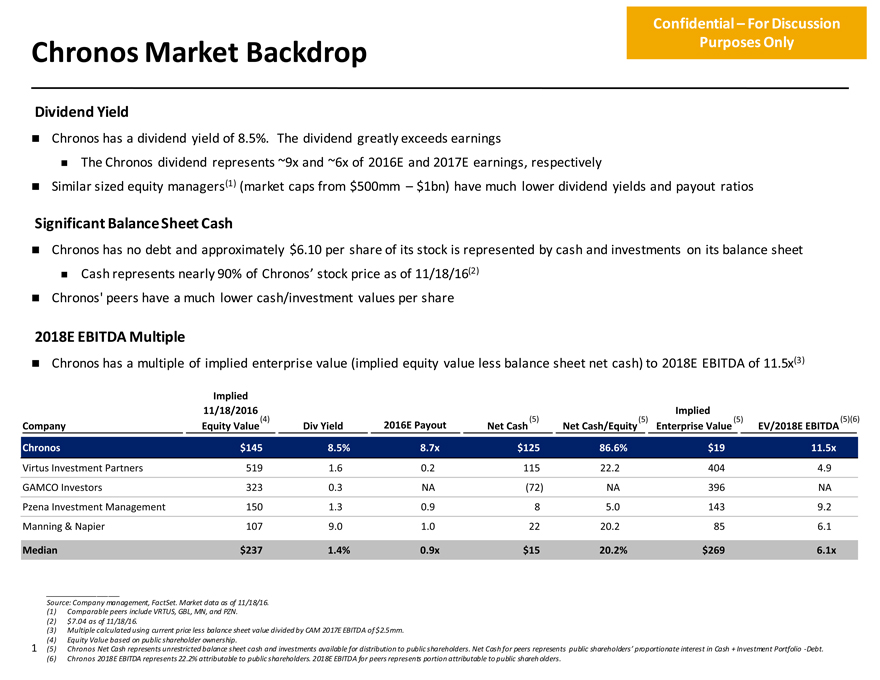
Dividend Yield
Chronos has a dividend yield of 8.5%. The dividend greatly exceeds earnings
The Chronos dividend represents ~9x and ~6x of 2016E and 2017E earnings, respectively
Similar sized equity managers(1) (market caps from $500mm – $1bn) have much lower dividend yields and payout ratios
Significant Balance Sheet Cash
Chronos has no debt and approximately $6.10 per share of its stock is represented by cash and investments on its balance sheet
Cash represents nearly 90% of Chronos’ stock price as of 11/18/16(2)
Chronos’ peers have a much lower cash/investment values per share
2018E EBITDA Multiple
Chronos has a multiple of implied enterprise value (implied equity value less balance sheet net cash) to 2018E EBITDA of 11.5x(3)
Implied
11/18/2016 Implied
(4) (5) (5) (5) (5)(6)
Company Equity Value Div Yield 2016E Payout Net Cash Net Cash/Equity Enterprise Value EV/2018E EBITDA
Chronos $145 8.5% 8.7x $125 86.6% $19 11.5x
Virtus Investment Partners 519 1.6 0.2 115 22.2 404 4.9 GAMCO Investors 323 0.3 NA (72) NA 396 NA (3) Pzena Investment Management 150 1.3 0.9 8 5.0 143 9.2 Manning & Napier 107 9.0 1.0 22 20.2 85 6.1
Median $237 1.4% 0.9x $15 20.2% $269 6.1x
Source: Company management, FactSet. Market data as of 11/18/16.
(1) Comparable peers include VRTUS, GBL, MN, and PZN.
(2) $7.04 as of 11/18/16.
(3) Multiple calculated using current price less balance sheet value divided by CAM 2017E EBITDA of $2.5mm. (4) Equity Value based on public shareholder ownership.
1 (5) Chronos Net Cash represents unrestricted balance sheet cash and investments available for distribution to public shareholders. Net Cash for peers represents public shareholders’ proportionate interest in Cash + Investment Portfolio -Debt.
(6) Chronos 2018E EBITDA represents 22.2% attributable to public shareholders. 2018E EBITDA for peers represents portion attributable to public shareh olders.
|
Observations Purposes Only
Confidential – For Discussion Purposes Only
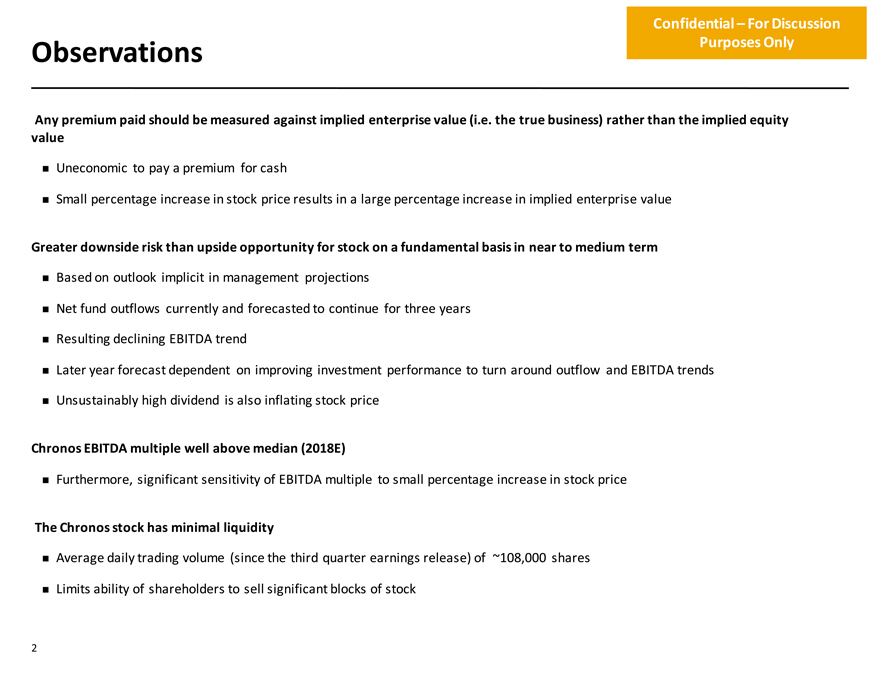
Any premium paid should be measured against implied enterprise value (i.e. the true business) rather than the implied equity value
Uneconomic to pay a premium for cash
Small percentage increase in stock price results in a large percentage increase in implied enterprise value
Greater downside risk than upside opportunity for stock on a fundamental basis in near to medium term
Based on outlook implicit in management projections
Net fund outflows currently and forecasted to continue for three years
Resulting declining EBITDA trend
Later year forecast dependent on improving investment performance to turn around outflow and EBITDA trends
Unsustainably high dividend is also inflating stock price
Chronos EBITDA multiple well above median (2018E)
Furthermore, significant sensitivity of EBITDA multiple to small percentage increase in stock price
(3)
The Chronos stock has minimal liquidity
Average daily trading volume (since the third quarter earnings release) of ~108,000 shares
Limits ability of shareholders to sell significant blocks of stock
2
|
Projected Balance Sheet Cash
Confidential – For Discussion Purposes Only
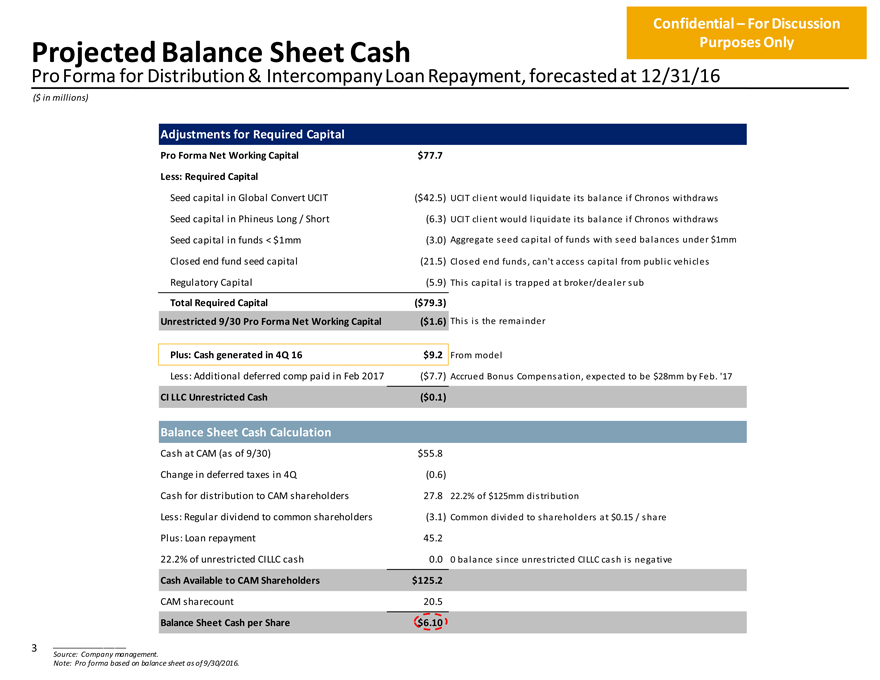
Pro Forma for Distribution & Intercompany Loan Repayment, forecasted at 12/31/16
($ in millions)
Adjustments for Required Capital
Pro Forma Net Working Capital $77.7
Less: Required Capital
Seed capital in Global Convert UCIT ($42.5) UCIT client would liquidate its balance if Chronos withdraws Seed capital in Phineus Long / Short (6.3) UCIT client would liquidate its balance if Chronos withdraws Seed capital in funds < $1mm (3.0) Aggregate seed capital of funds with seed balances under $1mm Closed end fund seed capital (21.5) Closed end funds, can’t access capital from public vehicles Regulatory Capital (5.9) This capital is trapped at broker/dealer sub
Total Required Capital ($79.3)
Unrestricted 9/30 Pro Forma Net Working Capital ($1.6) This is the remainder
Plus: Cash generated in 4Q 16 $9.2 From model
Less: Additional deferred comp paid in Feb 2017 ($7.7) Accrued Bonus Compensation, expected to be $28mm by Feb. ‘17
CI LLC Unrestricted Cash ($0.1)
Balance Sheet Cash Calculation
Cash at CAM (as of 9/30) $55.8
Change in deferred taxes in 4Q (0.6)
Cash for distribution to CAM shareholders 27.8 22.2% of $125mm distribution
Less: Regular dividend to common shareholders (3.1) Common divided to shareholders at $0.15 / share Plus: Loan repayment 45.2 22.2% of unrestricted CILLC cash 0.0 0 balance since unrestricted CILLC cash is negative
Cash Available to CAM Shareholders $125.2
CAM sharecount 20.5
Balance Sheet Cash per Share $6.10
3 ____________________
Source: Company management.
Note: Pro forma based on balance sheet as of 9/30/2016.
|
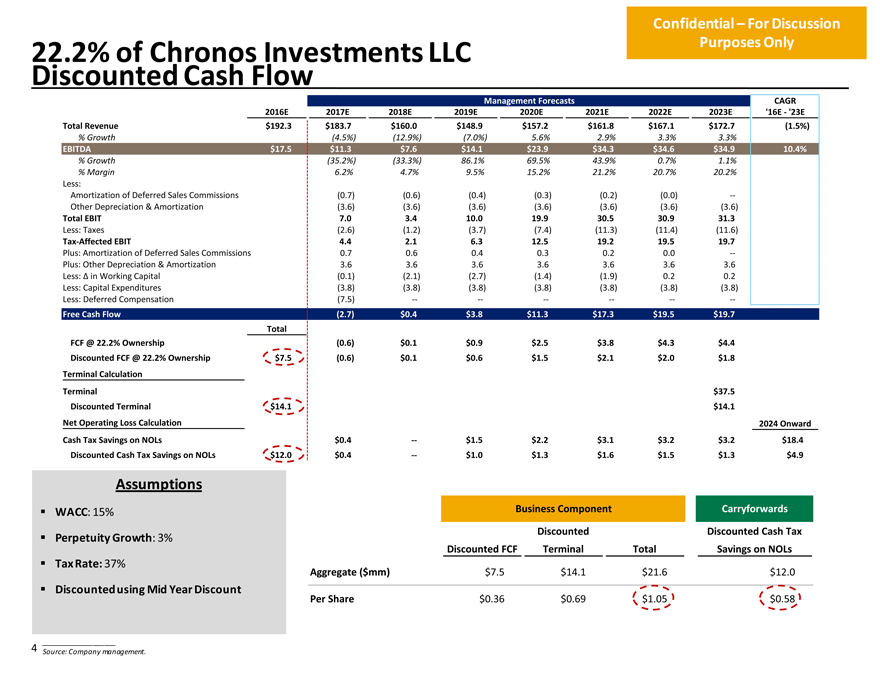
22.2% Discounted of Chronos Cash Flow Investments LLC
Management Forecasts CAGR 2016E 2017E 2018E 2019E 2020E 2021E 2022E 2023E ‘16E—‘23E
Confidential – For Discussion Purposes Only
Total Revenue $192.3 $183.7 $160.0 $148.9 $157.2 $161.8 $167.1 $172.7 (1.5%)
% Growth (4.5%) (12.9%) (7.0%) 5.6% 2.9% 3.3% 3.3%
EBITDA $17.5 $11.3 $7.6 $14.1 $23.9 $34.3 $34.6 $34.9 10.4%
% Growth (35.2%) (33.3%) 86.1% 69.5% 43.9% 0.7% 1.1%
% Margin 6.2% 4.7% 9.5% 15.2% 21.2% 20.7% 20.2%
Less:
Amortization of Deferred Sales Commissions (0.7) (0.6) (0.4) (0.3) (0.2) (0.0) —Other Depreciation & Amortization (3.6) (3.6) (3.6) (3.6) (3.6) (3.6) (3.6)
Total EBIT 7.0 3.4 10.0 19.9 30.5 30.9 31.3
Less: Taxes (2.6) (1.2) (3.7) (7.4) (11.3) (11.4) (11.6)
Tax-Affected EBIT 4.4 2.1 6.3 12.5 19.2 19.5 19.7
Plus: Amortization of Deferred Sales Commissions 0.7 0.6 0.4 0.3 0.2 0.0 —Plus: Other Depreciation & Amortization 3.6 3.6 3.6 3.6 3.6 3.6 3.6 Less: Ä in Working Capital (0.1) (2.1) (2.7) (1.4) (1.9) 0.2 0.2 Less: Capital Expenditures (3.8) (3.8) (3.8) (3.8) (3.8) (3.8) (3.8) Less: Deferred Compensation (7.5) -—————-
Free Cash Flow (2.7) $0.4 $3.8 $11.3 $17.3 $19.5 $19.7 Total FCF @ 22.2% Ownership (0.6) $0.1 $0.9 $2.5 $3.8 $4.3 $4.4 Discounted FCF @ 22.2% Ownership $7.5 (0.6) $0.1 $0.6 $1.5 $2.1 $2.0 $1.8
Terminal Calculation
Terminal $37.5 Discounted Terminal $14.1 $14.1
Net Operating Loss Calculation 2024 Onward Cash Tax Savings on NOLs $0.4 — $1.5 $2.2 $3.1 $3.2 $3.2 $18.4 Discounted Cash Tax Savings on NOLs $12.0 $0.4 — $1.0 $1.3 $1.6 $1.5 $1.3 $4.9
Assumptions
WACC: 15%
Perpetuity Growth: 3%
Tax Rate: 37%
Discounted using Mid Year Discount
Business Component Carryforwards
Discounted Discounted Cash Tax Discounted FCF Terminal Total Savings on NOLs
Aggregate ($mm) $7.5 $14.1 $21.6 $12.0
Per Share $0.36 $0.69 $1.05 $0.58
4 Source: Company management.
|
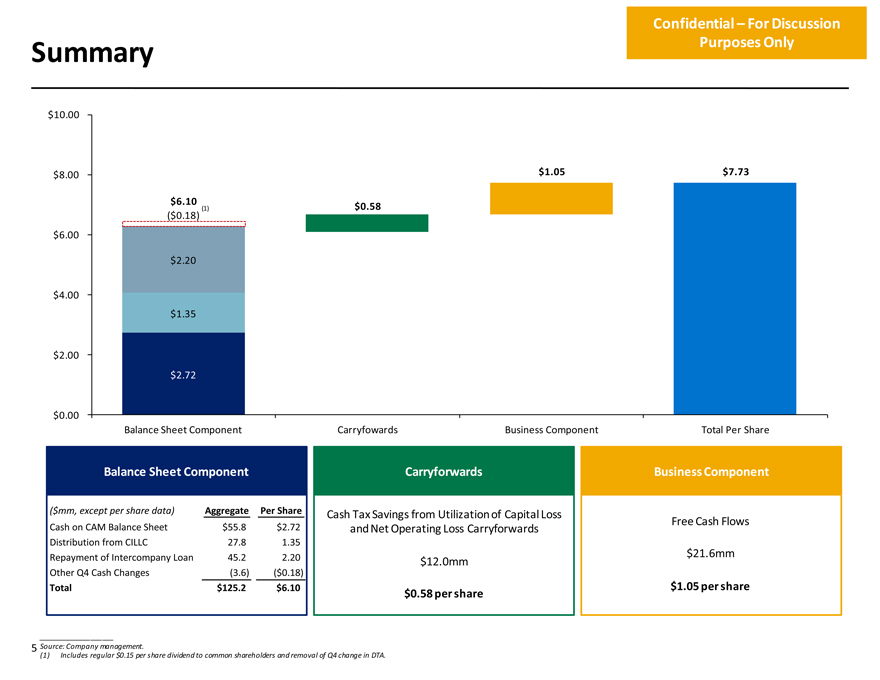
Summary
Confidential – For Discussion Purposes Only
$10.00
$8.00 $1.05 $7.73
$6.10
(1) $0.58
($0.18)
$6.00
$2.20
$4.00
$1.35
$2.00
$2.72
$0.00
Balance Sheet Component Carryfowards Business Component Total Per Share
Balance Sheet Component Carryforwards Business Component
($mm, except per share data) Aggregate Per Share Cash Tax Savings from Utilization of Capital Loss
Free Cash Flows
Cash on CAM Balance Sheet $55.8 $2.72 and Net Operating Loss Carryforwards Distribution from CILLC 27.8 1.35
Repayment of Intercompany Loan 45.2 2.20 $21.6mm $12.0mm
Other Q4 Cash Changes (3.6) ($0.18)
Total $125.2 $6.10 $1.05 per share $0.58 per share
5 Source: Company management.
(1) Includes regular $0.15 per share dividend to common shareholders and removal of Q4 change in DTA.
|
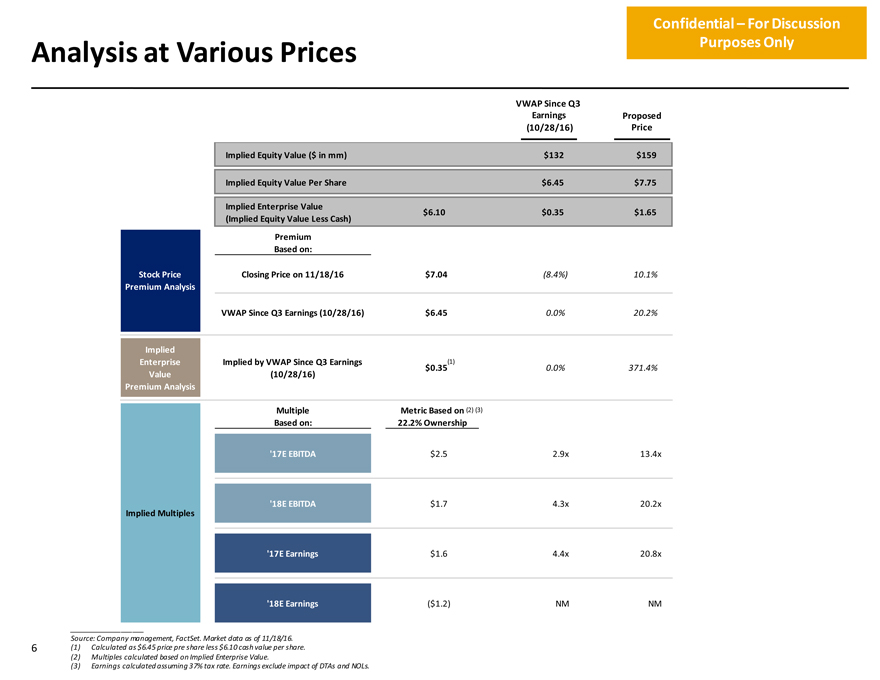
Analysis at Various Prices
Confidential – For Discussion Purposes Only
VWAP Since Q3
Earnings Proposed
(10/28/16) Price
Implied Equity Value ($ in mm) $132 $159
Implied Equity Value Per Share $6.45 $7.75
Implied Enterprise Value
$6.10 $0.35 $1.65 (Implied Equity Value Less Cash)
Premium Based on:
Stock Price Closing Price on 11/18/16 $7.04 (8.4%) 10.1% Premium Analysis
VWAP Since Q3 Earnings (10/28/16) $6.45 0.0% 20.2%
Implied
Enterprise Implied by VWAP Since Q3 Earnings $0.35(1) 0.0% 371.4% Value (10/28/16) Premium Analysis
Multiple Metric Based on (2) (3) Based on: 22.2% Ownership
‘17E EBITDA $2.5 2.9x 13.4x
‘18E EBITDA $1.7 4.3x 20.2x
Implied Multiples
‘17E Earnings $1.6 4.4x 20.8x
‘18E Earnings ($1.2) NM NM
Source: Company management, FactSet. Market data as of 11/18/16.
6 (1) Calculated as $6.45 price pre share less $6.10 cash value per share. (2) Multiples calculated based on Implied Enterprise Value.
(3) Earnings calculated assuming 37% tax rate. Earnings exclude impact of DTAs and NOLs.
|
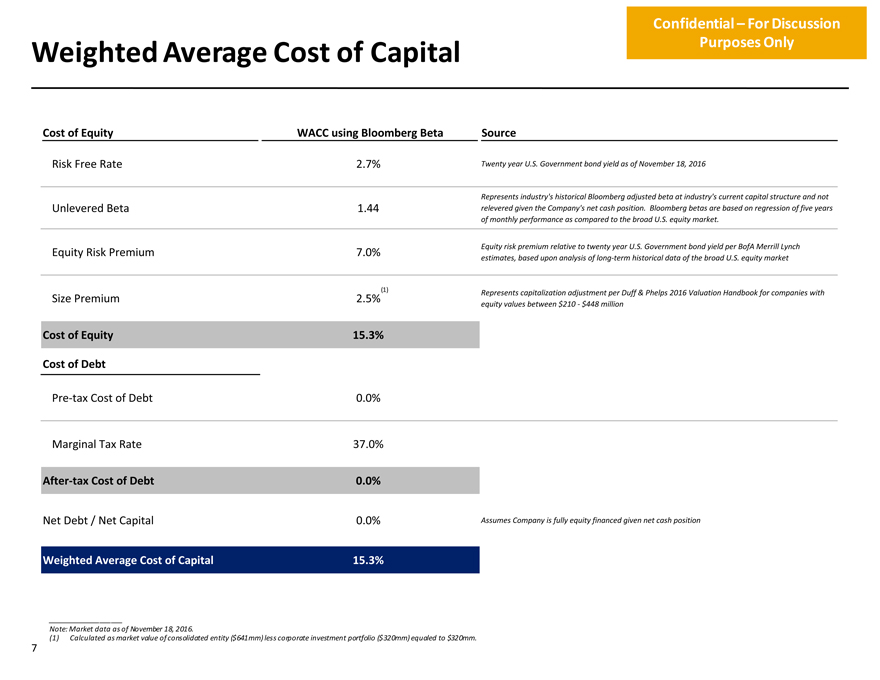
Weighted Average Cost of Capital
Confidential – For Discussion Purposes Only
Cost of Equity WACC using Bloomberg Beta
Risk Free Rate 2.7%
Unlevered Beta 1.44
Equity Risk Premium 7.0%
(1)
Size Premium 2.5%
Cost of Equity 15.3%
Cost of Debt
Pre-tax Cost of Debt 0.0%
Marginal Tax Rate 37.0%
After-tax Cost of Debt 0.0%
Net Debt / Net Capital 0.0%
Weighted Average Cost of Capital 15.3%
Source
Twenty year U.S. Government bond yield as of November 18, 2016
Represents industry’s historical Bloomberg adjusted beta at industry’s current capital structure and not relevered given the Company’s net cash position. Bloomberg betas are based on regression of five years of monthly performance as compared to the broad U.S. equity market.
Equity risk premium relative to twenty year U.S. Government bond yield per BofA Merrill Lynch estimates, based upon analysis of long-term historical data of the broad U.S. equity market
Represents capitalization adjustment per Duff & Phelps 2016 Valuation Handbook for companies with equity values between $210—$448 million
Assumes Company is fully equity financed given net cash position
Note: Market data as of November 18, 2016.
(1) Calculated as market value of consolidated entity ($641mm) less corporate investment portfolio ($320mm) equaled to $320mm.
7
|
Weighted Average Cost of Capital
Confidential – For Discussion Purposes Only
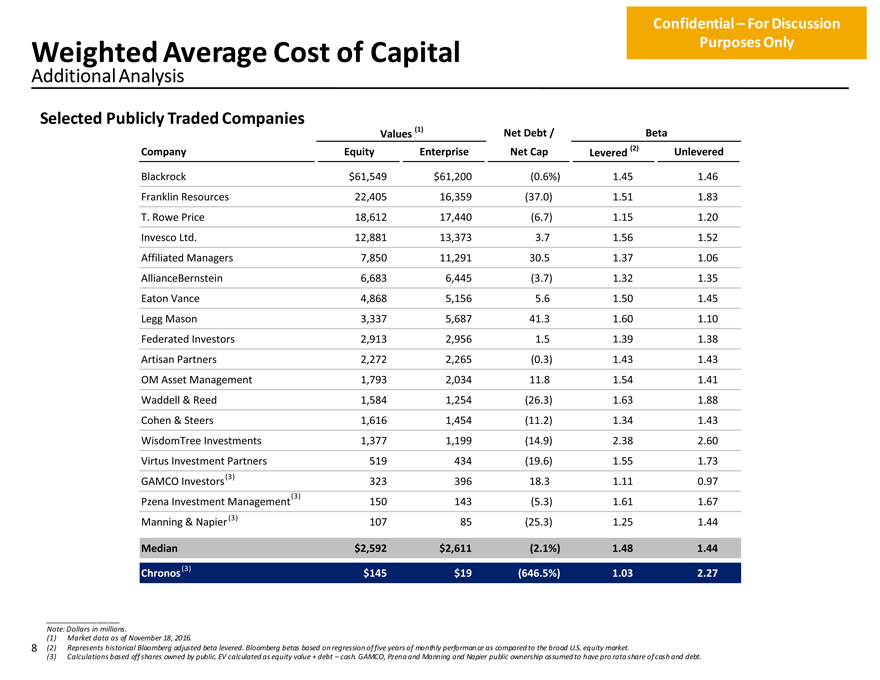
Additional Analysis
Selected Publicly Traded Companies
Values (1) Net Debt / Beta
Company Equity Enterprise Net Cap Levered (2) Unlevered
Blackrock $61,549 $61,200 (0.6%) 1.45 1.46 Franklin Resources 22,405 16,359 (37.0) 1.51 1.83 T. Rowe Price 18,612 17,440 (6.7) 1.15 1.20 Invesco Ltd. 12,881 13,373 3.7 1.56 1.52 Affiliated Managers 7,850 11,291 30.5 1.37 1.06 AllianceBernstein 6,683 6,445 (3.7) 1.32 1.35 Eaton Vance 4,868 5,156 5.6 1.50 1.45 Legg Mason 3,337 5,687 41.3 1.60 1.10 Federated Investors 2,913 2,956 1.5 1.39 1.38 Artisan Partners 2,272 2,265 (0.3) 1.43 1.43 OM Asset Management 1,793 2,034 11.8 1.54 1.41 Waddell & Reed 1,584 1,254 (26.3) 1.63 1.88 Cohen & Steers 1,616 1,454 (11.2) 1.34 1.43 WisdomTree Investments 1,377 1,199 (14.9) 2.38 2.60
Virtus Investment Partners 519 434 (19.6) 1.55 1.73
(3)
GAMCO Investors 323 396 18.3 1.11 0.97
(3)
Pzena Investment Management 150 143 (5.3) 1.61 1.67 Manning & Napier(3) 107 85 (25.3) 1.25 1.44
Median $2,592 $2,611 (2.1%) 1.48 1.44
(3)
Chronos $145 $19 (646.5%) 1.03 2.27
Note: Dollars in millions.
(1) Market data as of November 18, 2016.
8 (2) Represents historical Bloomberg adjusted beta levered. Bloomberg betas based on regression of five years of monthly performan ce as compared to the broad U.S. equity market.
(3) Calculations based off shares owned by public. EV calculated as equity value + debt – cash. GAMCO, Pzena and Manning and Napier public ownership assumed to have pro rata share of cash and debt.