UNITED STATES
SECURITIES AND EXCHANGE COMMISSION
Washington, D.C. 20549
FORM N-CSR
CERTIFIED SHAREHOLDER REPORT OF REGISTERED
MANAGEMENT INVESTMENT COMPANIES
Investment Company Act file number | 811-21609 |
|
Western Asset Variable Rate Strategic Fund Inc. |
(Exact name of registrant as specified in charter) |
|
55 Water Street, New York, NY | | 10041 |
(Address of principal executive offices) | | (Zip code) |
|
Robert I. Frenkel, Esq. Legg Mason & Co., LLC 100 First Stamford Place Stamford, CT 06902 |
(Name and address of agent for service) |
|
Registrant’s telephone number, including area code: | (888) 777-0102 | |
|
Date of fiscal year end: | September 30 | |
|
Date of reporting period: | September 30, 2010 | |
| | | | | | | | |
ITEM 1. REPORT TO STOCKHOLDERS.
The Annual Report to Stockholders is filed herewith.
September 30, 2010 | | 
|
Annual Report
Western Asset Variable Rate Strategic Fund Inc.
(GFY)
INVESTMENT PRODUCTS: NOT FDIC INSURED · NO BANK GUARANTEE · MAY LOSE VALUE |
II | | Western Asset Variable Rate Strategic Fund Inc. | | | |
Fund objective
The Fund’s investment objective is to maintain a high level of current income.
What’s inside
Letter from chairman | II |
| |
Investment commentary | III |
| |
Fund overview | 1 |
| |
Fund at a glance | 4 |
| |
Spread duration | 5 |
| |
Effective duration | 6 |
| |
Schedule of investments | 7 |
| |
Statement of assets and liabilities | 20 |
| |
Statement of operations | 21 |
| |
Statements of changes in net assets | 22 |
| |
Financial highlights | 23 |
| |
Notes to financial statements | 24 |
| |
Report of independent registered public accounting firm | 37 |
| |
Additional information | 38 |
| |
Annual chief executive officer and chief financial officer certifications | 43 |
| |
Important tax information | 44 |
| |
Dividend reinvestment plan | 45 |
Letter from the chairman | 
|
Dear Shareholder,
We are pleased to provide the annual report of Western Asset Variable Rate Strategic Fund Inc. for the twelve-month reporting period ended September 30, 2010. Please read on for a detailed look at prevailing economic and market conditions during the Fund’s reporting period and to learn how those conditions have affected Fund performance.
As always, we remain committed to providing you with excellent service and a full spectrum of investment choices. We also remain committed to supplementing the support you receive from your financial advisor. One way we accomplish this is through our website, www.leggmason.com/cef. Here you can gain immediate access to market and investment information, including:
· Fund prices and performance,
· Market insights and commentaries from our portfolio managers, and
· A host of educational resources.
Special shareholder notice
On June 1, 2010, Western Asset Variable Rate Strategic Fund Inc. announced that, in accordance with its tender offer for up to 1,664,686 of its issued and outstanding shares of common stock, which expired on May 24, 2010, the Fund has accepted that number of shares for payment at $15.87 per share. These shares represent approximately 20% of the Fund’s outstanding shares.
The offer commenced on April 26, 2010 and expired at 5:00 p.m., New York City time, on May 24, 2010. The tender offer was made and stockholders were notified in accordance with the terms and conditions specified in the requirements of the Securities Exchange Act of 1934, as amended, and the Investment Company Act of 1940, as amended, either by publication or mailing or both.
A total of 4,690,964 were properly tendered and not withdrawn by May 24, 2010, the final date for withdrawals. Because the number of shares tendered exceeded 1,664,686 shares, the tender offer was oversubscribed. Therefore, in accordance with the terms and conditions specified in the Offer to Purchase, the Fund purchased shares from all tendering stockholders on a pro rata basis, disregarding fractions. Accordingly, on a pro rata basis, 35.487% of shares for each stockholder who properly tendered shares were accepted for payment. The Fund transmitted payment to purchase the duly tendered and accepted shares on May 28, 2010.
We look forward to helping you meet your financial goals.
Sincerely,

R. Jay Gerken, CFA
Chairman, President and Chief Executive Officer
October 29, 2010
| | | Western Asset Variable Rate Strategic Fund Inc. | | III |
Investment commentary
Economic review
While the U.S. economy continued to expand over the twelve months ended September 30, 2010, overall growth moderated as the period progressed and unemployment remained elevated. The Federal Reserve Board (“Fed”)i expressed concerns regarding the direction of the economy and indicated that it was prepared to take additional actions if necessary to spur growth. This, in turn, caused investor sentiment to improve and had significant implications for the financial markets.
In September 2010, the National Bureau of Economic Research (“NBER”), the organization charged with determining when recessions start and end, announced that the downturn that began in December 2007 had concluded in June 2009. However, the NBER said, “In determining that a trough occurred in June 2009, the committee did not conclude that economic conditions since that month have been favorable or that the economy has returned to operating at normal capacity.” The NBER’s point is well-taken given continued areas of weakness in the U.S. economy.
Although the U.S. Department of Commerce continued to report positive U.S. gross domestic product (“GDP”)ii growth, the expansion has moderated since peaking at 5.0% in the fourth quarter of 2009. A slower drawdown in business inventories and renewed consumer spending were contributing factors spurring the economy’s solid growth at the end of 2009. However, the economy has grown at a more modest pace thus far in 2010. According to the Commerce Department, GDP growth was 3.7% and 1.7% during the first and second quarters of 2010, respectively. Its first estimate for third quarter GDP growth was 2.0%.
Turning to the job market, after experiencing sharp job losses in 2009, the U.S. Department of Labor reported that over one million new positions were added during the first five months of 2010. Included in that number, however, were 700,000 temporary government jobs tied to the 2010 Census. From June through September, more than 525,000 of these temporary positions were eliminated. This more than offset private sector growth and resulted in a net loss of 175,000, 66,000, 57,000 and 95,000 jobs in June, July, August and September, respectively. The unemployment rate ended the period at an elevated 9.6%.
There was mixed news in the housing market during the period. According to the National Association of Realtors, existing home sales increased 7.0% and 8.0% in March and April, respectively, after sales had fallen for the period from December 2009 through February 2010. The rebound was largely attributed to people rushing to take advantage of the government’s $8,000 tax credit for first-time home buyers that expired at the end of April. However, with the end of the tax credit, existing home sales then declined from May through July. After a steep 27.0% decline in sales in July, sales then rose 7.3% and 10.0% in August and September, respectively. In addition, the inventory of unsold homes was a 10.7 month supply in September at the current sales level, versus a 12.0 month supply in August. Looking at home prices, the S&P/Case-Shiller Home Price Indexiii indicated that, after four straight increases, month-to-month U.S. home prices fell 0.2% in August.
One overall bright spot for the economy has been the manufacturing sector. Based on the Institute for Supply Management’s PMIiv, the manufacturing sector has grown fourteen consecutive months since it began expanding in August 2009. After reaching a six-year peak of 60.4 in April 2010, PMI data indicated somewhat more modest growth from May through July (a reading below 50 indicates a contraction, whereas a reading above 50 indicates an expansion). However, the manufacturing sector then expanded at a faster pace in August, as its 56.3 reading during the month was better than July’s 55.5. While PMI dipped back to 54.4 in September, thirteen of the eighteen industries tracked by the Institute for Supply Management grew during the month, whereas only eleven industries expanded in August.
Financial market overview
During the majority of the reporting period, the financial markets were largely characterized by healthy investor risk appetite and solid results by lower-quality bonds. However, the market experienced a sharp sell-off in late April and in May, during which risk aversion returned and investors flocked to the relative safety of U.S. Treasury securities. Demand for riskier assets then resumed in June and July, before another “flight to quality” occurred in August. This proved to be a temporary situation, however, as risk appetite returned in September.
IV | | Western Asset Variable Rate Strategic Fund Inc. | | | |
Investment commentary (cont’d)
Due to signs that economic growth was slowing toward the end of the reporting period, the Fed took further actions to spur the economy. At its August 10th meeting, the Fed announced that it would begin to use the proceeds from expiring agency debt and agency mortgage-backed securities to purchase longer-dated Treasury securities. This led to speculation that the Fed may again move to purchase large amounts of agency and Treasury securities in an attempt to avoid a double-dip recession and ward off deflation.
In addition, the Fed remained cautious throughout the reporting period given pockets of weakness in the economy. At its meeting in September 2010, the Fed said that “the pace of recovery in output and employment has slowed in recent months. . . . The Committee will maintain the target range for the federal funds ratev at 0 to 1/4 percent and continues to anticipate that economic conditions, including low rates of resource utilization, subdued inflation trends, and stable inflation expectations, are likely to warrant exceptionally low levels of the federal funds rate for an extended period.”
Fixed-income market review
Continuing the trend that began in the second quarter of 2009, nearly every spread sector (non-Treasury) outperformed equal-durationvi Treasuries during the first seven months of the reporting period. Over that time, investor confidence was high given encouraging economic data, continued low interest rates, benign inflation and rebounding corporate profits. Robust investor appetite was then replaced with heightened risk aversion toward the end of April and during the month of May. This was due to the escalating sovereign debt crisis in Europe, uncertainties regarding new financial reforms in the U.S. and some worse-than-expected economic data. Most spread sectors then produced positive absolute returns in June and July, as investor demand for these securities again increased. There was another bout of risk aversion in August, given fears that the economy may slip back into a recession. However, with the Fed indicating the possibility of another round of quantitative easing, most spread sectors rallied in September.
Both short- and long-term Treasury yields fluctuated but, overall, moved lower during the twelve months ended September 30, 2010. When the period began, two- and ten-year Treasury yields were 0.95% and 3.31%, respectively. On April 5, 2010, two- and ten-year Treasury yields peaked at 1.18% and 4.01%, respectively. Subsequent to hitting their highs for the period, yields largely declined during the remainder of the reporting period. When the period ended on September 30, 2010, two- and ten-year Treasury yields were 0.42% and 2.53%, respectively — near their lows for the reporting period. For the twelve months ended September 30, 2010, the Barclays Capital U.S. Aggregate Indexvii returned 8.16%.
The U.S. high-yield bond market produced strong results during the reporting period. The asset class posted positive returns during each month, except for May 2010 when risk aversion reached extremely elevated levels. The high-yield market was supported by better-than-expected corporate profits and overall strong investor demand. All told, the Barclays Capital U.S. High Yield — 2% Issuer Cap Indexviii returned 18.24% for the twelve months ended September 30, 2010.
Emerging market debt prices rallied over the reporting period, also posting positive returns each month during the period except for May 2010. This impressive performance was triggered by strong economic growth in many emerging market countries, solid domestic demand and generally robust investor demand for the asset class. The JPMorgan Emerging Markets Bond Index Global (“EMBI Global”)ix returned 15.88% over the twelve months ended September 30, 2010.
As always, thank you for your confidence in our stewardship of your assets.
Sincerely,

R. Jay Gerken, CFA
Chairman, President and Chief Executive Officer
October 29, 2010
All investments are subject to risk including the possible loss of principal. Past performance is no guarantee of future results. All index performance reflects no deduction for fees, expenses or taxes. Please note that an investor cannot invest directly in an index.
| | | Western Asset Variable Rate Strategic Fund Inc. | | V |
i | The Federal Reserve Board (“Fed”) is responsible for the formulation of policies designed to promote economic growth, full employment, stable prices and a sustainable pattern of international trade and payments. |
ii | Gross domestic product (“GDP”) is the market value of all final goods and services produced within a country in a given period of time. |
iii | The S&P/Case-Shiller Home Price Index measures the residential housing market, tracking changes in the value of the residential real estate market in twenty metropolitan regions across the United States. |
iv | The Institute for Supply Management’s PMI is based on a survey of purchasing executives who buy the raw materials for manufacturing at more than 350 companies. It offers an early reading on the health of the manufacturing sector. |
v | The federal funds rate is the rate charged by one depository institution on an overnight sale of immediately available funds (balances at the Federal Reserve) to another depository institution; the rate may vary from depository institution to depository institution and from day to day. |
vi | Duration is the measure of the price sensitivity of a fixed-income security to an interest rate change of 100 basis points. Calculation is based on the weighted average of the present values for all cash flows. |
vii | The Barclays Capital U.S. Aggregate Index is a broad-based bond index comprised of government, corporate, mortgage- and asset-backed issues, rated investment grade or higher, and having at least one year to maturity. |
viii | The Barclays Capital U.S. High Yield — 2% Issuer Cap Index is an index of the 2% Issuer Cap component of the Barclays Capital U.S. Corporate High Yield Index, which covers the U.S. dollar-denominated, non-investment grade, fixed-rate, taxable corporate bond market. |
ix | The JPMorgan Emerging Markets Bond Index Global (“EMBI Global”) tracks total returns for U.S. dollar-denominated debt instruments issued by emerging market sovereign and quasi-sovereign entities: Brady bonds, loans, Eurobonds and local market instruments. |
(This page intentionally left blank.)
| | Western Asset Variable Rate Strategic Fund Inc. 2010 Annual Report | | 1 |
Fund overview
Q. What is the Fund’s investment strategy?
A. The Fund seeks to maintain a high level of current income. The Fund invests primarily in variable rate instruments of U.S. and non-U.S. issuers, including U.S. and non-U.S. investment grade and high-yield debt, senior loans, emerging market debt and derivatives related to these securities.
At Western Asset Management Company (“Western Asset”), the Fund’s subadviser, we utilize a fixed-income team approach, with decisions derived from interaction among various investment management sector specialists. The sector teams are comprised of Western Asset’s senior portfolio managers, research analysts and an in-house economist. Under this team approach, management of client fixed-income portfolios will reflect a consensus of interdisciplinary views within the Western Asset organization. The portfolio managers responsible for development of investment strategy, day-to-day portfolio management, oversight and coordination of the Fund are Stephen A. Walsh, S. Kenneth Leech, Michael C. Buchanan, Andrea A. Mack, Keith J. Gardner, Dennis J. McNamara, Julien A. Scholnick and Michael Y. Pak.
Q. What were the overall market conditions during the Fund’s reporting period?
A. During the twelve months ended September 30, 2010, the riskier segments of the fixed-income market produced strong results and outperformed U.S. Treasuries. This was due, in part, to improving economic conditions following the lengthy downturn from mid-2008 through mid-2009. Also supporting the spread sectors (non-U.S. Treasuries) was overall solid demand from investors seeking incremental yields given the low rates available from short-term fixed-income securities.
The spread sectors rallied during most of the reporting period, with notable exceptions being in late April and May 2010, as well as August 2010. Starting toward the end of April, there was a “flight to quality,” triggered by concerns regarding the escalating sovereign debt crisis in Europe. In addition, investor sentiment was negatively impacted by uncertainties surrounding financial reform legislation in the U.S. and signs that economic growth was moderating. Collectively, this caused investors to flock to the relative safety of Treasury securities, driving their yields lower and prices higher.
However, robust investor risk appetite largely resumed during June and July, and again in September. These turnarounds occurred as the situation in Europe appeared to stabilize, the financial reform bill was signed into law and the Federal Reserve Board (“Fed”)i continued to indicate that it would keep short-term rates low for an extended period.
The yields on two- and ten-year Treasuries began the fiscal year at 0.95% and 3.31%, respectively. Treasury yields fluctuated during the twelve-month reporting period given changing perceptions regarding the economy, interest rates, inflation and deflation. Yields moved sharply lower toward the end of the fiscal year in anticipation of possible quantitative easing by the Fed. During the period, two-year Treasury yields moved as high as 1.18% and as low as 0.37% — ending the period at 0.42%. In contrast, ten-year Treasuries rose as high as 4.01% and fell as low as 2.47% — ending the fiscal year at 2.53%.
Q. How did we respond to these changing market conditions?
A. A number of adjustments were made to the Fund’s portfolio during the reporting period. We significantly increased the Fund’s allocation to non-agency mortgage-backed securities (“MBS”). The combination of the government’s aggressive programs to aid the housing market and signs that housing prices appeared to be stabilizing helped these securities generate strong results. In addition, the sector was supported by ongoing demand from asset managers participating in the Public-Private Investment Program (“PPIP”). In contrast, we reduced the Fund’s exposures to agency MBS and government agencies. We felt these sectors had become less attractive given their significant spread narrowing, which was driven by the government’s direct purchase of agency MBS. With the government phasing out its purchasing program at the end of March 2010, we believed that more attractive opportunities could be found in other areas of the market.
Overall, the use of derivatives was a significant contributor to performance during the twelve-month period. We used Eurodollar futures and options to manage the portfolio’s exposure to
2 | | Western Asset Variable Rate Strategic Fund Inc. 2010 Annual Report | | |
Fund overview (cont’d)
the short end of the yield curveii and used Treasury futures to manage exposure to the intermediate-to-long end of the curve. We utilized interest rate swaps to help manage the Fund’s yield curve exposure and overall durationiii during the period. We also used credit default swaps to increase the Fund’s exposure to certain sectors in the corporate bond market. We hedged the euro-denominated debt we bought with foreign currency forwards, but we also bought Brazilian real-denominated sovereign debt unhedged. This positioning took advantage of both high real rates in Brazil and an appreciating currency.
Performance review
For the twelve months ended September 30, 2010, Western Asset Variable Rate Strategic Fund Inc. returned 17.08% based on its net asset value (“NAV”)iv and 20.40% based on its New York Stock Exchange (“NYSE”) market price per share. The Fund’s unmanaged benchmark, the BofA Merrill Lynch Constant Maturity 3-Month LIBOR Indexv, returned 0.34% for the same period. The Lipper Loan Participation Closed-End Funds Category Averagevi returned 12.42% over the same time frame. Please note that Lipper performance returns are based on each fund’s NAV.
During the twelve-month period, the Fund made distributions to shareholders totaling $0.67 per share. The performance table shows the Fund’s twelve-month total return based on its NAV and market price as of September 30, 2010. Past performance is no guarantee of future results.
Performance Snapshot as of September 30, 2010
Price Per Share | | 12-Month Total Return* | |
$17.05 (NAV) | | 17.08% | |
$15.86 (Market Price) | | 20.40% | |
All figures represent past performance and are not a guarantee of future results.
* Total returns are based on changes in NAV or market price, respectively. Total returns assume the reinvestment of all distributions in additional shares.
Q. What were the leading contributors to performance?
A. The largest contributor to the Fund’s relative performance during the reporting period was its overweight exposure to non-agency MBS. As discussed, the sector generated strong results given robust demand and some signs of stabilization in the housing market.
Our investment grade bond and high-yield bond exposures also enhanced the Fund’s results. In both cases, the Fund’s overweights to the Financials and Industrials sectors were beneficial. Within the investment grade bond sector, overweight positions in General Electric Capital Corp. and Citigroup Inc. were rewarded. In the high-yield sector, the Fund’s overweight exposures to Penhall International Corp. and GMAC Inc. were positive for performance.
Elsewhere, the Fund’s duration positioning was additive to performance. We maintained a longer duration than that of the benchmark throughout the period. This contributed to performance as rates moved sharply lower during the period.
Q. What were the leading detractors from performance?
A. The largest detractors from the Fund’s performance during the reporting period were our overweight exposure to investment grade bonds issued by NRG Energy Inc. and, within the high-yield sector, overweights to Supermedia Inc. and Station Casinos Inc.
Looking for additional information?
The Fund is traded under the symbol “GFY” and its closing market price is available in most newspapers under the NYSE listings. The daily NAV is available on-line under the symbol “XGFYX” on most financial websites. Barron’s and the Wall Street Journal’s Monday edition both carry closed-end fund tables that provide additional information. In addition, the Fund issues a quarterly press release that can be found on most major financial websites as well as www.leggmason.com/cef.
In a continuing effort to provide information concerning the Fund, shareholders may call 1-888-777-0102 (toll free), Monday through Friday from 8:00 a.m. to 5:30 p.m. Eastern Time, for the Fund’s current NAV, market price and other information.
| | Western Asset Variable Rate Strategic Fund Inc. 2010 Annual Report | | 3 |
Thank you for your investment in Western Asset Variable Rate Strategic Fund Inc. As always, we appreciate that you have chosen us to manage your assets and we remain focused on achieving the Fund’s investment goals.
Sincerely,
Western Asset Management Company
October 19, 2010
RISKS: The Fund is a non-diversified, closed-end management investment company designed primarily as a long-term investment and not as a trading vehicle. The Fund is not intended to be a complete investment program and, due to the uncertainty inherent in all investments, there can be no assurance that the Fund will achieve its investment objective. Common shares at any point in time may be worth less than when invested, even after taking into account the reinvestment of Fund dividends and distributions. The Fund invests in fixed-income securities which are subject to credit risks, including the risk of nonpayment of scheduled interest or loan payments, which could lower the Fund’s value. As interest rates rise, the value of a fixed-income portfolio generally declines, reducing the value of the Fund. However, the Fund can normally be expected to have less significant interest rate related fluctuations in its NAV than investment companies investing primarily in fixed-rate fixed-income securities (other than money market funds) because the floating or variable rate securities in which the Fund invests float in response to changes in prevailing market interest rates. The Fund may invest in high-yield and foreign securities, including emerging markets, which involve risks beyond those inherent solely in higher-rated and domestic investments. High-yield bonds involve greater credit and liquidity risks than investment grade bonds. Investing in foreign securities is subject to certain risks typically not associated with domestic investing, such as currency fluctuations and changes in political conditions. These risks are magnified in emerging or developing markets. Derivatives, such as options or futures, can be illiquid and hard to value, especially in declining markets. A small investment in certain derivatives may have a potentially large impact on Fund performance.
Portfolio holdings and breakdowns are as of September 30, 2010 and are subject to change and may not be representative of the portfolio managers’ current or future investments. Please refer to pages 7 through 19 for a list and percentage breakdown of the Fund’s holdings.
The mention of sector breakdowns is for informational purposes only and should not be construed as a recommendation to purchase or sell any securities. The information provided regarding such sectors is not a sufficient basis upon which to make an investment decision. Investors seeking financial advice regarding the appropriateness of investing in any securities or investment strategies discussed should consult their financial professional. The Fund’s top five sector holdings (as a percentage of net assets) as of September 30, 2010 were: Financials (32.1%), Collateralized Mortgage Obligations (30.6%), Energy (6.0%), Consumer Discretionary (5.8%) and Telecommunication Services (4.5%). The Fund’s portfolio composition is subject to change at any time.
All investments are subject to risk including the possible loss of principal. Past performance is no guarantee of future results. All index performance reflects no deduction for fees, expenses or taxes. Please note that an investor cannot invest directly in an index.
The information provided is not intended to be a forecast of future events, a guarantee of future results or investment advice. Views expressed may differ from those of the firm as a whole.
i | The Federal Reserve Board (“Fed”) is responsible for the formulation of policies designed to promote economic growth, full employment, stable prices and a sustainable pattern of international trade and payments. |
ii | The yield curve is the graphical depiction of the relationship between the yield on bonds of the same credit quality but different maturities. |
iii | Duration is the measure of the price sensitivity of a fixed-income security to an interest rate change of 100 basis points. Calculation is based on the weighted average of the present values for all cash flows. |
iv | Net asset value (“NAV”) is calculated by subtracting total liabilities and outstanding preferred stock (if any) from the closing value of all securities held by the Fund (plus all other assets) and dividing the result (total net assets) by the total number of the common shares outstanding. The NAV fluctuates with changes in the market prices of securities in which the Fund has invested. However, the price at which an investor may buy or sell shares of the Fund is the Fund’s market price as determined by supply of and demand for the Fund’s shares. |
v | The Merrill Lynch BofA Constant Maturity 3-Month LIBOR Index is based on the assumed purchase of a synthetic instrument having three months to maturity and with a coupon equal to the closing quote for three-month LIBOR. That issue is sold the following day (priced at a yield equal to the current day closing three-month LIBOR rate) and is rolled into a new three-month instrument. The Index, therefore, will always have a constant maturity equal to exactly three months. |
vi | Lipper, Inc., a wholly-owned subsidiary of Reuters, provides independent insight on global collective investments. Returns are based on the twelve-month period ended September 30, 2010, including the reinvestment of all distributions, including returns of capital, if any, calculated among the 40 funds in the Fund’s Lipper category. |
4 | | Western Asset Variable Rate Strategic Fund Inc. 2010 Annual Report | | |
Fund at a glance† (unaudited)
Investment breakdown (%) as a percent of total investments
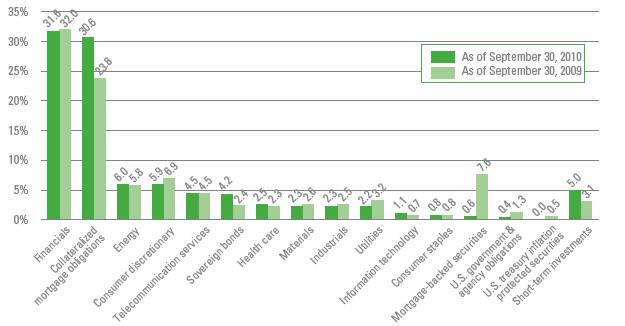
† The bar graph above represents the composition of the Fund’s investments as of September 30, 2010 and September 30, 2009 and does not include derivatives such as, future contracts, written options, forward foreign currency contracts and swap contracts. The Fund is actively managed. As a result, the composition of the Fund’s investments is subject to change at any time.
| | Western Asset Variable Rate Strategic Fund Inc. 2010 Annual Report | | 5 |
Spread duration (unaudited)
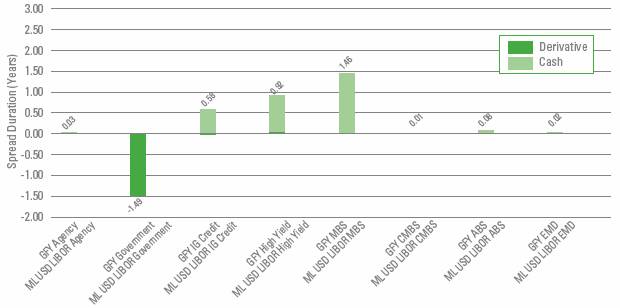
Spread duration is defined as the change in value for a 100 basis point change in the spread relative to Treasuries. The spread over Treasuries is the annual risk-premium demanded by investors to hold non-Treasury securities. This chart highlights the market sector exposure of the Fund’s portfolio and the exposure relative to the selected benchmark as of the end of the reporting period.
ABS | — Asset Backed Securities |
CMBS | — Commercial Mortgage Backed Securities |
EMD | — Emerging Markets |
GFY | — Western Asset Variable Rate Strategic Fund Inc. |
IG Credit | — Investment Grade Credit |
MBS | — Mortgage Backed Securities |
ML USD LIBOR | — BofA Merrill Lynch USD LIBOR 3-Month Constant Maturity |
6 | | Western Asset Variable Rate Strategic Fund Inc. 2010 Annual Report | | |
Effective duration (unaudited)
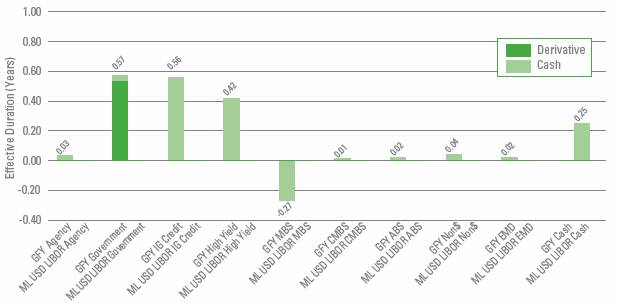
Effective duration is defined as the change in value for a 100 basis point change in Treasury yields. This chart highlights the interest rate exposure of the Fund’s portfolio relative to the selected benchmark as of the end of the reporting period.
ABS | — Asset Backed Securities |
CMBS | — Commercial Mortgage Backed Securities |
EMD | — Emerging Markets |
GFY | — Western Asset Variable Rate Strategic Fund Inc. |
IG Credit | — Investment Grade Credit |
MBS | — Mortgage Backed Securities |
ML USD LIBOR | — BofA Merrill Lynch USD LIBOR 3-Month Constant Maturity |
| | Western Asset Variable Rate Strategic Fund Inc. 2010 Annual Report | | 7 |
Schedule of investments
September 30, 2010
Western Asset Variable Rate Strategic Fund Inc.
Security | | Rate | | Maturity
Date | | Face
Amount† | | Value | |
Collateralized Mortgage Obligations — 30.6% | | | | | | | | | |
Adjustable Rate Mortgage Trust, 2005-11 5A1 | | 0.526 | % | 2/25/36 | | 308,390 | | $ | 176,675 | (a) |
Banc of America Funding Corp., 2003-1 A1 | | 6.000 | % | 5/20/33 | | 409,081 | | 428,862 | |
Banc of America Funding Corp., 2005-E 8A1 | | 3.221 | % | 6/20/35 | | 782,738 | | 426,175 | (a) |
Bayview Commercial Asset Trust, 2006-1A B2 | | 1.956 | % | 4/25/36 | | 1,207,764 | | 298,704 | (a)(b) |
Bear Stearns Alt-A Trust, 2004-3 A1 | | 0.896 | % | 4/25/34 | | 810,624 | | 627,913 | (a) |
Bear Stearns ARM Trust, 2004-8 11A1 | | 2.917 | % | 11/25/34 | | 687,416 | | 614,567 | (a) |
Bear Stearns Asset-Backed Securities Trust, 2005-AC3 1A1 | | 0.756 | % | 7/25/35 | | 881,169 | | 612,900 | (a) |
Citigroup Mortgage Loan Trust Inc., 2010-7 4A1 | | 1.264 | % | 9/25/37 | | 450,458 | | 450,458 | (a)(b)(c) |
Countrywide Alternative Loan Trust, 2005-24 4A1 | | 0.488 | % | 7/20/35 | | 865,980 | | 522,434 | (a) |
Countrywide Home Loan, Mortgage Pass-Through Trust, 2004-29 2A1 | | 0.586 | % | 2/25/35 | | 84,532 | | 56,037 | (a) |
Countrywide Home Loans, 2004-20 2A1 | | 2.883 | % | 9/25/34 | | 989,311 | | 436,987 | (a) |
Countrywide Home Loans, 2004-R1 2A | | 6.500 | % | 11/25/34 | | 178,911 | | 179,953 | (b) |
Countrywide Home Loans, 2005-HYB9 3A1A | | 4.669 | % | 2/20/36 | | 1,209,997 | | 865,398 | (a) |
Countrywide Home Loans, 2005-R3 AF | | 0.656 | % | 9/25/35 | | 760,515 | | 645,223 | (a)(b) |
Deutsche Mortgage Securities Inc., 2004-4 3AR1 | | 2.866 | % | 6/25/34 | | 398,907 | | 286,554 | (a) |
Downey Savings & Loan Association Mortgage Loan Trust, 2005-AR5 2A1A | | 0.587 | % | 8/19/45 | | 821,191 | | 516,119 | (a) |
Downey Savings & Loan Association Mortgage Loan Trust, 2006-AR1 1A1A | | 1.290 | % | 3/19/46 | | 479,047 | | 247,864 | (a) |
Federal Home Loan Mortgage Corp. (FHLMC), PAC IO | | 5.000 | % | 1/15/19 | | 2,166,418 | | 140,074 | (d) |
Federal Home Loan Mortgage Corp. (FHLMC), PAC IO, 2638 DI | | 5.000 | % | 5/15/23 | | 2,399,728 | | 216,830 | (d) |
Federal Home Loan Mortgage Corp. (FHLMC), PAC-1 IO | | 5.000 | % | 3/15/22 | | 3,208,226 | | 243,992 | (d) |
Federal National Mortgage Association (FNMA), STRIPS, IO | | 5.000 | % | 7/1/33 | | 8,115,861 | | 1,189,007 | (d) |
Federal National Mortgage Association (FNMA), STRIPS, IO, 339 30 | | 5.500 | % | 7/1/18 | | 2,290,035 | | 239,069 | (a)(d) |
Greenwich Capital Commercial Funding Corp., 2004-GG1 A4 | | 4.755 | % | 6/10/36 | | 379,844 | | 381,811 | |
GS Mortgage Securities Corp. II, 2001-1285 C | | 6.712 | % | 8/15/18 | | 950,000 | | 976,986 | (b) |
GSMPS Mortgage Loan Trust, 2005-LT1 A1 | | 0.486 | % | 2/25/35 | | 271,104 | | 225,016 | (a)(b)(c) |
GSMPS Mortgage Loan Trust, 2005-RP2 1AF | | 0.606 | % | 3/25/35 | | 1,172,017 | | 989,569 | (a)(b) |
GSMPS Mortgage Loan Trust, 2006-RP2 1AF1 | | 0.656 | % | 4/25/36 | | 539,643 | | 435,884 | (a)(b) |
Harborview Mortgage Loan Trust, 2004-10 4A | | 2.716 | % | 1/19/35 | | 520,795 | | 515,646 | (a) |
Harborview Mortgage Loan Trust, 2004-11 3A1A | | 0.607 | % | 1/19/35 | | 305,766 | | 175,030 | (a) |
Harborview Mortgage Loan Trust, 2005-14 3A1A | | 3.369 | % | 12/19/35 | | 300,611 | | 227,070 | (a) |
IMPAC Secured Assets Corp., 2005-2 A1 | | 0.576 | % | 3/25/36 | | 2,410,617 | | 1,296,668 | (a) |
Indymac Index Mortgage Loan Trust, 2004-AR12 A1 | | 0.646 | % | 12/25/34 | | 109,741 | | 67,010 | (a) |
Indymac Index Mortgage Loan Trust, 2004-AR7 A2 | | 1.116 | % | 9/25/34 | | 342,945 | | 227,362 | (a) |
Indymac Index Mortgage Loan Trust, 2004-AR8 2A2A | | 0.656 | % | 11/25/34 | | 94,342 | | 62,069 | (a) |
Indymac Index Mortgage Loan Trust, 2005-AR21 4A1 | | 5.153 | % | 10/25/35 | | 847,409 | | 684,894 | (a) |
JPMorgan Chase Commercial Mortgage Securities Corp., 2007-CB18 A1 | | 5.320 | % | 6/12/47 | | 706,392 | | 722,137 | |
JPMorgan Mortgage Trust, 2005-A3 3A4 | | 5.025 | % | 6/25/35 | | 400,000 | | 358,810 | (a) |
Luminent Mortgage Trust, 2006-2 A1A | | 0.456 | % | 2/25/46 | | 1,142,197 | | 651,127 | (a) |
MASTR ARM Trust, 2003-6 2A1 | | 2.286 | % | 12/25/33 | | 251,183 | | 225,444 | (a) |
MASTR ARM Trust, 2004-7 6M1 | | 0.906 | % | 8/25/34 | | 550,000 | | 435,521 | (a) |
MASTR Reperforming Loan Trust, 2005-2 1A1F | | 0.606 | % | 5/25/35 | | 1,632,733 | | 1,338,982 | (a)(b) |
| | | | | | | | | | |
See Notes to Financial Statements.
8 | | Western Asset Variable Rate Strategic Fund Inc. 2010 Annual Report | | |
Schedule of investments (cont’d)
September 30, 2010
Western Asset Variable Rate Strategic Fund Inc.
Security | | Rate | | Maturity
Date | | Face
Amount† | | Value | |
MASTR Reperforming Loan Trust, 2006-2 1A1 | | 5.635 | % | 5/25/36 | | 615,155 | | $ | 586,915 | (a)(b) |
MASTR Reperforming Loan Trust, 2006-2 2A1 | | 3.840 | % | 5/25/36 | | 264,123 | | 239,927 | (a)(b) |
Morgan Stanley Mortgage Loan Trust, 2006-6AR 2A | | 4.870 | % | 5/25/36 | | 1,308,281 | | 746,425 | (a) |
Residential Accredit Loans Inc., 2004-QA2 A2 | | 0.696 | % | 6/25/34 | | 839,100 | | 586,361 | (a) |
Residential Accredit Loans Inc., 2005-QO4 2A1 | | 0.536 | % | 12/25/45 | | 536,752 | | 313,420 | (a) |
Residential Asset Mortgage Products Inc., 2003-SL1 M1 | | 7.310 | % | 4/25/31 | | 1,062,606 | | 559,942 | (a) |
Structured ARM Loan Trust, 2004-20 1A1 | | 2.710 | % | 1/25/35 | | 190,161 | | 138,404 | (a) |
Structured ARM Loan Trust, 2004-9XS A | | 0.626 | % | 7/25/34 | | 944,832 | | 781,987 | (a) |
Structured Asset Mortgage Investments Inc., 2004-AR3 1A1 | | 0.857 | % | 7/19/34 | | 591,839 | | 509,459 | (a) |
Structured Asset Mortgage Investments Inc., 2006-AR2 A1 | | 0.486 | % | 2/25/36 | | 1,105,616 | | 637,991 | (a) |
Structured Asset Mortgage Investments Inc., 2006-AR3 11A1 | | 0.466 | % | 4/25/36 | | 509,683 | | 290,384 | (a) |
Structured Asset Securities Corp., 1998-2 M1 | | 1.356 | % | 2/25/28 | | 150,033 | | 146,337 | (a) |
Structured Asset Securities Corp., 1998-3 M1 | | 1.256 | % | 3/25/28 | | 121,007 | | 107,791 | (a) |
Structured Asset Securities Corp., 1998-8 M1 | | 1.196 | % | 8/25/28 | | 391,607 | | 305,079 | (a) |
Structured Asset Securities Corp., 2005-4XS 3A4 | | 4.790 | % | 3/25/35 | | 620,000 | | 577,401 | |
Structured Asset Securities Corp., 2005-RF1 A | | 0.606 | % | 3/25/35 | | 332,441 | | 274,780 | (a)(b) |
Structured Asset Securities Corp., 2005-RF2 A | | 0.606 | % | 4/25/35 | | 352,359 | | 293,747 | (a)(b) |
Structured Asset Securities Corp., 2005-RF3 1A | | 0.606 | % | 6/25/35 | | 341,026 | | 282,091 | (a)(b) |
Structured Asset Securities Corp., 2005-RF3 2A | | 4.493 | % | 6/25/35 | | 5,238,351 | | 4,439,991 | (a)(b) |
Voyager Dwnys Delaware Trust, 2009-1 UGL2 | | 1.290 | % | 3/20/47 | | 429,628 | | 35,444 | (a)(b)(c)(d) |
WaMu Mortgage Pass-Through Certificates, 2007-HY3 1A1 | | 5.438 | % | 3/25/37 | | 279,526 | | 203,927 | (a) |
Washington Mutual Inc. Mortgage Pass-Through Certificates, 2003-AR8 | | 0.616 | % | 10/25/45 | | 958,355 | | 580,672 | (a) |
Washington Mutual Inc. Mortgage Pass-Through Certificates, 2004-AR13 A1A | | 0.735 | % | 11/25/34 | | 758,061 | | 653,061 | (a) |
Washington Mutual Inc. Mortgage Pass-Through Certificates, 2006-AR11 1A | | 1.346 | % | 9/25/46 | | 628,675 | | 395,672 | (a) |
Washington Mutual Inc. Mortgage Pass-Through Certificates, 2006-AR8 1A3 | | 5.759 | % | 8/25/46 | | 375,000 | | 274,194 | (a) |
Washington Mutual Inc. Pass-Through Certificates, 2005-AR8 2AB3 | | 0.616 | % | 7/25/45 | | 632,341 | | 471,475 | (a) |
Washington Mutual Inc. Pass-Through Certificates, 2006-AR2 A1A | | 1.326 | % | 4/25/46 | | 331,695 | | 185,880 | (a) |
Wells Fargo Mortgage Backed Securities Trust, 2004-DD 1A1 | | 2.869 | % | 1/25/35 | | 762,212 | | 739,733 | (a) |
Total Collateralized Mortgage Obligations (Cost — $39,238,126) | | | | | | | | 34,777,321 | |
Asset-Backed Securities — 21.4% | | | | | | | | | |
Financials — 21.4% | | | | | | | | | |
Automobiles — 0.6% | | | | | | | | | |
Hertz Vehicle Financing LLC, 2009-2A A1 | | 4.260 | % | 3/25/14 | | 630,000 | | 661,342 | (b) |
Honda Auto Receivables Owner Trust, 2008-1 A3 | | 4.470 | % | 1/18/12 | | 84,354 | | 84,883 | |
Total Automobiles | | | | | | | | 746,225 | |
Home Equity — 19.1% | | | | | | | | | |
ABFS Mortgage Loan Trust, 2002-3 M1 | | 5.902 | % | 9/15/33 | | 870,000 | | 675,766 | |
Ameriquest Mortgage Securities Inc., 2002-AR1 M1 | | 1.327 | % | 9/25/32 | | 283,076 | | 235,960 | (a) |
Ameriquest Mortgage Securities Inc., 2005-R1 M1 | | 0.706 | % | 3/25/35 | | 800,000 | | 671,211 | (a) |
Asset Backed Funding Certificates, 2005-WF1 A2C | | 0.566 | % | 1/25/35 | | 273,590 | | 248,513 | (a) |
Bear Stearns Asset-Backed Securities Trust, 2001-3 A1 | | 0.706 | % | 10/27/32 | | 57,235 | | 45,756 | (a) |
Bear Stearns Asset-Backed Securities Trust, 2005-SD3 1A | | 0.746 | % | 7/25/35 | | 822,651 | | 633,240 | (a) |
| | | | | | | | | | |
See Notes to Financial Statements.
| | Western Asset Variable Rate Strategic Fund Inc. 2010 Annual Report | | 9 |
Western Asset Variable Rate Strategic Fund Inc.
Security | | Rate | | Maturity
Date | | Face
Amount† | | Value | |
Home Equity — continued | | | | | | | | | |
Bear Stearns Asset-Backed Securities Trust, 2007-SD1 1A2A | | 6.000 | % | 10/25/36 | | 1,324,263 | | $ | 1,043,307 | |
Chase Funding Mortgage Loan Asset-Backed Certificates, 2004-1 1A7 | | 3.985 | % | 11/25/33 | | 714,640 | | 650,616 | |
Citigroup Mortgage Loan Trust Inc., 2005-OPT4 M2 | | 0.686 | % | 7/25/35 | | 750,000 | | 648,579 | (a) |
Countrywide Asset-Backed Certificates, 2003-5 AF5 | | 5.739 | % | 2/25/34 | | 650,446 | | 580,359 | |
Countrywide Asset-Backed Certificates, 2005-5 M1 | | 0.716 | % | 10/25/35 | | 600,000 | | 558,123 | (a) |
Countrywide Asset-Backed Certificates, 2007-13 2A1 | | 1.156 | % | 10/25/47 | | 651,389 | | 438,607 | (a) |
Countrywide Asset-Backed Certificates, 2007-SEA2 1A1 | | 1.256 | % | 8/25/47 | | 524,074 | | 311,588 | (a)(b) |
Countrywide Home Equity Loan Trust, 2006-HW 2A1B | | 0.407 | % | 11/15/36 | | 1,189,145 | | 864,757 | (a) |
EMC Mortgage Loan Trust, 2004-C A1 | | 0.806 | % | 3/25/31 | | 249,340 | | 206,572 | (a)(b) |
First Franklin Mortgage Loan Asset-Backed Certificates, 2005-FFH4 2A4 | | 0.606 | % | 12/25/35 | | 400,000 | | 366,134 | (a) |
First Horizon ABS Trust, 2006-HE2 A | | 0.386 | % | 10/25/26 | | 1,630,638 | | 1,165,328 | (a) |
First Horizon ABS Trust, 2007-HE1 A | | 0.394 | % | 9/25/29 | | 151,143 | | 112,035 | (a) |
GMAC Mortgage Corp. Loan Trust, 2006-HE4 A1 | | 0.436 | % | 12/25/36 | | 1,214,181 | | 651,150 | (a) |
Greenpoint Home Equity Loan Trust, 2004-4 A | | 0.817 | % | 8/15/30 | | 664,165 | | 440,132 | (a) |
GSAMP Trust, 2004-OPT B1 | | 1.856 | % | 11/25/34 | | 100,231 | | 43,253 | (a) |
GSRPM Mortgage Loan Trust, 2007-1 A | | 0.656 | % | 10/25/46 | | 166,589 | | 94,175 | (a)(b) |
Home Equity Mortgage Trust, 2006-2 2A1 | | 0.416 | % | 7/25/36 | | 652,208 | | 214,144 | (a) |
IXIS Real Estate Capital Trust, 2005-HE4 A3 | | 0.596 | % | 2/25/36 | | 233,472 | | 209,273 | (a) |
Lehman XS Trust, (Structured Asset Securities Corp.), 2005-1 2A2 | | 1.764 | % | 7/25/35 | | 1,301,337 | | 773,298 | (a) |
Lehman XS Trust, 2005-5N 3A1A | | 0.556 | % | 11/25/35 | | 460,318 | | 325,473 | (a) |
Long Beach Mortgage Loan Trust, 2001-3 M1 | | 1.081 | % | 9/25/31 | | 234,371 | | 151,870 | (a) |
Long Beach Mortgage Loan Trust, 2002-1 2M1 | | 1.381 | % | 5/25/32 | | 716,559 | | 563,200 | (a) |
MASTR Second Lien Trust, 2005-1 A | | 0.526 | % | 9/25/35 | | 36,018 | | 34,575 | (a) |
MASTR Specialized Loan Trust, 2007-1 A | | 0.626 | % | 1/25/37 | | 558,557 | | 251,326 | (a)(b) |
Merrill Lynch Mortgage Investors Trust, 2007-SD1 A1 | | 0.706 | % | 2/25/47 | | 1,228,303 | | 598,345 | (a) |
Morgan Stanley ABS Capital I, 2007-NC2 M1 | | 0.626 | % | 2/25/37 | | 1,100,000 | | 12,483 | (a) |
Morgan Stanley ABS Capital I, 2007-NC2 M2 | | 0.676 | % | 2/25/37 | | 1,000,000 | | 7,357 | (a) |
Morgan Stanley ABS Capital I, 2007-NC2 M3 | | 0.806 | % | 2/25/37 | | 800,000 | | 3,466 | (a) |
Morgan Stanley ABS Capital I, 2007-NC2 M4 | | 1.256 | % | 2/25/37 | | 500,000 | | 1,532 | (a) |
Morgan Stanley ABS Capital I, 2007-NC2 M5 | | 1.456 | % | 2/25/37 | | 267,149 | | 258 | (a) |
Morgan Stanley Capital Inc., 2004-HE8 A7 | | 0.786 | % | 9/25/34 | | 74,135 | | 61,068 | (a) |
New Century Home Equity Loan Trust, 2004-3 M1 | | 1.186 | % | 11/25/34 | | 638,898 | | 459,898 | (a) |
Option One Mortgage Loan Trust, 2005-1 A4 | | 0.656 | % | 2/25/35 | | 226,177 | | 198,353 | (a) |
Park Place Securities Inc., 2004-WHQ2 M2 | | 0.886 | % | 2/25/35 | | 750,000 | | 656,837 | (a) |
RAAC Series, 2006-RP2 A | | 0.506 | % | 2/25/37 | | 363,739 | | 237,194 | (a)(b) |
RAAC Series, 2006-RP3 A | | 0.526 | % | 5/25/36 | | 1,313,674 | | 749,165 | (a)(b) |
RAAC Series, 2006-RP4 A | | 0.546 | % | 1/25/46 | | 768,152 | | 517,342 | (a)(b) |
RAAC Series, 2007-RP3 M1 | | 1.056 | % | 10/25/46 | | 1,200,000 | | 41,719 | (a)(b) |
RAAC Series, 2007-RP4 A | | 0.606 | % | 11/25/46 | | 1,256,788 | | 678,439 | (a)(b) |
RAAC Series, 2007-SP3 A1 | | 1.456 | % | 9/25/37 | | 345,643 | | 265,918 | (a) |
Renaissance Home Equity Loan Trust, 2003-1 A | | 1.116 | % | 6/25/33 | | 241,728 | | 214,348 | (a) |
Renaissance Home Equity Loan Trust, 2003-2 A | | 0.696 | % | 8/25/33 | | 201,707 | | 178,433 | (a) |
Renaissance Net Interest Margin Trust, 2007-2 N | | 8.353 | % | 6/25/37 | | 128,633 | | 161 | (b) |
| | | | | | | | | | |
See Notes to Financial Statements.
10 | | Western Asset Variable Rate Strategic Fund Inc. 2010 Annual Report | | |
Schedule of investments (cont’d)
September 30, 2010
Western Asset Variable Rate Strategic Fund Inc.
Security | | Rate | | Maturity
Date | | Face
Amount† | | Value | |
Home Equity — continued | | | | | | | | | |
Residential Asset Mortgage Products Inc., 2003-RZ4 A7 | | 4.790 | % | 6/25/33 | | 312,474 | | $ | 310,515 | |
SACO I Trust, 2005-WM3 A3 | | 0.956 | % | 9/25/35 | | 273,229 | | 116,852 | (a) |
SACO I Trust, 2006-3 A3 | | 0.716 | % | 4/25/36 | | 700,903 | | 204,558 | (a) |
SACO I Trust, 2006-4 A1 | | 0.426 | % | 3/25/36 | | 765,103 | | 215,169 | (a) |
Sail Net Interest Margin Notes, 2004-2A A | | 5.500 | % | 3/27/34 | | 107,070 | | 0 | (b)(d)(f) |
Soundview Home Equity Loan Trust, 2005-3 M2 | | 0.776 | % | 6/25/35 | | 480,637 | | 466,261 | (a) |
Structured Asset Investment Loan Trust, 2004-9 M4 | | 1.556 | % | 10/25/34 | | 177,472 | | 50,760 | (a) |
Structured Asset Securities Corp., 2004-6XS A5B | | 5.550 | % | 3/25/34 | | 663,305 | | 652,610 | |
Structured Asset Securities Corp., 2005-4XS 2A1A | | 2.062 | % | 3/25/35 | | 683,564 | | 545,844 | (a) |
Structured Asset Securities Corp., 2005-SC1 1A1 | | 0.526 | % | 5/25/31 | | 887,642 | | 461,073 | (a)(b) |
Structured Asset Securities Corp., 2006-GEL1 A2 | | 0.606 | % | 11/25/35 | | 600,000 | | 462,000 | (a)(b) |
Structured Asset Securities Corp., 2007-BC3 2A3 | | 0.436 | % | 5/25/47 | | 290,000 | | 73,802 | (a) |
Washington Mutual Inc. Asset-Backed Certificates, 2007-HE3 M5 | | 1.306 | % | 5/25/47 | | 263,835 | | 278 | (a) |
Total Home Equity | | | | | | | | 21,650,358 | |
Manufactured Housing — 0.6% | | | | | | | | | |
Conseco Finance Securitizations Corp., 2000-4 A6 | | 8.310 | % | 5/1/32 | | 549,489 | | 451,350 | (a) |
Vanderbilt Mortgage Finance, 2000-B IB2 | | 9.250 | % | 7/7/30 | | 224,830 | | 185,513 | (a) |
Total Manufactured Housing | | | | | | | | 636,863 | |
Student Loan — 1.1% | | | | | | | | | |
National Collegiate Student Loan Trust, IO, 2007-2 AIO | | 6.700 | % | 7/25/12 | | 4,500,000 | | 494,995 | (c) |
SLC Student Loan Trust, 2008-1 A4A | | 1.892 | % | 12/15/32 | | 720,000 | | 749,820 | (a) |
SLC Student Loan Trust, 2008-2 A1 | | 0.692 | % | 9/15/14 | | 60,063 | | 60,095 | (a) |
Total Student Loan | | | | | | | | 1,304,910 | |
Total Asset-Backed Securities (Cost — $32,597,885) | | | | | | | | 24,338,356 | |
Collateralized Senior Loans — 8.4% | | | | | | | | | |
Consumer Discretionary — 2.9% | | | | | | | | | |
Auto Components — 0.6% | | | | | | | | | |
Allison Transmission Inc., Term Loan B | | 3.010 - 3.050 | % | 8/7/14 | | 719,778 | | 677,266 | (e) |
Hotels, Restaurants & Leisure — 0.3% | | | | | | | | | |
BLB Worldwide Holdings Inc., Term Loan | | 6.500 | % | 7/18/12 | | 750,000 | | 17,812 | (e)(f) |
Harrahs Operating Co. Inc., Term Loan B2 | | 3.498 | % | 1/28/15 | | 460,941 | | 398,136 | (e) |
Total Hotels, Restaurants & Leisure | | | | | | | | 415,948 | |
Media — 1.6% | | | | | | | | | |
Charter Communications, Term Loan C | | 3.540 | % | 9/6/16 | | 865,967 | | 847,024 | (e) |
CSC Holdings Inc., Term Loan B-2 | | 2.007 | % | 3/29/16 | | 444,177 | | 443,288 | (e) |
CSC Holdings LLC, Term Loan B-3 | | 2.007 | % | 3/29/16 | | 234,344 | | 233,875 | (e) |
SuperMedia Inc., Term Loan | | 11.000 | % | 12/31/15 | | 351,880 | | 274,969 | (e) |
Total Media | | | | | | | | 1,799,156 | |
Multiline Retail — 0.4% | | | | | | | | | |
Neiman Marcus Group Inc., Term Loan B | | 2.258 - 2.294 | % | 4/5/13 | | 465,656 | | 452,057 | (e) |
Total Consumer Discretionary | | | | | | | | 3,344,427 | |
Energy — 0.3% | | | | | | | | | |
Oil, Gas & Consumable Fuels — 0.3% | | | | | | | | | |
Ashmore Energy International, Synthetic Revolving Credit Facility | | 3.433 | % | 3/30/12 | | 47,569 | | 44,750 | (e) |
Ashmore Energy International, Term Loan | | 3.289 | % | 3/30/14 | | 312,017 | | 293,530 | (e) |
Total Energy | | | | | | | | 338,280 | |
| | | | | | | | | | |
See Notes to Financial Statements.
| | Western Asset Variable Rate Strategic Fund Inc. 2010 Annual Report | | 11 |
Western Asset Variable Rate Strategic Fund Inc.
Security | | Rate | | Maturity
Date | | Face
Amount† | | Value | |
Health Care — 1.7% | | | | | | | | | |
Health Care Providers & Services — 1.7% | | | | | | | | | |
Community Health Systems Inc., Delayed Draw Term Loan | | 2.549 | % | 7/25/14 | | 473,038 | | $ | 449,385 | (e) |
Community Health Systems Inc., Term Loan B | | 2.549 | % | 7/25/14 | | 23,372 | | 22,204 | (e) |
HCA Inc., Term Loan B | | 2.539 | % | 11/18/13 | | 630,983 | | 608,252 | (e) |
Health Management Associates Inc., Term Loan B | | 2.039 | % | 2/28/14 | | 907,107 | | 858,634 | (e) |
Total Health Care | | | | | | | | 1,938,475 | |
Industrials — 0.9% | | | | | | | | | |
Trading Companies & Distributors — 0.9% | | | | | | | | | |
Transdigm Inc. Term B | | 2.256 - 2.290 | % | 6/23/13 | | 1,000,000 | | 982,500 | (e) |
Information Technology — 0.6% | | | | | | | | | |
IT Services — 0.6% | | | | | | | | | |
First Data Corp., Term Loan B2 | | 3.006 | % | 9/24/14 | | 711,293 | | 627,628 | (e) |
Materials — 0.4% | | | | | | | | | |
Containers & Packaging — 0.4% | | | | | | | | | |
Berry Plastics Group Inc., Term Loan C | | 2.376 | % | 4/3/15 | | 493,606 | | 452,463 | (e) |
Telecommunication Services — 0.4% | | | | | | | | | |
Diversified Telecommunication Services — 0.4% | | | | | | | | | |
Level 3 Communications Inc., Term Loan | | 2.507 - 2.777 | % | 3/13/14 | | 500,000 | | 458,304 | (e) |
Utilities — 1.2% | | | | | | | | | |
Electric Utilities — 0.7% | | | | | | | | | |
TXU Corp., Term Loan B2 | | 3.758 - 4.066 | % | 10/10/14 | | 970,000 | | 754,916 | (e) |
Independent Power Producers & Energy Traders — 0.5% | | | | | | | | | |
NRG Energy Inc., Term Loan | | 1.789 | % | 2/1/13 | | 131,958 | | 128,796 | (e) |
NRG Energy Inc., Term Loan B | | 3.539 | % | 8/31/15 | | 495,002 | | 495,002 | (e) |
Total Independent Power Producers & Energy Traders | | | | | | | | 623,798 | |
Total Utilities | | | | | | | | 1,378,714 | |
Total Collateralized Senior Loans (Cost — $10,917,642) | | | | | | | | 9,520,791 | |
Corporate Bonds & Notes — 29.0% | | | | | | | | | |
Consumer Discretionary — 2.8% | | | | | | | | | |
Automobiles — 0.3% | | | | | | | | | |
Ford Motor Credit Co., LLC, Senior Notes | | 9.875 | % | 8/10/11 | | 220,000 | | 233,065 | |
Motors Liquidation Co., Senior Debentures | | 8.250 | % | 7/15/23 | | 50,000 | | 16,375 | (f) |
Motors Liquidation Co., Senior Debentures | | 8.375 | % | 7/15/33 | | 400,000 | | 137,000 | (f) |
Total Automobiles | | | | | | | | 386,440 | |
Diversified Consumer Services — 0.0% | | | | | | | | | |
Service Corp. International, Senior Notes | | 7.625 | % | 10/1/18 | | 30,000 | | 32,250 | |
Hotels, Restaurants & Leisure — 1.0% | | | | | | | | | |
CCM Merger Inc., Notes | | 8.000 | % | 8/1/13 | | 100,000 | | 92,000 | (b) |
Choctaw Resort Development Enterprise, Senior Notes | | 7.250 | % | 11/15/19 | | 226,000 | | 157,070 | (b) |
El Pollo Loco Inc., Senior Notes | | 11.750 | % | 11/15/13 | | 120,000 | | 87,000 | |
El Pollo Loco Inc., Senior Secured Notes | | 11.750 | % | 12/1/12 | | 20,000 | | 20,400 | |
Harrah’s Operating Co. Inc., Senior Secured Notes | | 11.250 | % | 6/1/17 | | 175,000 | | 192,500 | |
Inn of the Mountain Gods Resort & Casino, Senior Notes | | 12.000 | % | 11/15/10 | | 100,000 | | 41,500 | (d)(f) |
Landry’s Restaurants Inc., Senior Secured Notes | | 11.625 | % | 12/1/15 | | 40,000 | | 42,400 | |
| | | | | | | | | | |
See Notes to Financial Statements.
12 | | Western Asset Variable Rate Strategic Fund Inc. 2010 Annual Report | | |
Schedule of investments (cont’d)
September 30, 2010
Western Asset Variable Rate Strategic Fund Inc.
Security | | Rate | | Maturity
Date | | Face
Amount† | | Value | |
Hotels, Restaurants & Leisure — continued | | | | | | | | | |
MGM MIRAGE Inc., Senior Notes | | 7.625 | % | 1/15/17 | | 230,000 | | $ | 194,925 | |
MGM Resorts International, Senior Secured Notes | | 10.375 | % | 5/15/14 | | 20,000 | | 22,350 | |
MGM Resorts International, Senior Secured Notes | | 11.125 | % | 11/15/17 | | 55,000 | | 62,906 | |
Mohegan Tribal Gaming Authority, Senior Subordinated Notes | | 6.875 | % | 2/15/15 | | 200,000 | | 111,250 | |
NCL Corp. Ltd., Senior Secured Notes | | 11.750 | % | 11/15/16 | | 60,000 | | 67,500 | |
Sbarro Inc., Senior Notes | | 10.375 | % | 2/1/15 | | 25,000 | | 15,125 | |
Snoqualmie Entertainment Authority, Senior Secured Notes | | 4.428 | % | 2/1/14 | | 10,000 | | 8,300 | (a)(b) |
Station Casinos Inc., Senior Notes | | 7.750 | % | 8/15/16 | | 155,000 | | 16 | (d)(f) |
Station Casinos Inc., Senior Subordinated Notes | | 6.875 | % | 3/1/16 | | 15,000 | | 24 | (d)(f) |
Total Hotels, Restaurants & Leisure | | | | | | | | 1,115,266 | |
Media — 1.2% | | | | | | | | | |
Cablevision Systems Corp., Senior Notes | | 7.750 | % | 4/15/18 | | 30,000 | | 31,875 | |
Cengage Learning Acquisitions Inc., Senior Notes | | 10.500 | % | 1/15/15 | | 40,000 | | 39,950 | (b) |
Charter Communications Operating LLC/Charter Communications Operating Capital, Senior Secured Notes | | 10.875 | % | 9/15/14 | | 100,000 | | 113,750 | (b) |
CMP Susquehanna Corp. | | 3.531 | % | 5/15/14 | | 2,000 | | 1,420 | (a)(b) |
Comcast Corp., Senior Notes | | 6.500 | % | 1/15/17 | | 200,000 | | 238,233 | |
DISH DBS Corp., Senior Notes | | 6.625 | % | 10/1/14 | | 85,000 | | 89,038 | |
DISH DBS Corp., Senior Notes | | 7.750 | % | 5/31/15 | | 290,000 | | 310,662 | |
DISH DBS Corp., Senior Notes | | 7.875 | % | 9/1/19 | | 65,000 | | 70,281 | |
Sun Media Corp., Senior Notes | | 7.625 | % | 2/15/13 | | 50,000 | | 50,500 | |
Univision Communications Inc., Senior Secured Notes | | 12.000 | % | 7/1/14 | | 170,000 | | 186,788 | (b) |
UPC Holding BV, Senior Notes | | 9.875 | % | 4/15/18 | | 30,000 | | 32,100 | (b) |
Virgin Media Finance PLC, Senior Bonds | | 9.500 | % | 8/15/16 | | 60,000 | | 68,100 | |
Virgin Media Finance PLC, Senior Notes | | 9.125 | % | 8/15/16 | | 140,000 | | 150,500 | |
Total Media | | | | | | | | 1,383,197 | |
Multiline Retail — 0.1% | | | | | | | | | |
Neiman Marcus Group Inc., Senior Notes | | 9.000 | % | 10/15/15 | | 64,494 | | 67,316 | (g) |
Specialty Retail — 0.1% | | | | | | | | | |
Michaels Stores Inc., Senior Notes | | 10.000 | % | 11/1/14 | | 45,000 | | 47,644 | |
Textiles, Apparel & Luxury Goods — 0.1% | | | | | | | | | |
Oxford Industries Inc., Senior Secured Notes | | 11.375 | % | 7/15/15 | | 105,000 | | 118,650 | |
Total Consumer Discretionary | | | | | | | | 3,150,763 | |
Consumer Staples — 0.8% | | | | | | | | | |
Beverages — 0.1% | | | | | | | | | |
Anheuser-Busch InBev Worldwide Inc., Senior Notes | | 4.125 | % | 1/15/15 | | 90,000 | | 96,976 | |
Food & Staples Retailing — 0.4% | | | | | | | | | |
CVS Corp., Pass-through Certificates | | 6.117 | % | 1/10/13 | | 387,010 | | 412,165 | (b)(c) |
Kroger Co., Notes | | 3.900 | % | 10/1/15 | | 60,000 | | 65,192 | |
Total Food & Staples Retailing | | | | | | | | 477,357 | |
Food Products — 0.2% | | | | | | | | | |
Kraft Foods Inc., Senior Notes | | 2.625 | % | 5/8/13 | | 260,000 | | 269,641 | |
Tobacco — 0.1% | | | | | | | | | |
Alliance One International Inc., Senior Notes | | 10.000 | % | 7/15/16 | | 70,000 | | 76,125 | |
Total Consumer Staples | | | | | | | | 920,099 | |
| | | | | | | | | | |
See Notes to Financial Statements.
| | Western Asset Variable Rate Strategic Fund Inc. 2010 Annual Report | | 13 |
Western Asset Variable Rate Strategic Fund Inc.
Security | | Rate | | Maturity
Date | | Face
Amount† | | Value | |
Energy — 5.7% | | | | | | | | | |
Energy Equipment & Services — 0.2% | | | | | | | | | |
Complete Production Services Inc., Senior Notes | | 8.000 | % | 12/15/16 | | 155,000 | | $ | 160,425 | |
Hercules Offshore LLC, Senior Secured Notes | | 10.500 | % | 10/15/17 | | 60,000 | | 50,100 | (b) |
Total Energy Equipment & Services | | | | | | | | 210,525 | |
Oil, Gas & Consumable Fuels — 5.5% | | | | | | | | | |
Anadarko Petroleum Corp., Senior Notes | | 6.375 | % | 9/15/17 | | 40,000 | | 44,141 | |
Belden & Blake Corp., Secured Notes | | 8.750 | % | 7/15/12 | | 170,000 | | 167,450 | |
Berry Petroleum Co., Senior Notes | | 10.250 | % | 6/1/14 | | 60,000 | | 67,950 | |
BP Capital Markets PLC, Senior Notes | | 3.125 | % | 10/1/15 | | 230,000 | | 231,474 | |
Chesapeake Energy Corp., Senior Notes | | 7.250 | % | 12/15/18 | | 285,000 | | 308,512 | |
Compagnie Generale de Geophysique-Veritas, Senior Notes | | 7.500 | % | 5/15/15 | | 210,000 | | 214,725 | |
CONSOL Energy Inc., Senior Notes | | 8.250 | % | 4/1/20 | | 160,000 | | 175,600 | (b) |
El Paso Corp., Medium-Term Notes | | 7.375 | % | 12/15/12 | | 375,000 | | 402,252 | |
Enterprise Products Operating LLP, Junior Subordinated Notes | | 8.375 | % | 8/1/66 | | 80,000 | | 83,596 | (a) |
Enterprise Products Operating LLP, Subordinated Notes | | 7.034 | % | 1/15/68 | | 120,000 | | 119,568 | (a) |
Kinder Morgan Energy Partners LP, Senior Notes | | 6.000 | % | 2/1/17 | | 170,000 | | 192,017 | |
Linn Energy LLC/Linn Energy Finance Corp., Senior Notes | | 8.625 | % | 4/15/20 | | 60,000 | | 63,900 | (b) |
LUKOIL International Finance BV, Bonds | | 6.356 | % | 6/7/17 | | 210,000 | | 220,237 | (b) |
LUKOIL International Finance BV, Senior Notes | | 7.250 | % | 11/5/19 | | 240,000 | | 262,116 | (b) |
OPTI Canada Inc., Senior Secured Notes | | 8.250 | % | 12/15/14 | | 25,000 | | 19,125 | |
Petrobras International Finance Co., Senior Notes | | 5.750 | % | 1/20/20 | | 780,000 | | 867,395 | |
Plains Exploration & Production Co., Senior Notes | | 10.000 | % | 3/1/16 | | 60,000 | | 68,700 | |
Plains Exploration & Production Co., Senior Notes | | 8.625 | % | 10/15/19 | | 40,000 | | 43,900 | |
Range Resources Corp., Senior Subordinated Notes | | 6.750 | % | 8/1/20 | | 550,000 | | 574,750 | |
SandRidge Energy Inc., Senior Notes | | 4.158 | % | 4/1/14 | | 1,000,000 | | 927,010 | (a) |
Shell International Finance BV, Senior Notes | | 3.100 | % | 6/28/15 | | 380,000 | | 400,495 | |
Teekay Corp., Senior Notes | | 8.500 | % | 1/15/20 | | 110,000 | | 120,312 | |
TNK-BP Finance SA, Senior Notes | | 7.875 | % | 3/13/18 | | 200,000 | | 226,500 | (b) |
Williams Cos. Inc., Senior Notes | | 8.750 | % | 3/15/32 | | 370,000 | | 464,907 | |
XTO Energy Inc., Senior Notes | | 5.500 | % | 6/15/18 | | 10,000 | | 11,999 | |
Total Oil, Gas & Consumable Fuels | | | | | | | | 6,278,631 | |
Total Energy | | | | | | | | 6,489,156 | |
Financials — 9.9% | | | | | | | | | |
Capital Markets — 1.3% | | | | | | | | | |
Goldman Sachs Capital III, Preferred Securities | | 1.067 | % | 9/1/12 | | 550,000 | | 381,563 | (a)(h) |
Goldman Sachs Group Inc., Notes | | 5.250 | % | 10/15/13 | | 340,000 | | 369,803 | |
Morgan Stanley, Senior Notes | | 2.876 | % | 5/14/13 | | 310,000 | | 316,157 | (a) |
Morgan Stanley, Senior Notes | | 6.000 | % | 5/13/14 | | 400,000 | | 439,498 | |
Total Capital Markets | | | | | | | | 1,507,021 | |
Commercial Banks — 3.7% | | | | | | | | | |
Bank of Ireland Governor & Co., Senior Notes | | 2.750 | % | 3/2/12 | | 680,000 | | 667,647 | (b) |
Barclays Bank PLC, Senior Notes | | 5.000 | % | 9/22/16 | | 200,000 | | 219,110 | |
Barclays Bank PLC, Subordinated Notes | | 6.050 | % | 12/4/17 | | 100,000 | | 108,607 | (b) |
Credit Agricole SA, Subordinated Notes | | 8.375 | % | 10/13/19 | | 420,000 | | 451,500 | (a)(b)(h) |
| | | | | | | | | | |
See Notes to Financial Statements.
14 | | Western Asset Variable Rate Strategic Fund Inc. 2010 Annual Report | | |
Schedule of investments (cont’d)
September 30, 2010
Western Asset Variable Rate Strategic Fund Inc.
Security | | Rate | | Maturity
Date | | Face
Amount† | | Value | |
Commercial Banks — continued | | | | | | | | | |
FIH Erhvervsbank A/S, Senior Notes | | 2.000 | % | 6/12/13 | | 730,000 | | $ | 747,084 | (b) |
ICICI Bank Ltd., Subordinated Bonds | | 6.375 | % | 4/30/22 | | 130,000 | | 130,843 | (a)(b) |
Intesa Sanpaolo SpA, Senior Notes | | 3.625 | % | 8/12/15 | | 140,000 | | 141,820 | (b) |
Lloyds TSB Bank PLC, Bonds | | 4.375 | % | 1/12/15 | | 330,000 | | 338,287 | (b) |
Rabobank Nederland NV, Junior Subordinated Notes | | 11.000 | % | 6/30/19 | | 260,000 | | 339,001 | (a)(b)(h) |
Royal Bank of Scotland PLC, Senior Notes | | 4.875 | % | 3/16/15 | | 270,000 | | 284,343 | |
Wachovia Capital Trust III, Junior Subordinated Bonds | | 5.800 | % | 3/15/11 | | 300,000 | | 266,250 | (a)(h) |
Wells Fargo & Co., Senior Notes | | 3.750 | % | 10/1/14 | | 450,000 | | 477,278 | |
Total Commercial Banks | | | | | | | | 4,171,770 | |
Consumer Finance — 2.4% | | | | | | | | | |
GMAC Inc., Senior Notes | | 7.250 | % | 3/2/11 | | 15,000 | | 15,337 | |
GMAC Inc., Senior Notes | | 2.497 | % | 12/1/14 | | 1,956,000 | | 1,750,820 | (a) |
GMAC Inc., Senior Notes | | 6.750 | % | 12/1/14 | | 307,000 | | 322,926 | |
SLM Corp. | | 0.798 | % | 1/27/14 | | 700,000 | | 605,141 | (a) |
Total Consumer Finance | | | | | | | | 2,694,224 | |
Diversified Financial Services — 2.5% | | | | | | | | | |
Air 2 US, Notes | | 8.027 | % | 10/1/19 | | 114,961 | | 112,087 | (b) |
Chukchansi Economic Development Authority, Senior Notes | | 4.123 | % | 11/15/12 | | 250,000 | | 145,000 | (a)(b) |
Citigroup Inc., Senior Notes | | 6.375 | % | 8/12/14 | | 850,000 | | 944,717 | |
Citigroup Inc., Senior Notes | | 5.500 | % | 10/15/14 | | 120,000 | | 130,326 | |
General Electric Capital Corp., Subordinated Debentures | | 6.375 | % | 11/15/67 | | 700,000 | | 702,625 | (a) |
International Lease Finance Corp., Senior Notes | | 8.750 | % | 3/15/17 | | 490,000 | | 526,750 | (b) |
TNK-BP Finance SA | | 6.875 | % | 7/18/11 | | 190,000 | | 196,888 | (b) |
Unitymedia GmbH, Senior Secured Bonds | | 8.125 | % | 12/1/17 | | 100,000 | | 104,500 | (b) |
Total Diversified Financial Services | | | | | | | | 2,862,893 | |
Total Financials | | | | | | | | 11,235,908 | |
Health Care — 0.8% | | | | | | | | | |
Health Care Providers & Services — 0.8% | | | | | | | | | |
Community Health Systems Inc., Senior Notes | | 8.875 | % | 7/15/15 | | 60,000 | | 63,900 | |
HCA Inc., Senior Secured Notes | | 9.625 | % | 11/15/16 | | 105,000 | | 114,187 | (g) |
Tenet Healthcare Corp., Senior Secured Notes | | 9.000 | % | 5/1/15 | | 150,000 | | 163,875 | (c) |
Tenet Healthcare Corp., Senior Secured Notes | | 8.875 | % | 7/1/19 | | 276,000 | | 306,015 | (c) |
Universal Hospital Services Inc., Senior Secured Notes | | 8.500 | % | 6/1/15 | | 10,000 | | 10,113 | (g) |
US Oncology Holdings Inc., Senior Notes | | 6.737 | % | 3/15/12 | | 135,387 | | 128,956 | (a)(g) |
Vanguard Health Holdings Co., II LLC, Senior Notes | | 8.000 | % | 2/1/18 | | 80,000 | | 81,600 | |
Total Health Care | | | | | | | | 868,646 | |
Industrials — 1.5% | | | | | | | | | |
Airlines — 0.2% | | | | | | | | | |
DAE Aviation Holdings Inc., Senior Notes | | 11.250 | % | 8/1/15 | | 160,000 | | 162,016 | (b) |
Delta Air Lines Inc., Pass-Through Certificates, Secured Notes | | 8.021 | % | 8/10/22 | | 73,279 | | 73,646 | |
Delta Air Lines Inc., Senior Secured Notes | | 9.500 | % | 9/15/14 | | 27,000 | | 29,430 | (b) |
Total Airlines | | | | | | | | 265,092 | |
| | | | | | | | | | |
See Notes to Financial Statements.
| | Western Asset Variable Rate Strategic Fund Inc. 2010 Annual Report | | 15 |
Western Asset Variable Rate Strategic Fund Inc.
Security | | Rate | | Maturity
Date | | Face
Amount† | | Value | |
Building Products — 0.0% | | | | | | | | | |
Ashton Woods USA LLC/Ashton Woods Finance Co., Senior Subordinated Notes, step bond | | 0.000 | % | 6/30/15 | | 7,800 | | $ | 3,939 | (b)(d) |
Commercial Services & Supplies — 0.3% | | | | | | | | | |
ACCO Brands Corp., Senior Secured Notes | | 10.625 | % | 3/15/15 | | 80,000 | | 89,800 | |
Altegrity Inc., Senior Subordinated Notes | | 10.500 | % | 11/1/15 | | 120,000 | | 119,550 | (b) |
RSC Equipment Rental Inc./RSC Holdings III LLC, Senior Secured Notes | | 10.000 | % | 7/15/17 | | 80,000 | | 89,400 | (b) |
Total Commercial Services & Supplies | | | | | | | | 298,750 | |
Construction & Engineering — 0.4% | | | | | | | | | |
Odebrecht Finance Ltd., Senior Notes | | 7.500 | % | 10/18/17 | | 460,000 | | 503,700 | (b) |
Industrial Conglomerates — 0.1% | | | | | | | | | |
Leucadia National Corp., Senior Notes | | 8.125 | % | 9/15/15 | | 80,000 | | 86,400 | |
Marine — 0.1% | | | | | | | | | |
Trico Shipping AS, Senior Secured Notes | | 13.875 | % | 11/1/14 | | 70,000 | | 62,825 | (b) |
Road & Rail — 0.3% | | | | | | | | | |
Kansas City Southern de Mexico, Senior Notes | | 12.500 | % | 4/1/16 | | 163,000 | | 196,007 | |
RailAmerica Inc., Senior Secured Notes | | 9.250 | % | 7/1/17 | | 88,000 | | 96,910 | |
Total Road & Rail | | | | | | | | 292,917 | |
Trading Companies & Distributors — 0.1% | | | | | | | | | |
Ashtead Capital Inc., Notes | | 9.000 | % | 8/15/16 | | 50,000 | | 52,000 | (b) |
H&E Equipment Services Inc., Senior Notes | | 8.375 | % | 7/15/16 | | 95,000 | | 95,475 | |
Total Trading Companies & Distributors | | | | | | | | 147,475 | |
Total Industrials | | | | | | | | 1,661,098 | |
Information Technology — 0.5% | | | | | | | | | |
IT Services — 0.4% | | | | | | | | | |
Ceridian Corp., Senior Notes | | 12.250 | % | 11/15/15 | | 53,250 | | 50,721 | (g) |
GXS Worldwide Inc., Senior Secured Notes | | 9.750 | % | 6/15/15 | | 430,000 | | 430,537 | |
Total IT Services | | | | | | | | 481,258 | |
Semiconductors & Semiconductor Equipment — 0.1% | | | | | | | | | |
Freescale Semiconductor Inc., Senior Secured Notes | | 9.250 | % | 4/15/18 | | 130,000 | | 135,850 | (b) |
Total Information Technology | | | | | | | | 617,108 | |
Materials — 1.9% | | | | | | | | | |
Metals & Mining — 1.6% | | | | | | | | | |
Freeport-McMoRan Copper & Gold Inc., Senior Notes | | 8.375 | % | 4/1/17 | | 170,000 | | 190,003 | |
Metals USA Inc., Senior Secured Notes | | 11.125 | % | 12/1/15 | | 150,000 | | 159,750 | |
Steel Dynamics Inc., Senior Notes | | 7.375 | % | 11/1/12 | | 95,000 | | 102,006 | |
Steel Dynamics Inc., Senior Notes | | 7.625 | % | 3/15/20 | | 370,000 | | 385,725 | (b) |
Teck Resources Ltd., Senior Secured Notes | | 9.750 | % | 5/15/14 | | 16,000 | | 19,742 | |
Teck Resources Ltd., Senior Secured Notes | | 10.250 | % | 5/15/16 | | 23,000 | | 27,976 | |
Teck Resources Ltd., Senior Secured Notes | | 10.750 | % | 5/15/19 | | 37,000 | | 46,664 | |
Vale Overseas Ltd., Notes | | 6.250 | % | 1/23/17 | | 338,000 | | 387,742 | |
Vedanta Resources PLC, Senior Notes | | 8.750 | % | 1/15/14 | | 390,000 | | 420,712 | (b) |
Vedanta Resources PLC, Senior Notes | | 8.750 | % | 1/15/14 | | 70,000 | | 75,600 | (b) |
Total Metals & Mining | | | | | | | | 1,815,920 | |
| | | | | | | | | | |
See Notes to Financial Statements.
16 | | Western Asset Variable Rate Strategic Fund Inc. 2010 Annual Report | | |
Schedule of investments (cont’d)
September 30, 2010
Western Asset Variable Rate Strategic Fund Inc.
Security | | Rate | | Maturity
Date | | Face
Amount† | | Value | |
Paper & Forest Products — 0.3% | | | | | | | | | |
Appleton Papers Inc., Senior Secured Notes | | 11.250 | % | 12/15/15 | | 199,000 | | $ | 148,255 | (b) |
NewPage Corp., Senior Secured Notes | | 11.375 | % | 12/31/14 | | 205,000 | | 186,550 | |
Total Paper & Forest Products | | | | | | | | 334,805 | |
Total Materials | | | | | | | | 2,150,725 | |
Telecommunication Services — 4.1% | | | | | | | | | |
Diversified Telecommunication Services — 2.4% | | | | | | | | | |
Axtel SAB de CV, Senior Notes | | 7.625 | % | 2/1/17 | | 377,000 | | 345,897 | (b) |
CC Holdings GS V LLC, Senior Secured Notes | | 7.750 | % | 5/1/17 | | 150,000 | | 166,500 | (b) |
Cincinnati Bell Telephone Co., Senior Debentures | | 6.300 | % | 12/1/28 | | 45,000 | | 34,425 | |
Deutsche Telekom International Finance BV, Senior Notes | | 4.875 | % | 7/8/14 | | 300,000 | | 330,130 | |
Deutsche Telekom International Finance BV, Senior Notes | | 5.750 | % | 3/23/16 | | 140,000 | | 161,704 | |
Frontier Communications Corp., Senior Notes | | 8.750 | % | 4/15/22 | | 34,000 | | 37,570 | |
Hawaiian Telcom Communications Inc., Senior Subordinated Notes | | 12.500 | % | 5/1/15 | | 25,000 | | 3 | (d)(f) |
Intelsat Jackson Holdings Ltd., Senior Notes | | 9.500 | % | 6/15/16 | | 40,000 | | 42,850 | |
Intelsat Jackson Holdings Ltd., Senior Notes | | 8.500 | % | 11/1/19 | | 140,000 | | 152,600 | (b) |
Qwest Corp., Senior Notes | | 3.542 | % | 6/15/13 | | 250,000 | | 262,500 | (a) |
Telecom Italia Capital S.p.A., Senior Notes | | 5.250 | % | 10/1/15 | | 320,000 | | 345,704 | |
Telefonica Emisiones SAU, Senior Notes | | 5.855 | % | 2/4/13 | | 370,000 | | 403,967 | |
Verizon Florida Inc., Senior Notes | | 6.125 | % | 1/15/13 | | 200,000 | | 218,072 | |
Windstream Corp., Senior Notes | | 8.625 | % | 8/1/16 | | 190,000 | | 201,875 | |
Total Diversified Telecommunication Services | | | | | | | | 2,703,797 | |
Wireless Telecommunication Services — 1.7% | | | | | | | | | |
Cricket Communications Inc., Senior Secured Notes | | 7.750 | % | 5/15/16 | | 125,000 | | 133,281 | |
New Cingular Wireless Services Inc., Notes | | 8.125 | % | 5/1/12 | | 100,000 | | 111,138 | |
Sprint Capital Corp., Senior Notes | | 6.875 | % | 11/15/28 | | 650,000 | | 598,000 | |
True Move Co., Ltd. | | 10.750 | % | 12/16/13 | | 230,000 | | 245,525 | (b) |
True Move Co., Ltd., Notes | | 10.750 | % | 12/16/13 | | 531,000 | | 566,842 | (b) |
Vodafone Group PLC, Senior Notes | | 5.000 | % | 12/16/13 | | 266,000 | | 292,647 | |
Total Wireless Telecommunication Services | | | | | | | | 1,947,433 | |
Total Telecommunication Services | | | | | | | | 4,651,230 | |
Utilities — 1.0% | | | | | | | | | |
Electric Utilities — 0.4% | | | | | | | | | |
EEB International Ltd., Senior Bonds | | 8.750 | % | 10/31/14 | | 192,000 | | 210,240 | (b) |
FirstEnergy Solutions Corp., Senior Notes | | 4.800 | % | 2/15/15 | | 260,000 | | 279,738 | |
Total Electric Utilities | | | | | | | | 489,978 | |
Independent Power Producers & Energy Traders — 0.6% | | | | | | | | | |
AES Corp., Senior Notes | | 8.875 | % | 2/15/11 | | 15,000 | | 15,450 | |
Edison Mission Energy, Senior Notes | | 7.750 | % | 6/15/16 | | 80,000 | | 63,000 | |
Edison Mission Energy, Senior Notes | | 7.625 | % | 5/15/27 | | 45,000 | | 30,488 | |
Energy Future Holdings Corp., Senior Notes | | 11.250 | % | 11/1/17 | | 192,633 | | 92,945 | (g) |
Energy Future Intermediate Holding Co. LLC/EFIH Finance Inc., Senior Secured Notes | | 10.000 | % | 12/1/20 | | 459,000 | | 457,814 | |
NRG Energy Inc., Senior Notes | | 7.375 | % | 2/1/16 | | 5,000 | | 5,156 | |
Total Independent Power Producers & Energy Traders | | | | | | | | 664,853 | |
Total Utilities | | | | | | | | 1,154,831 | |
Total Corporate Bonds & Notes (Cost — $32,068,950) | | | | | | | | $ | 32,899,564 | |
See Notes to Financial Statements.
| | Western Asset Variable Rate Strategic Fund Inc. 2010 Annual Report | | 17 |
Western Asset Variable Rate Strategic Fund Inc.
Security | | Rate | | Maturity
Date | | Face
Amount† | | Value | |
Mortgage-Backed Securities — 0.6% | | | | | | | | | |
GNMA — 0.6% | | | | | | | | | |
Government National Mortgage Association (GNMA)
(Cost — $680,250) | | 6.500 | % | 8/15/34 | | 600,000 | | $ | 677,837 | |
Sovereign Bonds — 4.2% | | | | | | | | | |
Brazil — 2.6% | | | | | | | | | |
Brazil Nota do Tesouro Nacional, Notes | | 10.000 | % | 1/1/12 | | 4,541,000 | BRL | 2,637,242 | |
Brazil Nota do Tesouro Nacional, Notes | | 10.000 | % | 1/1/14 | | 247,000 | BRL | 138,661 | |
Brazil Nota do Tesouro Nacional, Notes | | 10.000 | % | 1/1/17 | | 256,000 | BRL | 140,038 | |
Total Brazil | | | | | | | | 2,915,941 | |
Mexico — 0.3% | | | | | | | | | |
United Mexican States, Medium-Term Notes | | 6.750 | % | 9/27/34 | | 265,000 | | 330,587 | |
Russia — 0.8% | | | | | | | | | |
Russian Agricultural Bank, Credit-Linked Notes (HSBC Bank PLC) | | 8.900 | % | 12/20/10 | | 14,936,000 | RUB | 470,850 | (a)(b)(c) |
Russian Foreign Bond-Eurobond | | 12.750 | % | 6/24/28 | | 254,000 | | 463,550 | (b) |
Total Russia | | | | | | | | 934,400 | |
Venezuela — 0.5% | | | | | | | | | |
Bolivarian Republic of Venezuela | | 5.750 | % | 2/26/16 | | 912,000 | | 637,306 | (b) |
Total Sovereign Bonds (Cost — $4,746,068) | | | | | | | | 4,818,234 | |
U.S. Government & Agency Obligations — 0.4% | | | | | | | | | |
U.S. Government Obligations — 0.4% | | | | | | | | | |
U.S. Treasury Notes (Cost — $426,910) | | 3.375 | % | 11/15/19 | | 440,000 | | 474,066 | |
| | | | | | | | | |
| | | | | | Shares | | | |
Common Stocks — 0.2% | | | | | | | | | |
Consumer Discretionary — 0.1% | | | | | | | | | |
Media — 0.1% | | | | | | | | | |
Charter Communications Inc., Class A Shares | | | | | | 2,966 | | 96,395 | * |
Dex One Corp. | | | | | | 1,040 | | 12,771 | * |
SuperMedia Inc. | | | | | | 1,864 | | 19,704 | * |
Total Consumer Discretionary | | | | | | | | 128,870 | |
Energy — 0.0% | | | | | | | | | |
Oil, Gas & Consumable Fuels — 0.0% | | | | | | | | | |
SemGroup Corp., Class A Shares | | | | | | 116 | | 2,707 | * |
Industrials — 0.0% | | | | | | | | | |
Building Products — 0.0% | | | | | | | | | |
Ashton Woods USA LLC Class B Membership | | | | | | 2 | | 900 | (c)(d) |
Nortek Inc. | | | | | | 44 | | 1,725 | * |
Total Industrials | | | | | | | | 2,625 | |
Materials — 0.1% | | | | | | | | | |
Chemicals — 0.1% | | | | | | | | | |
Georgia Gulf Corp. | | | | | | 3,741 | | 61,128 | * |
Total Common Stocks (Cost — $742,893) | | | | | | | | 195,330 | |
| | | | | | | | | | |
See Notes to Financial Statements.
18 | | Western Asset Variable Rate Strategic Fund Inc. 2010 Annual Report | | |
Schedule of investments (cont’d)
September 30, 2010
Western Asset Variable Rate Strategic Fund Inc.
Security | | Rate | | | | Shares | | Value | |
Convertible Preferred Stocks — 0.1% | | | | | | | | | |
Financials — 0.1% | | | | | | | | | |
Diversified Financial Services — 0.1% | | | | | | | | | |
Citigroup Inc. (Cost — $60,000) | | 7.500 | % | | | 600 | | $ | 71,106 | |
Preferred Stocks — 0.3% | | | | | | | | | |
Consumer Discretionary — 0.0% | | | | | | | | | |
Automobiles — 0.0% | | | | | | | | | |
Saturns, Series F 2003-5 | | 8.125 | % | | | 575 | | 14,605 | |
Media — 0.0% | | | | | | | | | |
CMP Susquehanna Radio Holdings Corp. | | 0.000 | % | | | 559 | | 0 | *(a)(b)(d) |
Total Consumer Discretionary | | | | | | | | 14,605 | |
Financials — 0.3% | | | | | | | | | |
Diversified Financial Services — 0.3% | | | | | | | | | |
Citigroup Capital XII | | 8.500 | % | | | 11,450 | | 302,395 | (a) |
Total Preferred Stocks (Cost — $310,681) | | | | | | | | 317,000 | |
| | | | | | | | | |
| | | | Expiration
Date | | Warrants | | | |
Warrants — 0.0% | | | | | | | |
Buffets Restaurant Holdings | | 4/28/14 | | 30 | | 0 | *(c)(d) |
Charter Communications Inc. | | 11/30/14 | | 22 | | 141 | * |
CNB Capital Trust | | 3/23/19 | | 639 | | 0 | *(b)(c)(d) |
Nortek Inc. | | 12/7/14 | | 115 | | 1,397 | * |
SemGroup Corp. | | 11/30/14 | | 123 | | 705 | * |
Total Warrants (Cost — $1,530) | | | | | | 2,243 | |
Total Investments Before Short-Term Investments (Cost — $121,790,935) | | | | | | 108,091,848 | |
| | | | | | | | | |
| | | | Maturity
Date | | Face
Amount† | | | |
Short-Term Investments — 5.0% | | | | | | | | | |
U.S. Government Agencies — 0.4% | | | | | | | | | |
Federal National Mortgage Association (FNMA), Discount Notes (Cost — $499,267) | | 0.240 | % | 5/9/11 | | 500,000 | | 499,450 | (i)(j) |
Repurchase Agreements — 4.6% | | | | | | | | | |
Morgan Stanley tri-party repurchase agreement dated 9/30/10; Proceeds at maturity — $5,161,029; (Fully collateralized by U.S. government agency obligations, 0.990% due 10/26/12; Market value — $5,264,876) (Cost — $5,161,000) | | 0.200 | % | 10/1/10 | | 5,161,000 | | 5,161,000 | |
Total Short-Term Investments (Cost — $5,660,267) | | | | | | | | 5,660,450 | |
Total Investments — 100.2% (Cost — $127,451,202#) | | | | | | | | 113,752,298 | |
Liabilities in Excess of Other Assets — (0.2)% | | | | | | | | (217,137 | ) |
Total Net Assets — 100.0% | | | | | | | | $ | 113,535,161 | |
See Notes to Financial Statements.
| | Western Asset Variable Rate Strategic Fund Inc. 2010 Annual Report | | 19 |
Western Asset Variable Rate Strategic Fund Inc.
† | Face amount denominated in U.S. dollars, unless otherwise noted. |
* | Non-income producing security. |
(a) | Variable rate security. Interest rate disclosed is that which is in effect at September 30, 2010. |
(b) | Security is exempt from registration under Rule 144A of the Securities Act of 1933. This security may be resold in transactions that are exempt from registration, normally to qualified institutional buyers. This security has been deemed liquid pursuant to guidelines approved by the Board of Directors, unless otherwise noted. |
(c) | Security is valued in good faith at fair value in accordance with procedures approved by the Board of Directors (See Note 1). |
(d) | Illiquid security. |
(e) | Interest rates disclosed represent the effective rates on collateralized senior loans. Ranges in interest rates are attributable to multiple contracts under the same loan. |
(f) | The coupon payment on these securities is currently in default as of September 30, 2010. |
(g) | Payment-in-kind security for which part of the income earned may be paid as additional principal. |
(h) | Security has no maturity date. The date shown represents the next call date. |
(i) | Rate shown represents yield-to-maturity. |
(j) | All or a portion of this security is held at the broker as collateral for open futures contracts. |
# | Aggregate cost for federal income tax purposes is $127,551,891. |
| |
| Abbreviations used in this schedule: |
| ARM | — Adjustable Rate Mortgage |
| BRL | — Brazilian Real |
| IO | — Interest Only |
| PAC | — Planned Amortization Class |
| RUB | — Russian Ruble |
| STRIPS | — Separate Trading of Registered Interest and Principal Securities |
Schedule of Written Options
Security | | Expiration
Date | | Strike
Price | | Contracts | | Value | |
Eurodollar Futures, Put | | 12/13/10 | | $99.00 | | 17 | | $425 | |
Total Written Options (Premiums received — $9,720) | | | | | | | | $425 | |
See Notes to Financial Statements.
20 | | Western Asset Variable Rate Strategic Fund Inc. 2010 Annual Report |
Statement of assets and liabilities
September 30, 2010
Assets: | | | |
Investments, at value (Cost — $127,451,202) | | $113,752,298 | |
Foreign currency, at value (Cost — $11,928) | | 12,721 | |
Cash | | 1,324 | |
Deposits with brokers for swap contracts | | 4,150,000 | |
Interest receivable | | 958,952 | |
Receivable for securities sold | | 133,199 | |
Unrealized appreciation on swaps | | 95,689 | |
Premiums paid for open swaps | | 83,728 | |
Receivable for open swap contracts | | 64,933 | |
Receivable from broker — variation margin on open futures contracts | | 18,141 | |
Prepaid expenses | | 12,481 | |
Total Assets | | 119,283,466 | |
| | | |
Liabilities: | | | |
Unrealized depreciation on swaps | | 4,841,387 | |
Payable for open swap contracts | | 382,359 | |
Payable for securities purchased | | 229,347 | |
Investment management fee payable | | 69,297 | |
Premiums received for open swaps | | 61,987 | |
Directors’ fees payable | | 17,720 | |
Written options, at value (premium received $9,720) | | 425 | |
Accrued expenses | | 145,783 | |
Total Liabilities | | 5,748,305 | |
Total Net Assets | | $113,535,161 | |
| | | |
Net Assets: | | | |
Par value ($0.001 par value; 6,658,748 shares issued and outstanding; 100,000,000 shares authorized) | | $ 6,659 | |
Paid-in capital in excess of par value | | 131,760,317 | |
Undistributed net investment income | | 584,548 | |
Accumulated net realized loss on investments, futures contracts, written options, swap contracts and foreign currency transactions | | (765,694) | |
Net unrealized depreciation on investments, futures contracts, written options, swap contracts and foreign currencies | | (18,050,669) | |
Total Net Assets | | $113,535,161 | |
| | | |
Shares Outstanding | | 6,658,748 | |
| | | |
Net Asset Value | | $17.05 | |
See Notes to Financial Statements.
Western Asset Variable Rate Strategic Fund Inc. 2010 Annual Report | | 21 |
Statement of operations
For the Year Ended September 30, 2010
Investment Income: | | | |
Interest | | $ | 7,686,285 | |
Dividends | | | 38,686 | |
Total Investment Income | | | 7,724,971 | |
| | | | |
Expenses: | | | | |
Investment management fee (Note 2) | | | 938,284 | |
Legal fees | | | 109,775 | |
Shareholder reports | | | 89,312 | |
Audit and tax | | | 73,434 | |
Directors’ fees | | | 48,363 | |
Transfer agent fees | | | 44,756 | |
Excise tax (Note 1) | | | 17,968 | |
Stock exchange listing fees | | | 16,917 | |
Custody fees | | | 7,491 | |
Insurance | | | 4,025 | |
Miscellaneous expenses | | | 9,749 | |
Total Expenses | | | 1,360,074 | |
Less: Compensating balance arrangements (Note 1) | | | (389) | |
Net Expenses | | | 1,359,685 | |
Net Investment Income | | | 6,365,286 | |
| | | | |
Realized and Unrealized Gain (Loss) on Investments, Futures Contracts, Written Options, Swap Contracts and Foreign Currency Transactions (Notes 1, 3 and 4): | | | | |
Net Realized Gain (Loss) From: | | | | |
Investment transactions | | | (2,847,859) | |
Futures contracts | | | 5,452,551 | |
Written options | | | 119,062 | |
Swap contracts | | | (1,253,394) | |
Foreign currency transactions | | | (95,742) | |
Net Realized Gain | | | 1,374,618 | |
Change in Net Unrealized Appreciation (Depreciation) From: | | | | |
Investments | | | 13,320,138 | |
Futures contracts | | | (755,915) | |
Written options | | | 3,513 | |
Swap contracts | | | (1,495,938) | |
Foreign currencies | | | (22,778) | |
Change in Net Unrealized Appreciation (Depreciation) | | | 11,049,020 | |
Net Gain on Investments, Futures Contracts, Written Options, Swap Contracts and Foreign Currency Transactions | | | 12,423,638 | |
Increase in Net Assets from Operations | | $ | 18,788,924 | |
See Notes to Financial Statements.
22 | | Western Asset Variable Rate Strategic Fund Inc. 2010 Annual Report |
Statements of changes in net assets
For the Years Ended September 30, | | 2010 | | 2009 | |
| | | | | | | |
Operations: | | | | | | | |
Net investment income | | $ | 6,365,286 | | $ | 6,213,711 | |
Net realized gain (loss) | | | 1,374,618 | | | (1,423,464) | |
Change in net unrealized appreciation (depreciation) | | | 11,049,020 | | | 1,808,887 | |
Increase in Net Assets From Operations | | | 18,788,924 | | | 6,599,134 | |
| | | | | | | |
Distributions to Shareholders From (Note 1): | | | | | | | |
Net investment income | | | (5,220,458) | | | (5,670,756) | |
Net realized gains | | | — | | | (421,998) | |
Decrease in Net Assets From Distributions to Shareholders | | | (5,220,458) | | | (6,092,754) | |
| | | | | | | |
Fund Share Transactions: | | | | | | | |
Cost of shares repurchased (1,664,686 and 0 shares repurchased, respectively) (Note 6) | | | (26,418,567) | | | — | |
Decrease in Net Assets From Fund Share Transactions | | | (26,418,567) | | | — | |
Increase (Decrease) in Net Assets | | | (12,850,101) | | | 506,380 | |
| | | | | | | |
Net Assets: | | | | | | | |
Beginning of year | | | 126,385,262 | | | 125,878,882 | |
End of year* | | $113,535,161 | | $ | 126,385,262 | |
* Includes undistributed net investment income of: | | $584,548 | | $586,518 | |
See Notes to Financial Statements.
Western Asset Variable Rate Strategic Fund Inc. 2010 Annual Report | | 23 |
Financial highlights
For a share of capital stock outstanding throughout each year ended September 30:
| | 20101 | | 20091 | | 20081 | | 20071 | | 20061 | |
| | | | | | | | | | | |
Net asset value, beginning of year | | $15.18 | | $15.12 | | $18.85 | | $19.68 | | $19.47 | |
| | | | | | | | | | | |
Income (loss) from operations: | | | | | | | | | | | |
Net investment income | | 0.82 | | 0.75 | | 0.96 | | 1.07 | | 1.04 | |
Net realized and unrealized gain (loss) | | 1.66 | | 0.04 | | (3.57) | | (0.45) | | 0.36 | |
Total income (loss) from operations | | 2.48 | | 0.79 | | (2.61) | | 0.62 | | 1.40 | |
| | | | | | | | | | | |
Less distributions from: | | | | | | | | | | | |
Net investment income | | (0.67) | | (0.68) | | (0.96) | | (1.31) | | (1.07) | |
Net realized gains | | — | | (0.05) | | (0.16) | | (0.14) | | (0.12) | |
Total distributions | | (0.67) | | (0.73) | | (1.12) | | (1.45) | | (1.19) | |
Increase in net asset value due to shares repurchased in tender offer | | 0.06 | | — | | — | | — | | — | |
| | | | | | | | | | | |
Net asset value, end of year | | $17.05 | | $15.18 | | $15.12 | | $18.85 | | $19.68 | |
| | | | | | | | | | | |
Market price, end of year | | $15.86 | | $13.78 | | $12.00 | | $16.91 | | $17.36 | |
Total return, based on NAV2,3 | | 17.08 | % | 5.91 | % | (14.40) | %4 | 3.21 | % | 7.45 | % |
Total return, based on Market Price3 | | 20.40 | % | 22.20 | % | (23.67) | %4 | 5.75 | % | 8.46 | % |
| | | | | | | | | | | |
Net assets, end of year (000s) | | $113,535 | | $126,385 | | $125,879 | | $156,865 | | $163,784 | |
| | | | | | | | | | | |
Ratios to average net assets: | | | | | | | | | | | |
Gross expenses | | 1.09 | % | 1.16 | % | 1.06 | % | 0.97 | %5 | 2.35 | % |
Gross expenses, excluding interest expense | | 1.09 | | 1.16 | | 0.99 | | 0.97 | 5 | 1.16 | |
Net expenses6 | | 1.09 | | 1.16 | | 1.06 | | 0.97 | 5,7 | 2.34 | 7 |
Net expenses, excluding interest expense6 | | 1.09 | | 1.16 | | 0.99 | | 0.97 | 5,7 | 1.16 | 7 |
Net investment income | | 5.09 | | 5.41 | | 5.59 | | 5.53 | | 5.35 | |
| | | | | | | | | | | |
Portfolio turnover rate | | 43 | % | 68 | %8 | 77 | %8 | 160 | %8 | 27 | % |
1 | Per share amounts have been calculated using the average shares method. |
2 | Performance figures may reflect compensating balance arrangements, fee waivers and/or expense reimbursements. In the absence of compensating balance arrangements, fee waivers and/or expense reimbursements, the total return would have been lower. Past performance is no guarantee of future results. |
3 | The total return calculation assumes that distributions are reinvested in accordance with the Fund’s dividend reinvestment plan. Past performance is no guarantee of future results. |
4 | The investment manager fully reimbursed the Fund for losses incurred resulting from an investment transaction error. Without this reimbursement, the total return would not have changed. |
5 | Included in the expense ratios are certain non-recurring restructuring (and reorganization, if applicable) fees that were incurred by the Fund during the period. Without these fees, the gross and net expense ratios would both have been 0.97%. |
6 | The impact of compensating balance arrangements, if any, was less than 0.01%. |
7 | Reflects fee waivers and/or expense reimbursements. |
8 | Excluding mortgage dollar roll transactions. If mortgage dollar roll transactions had been included, the portfolio turnover rate would have been 146%, 205% and 197% for the years ended September 30, 2009, 2008 and 2007, respectively. |
See Notes to Financial Statements.
24 | | Western Asset Variable Rate Strategic Fund Inc. 2010 Annual Report |
Notes to financial statements
1. Organization and significant accounting policies
Western Asset Variable Rate Strategic Fund Inc. (the “Fund”) was incorporated in Maryland on August 3, 2004 and is registered as a non-diversified, closed-end management investment company under the Investment Company Act of 1940, as amended (the “1940 Act”). The Board of Directors authorized 100 million shares of $0.001 par value common stock. The Fund’s primary investment objective is to maintain a high level of current income.
The following are significant accounting policies consistently followed by the Fund and are in conformity with U.S. generally accepted accounting principles (“GAAP”). Estimates and assumptions are required to be made regarding assets, liabilities and changes in net assets resulting from operations when financial statements are prepared. Changes in the economic environment, financial markets and any other parameters used in determining these estimates could cause actual results to differ. Subsequent events have been evaluated through the date the financial statements were issued.
(a) Investment valuation. Debt securities are valued at the mean between the last quoted bid and asked prices provided by an independent pricing service, which are based on transactions in debt obligations, quotations from bond dealers, market transactions in comparable securities and various other relationships between securities. Publicly traded foreign government debt securities are typically traded internationally in the over-the-counter market, and are valued at the mean between the last quoted bid and asked prices as of the close of business of that market. Futures contracts are valued daily at the settlement price established by the board of trade or exchange on which they are traded. Equity securities for which market quotations are available are valued at the last reported sales price or official closing price on the primary market or exchange on which they trade. When prices are not readily available, or are determined not to reflect fair value, such as when the value of a security has been significantly affected by events after the close of the exchange or market on which the security is principally traded, but before the Fund calculates its net asset value, the Fund values these securities at fair value as determined in accordance with procedures approved by the Fund’s Board of Directors. Short-term obligations with maturities of 60 days or less are valued at amortized cost, which approximates fair value.
The Fund has adopted Financial Accounting Standards Board Codification Topic 820 (“ASC Topic 820”). ASC Topic 820 establishes a single definition of fair value, creates a three-tier hierarchy as a framework for measuring fair value based on inputs used to value the Fund’s investments, and requires additional disclosure about fair value. The hierarchy of inputs is summarized below.
· Level 1 — quoted prices in active markets for identical investments
· Level 2 — other significant observable inputs (including quoted prices for similar investments, interest rates, prepayment speeds, credit risk, etc.)
· Level 3 — significant unobservable inputs (including the Fund’s own assumptions in determining the fair value of investments)
The inputs or methodology used for valuing securities are not necessarily an indication of the risk associated with investing in those securities.
The Fund uses valuation techniques to measure fair value that are consistent with the market approach and/or income approach, depending on the type of security and the particular circumstance. The market approach uses prices and other relevant information generated by market transactions involving identical or comparable securities. The income approach uses valuation techniques to discount estimated future cash flows to present value.
Western Asset Variable Rate Strategic Fund Inc. 2010 Annual Report | | 25 |
The following is a summary of the inputs used in valuing the Fund’s assets and liabilities carried at fair value:
Description | | Quoted Prices
(Level 1) | | Other Significant
Observable Inputs
(Level 2) | | Significant
Unobservable
Inputs
(Level 3) | | Total | |
Long-term investments†: | | | | | | | | | | | | | |
Collateralized mortgage obligations | | | — | | $ | 34,066,403 | | $ | 710,918 | | $ | 34,777,321 | |
Asset-backed securities | | | — | | | 23,843,361 | | | 494,995 | | | 24,338,356 | |
Collateralized senior loans | | | — | | | 9,520,791 | | | — | | | 9,520,791 | |
Corporate bonds & notes | | | — | | | 32,487,399 | | | 412,165 | | | 32,899,564 | |
Mortgage-backed securities | | | — | | | 677,837 | | | — | | | 677,837 | |
Sovereign bonds | | | — | | | 4,818,234 | | | — | | | 4,818,234 | |
U.S. government & agency obligations | | | — | | | 474,066 | | | — | | | 474,066 | |
Common stocks: | | | | | | | | | | | | | |
Industrials | | $ | 1,725 | | | — | | | 900 | | | 2,625 | |
Other common stocks | | | 192,705 | | | — | | | — | | | 192,705 | |
Convertible preferred stocks | | | 71,106 | | | — | | | — | | | 71,106 | |
Preferred stocks | | | 317,000 | | | 0 | * | | — | | | 317,000 | |
Warrants | | | 141 | | | 2,102 | | | 0 | * | | 2,243 | |
Total long-term investments | | $ | 582,677 | | $ | 105,890,193 | | $ | 1,618,978 | | $ | 108,091,848 | |
Short-term investments† | | | — | | | 5,660,450 | | | — | | | 5,660,450 | |
Total investments | | $ | 582,677 | | $ | 111,550,643 | | $ | 1,618,978 | | $ | 113,752,298 | |
Other financial instruments: | | | | | | | | | | | | | |
Written options | | $ | (425 | ) | | — | | | — | | $ | (425 | ) |
Futures contracts | | | 381,838 | | | — | | | — | | | 381,838 | |
Interest rate swaps‡ | | | — | | | (4,761,984 | ) | | — | | | (4,761,984 | ) |
Credit default swaps on credit indices — sell protection‡ | | | — | | | 21,728 | | | — | | | 21,728 | |
Credit default swaps on corporate issues — buy protection‡ | | | — | | | 16,299 | | | — | | | 16,299 | |
Total other financial instruments | | $ | 381,413 | | $ | (4,723,957 | ) | | — | | $ | (4,342,544 | ) |
Total | | $ | 964,090 | | $ | 106,826,686 | | $ | 1,618,978 | | $ | 109,409,754 | |
† | See Schedule of Investments for additional detailed categorizations. |
‡ | Values include any premiums paid or received with respect to swap contracts. |
* | Value is less than $1. |
The following is a reconciliation of investments in which significant unobservable inputs (Level 3) were used in determining fair value:
Investments In Securities | | Collateralized
Mortgage
Obligations | | Asset-
Backed
Securities | | Corporate
Bonds &
Notes | | Common
Stocks | | Preferred
Stocks | | Warrants | | Total | |
Balance as of September 30, 2009 | | — | | — | | $ 3,775 | | — | | $ 237 | | $ 18 | | $ 4,030 | |
Accrued premiums/discounts | | — | | — | | 816 | | — | | — | | — | | 816 | |
Realized gain (loss) | | — | | — | | — | | — | | — | | — | | — | |
Change in unrealized appreciation (depreciation)1 | | — | | $ 39,730 | | 768 | | $900 | | (237 | ) | (18 | ) | 41,143 | |
Net purchases (sales) | | $450,458 | | 455,265 | | — | | — | | — | | — | | 905,723 | |
Transfers into Level 3 | | 260,460 | | — | | 412,165 | | — | | — | | — | | 672,625 | |
Transfers out of Level 3 | | — | | — | | (5,359 | ) | — | | 0 | * | — | | (5,359 | ) |
Balance as of September 30, 2010 | | $710,918 | | $494,995 | | $412,165 | | $900 | | — | | $ 0 | * | $1,618,978 | |
Net change in unrealized appreciation (depreciation) for investments in securities still held at September 30, 20101 | | — | | $ 39,730 | | — | | $900 | | — | | $ 0 | * | $ 40,630 | |
* | Value is less than $1. |
1 | This amount is included in the change in net unrealized appreciation (depreciation) in the accompanying Statement of Operations. Change in unrealized appreciation (depreciation) includes net unrealized appreciation (depreciation) resulting from changes in investment values during the reporting period and the reversal of previously recorded unrealized appreciation (depreciation) when gains or losses are realized. |
26 | | Western Asset Variable Rate Strategic Fund Inc. 2010 Annual Report |
Notes to financial statements (cont’d)
(b) Repurchase agreements. The Fund may enter into repurchase agreements with institutions that its investment adviser has determined are creditworthy. Each repurchase agreement is recorded at cost. Under the terms of a typical repurchase agreement, the Fund acquires a debt security subject to an obligation of the seller to repurchase, and of the Fund to resell, the security at an agreed-upon price and time, thereby determining the yield during the Fund’s holding period. When entering into repurchase agreements, it is the Fund’s policy that its custodian or a third party custodian, acting on the Fund’s behalf, take possession of the underlying collateral securities, the market value of which, at all times, at least equals the principal amount of the repurchase transaction, including accrued interest. To the extent that any repurchase transaction maturity exceeds one business day, the value of the collateral is marked-to-market and measured against the value of the agreement in an effort to ensure the adequacy of the collateral. If the counterparty defaults, the Fund generally has the right to use the collateral to satisfy the terms of the repurchase transaction. However, if the market value of the collateral declines during the period in which the Fund seeks to assert its rights or if bankruptcy proceedings are commenced with respect to the seller of the security, realization of the collateral by the Fund may be delayed or limited.
(c) Futures contracts. The Fund may use futures contracts to gain exposure to, or hedge against, changes in the value of equities, interest rates or foreign currencies. A futures contract represents a commitment for the future purchase or sale of an asset at a specified price on a specified date.
Upon entering into a futures contract, the Fund is required to deposit cash or cash equivalents with a broker in an amount equal to a certain percentage of the contract amount. This is known as the “initial margin” and subsequent payments (“variation margin”) are made or received by the Fund each day, depending on the daily fluctuation in the value of the contract. For certain futures, including foreign denominated futures, variation margin is not settled daily, but is recorded as a net variation margin payable or receivable. Futures contracts are valued daily at the settlement price established by the board of trade or exchange on which they are traded. The daily changes in contract value are recorded as unrealized gains or losses in the Statement of Operations and the Fund recognizes a realized gain or loss when the contract is closed.
Futures contracts involve, to varying degrees, risk of loss in excess of the amounts reflected in the financial statements. In addition, there is the risk that the Fund may not be able to enter into a closing transaction because of an illiquid secondary market.
(d) Forward foreign currency contracts. The Fund may enter into a forward foreign currency contract to hedge against foreign currency exchange rate risk on its non-U.S. dollar denominated securities or to facilitate settlement of a foreign currency denominated portfolio transaction. A forward foreign currency contract is an agreement between two parties to buy and sell a currency at a set price with delivery and settlement at a future date. The contract is marked-to-market daily and the change in value is recorded by the Fund as an unrealized gain or loss. When a forward foreign currency contract is closed, through either delivery or offset by entering into another forward foreign currency contract, the Fund recognizes a realized gain or loss equal to the difference between the value of the contract at the time it was opened and the value of the contract at the time it is closed.
Forward foreign currency contracts involve elements of market risk in excess of the amounts reflected on the Statement of Assets and Liabilities. The Fund bears the risk of an unfavorable change in the foreign exchange rate underlying the forward foreign currency contract. Risks may also arise upon entering into these contracts from the potential inability of the counterparties to meet the terms of their contracts.
(e) Written options. When the Fund writes an option, an amount equal to the premium received by the Fund is recorded as a liability, the value of which is marked-to-market daily to reflect the current market value of the option written. If the option expires, the premium received is recorded as a realized gain. When a written call option is exercised, the difference between the premium received plus the option exercise price and the Fund’s basis in the underlying security (in the case of a covered written call option), or the cost to purchase the underlying security (in the case of an uncovered written call option), including brokerage commission, is recognized as a realized gain or loss. When a
Western Asset Variable Rate Strategic Fund Inc. 2010 Annual Report | | 27 |
written put option is exercised, the amount of the premium received is subtracted from the cost of the security purchased by the Fund from the exercise of the written put option to form the Fund’s basis in the underlying security purchased. The writer or buyer of an option traded on an exchange can liquidate the position before the exercise of the option by entering into a closing transaction. The cost of a closing transaction is deducted from the original premium received resulting in a realized gain or loss to the Fund.
The risk in writing a covered call option is that the Fund may forego the opportunity of profit if the market price of the underlying security increases and the option is exercised. The risk in writing a put option is that the Fund may incur a loss if the market price of the underlying security decreases and the option is exercised. The risk in writing a call option is that the Fund is exposed to the risk of loss if the market price of the underlying security increases. In addition, there is the risk that the Fund may not be able to enter into a closing transaction because of an illiquid secondary market.
(f) Swap agreements. The Fund may invest in swaps for the purpose of managing its exposure to interest rate, credit or market risk, or for other purposes. The use of swaps involves risks that are different from those associated with ordinary portfolio transactions.
Swap contracts are marked-to-market daily and changes in value are recorded as unrealized appreciation (depreciation). Gains or losses are realized upon termination of the swap agreement. Periodic payments and premiums received or made by the Fund are recognized in the Statement of Operations as realized gains or losses, respectively. Collateral, in the form of restricted cash or securities, may be required to be held in segregated accounts with the Fund’s custodian in compliance with the terms of the swap contracts. Securities posted as collateral for swap contracts are identified in the Schedule of Investments and restricted cash, if any, is identified on the Statement of Assets and Liabilities. Risks may exceed amounts recorded in the Statement of Assets and Liabilities. These risks include changes in the returns of the underlying instruments, failure of the counterparties to perform under the contracts’ terms, and the possible lack of liquidity with respect to the swap agreements.
Payments received or made at the beginning of the measurement period are reflected as a premium or deposit, respectively, on the Statement of Assets and Liabilities. These upfront payments are amortized over the life of the swap and are recognized as realized gain or loss in the Statement of Operations. A liquidation payment received or made at the termination of the swap is recognized as a realized gain or loss in the Statement of Operations. Net periodic payments received or paid by the Fund are recognized as a realized gain or loss in the Statement of Operations.
As disclosed in the Fair Values of Derivatives — Statement of Assets and Liabilities table that follows the Fund’s summary of open swap contracts, the aggregate fair value of all swaps in a net liability position as of September 30, 2010 was $4,762,030. The aggregate fair value of assets posted as collateral, net of assets received as collateral, for all swaps was $4,150,000. If a defined credit event had occurred as of September 30, 2010, the swaps’ credit-risk-related contingent features would have been triggered and the Fund would have been required to pay up to $2,697,000 less the value of the contracts’ related reference obligations.
Credit default swaps
The Fund may enter into credit default swap (“CDS”) contracts for investment purposes, to manage its credit risk or to add leverage. CDS agreements involve one party making a stream of payments to another party in exchange for the right to receive a specified return in the event of a default by a third party, typically corporate or sovereign issuers, on a specified obligation, or in the event of a write-down, principal shortfall, interest shortfall or default of all or part of the referenced entities comprising a credit index. The Fund may use a CDS to provide protection against defaults of the issuers (i.e., to reduce risk where the Fund has exposure to an issuer) or to take an active long or short position with respect to the likelihood of a particular issuer’s default. As a seller of protection, the Fund generally receives an upfront payment or a stream of payments throughout the term of the swap provided that there is no credit event. If the Fund is a seller of protection and a credit event occurs, as defined under the terms of that particular swap agreement, the maximum potential
28 | | Western Asset Variable Rate Strategic Fund Inc. 2010 Annual Report |
Notes to financial statements (cont’d)
amount of future payments (undiscounted) that the Fund could be required to make under a credit default swap agreement would be an amount equal to the notional amount of the agreement. These amounts of potential payments will be partially offset by any recovery of values from the respective referenced obligations. As a seller of protection, the Fund effectively adds leverage to its portfolio because, in addition to its total net assets, the Fund is subject to investment exposure on the notional amount of the swap. As a buyer of protection, the Fund generally receives an amount up to the notional value of the swap if a credit event occurs.
Implied spreads are the theoretical prices a lender receives for credit default protection. When spreads rise, market perceived credit risk rises and when spreads fall, market perceived credit risk falls. The implied credit spread of a particular referenced entity reflects the cost of buying/selling protection and may include upfront payments required to enter into the agreement. Wider credit spreads and decreasing market values, when compared to the notional amount of the swap, represent a deterioration of the referenced entity’s credit soundness and a greater likelihood or risk of default or other credit event occurring as defined under the terms of the agreement. Credit spreads utilized in determining the period end market value of credit default swap agreements on corporate or sovereign issues are disclosed in the Notes to Financial Statements and serve as an indicator of the current status of the payment/performance risk and represent the likelihood or risk of default for credit derivatives. For credit default swap agreements on asset-backed securities and credit indices, the quoted market prices and resulting values, particularly in relation to the notional amount of the contract as well as the annual payment rate, serve as an indication of the current status of the payment/performance risk.
The Fund’s maximum risk of loss from counterparty risk, as the protection buyer, is the fair value of the contract (this risk is mitigated by the posting of collateral by the counterparty to the Fund to cover the Fund’s exposure to the counterparty). As the protection seller, the Fund’s maximum risk is the notional amount of the contract. Credit default swaps are considered to have credit risk-related contingent features since they require payment by the protection seller to the protection buyer upon the occurrence of a defined credit event.
Entering into a CDS agreement involves, to varying degrees, elements of credit, market and documentation risk in excess of the related amounts recognized on the Statement of Assets and Liabilities. Such risks involve the possibility that there will be no liquid market for these agreements, that the counterparty to the agreement may default on its obligation to perform or disagree as to the meaning of the contractual terms in the agreement, and that there will be unfavorable changes in net interest rates.
Interest rate swaps
The Fund may enter into interest rate swap contracts. Interest rate swaps are agreements between two parties to exchange cash flows based on a notional principal amount. The Fund may elect to pay a fixed rate and receive a floating rate, or, receive a fixed rate and pay a floating rate on a notional principal amount. Interest rate swaps are marked-to-market daily based upon quotations from market makers and the change, if any, is recorded as an unrealized gain or loss in the Statement of Operations. When a swap contract is terminated early, the Fund records a realized gain or loss equal to the difference between the original cost and the settlement amount of the closing transaction.
The risks of interest rate swaps include changes in market conditions that will affect the value of the contract or changes in the present value of the future cash flow streams and the possible inability of the counterparty to fulfill its obligations under the agreement. The Fund’s maximum risk of loss from counterparty credit risk is the discounted net value of the cash flows to be received from the counterparty over the contract’s remaining life, to the extent that that amount is positive. This risk is mitigated by the posting of collateral by the counterparty to the Fund to cover the Fund’s exposure to the counterparty.
Western Asset Variable Rate Strategic Fund Inc. 2010 Annual Report | | 29 |
(g) Stripped securities. The Fund may invest in “Stripped Securities,” a term used collectively for components, or strips, of fixed income securities. Stripped securities can be principal only securities (“PO”), which are debt obligations that have been stripped of unmatured interest coupons or, interest only securities (“IO”), which are unmatured interest coupons that have been stripped from debt obligations. The market value of Stripped Securities will fluctuate in response to changes in economic conditions, rates of pre-payment, interest rates and the market’s perception of the securities. However, fluctuations in response to interest rates may be greater in Stripped Securities than for debt obligations of comparable maturities that pay interest currently. The amount of fluctuation may increase with a longer period of maturity.
The yield to maturity on IO’s is sensitive to the rate of principal repayments (including prepayments) on the related underlying debt obligation and principal payments may have a material effect on yield to maturity. If the underlying debt obligation experiences greater than anticipated prepayments of principal, the Fund may not fully recoup its initial investment in IO’s.
(h) Mortgage dollar rolls. The Fund may enter into mortgage dollar rolls in which the Fund sells mortgage-backed securities for delivery in the current month, realizing a gain or loss, and simultaneously contracts to repurchase substantially similar (same type, coupon and maturity) securities to settle on a specified future date.
The Fund executes its mortgage dollar rolls entirely in the to-be-announced (“TBA”) market, whereby the Fund makes a forward commitment to purchase a security and, instead of accepting delivery, the position is offset by a sale of the security with a simultaneous agreement to repurchase at a future date. The Fund accounts for mortgage dollar rolls as purchases and sales.
The risk of entering into mortgage dollar rolls is that the market value of the securities the Fund is obligated to repurchase under the agreement may decline below the repurchase price. In the event the buyer of securities under a mortgage dollar roll files for bankruptcy or becomes insolvent, the Fund’s use of the proceeds of the mortgage dollar roll may be restricted pending a determination by the counterparty, or its trustee or receiver, whether to enforce the Fund’s obligation to repurchase the securities.
(i) Securities traded on a to-be-announced basis. The Fund may trade securities on a TBA basis. In a TBA transaction, the Fund commits to purchasing or selling securities which have not yet been issued by the issuer and for which specific information, such as the face amount, maturity date and underlying pool of investments in U.S. government agency mortgage pass-through securities, is not announced. Securities purchased on a TBA basis are not settled until they are delivered to the Fund. Beginning on the date the Fund enters into a TBA transaction, cash, U.S. government securities or other liquid high-grade debt obligations are segregated in an amount equal in value to the purchase price of the TBA security. These securities are subject to market fluctuations and their current value is determined in the same manner as for other securities.
(j) Foreign currency translation. Investment securities and other assets and liabilities denominated in foreign currencies are translated into U.S. dollar amounts based upon prevailing exchange rates on the date of valuation. Purchases and sales of investment securities and income and expense items denominated in foreign currencies are translated into U.S. dollar amounts based upon prevailing exchange rates on the respective dates of such transactions.
The Fund does not isolate that portion of the results of operations resulting from fluctuations in foreign exchange rates on investments from the fluctuations arising from changes in market prices of securities held. Such fluctuations are included with the net realized and unrealized gain or loss on investments.
Net realized foreign exchange gains or losses arise from sales of foreign currencies, including gains and losses on forward foreign currency contracts, currency gains or losses realized between the trade and settlement dates on securities transactions, and the difference between the amounts of
30 | | Western Asset Variable Rate Strategic Fund Inc. 2010 Annual Report |
Notes to financial statements (cont’d)
dividends, interest, and foreign withholding taxes recorded on the Fund’s books and the U.S. dollar equivalent of the amounts actually received or paid. Net unrealized foreign exchange gains and losses arise from changes in the values of assets and liabilities, other than investments in securities, on the date of valuation, resulting from changes in exchange rates.
Foreign security and currency transactions may involve certain considerations and risks not typically associated with those of U.S. dollar denominated transactions as a result of, among other factors, the possibility of lower levels of governmental supervision and regulation of foreign securities markets and the possibility of political or economic instability.
(k) Inflation-indexed bonds. Inflation-indexed bonds are fixed-income securities whose principal value or interest rate is periodically adjusted according to the rate of inflation. As the index measuring inflation changes, the principal value or interest rate of inflation-indexed bonds will be adjusted accordingly. Inflation adjustments to the principal amount of inflation-indexed bonds are reflected as an increase or decrease to investment income on the Statement of Operations. Repayment of the original bond principal upon maturity (as adjusted for inflation) is guaranteed in the case of U.S. Treasury inflation-indexed bonds. For bonds that do not provide a similar guarantee, the adjusted principal value of the bond repaid at maturity may be less than the original principal.
(l) Loan participations. The Fund may invest in loans arranged through private negotiation between one or more financial institutions. The Fund’s investment in any such loan may be in the form of a participation in or an assignment of the loan. In connection with purchasing participations, the Fund generally will have no right to enforce compliance by the borrower with the terms of the loan agreement related to the loan, or any rights of off-set against the borrower and the Fund may not benefit directly from any collateral supporting the loan in which it has purchased the participation.
The Fund assumes the credit risk of the borrower, the lender that is selling the participation and any other persons interpositioned between the Fund and the borrower. In the event of the insolvency of the lender selling the participation, the Fund may be treated as a general creditor of the lender and may not benefit from any off-set between the lender and the borrower.
(m) Credit and market risk. The Fund invests in high-yield and emerging market instruments that are subject to certain credit and market risks. The yields of high-yield and emerging market debt obligations reflect, among other things, perceived credit and market risks. The Fund’s investment in securities rated below investment grade typically involve risks not associated with higher rated securities including, among others, greater risk related to timely and ultimate payment of interest and principal, greater market price volatility and less liquid secondary market trading. The consequences of political, social, economic or diplomatic changes may have disruptive effects on the market prices of investments held by the Fund. The Fund’s investment in non-U.S. dollar denominated securities may also result in foreign currency losses caused by devaluations and exchange rate fluctuations.
Investments in securities that are collateralized by residential real estate mortgages are subject to certain credit and liquidity risks. When market conditions result in an increase in default rates of the underlying mortgages and foreclosure values of underlying real estate properties are materially below the outstanding amount of these underlying mortgages, collection of the full amount of accrued interest and principal on these investments may be doubtful. Such market conditions may significantly impair the value and liquidity of these investments and may result in a lack of correlation between their credit ratings and values.
(n) Other risks. Consistent with its objective to seek high current income, the Fund may invest in instruments whose values and interest rates are linked to foreign currencies, interest rates, indices or some other financial indicator. The value at maturity or interest rates for these instruments will increase or decrease according to the change in the indicator to which they are indexed, amongst other factors. These securities are generally more volatile in nature, and the risk of loss of principal may be greater.
Western Asset Variable Rate Strategic Fund Inc. 2010 Annual Report | | 31 |
(o) Security transactions and investment income. Security transactions are accounted for on a trade date basis. Interest income, adjusted for amortization of premium and accretion of discount, is recorded on the accrual basis. Dividend income is recorded on the ex-dividend date. The cost of investments sold is determined by use of the specific identification method. To the extent any issuer defaults or a credit event occurs that impacts the issuer, the Fund may halt any additional interest income accruals and consider the realizability of interest accrued up to the date of default or credit event.
(p) Distributions to shareholders. Distributions from net investment income for the Fund, if any, are declared and paid on a monthly basis. Distributions of net realized gains, if any, are declared at least annually. Distributions are recorded on the ex-dividend date and are determined in accordance with income tax regulations, which may differ from GAAP.
(q) Compensating balance arrangements. The Fund has an arrangement with its custodian bank whereby a portion of the custodian’s fees is paid indirectly by credits earned on the Fund’s cash on deposit with the bank. The amount is shown as a reduction of expenses in the Statement of Operations.
(r) Federal and other taxes. It is the Fund’s policy to comply with the federal income and excise tax requirements of the Internal Revenue Code of 1986 (the “Code”), as amended, applicable to regulated investment companies. Accordingly, the Fund intends to distribute its taxable income and net realized gains, if any, to shareholders in accordance with these requirements imposed by the Code. Therefore, no federal or state income tax provision is required in the Fund’s financial statements.
However, due to the timing of when distributions are made, the Fund may be subject to an excise tax of 4% of the amount by which 98% of the Fund’s annual taxable income exceeds the distributions from such taxable income for the year. The Fund paid $17,968 of federal excise taxes attributable to calendar year 2009 in March 2010. The Fund anticipates being subject to an excise tax of approximately $25,000 for calendar year 2010.
Management has analyzed the Fund’s tax positions taken on income tax returns for all open tax years and has concluded that as of September 30, 2010, no provision for income tax is required in the Fund’s financial statements. The Fund’s federal and state income and federal excise tax returns for tax years for which the applicable statutes of limitations have not expired are subject to examination by Internal Revenue Service and state departments of revenue.
(s) Reclassification. GAAP requires that certain components of net assets be reclassified to reflect permanent differences between financial and tax reporting. These reclassifications have no effect on net assets or net asset values per share. During the current year, the following reclassifications have been made:
| | Undistributed Net
Investment Income | | Accumulated Net
Realized Loss | | Paid-in Capital | |
(a) | | $ 17,968 | | — | | $(17,968 | ) |
(b) | | (1,164,766 | ) | $1,164,766 | | — | |
| | | | | | | | | | |
(a) | Reclassifications are primarily due to a non-deductible excise tax paid by the Fund. |
(b) | Reclassifications are primarily due to foreign currency transactions treated as ordinary income for tax purposes, differences between book and tax amortization of premium on fixed income securities, losses from mortgage backed securities treated as capital losses for tax purposes, and book/tax differences in the treatment of swap contracts. |
2. Investment management agreement and other transactions with affiliates
Legg Mason Partners Fund Advisor, LLC (“LMPFA”) is the Fund’s investment manager. Western Asset Management Company (“Western Asset”), Western Asset Management Company Limited (“Western Asset Limited”) and Western Asset Management Company Pte. Ltd. (“Western Singapore”) are the Fund’s subadvisers. LMPFA, Western Asset, Western Asset Limited and Western Singapore are wholly-owned subsidiaries of Legg Mason, Inc. (“Legg Mason”).
32 | | Western Asset Variable Rate Strategic Fund Inc. 2010 Annual Report |
Notes to financial statements (cont’d)
LMPFA provides administrative and certain oversight services to the Fund. The Fund pays LMPFA an investment management fee, calculated daily and paid monthly, at an annual rate of 0.75% of the Fund’s average daily net assets plus the proceeds of any outstanding borrowings.
LMPFA delegates to Western Asset the day-to-day portfolio management of the Fund. Western Asset Limited and Western Singapore provide certain advisory services to the Fund relating to currency transactions and investment in non-U.S. dollar-denominated debt securities. Western Asset Limited and Western Singapore do not receive any compensation from the Fund. For its services, LMPFA pays Western Asset 70% of the net management fee it receives from the Fund. In turn, Western Asset pays Western Asset Limited and Western Singapore a subadvisory fee of 0.30% on assets managed by Western Asset Limited and Western Singapore, respectively.
All officers and one Director of the Fund are employees of Legg Mason or its affiliates and do not receive compensation from the Fund.
3. Investments
During the year ended September 30, 2010, the aggregate cost of purchases and proceeds from sales of investments (excluding short-term investments) and U.S Government & Agency Obligations were as follows:
| | Investments | | U.S. Government & Agency Obligations | |
Purchases | | $48,932,267 | | $ 1,206,278 | |
Sales | | 65,387,927 | | 12,155,959 | |
At September 30, 2010, the aggregate gross unrealized appreciation and depreciation of investments for federal income tax purposes were as follows:
Gross unrealized appreciation | | | | $ 6,530,070 | |
Gross unrealized depreciation | | | | (20,329,663) | |
Net unrealized depreciation | | | | $(13,799,593) | |
At September 30, 2010, the Fund had the following open futures contracts:
| | Number of
Contracts | | Expiration
Date | | Basis
Value | | Market
Value | | Unrealized
Gain (Loss) | |
Contracts to Buy: | | | | | | | | | | | |
U.S. Treasury 5-Year Notes | | 487 | | 12/10 | | $ | 58,453,411 | | $ | 58,862,321 | | $408,910 | |
| | | | | | | | | | | |
Contracts to Sell: | | | | | | | | | | | |
U.S. Treasury 2-Year Notes | | 75 | | 12/10 | | 16,434,256 | | $ | 16,461,328 | | $ (27,072 | ) |
Net unrealized gain on open futures contracts | | | | | | | | | | $381,838 | |
| | | | | | | | | | | | | |
During the year ended September 30, 2010, written option transactions for the Fund were as follows:
| | Number of Contracts | | Premiums | |
Written options, outstanding September 30, 2009 | | 123 | | $ | 59,800 | |
Options written | | 152 | | 68,981 | |
Options closed | | — | | — | |
Options expired | | (258) | | (119,061 | ) |
Written options, outstanding September 30, 2010 | | 17 | | $ | 9,720 | |
Western Asset Variable Rate Strategic Fund Inc. 2010 Annual Report | | 33 |
At September 30, 2010, the Fund held the following open swap contracts:
Swap Counterparty | | Notional
Amount | | Termination
Date | | Payments
Made
by the
Fund‡ | | Payments
Received
by the
Fund‡ | | Upfront
Premiums
Paid
(Received) | | Unrealized
Appreciation
(Depreciation) | |
Barclay’s Capital Inc. | | $ | 5,520,000 | | 3/18/19 | | 4.250% | | 3-Month LIBOR | | $79,403 | | $ 907,795) | |
JPMorgan Chase Bank | | 10,000,000 | | 1/7/15 | | 4.665% | | 6-Month LIBOR | | — | | (1,416,783) | |
JPMorgan Chase Bank | | 18,000,000 | | 12/7/14 | | 4.655% | | 6-Month LIBOR | | — | | (2,516,809) | |
Total | | $ | 33,520,000 | | | | | | | | $79,403 | | $(4,841,387) | |
As of September 30, 2010, the three- and six-month London Interbank Offered Rates were 0.29% and 0.46%, respectively.
CREDIT DEFAULT SWAPS ON CREDIT INDICES—SELL PROTECTION1
Swap Counterparty
(Reference Entity) | | Notional
Amount2 | | Termination
Date | | Periodic
Payments
Received
by the
Fund‡ | | Market
Value3 | | Upfront
Premiums
Paid
(Received) | | Unrealized
Appreciation
(Depreciation) | |
JPMorgan Chase Bank
(CDX North America High Yield Index) | | $2,697,000 | | 6/20/12 | | 2.750% | | $21,728 | | $(60,324) | | $82,052 | |
CREDIT DEFAULT SWAPS ON CORPORATE ISSUES—BUY PROTECTION4
Swap Counterparty
(Reference Entity) | | Notional
Amount2 | | Termination
Date | | Periodic
Payments
Made
by the
Fund‡ | | Market
Value | | Upfront
Premiums
Paid
(Received) | | Unrealized
Appreciation
(Depreciation) | |
Goldman Sachs Group Inc. (Assured Guaranty Municipal Corp., 0.480%, due 11/15/13) | | $ 90,000 | | 3/20/11 | | 5.000%
quarterly | | $ (37) | | $(1,013) | | $ 976 | |
Goldman Sachs Group Inc. (Assured Guaranty Municipal Corp., 0.480% due 11/15/13) | | 90,000 | | 3/20/15 | | 5.000%
quarterly | | 4,660 | | 785 | | 3,875 | |
Goldman Sachs Group Inc. (Assured Guaranty Municipal Corp., 0.480% due 11/15/13) | | 120,000 | | 3/20/20 | | 5.000%
quarterly | | 8,581 | | 2,994 | | 5,587 | |
Goldman Sachs Group Inc. (Assured Guaranty Municipal Corp., 0.480%, due 11/15/13) | | 60,000 | | 3/20/13 | | 5.000%
quarterly | | 1,160 | | (409) | | 1,569 | |
Goldman Sachs Group Inc. (Assured Guaranty Municipal Corp., 0.480%, due 11/15/13) | | 20,000 | | 3/20/11 | | 5.000%
quarterly | | (9) | | (200) | | 191 | |
Goldman Sachs Group Inc. (Assured Guaranty Municipal Corp., 0.480%, due 11/15/13) | | 10,000 | | 3/20/13 | | 5.000%
quarterly | | 193 | | (41) | | 234 | |
Goldman Sachs Group Inc. (Assured Guaranty Municipal Corp., 0.480%, due 11/15/13) | | 20,000 | | 3/20/15 | | 5.000%
quarterly | | 1,036 | | 244 | | 792 | |
Goldman Sachs Group Inc. (Assured Guaranty Municipal Corp., 0.480%, due 11/15/13) | | 10,000 | | 3/20/20 | | 5.000%
quarterly | | 715 | | 302 | | 413 | |
Total | | $420,000 | | | | | | $16,299 | | $ 2,662 | | $13,637 | |
34 | | Western Asset Variable Rate Strategic Fund Inc. 2010 Annual Report |
Notes to financial statements (cont’d)
1 | If the Fund is a seller of protection and a credit event occurs, as defined under the terms of that particular swap agreement, the Fund will either (i) pay to the buyer of protection an amount equal to the notional amount of the swap and take delivery of the referenced obligation or underlying securities comprising the referenced index or (ii) pay a net settlement amount in the form of cash or securities equal to the notional amount of the swap less the recovery value of the referenced obligation or underlying securities comprising the referenced index. |
2 | The maximum potential amount the Fund could be required to pay as a seller of credit protection or receive as a buyer of credit protection if a credit event occurs as defined under the terms of that particular swap agreement. |
3 | The quoted market prices and resulting values for credit default swap agreements on asset-backed securities and credit indices serve as an indicator of the current status of the payment/performance risk and represent the likelihood of an expected liability (or profit) for the credit derivative should the notional amount of the swap agreement been closed/sold as of the period end. Decreasing market values when compared to the notional amount of the swap, represent a deterioration of the referenced entity’s credit soundness and a greater likelihood or risk of default or other credit event occurring as defined under the terms of the agreement. |
4 | If the Fund is a buyer of protection and a credit event occurs, as defined under the terms of that particular swap agreement, the Fund will either (i) receive from the seller of protection an amount equal to the notional amount of the swap and deliver the underlying securities comprising the referenced index or (ii) receive a net settlement amount in the form of cash or securities equal to the notional amount of the swap less the recovery value of the underlying securities comprising the referenced index. |
‡ | Percentage shown is an annual percentage rate. |
4. Derivative instruments and hedging activities
Financial Accounting Standards Board Codification Topic 815 requires enhanced disclosure about an entity’s derivative and hedging activities.
Below is a table, grouped by derivative type that provides information about the fair value and the location of derivatives within the Statement of Assets and Liabilities at September 30, 2010.
| | Interest Rate
Contracts Risk | | Credit
Contracts Risk | | Total | |
Futures contracts2 | | $408,910 | | — | | $408,910 | |
Swap contracts3 | | — | | $38,073 | | 38,073 | |
Total | | $408,910 | | $38,073 | | $446,983 | |
| | Interest Rate
Contracts Risk | | Credit
Contracts Risk | | Total | |
Written options | | $ 425 | | — | | $ 425 | |
Futures contracts2 | | 27,072 | | — | | 27,072 | |
Swap contracts3 | | 4,761,984 | | $46 | | 4,762,030 | |
Total | | $4,789,481 | | $46 | | $4,789,527 | |
1 | Generally, the balance sheet location for asset derivatives is receivables/net unrealized appreciation (depreciation) and for liability derivatives is payables/net unrealized appreciation (depreciation). |
2 | Includes cumulative appreciation (depreciation) of futures contracts as reported in the footnotes. Only variation margin is reported within the receivables and/or payables of the Statement of Assets and Liabilities. |
3 | Values include premiums paid (received) on swap contracts which are shown separately in the Statement of Assets and Liabilities. |
The following tables provide information about the effect of derivatives and hedging activities on the Fund’s Statement of Operations for the year ended September 30, 2010. The first table provides additional detail about the amounts and sources of gains (losses) realized on derivatives during the period. The second table provides additional information about the changes in unrealized appreciation (depreciation) resulting from the Fund’s derivatives and hedging activities during the period.
AMOUNT OF REALIZED GAIN (LOSS) ON DERIVATIVES RECOGNIZED
| | Interest Rate
Contracts Risk | | Foreign Exchange
Contracts Risk | | Credit
Contracts Risk | | Total | |
Written options | | $ 119,062 | | — | | — | | $ 119,062 | |
Futures contracts | | 5,452,551 | | — | | — | | 5,452,551 | |
Swap contracts | | (1,331,762) | | — | | $78,368 | | (1,253,394) | |
Forward foreign currency contracts | | — | | $(817) | | — | | (817) | |
Total | | $4,239,851 | | $(817) | | $78,368 | | $ 4,317,402 | |
Western Asset Variable Rate Strategic Fund Inc. 2010 Annual Report | | 35 |
CHANGE IN UNREALIZED APPRECIATION (DEPRECIATION) ON DERIVATIVES RECOGNIZED
| | Interest Rate
Contracts Risk | | Foreign Exchange
Contracts Risk | | Credit
Contracts Risk | | Total | |
Written options | | $ 3,513 | | — | | — | | $ 3,513 | |
Futures contracts | | (755,915) | | — | | — | | (755,915) | |
Swap contracts | | (1,679,665) | | — | | $183,727 | | (1,495,938) | |
Forward foreign currency contracts | | — | | $(21,410) | | — | | (21,410) | |
Total | | $(2,432,067) | | $(21,410) | | $183,727 | | $(2,269,750) | |
During the year ended September 30, 2010, the volume of derivative activity for the Fund was as follows:
| | Average
Market Value | |
Written options | | $ 19,528 | |
Forward foreign currency contracts (to buy)† | | 840,212 | |
Forward foreign currency contracts (to sell)† | | 275,865 | |
Futures contracts (to buy) | | 95,304,981 | |
Futures contracts (to sell) | | 14,815,293 | |
| | | |
| | Average
Notional Balance | |
Interest rate swap contracts | | $33,520,000 | |
Credit default swap contracts (to buy protection) | | 258,462 | |
Credit default swap contracts (to sell protection) | | 2,697,000 | |
† At September 30, 2010, there were no open positions held in this derivative.
The Fund has several credit related contingent features that if triggered would allow its derivatives counterparties to close out and demand payment or additional collateral to cover their exposure from the Fund. Credit related contingent features are established between the Fund and its derivatives counterparties to reduce the risk that the Fund will not fulfill its payment obligations to its counterparties. These triggering features include, but are not limited to, a percentage decrease in the Fund’s net assets and/or a percentage decrease in the Fund’s Net Asset Value or NAV. The contingent features are established within the Fund’s International Swap and Derivatives Association, Inc. master agreements which govern positions in swaps, over-the-counter options, and forward currency exchange contracts for each individual counterparty.
As of September 30, 2010, there were no swap positions with credit related contingent features in a net liability position. The Fund posted collateral for its swap transactions in the amount of $4,150,000.
5. Distributions subsequent to September 30, 2010
On October 12, 2010, the Fund’s Board of Directors declared a distribution in the amount of $0.056 per share, payable on October 29, 2010 to shareholders of record on October 22, 2010 and on November 10, 2010, the Fund’s Board of Directors declared a distribution in the amount of $0.056 per share payable on November 26, 2010 to shareholders of record on November 19, 2010. In addition, on November 15, 2010, the Fund’s Board of Directors declared a distribution in the amount of $0.056 per share payable on December 30, 2010, January 28, 2011 and February 25, 2011 to shareholders of record on December 23, 2010, January 21, 2011 and February 18, 2011, respectively.
6. Tender offer
During the year ended September 30, 2010, the Fund, in accordance with its tender offer for up to 1,664,686 of its issued and outstanding shares of common stock, accepted and made payment of these shares at $15.87 per share (98% of the net asset value per share of $16.19 on May 24, 2010). These shares represent approximately 20% of the Fund’s then outstanding shares.
36 | | Western Asset Variable Rate Strategic Fund Inc. 2010 Annual Report |
Notes to financial statements (cont’d)
7. Income tax information and distributions to shareholders
The tax character of distributions paid during the fiscal years ended September 30, were as follows:
| | 2010 | | 2009 | |
Distributions Paid From: | | | | | |
Ordinary income | | $5,220,458 | | $5,913,342 | |
Net long-term capital gains | | — | | 179,412 | |
Total distributions paid | | $5,220,458 | | $6,092,754 | |
As of September 30, 2010, the components of accumulated earnings on a tax basis were as follows:
Undistributed ordinary income — net | | $ 1,031,976 | |
Other book/tax temporary differences(a) | | (1,112,433 | ) |
Unrealized appreciation (depreciation)(b) | | (18,151,358 | ) |
Total accumulated earnings (losses) — net | | $(18,231,815 | ) |
(a) | Other book/tax temporary differences are attributable primarily to the tax deferral of losses on straddles, the realization for tax purposes of unrealized gains on certain futures contracts, the deferral of post-October capital losses for tax purposes, differences between book/tax accrual of interest income on securities in default and book/tax differences in the timing of the deductibility of various expenses. |
(b) | The difference between book-basis and tax-basis unrealized appreciation (depreciation) is attributable primarily to the tax deferral of losses on wash sales and the difference between book and tax amortization methods for premiums on fixed income securities. |
| | Western Asset Variable Rate Strategic Fund Inc. 2010 Annual Report | | 37 |
Report of independent registered public accounting firm
The Board of Directors and Shareholders
Western Asset Variable Rate Strategic Fund Inc.:
We have audited the accompanying statement of assets and liabilities of Western Asset Variable Rate Strategic Fund Inc., including the schedule of investments, as of September 30, 2010, and the related statement of operations for the year then ended, the statements of changes in net assets for each of the years in the two-year period then ended, and the financial highlights for each of the years in the five-year period then ended. These financial statements and financial highlights are the responsibility of the Fund’s management. Our responsibility is to express an opinion on these financial statements and financial highlights based on our audits.
We conducted our audits in accordance with the standards of the Public Company Accounting Oversight Board (United States). Those standards require that we plan and perform the audit to obtain reasonable assurance about whether the financial statements and financial highlights are free of material misstatement. An audit includes examining, on a test basis, evidence supporting the amounts and disclosures in the financial statements. Our procedures included confirmation of securities owned as of September 30, 2010, by correspondence with the custodian and brokers or by other appropriate auditing procedures. An audit also includes assessing the accounting principles used and significant estimates made by management, as well as evaluating the overall financial statement presentation. We believe that our audits provide a reasonable basis for our opinion.
In our opinion, the financial statements and financial highlights referred to above present fairly, in all material respects, the financial position of Western Asset Variable Rate Strategic Fund Inc. as of September 30, 2010, the results of its operations for the year then ended, the changes in its net assets for each of the years in the two-year period then ended, and the financial highlights for each of the years in the five-year period then ended, in conformity with U.S. generally accepted accounting principles.
New York, New York
November 19, 2010
38 | | Western Asset Variable Rate Strategic Fund Inc. | | |
Additional information (unaudited)
Information about Directors and Officers
The business and affairs of Western Asset Variable Rate Strategic Fund Inc. (the “Fund”) are conducted by management under the supervision and subject to the direction of its Board of Directors. The business address of each Director is c/o R. Jay Gerken, 620 Eighth Avenue, New York, New York 10018. Information pertaining to the Directors and officers of the Fund is set forth below.
Independent Directors†:
Carol L. Colman | | |
Year of birth | | 1946 |
Position(s) held with Fund1 | | Director and Member of the Nominating and Audit Committees, Class III |
Term of office1 and length of time served | | Since 2004 |
Principal occupation(s) during past five years | | President, Colman Consulting Company (consulting) |
Number of portfolios in fund complex overseen by Director (including the Fund) | | 24 |
Other board memberships held by Director | | None |
| | |
Daniel P. Cronin | | |
Year of birth | | 1946 |
Position(s) held with Fund1 | | Director and Member of the Nominating and Audit Committees, Class III |
Term of office1 and length of time served | | Since 2004 |
Principal occupation(s) during past five years | | Retired; formerly, Associate General Counsel, Pfizer Inc. (prior to and including 2004) |
Number of portfolios in fund complex overseen by Director (including the Fund) | | 24 |
Other board memberships held by Director | | None |
| | |
Paolo M. Cucchi | | |
Year of birth | | 1941 |
Position(s) held with Fund1 | | Director and Member of the Nominating and Audit Committees, Class I |
Term of office1 and length of time served | | Since 2007 |
Principal occupation(s) during past five years | | Professor of French and Italian at Drew University; formerly, Vice President and Dean of College of Liberal Arts at Drew University (1984 to 2009) |
Number of portfolios in fund complex overseen by Director (including the Fund) | | 24 |
Other board memberships held by Director | | None |
| | Western Asset Variable Rate Strategic Fund Inc. | | 39 |
Independent Directors cont’d
Leslie H. Gelb | | |
Year of birth | | 1937 |
Position(s) held with Fund1 | | Director and Member of the Nominating and Audit Committees, Class II |
Term of office1 and length of time served | | Since 2004 |
Principal occupation(s) during past five years | | President Emeritus and Senior Board Fellow (since 2003), The Council on Foreign Relations; formerly, President, (prior to 2003), the Council on Foreign Relations; formerly, Columnist, Deputy Editorial Page Editor and Editor, Op-Ed Page, The New York Times |
Number of portfolios in fund complex overseen by Director (including the Fund) | | 24 |
Other board memberships held by Director | | Director of two registered investment companies advised by Blackstone Asia Advisors LLC: India Fund, Inc. and Asia Tigers Fund, Inc. (since 1994) |
| | |
William R. Hutchinson | | |
Year of birth | | 1942 |
Position(s) held with Fund1 | | Director and Member of the Nominating and Audit Committees, Class II |
Term of office1 and length of time served | | Since 2004 |
Principal occupation(s) during past five years | | President, W.R. Hutchinson & Associates Inc. (Consulting) (since 2001) |
Number of portfolios in fund complex overseen by Director (including the Fund) | | 24 |
Other board memberships held by Director | | Director (Non-Executive Chairman of the Board (since December 1, 2009)), Associated Banc Corp. (banking) (since 1994) |
| | |
Riordan Roett | | |
Year of birth | | 1938 |
Position(s) held with Fund1 | | Director and Member of the Nominating and Audit Committees, Class I |
Term of office1 and length of time served | | Since 2004 |
Principal occupation(s) during past five years | | The Sarita and Don Johnston Professor of Political Science and Director of Western Hemisphere Studies, Paul H. Nitze School of Advanced International Studies, The John Hopkins University (since 1973) |
Number of portfolios in fund complex overseen by Director (including the Fund) | | 24 |
Other board memberships held by Director | | None |
40 | | Western Asset Variable Rate Strategic Fund Inc. | | |
Additional information (unaudited) (cont’d)
Information about Directors and Officers
Independent Directors cont’d
Jeswald W. Salacuse | | |
Year of birth | | 1938 |
Position(s) held with Fund1 | | Director and Member of the Nominating and Audit Committees, Class I |
Term of office1 and length of time served | | Since 2004 |
Principal occupation(s) during past five years | | Henry J. Braker Professor of Commercial Law, The Fletcher School of Law and Diplomacy, Tufts University (since 1986); President and Member, Arbitration Tribunal, World Bank/ICSID (since 2004) |
Number of portfolios in fund complex overseen by Director (including the Fund) | | 24 |
Other board memberships held by Director | | Director of two registered investment companies advised by Blackstone Asia Advisors LLC; India Fund, Inc. and Asia Tigers Fund, Inc. (since 1993) |
Interested Director and Officer:
R. Jay Gerken, CFA2 | | |
Year of birth | | 1951 |
Position(s) held with Fund1 | | Director, Chairman, President and Chief Executive Officer, Class II |
Term of office1 and length of time served | | Since 2004 |
Principal occupation(s) during past five years | | Managing Director of Legg Mason & Co., LLC (“Legg Mason & Co.”) (since 2005); Officer and Trustee/Director of 149 funds associated with Legg Mason Partners Fund Advisor, LLC (“LMPFA”) or its affiliates (since 2006) and Legg Mason & Co. predecessors (prior to 2006); President and Chief Executive Officer (“CEO”) of LMPFA (since 2006); President and CEO of Smith Barney Fund Management LLC (“SBFM”) and Citi Fund Management Inc. (“CFM”) (formerly registered investment advisers) (since 2002); formerly, Chairman, President and CEO, Travelers Investment Adviser Inc. (prior to 2005) |
Number of portfolios in fund complex overseen by Director (including the Fund) | | 136 |
Other board memberships held by Director | | Former Trustee, Consulting Group Capital Markets Funds (11 funds) (prior to 2006) |
Additional Officers:
Ted P. Becker | | |
Legg Mason | | |
620 Eighth Avenue, New York, NY 10018 | | |
Year of birth | | 1951 |
Position(s) held with Fund1 | | Chief Compliance Officer |
Term of office1 and length of time served | | Since 2006 |
Principal occupation(s) during past five years | | Director of Global Compliance at Legg Mason (since 2006); Chief Compliance Officer of LMPFA (since 2006); Managing Director of Compliance of Legg Mason & Co. (since 2005); Chief Compliance Officer of certain mutual funds associated with Legg Mason & Co. or its affiliates (since 2006) and Legg Mason & Co. predecessors (prior to 2006) |
| | Western Asset Variable Rate Strategic Fund Inc. | | 41 |
Additional Officers cont’d
John Chiota | | |
Legg Mason | | |
100 First Stamford Place, Stamford, CT 06902 | | |
Year of birth | | 1968 |
Position(s) with Fund1 | | Identity Theft Prevention Officer |
Term of office1 and length of time served | | Since 2008 |
Principal occupation(s) during past five years | | Identity Theft Prevention Officer of certain mutual funds associated with Legg Mason & Co. or its affiliates (since 2008); Chief Anti-Money Laundering Compliance Officer of certain mutual funds associated with Legg Mason & Co. or its affiliates (since 2006); Vice President of Legg Mason & Co. (since 2006) and Legg Mason & Co. predecessors (prior to 2006); formerly, Chief Anti-Money Laundering Compliance Officer of TD Waterhouse (prior to 2004) |
| | |
Robert I. Frenkel | | |
Legg Mason | | |
100 First Stamford Place, Stamford, CT 06902 | | |
Year of birth | | 1954 |
Position(s) held with Fund1 | | Secretary and Chief Legal Officer |
Term of office1 and length of time served | | Since 2003 |
Principal occupation(s) during past five years | | Vice President and Deputy General Counsel of Legg Mason (since 2006); Managing Director and General Counsel of Global Mutual Funds for Legg Mason & Co. (since 2006) and Legg Mason & Co. predecessors (since 1994); Secretary and Chief Legal Officer of certain mutual funds associated with Legg Mason & Co. or its affiliates (since 2006) and Legg Mason & Co. predecessors (prior to 2006) |
| | |
Thomas C. Mandia | | |
Legg Mason | | |
100 First Stamford Place, Stamford, CT 06902 | | |
Year of birth | | 1962 |
Position(s) held with Fund1 | | Assistant Secretary |
Term of office1 and length of time served | | Since 2006 |
Principal occupation(s) during past five years | | Managing Director and Deputy General Counsel of Legg Mason & Co. (since 2005) and Legg Mason & Co. predecessors (prior to 2005); Secretary of LMPFA (since 2006); Assistant Secretary of certain mutual funds associated with Legg Mason & Co. or its affiliates (since 2006) and Legg Mason & Co. predecessors (prior to 2006); Secretary of SBFM and CFM (since 2002) |
| | |
Kaprel Ozsolak | | |
Legg Mason | | |
55 Water Street, New York, NY 10041 | | |
Year of birth | | 1965 |
Position(s) held with Fund1 | | Chief Financial Officer |
Term of office1 and length of time served | | Since 2007 |
Principal occupation(s) during past five years | | Director of Legg Mason & Co. (since 2005); Chief Financial Officer of certain mutual funds associated with Legg Mason & Co. or its affiliates (since 2007) and Legg Mason & Co. predecessors (prior to 2007); formerly, Treasurer of certain mutual funds associated with Legg Mason & Co. or its affiliates (prior to 2010) and Legg Mason & Co. predecessors (prior to 2005); formerly, Controller of certain mutual funds associated with Legg Mason & Co. predecessors (prior to 2004) |
42 | | Western Asset Variable Rate Strategic Fund Inc. | | |
Additional information (unaudited) (cont’d)
Information about Directors and Officers
Additional Officers cont’d
Steven Frank | | |
Legg Mason | | |
55 Water Street, New York, NY 10041 | | |
Year of birth | | 1967 |
Position(s) held with Fund1 | | Treasurer |
Term of office1 and length of time served | | Since 2010 |
Principal occupation(s) during past five years | | Vice President of Legg Mason & Co. and Legg Mason & Co. predecessors (since 2002); Treasurer of certain mutual funds associated with Legg Mason & Co. or its affiliates (since 2010); formerly, Controller of certain mutual funds associated with Legg Mason & Co. or its affiliates (prior to 2010); formerly, Assistant Controller of certain mutual funds associated with Legg Mason & Co. predecessors (prior to 2005) |
| | |
Jeanne M. Kelly | | |
Legg Mason | | |
620 Eighth Avenue, New York, NY 10018 | | |
Year of birth | | 1951 |
Position(s) with Fund1 | | Senior Vice President |
Term of office1 and length of time served | | Since 2007 |
Principal occupation(s) during past five years | | Senior Vice President of certain mutual funds associated with Legg Mason & Co. or its affiliates (since 2007); Senior Vice President of LMPFA (since 2006); Managing Director of Legg Mason & Co. (since 2005) and Legg Mason & Co. predecessors (prior to 2005) |
† Directors who are not “interested persons” of the Fund within the meaning of Section 2(a)(19) of the 1940 Act.
1 The Fund’s Board of Directors is divided into three classes: Class I, Class II and Class III. The terms of office of the Class I, II and III Directors expire at the Annual Meetings of Stockholders in the year 2013, year 2011 and year 2012, respectively, or thereafter in each case when their respective successors are duly elected and qualified. The Fund’s executive officers are chosen each year at the first meeting of the Fund’s Board of Directors following the Annual Meeting of Stockholders, to hold office until the meeting of the Board following the next Annual Meeting of Stockholders and until their successors are duly elected and qualified.
2 Mr. Gerken is an “interested person” of the Fund as defined in the 1940 Act because Mr. Gerken is an officer of LMPFA and certain of its affiliates.
| | Western Asset Variable Rate Strategic Fund Inc. | | 43 |
Annual chief executive officer and chief financial officer certifications (unaudited)
The Fund’s Chief Executive Officer (“CEO”) has submitted to the NYSE the required annual certification and the Fund also has included the certifications of the Fund’s CEO and Chief Financial Officer required by Section 302 of the Sarbanes-Oxley Act in the Fund’s Form N-CSR filed with the SEC for the period of this report.
44 | | Western Asset Variable Rate Strategic Fund Inc. | | |
Important tax information (unaudited)
The following information is provided with respect to the distributions paid during the taxable year ended September 30, 2010:
Record date: | | 10/23/2009 | | 11/20/2009 | | 12/18/2009 | | Monthly |
Payable date: | | 10/30/2009 | | 11/27/2009 | | 12/28/2009 | | January 2010 –
September 2010 |
Ordinary income: | | | | | | | | |
Qualified dividend income for individuals | | 4.28% | | 3.42% | | 0.80% | | 0.15% |
Dividends qualifying for the dividends received deductions for corporations | | 4.28% | | 3.42% | | 0.80% | | 0.15% |
Interest from federal obligations | | 0.89% | | 0.89% | | 0.89% | | 0.25% |
The law varies in each state as to whether and what percentage of dividend income attributable to Federal obligations is exempt from state income tax. We recommend that you consult with your tax adviser to determine if any portion of the dividends you received is exempt from state income taxes.
Please retain this information for your records.
| | Western Asset Variable Rate Strategic Fund Inc. | | 45 |
Dividend reinvestment plan (unaudited)
Unless you elect to receive distributions in cash (i.e., opt-out), all distributions, on your common shares (the “Common Shares”) will be automatically reinvested by American Stock Transfer & Trust Company (“AST”), as agent for the holders of Common Shares (the “Common Shareholders”) (the “Plan Agent”), in additional Common Shares under the Dividend Reinvestment Plan (the “Plan”). You may elect not to participate in the Plan by contacting the Plan Agent. If you do not participate, you will receive all cash distributions paid by check mailed directly to you by AST, as dividend paying agent.
If you participate in the Plan, the number of Common Shares you will receive will be determined as follows:
1. If the market price of the Common Shares on the record date (or, if the record date is not a New York Stock Exchange (the “Exchange”) trading day, the immediately preceding trading day) for determining shareholders eligible to receive the relevant dividend or distribution (the “determination date”) is equal to or exceeds 98% of the net asset value per share of the Common Shares, the Fund will issue new Common Shares at a price equal to the greater of (a) 98% of the net asset value per share at the close of trading on the Exchange on the determination date or (b) 95% of the market price per share of the Common Shares on the determination date.
2. If 98% of the net asset value per share of the Common Shares exceeds the market price of the Common Shares on the determination date, the Plan Agent will receive the distribution in cash and will buy Common Shares in the open market, on the Exchange or elsewhere, for your account as soon as practicable commencing on the trading day following the determination date and terminating no later than the earlier of (a) 30 days after the distribution payment date, or (b) the record date for the next succeeding distribution to be made to the Common Shareholders; except when necessary to comply with applicable provisions of the federal securities laws. If during this period: (i) the market price rises so that it equals or exceeds 98% of the net asset value per share of the Common Shares at the close of trading on the Exchange on the determination date before the Plan Agent has completed the open market purchases or (ii) if the Plan Agent is unable to invest the full amount eligible to be reinvested in open market purchases, the Plan Agent will cease purchasing Common Shares in the open market and the Fund shall issue the remaining Common Shares at a price per share equal to the greater of (a) 98% of the net asset value per share at the close of trading on the Exchange on the determination date or (b) 95% of the then current market price per share.
The Plan Agent maintains all participants’ accounts in the Plan and gives written confirmation of all transactions in the accounts, including information you may need for tax records. Common Shares in your account will be held by the Plan Agent in noncertificated form. Any proxy you receive will include all Common Shares you have received under the Plan.
You may withdraw from the Plan by notifying the Plan Agent in writing at 59 Maiden Lane, New York, New York 10038 or by calling the Plan Agent at 1-888-888-0151. Such withdrawal will be effective immediately if notice is received by the Plan Agent not less than ten business days prior to any distribution record date; otherwise such withdrawal will be effective as soon as practicable after the Plan Agent’s investment of the most recently declared distribution on the Common Shares. The Plan may be terminated by the Fund upon notice in writing mailed to Common Shareholders at least 30 days prior to the record date for the payment of any distribution by the Fund for which the termination is to be effective. Upon any termination, you will be sent a certificate or certificates for the full Common Shares held for you under the Plan and cash for any fractional Common Shares. You may elect to notify the Plan Agent in advance of such termination to have the Plan Agent sell part or all of your shares on your behalf. You will be charged a service charge and the Plan Agent is authorized to deduct brokerage charges actually incurred for this transaction from the proceeds.
46 | | Western Asset Variable Rate Strategic Fund Inc. | | |
Dividend reinvestment plan (unaudited) (cont’d)
There is no service charge for reinvestment of your distributions in Common Shares. However, all participants will pay a pro rata share of brokerage commissions incurred by the Plan Agent when it makes open market purchases. Because all distributions will be automatically reinvested in additional Common Shares, this allows you to add to your investment through dollar cost averaging, which may lower the average cost of your Common Shares over time. Dollar cost averaging is a technique for lowering the average cost per share over time if the Fund’s net asset value declines. While dollar cost averaging has definite advantages, it cannot assure profit or protect against loss in declining markets. Investors will be subject to income tax on amounts reinvested under the plan.
Automatically reinvesting distributions does not mean that you do not have to pay income taxes due upon receiving distributions.
The Fund reserves the right to amend or terminate the Plan if, in the judgment of the Board of Directors, the change is warranted. There is no direct service charge to participants in the Plan; however, the Fund reserves the right to amend the Plan to include a service charge payable by the participants. Additional information about the Plan and your account may be obtained from the Plan Agent at 1-888-888-0151.
[This page intentionally left blank.]
Western Asset
Variable Rate Strategic Fund Inc.
Directors
Carol L. Colman | Western Asset Variable Rate
Strategic Fund Inc. | Independent registered public accounting firm |
Daniel P. Cronin | 55 Water Street | KPMG LLP |
Paolo M. Cucchi | New York, NY 10041 | 345 Park Avenue |
Leslie H. Gelb | | New York, NY 10154 |
R. Jay Gerken, CFA | Investment manager | |
Chairman | Legg Mason Partners Fund Advisor, LLC | Legal counsel |
William R. Hutchinson | | Simpson Thacher & Bartlett LLP |
Riordan Roett | Subadvisers | 425 Lexington Avenue |
Jeswald W. Salacuse | Western Asset Management Company | New York, NY 10017 |
| Western Asset Management Company Limited | |
| Western Asset Management Company Pte. Ltd. | New York Stock Exchange Symbol |
Officers | | GFY |
R. Jay Gerken, CFA | Custodian | |
President and Chief Executive Officer | State Street Bank and Trust Company | |
Kaprel Ozsolak | 1 Lincoln Street | |
Chief Financial Officer | Boston, MA 02111 | |
Ted P. Becker | | |
Chief Compliance Officer | Transfer agent | |
John Chiota | American Stock Transfer & Trust Company | |
Identity Theft Protection Officer | 59 Maiden Lane | |
Robert I. Frenkel | New York, NY 10038 | |
Secretary and Chief Legal Officer | | |
Thomas C. Mandia | | |
Assistant Secretary | | |
Steven Frank | | |
Treasurer | | |
Jeanne M. Kelly | | |
Senior Vice President | | |
Privacy policy
We are committed to keeping nonpublic personal information about you secure and confidential. This notice is intended to help you understand how we fulfill this commitment. From time to time, we may collect a variety of personal information about you, including:
· Information we receive from you on applications and forms, via the telephone, and through our websites;
· Information about your transactions with us, our affiliates, or others (such as your purchases, sales, or account balances); and
· Information we receive from consumer reporting agencies.
We do not disclose nonpublic personal information about our customers or former customers, except to our affiliates (such as broker-dealers or investment advisers with the Legg Mason family of companies) or as is otherwise permitted by applicable law or regulation. For example, we may share this information with others in order to process your transactions or service an account. We may also provide this information to companies that perform marketing services on our behalf, such as printing and mailing, or to other financial institutions with whom we have joint marketing agreements. When we enter into such agreements, we will require these companies to protect the confidentiality of this information and to use it only to perform the services for which we hired them.
With respect to our internal security procedures, we maintain physical, electronic, and procedural safeguards to protect your nonpublic personal information, and we restrict access to this information.
If you decide at some point either to close your account(s) or become an inactive customer, we will continue to adhere to our privacy policies and practices with respect to your nonpublic personal information.
| | |
| NOT PART OF THE ANNUAL REPORT | |
| | |
Western Asset Variable Rate Strategic Fund Inc.
Western Asset Variable Rate Strategic Fund Inc.
55 Water Street
New York, NY 10041
Notice is hereby given in accordance with Section 23(c) of the Investment Company Act of 1940, as amended, that from time to time the Fund may purchase, at market prices, shares of its common stock in the open market.
The Fund files its complete schedule of portfolio holdings with the Securities and Exchange Commission (“SEC”) for the first and third quarters of each fiscal year on Form N-Q. The Fund’s Forms N-Q are available on the SEC’s website at www.sec.gov. The Fund’s Forms N-Q may be reviewed and copied at the SEC’s Public Reference Room in Washington, D.C., and information on the operation of the Public Reference Room may be obtained by calling 1-800-SEC-0330. To obtain information on Form N-Q from the Fund, shareholders can call 1-888-777-0102.
Information on how the Fund voted proxies relating to portfolio securities during the prior 12-month period ended June 30th of each year and a description of the policies and procedures that the Fund uses to determine how to vote proxies related to portfolio transactions are available (1) without charge, upon request, by calling 1-888-777-0102, (2) on the Fund’s website at www.leggmason.com/cef and (3) on the SEC’s website at www.sec.gov.
This report is transmitted to the shareholders of Western Asset Variable Rate Strategic Fund Inc. for their information. This is not a prospectus, circular or representation intended for use in the purchase of shares of the Fund or any securities mentioned in this report.
American Stock
Transfer & Trust Company
59 Maiden Lane
New York, NY 10038
WASX010407 11/10 SR10-1230
ITEM 2. CODE OF ETHICS.
The registrant has adopted a code of ethics that applies to the registrant’s principal executive officer, principal financial officer, principal accounting officer or controller.
ITEM 3. AUDIT COMMITTEE FINANCIAL EXPERT.
The Board of Directors of the registrant has determined that William R. Hutchinson, a member of the Board’s Audit Committee, possesses the technical attributes identified in Instruction 2(b) of Item 3 to Form N-CSR to qualify as an “audit committee financial expert,” and has designated Mr. Hutchinson as the Audit Committee’s financial expert. Mr. Hutchinson is an “independent” Director pursuant to paragraph (a)(2) of Item 3 to Form N-CSR.
ITEM 4. PRINCIPAL ACCOUNTANT FEES AND SERVICES.
a) Audit Fees. The aggregate fees billed in the last two fiscal years ending September 30, 2009 and September 30, 2010 (the “Reporting Periods”) for professional services rendered by the Registrant’s principal accountant (the “Auditor”) for the audit of the Registrant’s annual financial statements, or services that are normally provided by the Auditor in connection with the statutory and regulatory filings or engagements for the Reporting Periods, were $61,400 in 2009 and $69,700 in 2010.
b) Audit-Related Fees. There were no fees billed in the Reporting Periods for assurance and related services by the Auditor that are reasonably related to the performance of the audit of the Registrant’s financial statements and are not reported under paragraph (a) of the Item 4 for Western Asset Variable Rate Strategic Fund Inc.
In addition, there were no Audit-Related Fees billed in the Reporting Period for assurance and related services by the Auditor to the Registrant’s investment adviser (not including any sub-adviser whose role is primarily portfolio management and is subcontracted with or overseen by another investment adviser), and any entity controlling, controlled by or under common control with the investment adviser that provides ongoing services to the Western Asset Variable Rate Strategic Fund Inc. (“service affiliates”), that were reasonably related to the performance of the annual audit of the service affiliates. Accordingly, there were no such fees that required pre-approval by the Audit Committee for the Reporting Periods.
(c) Tax Fees. The aggregate fees billed in the Reporting Periods for professional services rendered by the Auditor for tax compliance, tax advice and tax planning (“Tax Services”) were $3,100 in 2009 and $3,300 in 2010. These services consisted of (i) review or preparation of U.S. federal, state, local and excise tax returns; (ii) U.S. federal, state and local tax planning, advice and assistance regarding statutory, regulatory or administrative developments, and (iii) tax advice regarding tax qualification matters and/or treatment of various financial instruments held or proposed to be acquired or held.
There were no fees billed for tax services by the Auditors to service affiliates during the Reporting Periods that required pre-approval by the Audit Committee.
d) All Other Fees. There were no other fees billed in the Reporting Periods for products and services provided by the Auditor, other than the services reported in paragraphs (a) through (c) of this Item 4 for the Western Asset Variable Rate Strategic Fund Inc.
All Other Fees. There were no other non-audit services rendered by the Auditor to Legg Mason Partners Fund Advisors, LLC (“LMPFA”), and any entity controlling, controlled by or under common control with LMPFA that provided ongoing services to Western Asset Variable Rate Strategic Fund Inc. requiring pre-approval by the Audit Committee in the Reporting Period.
(e) Audit Committee’s pre—approval policies and procedures described in paragraph (c) (7) of Rule 2-01 of Regulation S-X.
(1) The Charter for the Audit Committee (the “Committee”) of the Board of each registered investment company (the “Fund”) advised by LMPFA or one of their affiliates (each, an “Adviser”) requires that the Committee shall approve (a) all audit and permissible non-audit services to be provided to the Fund and (b) all permissible non-audit services to be provided by the Fund’s independent auditors to the Adviser and any Covered Service Providers if the engagement relates directly to the operations and financial reporting of the Fund. The Committee may implement policies and procedures by which such services are approved other than by the full Committee.
The Committee shall not approve non-audit services that the Committee believes may impair the independence of the auditors. As of the date of the approval of this Audit Committee Charter, permissible non-audit services include any professional services (including tax services), that are not prohibited services as described below, provided to the Fund by the independent auditors, other than those provided to the Fund in connection with an audit or a review of the financial statements of the Fund. Permissible non-audit services may not include: (i) bookkeeping or other services related to the accounting records or financial statements of the Fund; (ii) financial information systems design and implementation; (iii) appraisal or valuation services, fairness opinions or contribution-in-kind reports; (iv) actuarial services; (v) internal audit outsourcing services; (vi) management functions or human resources; (vii) broker or dealer, investment adviser or investment banking services; (viii) legal services and expert services unrelated to the audit; and (ix) any other service the Public Company Accounting Oversight Board determines, by regulation, is impermissible.
Pre-approval by the Committee of any permissible non-audit services is not required so long as: (i) the aggregate amount of all such permissible non-audit services provided to the Fund, the Adviser and any service providers controlling, controlled by or under common control with the Adviser that provide ongoing services to the Fund (“Covered Service Providers”) constitutes not more than 5% of the total amount of revenues paid to the independent auditors during the fiscal year in which the permissible non-audit services are provided to (a) the Fund, (b) the Adviser and (c) any entity controlling, controlled by or under common control with the Adviser that provides ongoing services to the Fund during the fiscal year in which the services are provided that would have to be approved by the Committee; (ii) the permissible non-audit services were not recognized by the Fund at the time of the engagement to be non-audit services; and (iii) such services are promptly brought to the attention of the Committee and approved by the Committee (or its delegate(s)) prior to the completion of the audit.
(2) For the Western Asset Variable Rate Strategic Fund Inc., the percentage of fees that were approved by the audit committee, with respect to: Audit-Related Fees were 100% and 100% for 2009 and 2010; Tax Fees were 100% and 100% for 2009 and 2010; and Other Fees were 100% and 100% for 2009 and 2010.
(f) N/A
(g) Non-audit fees billed by the Auditor for services rendered to Western Asset Variable Rate Strategic Fund Inc., LMPFA and any entity controlling, controlled by, or under common control with LMPFA that provides ongoing services to Western Asset Variable Rate Strategic Fund Inc. during the reporting period were $0 in 2010.
(h) Yes. Western Asset Variable Rate Strategic Fund Inc.’s Audit Committee has considered whether the provision of non-audit services that were rendered to Service Affiliates, which were not pre-approved (not requiring pre-approval), is compatible with maintaining the Accountant’s independence. All services provided by the Auditor to the Western Asset Variable Rate Strategic Fund Inc. or to Service Affiliates, which were required to be pre-approved, were pre-approved as required.
ITEM 5. AUDIT COMMITTEE OF LISTED REGISTRANTS.
a) Registrant has a separately-designated standing Audit Committee established in accordance with Section 3(a)58(A) of the Exchange Act. The Audit Committee consists of the following Board members:
William R. Hutchinson
Paolo M. Cucchi
Daniel P. Cronin
Carol L. Colman
Leslie H. Gelb
Dr. Riordan Roett
Jeswald W. Salacuse
b) Not applicable
ITEM 6. | SCHEDULE OF INVESTMENTS. |
| |
| Included herein under Item 1. |
| |
ITEM 7. | DISCLOSURE OF PROXY VOTING POLICIES AND PROCEDURES FOR CLOSED-END MANAGEMENT INVESTMENT COMPANIES. |
Proxy Voting Guidelines and Procedures
Legg Mason Partners Fund Advisor, LLC (“LMPFA”) delegates the responsibility for voting proxies for the fund to the subadviser through its contracts with the subadviser. The subadviser will use its own proxy voting policies and procedures to vote proxies. Accordingly, LMPFA does not expect to have proxy-voting responsibility for the fund. Should LMPFA become responsible for voting proxies for any reason, such as the inability of the subadviser to provide investment advisory services, LMPFA shall utilize the proxy voting guidelines established by the most recent subadviser to vote proxies until a new subadviser is retained.
The subadviser’s Proxy Voting Policies and Procedures govern in determining how proxies relating to the fund’s portfolio securities are voted and are provided below. Information regarding how each fund voted proxies (if any) relating to portfolio securities during the most recent 12-month period ended June 30 is available without charge (1) by calling 888-425-6432, (2) on the fund’s website at http://www.leggmason.com/individualinvestors and (3) on the SEC’s website at http://www.sec.gov.
Background
Western Asset Management Company (“WA”), Western Asset Management Company Limited (“WAML”) and Western Asset Management Company Pte. Ltd. (“WAMC”) (together “Western Asset”) have adopted and implemented policies and procedures that we believe are reasonably designed to ensure that proxies are voted in the best interest of clients, in accordance with our fiduciary duties and SEC Rule 206(4)-6 under the Investment Advisers Act of 1940 (“Advisers Act”). Our authority to vote the proxies of our clients is established through investment management agreements or comparable documents, and our proxy voting guidelines have been tailored to reflect these specific contractual obligations. In addition to SEC requirements governing advisers, our proxy voting policies reflect the long-standing fiduciary standards and responsibilities for ERISA accounts. Unless a manager of ERISA assets
has been expressly precluded from voting proxies, the Department of Labor has determined that the responsibility for these votes lies with the Investment Manager.
In exercising its voting authority, Western Asset will not consult or enter into agreements with officers, directors or employees of Legg Mason Inc. or any of its affiliates (except that WA, WAML and WAMC may so consult and agree with each other) regarding the voting of any securities owned by its clients.
Policy
Western Asset’s proxy voting procedures are designed and implemented in a way that is reasonably expected to ensure that proxy matters are handled in the best interest of our clients. While the guidelines included in the procedures are intended to provide a benchmark for voting standards, each vote is ultimately cast on a case-by-case basis, taking into consideration Western Asset’s contractual obligations to our clients and all other relevant facts and circumstances at the time of the vote (such that these guidelines may be overridden to the extent Western Asset deems appropriate).
Procedures
Responsibility and Oversight
The Western Asset Compliance Department (“Compliance Department”) is responsible for administering and overseeing the proxy voting process. The gathering of proxies is coordinated through the Corporate Actions area of Investment Support (“Corporate Actions”). Research analysts and portfolio managers are responsible for determining appropriate voting positions on each proxy utilizing any applicable guidelines contained in these procedures.
Client Authority
Prior to August 1, 2003, all existing client investment management agreements (“IMAs”) will be reviewed to determine whether Western Asset has authority to vote client proxies. At account start-up, or upon amendment of an IMA, the applicable client IMA are similarly reviewed. If an agreement is silent on proxy voting, but contains an overall delegation of discretionary authority or if the account represents assets of an ERISA plan, Western Asset will assume responsibility for proxy voting. The Client Account Transition Team maintains a matrix of proxy voting authority.
Proxy Gathering
Registered owners of record, client custodians, client banks and trustees (“Proxy Recipients”) that receive proxy materials on behalf of clients should forward them to Corporate Actions. Prior to August 1, 2003, Proxy Recipients of existing clients will be reminded of the appropriate routing to Corporate Actions for proxy materials received and reminded of their responsibility to forward all proxy materials on a timely basis. Proxy Recipients for new clients (or, if Western Asset becomes aware that the applicable Proxy Recipient for an existing client has changed, the Proxy Recipient for the existing client) are notified at start-up of appropriate routing to Corporate Actions of proxy materials received and reminded of their responsibility to forward all proxy materials on a timely basis. If Western Asset personnel other than Corporate Actions receive proxy materials, they should promptly forward the materials to Corporate Actions.
Proxy Voting
Once proxy materials are received by Corporate Actions, they are forwarded to the Compliance Department for coordination and the following actions:
a. Proxies are reviewed to determine accounts impacted.
b. Impacted accounts are checked to confirm Western Asset voting authority.
c. Compliance Department staff reviews proxy issues to determine any material conflicts of interest. (See conflicts of interest section of these procedures for further information on determining material conflicts of interest.)
d. If a material conflict of interest exists, (i) to the extent reasonably practicable and permitted by applicable law, the client is promptly notified, the conflict is disclosed and Western Asset obtains the client’s proxy voting instructions, and (ii) to the extent that it is not reasonably practicable or permitted by applicable law to notify the client and obtain such instructions (e.g., the client is a mutual fund or other commingled vehicle or is an ERISA plan client), Western Asset seeks voting instructions from an independent third party.
e. Compliance Department staff provides proxy material to the appropriate research analyst or portfolio manager to obtain their recommended vote. Research analysts and portfolio managers determine votes on a case-by-case basis taking into account the voting guidelines contained in these procedures. For avoidance of doubt, depending on the best interest of each individual client, Western Asset may vote the same proxy differently for different clients. The analyst’s or portfolio manager’s basis for their decision is documented and maintained by the Compliance Department.
f. Compliance Department staff votes the proxy pursuant to the instructions received in (d) or (e) and returns the voted proxy as indicated in the proxy materials.
Timing
Western Asset personnel act in such a manner to ensure that, absent special circumstances, the proxy gathering and proxy voting steps noted above can be completed before the applicable deadline for returning proxy votes.
Recordkeeping
Western Asset maintains records of proxies voted pursuant to Section 204-2 of the Advisers Act and ERISA DOL Bulletin 94-2. These records include:
a. A copy of Western Asset’s policies and procedures.
b. Copies of proxy statements received regarding client securities.
c. A copy of any document created by Western Asset that was material to making a decision how to vote proxies.
d. Each written client request for proxy voting records and Western Asset’s written response to both verbal and written client requests.
e. A proxy log including:
1. Issuer name;
2. Exchange ticker symbol of the issuer’s shares to be voted;
3. Council on Uniform Securities Identification Procedures (“CUSIP”) number for the shares to be voted;
4. A brief identification of the matter voted on;
5. Whether the matter was proposed by the issuer or by a shareholder of the issuer;
6. Whether a vote was cast on the matter;
7. A record of how the vote was cast; and
8. Whether the vote was cast for or against the recommendation of the issuer’s management team.
Records are maintained in an easily accessible place for five years, the first two in Western Asset’s offices.
Disclosure
Part II of the WA Form ADV, the WAML Form ADV and WAMC Form ADV, each, contain a description of Western Asset’s proxy policies. Prior to August 1, 2003, Western Asset will deliver Part II of its revised Form ADV to all existing clients, along with a letter identifying the new disclosure. Clients will be provided a copy of these policies and procedures upon request. In addition, upon request, clients may receive reports on how their proxies have been voted.
Conflicts of Interest
All proxies are reviewed by the Compliance Department for material conflicts of interest. Issues to be reviewed include, but are not limited to:
1. Whether Western Asset (or, to the extent required to be considered by applicable law, its affiliates) manages assets for the company or an employee group of the company or otherwise has an interest in the company;
2. Whether Western Asset or an officer or director of Western Asset or the applicable portfolio manager or analyst responsible for recommending the proxy vote (together, “Voting Persons”) is a close relative of or has a personal or business relationship with an executive, director or person who is a candidate for director of the company or is a participant in a proxy contest; and
3. Whether there is any other business or personal relationship where a Voting Person has a personal interest in the outcome of the matter before shareholders.
Voting Guidelines
Western Asset’s substantive voting decisions turn on the particular facts and circumstances of each proxy vote and are evaluated by the designated research analyst or portfolio manager. The examples outlined below are meant as guidelines to aid in the decision making process.
Guidelines are grouped according to the types of proposals generally presented to shareholders. Part I deals with proposals which have been approved and are recommended by a company’s board of directors; Part II deals with proposals submitted by shareholders for inclusion in proxy statements; Part III addresses issues relating to voting shares of investment companies; and Part IV addresses unique considerations pertaining to foreign issuers.
I. Board Approved Proposals
The vast majority of matters presented to shareholders for a vote involve proposals made by a company itself that have been approved and recommended by its board of directors. In view of the enhanced corporate governance practices currently being implemented in
public companies, Western Asset generally votes in support of decisions reached by independent boards of directors. More specific guidelines related to certain board-approved proposals are as follows:
1. Matters relating to the Board of Directors
Western Asset votes proxies for the election of the company’s nominees for directors and for board-approved proposals on other matters relating to the board of directors with the following exceptions:
a. Votes are withheld for the entire board of directors if the board does not have a majority of independent directors or the board does not have nominating, audit and compensation committees composed solely of independent directors.
b. Votes are withheld for any nominee for director who is considered an independent director by the company and who has received compensation from the company other than for service as a director.
c. Votes are withheld for any nominee for director who attends less than 75% of board and committee meetings without valid reasons for absences.
d. Votes are cast on a case-by-case basis in contested elections of directors.
2. Matters relating to Executive Compensation
Western Asset generally favors compensation programs that relate executive compensation to a company’s long-term performance. Votes are cast on a case-by-case basis on board-approved proposals relating to executive compensation, except as follows:
a. Except where the firm is otherwise withholding votes for the entire board of directors, Western Asset votes for stock option plans that will result in a minimal annual dilution.
b. Western Asset votes against stock option plans or proposals that permit replacing or repricing of underwater options.
c. Western Asset votes against stock option plans that permit issuance of options with an exercise price below the stock’s current market price.
d. Except where the firm is otherwise withholding votes for the entire board of directors, Western Asset votes for employee stock purchase plans that limit the discount for shares purchased under the plan to no more than 15% of their market value, have an offering period of 27 months or less and result in dilution of 10% or less.
3. Matters relating to Capitalization
The management of a company’s capital structure involves a number of important issues, including cash flows, financing needs and market conditions that are unique to the circumstances of each company. As a result, Western Asset votes on a case-by-case basis on board-approved proposals involving changes to a company’s capitalization except where Western Asset is otherwise withholding votes for the entire board of directors.
a. Western Asset votes for proposals relating to the authorization of additional common stock.
b. Western Asset votes for proposals to effect stock splits (excluding reverse stock splits).
c. Western Asset votes for proposals authorizing share repurchase programs.
4. Matters relating to Acquisitions, Mergers, Reorganizations and Other Transactions
Western Asset votes these issues on a case-by-case basis on board-approved transactions.
5. Matters relating to Anti-Takeover Measures
Western Asset votes against board-approved proposals to adopt anti-takeover measures except as follows:
a. Western Asset votes on a case-by-case basis on proposals to ratify or approve shareholder rights plans.
b. Western Asset votes on a case-by-case basis on proposals to adopt fair price provisions.
6. Other Business Matters
Western Asset votes for board-approved proposals approving such routine business matters such as changing the company’s name, ratifying the appointment of auditors and procedural matters relating to the shareholder meeting.
a. Western Asset votes on a case-by-case basis on proposals to amend a company’s charter or bylaws.
b. Western Asset votes against authorization to transact other unidentified, substantive business at the meeting.
II. Shareholder Proposals
SEC regulations permit shareholders to submit proposals for inclusion in a company’s proxy statement. These proposals generally seek to change some aspect of a company’s corporate governance structure or to change some aspect of its business operations. Western Asset votes in accordance with the recommendation of the company’s board of directors on all shareholder proposals, except as follows:
1. Western Asset votes for shareholder proposals to require shareholder approval of shareholder rights plans.
2. Western Asset votes for shareholder proposals that are consistent with Western Asset’s proxy voting guidelines for board-approved proposals.
3. Western Asset votes on a case-by-case basis on other shareholder proposals where the firm is otherwise withholding votes for the entire board of directors.
III. Voting Shares of Investment Companies
Western Asset may utilize shares of open or closed-end investment companies to implement its investment strategies. Shareholder votes for investment companies that fall within the categories listed in Parts I and II above are voted in accordance with those guidelines.
1. Western Asset votes on a case-by-case basis on proposals relating to changes in the investment objectives of an investment company taking into account the original intent of the fund and the role the fund plays in the clients’ portfolios.
2. Western Asset votes on a case-by-case basis all proposals that would result in increases in expenses (e.g., proposals to adopt 12b-1 plans, alter investment advisory arrangements or approve fund mergers) taking into account comparable expenses for similar funds and the services to be provided.
IV. Voting Shares of Foreign Issuers
In the event Western Asset is required to vote on securities held in foreign issuers — i.e. issuers that are incorporated under the laws of a foreign jurisdiction and that are not listed on a U.S. securities exchange or the NASDAQ stock market, the following guidelines are used, which are premised on the existence of a sound corporate governance and disclosure framework. These guidelines, however, may not be appropriate under some circumstances for foreign issuers and therefore apply only where applicable.
1. Western Asset votes for shareholder proposals calling for a majority of the directors to be independent of management.
2. Western Asset votes for shareholder proposals seeking to increase the independence of board nominating, audit and compensation committees.
3. Western Asset votes for shareholder proposals that implement corporate governance standards similar to those established under U.S. federal law and the listing requirements of U.S. stock exchanges, and that do not otherwise violate the laws of the jurisdiction under which the company is incorporated.
4. Western Asset votes on a case-by-case basis on proposals relating to (1) the issuance of common stock in excess of 20% of a company’s outstanding common stock where shareholders do not have preemptive rights, or (2) the issuance of common stock in excess of 100% of a company’s outstanding common stock where shareholders have preemptive rights.
ITEM 8. PORTFOLIO MANAGERS OF CLOSED-END MANAGEMENT INVESTMENT COMPANIES.
(a)(1):
NAME AND | | LENGTH OF | | PRINCIPAL OCCUPATION(S) DURING |
ADDRESS | | TIME SERVED | | PAST 5 YEARS |
| | | | |
S. Kenneth Leech Western Asset
385 East | | Since 2006 | | Co-portfolio manager of the fund; Chief Investment Officer of Western Asset from 1998 to 2008; Senior Advisor/Chief Investment Officer Emeritus of Western Asset. |
Colorado Blvd.
Pasadena, CA 91101 | | | | |
| | | | |
Stephen A. Walsh Western Asset
385 East Colorado Blvd.
Pasadena, CA 91101 | | Since 2006 | | Co-portfolio manager of the fund; Deputy Chief Investment Officer of Western Asset from 2000 to 2008; Chief Investment Officer of Western Asset since 2008. |
| | | | |
Keith J. Gardner Western Asset
385 East Colorado Blvd.
Pasadena, CA 91101 | | Since 2006 | | Co-portfolio manager of the fund; portfolio manager and research analyst at Western Asset since 1994. |
| | | | |
Michael C. Buchanan Western Asset
385 East Colorado Blvd.
Pasadena, CA 91101 | | Since 2006 | | Co-portfolio manager of the fund; Managing Director and head of U.S. Credit Products from 2003-2005 at Credit Suisse Asset Management |
Andrea Mack Western Asset
385 East Colorado Blvd.
Pasadena, CA 91101 | | Since 2007 | | Co-portfolio manager of the fund; portfolio manager at Western Asset for the past five years. |
| | | | |
Dennis McNamara Western Asset
385 East Colorado Blvd.
Pasadena, CA 91101 | | Since 2010 | | Co-portfolio manager of the fund; portfolio manager at Western Asset since 2001. |
| | | | |
Julien A. Scholnick Western Asset
385 East Colorado Blvd.
Pasadena, CA 91101 | | Since 2010 | | Co-portfolio manager of the fund; portfolio manager at Western Asset since 2003. |
| | | | |
Michael Y. Pak Western Asset
385 East Colorado Blvd.
Pasadena, CA 91101 | | Since 2010 | | Co-portfolio manager of the fund; portfolio manager at Western Asset since 2000. |
(a)(2): DATA TO BE PROVIDED BY FINANCIAL CONTROL
The following tables set forth certain additional information with respect to the fund’s portfolio managers for the fund. Unless noted otherwise, all information is provided as of September 30, 2010.
Other Accounts Managed by Portfolio Managers
The table below identifies the number of accounts (other than the fund) for which the fund’s portfolio managers have day-to-day management responsibilities and the total assets in such accounts, within each of the following categories: registered investment companies, other pooled investment vehicles, and other accounts. For each category, the number of accounts and total assets in the accounts where fees are based on performance is also indicated.
| | Registered | | Other Pooled | | |
Portfolio | | Investment | | Investment | | Other |
Manager(s) | | Companies | | Vehicles | | Accounts |
| | | | | | |
S. Kenneth Leech ‡ | | 105 registered investment companies with $170.8 billion in total assets under management | | 209 Other pooled investment vehicles with $113.3 billion in assets under management* | | 797 Other accounts with $185.2 on in total assets under management** |
| | | | | | |
Stephen A. Walsh ‡ | | 105 registered investment companies with $170.8 billion in total assets under management | | 209 Other pooled investment vehicles with $113.3 billion in assets under management* | | 797 Other accounts with $185.2 on in total assets under management** |
| | | | | | |
Keith J. Gardner ‡ | | 43 registered investment companies with $27.2 billion in total assets under management | | 7 Other pooled investment vehicles with $0.9 billion in assets under management | | 1 Other accounts with $0.3 billion in total assets under management |
| | | | | | |
Michael C. Buchanan ‡ | | 51 registered investment companies with $30.1 billion in total assets Under management | | 5 Other pooled investment vehicles with $2.9 billion in assets under management | | 11 Other accounts with $1.7 billion in total assets under management |
| | | | | | |
Andrea Mack‡ | | 5 registered investment Companies with $1.3 billion in total assets Under management | | 1 Other pooled investment vehicles with $25 million in assets under management | | 13 Other accounts with $2.8 billion in total assets under management |
Dennis McNamara | | None | | 5 Other pooled investment vehicles with $1.0 billion in assets under management | | 27 Other accounts with $4.5 billion in total assets under management*** |
| | | | | | |
Julien A. Scholnick | | 4 registered investment companies with $1.0 billion in total assets under management | | 8 Other pooled investment vehicles with $1.1 billion in assets under management | | 78 Other accounts with $11.2 billion in total assets under management**** |
| | | | | | |
Michael Y. Pak | | 2 registered investment companies with $0.6 billion in total assets under management | | 1 Other pooled investment vehicles with $0.2 billion in assets under management | | 6 Other accounts with $5.3 billion in total assets under management |
* | Includes 7 accounts managed, totaling $1.2 billion, for which advisory fee is performance based. |
** | Includes 83 accounts managed, totaling $20.1 billion, for which advisory fee is performance based. |
*** | Includes 2 accounts managed, totaling $0.2 billion, for which advisory fee is performance based. |
**** | Includes 1 account managed, totaling $0.5 billion, for which advisory fee is performance based. |
‡ The numbers above reflect the overall number of portfolios managed by employees of Western Asset Management Company (“Western Asset”). Mr. Leech and Mr. Walsh are involved in the management of all the Firm’s portfolios, but they are not solely responsible for particular portfolios. Western Asset’s investment discipline emphasizes a team approach that combines the efforts of groups of specialists working in different market sectors. They are responsible for overseeing implementation of Western Asset’s overall investment ideas and coordinating the work of the various sector teams. This structure ensures that client portfolios benefit from a consensus that draws on the expertise of all team members.
(a)(3): Portfolio Manager Compensation
With respect to the compensation of the portfolio managers, Western Asset’s compensation system assigns each employee a total compensation range, which is derived from annual market surveys that benchmark each role with its job function and peer universe. This method is designed to reward employees with total compensation reflective of the external market value of their skills, experience, and ability to produce desired results. Standard compensation includes competitive base salaries, generous employee benefits, and a retirement plan.
In addition, the subadviser’s employees are eligible for bonuses. These are structured to closely align the interests of employees with those of the subadviser, and are determined by the professional’s job function and pre-tax performance as measured by a formal review process. All bonuses are completely discretionary. The principal factor considered is a portfolio manager’s investment performance versus appropriate peer groups and benchmarks (e.g., a securities index and with respect to a fund, the benchmark set forth in the fund’s Prospectus to which the fund’s average annual total returns are compared or, if none, the benchmark set forth in the fund’s annual report). Performance is reviewed on a 1, 3 and 5 year basis for compensation—with 3 years having the most emphasis. The subadviser may also measure a portfolio manager’s pre-tax investment performance against other benchmarks, as it determines appropriate. Because portfolio managers are generally responsible for multiple accounts (including the funds) with similar investment strategies, they are generally compensated on the performance of the aggregate group of similar accounts, rather than a specific account. Other factors that may be considered when making bonus decisions include client service, business development, length
of service to the subadviser, management or supervisory responsibilities, contributions to developing business strategy and overall contributions to the subadviser’s business.
Finally, in order to attract and retain top talent, all professionals are eligible for additional incentives in recognition of outstanding performance. These are determined based upon the factors described above and include Legg Mason stock options and long-term incentives that vest over a set period of time past the award date.
Potential Conflicts of Interest
Conflicts of Interest
The manager, subadvisers and portfolio managers have interests which conflict with the interests of the fund. There is no guarantee that the policies and procedures adopted by the manager, the subadvisers and the fund will be able to identify or mitigate these conflicts of interest.
Some examples of material conflicts of interest include:
Allocation of Limited Time and Attention. A portfolio manager who is responsible for managing multiple funds and/or accounts may devote unequal time and attention to the management of those funds and/or accounts. A portfolio manager may not be able to formulate as complete a strategy or identify equally attractive investment opportunities for each of those funds and accounts as might be the case if he or she were to devote substantially more attention to the management of a single fund. Such a portfolio manager may make general determinations across multiple funds, rather than tailoring a unique approach for each fund. The effects of this conflict may be more pronounced where funds and/or accounts overseen by a particular portfolio manager have different investment strategies.
Allocation of Limited Investment Opportunities; Aggregation of Orders. If a portfolio manager identifies a limited investment opportunity that may be suitable for multiple funds and/or accounts, the opportunity may be allocated among these several funds or accounts, which may limit the fund’s ability to take full advantage of the investment opportunity. Additionally, a subadviser may aggregate transaction orders for multiple accounts for purpose of execution. Such aggregation may cause the price or brokerage costs to be less favorable to a particular client than if similar transactions were not being executed concurrently for other accounts. In addition, a subadviser’s trade allocation policies may result in the fund’s orders not being fully executed or being delayed in execution.
Pursuit of Differing Strategies. At times, a portfolio manager may determine that an investment opportunity may be appropriate for only some of the funds and/or accounts for which he or she exercises investment responsibility, or may decide that certain of the funds and/or accounts should take differing positions with respect to a particular security. In these cases, the portfolio manager may place separate transactions for one or more funds or accounts which may affect the market price of the security or the execution of the transaction, or both, to the detriment or benefit of one or more other funds and/or accounts. For example, a portfolio manager may determine that it would be in the interest of another account to sell a security that the fund holds long, potentially resulting in a decrease in the market value of the security held by the fund.
Cross Trades. Portfolio managers may manage funds that engage in cross trades, where one of the manager’s funds or accounts sells a particular security to another fund or account managed by the same manager. Cross trades may pose conflicts of interest because of, for example, the possibility that one account sells a security to another account at a higher price than an independent third party would pay or otherwise enters into a transaction that it would not enter into with an independent party, such as the sale of a difficult-to-obtain security.
Selection of Broker/Dealers. Portfolio managers may select or influence the selection of the brokers and dealers that are used to execute securities transactions for the funds and/or accounts that they supervise. In addition to executing trades, some brokers and dealers provide subadvisers with brokerage and research services, These services may be taken into account in the selection of brokers and dealers whether a broker is being selected to effect a trade on an agency basis for a commission or (as is normally the case for the funds) whether a dealer is being selected to effect a trade on a principal basis. This may result in the payment of higher brokerage fees and/or execution at a less favorable price than might have otherwise been available. The services obtained may ultimately be more beneficial to certain of the manager’s funds or accounts than to others (but not necessarily to the funds that pay the increased commission or incur the less favorable execution). A decision as to the selection of brokers and dealers could therefore yield disproportionate costs and benefits among the funds and/or accounts managed.
Variation in Financial and Other Benefits. A conflict of interest arises where the financial or other benefits available to a portfolio manager differ among the funds and/or accounts that he or she manages. If the amount or structure of the investment manager’s management fee and/or a portfolio manager’s compensation differs among funds and/or accounts (such as where certain funds or accounts pay higher management fees or performance-based management fees), the portfolio manager might be motivated to help certain funds and/or accounts over others. Similarly, the desire to maintain assets under management or to enhance the portfolio manager’s performance record or to derive other rewards, financial or otherwise, could influence the portfolio manager in affording preferential treatment to those funds and/or accounts that could most significantly benefit the portfolio manager. A portfolio manager may, for example, have an incentive to allocate favorable or limited opportunity investments or structure the timing of investments to favor such funds and/or accounts. Also, a portfolio manager’s or the manager’s or a subadviser’s desire to increase assets under management could influence the portfolio manager to keep a fund open for new investors without regard to potential benefits of closing the fund to new investors. Additionally, the portfolio manager might be motivated to favor funds and/or accounts in which he or she has an ownership interest or in which the investment manager and/or its affiliates have ownership interests. Conversely, if a portfolio manager does not personally hold an investment in the fund, the portfolio manager’s conflicts of interest with respect to the fund may be more acute.
Related Business Opportunities. The investment manager or its affiliates may provide more services (such as distribution or recordkeeping) for some types of funds or accounts than for others. In such cases, a portfolio manager may benefit, either directly or indirectly, by devoting disproportionate attention to the management of funds and/or accounts that provide greater overall returns to the investment manager and its affiliates.
(a)(4): Portfolio Manager Securities Ownership
The table below identifies the dollar range of securities beneficially owned by each portfolio managers as of September 30, 2010.
Portfolio Manager(s) | | Dollar Range of
Portfolio
Securities
Beneficially
Owned | |
S. Kenneth Leech | | E | |
Stephen A. Walsh | | E | |
Keith J. Gardner | | A | |
Michael C. Buchanan | | A | |
Andrea Mack | | A | |
Dennis McNamara | | E | |
Julien A. Scholnick | | A | |
Michael Y. Pak | | A | |
Dollar Range ownership is as follows:
A: none
B: $1 - $10,000
C: 10,001 - $50,000
D: $50,001 - $100,000
E: $100,001 - $500,000
F: $500,001 - $1 million
G: over $1 million
ITEM 9. PURCHASES OF INCOME SECURITIES BY CLOSED-END MANAGEMENT INVESTMENT COMPANY AND AFFILIATED PURCHASERS.
None.
ITEM 10. SUBMISSION OF MATTERS TO A VOTE OF SECURITY HOLDERS.
None.
ITEM 11. CONTROLS AND PROCEDURES.
(a) The registrant’s principal executive officer and principal financial officer have concluded that the registrant’s disclosure controls and procedures (as defined in Rule 30a- 3(c) under the Investment Company Act of 1940, as amended (the “1940 Act”)) are effective as of a date within 90 days of the filing date of this report that includes the disclosure required by this paragraph, based on their evaluation of the disclosure controls and procedures required by Rule 30a-3(b) under the 1940 Act and 15d-15(b) under the Securities Exchange Act of 1934.
(b) There were no changes in the registrant’s internal control over financial reporting (as defined in Rule 30a-3(d) under the 1940 Act) that occurred during the registrant’s last fiscal half-year (the registrant’s second fiscal half-year in the case of an annual report) that have materially affected, or are likely to materially affect the registrant’s internal control over financial reporting.
ITEM 12. EXHIBITS.
(a) (1) Code of Ethics attached hereto.
Exhibit 99.CODE ETH
(a) (2) Certifications pursuant to section 302 of the Sarbanes-Oxley Act of 2002 attached hereto.
Exhibit 99.CERT
(b) Certifications pursuant to Section 906 of the Sarbanes-Oxley Act of 2002 attached hereto.
Exhibit 99.906CERT
SIGNATURES
Pursuant to the requirements of the Securities Exchange Act of 1934 and the Investment Company Act of 1940, the registrant has duly caused this Report to be signed on its behalf by the undersigned, there unto duly authorized.
Western Asset Variable Rate Strategic Fund Inc.
By: | /s/ R. Jay Gerken | |
| (R. Jay Gerken) |
| Chief Executive Officer of |
| Western Asset Variable Rate Strategic Fund Inc. |
| |
Date: | November 23, 2010 |
Pursuant to the requirements of the Securities Exchange Act of 1934 and the Investment Company Act of 1940, this report has been signed below by the following persons on behalf of the registrant and in the capacities and on the dates indicated.
By: | /s/ R. Jay Gerken | |
| (R. Jay Gerken) |
| Chief Executive Officer of |
| Western Asset Variable Rate Strategic Fund Inc. |
| |
Date: | November 23, 2010 |
| |
By: | /s/ Kaprel Ozsolak | |
| (Kaprel Ozsolak) |
| Chief Financial Officer of |
| Western Asset Variable Rate Strategic Fund Inc. |
| |
Date: | November 23, 2010 |