UNITED STATES
SECURITIES AND EXCHANGE COMMISSION
Washington, D.C. 20549
FORM N-CSR
CERTIFIED SHAREHOLDER REPORT OF REGISTERED
MANAGEMENT INVESTMENT COMPANIES
Investment Company Act file number | 811-21609 |
|
Western Asset Variable Rate Strategic Fund Inc. |
(Exact name of registrant as specified in charter) |
|
620 Eighth Avenue, 49th Floor, New York, New York | | 10018 |
(Address of principal executive offices) | | (Zip code) |
|
Robert I. Frenkel, Esq. Legg Mason & Co., LLC 100 First Stamford Place Stamford, CT 06902 |
(Name and address of agent for service) |
|
Registrant’s telephone number, including area code: | (888) 777-0102 | |
|
Date of fiscal year end: | September 30 | |
|
Date of reporting period: | March 31, 2012 | |
| | | | | | | | |
ITEM 1. REPORT TO STOCKHOLDERS.
The Semi-Annual Report to Stockholders is filed herewith.
March 31, 2012 | | 
|
Semi-Annual Report
Western Asset Variable Rate Strategic Fund Inc.
(GFY)
| |
| INVESTMENT PRODUCTS: NOT FDIC INSURED · NO BANK GUARANTEE · MAY LOSE VALUE |
| |
II | | Western Asset Variable Rate Strategic Fund Inc. | | |
Fund objective
The Fund’s investment objective is to maintain a high level of current income.
What’s inside
Letter from chairman | II |
| |
Investment commentary | III |
| |
Fund at a glance | 1 |
| |
Spread duration | 2 |
| |
Effective duration | 3 |
| |
Schedule of investments | 4 |
| |
Statement of assets and liabilities | 20 |
| |
Statement of operations | 21 |
| |
Statements of changes in net assets | 22 |
| |
Statement of cash flows | 23 |
| |
Financial highlights | 24 |
| |
Notes to financial statements | 25 |
| |
Board approval of management and subadvisory agreements | 44 |
| |
Additional shareholder information | 50 |
| |
Dividend reinvestment plan | 51 |
Letter from the chairman | 
|
Dear Shareholder,
We are pleased to provide the semi-annual report of Western Asset Variable Rate Strategic Fund Inc. for the six-month reporting period ended March 31, 2012. Please read on for Fund performance information and a detailed look at prevailing economic and market conditions during the Fund’s reporting period.
As always, we remain committed to providing you with excellent service and a full spectrum of investment choices. We also remain committed to supplementing the support you receive from your financial advisor. One way we accomplish this is through our website, www.lmcef.com. Here you can gain immediate access to market and investment information, including:
· Fund prices and performance,
· Market insights and commentaries from our portfolio managers, and
· A host of educational resources.
We look forward to helping you meet your financial goals.
Sincerely,

R. Jay Gerken, CFA
Chairman, President and Chief Executive Officer
April 27, 2012
| | Western Asset Variable Rate Strategic Fund Inc. | | III |
Investment commentary
Economic review
The U.S. economy continued to grow over the six months ended March 31, 2012, albeit at an uneven pace. Looking back, U.S. gross domestic product (“GDP”)i growth, as reported by the U.S. Department of Commerce, was 1.8% in the third quarter of 2011. The economy then gathered further momentum late in 2011, as the Commerce Department reported that fourth quarter GDP growth was 3.0% — the fastest pace since the second quarter of 2010. However, economic growth in the U.S. then moderated somewhat, as the Commerce Department’s initial estimate for first quarter 2012 GDP growth was 2.2%.
Two factors constraining economic growth were the weak job market and continued troubles in the housing market. While there was some improvement during the reporting period, unemployment remained elevated. When the reporting period began, unemployment, as reported by the U.S. Department of Labor, was 9.0%. Unemployment then generally declined over the next six months and was 8.2% in March 2012, the lowest rate since February 2009. The housing market showed some positive signs, although it still appears to be searching for a bottom. According to the National Association of Realtors (“NAR”), existing-home sales fluctuated throughout the period. However, the inventory of unsold homes moved lower versus the previous month in March 2012 and home prices increased. The NAR reported that the median existing-home price for all housing types was $163,800 in March 2012, up 2.5% from March 2011.
After experiencing a soft patch in the summer of 2011, the manufacturing sector expanded at a stronger pace during much of the reporting period. Based on the Institute for Supply Management’s PMI (“PMI”)ii, in August 2011, it had a reading of 50.6, its lowest reading in two years (a reading below 50 indicates a contraction, whereas a reading above 50 indicates an expansion). The manufacturing sector gathered momentum and ended January 2012 at 54.1, its highest reading since June 2011. After dipping to 52.4 in February, the PMI rose to 53.4 in March. In addition, fifteen of the eighteen industries tracked by the Institute for Supply Management expanded in March. In contrast, only nine and eleven industries expanded in January and February 2012, respectively.
IV | | Western Asset Variable Rate Strategic Fund Inc. | | |
Investment commentary (cont’d)
Market review
Q. Did Treasury yields trend higher or lower during the six months ended March 31, 2012?
A. Both short- and long-term Treasury yields fluctuated during the reporting period. When the period began, two- and ten-year Treasury yields were 0.25% and 1.92%, respectively. Two-year Treasuries hit their low for the reporting period of 0.21% in mid-January 2012, and ten-year Treasuries reached their reporting period trough of 1.80% in early October 2011. With the economy gathering some momentum, Treasury yields moved higher toward the end of the period. Two-year Treasury yields rose as high as 0.41% on March 20, 2012 and ten-year Treasuries peaked at 2.39% around the same time. Yields then fell in late March given renewed fears over the European sovereign debt crisis. When the reporting period ended on March 31, 2012, two-year Treasury yields were 0.33% and ten-year Treasury yields were 2.23%.
Q. How did the Federal Reserve Board (“Fed”)iii respond to the economic environment?
A. The Fed took a number of actions as it sought to meet its dual mandate of fostering maximum employment and price stability. As has been the case since December 2008, the Fed kept the federal funds rateiv at a historically low range between zero and 0.25%. In August 2011, the Fed declared its intention to keep the federal funds rate steady until mid-2013. Then, in September 2011, the Fed announced its intention to purchase $400 billion of longer-term Treasury securities and to sell an equal amount of shorter-term Treasury securities by June 2012 (often referred to as “Operation Twist”). In January 2012, the Fed extended the period it expects to keep rates on hold, saying “economic conditions — including low rates of resource utilization and a subdued outlook for inflation over the medium run — are likely to warrant exceptionally low levels for the federal funds rate at least through late 2014.” The Fed repeated this point at its meeting in April (after the reporting period ended), saying “To support a stronger economic recovery and to help ensure that inflation, over time, is at the rate most consistent with its dual mandate, the Committee expects to maintain a highly accommodative stance for monetary policy.”
Q. What factors impacted the spread sectors (non-Treasuries) during the reporting period?
A. The spread sectors experienced periods of volatility during the period. Risk appetite was robust in October 2011, due to some better-than-expected economic data and signs of progress in the European sovereign debt crisis. A flight to quality then occurred in November given fears regarding the situation in Europe. Risk appetite returned over the next three months of the period as the U.S. economy gained further traction. However, concerns related to Europe triggered another bout of risk aversion in March. For the six months ended March 31, 2012, the Barclays Capital U.S. Aggregate Indexv returned 1.43%.
Q. How did the high-yield market perform over the six months ended March 31, 2012?
A. The U.S. high-yield bond market generated a strong gain during the reporting period. The asset class rallied sharply during the first month of the period given strong risk appetite. Against this backdrop, the Barclays Capital U.S. High Yield — 2% Issuer Cap Indexvi, rose 6.00% in October. The high-yield market then weakened in
| | Western Asset Variable Rate Strategic Fund Inc. | | V |
November due to the escalating European sovereign debt crisis. However, it rallied during three of the last four months of the period as risk appetite returned. All told, the high-yield market gained 12.17% for the six months ended March 31, 2012.
Q. How did the emerging market debt asset class perform over the reporting period?
A. Despite periods of volatility, the asset class generated strong results for the six-month reporting period. In general, emerging market debt was supported by solid growth in developing countries and overall solid demand. These factors more than offset periods of weakness triggered by fears that China’s economy would experience a hard landing, geopolitical issues and decelerating growth in many developed countries. Overall, the JPMorgan Emerging Markets Bond Index Global (“EMBI Global”)vii returned 10.24% over the six months ended March 31, 2012.
Performance review
For the six months ended March 31, 2012, Western Asset Variable Rate Strategic Fund Inc. returned 7.53% based on its net asset value (“NAV”)viii and 10.41% based on its New York Stock Exchange (“NYSE”) market price per share. The Fund’s unmanaged benchmark, the BofA Merrill Lynch Constant Maturity 3-Month LIBOR Indexix returned 0.23% over the same time frame. The Lipper Global Income Closed-End Funds Category Averagex returned 9.42% for the same period. Please note that Lipper performance returns are based on each fund’s NAV.
During this six-month period, the Fund made distributions to shareholders totaling $0.39 per share, which may have included a return of capital. The performance table shows the Fund’s six-month total return based on its NAV and market price as of March 31, 2012. Past performance is no guarantee of future results.
Performance Snapshot as of March 31, 2012 (unaudited)
Price Per Share | | 6-Month
Total Return* | |
$17.66 (NAV) | | 7.53%† | |
$16.62 (Market Price) | | 10.41%‡ | |
All figures represent past performance and are not a guarantee of future results. Performance figures for periods shorter than one year represent cumulative figures and are not annualized.
* Total returns are based on changes in NAV or market price, respectively.
† Total return assumes the reinvestment of all distributions, including returns of capital, if any, at NAV.
‡ Total return assumes the reinvestment of all distributions, including returns of capital, if any, in additional shares in accordance with the Fund’s Dividend Reinvestment Plan.
Looking for additional information?
The Fund is traded under the symbol “GFY” and its closing market price is available in most newspapers under the NYSE listings. The daily NAV is available on-line under the symbol “XGFYX” on most financial websites. Barron’s and the Wall Street Journal’s Monday edition both carry closed-end fund tables that provide additional information. In addition, the Fund issues a quarterly press release that can be found on most major financial websites as well as www.lmcef.com.
In a continuing effort to provide information concerning the Fund, shareholders may call 1-888-777-0102 (toll free), Monday through Friday from 8:00 a.m. to 5:30 p.m. Eastern Time, for the Fund’s current NAV, market price and other information.
VI | | Western Asset Variable Rate Strategic Fund Inc. | | |
Investment commentary (cont’d)
As always, thank you for your confidence in our stewardship of your assets.
Sincerely,
R. Jay Gerken, CFA
Chairman, President and
Chief Executive Officer
April 27, 2012
RISKS: The Fund is a non-diversified, closed-end management investment company designed primarily as a long term investment and not as a trading vehicle. The Fund is not intended to be a complete investment program and, due to the uncertainty inherent in all investments, there can be no assurance that the Fund will achieve its investment objective. Common shares at any point in time may be worth less than when invested, even after taking into account the reinvestment of Fund dividends and distributions. The Fund invests in fixed income securities which are subject to credit risks, including the risk of nonpayment of scheduled interest or loan payments, which could lower the Fund’s value. The Fund’s investments are subject to credit risk, inflation risk and interest rate risk. As interest rates rise, the value of a fixed-income portfolio generally declines, reducing the value of the Fund. However, the Fund can normally be expected to have less significant interest rate related fluctuations in its NAV than investment companies investing primarily in fixed-rate fixed-income securities (other than money market funds) because the floating or variable rate securities in which the Fund invests float in response to changes in prevailing market interest rates. The Fund may invest in high-yield and foreign securities, including emerging markets, which involve risks beyond those inherent solely in higher-rated and domestic investments. High-yield bonds involve greater credit and liquidity risks than investment grade bonds. Investing in foreign securities is subject to certain risks typically not associated with domestic investing, such as currency fluctuations and changes in political conditions. These risks are magnified in emerging or developing markets. Derivatives, such as options or futures, can be illiquid and hard to value, especially in declining markets. A small investment in certain derivatives may have a potentially large impact on Fund performance.
All investments are subject to risk including the possible loss of principal. Past performance is no guarantee of future results. All index performance reflects no deduction for fees, expenses or taxes. Please note that an investor cannot invest directly in an index.
The information provided is not intended to be a forecast of future events, a guarantee of future results or investment advice. Views expressed may differ from those of the firm as a whole.
| | Western Asset Variable Rate Strategic Fund Inc. | | VII |
i | Gross domestic product (“GDP”) is the market value of all final goods and services produced within a country in a given period of time. |
ii | The Institute for Supply Management’s PMI is based on a survey of purchasing executives who buy the raw materials for manufacturing at more than 350 companies. It offers an early reading on the health of the manufacturing sector. |
iii | The Federal Reserve Board (“Fed”) is responsible for the formulation of policies designed to promote economic growth, full employment, stable prices and a sustainable pattern of international trade and payments. |
iv | The federal funds rate is the rate charged by one depository institution on an overnight sale of immediately available funds (balances at the Federal Reserve) to another depository institution; the rate may vary from depository institution to depository institution and from day to day. |
v | The Barclays Capital U.S. Aggregate Index is a broad-based bond index comprised of government, corporate, mortgage- and asset-backed issues, rated investment grade or higher, and having at least one year to maturity. |
vi | The Barclays Capital U.S. High Yield — 2% Issuer Cap Index is an index of the 2% Issuer Cap component of the Barclays Capital U.S. Corporate High Yield Index, which covers the U.S. dollar-denominated, non-investment grade, fixed-rate, taxable corporate bond market. |
vii | The JPMorgan Emerging Markets Bond Index Global (“EMBI Global”) tracks total returns for U.S. dollar-denominated debt instruments issued by emerging market sovereign and quasi-sovereign entities: Brady bonds, loans, Eurobonds and local market instruments. |
viii | Net asset value (“NAV”) is calculated by subtracting total liabilities and outstanding preferred stock (if any) from the closing value of all securities held by the Fund (plus all other assets) and dividing the result (total net assets) by the total number of the common shares outstanding. The NAV fluctuates with changes in the market prices of securities in which the Fund has invested. However, the price at which an investor may buy or sell shares of the Fund is the Fund’s market price as determined by supply of and demand for the Fund’s shares. |
ix | The BofA Merrill Lynch Constant Maturity 3-Month LIBOR Index is based on the assumed purchase of a synthetic instrument having three months to maturity and with a coupon equal to the closing quote for three-month LIBOR. That issue is sold the following day (priced at a yield equal to the current day closing three-month LIBOR rate) and is rolled into a new three-month instrument. The Index, therefore, will always have a constant maturity equal to exactly three months. |
x | Lipper, Inc., a wholly-owned subsidiary of Reuters, provides independent insight on global collective investments. Returns are based on the six-month period ended March 31, 2012, including the reinvestment of all distributions, including returns of capital, if any, calculated among the 13 funds in the Fund’s Lipper category. |
(This Page Intentionally left blank.)
| | Western Asset Variable Rate Strategic Fund Inc. 2012 Semi-Annual Report | | 1 |
Fund at a glance† (unaudited)
Investment breakdown (%) as a percent of total investments
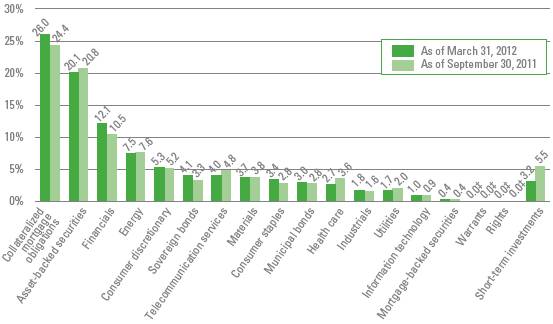
† The bar graph above represents the composition of the Fund’s investments as of March 31, 2012 and September 30, 2011. and does not include derivatives, such as future contracts, written options, forward foreign currency contracts and swap contracts. The Fund is actively managed. As a result, the composition of the Fund’s investments is subject to change at any time.
‡ Represents less than 0.1%.
2 | | Western Asset Variable Rate Strategic Fund Inc. 2012 Semi-Annual Report | | |
Spread duration (unaudited)
Economic exposure — March 31, 2012

Spread duration measures the sensitivity to changes in spreads. The spread over Treasuries is the annual risk premium demanded by investors to hold non-Treasury securities. Spread duration is quantified as the % change in price resulting from a 100 basis points change in spreads. For a security with positive spread duration, an increase in spreads would result in a price decline and a decline in spreads would result in a price increase. This chart highlights the market sector exposure of the Fund’s sectors relative to the selected benchmark sectors as of the end of the reporting period.
ABS | — Asset Backed Securities |
EM | — Emerging Markets |
GFY | — Western Asset Variable Rate Strategic Fund Inc. |
HY | — High Yield |
IG Credit | — Investment Grade Credit |
MBS | — Mortgage Backed Securities |
ML USD LIBOR | — BofA Merrill Lynch USD LIBOR 3-Month Constant Maturity |
| | Western Asset Variable Rate Strategic Fund Inc. 2012 Semi-Annual Report | | 3 |
Effective duration (unaudited)
Interest rate exposure — March 31, 2012
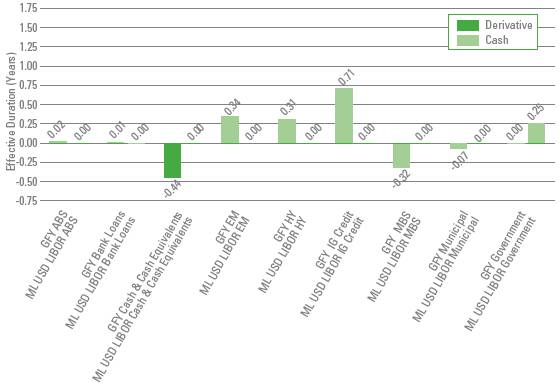
Effective duration measures the sensitivity to changes in relevant interest rates. Effective duration is quantified as the % change in price resulting from a 100 basis points change in interest rates. For a security with positive effective duration, an increase in interest rates would result in a price decline and a decline in interest rates would result in a price increase. This chart highlights the interest rate exposure of the Fund’s sectors relative to the selected benchmark sectors as of the end of the reporting period.
ABS | — Asset Backed Securities |
EM | — Emerging Markets |
GFY | — Western Asset Variable Rate Strategic Fund Inc. |
IG Credit | — Investment Grade Credit |
HY | — High Yield |
MBS | — Mortgage Backed Securities |
ML USD LIBOR | — BofA Merrill Lynch USD LIBOR 3-Month Constant Maturity |
4 | | Western Asset Variable Rate Strategic Fund Inc. 2012 Semi-Annual Report | | |
Schedule of investments (unaudited)
March 31, 2012
Western Asset Variable Rate Strategic Fund Inc.
Security | | Rate | | Maturity
Date | | | Face
Amount† | | Value | |
Corporate Bonds & Notes — 36.3% | | | | | | | | | |
Consumer Discretionary — 3.6% | | | | | | | | | |
Automobiles — 0.2% | | | | | | | | | |
Ford Motor Credit Co., LLC, Senior Notes | | 5.875 | % | 8/2/21 | | 250,000 | | $ | 270,135 | |
Consumer Finance — 0.1% | | | | | | | | | |
Abbey National Treasury Services PLC, Senior Notes | | 2.137 | % | 4/25/14 | | 180,000 | | 174,813 | (a) |
Diversified Consumer Services — 0.0% | | | | | | | | | |
Service Corp. International, Senior Notes | | 7.625 | % | 10/1/18 | | 30,000 | | 34,650 | |
Hotels, Restaurants & Leisure — 1.0% | | | | | | | | | |
Caesars Entertainment Operating Co. Inc., Senior Secured Notes | | 11.250 | % | 6/1/17 | | 175,000 | | 191,625 | |
Choctaw Resort Development Enterprise, Senior Notes | | 7.250 | % | 11/15/19 | | 218,000 | | 185,845 | (b) |
El Pollo Loco Inc., Secured Notes | | 17.000 | % | 1/1/18 | | 122,565 | | 111,075 | (b) |
Inn of the Mountain Gods Resort & Casino, Senior Secured Notes | | 8.750 | % | 11/30/20 | | 22,000 | | 21,615 | (b) |
Landry’s Acquisition Co., Secured Notes | | 11.625 | % | 12/1/15 | | 10,000 | | 11,187 | (b) |
Landry’s Restaurants Inc., Senior Secured Notes | | 11.625 | % | 12/1/15 | | 40,000 | | 44,750 | |
MGM Resorts International, Senior Notes | | 7.625 | % | 1/15/17 | | 230,000 | | 238,625 | |
MGM Resorts International, Senior Secured Notes | | 10.375 | % | 5/15/14 | | 20,000 | | 22,775 | |
MGM Resorts International, Senior Secured Notes | | 11.125 | % | 11/15/17 | | 55,000 | | 62,494 | |
Mohegan Tribal Gaming Authority, Senior Notes | | 11.000 | % | 9/15/18 | | 200,000 | | 148,000 | (b) |
NCL Corp. Ltd., Senior Secured Notes | | 11.750 | % | 11/15/16 | | 60,000 | | 69,750 | |
Snoqualmie Entertainment Authority, Senior Secured Notes | | 4.532 | % | 2/1/14 | | 10,000 | | 9,450 | (a)(b) |
Station Casinos Inc., Senior Subordinated Notes | | 6.875 | % | 3/1/16 | | 15,000 | | 0 | (c)(d)(e)(f) |
Total Hotels, Restaurants & Leisure | | | | | | | | 1,117,191 | |
Media — 1.9% | | | | | | | | | |
Cengage Learning Acquisitions Inc., Senior Notes | | 10.500 | % | 1/15/15 | | 40,000 | | 30,300 | (b) |
Comcast Corp., Senior Notes | | 6.500 | % | 1/15/17 | | 400,000 | | 479,095 | (g) |
DISH DBS Corp., Senior Notes | | 6.750 | % | 6/1/21 | | 400,000 | | 433,000 | |
Nara Cable Funding Ltd., Senior Secured Notes | | 8.875 | % | 12/1/18 | | 600,000 | | 573,000 | (b) |
News America Inc., Notes | | 5.300 | % | 12/15/14 | | 200,000 | | 221,397 | (g) |
Time Warner Cable Inc., Senior Notes | | 4.125 | % | 2/15/21 | | 400,000 | | 416,325 | |
UPC Holding BV, Senior Notes | | 9.875 | % | 4/15/18 | | 30,000 | | 33,300 | (b) |
Virgin Media Finance PLC, Senior Bonds | | 9.500 | % | 8/15/16 | | 25,000 | | 28,312 | |
Total Media | | | | | | | | 2,214,729 | |
Specialty Retail — 0.3% | | | | | | | | | |
Lowe’s Cos. Inc., Senior Notes | | 2.125 | % | 4/15/16 | | 300,000 | | 309,126 | (g) |
Textiles, Apparel & Luxury Goods — 0.1% | | | | | | | | | |
Oxford Industries Inc., Senior Secured Notes | | 11.375 | % | 7/15/15 | | 105,000 | | 113,794 | |
Total Consumer Discretionary | | | | | | | | 4,234,438 | |
| | | | | | | | | | | |
See Notes to Financial Statements.
| | Western Asset Variable Rate Strategic Fund Inc. 2012 Semi-Annual Report | | 5 |
Western Asset Variable Rate Strategic Fund Inc.
Security | | Rate | | Maturity
Date | | | Face
Amount† | | Value | |
Consumer Staples — 2.4% | | | | | | | | | |
Beverages — 0.4% | | | | | | | | | |
Anheuser-Busch InBev Worldwide Inc., Senior Notes | | 4.125 | % | 1/15/15 | | 90,000 | | $ | 97,586 | |
Anheuser-Busch InBev Worldwide Inc., Senior Notes | | 2.875 | % | 2/15/16 | | 300,000 | | 316,735 | |
Total Beverages | | | | | | | | 414,321 | |
Food & Staples Retailing — 0.9% | | | | | | | | | |
CVS Corp., Pass-through Certificates | | 6.117 | % | 1/10/13 | | 332,286 | | 341,839 | (b) |
Kroger Co., Notes | | 3.900 | % | 10/1/15 | | 360,000 | | 392,224 | (g) |
Wal-Mart Stores Inc., Senior Notes | | 2.800 | % | 4/15/16 | | 300,000 | | 319,355 | (g) |
Total Food & Staples Retailing | | | | | | | | 1,053,418 | |
Food Products — 0.4% | | | | | | | | | |
Kraft Foods Inc., Senior Notes | | 2.625 | % | 5/8/13 | | 260,000 | | 265,064 | (g) |
Kraft Foods Inc., Senior Notes | | 5.375 | % | 2/10/20 | | 200,000 | | 231,586 | |
Total Food Products | | | | | | | | 496,650 | |
Tobacco — 0.7% | | | | | | | | | |
Alliance One International Inc., Senior Notes | | 10.000 | % | 7/15/16 | | 70,000 | | 70,700 | |
Altria Group Inc., Senior Notes | | 9.250 | % | 8/6/19 | | 350,000 | | 471,323 | |
Reynolds American Inc., Senior Secured Notes | | 7.300 | % | 7/15/15 | | 270,000 | | 301,740 | |
Total Tobacco | | | | | | | | 843,763 | |
Total Consumer Staples | | | | | | | | 2,808,152 | |
Energy — 6.8% | | | | | | | | | |
Energy Equipment & Services — 0.4% | | | | | | | | | |
Hercules Offshore LLC, Senior Secured Notes | | 10.500 | % | 10/15/17 | | 60,000 | | 63,150 | (b) |
Key Energy Services Inc., Senior Notes | | 6.750 | % | 3/1/21 | | 350,000 | | 361,375 | |
Total Energy Equipment & Services | | | | | | | | 424,525 | |
Oil, Gas & Consumable Fuels — 6.4% | | | | | | | | | |
Anadarko Petroleum Corp., Senior Notes | | 7.625 | % | 3/15/14 | | 160,000 | | 178,496 | (g) |
Anadarko Petroleum Corp., Senior Notes | | 6.375 | % | 9/15/17 | | 240,000 | | 285,507 | |
Berry Petroleum Co., Senior Notes | | 10.250 | % | 6/1/14 | | 60,000 | | 69,600 | |
BP Capital Markets PLC, Senior Notes | | 3.125 | % | 10/1/15 | | 530,000 | | 560,658 | (g) |
Chesapeake Energy Corp., Senior Notes | | 7.250 | % | 12/15/18 | | 285,000 | | 305,663 | |
Chesapeake Energy Corp., Senior Notes | | 6.625 | % | 8/15/20 | | 150,000 | | 153,375 | |
CONSOL Energy Inc., Senior Notes | | 8.250 | % | 4/1/20 | | 160,000 | | 168,000 | |
Devon Energy Corp., Senior Notes | | 2.400 | % | 7/15/16 | | 400,000 | | 411,343 | (g) |
El Paso Corp., Medium-Term Notes | | 7.375 | % | 12/15/12 | | 194,000 | | 200,098 | |
Enterprise Products Operating LLC, Senior Notes | | 3.200 | % | 2/1/16 | | 450,000 | | 473,913 | (g) |
Enterprise Products Operating LLP, Junior Subordinated Notes | | 8.375 | % | 8/1/66 | | 80,000 | | 87,279 | (a) |
| | | | | | | | | | | |
See Notes to Financial Statements.
6 | | Western Asset Variable Rate Strategic Fund Inc. 2012 Semi-Annual Report | | |
Schedule of investments (unaudited) (cont’d)
March 31, 2012
Western Asset Variable Rate Strategic Fund Inc.
Security | | Rate | | Maturity
Date | | | Face
Amount† | | Value | |
Oil, Gas & Consumable Fuels — continued | | | | | | | | | |
Enterprise Products Operating LLP, Subordinated Notes | | 7.034 | % | 1/15/68 | | 120,000 | | $ | 129,154 | (a) |
Kinder Morgan Energy Partners LP, Senior Notes | | 6.000 | % | 2/1/17 | | 170,000 | | 196,152 | |
LUKOIL International Finance BV, Bonds | | 6.356 | % | 6/7/17 | | 210,000 | | 230,009 | (b) |
LUKOIL International Finance BV, Senior Notes | | 7.250 | % | 11/5/19 | | 240,000 | | 273,000 | (b) |
Petrobras International Finance Co., Senior Notes | | 3.875 | % | 1/27/16 | | 250,000 | | 264,401 | |
Petrobras International Finance Co., Senior Notes | | 5.750 | % | 1/20/20 | | 780,000 | | 867,984 | |
Plains Exploration & Production Co., Senior Notes | | 8.625 | % | 10/15/19 | | 40,000 | | 45,100 | |
Range Resources Corp., Senior Subordinated Notes | | 6.750 | % | 8/1/20 | | 550,000 | | 599,500 | |
SandRidge Energy Inc., Senior Notes | | 3.871 | % | 4/1/14 | | 1,000,000 | | 995,726 | (a) |
Shell International Finance BV, Senior Notes | | 3.100 | % | 6/28/15 | | 380,000 | | 407,070 | (g) |
Teekay Corp., Senior Notes | | 8.500 | % | 1/15/20 | | 110,000 | | 114,675 | |
TNK-BP Finance SA, Senior Notes | | 7.875 | % | 3/13/18 | | 200,000 | | 234,000 | (b) |
Williams Cos. Inc., Senior Notes | | 8.750 | % | 3/15/32 | | 229,000 | | 302,704 | |
Total Oil, Gas & Consumable Fuels | | | | | | | | 7,553,407 | |
Total Energy | | | | | | | | 7,977,932 | |
Financials — 12.9% | | | | | | | | | |
Capital Markets — 1.6% | | | | | | | | | |
Goldman Sachs Capital III, Preferred Securities | | 1.258 | % | 9/1/12 | | 550,000 | | 361,389 | (a)(h) |
Goldman Sachs Group Inc., Senior Notes | | 5.250 | % | 10/15/13 | | 340,000 | | 356,030 | (g) |
Morgan Stanley, Senior Notes | | 3.006 | % | 5/14/13 | | 310,000 | | 312,443 | (a) |
Morgan Stanley, Senior Notes | | 6.000 | % | 5/13/14 | | 400,000 | | 418,866 | |
UBS AG Stamford CT, Senior Notes | | 3.875 | % | 1/15/15 | | 400,000 | | 416,414 | (g) |
Total Capital Markets | | | | | | | | 1,865,142 | |
Commercial Banks — 3.6% | | | | | | | | | |
Barclays Bank PLC, Senior Notes | | 5.000 | % | 9/22/16 | | 200,000 | | 215,328 | |
BBVA US Senior SAU, Senior Notes | | 3.250 | % | 5/16/14 | | 400,000 | | 398,993 | |
Commonwealth Bank of Australia, Senior Notes | | 1.950 | % | 3/16/15 | | 370,000 | | 372,745 | |
Cooperatieve Centrale Raiffeisen- Boerenleenbank BA, Senior Notes | | 3.375 | % | 1/19/17 | | 250,000 | | 255,866 | |
Credit Agricole SA, Subordinated Notes | | 8.375 | % | 10/13/19 | | 420,000 | | 392,700 | (a)(b)(h) |
Danske Bank A/S, Senior Notes | | 1.617 | % | 4/14/14 | | 300,000 | | 295,185 | (a)(b) |
Intesa Sanpaolo SpA, Senior Notes | | 3.625 | % | 8/12/15 | | 140,000 | | 133,852 | (b) |
Lloyds TSB Bank PLC, Medium-Term Notes, Senior Bonds | | 4.375 | % | 1/12/15 | | 180,000 | | 184,641 | (b) |
Lloyds TSB Bank PLC, Senior Notes | | 6.375 | % | 1/21/21 | | 280,000 | | 301,061 | |
Rabobank Nederland NV, Junior Subordinated Notes | | 11.000 | % | 6/30/19 | | 260,000 | | 331,876 | (a)(b)(h) |
Royal Bank of Scotland PLC, Senior Notes | | 4.875 | % | 3/16/15 | | 270,000 | | 280,846 | |
Wachovia Capital Trust III, Junior Subordinated Bonds | | 5.570 | % | 5/14/12 | | 300,000 | | 284,625 | (a)(h) |
| | | | | | | | | | | |
See Notes to Financial Statements.
| | Western Asset Variable Rate Strategic Fund Inc. 2012 Semi-Annual Report | | 7 |
Western Asset Variable Rate Strategic Fund Inc.
Security | | Rate | | Maturity
Date | | | Face
Amount† | | Value | |
Commercial Banks — continued | | | | | | | | | |
Wells Fargo & Co., Senior Notes | | 3.750 | % | 10/1/14 | | 450,000 | | $ | 476,910 | |
Wells Fargo & Co., Senior Notes | | 3.676 | % | 6/15/16 | | 250,000 | | 267,239 | (g) |
Total Commercial Banks | | | | | | | | 4,191,867 | |
Consumer Finance — 4.0% | | | | | | | | | |
Ally Financial Inc., Senior Notes | | 6.750 | % | 12/1/14 | | 307,000 | | 323,118 | |
Ally Financial Inc., Senior Notes | | 8.000 | % | 3/15/20 | | 280,000 | | 312,200 | |
American Express Co., Senior Notes | | 8.125 | % | 5/20/19 | | 450,000 | | 589,118 | |
GMAC Inc., Senior Notes | | 2.688 | % | 12/1/14 | | 1,956,000 | | 1,856,354 | (a) |
HSBC Finance Corp., Senior Notes | | 6.676 | % | 1/15/21 | | 500,000 | | 534,607 | |
SLM Corp. | | 0.860 | % | 1/27/14 | | 700,000 | | 668,895 | (a) |
Toyota Motor Credit Corp., Senior Notes | | 2.000 | % | 9/15/16 | | 400,000 | | 408,624 | |
Total Consumer Finance | | | | | | | | 4,692,916 | |
Diversified Financial Services — 3.4% | | | | | | | | | |
Air 2 US, Notes | | 8.027 | % | 10/1/19 | | 82,816 | | 82,402 | (b) |
Bank of America Corp., Senior Notes | | 3.750 | % | 7/12/16 | | 600,000 | | 603,581 | |
CDP Financial Inc., Senior Notes | | 3.000 | % | 11/25/14 | | 300,000 | | 314,293 | (b) |
Chukchansi Economic Development Authority, Senior Notes | | 4.159 | % | 11/15/12 | | 250,000 | | 180,000 | (a)(b) |
Citigroup Inc., Senior Notes | | 6.375 | % | 8/12/14 | | 850,000 | | 922,761 | (g) |
Citigroup Inc., Senior Notes | | 5.500 | % | 10/15/14 | | 120,000 | | 128,826 | (g) |
General Electric Capital Corp., Senior Notes | | 2.950 | % | 5/9/16 | | 550,000 | | 574,270 | (g) |
International Lease Finance Corp., Senior Notes | | 8.750 | % | 3/15/17 | | 490,000 | | 546,350 | |
JPMorgan Chase & Co., Senior Notes | | 3.150 | % | 7/5/16 | | 550,000 | | 567,538 | (g) |
Unitymedia GmbH, Senior Secured Bonds | | 8.125 | % | 12/1/17 | | 100,000 | | 108,500 | (b) |
Total Diversified Financial Services | | | | | | | | 4,028,521 | |
Insurance — 0.1% | | | | | | | | | |
American International Group Inc., Senior Notes | | 3.750 | % | 11/30/13 | | 170,000 | | 172,031 | (b) |
Thrifts & Mortgage Finance — 0.2% | | | | | | | | | |
Santander Holdings USA Inc., Senior Notes | | 4.625 | % | 4/19/16 | | 240,000 | | 243,421 | |
Total Financials | | | | | | | | 15,193,898 | |
Health Care — 1.0% | | | | | | | | | |
Health Care Providers & Services — 1.0% | | | | | | | | | |
Community Health Systems Inc., Senior Notes | | 8.875 | % | 7/15/15 | | 30,000 | | 31,125 | |
Humana Inc., Senior Notes | | 6.450 | % | 6/1/16 | | 300,000 | | 341,461 | |
McKesson Corp., Senior Notes | | 3.250 | % | 3/1/16 | | 300,000 | | 321,662 | (g) |
Tenet Healthcare Corp., Senior Secured Notes | | 8.875 | % | 7/1/19 | | 326,000 | | 366,750 | |
Universal Hospital Services Inc., Senior Secured Notes | | 8.500 | % | 6/1/15 | | 10,000 | | 10,287 | (a) |
Vanguard Health Holdings Co., II LLC, Senior Notes | | 8.000 | % | 2/1/18 | | 80,000 | | 82,000 | |
Total Health Care | | | | | | | | 1,153,285 | |
| | | | | | | | | | | |
See Notes to Financial Statements.
8 | | Western Asset Variable Rate Strategic Fund Inc. 2012 Semi-Annual Report | | |
Schedule of investments (unaudited) (cont’d)
March 31, 2012
Western Asset Variable Rate Strategic Fund Inc.
Security | | Rate | | Maturity
Date | | | Face
Amount† | | Value | |
Industrials — 1.6% | | | | | | | | | |
Airlines — 0.2% | | | | | | | | | |
DAE Aviation Holdings Inc., Senior Notes | | 11.250 | % | 8/1/15 | | 160,000 | | $ | 167,600 | (b) |
Delta Air Lines Inc., Pass-Through Certificates, Secured Notes | | 8.021 | % | 8/10/22 | | 61,145 | | 62,288 | |
Delta Air Lines Inc., Senior Secured Notes | | 9.500 | % | 9/15/14 | | 24,000 | | 25,680 | (b) |
Total Airlines | | | | | | | | 255,568 | |
Building Products — 0.0% | | | | | | | | | |
Ashton Woods USA LLC/Ashton Woods Finance Co., Senior Subordinated Notes | | 11.000 | % | 6/30/15 | | 7,800 | | 6,474 | (b)(e) |
Commercial Services & Supplies — 0.5% | | | | | | | | | |
ACCO Brands Corp., Senior Secured Notes | | 10.625 | % | 3/15/15 | | 80,000 | | 87,501 | |
Altegrity Inc., Senior Subordinated Notes | | 10.500 | % | 11/1/15 | | 120,000 | | 114,600 | (b) |
RSC Equipment Rental Inc./RSC Holdings III LLC, Senior Secured Notes | | 10.000 | % | 7/15/17 | | 80,000 | | 92,800 | (b) |
Waste Management Inc., Senior Notes | | 2.600 | % | 9/1/16 | | 300,000 | | 307,722 | |
Total Commercial Services & Supplies | | | | | | | | 602,623 | |
Construction & Engineering — 0.5% | | | | | | | | | |
Odebrecht Finance Ltd., Senior Notes | | 6.000 | % | 4/5/23 | | 580,000 | | 605,694 | (b) |
Industrial Conglomerates — 0.1% | | | | | | | | | |
Leucadia National Corp., Senior Notes | | 8.125 | % | 9/15/15 | | 80,000 | | 90,000 | |
Road & Rail — 0.2% | | | | | | | | | |
Kansas City Southern de Mexico, Senior Notes | | 12.500 | % | 4/1/16 | | 163,000 | | 189,487 | |
RailAmerica Inc., Senior Secured Notes | | 9.250 | % | 7/1/17 | | 10,000 | | 10,588 | |
Total Road & Rail | | | | | | | | 200,075 | |
Trading Companies & Distributors — 0.1% | | | | | | | | | |
Ashtead Capital Inc., Notes | | 9.000 | % | 8/15/16 | | 50,000 | | 52,438 | (b) |
H&E Equipment Services Inc., Senior Notes | | 8.375 | % | 7/15/16 | | 95,000 | | 98,325 | |
Total Trading Companies & Distributors | | | | | | | | 150,763 | |
Total Industrials | | | | | | | | 1,911,197 | |
Information Technology — 0.1% | | | | | | | | | |
Semiconductors & Semiconductor Equipment — 0.1% | | | | | | | | | |
Freescale Semiconductor Inc., Senior Secured Notes | | 9.250 | % | 4/15/18 | | 130,000 | | 143,000 | (b) |
Materials — 3.2% | | | | | | | | | |
Containers & Packaging — 0.2% | | | | | | | | | |
Reynolds Group Issuer Inc./ Reynolds Group Issuer LLC, Senior Secured Notes | | 7.125 | % | 4/15/19 | | 250,000 | | 261,875 | (b) |
Metals & Mining — 2.7% | | | | | | | | | |
ArcelorMittal, Senior Notes | | 3.750 | % | 2/25/15 | | 350,000 | | 355,938 | |
ArcelorMittal, Senior Notes | | 3.750 | % | 8/5/15 | | 50,000 | | 50,828 | |
Barrick Gold Corp., Senior Notes | | 1.750 | % | 5/30/14 | | 250,000 | | 253,221 | |
| | | | | | | | | | | |
See Notes to Financial Statements.
| | Western Asset Variable Rate Strategic Fund Inc. 2012 Semi-Annual Report | | 9 |
Western Asset Variable Rate Strategic Fund Inc.
Security | | Rate | | Maturity
Date | | | Face
Amount† | | Value | |
Metals & Mining — continued | | | | | | | | | |
Barrick International Barbados Corp., Senior Notes | | 5.750 | % | 10/15/16 | | 200,000 | | $ | 229,367 | (b)(g) |
Cliffs Natural Resources Inc., Senior Notes | | 4.875 | % | 4/1/21 | | 300,000 | | 311,322 | |
Metals USA Inc., Senior Secured Notes | | 11.125 | % | 12/1/15 | | 150,000 | | 156,750 | |
Rio Tinto Finance USA Ltd., Senior Notes | | 2.500 | % | 5/20/16 | | 500,000 | | 518,728 | (g) |
Steel Dynamics Inc., Senior Notes | | 7.625 | % | 3/15/20 | | 370,000 | | 402,375 | |
Teck Resources Ltd., Senior Secured Notes | | 10.250 | % | 5/15/16 | | 23,000 | | 26,360 | |
Vale Overseas Ltd., Notes | | 6.250 | % | 1/23/17 | | 338,000 | | 391,210 | |
Vedanta Resources PLC, Senior Notes | | 8.750 | % | 1/15/14 | | 390,000 | | 404,625 | (b) |
Vedanta Resources PLC, Senior Notes | | 8.750 | % | 1/15/14 | | 70,000 | | 72,625 | (b) |
Total Metals & Mining | | | | | | | | 3,173,349 | |
Paper & Forest Products — 0.3% | | | | | | | | | |
Appleton Papers Inc., Senior Secured Notes | | 11.250 | % | 12/15/15 | | 199,000 | | 185,567 | |
NewPage Corp., Senior Secured Notes | | 11.375 | % | 12/31/14 | | 205,000 | | 138,375 | (c) |
Total Paper & Forest Products | | | | | | | | 323,942 | |
Total Materials | | | | | | | | 3,759,166 | |
Telecommunication Services — 3.3% | | | | | | | | | |
Diversified Telecommunication Services — 2.2% | | | | | | | | | |
Axtel SAB de CV, Senior Notes | | 7.625 | % | 2/1/17 | | 377,000 | | 309,140 | (b) |
CC Holdings GS V LLC, Senior Secured Notes | | 7.750 | % | 5/1/17 | | 150,000 | | 164,250 | (b) |
Cincinnati Bell Telephone Co., Senior Debentures | | 6.300 | % | 12/1/28 | | 45,000 | | 36,225 | |
Deutsche Telekom International Finance BV, Senior Notes | | 4.875 | % | 7/8/14 | | 300,000 | | 321,359 | (g) |
Deutsche Telekom International Finance BV, Senior Notes | | 5.750 | % | 3/23/16 | | 140,000 | | 158,239 | |
Intelsat Jackson Holdings Ltd., Senior Notes | | 9.500 | % | 6/15/16 | | 40,000 | | 41,900 | |
Intelsat Jackson Holdings Ltd., Senior Notes | | 8.500 | % | 11/1/19 | | 140,000 | | 154,000 | |
Qwest Corp., Senior Notes | | 3.724 | % | 6/15/13 | | 250,000 | | 254,161 | (a) |
Telecom Italia Capital, Senior Notes | | 5.250 | % | 10/1/15 | | 320,000 | | 331,200 | |
Telefonica Emisiones SAU, Senior Notes | | 5.855 | % | 2/4/13 | | 210,000 | | 217,164 | (g) |
Telefonica Emisiones SAU, Senior Notes | | 3.992 | % | 2/16/16 | | 230,000 | | 229,135 | |
Verizon Communications Inc., Senior Notes | | 4.600 | % | 4/1/21 | | 300,000 | | 333,509 | |
Total Diversified Telecommunication Services | | | | | | | | 2,550,282 | |
Wireless Telecommunication Services — 1.1% | | | | | | | | | |
Cricket Communications Inc., Senior Secured Notes | | 7.750 | % | 5/15/16 | | 125,000 | | 132,500 | |
Rogers Cable Inc., Senior Secured Second Priority Notes | | 6.750 | % | 3/15/15 | | 300,000 | | 342,538 | (g) |
Sprint Capital Corp., Senior Notes | | 6.875 | % | 11/15/28 | | 650,000 | | 500,500 | |
Vodafone Group PLC, Senior Notes | | 5.000 | % | 12/16/13 | | 266,000 | | 284,575 | (g) |
Total Wireless Telecommunication Services | | | | | | | | 1,260,113 | |
Total Telecommunication Services | | | | | | | | 3,810,395 | |
| | | | | | | | | | | |
See Notes to Financial Statements.
10 | | Western Asset Variable Rate Strategic Fund Inc. 2012 Semi-Annual Report | | |
Schedule of investments (unaudited) (cont’d)
March 31, 2012
Western Asset Variable Rate Strategic Fund Inc.
Security | | Rate | | Maturity
Date | | | Face
Amount† | | Value | |
Utilities — 1.4% | | | | | | | | | |
Electric Utilities — 0.3% | | | | | | | | | |
Edison International, Senior Notes | | 3.750 | % | 9/15/17 | | 300,000 | | $ | 315,124 | |
Independent Power Producers & Energy Traders — 0.8% | | | | | | | | | |
Calpine Corp., Senior Secured Notes | | 7.500 | % | 2/15/21 | | 280,000 | | 300,300 | (b) |
Edison Mission Energy, Senior Notes | | 7.750 | % | 6/15/16 | | 180,000 | | 125,100 | |
Energy Future Intermediate Holding Co. LLC/ EFIH Finance Inc., Senior Secured Notes | | 10.000 | % | 12/1/20 | | 459,000 | | 502,605 | |
Total Independent Power Producers & Energy Traders | | | | | | | | 928,005 | |
Multi-Utilities — 0.3% | | | | | | | | | |
Dominion Resources Inc., Senior Notes | | 1.950 | % | 8/15/16 | | 400,000 | | 405,926 | (g) |
Total Utilities | | | | | | | | 1,649,055 | |
Total Corporate Bonds & Notes (Cost — $41,067,501) | | | | | | | | 42,640,518 | |
Asset-Backed Securities — 21.5% | | | | | | | | | |
ABFS Mortgage Loan Trust, 2002-3 M1 | | 5.902 | % | 9/15/33 | | 860,936 | | 599,994 | |
Access Group Inc., 2005-2 A3 | | 0.673 | % | 11/22/24 | | 600,000 | | 578,453 | (a) |
Access Group Inc., 2005-B A2 | | 0.790 | % | 7/25/22 | | 355,199 | | 344,417 | (a) |
AmeriCredit Automobile Receivables Trust, 2011-2 A2 | | 0.900 | % | 9/8/14 | | 270,599 | | 270,885 | |
Ameriquest Mortgage Securities Inc., 2002-AR1 M1 | | 1.315 | % | 9/25/32 | | 228,847 | | 185,888 | (a) |
Ameriquest Mortgage Securities Inc., 2005-R1 M1 | | 0.692 | % | 3/25/35 | | 800,000 | | 727,607 | (a) |
Argent Securities Inc., 2003-W3 M1 | | 1.367 | % | 9/25/33 | | 139,297 | | 127,768 | (a) |
Argent Securities Inc., 2005-W3 A2D | | 0.582 | % | 11/25/35 | | 700,000 | | 438,310 | (a) |
Bear Stearns Asset-Backed Securities Trust, 2001-3 A1 | | 1.142 | % | 10/27/32 | | 32,608 | | 27,628 | (a) |
Bear Stearns Asset-Backed Securities Trust, 2005-SD3 1A | | 0.732 | % | 7/25/35 | | 640,513 | | 485,937 | (a) |
Bear Stearns Asset-Backed Securities Trust, 2007-SD1 1A2A | | 6.000 | % | 10/25/36 | | 1,049,866 | | 753,273 | |
Brazos Higher Education Authority Inc., 2011-1 A3 | | 1.541 | % | 11/25/33 | | 400,000 | | 377,221 | (a) |
Chase Funding Mortgage Loan Asset-Backed Certificates, 2004-1 1A7 | | 3.985 | % | 11/25/33 | | 603,704 | | 540,350 | |
Citigroup Mortgage Loan Trust Inc., 2005-OPT1 M1 | | 0.662 | % | 2/25/35 | | 244,419 | | 198,187 | (a) |
Citigroup Mortgage Loan Trust Inc., 2005-OPT4 M2 | | 0.672 | % | 7/25/35 | | 750,000 | | 641,798 | (a) |
Countrywide Asset-Backed Certificates, 2003-5 AF5 | | 5.977 | % | 2/25/34 | | 631,145 | | 604,399 | |
Countrywide Asset-Backed Certificates, 2004-BC1 M1 | | 0.992 | % | 2/25/34 | | 144,870 | | 113,314 | (a) |
Countrywide Asset-Backed Certificates, 2007-13 2A1 | | 1.142 | % | 10/25/47 | | 842,297 | | 576,667 | (a) |
Countrywide Home Equity Loan Trust, 2006-HW 2A1B | | 0.392 | % | 11/15/36 | | 936,577 | | 689,680 | (a) |
Credit-Based Asset Servicing and Securitization LLC, 2007-SP1 A4 | | 6.020 | % | 12/25/37 | | 600,000 | | 488,135 | (b) |
EMC Mortgage Loan Trust, 2004-C A1 | | 0.792 | % | 3/25/31 | | 191,526 | | 157,901 | (a)(b) |
| | | | | | | | | | | |
See Notes to Financial Statements.
| | Western Asset Variable Rate Strategic Fund Inc. 2012 Semi-Annual Report | | 11 |
Western Asset Variable Rate Strategic Fund Inc.
Security | | Rate | | Maturity
Date | | | Face
Amount† | | Value | |
Asset-Backed Securities — continued | | | | | | | | | |
Equity One ABS Inc., 2004-1 AF5 | | 5.110 | % | 4/25/34 | | 300,000 | | $ | 289,274 | |
First Franklin Mortgage Loan Asset-Backed Certificates, 2005-FFH4 2A4 | | 0.592 | % | 12/25/35 | | 328,571 | | 305,661 | (a) |
First Horizon ABS Trust, 2007-HE1 A | | 0.372 | % | 9/25/29 | | 111,180 | | 82,025 | (a) |
Greenpoint Home Equity Loan Trust, 2004-4 A | | 0.802 | % | 8/15/30 | | 480,136 | | 300,541 | (a) |
Greenpoint Manufactured Housing, 1999-3 1A7 | | 7.270 | % | 6/15/29 | | 230,000 | | 216,698 | |
Greenpoint Manufactured Housing, 2000-4 A3 | | 2.246 | % | 8/21/31 | | 500,000 | | 430,939 | (a) |
GSAMP Trust, 2004-OPT B1 | | 1.842 | % | 11/25/34 | | 89,456 | | 37,346 | (a) |
GSRPM Mortgage Loan Trust, 2007-1 A | | 0.642 | % | 10/25/46 | | 141,314 | | 62,856 | (a)(b) |
Hertz Vehicle Financing LLC, 2009-2A A1 | | 4.260 | % | 3/25/14 | | 630,000 | | 645,469 | (b) |
Home Equity Mortgage Trust, 2006-2 2A1 | | 0.402 | % | 7/25/36 | | 577,418 | | 194,541 | (a) |
IXIS Real Estate Capital Trust, 2005-HE4 A3 | | 0.582 | % | 2/25/36 | | 173,596 | | 148,562 | (a) |
John Deere Owner Trust, 2011-A A2 | | 0.640 | % | 6/16/14 | | 488,294 | | 488,544 | |
Lehman XS Trust, (Structured Asset Securities Corp.), 2005-1 2A2 | | 1.742 | % | 7/25/35 | | 1,047,069 | | 662,870 | (a) |
Lehman XS Trust, 2005-5N 3A1A | | 0.542 | % | 11/25/35 | | 375,588 | | 257,493 | (a) |
Long Beach Mortgage Loan Trust, 2001-3 M1 | | 1.067 | % | 9/25/31 | | 234,371 | | 146,732 | (a) |
Long Beach Mortgage Loan Trust, 2002-1 2M1 | | 1.367 | % | 5/25/32 | | 549,899 | | 410,448 | (a) |
MASTR Asset-Backed Securities Trust, 2005-AB1 A5A | | 5.712 | % | 11/25/35 | | 720,000 | | 257,945 | |
MASTR Specialized Loan Trust, 2007-1 A | | 0.612 | % | 1/25/37 | | 507,245 | | 176,036 | (a)(b) |
Merrill Lynch Mortgage Investors Trust, 2007-SD1 A1 | | 0.692 | % | 2/25/47 | | 1,119,367 | | 500,161 | (a) |
Morgan Stanley ABS Capital I, 2007-NC2 M1 | | 0.612 | % | 2/25/37 | | 1,100,000 | | 5,601 | (a) |
Morgan Stanley ABS Capital I, 2007-NC2 M2 | | 0.662 | % | 2/25/37 | | 164,571 | | 135 | (a) |
Morgan Stanley Capital Inc., 2003-NC9 M | | 1.367 | % | 9/25/33 | | 1,267,135 | | 916,823 | (a) |
Morgan Stanley Capital Inc., 2004-HE8 A7 | | 0.772 | % | 9/25/34 | | 74,135 | | 57,151 | (a) |
National Collegiate Student Loan Trust, IO, 2007-2 AIO | | 6.700 | % | 7/25/12 | | 4,074,107 | | 132,408 | (d) |
New Century Home Equity Loan Trust, 2004-3 M1 | | 1.172 | % | 11/25/34 | | 638,898 | | 438,552 | (a) |
Nissan Auto Receivables Owner Trust, 2011-A A2 | | 0.650 | % | 12/16/13 | | 226,946 | | 227,426 | |
Nissan Auto Receivables Owner Trust, 2011-A A3 | | 1.180 | % | 2/16/15 | | 300,000 | | 302,443 | |
Option One Mortgage Loan Trust, 2005-1 A4 | | 0.642 | % | 2/25/35 | | 198,204 | | 172,805 | (a) |
Origen Manufactured Housing, 2007-A A2 | | 3.748 | % | 4/15/37 | | 854,433 | | 487,027 | (a) |
Park Place Securities Inc., 2004-WHQ2 M2 | | 0.872 | % | 2/25/35 | | 750,000 | | 642,082 | (a) |
People’s Choice Home Loan Securities Trust, 2004-2 M1 | | 1.142 | % | 10/25/34 | | 189,548 | | 152,930 | (a) |
RAAC Series, 2006-RP2 A | | 0.492 | % | 2/25/37 | | 268,435 | | 230,884 | (a)(b) |
RAAC Series, 2006-RP3 A | | 0.512 | % | 5/25/36 | | 1,079,929 | | 696,288 | (a)(b) |
RAAC Series, 2006-RP4 A | | 0.532 | % | 1/25/46 | | 589,460 | | 452,624 | (a)(b) |
RAAC Series, 2007-RP3 M1 | | 1.042 | % | 10/25/46 | | 1,200,000 | | 57,107 | (a)(b) |
| | | | | | | | | | | |
See Notes to Financial Statements.
12 | | Western Asset Variable Rate Strategic Fund Inc. 2012 Semi-Annual Report |
Schedule of investments (unaudited) (cont’d)
March 31, 2012
Western Asset Variable Rate Strategic Fund Inc.
Security | | Rate | | Maturity
Date | | Face
Amount† | | Value | |
Asset-Backed Securities — continued | | | | | | | | | |
RAAC Series, 2007-RP4 A | | 0.592 | % | 11/25/46 | | 1,074,160 | | $ | 541,523 | (a)(b) |
Renaissance Home Equity Loan Trust, 2003-1 A | | 1.102 | % | 6/25/33 | | 223,133 | | 176,044 | (a) |
Renaissance Home Equity Loan Trust, 2003-2 A | | 0.682 | % | 8/25/33 | | 166,334 | | 138,086 | (a) |
Renaissance Net Interest Margin Trust, 2007-2 N | | 8.353 | % | 6/25/37 | | 128,633 | | 1 | (b)(e) |
Residential Asset Mortgage Products Inc., 2003-RS7 MII1 | | 1.367 | % | 8/25/33 | | 48,409 | | 27,968 | (a) |
Residential Asset Mortgage Products Inc., 2003-RZ4 A7 | | 4.790 | % | 6/25/33 | | 186,556 | | 188,549 | |
Residential Asset Mortgage Products Inc., 2004-RZ3 MII2 | | 1.892 | % | 9/25/34 | | 400,000 | | 296,206 | (a) |
SACO I Trust, 2005-WM3 A3 | | 0.942 | % | 9/25/35 | | 221,142 | | 92,702 | (a) |
SACO I Trust, 2006-3 A3 | | 0.702 | % | 4/25/36 | | 436,668 | | 206,288 | (a) |
SACO I Trust, 2006-4 A1 | | 0.582 | % | 3/25/36 | | 475,203 | | 229,195 | (a) |
Sail Net Interest Margin Notes, 2004-2A A | | 5.500 | % | 3/27/34 | | 107,070 | | 1 | (b)(e) |
SLM Student Loan Trust, 2003-01 A5C | | 1.224 | % | 12/15/32 | | 475,450 | | 451,009 | (a)(b) |
SLM Student Loan Trust, 2003-04 A5A | | 1.224 | % | 3/15/33 | | 204,247 | | 195,280 | (a)(b) |
SLM Student Loan Trust, 2003-04 A5E | | 1.224 | % | 3/15/33 | | 542,250 | | 519,904 | (a)(b) |
Soundview Home Equity Loan Trust, 2005-3 M2 | | 1.022 | % | 6/25/35 | | 282,413 | | 268,003 | (a) |
Structured Asset Investment Loan Trust, 2004-9 M4 | | 2.192 | % | 10/25/34 | | 149,685 | | 35,186 | (a) |
Structured Asset Securities Corp., 2003-AL1 A | | 3.357 | % | 4/25/31 | | 137,903 | | 133,813 | (b) |
Structured Asset Securities Corp., 2004-6XS A5B | | 5.550 | % | 3/25/34 | | 584,579 | | 587,735 | |
Structured Asset Securities Corp., 2005-4XS 2A1A | | 1.992 | % | 3/25/35 | | 566,423 | | 444,927 | (a) |
Structured Asset Securities Corp., 2005-SC1 1A1 | | 0.512 | % | 5/25/31 | | 793,636 | | 355,113 | (a)(b) |
Structured Asset Securities Corp., 2005-WF1 A3 | | 0.572 | % | 2/25/35 | | 292,551 | | 243,809 | (a) |
Structured Asset Securities Corp., 2006-GEL1 A2 | | 0.592 | % | 11/25/35 | | 421,081 | | 383,965 | (a)(b) |
Structured Asset Securities Corp., 2007-BC3 2A3 | | 0.422 | % | 5/25/47 | | 290,000 | | 79,461 | (a) |
Vanderbilt Mortgage Finance, 2000-B IB2 | | 9.250 | % | 7/7/30 | | 201,165 | | 202,998 | (a) |
Total Asset-Backed Securities (Cost — $30,258,815) | | | | | | | | 25,312,005 | |
Collateralized Mortgage Obligations — 27.8% | | | | | | | | | |
Adjustable Rate Mortgage Trust, 2005-11 5A1 | | 0.512 | % | 2/25/36 | | 260,070 | | 146,839 | (a) |
Banc of America Funding Corp., 2003-1 A1 | | 6.000 | % | 5/20/33 | | 198,877 | | 209,724 | |
Banc of America Funding Corp., 2004-B 6A1 | | 2.949 | % | 12/20/34 | | 786,396 | | 454,366 | (a) |
Banc of America Funding Corp., 2005-E 8A1 | | 2.651 | % | 6/20/35 | | 668,035 | | 351,467 | (a) |
Bayview Commercial Asset Trust, 2006-1A B2 | | 1.942 | % | 4/25/36 | | 978,409 | | 264,015 | (a)(b) |
Bear Stearns Alt-A Trust, 2004-03 A1 | | 0.882 | % | 4/25/34 | | 702,972 | | 620,135 | (a) |
Bear Stearns Alt-A Trust, 2004-10 1A3 | | 1.242 | % | 9/25/34 | | 158,103 | | 141,012 | (a) |
Bear Stearns ARM Trust, 2004-08 11A1 | | 2.702 | % | 11/25/34 | | 571,190 | | 531,787 | (a) |
Bear Stearns Asset-Backed Securities Trust, 2005-AC3 1A1 | | 0.742 | % | 7/25/35 | | 770,870 | | 508,672 | (a) |
Countrywide Alternative Loan Trust, 2005-24 4A1 | | 0.472 | % | 7/20/35 | | 765,559 | | 460,506 | (a) |
| | | | | | | | | | |
See Notes to Financial Statements.
Western Asset Variable Rate Strategic Fund Inc. 2012 Semi-Annual Report | | 13 |
Western Asset Variable Rate Strategic Fund Inc.
Security | | Rate | | Maturity
Date | | Face
Amount† | | Value | |
Collateralized Mortgage Obligations — continued | | | | | | | | | |
Countrywide Home Loan, Mortgage Pass-Through Trust, 2004-29 2A1 | | 0.572 | % | 2/25/35 | | 71,839 | | $ | 46,501 | (a) |
Countrywide Home Loans, 2004-20 2A1 | | 2.844 | % | 9/25/34 | | 779,510 | | 521,536 | (a) |
Countrywide Home Loans, 2004-R1 2A | | 6.500 | % | 11/25/34 | | 158,351 | | 161,962 | (b) |
Countrywide Home Loans, 2005-HYB9 3A1A | | 2.548 | % | 2/20/36 | | 1,012,305 | | 712,427 | (a) |
Countrywide Home Loans, 2005-R2 2A1 | | 7.000 | % | 6/25/35 | | 363,205 | | 355,549 | (b) |
Countrywide Home Loans, 2005-R3 AF | | 0.642 | % | 9/25/35 | | 577,489 | | 481,060 | (a)(b) |
Countrywide Home Loans, 2006-R2 AF1 | | 0.662 | % | 7/25/36 | | 283,752 | | 243,072 | (a)(b) |
Countrywide Home Loans Mortgage Pass-Through Trust, 2005-R1 1AF1 | | 0.602 | % | 3/25/35 | | 505,918 | | 398,193 | (a)(b) |
Deutsche Mortgage Securities Inc., 2004-4 3AR1 | | 2.839 | % | 6/25/34 | | 374,141 | | 298,783 | (a) |
Downey Savings & Loan Association Mortgage Loan Trust, 2005-AR5 2A1A | | 0.572 | % | 8/19/45 | | 736,851 | | 458,973 | (a) |
Downey Savings & Loan Association Mortgage Loan Trust, 2006-AR1 1A1A | | 1.079 | % | 3/19/46 | | 427,498 | | 214,762 | (a) |
Federal Home Loan Mortgage Corp. (FHLMC), PAC IO | | 5.000 | % | 1/15/19 | | 936,418 | | 34,463 | |
Federal Home Loan Mortgage Corp. (FHLMC), PAC IO, 2638 DI | | 5.000 | % | 5/15/23 | | 1,106,438 | | 98,761 | |
Federal Home Loan Mortgage Corp. (FHLMC), PAC-1 IO | | 5.000 | % | 3/15/22 | | 1,507,141 | | 86,730 | |
Federal National Mortgage Association (FNMA), STRIPS, IO | | 5.000 | % | 7/1/33 | | 4,562,609 | | 699,871 | |
Federal National Mortgage Association (FNMA), STRIPS, IO, 339 30 | | 5.500 | % | 7/1/18 | | 1,461,519 | | 149,645 | (a) |
Granite Mortgages PLC, 2003-2 1A3 | | 1.061 | % | 7/20/43 | | 64,542 | | 62,880 | (a)(b) |
Granite Mortgages PLC, 2004-1 2A1 | | 0.794 | % | 3/20/44 | | 110,827 | | 107,142 | (a) |
Granite Mortgages PLC, 2004-3 2A1 | | 0.754 | % | 9/20/44 | | 42,148 | | 40,840 | (a) |
GSMPS Mortgage Loan Trust, 2005-LT1 A1 | | 0.472 | % | 2/25/35 | | 211,742 | | 165,688 | (a)(b)(d) |
GSMPS Mortgage Loan Trust, 2005-RP2 1AF | | 0.592 | % | 3/25/35 | | 1,005,212 | | 826,516 | (a)(b) |
GSMPS Mortgage Loan Trust, 2005-RP3 1AF | | 0.592 | % | 9/25/35 | | 223,844 | | 176,405 | (a)(b) |
GSMPS Mortgage Loan Trust, 2006-RP2 1AF1 | | 0.642 | % | 4/25/36 | | 471,311 | | 384,207 | (a)(b) |
Harborview Mortgage Loan Trust, 2004-10 4A | | 2.776 | % | 1/19/35 | | 433,983 | | 422,799 | (a) |
Harborview Mortgage Loan Trust, 2004-11 3A1A | | 0.592 | % | 1/19/35 | | 249,336 | | 160,075 | (a) |
Harborview Mortgage Loan Trust, 2005-14 3A1A | | 2.900 | % | 12/19/35 | | 247,307 | | 171,213 | (a) |
IMPAC Secured Assets Corp., 2005-2 A1 | | 0.562 | % | 3/25/36 | | 2,141,276 | | 1,032,133 | (a) |
Indymac Index Mortgage Loan Trust, 2004-AR07 A2 | | 1.102 | % | 9/25/34 | | 288,770 | | 194,404 | (a) |
Indymac Index Mortgage Loan Trust, 2004-AR08 2A2A | | 1.042 | % | 11/25/34 | | 79,130 | | 51,888 | (a) |
Indymac Index Mortgage Loan Trust, 2004-AR12 A1 | | 1.022 | % | 12/25/34 | | 99,345 | | 62,717 | (a) |
Indymac Index Mortgage Loan Trust, 2005-AR21 4A1 | | 5.087 | % | 10/25/35 | | 654,127 | | 514,455 | (a) |
| | | | | | | | | | |
See Notes to Financial Statements.
14 | | Western Asset Variable Rate Strategic Fund Inc. 2012 Semi-Annual Report |
Schedule of investments (unaudited) (cont’d)
March 31, 2012
Western Asset Variable Rate Strategic Fund Inc.
Security | | Rate | | Maturity
Date | | Face
Amount† | | Value | |
Collateralized Mortgage Obligations — continued | | | | | | | | | |
JPMorgan Mortgage Trust, 2005-A3 3A4 | | 3.912 | % | 6/25/35 | | 400,000 | | $ | 357,257 | (a) |
Luminent Mortgage Trust, 2006-2 A1A | | 0.442 | % | 2/25/46 | | 990,618 | | 528,622 | (a) |
MASTR ARM Trust, 2003-6 2A1 | | 2.422 | % | 12/25/33 | | 197,503 | | 187,080 | (a) |
MASTR ARM Trust, 2004-7 6M1 | | 0.892 | % | 8/25/34 | | 550,000 | | 435,583 | (a) |
MASTR Asset Securitization Trust, 2003-11 6A16 | | 5.250 | % | 12/25/33 | | 123,786 | | 125,849 | |
MASTR Reperforming Loan Trust, 2005-2 1A1F | | 0.592 | % | 5/25/35 | | 1,517,146 | | 1,160,816 | (a)(b) |
MASTR Reperforming Loan Trust, 2006-2 1A1 | | 5.283 | % | 5/25/36 | | 549,360 | | 508,239 | (a)(b) |
MASTR Reperforming Loan Trust, 2006-2 2A1 | | 3.282 | % | 5/25/36 | | 181,705 | | 159,834 | (a)(b) |
Morgan Stanley Mortgage Loan Trust, 2006-3AR 1A3 | | 0.502 | % | 3/25/36 | | 402,680 | | 205,165 | (a) |
Morgan Stanley Mortgage Loan Trust, 2006-6AR 2A | | 2.772 | % | 5/25/36 | | 1,082,412 | | 682,945 | (a) |
Residential Accredit Loans Inc., 2004-QA2 A2 | | 0.682 | % | 6/25/34 | | 730,514 | | 671,688 | (a) |
Residential Accredit Loans Inc., 2005-QO4 2A1 | | 0.522 | % | 12/25/45 | | 457,424 | | 275,426 | (a) |
Residential Asset Mortgage Products Inc., 2003-SL1 M1 | | 7.335 | % | 4/25/31 | | 878,179 | | 683,743 | (a) |
Structured ARM Loan Trust, 2004-09XS A | | 0.612 | % | 7/25/34 | | 875,337 | | 757,999 | (a) |
Structured ARM Loan Trust, 2004-20 1A1 | | 2.703 | % | 1/25/35 | | 174,373 | | 125,276 | (a) |
Structured Asset Mortgage Investments Inc., 2004-AR3 1A1 | | 0.842 | % | 7/19/34 | | 560,167 | | 490,927 | (a) |
Structured Asset Mortgage Investments Inc., 2006-AR2 A1 | | 0.472 | % | 2/25/36 | | 943,924 | | 545,125 | (a) |
Structured Asset Mortgage Investments Inc., 2006-AR3 11A1 | | 0.452 | % | 4/25/36 | | 425,305 | | 258,915 | (a) |
Structured Asset Securities Corp., 1998-2 M1 | | 1.342 | % | 2/25/28 | | 64,645 | | 60,118 | (a) |
Structured Asset Securities Corp., 1998-3 M1 | | 1.242 | % | 3/25/28 | | 95,278 | | 89,398 | (a) |
Structured Asset Securities Corp., 1998-8 M1 | | 1.182 | % | 8/25/28 | | 317,738 | | 255,120 | (a) |
Structured Asset Securities Corp., 2005-4XS 3A4 | | 4.790 | % | 3/25/35 | | 430,364 | | 432,224 | |
Structured Asset Securities Corp., 2005-RF1 A | | 0.592 | % | 3/25/35 | | 289,367 | | 229,703 | (a)(b) |
Structured Asset Securities Corp., 2005-RF2 A | | 0.592 | % | 4/25/35 | | 308,314 | | 239,509 | (a)(b) |
Structured Asset Securities Corp., 2005-RF3 1A | | 0.592 | % | 6/25/35 | | 287,428 | | 222,530 | (a)(b) |
Structured Asset Securities Corp., 2005-RF3 2A | | 3.655 | % | 6/25/35 | | 4,484,917 | | 3,959,204 | (a)(b) |
Voyager Dwnys Delaware Trust, 2009-1 UGL2, IO | | 1.079 | % | 3/20/47 | | 124,237 | | 7,578 | (a)(b)(d)(e) |
WaMu Mortgage Pass-Through Certificates, 2003-AR11 A6 | | 2.468 | % | 10/25/33 | | 456,525 | | 459,212 | (a) |
WaMu Mortgage Pass-Through Certificates, 2004-AR14 A1 | | 2.452 | % | 1/25/35 | | 234,951 | | 228,979 | (a) |
WaMu Mortgage Pass-Through Certificates, 2005-AR13 A1C3 | | 0.732 | % | 10/25/45 | | 354,711 | | 197,265 | (a) |
WaMu Mortgage Pass-Through Certificates, 2007-HY3 1A1 | | 2.679 | % | 3/25/37 | | 227,199 | | 145,531 | (a) |
WaMu Mortgage Pass-Through Certificates, 2007-OA6 1A | | 0.969 | % | 7/25/47 | | 1,342,630 | | 859,614 | (a) |
| | | | | | | | | | |
See Notes to Financial Statements.
Western Asset Variable Rate Strategic Fund Inc. 2012 Semi-Annual Report | | 15 |
Western Asset Variable Rate Strategic Fund Inc.
Security | | Rate | | Maturity
Date | | Face
Amount† | | Value | |
Collateralized Mortgage Obligations — continued | | | | | | | | | |
WaMu Mortgage Pass-Through Certificates, 2007-OA6 2A | | 2.474 | % | 7/25/47 | | 612,290 | | $ | 371,780 | (a) |
Washington Mutual Inc., 2004-AR11 | | 2.492 | % | 10/25/34 | | 295,146 | | 285,944 | (a) |
Washington Mutual Inc., 2004-AR12 A2A | | 0.640 | % | 10/25/44 | | 244,146 | | 192,174 | (a) |
Washington Mutual Inc. Mortgage Pass-Through Certificates | | 0.642 | % | 1/25/45 | | 186,489 | | 145,806 | (a) |
Washington Mutual Inc. Mortgage Pass-Through Certificates, 2003-AR8 | | 0.602 | % | 10/25/45 | | 831,727 | | 623,263 | (a) |
Washington Mutual Inc. Mortgage Pass-Through Certificates, 2004-AR13 A1A | | 0.610 | % | 11/25/34 | | 649,869 | | 538,937 | (a) |
Washington Mutual Inc. Mortgage Pass-Through Certificates, 2005-AR01 A1A | | 0.562 | % | 1/25/45 | | 41,542 | | 34,982 | (a) |
Washington Mutual Inc. Mortgage Pass-Through Certificates, 2006-AR08 1A3 | | 2.527 | % | 8/25/46 | | 359,169 | | 250,692 | (a) |
Washington Mutual Inc. Mortgage Pass-Through Certificates, 2006-AR11 1A | | 1.119 | % | 9/25/46 | | 543,157 | | 351,796 | (a) |
Washington Mutual Inc. Pass-Through Certificates, 2003-AR10 A7 | | 2.448 | % | 10/25/33 | | 197,598 | | 199,781 | (a) |
Washington Mutual Inc. Pass-Through Certificates, 2005-AR08 2AB3 | | 0.602 | % | 7/25/45 | | 541,058 | | 416,618 | (a) |
Washington Mutual Inc. Pass-Through Certificates, 2006-AR02 A1A | | 1.099 | % | 4/25/46 | | 294,074 | | 164,405 | (a) |
Wells Fargo Mortgage Backed Securities Trust, 2004-DD 1A1 | | 2.616 | % | 1/25/35 | | 656,959 | | 599,255 | (a) |
Total Collateralized Mortgage Obligations (Cost — $36,290,475) | | | | | | 32,746,080 | |
Collateralized Senior Loans — 9.9% | | | | | | | | | |
Consumer Discretionary — 2.1% | | | | | | | | | |
Hotels, Restaurants & Leisure — 0.2% | | | | | | | | | |
Caesars Entertainment Operating Co. Inc., Term Loan B6 | | 5.492 | % | 1/26/18 | | 276,565 | | 250,205 | (i) |
Media — 1.5% | | | | | | | | | |
Charter Communications Operating LLC, Term Loan C | | 3.720 | % | 9/6/16 | | 852,878 | | 851,812 | (i) |
Univision Communications Inc. | | 4.491 | % | 3/31/17 | | 1,000,000 | | 929,303 | (i) |
Total Media | | | | | | | | 1,781,115 | |
Multiline Retail — 0.4% | | | | | | | | | |
Neiman-Marcus Group Inc., Term Loan | | 4.750 | % | 5/16/18 | | 465,000 | | 464,709 | (i) |
Total Consumer Discretionary | | | | | | | | 2,496,029 | |
Consumer Staples — 1.2% | | | | | | | | | |
Food Products — 0.8% | | | | | | | | | |
Del Monte Foods Co., Term Loan B | | 4.500 | % | 3/8/18 | | 992,500 | | 991,259 | (i) |
Household Products — 0.4% | | | | | | | | | |
Visant Corp., Term Loan | | 5.250 | % | 12/22/16 | | 473,306 | | 460,981 | (i) |
Total Consumer Staples | | | | | | | | 1,452,240 | |
| | | | | | | | | | |
See Notes to Financial Statements.
16 | | Western Asset Variable Rate Strategic Fund Inc. 2012 Semi-Annual Report |
Schedule of investments (unaudited) (cont’d)
March 31, 2012
Western Asset Variable Rate Strategic Fund Inc.
Security | | Rate | | Maturity
Date | | Face
Amount† | | Value | |
Energy — 1.3% | | | | | | | | | |
Energy Equipment & Services — 0.4% | | | | | | | | | |
Hercules Offshore Inc., Term Loan B | | 7.500 | % | 7/11/13 | | 475,537 | | $ | 475,496 | (i) |
Oil, Gas & Consumable Fuels — 0.9% | | | | | | | | | |
Husky Injection Molding Systems, Term Loan | | 6.500 | % | 6/29/18 | | 992,500 | | 1,000,982 | (i) |
Total Energy | | | | | | | | 1,476,478 | |
Health Care — 2.0% | | | | | | | | | |
Biotechnology — 0.9% | | | | | | | | | |
Exopack LLC, Term Loan B | | 6.500 | % | 5/31/17 | | 992,500 | | 993,741 | (i) |
Health Care Providers & Services — 1.1% | | | | | | | | | |
Community Health Systems Inc., Term Loan B | 2.491 - 2.739 | % | 7/25/14 | | 379,398 | | 375,057 | (i) |
Emergency Medical Services Corp., Term Loan B | | 5.250 | % | 5/25/18 | | 297,750 | | 298,420 | (i) |
HCA Inc., Term Loan B1 | | 2.491 | % | 11/18/13 | | 630,983 | | 629,172 | (i) |
Total Health Care Providers & Services | | | | | | | | 1,302,649 | |
Total Health Care | | | | | | | | 2,296,390 | |
Industrials — 0.2% | | | | | | | | | |
Marine — 0.0% | | | | | | | | | |
Trico Shipping AS, Term Loan A | | 10.000 | % | 5/13/14 | | 6,589 | | 6,589 | (e)(i) |
Trico Shipping AS, Term Loan B | | — | | 5/13/14 | | 11,602 | | 11,602 | (e)(j) |
Total Marine | | | | | | | | 18,191 | |
Road & Rail — 0.2% | | | | | | | | | |
Hertz Corp., Term Loan | | 3.750 | % | 3/9/18 | | 247,500 | | 247,113 | (i) |
Total Industrials | | | | | | | | 265,304 | |
Information Technology — 0.9% | | | | | | | | | |
IT Services — 0.5% | | | | | | | | | |
First Data Corp., Term Loan B | | 4.242 | % | 3/23/18 | | 301,701 | | 275,679 | (i) |
First Data Corp., Term Loan B2 | | 2.992 | % | 9/24/14 | | 365,915 | | 353,339 | (i) |
Total IT Services | | | | | | | | 629,018 | |
Semiconductors & Semiconductor Equipment — 0.4% | | | | | | | | | |
Freescale Semiconductor Inc., Term Loan | | 4.494 | % | 12/1/16 | | 500,000 | | 487,812 | (i) |
Total Information Technology | | | | | | | | 1,116,830 | |
Materials — 0.7% | | | | | | | | | |
Construction Materials — 0.7% | | | | | | | | | |
Fairmount Minerals, Term Loan B | | 5.250 | % | 3/15/17 | | 800,000 | | 802,500 | (i) |
Telecommunication Services — 1.1% | | | | | | | | | |
Diversified Telecommunication Services — 1.1% | | | | | | | | | |
Intelsat Jackson Holdings Ltd., Term Loan | | 5.250 | % | 4/2/18 | | 746,241 | | 751,038 | (i) |
Level 3 Financing Inc., Term Loan A | 2.492 - 2.827 | % | 3/13/14 | | 500,000 | | 493,203 | (i) |
Total Telecommunication Services | | | | | | | | 1,244,241 | |
| | | | | | | | | | | | |
See Notes to Financial Statements.
Western Asset Variable Rate Strategic Fund Inc. 2012 Semi-Annual Report | | 17 |
Western Asset Variable Rate Strategic Fund Inc.
Security | | Rate | | Maturity
Date | | Face
Amount† | | Value | |
Utilities — 0.4% | | | | | | | | | |
Electric Utilities — 0.4% | | | | | | | | | |
Texas Competitive Electric Holdings Co. LLC, Term Loan | | 4.743 | % | 10/10/17 | | 930,144 | | $ | 519,427 | (i) |
Total Collateralized Senior Loans (Cost — $11,724,422) | | | | | | | | 11,669,439 | |
Mortgage-Backed Securities — 0.4% | | | | | | | | | |
GNMA — 0.4% | | | | | | | | | |
Government National Mortgage Association (GNMA) (Cost — $508,598) | | 6.500 | % | 8/15/34 | | 448,598 | | 522,226 | |
Municipal Bonds — 3.2% | | | | | | | | | |
Carroll County, KY, PCR, Kentucky Utilities Co. Project, AMBAC | | 0.222 | % | 10/1/32 | | 500,000 | | 395,000 | (a) |
Florida Educational Loan Marketing Corp., Education Loan Revenue | | 0.495 | % | 12/1/18 | | 700,000 | | 525,000 | (a)(k) |
Illinois State, GO | | 5.100 | % | 6/1/33 | | 425,000 | | 401,056 | |
New York State Energy Research & Development Authority Facilities Revenue, Consolidated Edison Co., XLCA | | 0.280 | % | 5/1/32 | | 500,000 | | 350,000 | (a) |
North Carolina State Education Assistance Authority Revenue, Student Loan Backed Notes | | 1.360 | % | 7/25/25 | | 600,000 | | 589,164 | (a) |
North Carolina State Education Assistance Authority Revenue, Student Loan Backed Notes | | 1.451 | % | 10/25/41 | | 400,000 | | 370,012 | (a) |
Person County, NC, Industrial Facilities & Pollution Control Financing Authority Revenue, Carolina Power & Light Co., AMBAC | | 0.280 | % | 11/1/18 | | 550,000 | | 456,500 | (a) |
Wake County, NC, Industrial Facilities & Pollution Control Financing Authority Revenue, Carolina Power & Light Co., AMBAC | | 0.245 | % | 10/1/22 | | 800,000 | | 648,000 | (a) |
Total Municipal Bonds (Cost — $3,970,983) | | | | | | | | 3,734,732 | |
Sovereign Bonds — 4.4% | | | | | | | | | |
Brazil — 2.9% | | | | | | | | | |
Brazil Nota do Tesouro Nacional, Notes | | 10.000 | % | 1/1/14 | | 421,000 | BRL | 232,004 | |
Brazil Nota do Tesouro Nacional, Notes | | 10.000 | % | 1/1/17 | | 5,902,000 | BRL | 3,150,105 | |
Total Brazil | | | | | | | | 3,382,109 | |
India — 0.1% | | | | | | | | | |
ICICI Bank Ltd., Subordinated Bonds | | 6.375 | % | 4/30/22 | | 130,000 | | 124,150 | (a)(b) |
Mexico — 0.3% | | | | | | | | | |
United Mexican States, Medium-Term Notes | | 6.750 | % | 9/27/34 | | 265,000 | | 341,850 | |
Russia — 0.4% | | | | | | | | | |
Russian Foreign Bond — Eurobond | | 12.750 | % | 6/24/28 | | 254,000 | | 458,788 | (b) |
Venezuela — 0.7% | | | | | | | | | |
Bolivarian Republic of Venezuela | | 5.750 | % | 2/26/16 | | 912,000 | | 813,960 | (b) |
Total Sovereign Bonds (Cost — $4,974,449) | | | | | | | | 5,120,857 | |
| | | | | | | | | | |
See Notes to Financial Statements.
18 | | Western Asset Variable Rate Strategic Fund Inc. 2012 Semi-Annual Report |
Schedule of investments (unaudited) (cont’d)
March 31, 2012
Western Asset Variable Rate Strategic Fund Inc.
Security | | | | Shares | | Value | |
Common Stocks — 0.2% | | | | | | | |
Industrials — 0.1% | | | | | | | |
Marine — 0.1% | | | | | | | |
DeepOcean Group Holding AS | | | | 3,101 | | $ | 53,492 | (d) |
Materials — 0.1% | | | | | | | |
Chemicals — 0.1% | | | | | | | |
Georgia Gulf Corp. | | | | 3,741 | | 130,486 | * |
Total Common Stocks (Cost — $197,813) | | | | | | 183,978 | |
| | | | | | | |
| | Expiration
Date | | Rights | | | |
Rights — 0.0% | | | | | | | |
Consumer Discretionary — 0.0% | | | | | | | |
Twin River Worldwide Holdings, Inc. (Cost — $25,055) | | 11/5/17 | | 750 | | 4,125 | * |
| | | | | | | |
| | | | Warrants | | | |
Warrants — 0.0% | | | | | | | |
Buffets Restaurant Holdings | | 4/28/14 | | 29 | | 0 | *(d)(e)(f) |
Charter Communications Inc. | | 11/30/14 | | 22 | | 423 | * |
CMP Susquehanna Radio Holdings Co. | | 3/23/19 | | 639 | | 3,451 | *(a)(d)(e) |
Nortek Inc. | | 12/7/14 | | 115 | | 265 | *(d)(e) |
SemGroup Corp. | | 11/30/14 | | 122 | | 905 | *(e) |
Total Warrants (Cost — $1,528) | | | | | | 5,044 | |
Total Investments before Short-Term Investments (Cost — $129,019,639) | | | | | 121,939,004 | |
| | | | | | | | |
| | Rate | | Maturity
Date | | Face
Amount† | | | |
Short-Term Investments — 3.4% | | | | | | | | | |
Repurchase Agreements — 3.4% | | | | | | | | | |
State Street Bank & Trust Co. repurchase agreement dated 3/30/12; Proceeds at maturity — $3,968,003; (Fully collateralized by U.S. Government Obligations, 1.500% due 6/30/16; Market value — $4,047,656) (Cost — $3,968,000) | | 0.010 | % | 4/2/12 | | 3,968,000 | | 3,968,000 | |
Total Investments — 107.1% (Cost — $132,987,639#) | | | | | | | | 125,907,004 | |
Liabilities in Excess of Other Assets — (7.1)% | | | | | | | | (8,323,509) | |
Total Net Assets — 100.0% | | | | | | | | $117,583,495 | |
† Face amount denominated in U.S. dollars, unless otherwise noted.
* Non-income producing security.
(a) Variable rate security. Interest rate disclosed is as of the most recent information available.
See Notes to Financial Statements.
Western Asset Variable Rate Strategic Fund Inc. 2012 Semi-Annual Report | | 19 |
Western Asset Variable Rate Strategic Fund Inc.
(b) Security is exempt from registration under Rule 144A of the Securities Act of 1933. This security may be resold in transactions that are exempt from registration, normally to qualified institutional buyers. This security has been deemed liquid pursuant to guidelines approved by the Board of Trustees, unless otherwise noted.
(c) The coupon payment on these securities is currently in default as of March 31, 2012.
(d) Security is valued in good faith in accordance with procedures approved by the Board of Trustees (See Note 1).
(e) Illiquid security.
(f) Value is less than $1.
(g) All or a portion of this security is held by the counterparty as collateral for open reverse repurchase agreements.
(h) Security has no maturity date. The date shown represents the next call date.
(i) Interest rates disclosed represent the effective rates on collateralized senior loans. Ranges in interest rates are attributable to multiple contracts under the same loan.
(j) All or a portion of this loan is unfunded as of March 31, 2012. The interest rate for fully unfunded term loans is to be determined.
(k) Income from this issue is considered a preference item for purposes of calculating the alternative minimum tax (“AMT”).
# Aggregate cost for federal income tax purposes is substantially the same.
Abbreviations used in this schedule:
ARM | — Adjustable Rate Mortgage |
BRL | — Brazilian Real |
GO | — General Obligation |
IO | — Interest Only |
PAC | — Planned Amortization Class |
STRIPS | — Separate Trading of Registered Interest and Principal Securities |
Schedule of Written Options
Security | | Expiration
Date | | Strike
Price | | Contracts | | Value | |
Eurodollar Futures, Call | | 9/17/12 | | $ | 99.38 | | 38 | | $ | 17,100 | |
Eurodollar Futures, Put | | 9/17/12 | | 99.25 | | 38 | | 3,088 | |
| | | | | | | | | |
| | | | Strike
Rate | | Notional
Par | | | |
Interest rate swaption with Credit Suisse First Boston Inc., Call | | 4/13/12 | | 1.90 | % | 10,000,000 | | $ | 243 | |
Interest rate swaption with Credit Suisse First Boston Inc., Put | | 8/26/14 | | 2.50 | | 28,669,000 | | 67,872 | |
Total Written Options (Premiums received — $241,271) | | | | | | | | $ | 88,303 | |
| | | | | | | | | | | |
See Notes to Financial Statements.
20 | | Western Asset Variable Rate Strategic Fund Inc. 2012 Semi-Annual Report |
Statement of assets and liabilities (unaudited)
March 31, 2012
Assets: | | | |
Investments, at value (Cost — $132,987,639) | | $125,907,004 | |
Foreign currency, at value (Cost — $142,983) | | 146,299 | |
Cash | | 723 | |
Interest receivable | | 912,665 | |
Deposits with brokers for swap contracts | | 800,000 | |
Deposits with brokers for open futures contracts | | 145,000 | |
Unrealized appreciation on forward foreign currency contracts | | 41,541 | |
Receivable for open swap contracts | | 16,162 | |
Receivable for securities sold | | 10,307 | |
Swaps, at value (net premiums paid — $2,771) | | 7,527 | |
Receivable from broker — variation margin on open futures contracts | | 1,141 | |
Prepaid expenses | | 22,777 | |
Other receivables | | 6,040 | |
Total Assets | | 128,017,186 | |
| | | |
Liabilities: | | | |
Payable for open reverse repurchase agreement | | 9,337,635 | |
Swaps, at value (net premiums paid — $30,341) | | 751,933 | |
Payable for open swap contracts | | 89,806 | |
Written options, at value (premiums received $241,271) | | 88,303 | |
Investment management fee payable | | 81,102 | |
Payable for securities purchased | | 11,602 | |
Interest payable for reverse repurchase agreement | | 5,188 | |
Unrealized depreciation on forward foreign currency contracts | | 2,004 | |
Accrued expenses | | 66,118 | |
Total Liabilities | | 10,433,691 | |
Total Net Assets | | $117,583,495 | |
| | | |
Net Assets: | | | |
Par value ($0.001 par value; 6,658,748 shares issued and outstanding; 100,000,000 shares authorized) | | $ 6,659 | |
Paid-in capital in excess of par value | | 131,721,880 | |
Undistributed net investment income | | 2,616,233 | |
Accumulated net realized loss on investments, futures contracts, written options, swap contracts and foreign currency transactions | | (9,135,374) | |
Net unrealized depreciation on investments, futures contracts, written options, swap contracts and foreign currencies | | (7,625,903) | |
Total Net Assets | | $117,583,495 | |
| | | |
Shares Outstanding | | 6,658,748 | |
| | | |
Net Asset Value | | $17.66 | |
See Notes to Financial Statements.
Western Asset Variable Rate Strategic Fund Inc. 2012 Semi-Annual Report | | 21 |
Statement of operations (unaudited)
For the Six Months Ended March 31, 2012
Investment Income: | | | |
Interest | | $ 3,739,498 | |
Dividends | | 6,083 | |
Total Investment Income | | 3,745,581 | |
| | | |
Expenses: | | | |
Investment management fee (Note 2) | | 486,928 | |
Excise tax (Note 1) | | 83,994 | |
Interest expense (Note 3) | | 65,637 | |
Audit and tax | | 40,088 | |
Shareholder reports | | 19,169 | |
Transfer agent fees | | 10,643 | |
Directors’ fees | | 10,640 | |
Stock exchange listing fees | | 10,137 | |
Legal fees | | 6,922 | |
Fund accounting fees | | 5,688 | |
Custody fees | | 5,400 | |
Insurance | | 1,826 | |
Miscellaneous expenses | | 2,787 | |
Total Expenses | | 749,859 | |
Net Investment Income | | 2,995,722 | |
| | | |
Realized and Unrealized Gain (Loss) on Investments, Futures Contracts, Written Options, Swap Contracts and Foreign Currency Transactions (Notes 1, 3 and 4): | | | |
Net Realized Gain (Loss) From: | | | |
Investment transactions | | (598,282) | |
Futures contracts | | 140,062 | |
Written options | | 37,737 | |
Swap contracts | | (746,489) | |
Foreign currency transactions | | 33,350 | |
Net Realized Loss | | (1,133,622) | |
Change in Net Unrealized Appreciation (Depreciation) From: | | | |
Investments | | 5,742,110 | |
Futures contracts | | (7,989) | |
Written options | | 136,910 | |
Swap contracts | | 486,824 | |
Foreign currencies | | 52,993 | |
Change in Net Unrealized Appreciation (Depreciation) | | 6,410,848 | |
Net Gain on Investments, Futures Contracts, Written Options, Swap Contracts and Foreign Currency Transactions | | 5,277,226 | |
Increase in Net Assets From Operations | | $ 8,272,948 | |
See Notes to Financial Statements.
22 | | Western Asset Variable Rate Strategic Fund Inc. 2012 Semi-Annual Report |
Statements of changes in net assets (unaudited)
For the Six Months Ended March 31, 2012 (unaudited)
and the Year Ended September 30, 2011 | | 2012 | | 2011 | |
| | | | | |
Operations: | | | | | |
Net investment income | | $ 2,995,722 | | $ 5,756,628 | |
Net realized loss | | (1,133,622) | | (6,850,323) | |
Change in net unrealized appreciation (depreciation) | | 6,410,848 | | 4,013,918 | |
Increase in Net Assets From Operations | | 8,272,948 | | 2,920,223 | |
| | | | | |
Distributions to Shareholders From (Note 1): | | | | | |
Net investment income | | (2,583,594) | | (4,293,561) | |
Net realized gains | | — | | (267,682) | |
Decrease in Net Assets From Distributions to Shareholders | | (2,583,594) | | (4,561,243) | |
Increase (Decrease) in Net Assets | | 5,689,354 | | (1,641,020) | |
| | | | | |
Net Assets: | | | | | |
Beginning of period | | 111,894,141 | | 113,535,161 | |
End of period* | | $117,583,495 | | $111,894,141 | |
* Includes undistributed net investment income of: | | $2,616,233 | | $2,204,105 | |
See Notes to Financial Statements.
Western Asset Variable Rate Strategic Fund Inc. 2012 Semi-Annual Report | | 23 |
Statement of cash flows (unaudited)
For the Six Months Ended March 31, 2012
Increase (Decrease) in Cash: Cash Provided (Used) by Operating Activities: | | | |
Net increase in net assets resulting from operations | | $ 8,272,948 | |
Adjustments to reconcile net increase in net assets resulting from operations to net cash provided (used) by operating activities: | | | |
Purchases of portfolio securities | | (4,214,094) | |
Proceeds from sales of portfolio securities | | 16,699,516 | |
Net purchases, sales and maturities of short-term investments | | 3,519,615 | |
Net amortization (accretion) of discount and premium | | (752,676) | |
Increase in receivable for securities sold | | (2,006) | |
Decrease in interest receivable | | 37,136 | |
Increase in prepaid expenses | | (9,287) | |
Increase in receivable for open swap contracts | | (2,856) | |
Decrease in cash collateral with brokers | | 55,000 | |
Increase in other assets | | (5,785) | |
Decrease in payable for securities purchased | | (4,678,287) | |
Increase in investment management fee payable | | 1,105 | |
Increase in payable for open swap contracts | | 887 | |
Decrease in Directors’ fee payable | | (17) | |
Decrease in interest payable | | (5,190) | |
Decrease in accrued expenses | | (58,269) | |
Upfront premiums paid from swap contracts, net | | 15,076 | |
Premiums received from written options, net | | 112,815 | |
Change in payable to broker — variation margin on open futures contracts | | (8,186) | |
Net realized gain on investments | | 598,282 | |
Change in unrealized appreciation of investments, futures contracts, written options, swap contracts and forward foreign currency contracts | | (6,404,368) | |
Net cash provided by operating activities* | | 13,171,359 | |
| | | |
Cash Flows From Financing Activities | | | |
Distribution paid on common stock | | (2,583,594) | |
Proceeds from reverse repurchase agreements | | (10,587,686) | |
Net cash used in financing activities | | (13,171,280) | |
Net increase in cash | | 79 | |
Cash at beginning of period | | 146,943 | |
Cash at end of period | | $ 147,022 | |
* Included in operating expenses is cash paid for interest on borrowings of $70,827.
See Notes to Financial Statements.
24 | | Western Asset Variable Rate Strategic Fund Inc. 2012 Semi-Annual Report |
Financial highlights
For a share of capital stock outstanding throughout each year ended September 30, unless otherwise noted:
| | 20121,2 | | 20112 | | 20102 | | 20092 | | 20082 | | 20072 | |
| | | | | | | | | | | | | |
Net asset value, beginning of period | | $16.80 | | $17.05 | | $15.18 | | $15.12 | | $18.85 | | $19.68 | |
| | | | | | | | | | | | | |
Income (loss) from operations: | | | | | | | | | | | | | |
Net investment income | | 0.45 | | 0.86 | | 0.82 | | 0.75 | | 0.96 | | 1.07 | |
Net realized and unrealized gain (loss) | | 0.80 | | (0.43) | | 1.66 | | 0.04 | | (3.57) | | (0.45) | |
Total income (loss) from operations | | 1.25 | | 0.43 | | 2.48 | | 0.79 | | (2.61) | | 0.62 | |
| | | | | | | | | | | | | |
Less distributions from: | | | | | | | | | | | | | |
Net investment income | | (0.39) | | (0.64) | | (0.67) | | (0.68) | | (0.96) | | (1.31) | |
Net realized gains | | — | | (0.04) | | — | | (0.05) | | (0.16) | | (0.14) | |
Total distributions | | (0.39) | | (0.68) | | (0.67) | | (0.73) | | (1.12) | | (1.45) | |
| | | | | | | | | | | | | |
Increase in net asset value due to shares repurchased in tender offer | | — | | — | | 0.06 | | — | | — | | — | |
Net asset value, end of period | | $17.66 | | $16.80 | | $17.05 | | $15.18 | | $15.12 | | $18.85 | |
| | | | | | | | | | | | | |
Market price, end of period | | $16.62 | | $15.43 | | $15.86 | | $13.78 | | $12.00 | | $16.91 | |
Total return, based on NAV3,4 | | 7.53 | % | 2.45 | % | 17.08 | % | 5.91 | % | (14.40) | %5 | 3.21 | % |
Total return, based on Market Price6 | | 10.41 | % | 1.44 | % | 20.40 | % | 22.20 | % | (23.67) | %5 | 5.75 | % |
| | | | | | | | | | | | | |
Net assets, end of period (000s) | | $117,583 | | $118,894 | | $113,535 | | $126,385 | | $125,879 | | $156,865 | |
| | | | | | | | | | | | | |
Ratios to average net assets: | | | | | | | | | | | | | |
Gross expenses | | 1.32% | 7 | 0.99 | % | 1.09 | % | 1.16 | % | 1.06 | % | 0.97% | 8 |
Net expenses9 | | 1.32 | 7 | 0.99 | | 1.09 | | 1.16 | | 1.06 | | 0.97 | 8,10 |
Net investment income | | 5.27 | 7 | 4.91 | | 5.09 | | 5.41 | | 5.59 | | 5.53 | |
| | | | | | | | | | | | | |
Portfolio turnover rate | | 3 | % | 31 | % | 43 | % | 68% | 11 | 77% | 11 | 160% | 11 |
1 | For the six months ended March 31, 2012 (unaudited). |
2 | Per share amounts have been calculated using the average shares method. |
3 | Performance figures may reflect compensating balance arrangements, fee waivers and/or expense reimbursements. In the absence of compensating balance arrangements, fee waivers and/or expense reimbursements, the total return would have been lower. Past performance is no guarantee of future results. Total returns for periods of less than one year are not annualized. |
4 | The total return calculation assumes that distributions are reinvested at NAV. Past performance is no guarantee of future results. Total returns for periods of less than one year are not annualized. |
5 | The investment manager fully reimbursed the Fund for losses incurred resulting from an investment transaction error. Without this reimbursement, the total return would not have changed. |
6 | The total return calculation assumes that distributions are reinvested in accordance with the Fund’s dividend reinvestment plan. Past performance is no guarantee of future results. Total returns for periods of less than one year are not annualized. |
7 | Annualized. |
8 | Included in the expense ratios are certain non-recurring restructuring (and reorganization, if applicable) fees that were incurred by the Fund during the period. Without these fees, the gross and net expense ratios would both have been 0.97%. |
9 | The impact of compensating balance arrangements, if any, was less than 0.01%. |
10 | Reflects fee waivers and/or expense reimbursements. |
11 | Excluding mortgage dollar roll transactions. If mortgage dollar roll transactions had been included, the portfolio turnover rate would have been 146%, 205% and 197% for the years ended September 30, 2009, 2008 and 2007, respectively. |
See Notes to Financial Statements.
Western Asset Variable Rate Strategic Fund Inc. 2012 Semi-Annual Report | | 25 |
Notes to financial statements (unaudited)
1. Organization and significant accounting policies
Western Asset Variable Rate Strategic Fund Inc. (the “Fund”) was incorporated in Maryland on August 3, 2004 and is registered as a non-diversified, closed-end management investment company under the Investment Company Act of 1940, as amended (the “1940 Act”). The Board of Directors authorized 100 million shares of $0.001 par value common stock. The Fund’s primary investment objective is to maintain a high level of current income.
The following are significant accounting policies consistently followed by the Fund and are in conformity with U.S. generally accepted accounting principles (“GAAP”). Estimates and assumptions are required to be made regarding assets, liabilities and changes in net assets resulting from operations when financial statements are prepared. Changes in the economic environment, financial markets and any other parameters used in determining these estimates could cause actual results to differ. Subsequent events have been evaluated through the date the financial statements were issued.
(a) Investment valuation. The valuations for fixed income securities (which may include, but are not limited to, corporate, government, municipal, mortgage-backed, collateralized mortgage obligations and asset-backed securities) and certain derivative instruments are typically the prices supplied by independent third party pricing services, which may use market prices or broker/dealer quotations or a variety of valuation techniques and methodologies. The independent third party pricing services’ internal models use inputs that are observable such as issuer details, interest rates, yield curves, prepayment speeds, credit risks/ spreads, default rates and quoted prices for similar securities. Short-term fixed income securities that will mature in 60 days or less are valued at amortized cost, unless it is determined that using this method would not reflect an investment’s fair value. Futures contracts are valued daily at the settlement price established by the board of trade or exchange on which they are traded. Equity securities for which market quotations are available are valued at the last reported sales price or official closing price on the primary market or exchange on which they trade. When the Fund holds securities or other assets that are denominated in a foreign currency, the Fund will normally use the currency exchange rates as of 4:00 p.m. (Eastern Time). If independent third party pricing services are unable to supply prices for a portfolio investment, or if the prices supplied are deemed by the manager to be unreliable, the market price may be determined by the manager using quotations from one or more broker/dealers or at the transaction price if the security has recently been purchased and no value has yet been obtained from a pricing service or pricing broker. When reliable prices are not readily available, such as when the value of a security has been significantly affected by events after the close of the exchange or market on which the security is principally traded, but before the Fund calculates its net asset value, the Fund values these securities as determined in accordance with procedures approved by the Fund’s Board of Directors.
26 | | Western Asset Variable Rate Strategic Fund Inc. 2012 Semi-Annual Report | | |
Notes to financial statements (unaudited) (cont’d)
The Board of Directors is responsible for the valuation process and has delegated the supervision of the daily valuation process to the Legg Mason North American Fund Valuation Committee (the “Valuation Committee”). The Valuation Committee, pursuant to the policies adopted by the Board of Directors, is responsible for making fair value determinations, evaluating the effectiveness of the Fund’s pricing policies, and reporting to the Board of Directors. When determining the reliability of third party pricing information for investments owned by the Fund, the Valuation Committee, among other things, conducts due diligence reviews of pricing vendors, monitors the daily change in prices and reviews transactions among market participants.
The Valuation Committee will consider pricing methodologies it deems relevant and appropriate when making fair value determinations. Examples of possible methodologies include, but are not limited to, multiple of earnings; discount from market of a similar freely traded security; discounted cash-flow analysis; book value or a multiple thereof; risk premium/yield analysis; yield to maturity; and/or fundamental investment analysis. The Valuation Committee will also consider factors it deems relevant and appropriate in light of the facts and circumstances. Examples of possible factors include, but are not limited to, the type of security; the issuer’s financial statements; the purchase price of the security; the discount from market value of unrestricted securities of the same class at the time of purchase; analysts’ research and observations from financial institutions; information regarding any transactions or offers with respect to the security; the existence of merger proposals or tender offers affecting the security; the price and extent of public trading in similar securities of the issuer or comparable companies; and the existence of a shelf registration for restricted securities.
For each portfolio security that has been fair valued pursuant to the policies adopted by the Board of Directors, the fair value price is compared against the last available and next available market quotations. The Valuation Committee reviews the results of such back testing monthly and fair valuation occurrences are reported to the Board of Directors quarterly.
The Fund uses valuation techniques to measure fair value that are consistent with the market approach and/or income approach, depending on the type of security and the particular circumstance. The market approach uses prices and other relevant information generated by market transactions involving identical or comparable securities. The income approach uses valuation techniques to discount estimated future cash flows to present value.
GAAP establishes a disclosure hierarchy that categorizes the inputs to valuation techniques used to value assets and liabilities at measurement date. These inputs are summarized in the three broad levels listed below:
· Level 1 — quoted prices in active markets for identical investments
· Level 2 — other significant observable inputs (including quoted prices for similar investments, interest rates, prepayment speeds, credit risk, etc.)
· Level 3 — significant unobservable inputs (including the Fund’s own assumptions in determining the fair value of investments)
| | Western Asset Variable Rate Strategic Fund Inc. 2012 Semi-Annual Report | | 27 |
The inputs or methodologies used to value securities are not necessarily an indication of the risk associated with investing in those securities.
The following is a summary of the inputs used in valuing the Fund’s assets and liabilities carried at fair value:
ASSETS
Description | | Quoted Prices
(Level 1) | | Other Significant
Observable Inputs
(Level 2) | | Significant
Unobservable
Inputs
(Level 3) | | Total | |
Long-term investments†: | | | | | | | | | | |
Corporate bonds & notes | | — | | | $ 42,640,518 | | | $ 0 | * | | $ 42,640,518 | |
Asset-backed securities | | — | | | 25,179,597 | | | 132,408 | | | 25,312,005 | |
Collateralized mortgage obligations | | — | | | 32,746,080 | | | — | | | 32,746,080 | |
Collateralized senior loans | | — | | | 11,669,439 | | | — | | | 11,669,439 | |
Mortgage-backed securities | | — | | | 522,226 | | | — | | | 522,226 | |
Municipal bonds | | — | | | 3,734,732 | | | — | | | 3,734,732 | |
Sovereign bonds | | — | | | 5,120,857 | | | — | | | 5,120,857 | |
Common stocks: | | | | | | | | | | | | |
Industrials | | — | | | 53,492 | | | — | | | 53,492 | |
Other common stocks | | $130,486 | | | — | | | — | | | 130,486 | |
Rights | | — | | | 4,125 | | | — | | | 4,125 | |
Warrants | | | | | 4,779 | | | 265 | | | 5,044 | |
Total long-term investments | | $130,486 | | | $121,675,845 | | | $132,673 | | | $121,939,004 | |
Short-term investments† | | — | | | 3,968,000 | | | — | | | 3,968,000 | |
Total investments | | $130,486 | | | $125,643,845 | | | $132,673 | | | $125,907,004 | |
Other financial instruments: | | | | | | | | | | | | |
Futures contracts | | $ 71,879 | | | — | | | — | | | $ 71,879 | |
Forward foreign currency contracts | | — | | | $ 41,541 | | | — | | | 41,541 | |
Interest rate swaps‡ | | — | | | 2,388 | | | — | | | 2,388 | |
Credit default swaps on corporate issues — buy protection‡ | | — | | | 5,139 | | | — | | | 5,139 | |
Total other financial instruments | | $ 71,879 | | | $ 49,068 | | | — | | | $ 120,947 | |
Total | | $202,365 | | | $125,692,913 | | | $132,673 | | | $126,027,951 | |
LIABILITIES |
Description | | Quoted Prices
(Level 1) | | Other Significant
Observable Inputs
(Level 2) | | Significant
Unobservable
Inputs
(Level 3) | | Total | |
Other financial instruments: | | | | | | | | | | | | |
Written options | | $ 20,188 | | | $ 68,115 | | | — | | | $ 88,303 | |
Futures contracts | | 32,597 | | | — | | | — | | | 32,597 | |
Forward foreign currency contracts | | — | | | 2,004 | | | — | | | 2,004 | |
Interest rate swaps‡ | | — | | | 750,372 | | | — | | | 750,372 | |
Credit default swaps on credit indices — sell protection‡ | | — | | | 1,561 | | | — | | | 1,561 | |
Total | | $ 52,785 | | | $ 822,052 | | | — | | | $ 874,837 | |
* Amount represents less than $1.
† See Schedule of Investments for additional detailed categorizations.
‡ Values include any premiums paid or received with respect to swap contracts.
28 | | Western Asset Variable Rate Strategic Fund Inc. 2012 Semi-Annual Report | | |
Notes to financial statements (unaudited) (cont’d)
The following is a reconciliation of investments in which significant unobservable inputs (Level 3) were used in determining fair value:
Investments in Securities | | Collateralized
Mortgage
Obligations | | Asset
Backed
Securities | | Corporate
Bonds & Notes | | Common
Stocks | | Warrants | | Total |
Balance as of September 30, 2011 | | $ 14,867 | �� | | $ 413,544 | | $ 2 | | | $47,805 | | $ 478 | | | $ 476,696 | |
Accrued premiums/ discounts | | 268 | | | 2,339 | | — | | | — | | — | | | 2,607 | |
Realized gain (loss)1 | | (48,401 | ) | | 12,156 | | — | | | 2,016 | | — | | | (34,229 | ) |
Change in unrealized appreciation (depreciation)2 | | 62,172 | | | 4,782 | | (2 | ) | | 5,687 | | 210 | | | 72,849 | |
Purchases | | — | | | — | | — | | | — | | — | | | — | |
Sales | | (21,328 | ) | | (48,856 | ) | — | | | (2,016 | ) | — | | | (72,200 | ) |
Transfers into Level 33 | | — | | | 132,408 | | — | | | — | | — | | | 132,408 | |
Transfers out of Level 34 | | (7,578 | ) | | (383,965 | ) | — | | | (53,492 | ) | (423 | ) | | (445,458 | ) |
Balance as of March 31, 2012 | | — | | | $ 132,408 | | $ 0 | * | | — | | $ 265 | | | $ 132,673 | |
Net change in unrealized appreciation (depreciation) for investments in securities still held at March 31, 20122 | | — | | | — | | $ (2 | ) | | — | | $ 35 | | | $ 33 | |
The Fund’s policy is to recognize transfers between levels as of the end of the reporting period.
* Value is less than $1.
1 This amount is included in net realized gain (loss) from investment transactions in the accompanying Statement of Operations.
2 This amount is included in the change in net unrealized appreciation (depreciation) in the accompanying Statement of Operations. Change in unrealized appreciation (depreciation) includes net unrealized appreciation (depreciation) resulting from changes in investment values during the reporting period and the reversal of previously recorded unrealized appreciation (depreciation) when gains or losses are realized.
3 Transferred into Level 3 as a result of the unavailability of a quoted price in an active market for an identical investment or the unavailability of other significant observable inputs.
4 Transferred out of Level 3 as a result of the availability of a quoted price in an active market for an identical investment or the availability of other significant observable inputs.
(b) Repurchase agreements. The Fund may enter into repurchase agreements with institutions that its investment adviser has determined are creditworthy. Each repurchase agreement is recorded at cost. Under the terms of a typical repurchase agreement, the Fund acquires a debt security subject to an obligation of the seller to repurchase, and of the Fund to resell, the security at an agreed-upon price and time, thereby determining the yield during the Fund’s holding period. When entering into repurchase agreements, it is the Fund’s policy that its custodian or a third party custodian, acting on the Fund’s behalf, take possession of the underlying collateral securities, the market value of which, at all times, at least equals the principal amount of the repurchase transaction, including accrued interest. To the extent that any repurchase transaction maturity exceeds one business day, the value of the collateral is marked-to-market and measured against the value of the agreement in an effort to ensure the adequacy of the collateral. If the counterparty
| | Western Asset Variable Rate Strategic Fund Inc. 2012 Semi-Annual Report | | 29 |
defaults, the Fund generally has the right to use the collateral to satisfy the terms of the repurchase transaction. However, if the market value of the collateral declines during the period in which the Fund seeks to assert its rights or if bankruptcy proceedings are commenced with respect to the seller of the security, realization of the collateral by the Fund may be delayed or limited.
(c) Reverse repurchase agreements. The Fund may enter into reverse repurchase agreements. Under the terms of a typical reverse repurchase agreement, a fund sells a security subject to an obligation to repurchase the security from the buyer at an agreed-upon time and price. In the event the buyer of securities under a reverse repurchase agreement files for bankruptcy or becomes insolvent, the Fund’s use of the proceeds of the agreement may be restricted pending a determination by the counterparty, or its trustee or receiver, whether to enforce the Fund’s obligation to repurchase the securities. In entering into reverse repurchase agreements, the Fund will maintain cash, U.S. government securities or other liquid debt obligations at least equal in value to its obligations with respect to reverse repurchase agreements or will take other actions permitted by law to cover its obligations.
(d) Futures contracts. The Fund uses futures contracts generally to gain exposure to, or hedge against, changes in interest rates or gain exposure to, or hedge against, changes in certain asset classes. A futures contract represents a commitment for the future purchase or sale of an asset at a specified price on a specified date.
Upon entering into a futures contract, the Fund is required to deposit cash or cash equivalents with a broker in an amount equal to a certain percentage of the contract amount. This is known as the “initial margin” and subsequent payments (“variation margin”) are made or received by the Fund each day, depending on the daily fluctuation in the value of the contract. For certain futures, including foreign denominated futures, variation margin is not settled daily, but is recorded as a net variation margin payable or receivable. The daily changes in contract value are recorded as unrealized gains or losses in the Statement of Operations and the Fund recognizes a realized gain or loss when the contract is closed.
Futures contracts involve, to varying degrees, risk of loss in excess of the amounts reflected in the financial statements. In addition, there is the risk that the Fund may not be able to enter into a closing transaction because of an illiquid secondary market.
(e) Forward foreign currency contracts. The Fund enters into a forward foreign currency contract to hedge against foreign currency exchange rate risk on its non-U.S. dollar denominated securities or to facilitate settlement of a foreign currency denominated portfolio transaction. A forward foreign currency contract is an agreement between two parties to buy and sell a currency at a set price with delivery and settlement at a future date. The contract is marked-to-market daily and the change in value is recorded by the Fund as
30 | | Western Asset Variable Rate Strategic Fund Inc. 2012 Semi-Annual Report | | |
Notes to financial statements (unaudited) (cont’d)
an unrealized gain or loss. When a forward foreign currency contract is closed, through either delivery or offset by entering into another forward foreign currency contract, the Fund recognizes a realized gain or loss equal to the difference between the value of the contract at the time it was opened and the value of the contract at the time it is closed.
Forward foreign currency contracts involve elements of market risk in excess of the amounts reflected on the Statement of Assets and Liabilities. The Fund bears the risk of an unfavorable change in the foreign exchange rate underlying the forward foreign currency contract. Risks may also arise upon entering into these contracts from the potential inability of the counterparties to meet the terms of their contracts.
(f) Swap agreements. The Fund invests in swaps for the purpose of managing its exposure to interest rate, credit or market risk, or for other purposes. The use of swaps involves risks that are different from those associated with portfolio transactions.
Swap contracts are marked-to-market daily and changes in value are recorded as unrealized appreciation (depreciation). Gains or losses are realized upon termination of the swap agreement. Collateral, in the form of restricted cash or securities, may be required to be held in segregated accounts with the Fund’s custodian in compliance with the terms of the swap contracts. Securities posted as collateral for swap contracts are identified in the Schedule of Investments and restricted cash, if any, is identified on the Statement of Assets and Liabilities. Risks may exceed amounts recorded in the Statement of Assets and Liabilities. These risks include changes in the returns of the underlying instruments, failure of the counterparties to perform under the contracts’ terms, and the possible lack of liquidity with respect to the swap agreements.
Payments received or made at the beginning of the measurement period are reflected as a premium or deposit, respectively, on the Statement of Assets and Liabilities. These upfront payments are amortized over the life of the swap and are recognized as realized gain or loss in the Statement of Operations. Net periodic payments received or paid by the Fund are recognized as a realized gain or loss in the Statement of Operations.
For average notional amounts of swaps held during the six months ended March 31, 2012, see Note 4.
Credit default swaps
The Fund enters into credit default swap (“CDS”) contracts for investment purposes, to manage its credit risk or to add leverage. CDS agreements involve one party making a stream of payments to another party in exchange for the right to receive a specified return in the event of a default by a third party, typically corporate or sovereign issuers, on a specified obligation, or in the event of a write-down, principal shortfall, interest shortfall or default of all or part of the referenced entities comprising a credit index. The Fund may
| | Western Asset Variable Rate Strategic Fund Inc. 2012 Semi-Annual Report | | 31 |
use a CDS to provide protection against defaults of the issuers (i.e., to reduce risk where the Fund has exposure to an issuer) or to take an active long or short position with respect to the likelihood of a particular issuer’s default. As a seller of protection, the Fund generally receives an upfront payment or a stream of payments throughout the term of the swap provided that there is no credit event. If the Fund is a seller of protection and a credit event occurs, as defined under the terms of that particular swap agreement, the maximum potential amount of future payments (undiscounted) that the Fund could be required to make under a credit default swap agreement would be an amount equal to the notional amount of the agreement. These amounts of potential payments will be partially offset by any recovery of values from the respective referenced obligations. As a seller of protection, the Fund effectively adds leverage to its portfolio because, in addition to its total net assets, the Fund is subject to investment exposure on the notional amount of the swap. As a buyer of protection, the Fund generally receives an amount up to the notional value of the swap if a credit event occurs.
Implied spreads are the theoretical prices a lender receives for credit default protection. When spreads rise, market perceived credit risk rises and when spreads fall, market perceived credit risk falls. The implied credit spread of a particular referenced entity reflects the cost of buying/selling protection and may include upfront payments required to enter into the agreement. Wider credit spreads and decreasing market values, when compared to the notional amount of the swap, represent a deterioration of the referenced entity’s credit soundness and a greater likelihood or risk of default or other credit event occurring as defined under the terms of the agreement. Credit spreads utilized in determining the period end market value of credit default swap agreements on corporate or sovereign issues are disclosed in the Notes to Financial Statements and serve as an indicator of the current status of the payment/performance risk and represent the likelihood or risk of default for credit derivatives. For credit default swap agreements on asset-backed securities and credit indices, the quoted market prices and resulting values, particularly in relation to the notional amount of the contract as well as the annual payment rate, serve as an indication of the current status of the payment/performance risk.
The Fund’s maximum risk of loss from counterparty risk, as the protection buyer, is the fair value of the contract (this risk is mitigated by the posting of collateral by the counterparty to the Fund to cover the Fund’s exposure to the counterparty). As the protection seller, the Fund’s maximum risk is the notional amount of the contract. Credit default swaps are considered to have credit risk-related contingent features since they require payment by the protection seller to the protection buyer upon the occurrence of a defined credit event.
Entering into a CDS agreement involves, to varying degrees, elements of credit, market and documentation risk in excess of the related amounts recognized on the Statement of Assets and Liabilities. Such risks involve the
32 | | Western Asset Variable Rate Strategic Fund Inc. 2012 Semi-Annual Report | | |
Notes to financial statements (unaudited) (cont’d)
possibility that there will be no liquid market for these agreements, that the counterparty to the agreement may default on its obligation to perform or disagree as to the meaning of the contractual terms in the agreement, and that there will be unfavorable changes in net interest rates.
Interest rate swaps
The Fund enters into interest rate swap contracts to manage its exposure to interest rate risk. Interest rate swaps are agreements between two parties to exchange cash flows based on a notional principal amount. The Fund may elect to pay a fixed rate and receive a floating rate, or, receive a fixed rate and pay a floating rate on a notional principal amount. Interest rate swaps are marked-to-market daily based upon quotations from market makers and the change, if any, is recorded as an unrealized gain or loss in the Statement of Operations. When a swap contract is terminated early, the Fund records a realized gain or loss equal to the difference between the original cost and the settlement amount of the closing transaction.
The risks of interest rate swaps include changes in market conditions that will affect the value of the contract or changes in the present value of the future cash flow streams and the possible inability of the counterparty to fulfill its obligations under the agreement. The Fund’s maximum risk of loss from counterparty credit risk is the discounted net value of the cash flows to be received from the counterparty over the contract’s remaining life, to the extent that that amount is positive. This risk is mitigated by the posting of collateral by the counterparty to the Fund to cover the Fund’s exposure to the counterparty.
(g) Written options. When the Fund writes an option, an amount equal to the premium received by the Fund is recorded as a liability, the value of which is marked-to-market daily to reflect the current market value of the option written. If the option expires, the premium received is recorded as a realized gain. When a written call option is exercised, the difference between the premium received plus the option exercise price and the Fund’s basis in the underlying security (in the case of a covered written call option), or the cost to purchase the underlying security (in the case of an uncovered written call option), including brokerage commission, is recognized as a realized gain or loss. When a written put option is exercised, the amount of the premium received is subtracted from the cost of the security purchased by the Fund from the exercise of the written put option to form the Fund’s basis in the underlying security purchased. The writer or buyer of an option traded on an exchange can liquidate the position before the exercise of the option by entering into a closing transaction. The cost of a closing transaction is deducted from the original premium received resulting in a realized gain or loss to the Fund.
The risk in writing a covered call option is that the Fund may forego the opportunity of profit if the market price of the underlying security increases
| | Western Asset Variable Rate Strategic Fund Inc. 2012 Semi-Annual Report | | 33 |
and the option is exercised. The risk in writing a put option is that the Fund may incur a loss if the market price of the underlying security decreases and the option is exercised. The risk in writing an uncovered call option is that the Fund is exposed to the risk of loss if the market price of the underlying security increases. In addition, there is the risk that the Fund may not be able to enter into a closing transaction because of an illiquid secondary market.
(h) Swaptions. The Fund purchases and writes swaption contracts to manage exposure to an underlying instrument. The Fund may also purchase or write options to manage exposure to fluctuations in interest rates or to enhance yield. Swaption contracts written by the Fund represent an option that gives the purchaser the right, but not the obligation, to enter into a previously agreed upon swap contract at a future date. Swaption contracts purchased by the Fund represent an option that gives the Fund the right, but not the obligation, to enter into a previously agreed upon swap contract at a future date.
When the Fund writes a swaption, an amount equal to the premium received by the Fund is recorded as a liability, the value of which is marked-to-market daily to reflect the current market value of the swaption written. If the swaption expires, the Fund realizes a gain equal to the amount of the premium received.
When the Fund purchases a swaption, an amount equal to the premium paid by the Fund is recorded as an investment on the statement of assets and liabilities, the value of which is marked-to-market daily to reflect the current market value of the swaption purchased. If the swaption expires, the Fund realizes a loss equal to the amount of the premium paid.
Swaptions are marked-to-market daily based upon quotations from market makers. Changes in the value of the swaption are reported as unrealized gains or losses in the Statement of Operations.
(i) Stripped securities. The Fund may invest in ‘‘Stripped Securities,’’ a term used collectively for components, or strips, of fixed income securities. Stripped securities can be principal only securities (“PO”), which are debt obligations that have been stripped of unmatured interest coupons or, interest only securities (“IO”), which are unmatured interest coupons that have been stripped from debt obligations. The market value of Stripped Securities will fluctuate in response to changes in economic conditions, rates of pre-payment, interest rates and the market’s perception of the securities. However, fluctuations in response to interest rates may be greater in Stripped Securities than for debt obligations of comparable maturities that pay interest currently. The amount of fluctuation may increase with a longer period of maturity.
The yield to maturity on IO’s is sensitive to the rate of principal repayments (including prepayments) on the related underlying debt obligation and principal payments may have a material effect on yield to maturity. If the underlying debt obligation experiences greater than anticipated
34 | | Western Asset Variable Rate Strategic Fund Inc. 2012 Semi-Annual Report | | |
Notes to financial statements (unaudited) (cont’d)
prepayments of principal, the Fund may not fully recoup its initial investment in IO’s.
(j) Foreign currency translation. Investment securities and other assets and liabilities denominated in foreign currencies are translated into U.S. dollar amounts based upon prevailing exchange rates on the date of valuation. Purchases and sales of investment securities and income and expense items denominated in foreign currencies are translated into U.S. dollar amounts based upon prevailing exchange rates on the respective dates of such transactions.
The Fund does not isolate that portion of the results of operations resulting from fluctuations in foreign exchange rates on investments from the fluctuations arising from changes in market prices of securities held. Such fluctuations are included with the net realized and unrealized gain or loss on investments.
Net realized foreign exchange gains or losses arise from sales of foreign currencies, including gains and losses on forward foreign currency contracts, currency gains or losses realized between the trade and settlement dates on securities transactions, and the difference between the amounts of dividends, interest, and foreign withholding taxes recorded on the Fund’s books and the U.S. dollar equivalent of the amounts actually received or paid. Net unrealized foreign exchange gains and losses arise from changes in the values of assets and liabilities, other than investments in securities, on the date of valuation, resulting from changes in exchange rates.
Foreign security and currency transactions may involve certain considerations and risks not typically associated with those of U.S. dollar denominated transactions as a result of, among other factors, the possibility of lower levels of governmental supervision and regulation of foreign securities markets and the possibility of political or economic instability.
(k) Unfunded loan commitments. The Fund may enter into certain credit agreements all or a portion of which may be unfunded. The Fund is obligated to fund these commitments at the borrower’s discretion. The commitments are disclosed in the accompanying Schedule of Investments. At March 31, 2012, the Fund had sufficient cash and/or securities to cover these commitments.
(l) Loan participations. The Fund may invest in loans arranged through private negotiation between one or more financial institutions. The Fund’s investment in any such loan may be in the form of a participation in or an assignment of the loan. In connection with purchasing participations, the Fund generally will have no right to enforce compliance by the borrower with the terms of the loan agreement related to the loan, or any rights of off-set against the borrower and the Fund may not benefit directly from any collateral supporting the loan in which it has purchased the participation.
| | Western Asset Variable Rate Strategic Fund Inc. 2012 Semi-Annual Report | | 35 |
The Fund assumes the credit risk of the borrower, the lender that is selling the participation and any other persons interpositioned between the Fund and the borrower. In the event of the insolvency of the lender selling the participation, the Fund may be treated as a general creditor of the lender and may not benefit from any off-set between the lender and the borrower.
(m) Counterparty risk and credit-risk-related contingent features of derivative instruments. The Fund may invest in certain securities or engage in other transactions, where the Fund is exposed to counterparty credit risk in addition to broader market risks. The Fund may invest in securities of issuers, which may also be considered counterparties as trading partners in other transactions. This may increase the risk of loss in the event of default or bankruptcy by the counterparty or if the counterparty otherwise fails to meet its contractual obligations. The Fund’s investment manager attempts to mitigate counterparty risk by (i) periodically assessing the creditworthiness of its trading partners, (ii) monitoring and/or limiting the amount of its net exposure to each individual counterparty based on its assessment and (iii) requiring collateral from the counterparty for certain transactions. Market events and changes in overall economic conditions may impact the assessment of such counterparty risk by the investment manager. In addition, declines in the values of underlying collateral received may expose the Fund to increased risk of loss.
The Fund has entered into master agreements with certain of its derivative counterparties that provide for general obligations, representations, agreements, collateral, events of default or termination and credit related contingent features. The credit related contingent features include, but are not limited to, a percentage decrease in the Fund’s net assets or NAV over a specified period of time. If these credit related contingent features were triggered, the derivatives counterparty could terminate the positions and demand payment or require additional collateral.
As of March 31, 2012, the Fund held written options, forward foreign currency contracts , credit default swaps and interest rate swaps with credit related contingent features which had a liability position of $842,240. If a contingent feature in the master agreements would have been triggered, the Fund would have been required to pay this amount to its derivatives counterparties. As of March 31, 2012, the Fund had posted with its counterparties cash and/or securities as collateral to cover the net liability of these derivatives amounting to $800,000 which could be used to reduce the required payment.
(n) Credit and market risk. The Fund invests in high-yield and emerging market instruments that are subject to certain credit and market risks. The yields of high-yield and emerging market debt obligations reflect, among other things, perceived credit and market risks. The Fund’s investment in securities rated below investment grade typically involve risks not associated with higher rated securities including, among others, greater risk related to timely and ultimate payment of interest and principal, greater market price volatility
36 | | Western Asset Variable Rate Strategic Fund Inc. 2012 Semi-Annual Report | | |
Notes to financial statements (unaudited) (cont’d)
and less liquid secondary market trading. The consequences of political, social, economic or diplomatic changes may have disruptive effects on the market prices of investments held by the Fund. The Fund’s investment in non-U.S. dollar denominated securities may also result in foreign currency losses caused by devaluations and exchange rate fluctuations.
Investments in securities that are collateralized by residential real estate mortgages are subject to certain credit and liquidity risks. When market conditions result in an increase in default rates of the underlying mortgages and the foreclosure values of underlying real estate properties are materially below the outstanding amount of these underlying mortgages, collection of the full amount of accrued interest and principal on these investments may be doubtful. Such market conditions may significantly impair the value and liquidity of these investments and may result in a lack of correlation between their credit ratings and values.
(o) Other risks. Consistent with its objective to seek high current income, the Fund may invest in instruments whose values and interest rates are linked to foreign currencies, interest rates, indices or some other financial indicator. The value at maturity or interest rates for these instruments will increase or decrease according to the change in the indicator to which they are indexed, amongst other factors. These securities are generally more volatile in nature, and the risk of loss of principal may be greater.
(p) Security transactions and investment income. Security transactions are accounted for on a trade date basis. Interest income, adjusted for amortization of premium and accretion of discount, is recorded on the accrual basis. Dividend income is recorded on the ex-dividend date. The cost of investments sold is determined by use of the specific identification method. To the extent any issuer defaults or a credit event occurs that impacts the issuer, the Fund may halt any additional interest income accruals and consider the realizability of interest accrued up to the date of default or credit event.
(q) Distributions to shareholders. Distributions from net investment income of the Fund, if any, are declared quarterly and paid on a monthly basis. Distributions of net realized gains, if any, are declared at least annually. Distributions to shareholders of the Fund are recorded on the ex-dividend date and are determined in accordance with income tax regulations, which may differ from GAAP.
(r) Compensating balance arrangements. The Fund has an arrangement with its custodian bank whereby a portion of the custodian’s fees is paid indirectly by credits earned on the Fund’s cash on deposit with the bank.
(s) Federal and other taxes. It is the Fund’s policy to comply with the federal income and excise tax requirements of the Internal Revenue Code of 1986 (the “Code”), as amended, applicable to regulated investment companies. Accordingly, the Fund intends to distribute its taxable income and net realized gains, if any, to shareholders in accordance with timing requirements
| | Western Asset Variable Rate Strategic Fund Inc. 2012 Semi-Annual Report | | 37 |
imposed by the Code. Therefore, no federal or state income tax provision is required in the Fund’s financial statements.
However, due to the timing of when distributions are made by the Fund, the Fund may be subject to an excise tax of 4% of the amount by which 98% of the Fund’s annual taxable income and net realized gains exceed the distributions from such taxable income and realized gains for the calendar year. The Fund paid $83,994 of Federal excise tax attributable to calendar year 2011 in March 2012. Under the recently enacted Regulated Investment Company Modernization Act of 2010, the minimum distribution requirement for capital gains that must be met in order to avoid the imposition of excise tax has been raised from 98% to 98.2% for calendar years beginning after December 22, 2010.
(t) Reclassification. GAAP requires that certain components of net assets be reclassified to reflect permanent differences between financial and tax reporting. These reclassifications have no effect on net assets or net asset value per share.
2. Investment management agreement and other transactions with affiliates
Legg Mason Partners Fund Advisor, LLC (“LMPFA”) is the Fund’s investment manager. Western Asset Management Company (“Western Asset”), Western Asset Management Company Limited (“Western Asset Limited”) and Western Asset Management Company Pte. Ltd. (“Western Singapore”) are the Fund’s subadvisers. LMPFA, Western Asset, Western Asset Limited and Western Singapore are wholly-owned subsidiaries of Legg Mason, Inc. (“Legg Mason”).
LMPFA provides administrative and certain oversight services to the Fund. The Fund pays an investment management fee, calculated daily and paid monthly, at an annual rate of 0.75% of the Fund’s average daily net assets plus the proceeds of any outstanding borrowings.
LMPFA delegates to Western Asset the day-to-day portfolio management of the Fund. Western Asset Limited and Western Singapore do not receive any compensation from the Fund. For its services, LMPFA pays Western Asset 70% of the net management fee it receives from the Fund. In turn, Western Asset pays Western Asset Limited and Western Singapore a subadvisory fee of 0.30% on assets managed by Western Asset Limited and Western Singapore, respectively.
During periods in which the Fund utilizes financial leverage, the fees which are payable to the investment manager as a percentage of the Fund’s net assets will be higher than if the Fund did not utilize leverage because the fees are calculated as a percentage of the Fund’s assets, including those investments purchased with leverage.
38 | | Western Asset Variable Rate Strategic Fund Inc. 2012 Semi-Annual Report | | |
Notes to financial statements (unaudited) (cont’d)
All officers and one Director of the Fund are employees of Legg Mason or its affiliates and do not receive compensation from the Fund.
3. Investments
During the six months ended March 31, 2012, the aggregate cost of purchases and proceeds from sales of investments (excluding short-term investments) were as follows:
| | Investments | | U.S. Government &
Agency Obligations | |
Purchases | | $ 4,214,094 | | — | | |
Sales | | 16,655,291 | | $44,225 | | |
At March 31, 2012, the aggregate gross unrealized appreciation and depreciation of investments for federal income tax purposes were substantially as follows:
Gross unrealized appreciation | | $ 5,971,221 | |
Gross unrealized depreciation | | (13,051,856 | ) |
Net unrealized depreciation | | $ (7,080,635 | ) |
Transactions in reverse repurchase agreements for the Fund during the six months ended March 31, 2012 were as follows:
Average Daily
Balance* | | Weighted Average
Interest Rate* | | Maximum Amount
Outstanding | |
$16,076,307 | | 0.82% | | $19,925,321 | |
* Averages based on the number of days that Fund had reverse repurchase agreements outstanding.
Interest rates on reverse repurchase agreements ranged from 0.75% to 0.85% during the six months ended March 31, 2012. Interest expense incurred on reverse repurchase agreements totaled $65,637.
At March 31, 2012, the Fund had the following open reverse repurchase agreement:
Counterparty | | Rate | | Effective Date | | Maturity Date | | Face Amount of
Reverse Repurchase
Agreements | |
Deutsche Bank | | 0.80% | | 3/7/2012 | | 6/7/2012 | | $9,337,635 | |
On March 31, 2012, the total market value of underlying collateral (refer to the Schedule of Investments for positions held at the counterparty as collateral for reverse repurchase agreements) for open reverse repurchase agreements was $9,892,138.
| | Western Asset Variable Rate Strategic Fund Inc. 2012 Semi-Annual Report | | 39 |
At March 31, 2012, the Fund had the following open futures contracts:
| | Number of
Contracts | | Expiration
Date | | Basis
Value | | Market
Value | | Unrealized
Gain (Loss) |
Contracts to Buy: | | | | | | | | | | | |
90-Day Eurodollar | | 23 | | 6/13 | | $5,704,075 | | $5,715,213 | | $ 11,138 | |
90-Day Eurodollar | | 23 | | 3/13 | | 5,708,962 | | 5,718,375 | | 9,413 | |
90-Day Eurodollar | | 35 | | 9/13 | | 8,674,439 | | 8,690,500 | | 16,061 | |
U.S. Treasury 5-Year Notes | | 61 | | 6/12 | | 7,507,480 | | 7,474,883 | | (32,597 | ) |
| | | | | | | | | | 4,015 | |
Contracts to Sell: | | | | | | | | | | | |
U.S. Treasury 2-Year Notes | | 24 | | 6/12 | | 5,287,110 | | 5,283,375 | | 3,735 | |
U.S. Treasury 10-Year Notes | | 19 | | 6/12 | | 2,491,735 | | 2,460,203 | | 31,532 | |
| | | | | | | | | | 35,267 | |
Net unrealized gain on open futures contracts | | | | | | | | | | $ 39,282 | |
During the six months ended March 31, 2012, written option transactions for the Fund were as follows:
| | Number of Contracts/
Notional Amounts | | Premiums | |
Written options, outstanding as of September 30, 2011 | | 28,669,023 | | | $128,456 | |
Options written | | 10,000,207 | | | 150,552 | |
Options closed | | — | | | — | |
Options exercised | | — | | | — | |
Options expired | | (154 | ) | | (37,737 | ) |
Written options, outstanding as of March 31, 2012 | | 38,669,076 | | | $241,271 | |
At March 31, 2012, the Fund had the following open forward foreign currency contracts:
Foreign Currency | | Counterparty | | Local
Currency | | Market
Value | | Settlement
Date | | Unrealized
Gain (Loss) |
Contracts to Sell: | | | | | | | | | | | |
Brazilian Real | | JPMorgan Chase Bank N.A | | 3,148,210 | | $1,719,499 | | 4/16/12 | | $41,541 | |
Euro | | UBS AG | | 100,000 | | 133,397 | | 5/16/12 | | (2,004 | ) |
Net unrealized gain on open forward foreign currency contracts | | | | | | $39,537 | |
40 | | Western Asset Variable Rate Strategic Fund Inc. 2012 Semi-Annual Report | | |
Notes to financial statements (unaudited) (cont’d)
At March 31, 2012, the Fund held the following open swap contracts:
INTEREST RATE SWAPS
Swap Counterparty | | Notional
Amount | | Termination
Date | | Payments
Made
By the
Fund‡ | | Payments
Received
By the
Fund‡ | | Upfront
Premiums
Paid
(Received) | | Unrealized
Appreciation
(Depreciation) |
Barclays Capital Inc. | | $ 2,520,000 | | 3/18/19 | | 4.250%
Semi-Annually | | 3-Month LIBOR | | $29,800 | | $(450,416 | ) |
Barclays Capital Inc. | | 10,000,000 | | 6/14/16 | | 1.785%
Semi-Annually | | 3-Month LIBOR | | — | | (301,151 | ) |
Barclays Capital Inc. | | 5,000,000 | | 9/6/14 | | 0.633%
Semi-Annually | | 3-Month LIBOR | | — | | 2,388 | |
Credit Suisse First Boston Inc. | | 1,175,000 | | 8/31/16 | | 1.356%
Semi-Annually | | 3-Month LIBOR | | — | | (9,730 | ) |
Morgan Stanley & Co. Inc. | | 10,000,000 | | 10/18/13 | | 0.658%
Semi-Annually | | 3-Month LIBOR | | — | | (18,875 | ) |
Total | | $28,695,000 | | | | | | | | $29,800 | | $(777,784 | ) |
CREDIT DEFAULT SWAPS ON CORPORATE ISSUES — BUY PROTECTION1
Swap Counterparty
(Reference Entity) | | Notional
Amount2 | | Termination
Date | | Periodic
Payments
Made
by the
Fund‡ | | Market
Value3 | | Upfront
Premiums
Paid
(Received) | | Unrealized
Appreciation
(Depreciation) |
Goldman Sachs Group Inc.
(Assured Guaranty Municipal Corp., 0.480% due 11/15/13) | | $ 90,000 | | 3/20/15 | | 5.000% quarterly | | $ (516 | ) | $ 521 | | $(1,037 | ) |
Goldman Sachs Group Inc.
(Assured Guaranty Municipal Corp., 0.480% due 11/15/13) | | 120,000 | | 3/20/20 | | 5.000% quarterly | | 4,744 | | 2,517 | | 2,227 | |
Goldman Sachs Group Inc.
(Assured Guaranty Municipal Corp., 0.480%, due 11/15/13) | | 60,000 | | 3/20/13 | | 5.000% quarterly | | (797 | ) | (128 | ) | (669 | ) |
Goldman Sachs Group Inc.
(Assured Guaranty Municipal Corp., 0.480%, due 11/15/13) | | 10,000 | | 3/20/13 | | 5.000% quarterly | | (133 | ) | (13 | ) | (120 | ) |
Goldman Sachs Group Inc.
(Assured Guaranty Municipal Corp., 0.480%, due 11/15/13) | | 20,000 | | 3/20/15 | | 5.000% quarterly | | (115 | ) | 161 | | (276 | ) |
Goldman Sachs Group Inc.
(Assured Guaranty Municipal Corp., 0.480%, due 11/15/13) | | 10,000 | | 3/20/20 | | 5.000% quarterly | | 395 | | 254 | | 141 | |
Total | | $310,000 | | | | | | $3,578 | | $3,312 | | $ 266 | |
| | Western Asset Variable Rate Strategic Fund Inc. 2012 Semi-Annual Report | | 41 |
1 If the Fund is a buyer of protection and a credit event occurs, as defined under the terms of that particular swap agreement, the Fund will either (i) receive from the seller of protection an amount equal to the notional amount of the swap and deliver the underlying securities comprising the referenced index or (ii) receive a net settlement amount in the form of cash or securities equal to the notional amount of the swap less the recovery value of the underlying securities comprising the referenced index.
2 The maximum potential amount the Fund could be required to pay as a seller of credit protection or receive as a buyer of credit protection if a credit event occurs as defined under the terms of that particular swap agreement.
3 The quoted market prices and resulting values for credit default swap agreements on asset-backed securities and credit indices serve as an indicator of the current status of the payment/performance risk and represent the likelihood of an expected liability (or profit) for the credit derivative should the notional amount of the swap agreement been closed/sold as of the period end. Decreasing market values (sell protection) or increasing market values (buy protection) when compared to the notional amount of the swap, represent a deterioration of the referenced entity’s credit soundness and a greater likelihood or risk of default or other credit event occurring as defined under the terms of the agreement.
‡ Percentage shown is an annual percentage rate.
4. Derivative instruments and hedging activities
Financial Accounting Standards Board Codification Topic 815 requires enhanced disclosure about an entity’s derivative and hedging activities.
Below is a table, grouped by derivative type, that provides information about the fair value and the location of derivatives within the Statement of Assets and Liabilities at March 31, 2012.
ASSET DERIVATIVES1
| | Interest Rate
Risk | | Foreign
Exchange
Risk | | Credit
Risk | | Total | |
Futures contracts2 | | $71,879 | | | — | | | — | | | $ 71,879 | | |
Forward foreign currency contracts | | — | | | $41,541 | | | — | | | 41,541 | | |
Swap contracts3 | | 2,388 | | | — | | | $5,139 | | | 7,527 | | |
Total | | $74,267 | | | $41,541 | | | $5,139 | | | $120,947 | | |
LIABILITY DERIVATIVES1
| | Interest Rate
Risk | | Foreign
Exchange
Risk | | Credit
Risk | | Total | |
Written options | | $ 88,303 | | | — | | | — | | | $ 88,303 | | |
Futures contracts2 | | 32,597 | | | — | | | — | | | 32,597 | | |
Forward foreign currency contracts | | — | | | $2,004 | | | — | | | 2,004 | | |
Swap contracts3 | | 750,372 | | | — | | | $1,561 | | | 751,933 | | |
Total | | $871,272 | | | $2,004 | | | $1,561 | | | $874,837 | | |
1 Generally, the balance sheet location for asset derivatives is receivables/net unrealized appreciation (depreciation) and for liability derivatives is payables/net unrealized appreciation (depreciation).
2 Includes cumulative appreciation (depreciation) of futures contracts as reported in the footnotes. Only variation margin is reported within the receivables and/or payables of the Statement of Assets and Liabilities.
3 Values include premiums paid (received) on swap contracts which are shown separately in the Statement of Assets and Liabilities.
42 | | Western Asset Variable Rate Strategic Fund Inc. 2012 Semi-Annual Report | | |
Notes to financial statements (unaudited) (cont’d)
The following tables provide information about the effect of derivatives and hedging activities on the Fund’s Statement of Operations for the six months ended March 31, 2012. The first table provides additional detail about the amounts and sources of gains (losses) realized on derivatives during the period. The second table provides additional information about the change in unrealized appreciation (depreciation) resulting from the Fund’s derivatives and hedging activities during the period.
AMOUNT OF REALIZED GAIN (LOSS) ON DERIVATIVES RECOGNIZED
| | Interest Rate
Contracts
Risk | | Foreign
Exchange
Risk | | Credit
Contracts
Risk | | Total | |
Written options | | $ 37,737 | | | — | | | — | | | $ 37,737 | | |
Futures contracts | | 140,062 | | | — | | | — | | | 140,062 | | |
Forward foreign currency contracts | | — | | | $47,657 | | | — | | | 47,657 | | |
Swap contracts | | (620,685 | ) | | — | | | $(125,804 | ) | | (746,489 | ) | |
Total | | $(442,886 | ) | | $47,657 | | | $(125,804 | ) | | $(521,033 | ) | |
CHANGE IN UNREALIZED APPRECIATION (DEPRECIATION) ON DERIVATIVES RECOGNIZED
| | Interest Rate
Risk | | Foreign
Exchange
Risk | | Credit
Risk | | Total | |
Written options | | $ 136,910 | | | — | | | — | | | $ 136,910 | | |
Futures contracts | | (7,989 | ) | | — | | | — | | | (7,989 | ) | |
Forward foreign currency contracts | | — | | | $37,093 | | | — | | | 37,093 | | |
Swap contracts | | 529,176 | | | — | | | $(42,352 | ) | | 486,824 | | |
Total | | $ 658,097 | | | $37,093 | | | $(42,352 | ) | | $652,838 | | |
During the six months ended March 31, 2012, the volume of derivative activity for the Fund was as follows:
| | Average Market
Value | |
Written options | | $ 118,679 | | |
Forward foreign currency contracts (to sell) | | 635,299 | | |
Futures contracts (to buy) | | 32,623,658 | | |
Futures contracts (to sell) | | 9,573,165 | | |
| | Average
Notional Balance | |
Interest rate swap contracts | | $31,116,429 | | |
Credit default swap contracts (to buy protection) | | 310,000 | | |
Credit default swap contracts (to sell protection)† | | 1,904,286 | | |
† At March 31, 2012, there was no open positions held in this derivative.
| | Western Asset Variable Rate Strategic Fund Inc. 2012 Semi-Annual Report | | 43 |
5. Distributions subsequent to March 31, 2012
On February 10, 2012, the Fund’s Board of Directors (the “Board”) declared three distributions, each in the amount of $0.0670 per share, payable on March 30, 2012, April 27, 2012 and May 25, 2012 to shareholders of record on March 23, 2012, April 20, 2012 and May 18, 2012, respectively. The April and May record date distributions were made subsequent to the period end of this report.
On May 10, 2012, the Board declared three distributions, each in the amount of $0.0700 per share, payable on June 29, 2012, July 27, 2012 and August 31, 2012 to shareholders of record on June 22, 2012, July 20, 2012 and August 24, 2012, respectively.
6. Capital loss carryforward
As of September 30, 2011, the Fund had a net capital loss carryforward of approximately $4,735,221 which expires in 2019. This amount will be available to offset any future taxable capital gains.
Under the recently enacted Regulated Investment Company Modernization Act of 2010, the Fund will be permitted to carry forward capital losses incurred in taxable years beginning after December 22, 2010 for an unlimited period. However, any losses incurred during those future years will be required to be utilized prior to the losses incurred in pre-enactment taxable years. As a result of this ordering rule, pre-enactment capital loss carryforwards may be more likely to expire unused. Additionally, post-enactment capital losses that are carried forward will retain their character as either short-term or long-term capital losses rather than being considered all short-term as under previous law.
7. Recent accounting pronouncement
In May 2011, the Financial Accounting Standards Board issued Accounting Standard Update No. 2011-04, Fair Value Measurement (Topic 820) – Amendments to Achieve Common Fair Value Measurement and Disclosure Requirements in U.S. GAAP and IFRSs (“ASU No. 2011-04”). ASU No. 2011-04 establishes common requirements for measuring fair value and for disclosing information about fair value measurements. ASU No. 2011-04 is effective during interim and annual periods beginning after December 15, 2011. Management has evaluated ASU No. 2011-04 and concluded that it does not materially impact the financial statement amounts; however, as required, additional disclosure has been included about fair value measurement.
44 | | Western Asset Variable Rate Strategic Fund Inc. | | |
Board approval of management and subadvisory agreements (unaudited)
Background
The Investment Company Act of 1940, as amended (the “1940 Act”), requires that the Board of Directors (the “Board”) of Western Asset Variable Rate Strategic Fund, Inc. (the “Fund”), including a majority of its members that are not considered to be “interested persons” under the 1940 Act (the “Independent Directors”) voting separately, approve on an annual basis the continuation of the investment management contract (the “Management Agreement”) with the Fund’s manager, Legg Mason Partners Fund Advisor, LLC (the “Manager”), and the sub-advisory agreements (individually, a “Sub-Advisory Agreement,” and, collectively, the “Sub-Advisory Agreements”) with the Manager’s affiliates, Western Asset Management Company (“Western Asset”) and Western Asset Management Company Pte. Ltd. in Singapore (“Western Asset Singapore,” and, together with Western Asset, the “Sub-Advisers”). At a meeting (the “Contract Renewal Meeting”) held in-person on November 9 and 10, 2011, the Board, including the Independent Directors, considered and approved the continuation of each of the Management Agreement and the Sub-Advisory Agreements for an additional one-year term. To assist in its consideration of the renewals of the Management Agreement and the Sub-Advisory Agreements, the Board received and considered a variety of information (together with the information provided at the Contract Renewal Meeting, the “Contract Renewal Information”) about the Manager and the Sub-Advisers, as well as the management and sub-advisory arrangements for the Fund and the other closed-end funds in the same complex under the Board’s supervision (collectively, the “Legg Mason Closed-end Funds”), certain portions of which are discussed below. A presentation made by the Manager and Western Asset to the Board at the Contract Renewal Meeting in connection with its evaluations of the Management Agreement and the Sub-Advisory Agreements encompassed the Fund and other Legg Mason Closed-end Funds. In addition to the Contract Renewal Information, the Board received performance and other information throughout the year related to the respective services rendered by the Manager and the Sub-Advisers to the Fund. The Board’s evaluation took into account the information received throughout the year and also reflected the knowledge and familiarity gained as members of the Board of the Fund and other Legg Mason Closed-end Funds with respect to the services provided to the Fund by the Manager and the Sub-Advisers.
The Manager provides the Fund with investment advisory and administrative services pursuant to the Management Agreement and the Sub-Advisers together provide the Fund with certain investment sub-advisory services pursuant to the Sub-Advisory Agreements. The discussion below covers both the advisory and administrative functions being rendered by the Manager, each such function being encompassed by the Management Agreement, and the investment sub-advisory functions being rendered by the Sub-Advisers.
| | Western Asset Variable Rate Strategic Fund Inc. | | 45 |
Board approval of management agreement and sub-advisory agreements
In its deliberations regarding renewal of the Management Agreement and the Sub-Advisory Agreements, the Board, including the Independent Directors, considered the factors below.
Nature, extent and quality of the services under the management agreement and sub-advisory agreements
The Board received and considered Contract Renewal Information regarding the nature, extent and quality of services provided to the Fund by the Manager and the Sub-Advisers under the Management Agreement and the Sub-Advisory Agreements, respectively, during the past year. The Board also reviewed Contract Renewal Information regarding the Fund’s compliance policies and procedures established pursuant to the 1940 Act. The Board reviewed the qualifications, backgrounds and responsibilities of the Fund’s senior personnel and the portfolio management team primarily responsible for the day-to-day portfolio management of the Fund. The Board also considered, based on its knowledge of the Manager and its affiliates, the Contract Renewal Information and the Board’s discussions with the Manager and Western Asset at the Contract Renewal Meeting, the general reputation and investment performance records of the Manager, Western Asset and their affiliates and the financial resources available to the corporate parent of the Manager and the Sub-Advisers, Legg Mason, Inc. (“Legg Mason”), to support their activities in respect of the Fund and the other Legg Mason Closed-end Funds.
The Board considered the responsibilities of the Manager and the Sub-Advisers under the Management Agreement and the Sub-Advisory Agreements, respectively, including the Manager’s coordination and oversight of the services provided to the Fund by the Sub-Advisers and others and Western Asset’s coordination and oversight of the services provided to the Fund by Western Asset Singapore. The Management Agreement permits the Manager to delegate certain of its responsibilities, including its investment advisory duties thereunder, provided that the Manager, in each case, will supervise the activities of the delegee. Pursuant to this provision of the Management Agreement, the Manager does not provide day-to-day portfolio management services to the Fund. Rather, portfolio management services for the Fund are provided by Western Asset pursuant to the Sub-Advisory Agreement (the “Western Asset Sub-Advisory Agreement”) between the Manager and Western Asset. The Western Asset Sub-Advisory Agreement permits Western Asset to delegate certain of its responsibilities, including its investment sub-advisory duties thereunder, provided that Western Asset, in each case, will supervise the activities of the delegee. Pursuant to this provision Western Asset Singapore helps to provide certain investment sub-advisory services to the Fund pursuant to a separate Sub-Advisory Agreement with Western Asset.
46 | | Western Asset Variable Rate Strategic Fund Inc. | | |
Board approval of management and subadvisory agreements (unaudited) (cont’d)
In reaching its determinations regarding continuation of the Management Agreement and the Sub-Advisory Agreements, the Board took into account that Fund shareholders, in pursuing their investment goals and objectives, likely purchased their shares based upon the reputation and the investment style, philosophy and strategy of the Manager and Western Asset, as well as the resources available to the Manager and the Sub-Advisers.
The Board concluded that, overall, the nature, extent and quality of the management and other services provided to the Fund under the Management Agreement and the Sub-Advisory Agreements have been satisfactory under the circumstances.
Fund performance
The Board received and considered performance information and analyses (the “Lipper Performance Information”) for the Fund, as well as for a group of funds (the “Performance Universe”) selected by Lipper, Inc. (“Lipper”), an independent provider of investment company data. The Board was provided with a description of the methodology Lipper used to determine the similarity of the Fund with the funds included in the Performance Universe. The Performance Universe included the Fund and all non-leveraged global income closed-end funds, as classified by Lipper, regardless of asset size. The Board noted that it had received and discussed with the Manager and Western Asset information throughout the year at periodic intervals comparing the Fund’s performance against its benchmarks and its peer funds as selected by Lipper. The Performance Universe consisted of six funds, including the Fund, for each of the 1- and 3-year periods ended June 30, 2011 and of five funds, including the Fund, for the 5-year period ended June 30, 2011.
The Lipper Performance Information comparing the Fund’s performance to that of the Performance Universe based on net asset value per share showed, among other things, that the Fund’s performance for each of the 1- and 5-year periods ended June 30, 2011 was ranked fourth among the funds in the Performance Universe for that period and that the Fund’s performance for the 3-year period ended June 30, 2011 was ranked third among the funds in the Performance Universe for that period. The Fund’s performance was worse than the median performance for the Performance Universe for the 1- and 5-year periods but was better than the Performance Universe median for the 3-year period. The Board noted that the small number of funds in the Performance Universe made meaningful comparisons difficult. The Board also considered the Fund’s performance relative to its benchmarks and in absolute terms.
Based on its review of the Fund’s performance, which included consideration of all of the factors noted above, the Board concluded that, under the circumstances, the Fund’s performance supported continuation of the
| | Western Asset Variable Rate Strategic Fund Inc. | | 47 |
Management Agreement and the Sub-Advisory Agreements for an additional period not to exceed one year.
Management fees and expense ratios
The Board reviewed and considered the management fee (the “Management Fee”) payable by the Fund to the Manager under the Management Agreement and the sub-advisory fees (the “Sub-Advisory Fees”) payable to the Sub-Advisers under the Sub-Advisory Agreements in light of the nature, extent and overall quality of the management, investment advisory and other services provided by the Manager and the Sub-Advisers. The Board noted that the Sub-Advisory Fees payable to Western Asset under the Western Asset Sub-Advisory Agreement are paid by the Manager, not the Fund, and, accordingly, that the retention of Western Asset does not increase the fees or expenses otherwise incurred by the Fund’s shareholders. Similarly, the Board noted that the Sub-Advisory Fees payable to Western Asset Singapore under its Sub-Advisory Agreement with Western Asset are paid by Western Asset, not the Fund, and, accordingly, that the retention of Western Asset Singapore does not increase the fees or expenses otherwise incurred by the Fund’s shareholders.
Additionally, the Board received and considered information and analyses prepared by Lipper (the “Lipper Expense Information”) comparing the Management Fee and the Fund’s overall expenses with those of funds in an expense universe (the “Expense Universe”) selected and provided by Lipper. The comparison was based upon the constituent funds’ latest fiscal years. The Expense Universe consisted of the Fund and five other non-leveraged global income closed-end funds, as classified by Lipper. The Expense Universe had net common share assets ranging from $91.6 million to $1.24 billion. Four of the Expense Universe funds were larger than the Fund and one was smaller.
The Lipper Expense Information comparing the Management Fee as well as the Fund’s actual total expenses to the Fund’s Expense Universe showed that the Fund’s contractual Management Fee and actual Management Fee (i.e., giving effect to any voluntary fee waivers implemented by the Manager with respect to the Fund and by the managers of the other in the Expense Universe funds) each was ranked second among the funds in the Expense Universe and that the Fund’s actual total expenses were ranked third among the funds in the Expense Universe. Each expense component was better (i.e., lower) than the Expense Universe median for that component. The Board noted, among other things, the small number of funds in the Expense Universe made meaningful comparisons difficult.
The Board also reviewed Contract Renewal Information regarding fees charged by the Manager to other U.S. clients investing primarily in an asset class similar to that of the Fund, including, where applicable, institutional
48 | | Western Asset Variable Rate Strategic Fund Inc. | | |
Board approval of management and subadvisory agreements (unaudited) (cont’d)
and separate accounts. The Board was advised that the fees paid by such institutional, separate account and other clients generally are lower, and may be significantly lower, than the Management Fee. The Contract Renewal Information discussed the significant differences in scope of services provided to the Fund and to these other clients, noting that the Fund is provided with administrative services, office facilities, Fund officers (including the Fund’s chief executive, chief financial and chief compliance officers), and that the Manager coordinates and oversees the provision of services to the Fund by other fund service providers. The Contract Renewal Information included information regarding management fees paid by open-end mutual funds in the same complex (the “Legg Mason Open-end Funds”) and that such information indicated that the management fees paid by the Legg Mason Closed-end Funds generally were higher than those paid by the Legg Mason Open-end Funds. The Manager, in response to an inquiry by the Board as to the reasons for the fee differential, provided information as to differences between the services provided to the Fund and the other Legg Mason Closed-end Funds and the services provided to the Legg Mason Open-end Funds. The Board considered the fee comparisons in light of the different services provided in managing these other types of clients and funds.
Taking all of the above into consideration, the Board determined that the Management Fee and the Sub-Advisory Fees were reasonable in light of the nature, extent and overall quality of the management, investment advisory and other services provided to the Fund under the Management Agreement and the Sub-Advisory Agreements.
Manager profitability
The Board, as part of the Contract Renewal Information, received an analysis of the profitability to the Manager and its affiliates in providing services to the Fund for the Manager’s fiscal years ended March 31, 2011 and March 31, 2010. The Board also received profitability information with respect to the Legg Mason fund complex as a whole. In addition, the Board received Contract Renewal Information with respect to the Manager’s revenue and cost allocation methodologies used in preparing such profitability data. In 2007, the Board received a report from an outside consultant that had reviewed the Manager’s methodologies and the Board was assured by the Manager at the Contract Renewal Meeting that there had been no significant changes in those methodologies since the report was rendered. The profitability to each of the Sub-Advisers was not considered to be a material factor in the Board’s considerations since Western Asset’s Sub-Advisory Fees are paid by the Manager, not the Fund, and the Sub-Advisory Fees for Western Asset Singapore are paid by Western Asset, not the Fund. The profitability analysis presented to the Board indicated that profitability to the Manager had increased by 3 percent over the period covered by the analysis. The Board, however, concluded that profitability was not excessive in light of
| | Western Asset Variable Rate Strategic Fund Inc. | | 49 |
the nature, extent and overall quality of the investment advisory and other services provided to the Fund by the Manager and the Sub-Advisers.
Economies of scale
The Board received and discussed Contract Renewal Information concerning whether the Manager realizes economies of scale if the Fund’s assets grow. The Board noted that because the Fund is a closed-end fund with no current plans to seek additional assets beyond maintaining its dividend reinvestment plan, any significant growth in its assets generally will occur through appreciation in the value of the Fund’s investment portfolio, rather than sales of additional shares in the Fund. The Board determined that the Management Fee structure was appropriate under present circumstances.
Other benefits to the manager and the sub-advisers
The Board considered other benefits received by the Manager, the Sub-Advisers and their affiliates as a result of their relationship with the Fund and did not regard such benefits as excessive.
* * *
In light of all of the foregoing and other relevant factors, the Board determined that, under the circumstances, continuation of the Management Agreement and the Sub-Advisory Agreements would be consistent with the interests of the Fund and its shareholders and unanimously voted to continue each Agreement for a period of one additional year.
No single factor reviewed by the Board was identified by the Board as the principal factor in determining whether to approve continuation of the Management Agreement and the Sub-Advisory Agreements, and each Board member attributed different weights to the various factors. The Independent Directors were advised by separate independent legal counsel throughout the process. Prior to the Contract Renewal Meeting, the Board received a memorandum prepared by the Manager discussing its responsibilities in connection with the proposed continuation of the Management Agreement and the Sub-Advisory Agreements as part of the Contract Renewal Information and the Independent Directors separately received a memorandum discussing such responsibilities from their independent counsel. Prior to voting, the Independent Directors also discussed the proposed continuation of the Management Agreement and the Sub-Advisory Agreements in private sessions with their independent legal counsel at which no representatives of the Manager were present.
50 | | Western Asset Variable Rate Strategic Fund Inc. | | |
Additional shareholder information (unaudited)
Results of annual meeting of shareholders
The Annual Meeting of Shareholders of Western Asset Variable Rate Strategic Fund Inc. was held on January 27, 2012 for the purpose of considering and voting upon the election of Directors. The following table provides information concerning the matter voted upon at the Meeting:
Election of directors
Nominees | | Votes For | | Votes Withheld |
Carol L. Colman | | 4,634,234 | | 320,190 | |
Daniel P. Cronin | | 4,638,945 | | 315,479 | |
At March 31, 2012, in addition to Carol L. Colman and Daniel P. Cronin, the other Directors of the Fund were as follows:
Paolo M. Cucchi
Leslie H. Gelb
R. Jay Gerken
Riordan Roett
Jeswald W. Salacuse
William R. Hutchinson
| | Western Asset Variable Rate Strategic Fund Inc. | | 51 |
Dividend reinvestment plan (unaudited)
Unless you elect to receive distributions in cash (i.e., opt-out), all distributions, on your common shares (the “Common Shares”) will be automatically reinvested by American Stock Transfer & Trust Company (“AST”), as agent for the holders of Common Shares (the “Common Shareholders”) (the “Plan Agent”), in additional Common Shares under the Dividend Reinvestment Plan (the “Plan”). You may elect not to participate in the Plan by contacting the Plan Agent. If you do not participate, you will receive all cash distributions paid by check mailed directly to you by AST, as dividend paying agent.
If you participate in the Plan, the number of Common Shares you will receive will be determined as follows:
1. If the market price of the Common Shares on the record date (or, if the record date is not a New York Stock Exchange (the “Exchange”) trading day, the immediately preceding trading day) for determining shareholders eligible to receive the relevant dividend or distribution (the “determination date”) is equal to or exceeds 98% of the net asset value per share of the Common Shares, the Fund will issue new Common Shares at a price equal to the greater of (a) 98% of the net asset value per share at the close of trading on the Exchange on the determination date or (b) 95% of the market price per share of the Common Shares on the determination date.
2. If 98% of the net asset value per share of the Common Shares exceeds the market price of the Common Shares on the determination date, the Plan Agent will receive the distribution in cash and will buy Common Shares in the open market, on the Exchange or elsewhere, for your account as soon as practicable commencing on the trading day following the determination date and terminating no later than the earlier of (a) 30 days after the distribution payment date, or (b) the record date for the next succeeding distribution to be made to the Common Shareholders; except when necessary to comply with applicable provisions of the federal securities laws. If during this period: (i) the market price rises so that it equals or exceeds 98% of the net asset value per share of the Common Shares at the close of trading on the Exchange on the determination date before the Plan Agent has completed the open market purchases or (ii) if the Plan Agent is unable to invest the full amount eligible to be reinvested in open market purchases, the Plan Agent will cease purchasing Common Shares in the open market and the Fund shall issue the remaining Common Shares at a price per share equal to the greater of (a) 98% of the net asset value per share at the close of trading on the Exchange on the determination date or (b) 95% of the then current market price per share.
The Plan Agent maintains all participants’ accounts in the Plan and gives written confirmation of all transactions in the accounts, including information you may need for tax records. Common Shares in your account will be held by the Plan Agent in noncertificated form. Any proxy you receive will include all Common Shares you have received under the Plan.
52 | | Western Asset Variable Rate Strategic Fund Inc. | | |
Dividend reinvestment plan (unaudited) (cont’d)
You may withdraw from the Plan by notifying the Plan Agent in writing at 59 Maiden Lane, New York, New York 10038 or by calling the Plan Agent at 1-888-888-0151. Such withdrawal will be effective immediately if notice is received by the Plan Agent not less than ten business days prior to any distribution record date; otherwise such withdrawal will be effective as soon as practicable after the Plan Agent’s investment of the most recently declared distribution on the Common Shares. The Plan may be terminated by the Fund upon notice in writing mailed to Common Shareholders at least 30 days prior to the record date for the payment of any distribution by the Fund for which the termination is to be effective. Upon any termination, you will be sent a certificate or certificates for the full Common Shares held for you under the Plan and cash for any fractional Common Shares. You may elect to notify the Plan Agent in advance of such termination to have the Plan Agent sell part or all of your shares on your behalf. You will be charged a service charge and the Plan Agent is authorized to deduct brokerage charges actually incurred for this transaction from the proceeds.
There is no service charge for reinvestment of your distributions in Common Shares. However, all participants will pay a pro rata share of brokerage commissions incurred by the Plan Agent when it makes open market purchases. Because all distributions will be automatically reinvested in additional Common Shares, this allows you to add to your investment through dollar cost averaging, which may lower the average cost of your Common Shares over time. Dollar cost averaging is a technique for lowering the average cost per share over time if the Fund’s net asset value declines. While dollar cost averaging has definite advantages, it cannot assure profit or protect against loss in declining markets. Investors will be subject to income tax on amounts reinvested under the plan.
Automatically reinvesting distributions does not mean that you do not have to pay income taxes due upon receiving distributions.
The Fund reserves the right to amend or terminate the Plan if, in the judgment of the Board of Directors, the change is warranted. There is no direct service charge to participants in the Plan; however, the Fund reserves the right to amend the Plan to include a service charge payable by the participants. Additional information about the Plan and your account may be obtained from the Plan Agent at 1-888-888-0151.
Western Asset
Variable Rate Strategic Fund Inc.
Directors | | Western Asset Variable Rate Strategic Fund Inc. | | Independent registered public accounting firm |
Carol L. Colman | | 620 Eighth Avenue | | KPMG LLP |
Daniel P. Cronin | | 49th Floor | | 345 Park Avenue |
Paolo M. Cucchi | | New York, NY 10018 | | New York, NY 10154 |
Leslie H. Gelb | | | | |
R. Jay Gerken | | Investment manager | | Legal counsel |
Chairman | | Legg Mason Partners Fund Advisor, LLC | | Simpson Thacher & Bartlett LLP |
William R. Hutchinson | | | | 425 Lexington Avenue |
Riordan Roett | | Subadvisers | | New York, NY 10017 |
Jeswald W. Salacuse | | Western Asset Management Company | | |
| | Western Asset Management Company Limited | | New York Stock Exchange Symbol |
Officers | | Western Asset Management Company Pte. Ltd. | | GFY |
R. Jay Gerken | | | | |
President and | | Custodian | | |
Chief Executive Officer | | State Street Bank and Trust Company | | |
Richard F. Sennett | | 1 Lincoln Street | | |
Principal Financial Officer | | Boston, MA 02111 | | |
Ted P. Becker | | | | |
Chief Compliance Officer | | Transfer agent | | |
Vanessa A. Williams | | American Stock Transfer & Trust Company | | |
Identity Theft Prevention Officer | | 59 Maiden Lane | | |
Robert I. Frenkel | | New York, NY 10038 | | |
Secretary and | | | | |
Chief Legal Officer | | | | |
Thomas C. Mandia | | | | |
Assistant Secretary | | | | |
Steven Frank | | | | |
Treasurer | | | | |
Jeanne M. Kelly | | | | |
Senior Vice President | | | | |
Legg Mason Funds Privacy and Security Notice
Your Privacy and the Security of Your Personal Information is Very Important to the Legg Mason Funds
This Privacy and Security Notice (the “Privacy Notice”) addresses the Legg Mason Funds’ privacy and data protection practices with respect to nonpublic personal information the Funds receive. The Legg Mason Funds include any funds sold by the Funds’ distributor, Legg Mason Investor Services, LLC, as well as Legg Mason-sponsored closed-end funds and certain closed-end funds managed or sub-advised by Legg Mason or its affiliates. The provisions of this Privacy Notice apply to your information both while you are a shareholder and after you are no longer invested with the Funds.
The Type of Nonpublic Personal Information the Funds Collect About You
The Funds collect and maintain nonpublic personal information about you in connection with your shareholder account. Such information may include, but is not limited to:
· Personal information included on applications or other forms;
· Account balances, transactions, and mutual fund holdings and positions;
· Online account access user IDs, passwords, security challenge question responses; and
· Information received from consumer reporting agencies regarding credit history and creditworthiness (such as the amount of an individual’s total debt, payment history, etc.).
How the Funds Use Nonpublic Personal Information About You
The Funds do not sell or share your nonpublic personal information with third parties or with affiliates for their marketing purposes, or with other financial institutions or affiliates for joint marketing purposes, unless you have authorized the Funds to do so. The Funds do not disclose any nonpublic personal information about you except as may be required to perform transactions or services you have authorized or as permitted or required by law. The Funds may disclose information about you to:
· Employees, agents, and affiliates on a “need to know” basis to enable the Funds to conduct ordinary business or comply with obligations to government regulators;
· Service providers, including the Funds’ affiliates, who assist the Funds as part of the ordinary course of business (such as printing, mailing services, or processing or servicing your account with us) or otherwise perform services on the Funds’ behalf, including companies that may perform marketing services solely for the Funds;
· The Funds’ representatives such as legal counsel, accountants and auditors; and
· Fiduciaries or representatives acting on your behalf, such as an IRA custodian or trustee of a grantor trust.
| | | | |
| | NOT PART OF THE SEMI-ANNUAL REPORT | | |
| | | | |
Legg Mason Funds Privacy and Security Notice (cont’d)
Except as otherwise permitted by applicable law, companies acting on the Funds’ behalf are contractually obligated to keep nonpublic personal information the Funds provide to them confidential and to use the information the Funds share only to provide the services the Funds ask them to perform.
The Funds may disclose nonpublic personal information about you when necessary to enforce their rights or protect against fraud, or as permitted or required by applicable law, such as in connection with a law enforcement or regulatory request, subpoena, or similar legal process. In the event of a corporate action or in the event a Fund service provider changes, the Funds may be required to disclose your nonpublic personal information to third parties. While it is the Funds’ practice to obtain protections for disclosed information in these types of transactions, the Funds cannot guarantee their privacy policy will remain unchanged.
Keeping You Informed of the Funds’ Privacy and Security Practices
The Funds will notify you annually of their privacy policy as required by federal law. While the Funds reserve the right to modify this policy at any time they will notify you promptly if this privacy policy changes.
The Funds’ Security Practices
The Funds maintain appropriate physical, electronic and procedural safeguards designed to guard your nonpublic personal information. The Funds’ internal data security policies restrict access to your nonpublic personal information to authorized employees, who may use your nonpublic personal information for Fund business purposes only.
Although the Funds strive to protect your nonpublic personal information, they cannot ensure or warrant the security of any information you provide or transmit to them, and you do so at your own risk. In the event of a breach of the confidentiality or security of your nonpublic personal information, the Funds will attempt to notify you as necessary so you can take appropriate protective steps. If you have consented to the Funds using electronic communications or electronic delivery of statements, they may notify you under such circumstances using the most current email address you have on record with them.
In order for the Funds to provide effective service to you, keeping your account information accurate is very important. If you believe that your account information is incomplete, not accurate or not current, or if you have questions about the Funds’ privacy practices, write the Funds using the contact information on your account statements, email the Funds by clicking on the Contact Us section of the Funds’ website at www.leggmason.com, or contact the Fund at 1-888-777-0102.
Revised April 2011
| | | | |
| | NOT PART OF THE SEMI-ANNUAL REPORT | | |
| | | | |
Western Asset Variable Rate Strategic Fund Inc.
Western Asset Variable Rate Strategic Fund Inc.
620 Eighth Avenue
49th Floor
New York, NY 10018
Notice is hereby given in accordance with Section 23(c) of the Investment Company Act of 1940, as amended, that from time to time the Fund may purchase, at market prices, shares of its common stock in the open market.
The Fund files its complete schedule of portfolio holdings with the Securities and Exchange Commission (“SEC”) for the first and third quarters of each fiscal year on Form N-Q. The Fund’s Forms N-Q are available on the SEC’s website at www.sec.gov. The Fund’s Forms N-Q may be reviewed and copied at the SEC’s Public Reference Room in Washington, D.C., and information on the operation of the Public Reference Room may be obtained by calling 1-800-SEC-0330. To obtain information on Form N-Q from the Fund, shareholders can call 1-888-777-0102.
Information on how the Fund voted proxies relating to portfolio securities during the prior 12-month period ended June 30th of each year and a description of the policies and procedures that the Fund uses to determine how to vote proxies related to portfolio transactions are available (1) without charge, upon request, by calling 1-888-777-0102, (2) on the Fund’s website at www.lmcef.com and (3) on the SEC’s website at www.sec.gov.
This report is transmitted to the shareholders of Western Asset Variable Rate Strategic Fund Inc. for their information. This is not a prospectus, circular or representation intended for use in the purchase of shares of the Fund or any securities mentioned in this report.
American Stock
Transfer & Trust Company
59 Maiden Lane
New York, NY 10038
WAS04036 5/12 SR12-1640
ITEM 2. CODE OF ETHICS.
Not applicable.
ITEM 3. AUDIT COMMITTEE FINANCIAL EXPERT.
Not applicable.
ITEM 4. PRINCIPAL ACCOUNTANT FEES AND SERVICES.
Not applicable.
ITEM 5. AUDIT COMMITTEE OF LISTED REGISTRANTS.
Not applicable.
ITEM 6. SCHEDULE OF INVESTMENTS.
Included herein under Item 1.
ITEM 7. DISCLOSURE OF PROXY VOTING POLICIES AND PROCEDURES FOR CLOSED-END MANAGEMENT INVESTMENT COMPANIES.
Not applicable.
ITEM 8. PORTFOLIO MANAGERS OF CLOSED-END MANAGEMENT INVESTMENT COMPANIES.
Not applicable.
ITEM 9. PURCHASES OF INCOME SECURITIES BY CLOSED-END MANAGEMENT INVESTMENT COMPANY AND AFFILIATED PURCHASERS.
Not applicable.
ITEM 10. SUBMISSION OF MATTERS TO A VOTE OF SECURITY HOLDERS.
Not applicable.
ITEM 11. CONTROLS AND PROCEDURES.
(a) The registrant’s principal executive officer and principal financial officer have concluded that the registrant’s disclosure controls and procedures (as defined in Rule 30a- 3(c) under the Investment Company Act of 1940, as amended (the “1940 Act”)) are effective as of a date within 90 days of the filing date of this report that includes the disclosure required by this paragraph, based on their evaluation of the disclosure controls and procedures required by Rule 30a-3(b) under the 1940 Act and 15d-15(b) under the Securities Exchange Act of 1934.
(b) There were no changes in the registrant’s internal control over financial reporting (as defined in Rule 30a-3(d) under the 1940 Act) that occurred during the second fiscal quarter of the period covered by this report that have materially affected, or are likely to materially affect the registrant’s internal control over financial reporting.
ITEM 12. EXHIBITS.
(a) (1) Not applicable.
Exhibit 99.CODE ETH
(a) (2) Certifications pursuant to section 302 of the Sarbanes-Oxley Act of 2002 attached hereto.
Exhibit 99.CERT
(b) Certifications pursuant to Section 906 of the Sarbanes-Oxley Act of 2002 attached hereto.
Exhibit 99.906CERT
SIGNATURES
Pursuant to the requirements of the Securities Exchange Act of 1934 and the Investment Company Act of 1940, the registrant has duly caused this Report to be signed on its behalf by the undersigned, there unto duly authorized.
Western Asset Variable Rate Strategic Fund Inc. | |
| | |
By: | /s/ R. Jay Gerken | |
| (R. Jay Gerken) | |
| Chief Executive Officer of | |
| Western Asset Variable Rate Strategic Fund Inc. | |
| | |
Date: | May 25, 2012 | |
Pursuant to the requirements of the Securities Exchange Act of 1934 and the Investment Company Act of 1940, this report has been signed below by the following persons on behalf of the registrant and in the capacities and on the dates indicated.
By: | /s/ R. Jay Gerken | |
| (R. Jay Gerken) | |
| Chief Executive Officer of | |
| Western Asset Variable Rate Strategic Fund Inc. | |
| | |
Date: | May 25, 2012 | |
| | |
By: | /s/ Richard F. Sennett | |
| (Richard F. Sennett) | |
| Principal Financial Officer of | |
| Western Asset Variable Rate Strategic Fund Inc. | |
| | |
Date: | May 25, 2012 | |