UNITED STATES
SECURITIES AND EXCHANGE COMMISSION
Washington, D.C. 20549
FORM N-CSR
CERTIFIED SHAREHOLDER REPORT OF REGISTERED
MANAGEMENT INVESTMENT COMPANIES
| | |
Investment Company Act file number 811-21609 |
Salomon Brothers Variable Rate Strategic Fund Inc.
|
| (Exact name of registrant as specified in charter) |
| | |
| 125 Broad Street, New York, NY | | 10004 |
| (Address of principal executive offices) | | (Zip code) |
Robert I. Frenkel, Esq.
C/o Citigroup Asset Management
300 First Stamford Place, 4th Floor
Stamford, CT 06902
|
| (Name and address of agent for service) |
Registrant’s telephone number, including area code: (800) 725-6666
Date of fiscal year end: September 30
Date of reporting period: September 30, 2005
| ITEM 1. | REPORT TO STOCKHOLDERS. |
The Annual Report to Stockholders is filed herewith.
EXPERIENCE
ANNUAL REPORT
SEPTEMBER 30, 2005


Salomon Brothers
Variable Rate Strategic Fund Inc.
INVESTMENT PRODUCTS: NOT FDIC INSURED Ÿ NO BANK GUARANTEE Ÿ MAY LOSE VALUE
Salomon Brothers Variable Rate Strategic Fund Inc.
Annual Report • September 30, 2005
What’s
Inside
Fund Objective
The Fund’s investment objective is to maintain a high level of current income.
Letter from the Chairman

R. JAY GERKEN, CFA
Chairman and Chief Executive Officer
Dear Shareholder,
There was no shortage of potential threats to the U.S. economy during the reporting period. These included record high oil prices, rising short-term interest rates, the devastation inflicted by Hurricanes Katrina and Rita, geopolitical issues, and falling consumer confidence. However, the economy proved to be surprisingly resilient during the fiscal year of this report. Fourth quarter 2004 and first quarter 2005 gross domestic product (“GDP”)i growth was 3.8% and second quarter GDP growth was 3.3%, another solid advance. This marked nine consecutive quarters in which GDP grew 3.0% or more.
The Federal Reserve Board (“Fed”)ii continued to raise interest rates over the period in an attempt to ward off inflation. After raising rates in June, August, and September 2004, the Fed increased its target for the federal funds rateiii in 0.25% increments eight additional times. All told, the Fed’s 11 rate hikes have brought the target for the federal funds rate from 1.00% to 3.75% by the end of the period of this report. This also represents the longest sustained Fed tightening cycle since 1977-1979. Following the end of the Fund’s reporting period, at its November meeting, the Fed once again raised the target rate by 0.25% to 4.00%.
During much of the reporting period, the fixed income market confounded investors as short-term interest rates rose in concert with the Fed rate tightening, while longer-term rates, surprisingly, declined. When the period began, the federal funds target rate was 1.75% and the yield on the 10-year Treasury was 4.21%. When the reporting period ended, the federal funds rate had risen to 3.75%. Due to a spike in September, the 10-year yield finished the period at 4.29%, slightly higher than when the period began, but still lower than its yield of 4.62% when the Fed began its tightening cycle on June 30, 2004. Looking at the one-year period
Salomon Brothers Variable Rate Strategic Fund Inc. 2005 Annual Report 1
as a whole, the overall bond market, as measured by the Lehman Brothers Aggregate Bond Indexiv returned 2.80%.
The high yield market experienced several periods of volatility during the reporting period. After a strong start, high yield bonds fell sharply in March and April 2005 as investors became concerned over the bond downgrades for General Motors and Ford Motor Company. However, the high yield market then rallied as the uncertainty surrounding the downgrades lifted and investors searched for incremental yield. Over the one-year period, the Citigroup High Yield Market Indexv returned 6.49%.
During the one-year period, emerging markets debt, as represented by the JPMorgan Emerging Markets Bond Index Global (“EMBI Global”)vi returned 14.00%. Improving country fundamentals and strong market technicals outweighed the downward pressure exerted throughout the period by Fed tightening. In addition, continued strength in commodity prices, including metals, agriculture, and oil, supported many emerging market countries.
Please read on for a more detailed look at prevailing economic and market conditions during the Fund’s most recent fiscal year and to learn how those conditions have affected Fund performance.
Special Shareholder Notice
On June 24, 2005, Citigroup Inc. (“Citigroup”) announced that it has signed a definitive agreement under which Citigroup will sell substantially all of its worldwide asset management business to Legg Mason, Inc. (“Legg Mason”).
As part of this transaction, Salomon Brothers Asset Management Inc (the “Manager”), currently an indirect wholly owned subsidiary of Citigroup, would become an indirect wholly owned subsidiary of Legg Mason. The Manager is the investment manager to the Fund.
The transaction is subject to certain regulatory approvals, as well as other customary conditions to closing. Subject to such approvals and the satisfaction of the other conditions, Citigroup expects the transaction to be completed later this year.
Under the Investment Company Act of 1940, consummation of the transaction will result in the automatic termination of the investment advisory contract between the Fund and the Manager. Therefore the Fund’s Board of Directors has approved a new investment advisory contract between the Fund and the Manager to become effective upon the closing of the sale to Legg Mason. The new investment advisory contract has been presented to shareholders for their approval.
Information About Your Fund
As you may be aware, several issues in the mutual fund industry have recently come under the scrutiny of federal and state regulators. The Fund’s Manager and some of its affiliates
2 Salomon Brothers Variable Rate Strategic Fund Inc. 2005 Annual Report
have received requests for information from various government regulators regarding market timing, late trading, fees, and other mutual fund issues in connection with various investigations. The regulators appear to be examining, among other things, open-end fund’s response to market timing and shareholder exchange activity, including compliance with prospectus disclosure related to these subjects. The Fund has been informed that the Manager and its affiliates are responding to those information requests, but are not in a position to predict the outcome of these requests and investigations.
Important information concerning the Fund and its Manager with regard to recent regulatory developments is contained in the Notes to the Financial Statements included in this report.
As always, thank you for your confidence in our stewardship of your assets. We look forward to helping you continue to meet your financial goals.
Sincerely,

R. Jay Gerken, CFA
Chairman and Chief Executive Officer
November 1, 2005
Salomon Brothers Variable Rate Strategic Fund Inc. 2005 Annual Report 3
Manager Overview
Investment Grade Market Review
During the 12 months ended September 30, 2005, markets were primarily driven by Fed activity, employment and inflation data and rising energy costs, exacerbated near period end by the devastating impact of Hurricane Katrina on the U.S. Gulf Coast. The Fed’s eight “measured” 25-basis-pointvii hikes during the period brought the federal funds rate to 3.75% from 1.75% by the end of the period. Following the end of the Fund’s reporting period, at its November meeting, the Fed once again raised the target rate by 0.25% to 4.00%. This exerted upward pressure on short-term bond yields, driving 2-year yields up about 156 basis points during the 12 months covered by this report. However, in what Fed Chairman Alan Greenspan termed a “conundrum,” long-term bond yields did not begin to rise and, in fact, continued to decline. Ten-year yields visited levels well below 4.00% during the 12 months of this report before leveling approximately 30 basis points lower by the end of the period. This sharp rise in short-term yields and continued decline in long-term yields resulted in the extensive yield curveviii flattening seen during the period.
As the market fully expected each 25-basis-point hike in the federal funds rate during the period — thanks to the Fed’s well-advertised intentions to raise rates at a measured pace — investors spent much of the period dissecting language from the Fed for clues on its assessment of the U.S. economy and the pace of rate hikes. The Fed reiterated throughout the year that it would increase rates “at a pace that is likely to be measured” and, starting in June 2004, added that, “the Committee will respond to changes in economic prospects as needed to fulfill its obligation to maintain price stability.” In its most recent statement (from the September 20th meeting), the Fed noted that core inflation remained low and long-term inflation expectations remained “contained” (even if the language was downgraded from the “well contained” language used at prior meetings).
Slowing global growth, rising inflation and surging oil prices undoubtedly restrained economic activity during the period, with GDP declining year-over-year to 3.8% growth in first quarter 2005 (from first quarter 2004’s 4.5% pace) and to 3.4% growth in second quarter 2005 (from second quarter 2004’s 3.5%). Although growth remained strong throughout the period, fears of potential slowing, combined with increasing inflation, drove markets. Oil prices, which breached $70 per barrel before the reporting period’s end, continue to cast a pall on growth and consumer spending expectations. This was particularly true in the latter half of the period, as investors assessed the potential impact on U.S. economic growth of Hurricanes Katrina and Rita, inflation and the pace of interest rates caused growth indicators to turn increasingly mixed. For example, the U.S. labor market began to pick up in early 2004 and continued to improve through most of the Fund’s most recent fiscal year, although the pace of improvement remained uneven from month to month. Unemployment fell through the majority of the period, declining from 5.4% in September 2004 to 4.9% in August 2005. However, most recent unemployment numbers skyrocketed, even if not as much as expected, in the wake of Hurricane Katrina, and the unemployment rate rose to 5.1% in September. Industrial production and retail sales also
4 Salomon Brothers Variable Rate Strategic Fund Inc. 2005 Annual Report
remained positive through most of the period, even considering the volatility in the auto sector as General Motors and Ford were successively downgraded by three major credit rating agencies to below investment grade. Again, however, as with employment, industrial production and retail sales data turned negative near the reporting period’s end as the effects of Hurricane Katrina roiled through the economy, reductions in auto production hit the market and the highly successful automotive dealer incentive packages offered through the summer came to an end.
Core inflation rates remained relatively subdued throughout the period, with only first quarter 2005 seeing moderate increases, despite growing inflationary pressure from continually high and rising energy prices. Despite some volatility month to month, Core Consumer Price Index (CPI) inflation remained constant year-over-year, and core Producer Price Index (PPI) edged up only 0.7% in September 2005 versus September 2004. The core PCE deflator, which is the Fed’s preferred measure of inflation, increased 0.9% year-over-year in the latest August reading.
High Yield Market Review
During the 12 months ended September 30, 2005, the high yield market, as represented by the Citigroup High Yield Market Index, returned 6.49%. High yield debt markets rallied from the start of the period in September 2004 through the remainder of 2004 as investors gained confidence that inflation was contained and the Fed would continue to raise rates at a “measured pace.” Reduced U.S. Treasury market volatility, combined with the continued low interest rate environment, set a positive tone for high yield, engendering generally positive mutual fund flows and contributing both to the record number of deals that came to market during 2004 and strong demand for higher yielding assets. Additionally, default rates reached 20-year lows as the improving economy and the low interest rate environment enabled companies to extend their debt maturities and improve their liquidity.
Rising oil prices, weak equity markets and isolated hawkish comments from the Fed regarding inflation led the market down in the first few months of 2005. The steady stream of negative auto sector headlines through Spring 2005, including General Motor’s unexpected negative earnings warning in mid-March and Ford’s reduced earnings guidance and second quarter production cuts announced in late April, reintroduced investor fears of both companies’ potential downgrades to high yield status. This caused spreads to widen dramatically within the auto sector and across fixed income credit markets. Markets began recovering in mid-May on stronger technicals, positive economic developments and S&P and Fitch’s long-anticipated downgrades of Ford and GM to non-investment grade. The rating agencies’ actions removed some of the uncertainty in the market surrounding the credits’ ultimate resting places, allowing both high yield and investment grade investors to shore up their positions.
Improving technicals, better overall demand and the relative absence of further negative headlines continued to buoy markets through June and July, despite a stronger new issue
Salomon Brothers Variable Rate Strategic Fund Inc. 2005 Annual Report 5
calendar in June and renewed outflows from high yield mutual funds. Resurgent investor risk appetites on the back of strong U.S. economic news and positive 2Q earnings announcements also contributed to positive performance, allowing markets to outperform despite the July 7th terrorist bombings in London (and the July 21st reprise) and weaker consumer sentiment.
However, higher-than-expected August new issuance, combined with stronger inflation, increasingly mixed economic data and rising energy prices, slowed activity near the end of the reporting period, although low trading volumes and light issuance in the latter half of August (ahead of the Labor Day holiday) kept markets in positive territory. High yield markets continued to decline through September end, registering the first month of negative performance since April 2005, as volatility in the auto sector, higher energy costs, rising inflation and fears of a potentially slowing economy in the aftermath of Hurricane Katrina converged with abundant new supply and continued retail outflows following the Labor Day holiday.
Based on the 7.85% yieldix of the Citigroup High Market Yield Index as of September 30, 2005, we believe high-yield bonds continued to offer competitive yields relative to U. S. Treasury notes.x However, high-yield issues are subject to additional risks, such as the increased possibility of default because of their lower credit quality, and yields and prices will fluctuate.
Emerging Markets Debt Review
Emerging markets debt returned 14.00% during the 12 months ended September 30, 2005, as represented by the EMBI Global. Strong country fundamentals and market technicals offset the downward pressure exerted by increases in the federal funds rate throughout the 12 months of this report and credit contagion from the auto sector during the volatile Spring of 2005. Continued progress on political and economic reform in many emerging countries and the generally positive macro environment supported broad credit quality improvements across emerging markets during the 12 months of this report.
Sovereign debt markets achieved positive momentum at the start of the period of this report after recovering from depressed levels earlier in 2004 and rallied through the remainder of the year. Positive returns were supported by strong underlying country fundamentals, commodity prices strength (particularly in metals, agriculture and oil) and relatively low U.S. Treasury market volatility. Emerging debt continued to trend positive during the first two months of 2005 despite concerns over the path of U.S. interest rates, risks of higher inflation and new bond issuance weighing on the market. However, indications of potentially more aggressive tightening (50-basis-point increments) from the Fed and increasingly prominent inflation worries led the market down in March, broadly in line with the U.S. Treasury market. Emerging debt markets remained under pressure in early April as spillover from volatile credit markets, with the highly visible troubles in the auto sector, worsened technicals.
6 Salomon Brothers Variable Rate Strategic Fund Inc. 2005 Annual Report
Markets turned again by mid-April and followed a generally upward trajectory through the remainder of the period as U.S. Treasury market volatility declined, the U.S. equity market recovered and country fundamentals remained broadly supportive. Although sovereign market volatility trended upward near the end of the period of this report, emerging markets proved relatively resilient, boosted by strong investor demand for greater risk assets despite the early July terrorist bombings in London, continued political noise in key emerging countries and increasing volatility in U.S. Treasuries.
Spreads tightened 174 basis points during the 12-month period ended September 30, 2005, closing at 235 basis points over U.S. Treasuries. Of note, sovereign spreads tightened 67 basis points alone during the month of June 2005 due primarily to index rebalancing with the conclusion of the Argentine bond exchange. Over the period of this report, 12-month return volatility stood at 4.69%,xi substantially below long-term, historical levels of approximately 16%.
Performance Review
Since the Fund’s inception on October 26, 2004 through September 30, 2005, the Salomon Brothers Variable Rate Strategic Fund Inc. returned –9.82%, based on its New York Stock Exchange (“NYSE”) market price and 7.06% based on its net asset value (“NAV”)xii per share. In comparison, the Fund’s unmanaged benchmark, the Lehman Brothers Aggregate Bond Index returned 1.94% 10/31/04-9/30/05 month-end only. The Lipper Global Income Closed-End Funds Category Averagexiii increased 6.09% from October 31, 2004 through September 30, 2005. Please note that Lipper performance returns are based on a Fund’s NAV.
During the period ended September 30, 2005, the Fund made distributions to shareholders totaling $0.8975 per share, (which may have included a return of capital). The performance table shows the Fund’s September 30, 2005 total return based on its NAV and market price as of September 30, 2005. Past performance is no guarantee of future results.
| | | | | |
| Fund Performance as of September 30, 2005 (unaudited) | |
| | |
Price
Per Share | | | | 10/26/04-9/30/05
Total Return | |
| | | | | | |
$19.47 (NAV) | | | | 7.06 | % |
|
|
$17.16 (Market Price) | | | | -9.82 | % |
|
|
| | | | |
| All figures represent past performance and are not a guarantee of future results. |
|
| Total returns are based on changes in NAV or market price, respectively. Total returns assume the reinvestment of all distributions, including returns of capital, if any, in additional shares. |
Salomon Brothers Variable Rate Strategic Fund Inc. 2005 Annual Report 7
Factors Influencing Fund Performance
Although the Fund maintained a higher allocation to emerging markets debt during the early part of the period of this report, we decreased our allocation to emerging markets toward the period’s end based on relative value. As emerging markets spreads continued to narrow toward historical levels, we reallocated assets into U.S. high yield, which saw spreads widening. We also increased our overall exposure to U.S. investment grade debt, particularly mortgage-backed securities, since the Fund’s inception.
Finally, we gradually decreased interest rate sensitivity (i.e., duration) throughout the reporting period as rates rose on the short end of the curve and maintained a high average credit quality throughout the reporting period, which helped to insulate the Fund from net asset value (“NAV”) volatility during periods of credit weakness while maintaining overall yield.
Looking for Additional Information?
The Fund is traded under the symbol “GFY” and its closing market price is available in most newspapers under the NYSE listings. The daily NAV is available on-line under symbol XGFYX. Barron’s and The Wall Street Journal’s Monday editions carry closed-end fund tables that provide additional information. In addition, the Fund issues a quarterly press release that can be found on most major financial websites as well as www.citigroupam.com.
In a continuing effort to provide information concerning the Fund, shareholders may call 1-888-777-0102 or 1-800-SALOMON (toll free), Monday through Friday from 8:00 a.m. to 6:00 p.m. Eastern Time, for the Fund’s current NAV, market price, and other information.
Thank you for your investment in the Salomon Brothers Variable Rate Strategic Fund Inc. As ever, we appreciate that you have chosen us to manage your assets and we remain focused on achieving the Fund’s investment goals.
Sincerely,
| | | | |
 | |  | |  |
| Peter J. Wilby | | James E. Craige | | Roger Lavan |
| President | | Portfolio Manager | | Portfolio Manager |
| | |
 | |  | |  |
| David Torchia | | Beth A. Semmel | | David Scott |
| Portfolio Manager | | Portfolio Manager | | Portfolio Manager |
October 27, 2005
8 Salomon Brothers Variable Rate Strategic Fund Inc. 2005 Annual Report
The information provided is not intended to be a forecast of future events, a guarantee of future results or investment advice. Views expressed may differ from those of the firm as a whole.
RISKS: The Fund is a non-diversified, closed-end management investment company designed primarily as a long-term investment and not as a trading vehicle. The Fund is not intended to be a complete investment program and, due to the uncertainty inherent in all investments, there can be no assurance that the Fund will achieve its investment objective. Your Common Shares at any point in time may be worth less than you invested, even after taking into account the reinvestment of Fund distributions. The Fund may invest in high-yield and foreign securities, including emerging markets, which involve risks beyond those inherently in solely higher-rated and domestic investments. High-yield bonds involve greater credit and liquidity risks than investment grade bonds. Investing in foreign securities is subject to certain risks not associated with domestic investing, such as currency fluctuations, and changes in political and economic conditions. These risks are magnified in emerging or developing markets. Derivatives, such as options or futures, can be illiquid and harder to value, especially in declining markets. A small investment in certain derivatives may have a potentially large impact on the Fund’s performance. As interest rates rise, bond prices fall, reducing the value of the Fund’s share price.
All index performance reflects no deduction for fees, expenses or taxes. Please note that an investor cannot invest directly in an index.
| i | | Gross domestic product is a market value of goods and services produced by labor and property in a given country. |
| ii | | The Federal Reserve Board is responsible for the formulation of a policy designed to promote economic growth, full employment, stable prices, and a sustainable pattern of international trade and payments. |
| iii | | The federal funds rate is the interest rate that banks with excess reserves at a Federal Reserve district bank charge other banks that need overnight loans. |
| iv | | The Lehman Brothers Aggregate Bond Index is a broad-based bond index comprised of Government, Corporate, Mortgage and Asset-backed issues, rated investment grade or higher, and having at least one year to maturity. |
| v | | The Citigroup High Yield Market Index is a broad-based unmanaged index of high yield securities. |
| vi | | JPMorgan Emerging Markets Bond Index Global (“EMBI Global”) tracks total returns for U.S. dollar denominated debt instruments issued by emerging market sovereign and quasi-sovereign entities: Brady bonds, loans, Eurobonds, and local market instruments. Countries covered are Algeria, Argentina, Brazil, Bulgaria, Chile, China, Colombia, Cote d’Ivoire, Croatia, Ecuador, Greece, Hungary, Lebanon, Malaysia, Mexico, Morocco, Nigeria, Panama, Peru, the Philippines, Poland, Russia, South Africa, South Korea, Thailand, Turkey and Venezuela. |
| vii | | A basis point is one one-hundredth (1/100 or 0.01) of one percent. |
| viii | | The yield curve is the graphical depiction of the relationship between the yield on bonds of the same credit quality but different maturities. |
| ix | | As measured by the yield on the Citigroup High Yield Market Index as of the reporting period’s close. |
| x | | Yields are subject to change and will fluctuate. |
| xii | | NAV is calculated by subtracting total liabilities from the closing value of all securities held by the Fund (plus all other assets) and dividing the result (total net assets) by the total number of the common shares outstanding. The NAV fluctuates with changes in the market prices of securities in which the Fund has invested. However, the price at which an investor may buy or sell shares of the Fund is at the Fund’s market price as determined by supply of and demand for the Fund’s shares. |
| xiii | | Lipper, Inc. is a major independent mutual-fund tracking organization. Returns are based on the time period from October 31, 2004 through September 30, 2005, including the reinvestment of distributions, including returns of capital, if any, calculated among the 9 funds in the Fund’s Lipper category, and excluding sales charges. |
Salomon Brothers Variable Rate Strategic Fund Inc. 2005 Annual Report 9
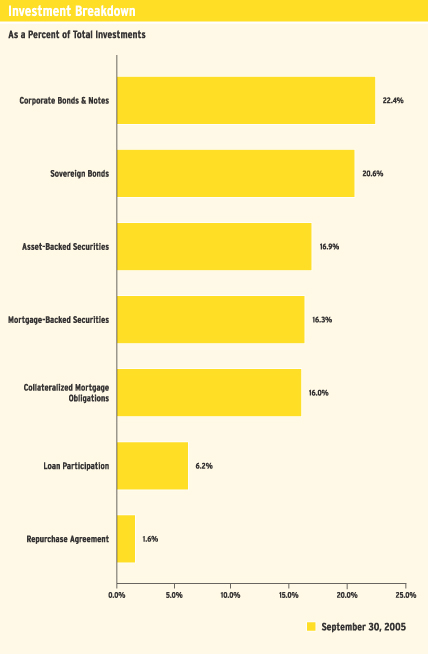
Fund at a Glance (unaudited)
10 Salomon Brothers Variable Rate Strategic Fund Inc. 2005 Annual Report
Schedule of Investments (September 30, 2005)
| | | | | | | |
| | |
Face
Amount | | Security | | Value | |
| | | | | | | | |
| | CORPORATE BONDS & NOTES — 22.4% | |
| | Advertising — 0.2% | |
| $ | 100,000 | | Bear Creek Corp., Senior Notes, 9.000% due 3/1/13 (a) | | $ | 104,000 | |
| | 375,000 | | Vertis Inc., Senior Second Lien Secured Notes, 9.750% due 4/1/09 | | | 389,063 | |
|
|
|
| | | | Total Advertising | | | 493,063 | |
|
|
|
| | Aerospace/Defense — 0.4% | |
| | 100,000 | | DRS Technologies Inc., Senior Subordinated Notes, 6.875% due 11/1/13 | | | 97,000 | |
| | 250,000 | | L-3 Communications Corp., Senior Subordinated Notes, 7.625% due 6/15/12 | | | 263,750 | |
| | 225,000 | | Moog Inc., Senior Subordinated Notes, 6.250% due 1/15/15 | | | 227,250 | |
| | 375,000 | | Sequa Corp., Senior Notes, Series B, 8.875% due 4/1/08 | | | 391,875 | |
|
|
|
| | | | Total Aerospace/Defense | | | 979,875 | |
|
|
|
| | Airlines — 0.0% | |
| | 100,000 | | Continental Airlines Inc., Senior Notes, 8.000% due 12/15/05 | | | 99,750 | |
|
|
|
| | Apparel — 0.2% | |
| | | | Levi Strauss & Co., Senior Notes: | | | | |
| | 25,000 | | 8.254% due 4/1/12 (b) | | | 25,063 | |
| | 25,000 | | 12.250% due 12/15/12 | | | 27,750 | |
| | 275,000 | | 9.750% due 1/15/15 | | | 281,875 | |
| | 125,000 | | Oxford Industries Inc., Senior Notes, 8.875% due 6/1/11 | | | 130,625 | |
|
|
|
| | | | Total Apparel | | | 465,313 | |
|
|
|
| | Auto Manufacturers — 0.5% | |
| | | | Ford Motor Co.: | | | | |
| | 50,000 | | Debentures, 6.625% due 10/1/28 | | | 36,375 | |
| | 850,000 | | Notes, 7.450% due 7/16/31 | | | 667,250 | |
| | | | General Motors Corp., Senior Debentures: | | | | |
| | 50,000 | | 8.250% due 7/15/23 | | | 39,125 | |
| | 410,000 | | 8.375% due 7/15/33 | | | 321,850 | |
|
|
|
| | | | Total Auto Manufacturers | | | 1,064,600 | |
|
|
|
| | Auto Parts & Equipment — 0.1% | |
| | 50,000 | | Delphi Corp., Notes, 6.500% due 8/15/13 (c) | | | 33,750 | |
| | 100,000 | | Tenneco Automotive Inc., Senior Subordinated Notes, 8.625% due 11/15/14 | | | 101,250 | |
| | 125,000 | | TRW Automotive Inc., Senior Notes, 9.375% due 2/15/13 | | | 136,250 | |
|
|
|
| | | | Total Auto Parts & Equipment | | | 271,250 | |
|
|
|
| | Beverages — 0.1% | |
| | 225,000 | | Constellation Brands Inc., Senior Subordinated Notes, Series B,
8.125% due 1/15/12 | | | 238,781 | |
|
|
|
| | Building Materials — 0.4% | |
| | | | Associated Materials Inc.: | | | | |
| | 200,000 | | Senior Discount Notes, step bond to yield 15.752% due 3/1/14 | | | 101,000 | |
| | 100,000 | | Senior Subordinated Notes, 9.750% due 4/15/12 | | | 97,250 | |
| | 500,000 | | Goodman Global Holding Co. Inc., Senior Notes, 6.410% due 6/15/12 (a)(b) | | | 491,250 | |
| | 225,000 | | Nortek Inc., Senior Subordinated Notes, 8.500% due 9/1/14 | | | 208,125 | |
See Notes to Financial Statements.
Salomon Brothers Variable Rate Strategic Fund Inc. 2005 Annual Report 11
Schedule of Investments (September 30, 2005) (continued)
| | | | | | | |
| | |
Face
Amount | | Security | | Value | |
| | | | | | | | |
| | Building Materials — 0.4% (continued) | |
| $ | 125,000 | | Texas Industries, Inc., Senior Notes, 7.250% due 7/15/13 (a) | | $ | 130,625 | |
|
|
|
| | | | Total Building Materials | | | 1,028,250 | |
|
|
|
| | Chemicals — 1.3% | |
| | 200,000 | | Borden U.S. Finance Corp./Nova Scotia Finance ULC, Second Priority Senior Secured Notes, 9.000% due 7/15/14 (a) | | | 204,000 | |
| | 175,000 | | Compass Minerals Group Inc., Senior Subordinated Notes,
10.000% due 8/15/11 | | | 190,750 | |
| | 200,000 | | Equistar Chemicals LP/Equistar Funding Corp., Senior Notes,
10.625% due 5/1/11 | | | 219,000 | |
| | 200,000 | | New Market Corp., Senior Notes, 8.875% due 5/1/10 | | | 210,750 | |
| | | | Huntsman International LLC, Senior Subordinated Notes: | | | | |
| | 152,000 | | 10.125% due 7/1/09 | | | 157,130 | |
| | 75,000 | | 7.375% due 1/1/15 (a) | | | 72,188 | |
| | 100,000 | | Innophos Inc., Senior Subordinated Notes, 8.875% due 8/15/14 (a) | | | 102,750 | |
| | 125,000 | | ISP Holdings Inc., Senior Secured Notes, Series B, 10.625% due 12/15/09 | | | 132,812 | |
| | 375,000 | | Lyondell Chemical Co., Senior Secured Notes, 10.500% due 6/1/13 | | | 425,625 | |
| | 200,000 | | Nalco Co., Senior Subordinated Notes, 8.875% due 11/15/13 | | | 206,250 | |
| | 225,000 | | PQ Corp., Senior Subordinated Notes, 7.500% due 2/15/13 (a) | | | 219,375 | |
| | 200,000 | | Resolution Performance Products Inc., Senior Subordinated Notes,
13.500% due 11/15/10 | | | 213,500 | |
| | 225,000 | | Rhodia SA, Senior Notes, 7.625% due 6/1/10 | | | 220,500 | |
| | 300,000 | | Westlake Chemical Corp., Senior Notes, 8.750% due 7/15/11 | | | 324,750 | |
|
|
|
| | | | Total Chemicals | | | 2,899,380 | |
|
|
|
| | Commercial Services — 0.3% | |
| | 100,000 | | Allied Security Escrow Corp., Senior Subordinated Notes,
11.375% due 7/15/11 | | | 99,750 | |
| | | | Cenveo Corp.: | | | | |
| | 125,000 | | Senior Notes, 9.625% due 3/15/12 | | | 134,688 | |
| | 100,000 | | Senior Subordinated Notes, 7.875% due 12/1/13 | | | 97,000 | |
| | 425,000 | | Iron Mountain Inc., Senior Subordinated Notes, 8.625% due 4/1/13 | | | 447,312 | |
|
|
|
| | | | Total Commercial Services | | | 778,750 | |
|
|
|
| | Computers — 0.2% | |
| | 125,000 | | Seagate Technology HDD Holdings, Senior Notes, 8.000% due 5/15/09 | | | 131,875 | |
| | 50,000 | | SunGard Data Systems Inc., Senior Notes, 9.125% due 8/15/13 (a) | | | 52,063 | |
| | 225,000 | | Unisys Corp., Senior Notes, 6.875% due 3/15/10 | | | 218,250 | |
|
|
|
| | | | Total Computers | | | 402,188 | |
|
|
|
| | Containers & Packaging — 0.1% | |
| | 225,000 | | JSG Funding PLC, Senior Notes, 9.625% due 10/1/12 | | | 227,250 | |
|
|
|
| | Diversified Financial Services — 4.3% | |
| | 400,000 | | Alamosa Delaware Inc., Senior Notes, 11.000% due 7/31/10 | | | 453,000 | |
| | 188,000 | | BCP Crystal U.S. Holdings Corp., Senior Subordinated Notes,
9.625% due 6/15/14 | | | 210,090 | |
| | 100,000 | | CCM Merger Inc., Notes, 8.000% due 8/1/13 (a) | | | 101,375 | |
See Notes to Financial Statements.
12 Salomon Brothers Variable Rate Strategic Fund Inc. 2005 Annual Report
Schedule of Investments (September 30, 2005) (continued)
| | | | | | | |
| | |
Face
Amount | | Security | | Value | |
| | | | | | | | |
| | Diversified Financial Services — 4.3% (continued) | |
| | | | Ford Motor Credit Co., Notes: | | | | |
| $ | 3,000,000 | | 5.169% due 1/15/10 (b) | | $ | 2,736,531 | |
| | 175,000 | | 7.000% due 10/1/13 | | | 162,528 | |
| | | | General Motors Acceptance Corp.: | | | | |
| | 50,000 | | Bonds, 8.000% due 11/1/31 | | | 43,768 | |
| | | | Notes: | | | | |
| | 25,000 | | 7.250% due 3/2/11 | | | 23,272 | |
| | 4,000,000 | | 6.070% due 12/1/14 (b) | | | 3,369,592 | |
| | 500,000 | | 6.750% due 12/1/14 | | | 435,631 | |
| | 125,000 | | Global Cash Access LLC/Global Cash Finance Corp., Senior Subordinated Notes, 8.750% due 3/15/12 | | | 135,000 | |
| | 2,000,000 | | Residential Capital Corp., Notes, 5.385% due 6/29/07 (a)(b) | | | 2,017,544 | |
| | 325,000 | | Vanguard Health Holdings Co. I LLC, Senior Discount Notes, step bond to yield 9.731% due 10/1/15 | | | 237,250 | |
|
|
|
| | | | Total Diversified Financial Services | | | 9,925,581 | |
|
|
|
| | Electric — 0.9% | |
| | | | AES Corp., Senior Notes: | | | | |
| | 375,000 | | 9.375% due 9/15/10 | | | 415,312 | |
| | 25,000 | | 8.875% due 2/15/11 | | | 27,250 | |
| | 500,000 | | Calpine Corp., Second Priority Senior Secured Notes, 8.500% due 7/15/10 (a) | | | 360,000 | |
| | 375,000 | | Edison Mission Energy, Senior Notes, 9.875% due 4/15/11 | | | 446,250 | |
| | 348,000 | | NRG Energy Inc., Second Priority Senior Secured Notes, 8.000% due 12/15/13 | | | 372,360 | |
| | | | Reliant Energy Inc., Senior Secured Notes: | | | | |
| | 250,000 | | 9.250% due 7/15/10 | | | 272,500 | |
| | 200,000 | | 9.500% due 7/15/13 | | | 222,000 | |
|
|
|
| | | | Total Electric | | | 2,115,672 | |
|
|
|
| | Entertainment — 0.8% | |
| | 250,000 | | Choctaw Resort Development Enterprise, Senior Notes,
7.250% due 11/15/19 (a) | | | 252,187 | |
| | 350,000 | | Cinemark Inc., Senior Discount Notes, step bond to yield
10.033% due 3/15/14 | | | 246,750 | |
| | 125,000 | | Herbst Gaming Inc., Senior Subordinated Notes, 7.000% due 11/15/14 | | | 125,469 | |
| | 225,000 | | Isle of Capri Casinos Inc., Senior Subordinated Notes, 7.000% due 3/1/14 | | | 216,844 | |
| | 200,000 | | Mohegan Tribal Gaming Authority, Senior Subordinated Notes,
6.875% due 2/15/15 | | | 205,000 | |
| | 250,000 | | Penn National Gaming Inc., Senior Subordinated Notes, 6.750% due 3/1/15 | | | 246,250 | |
| | 200,000 | | Pinnacle Entertainment Inc., Senior Subordinated Notes, 8.250% due 3/15/12 | | | 201,000 | |
| | 200,000 | | Scientific Games Corp., Series A, 6.250% due 12/15/12 | | | 200,000 | |
| | | | Six Flags Inc., Senior Notes: | | | | |
| | 200,000 | | 9.750% due 4/15/13 | | | 198,000 | |
| | 25,000 | | 9.625% due 6/1/14 | | | 24,750 | |
|
|
|
| | | | Total Entertainment | | | 1,916,250 | |
|
|
|
| | Environmental Control — 0.3% | |
| | 125,000 | | Aleris International Inc., Series B, Senior Secured Notes,
10.375% due 10/15/10 | | | 138,438 | |
See Notes to Financial Statements.
Salomon Brothers Variable Rate Strategic Fund Inc. 2005 Annual Report 13
Schedule of Investments (September 30, 2005) (continued)
| | | | | | | |
| | |
Face
Amount | | Security | | Value | |
| | | | | | | | |
| | Environmental Control — 0.3% (continued) | |
| | | | Allied Waste North America Inc.: | | | | |
| $ | 175,000 | | Senior Notes, 7.250% due 3/15/15 (a) | | $ | 173,250 | |
| | 167,000 | | Senior Secured Notes, Series B, 9.250% due 9/1/12 | | | 181,612 | |
| | 225,000 | | Allied Waste North America, Inc., Senior Notes, 7.875% due 4/15/13 | | | 230,625 | |
|
|
|
| | | | Total Environmental Control | | | 723,925 | |
|
|
|
| | Food — 0.4% | |
| | 125,000 | | Del Monte Corp., Senior Subordinated Notes, 8.625% due 12/15/12 | | | 135,000 | |
| | 200,000 | | Doane Pet Care Co., Senior Notes, 10.750% due 3/1/10 | | | 219,000 | |
| | 250,000 | | Dole Food Co. Inc., Debentures, 8.750% due 7/15/13 | | | 268,750 | |
| | 125,000 | | Pinnacle Foods Holding Corp., Senior Subordinated Notes, 8.250% due 12/1/13 | | | 118,750 | |
| | 90,000 | | United Agri Products Inc., Senior Notes, 8.250% due 12/15/11 | | | 95,400 | |
|
|
|
| | | | Total Food | | | 836,900 | |
|
|
|
| | Forest Products & Paper — 0.4% | |
| | | | Appleton Papers Inc.: | | | | |
| | 100,000 | | Senior Notes, 8.125% due 6/15/11 | | | 98,500 | |
| | 125,000 | | Senior Subordinated Notes, Series B, 9.750% due 6/15/14 | | | 120,625 | |
| | 225,000 | | Boise Cascade, LLC/Boise Cascade Finance Corp., Senior Subordinated Notes, Series B, 7.125% due 10/15/14 (a) | | | 214,313 | |
| | 200,000 | | Buckeye Technologies Inc., Senior Notes, 8.500% due 10/1/13 | | | 204,000 | |
| | 100,000 | | Domtar Inc., Notes, 7.125% due 8/15/15 | | | 92,187 | |
| | 200,000 | | Norske Skog Canada Ltd., Senior Notes, Series D, 8.625% due 6/15/11 | | | 202,000 | |
|
|
|
| | | | Total Forest Products & Paper | | | 931,625 | |
|
|
|
| | Health Care – Product — 0.1% | |
| | 125,000 | | Accellent Corp., Senior Subordinated Notes, Series B, 10.000% due 7/15/12 | | | 136,250 | |
|
|
|
| | Health Care – Services — 0.9% | |
| | 225,000 | | Community Health Systems Inc., Senior Subordinated Notes,
6.500% due 12/15/12 | | | 226,688 | |
| | 225,000 | | DaVita Inc., Senior Subordinated Notes, 7.250% due 3/15/15 | | | 229,219 | |
| | 200,000 | | Extendicare Health Services Inc., Senior Subordinated Notes,
6.875% due 5/1/14 | | | 198,000 | |
| | | | HCA Inc.: | | | | |
| | 200,000 | | Debentures, 7.050% due 12/1/27 | | | 189,902 | |
| | 250,000 | | Senior Notes, 6.375% due 1/15/15 | | | 248,588 | |
| | 375,000 | | IASIS Healthcare LLC/IASIS Capital Corp., Senior Subordinated Notes,
8.750% due 6/15/14 | | | 390,937 | |
| | 100,000 | | InSight Health Services Holdings Corp., Senior Secured Notes,
9.174% due 11/1/11 (a)(b) | | | 98,000 | |
| | 100,000 | | National Mentor Inc., Senior Subordinated Notes, 9.625% due 12/1/12 (a) | | | 105,000 | |
| | 375,000 | | Tenet Healthcare Corp., Senior Notes, 9.875% due 7/1/14 | | | 393,750 | |
|
|
|
| | | | Total Health Care-Services | | | 2,080,084 | |
|
|
|
| | Holding Companies – Diversified — 0.1% | |
| | 125,000 | | Nell AF SARL, Senior Notes, 8.375% due 8/15/15 (a) | | | 122,813 | |
|
|
|
See Notes to Financial Statements.
14 Salomon Brothers Variable Rate Strategic Fund Inc. 2005 Annual Report
Schedule of Investments (September 30, 2005) (continued)
| | | | | | | |
| | |
Face
Amount | | Security | | Value | |
| | | | | | | | |
| | Home Furnishings — 0.1% | |
| $ | 225,000 | | Norcraft Cos. LP/Norcraft Finance Corp., Senior Subordinated Notes,
9.000% due 11/1/11 | | $ | 234,000 | |
| | 125,000 | | Sealy Mattress Co., Senior Subordinated Notes, 8.250% due 6/15/14 | | | 126,250 | |
|
|
|
| | | | Total Home Furnishings | | | 360,250 | |
|
|
|
| | Household Products/Wares — 0.1% | |
| | 200,000 | | Playtex Products Inc., Senior Subordinated Notes, 9.375% due 6/1/11 | | | 209,750 | |
|
|
|
| | Insurance — 0.2% | |
| | 500,000 | | Stingray Pass-Through Trust Certificates, MTN,
5.902% due 1/12/15 (a) | | | 499,267 | |
|
|
|
| | Internet — 0.1% | |
| | 225,000 | | FTD Inc., Senior Subordinated Notes, 7.750% due 2/15/14 | | | 226,688 | |
|
|
|
| | Leisure Time — 0.2% | |
| | 125,000 | | AMF Bowling Worldwide Inc., Senior Subordinated Notes,
10.000% due 3/1/10 | | | 125,000 | |
| | 100,000 | | Equinox Holdings Inc., Senior Notes, 9.000% due 12/15/09 | | | 103,125 | |
| | 125,000 | | Riddell Bell Holdings Inc., Senior Subordinated Notes, 8.375% due 10/1/12 | | | 123,750 | |
|
|
|
| | | | Total Leisure Time | | | 351,875 | |
|
|
|
| | Lodging — 0.8% | |
| | 375,000 | | Boyd Gaming Corp., Senior Subordinated Notes, 7.750% due 12/15/12 | | | 396,094 | |
| | | | Gaylord Entertainment Co., Senior Notes: | | | | |
| | 25,000 | | 8.000% due 11/15/13 | | | 26,375 | |
| | 125,000 | | 6.750% due 11/15/14 | | | 121,562 | |
| | 250,000 | | Las Vegas Sands Corp., Senior Notes, 6.375% due 2/15/15 (a) | | | 242,500 | |
| | 150,000 | | Kerzner International Ltd., Senior Subordinated Notes, 6.750% due 10/1/15 (a) | | | 146,063 | |
| | 500,000 | | MGM MIRAGE Inc., Senior Notes, 6.750% due 9/1/12 | | | 510,625 | |
| | 375,000 | | Station Casinos Inc., Senior Subordinated Notes, 6.875% due 3/1/16 | | | 382,031 | |
|
|
|
| | | | Total Lodging | | | 1,825,250 | |
|
|
|
| | Machinery — 0.1% | |
| | 198,000 | | Dresser-Rand Group Inc., Senior Subordinated Notes,
7.375% due 11/1/14 (a) | | | 206,415 | |
|
|
|
| | Machinery – Construction & Mining — 0.1% | |
| | 300,000 | | Terex Corp., Senior Subordinated Notes, 7.375% due 1/15/14 | | | 304,500 | |
|
|
|
| | Media — 2.0% | |
| | 225,000 | | Cadmus Communications Corp., Senior Subordinated Notes,
8.375% due 6/15/14 | | | 233,437 | |
| | 497,250 | | CCH I LLC, Senior Secured Notes, 11.000% due 10/1/15 (a) | | | 487,305 | |
| | 225,000 | | Charter Communications Holdings II LLC/Charter Communications Holdings II Capital Corp., Senior Notes, 10.250% due 9/15/10 | | | 231,750 | |
| | 225,000 | | Charter Communications Operating LLC, Second Lien Senior Notes,
8.375% due 4/30/14 (a) | | | 227,250 | |
| | | | CSC Holdings Inc.: | | | | |
| | 75,000 | | Debentures, Series B, 8.125% due 8/15/09 | | | 75,938 | |
| | 125,000 | | Senior Debentures, 7.625% due 7/15/18 | | | 117,500 | |
See Notes to Financial Statements.
Salomon Brothers Variable Rate Strategic Fund Inc. 2005 Annual Report 15
Schedule of Investments (September 30, 2005) (continued)
| | | | | | | |
| | |
Face
Amount | | Security | | Value | |
| | | | | | | | |
| | Media — 2.0% (continued) | |
| $ | 250,000 | | Senior Notes, Series B, 8.125% due 7/15/09 | | $ | 253,125 | |
| | | | Dex Media Inc., Discount Notes: | | | | |
| | 500,000 | | step bond to yield 8.389% due 11/15/13 | | | 396,250 | |
| | 75,000 | | step bond to yield 8.389% due 11/15/13 | | | 59,438 | |
| | 81,000 | | DirecTV Holdings LLC/DirecTV Financing Co., Senior Notes, 8.375% due 3/15/13 | | | 88,796 | |
| | 375,000 | | DirecTV Holdings/Finance, Senior Notes, 6.375% due 6/15/15 (a) | | | 374,062 | |
| | 375,000 | | EchoStar DBS Corp., Senior Notes, 6.625% due 10/1/14 | | | 373,125 | |
| | 225,000 | | Emmis Communications Corp., Senior Notes, Class A,
9.745% due 6/15/12 (b) | | | 227,812 | |
| | 325,000 | | LodgeNet Entertainment Corp., Senior Subordinated Debentures,
9.500% due 6/15/13 | | | 357,500 | |
| | 75,000 | | Mediacom Broadband LLC, Senior Notes, 11.000% due 7/15/13 | | | 81,188 | |
| | 125,000 | | Mediacom LLC/Mediacom Capital Corp., Senior Notes, 9.500% due 1/15/13 | | | 124,687 | |
| | 200,000 | | Salem Communications Holding Corp., Senior Subordinated Notes, Series B, 9.000% due 7/1/11 | | | 214,250 | |
| | 225,000 | | Sinclair Broadcast Group Inc., Senior Subordinated Notes,
8.000% due 3/15/12 | | | 231,469 | |
| | 225,000 | | Yell Finance BV, Senior Notes, 10.750% due 8/1/11 | | | 247,500 | |
| | 250,000 | | Young Broadcasting Inc., Senior Subordinated Notes, 10.000% due 3/1/11 | | | 237,500 | |
|
|
|
| | | | Total Media | | | 4,639,882 | |
|
|
|
| | Metal Fabricate/Hardware — 0.1% | |
| | 125,000 | | Mueller Group Inc., Senior Subordinated Notes, 10.000% due 5/1/12 | | | 133,125 | |
|
|
|
| | Mining — 0.2% | |
| | 200,000 | | Corporacion Nacional del Cobre-Codelco, Notes, 5.500% due 10/15/13 (a) | | | 207,188 | |
| | 225,000 | | Novelis Inc., Senior Notes, 7.250% due 2/15/15 (a) | | | 213,750 | |
|
|
|
| | | | Total Mining | | | 420,938 | |
|
|
|
| | Miscellaneous Manufacturing — 0.2% | |
| | 125,000 | | Blount Inc., Senior Subordinated Notes, 8.875% due 8/1/12 | | | 133,750 | |
| | 125,000 | | Invensys PLC, Senior Notes, 9.875% due 3/15/11 (a) | | | 124,844 | |
| | 200,000 | | KI Holdings Inc., Senior Discount Notes, step bond to yield
9.582% due 11/15/14 | | | 137,500 | |
| | 75,000 | | Park-Ohio Industries Inc., Senior Subordinated Notes, 8.375% due 11/15/14 (a) | | | 65,437 | |
|
|
|
| | | | Total Miscellaneous Manufacturing | | | 461,531 | |
|
|
|
| | Office Furnishings — 0.1% | |
| | 125,000 | | Interface Inc., Senior Notes, 7.300% due 4/1/08 | | | 125,625 | |
|
|
|
| | Oil & Gas — 1.0% | |
| | | | Chesapeake Energy Corp., Senior Notes: | | | | |
| | 50,000 | | 6.375% due 6/15/15 (a) | | | 50,500 | |
| | 375,000 | | 6.875% due 1/15/16 | | | 386,250 | |
| | 250,000 | | EXCO Resources Inc., Senior Notes, 7.250% due 1/15/11 | | | 260,000 | |
| | 450,000 | | Kerr-McGee Corp., Senior Secured Notes, 7.000% due 11/1/11 | | | 452,250 | |
| | 475,000 | | Petronas Capital Ltd., 7.875% due 5/22/22 (a) | | | 591,135 | |
| | 200,000 | | Stone Energy Corp., Senior Subordinated Notes, 8.250% due 12/15/11 | | | 211,000 | |
See Notes to Financial Statements.
16 Salomon Brothers Variable Rate Strategic Fund Inc. 2005 Annual Report
Schedule of Investments (September 30, 2005) (continued)
| | | | | | | |
| | |
Face
Amount | | Security | | Value | |
| | | | | | | | |
| | Oil & Gas — 1.0% (continued) | |
| $ | 250,000 | | Vintage Petroleum Inc., Senior Subordinated Notes, 7.875% due 5/15/11 | | $ | 262,500 | |
|
|
|
| | | | Total Oil & Gas | | | 2,213,635 | |
|
|
|
| | Oil & Gas Services — 0.3% | |
| | 250,000 | | Hanover Compressor Co., Senior Notes, 9.000% due 6/1/14 | | | 279,063 | |
| | 225,000 | | Key Energy Services, Inc., Senior Notes, 6.375% due 5/1/13 | | | 225,000 | |
| | 200,000 | | Universal Compression Inc., Senior Notes, 7.250% due 5/15/10 | | | 208,000 | |
|
|
|
| | | | Total Oil & Gas Services | | | 712,063 | |
|
|
|
| | Packaging & Containers — 0.6% | |
| | 125,000 | | Anchor Glass Container Corp., Senior Secured Notes, 11.000% due 2/15/13 (c) | | | 80,625 | |
| | 200,000 | | Berry Plastics Corp., Senior Subordinated Notes, 10.750% due 7/15/12 | | | 216,000 | |
| | 225,000 | | Graphic Packaging International Corp., Senior Subordinated Notes,
9.500% due 8/15/13 | | | 212,625 | |
| | 375,000 | | Owens-Illinois Inc., Debentures, 7.500% due 5/15/10 | | | 382,500 | |
| | 125,000 | | Plastipak Holdings Inc., Senior Notes, 10.750% due 9/1/11 | | | 136,875 | |
| | 125,000 | | Pliant Corp., Senior Secured Second Lien Notes, 11.125% due 9/1/09 | | | 108,125 | |
| | 375,000 | | Smurfit-Stone Container Enterprises Inc., Senior Notes, 8.375% due 7/1/12 | | | 358,125 | |
|
|
|
| | | | Total Packaging & Containers | | | 1,494,875 | |
|
|
|
| | Pharmaceuticals — 0.1% | |
| | 125,000 | | Warner Chilcott Corp., 8.750% due 2/1/15 (a) | | | 120,625 | |
|
|
|
| | Pipelines — 1.0% | |
| | | | Dynergy Holding Inc.: | | | | |
| | 200,000 | | Debentures, 7.625% due 10/15/26 | | | 186,000 | |
| | 500,000 | | Senior Notes, 6.875% due 4/1/11 | | | 491,250 | |
| | | | El Paso Corp., MTN: | | | | |
| | 375,000 | | 7.375% due 12/15/12 | | | 378,750 | |
| | 300,000 | | 7.750% due 1/15/32 | | | 303,750 | |
| | 225,000 | | Holly Energy Partners LP, Senior Notes, 6.250% due 3/1/15 (a) | | | 223,875 | |
| | 500,000 | | Williams Cos. Inc., Notes, 8.750% due 3/15/32 | | | 592,500 | |
|
|
|
| | | | Total Pipelines | | | 2,176,125 | |
|
|
|
| | Real Estate Investment Trust — 0.7% | |
| | 375,000 | | Felcor Lodging LP, Senior Notes, 9.000% due 6/1/11 | | | 409,687 | |
| | 425,000 | | Host Marriott LP, Senior Notes, 7.125% due 11/1/13 | | | 436,156 | |
| | 425,000 | | iStar Financial Inc., Senior Notes, 5.150% due 3/1/12 | | | 415,680 | |
| | 250,000 | | MeriStar Hospitality Corp., Senior Notes, 9.125% due 1/15/11 | | | 266,250 | |
|
|
|
| | | | Total Real Estate Investment Trust | | | 1,527,773 | |
|
|
|
| | Retail — 0.7% | | | | |
| | 225,000 | | Carrols Corp., Senior Subordinated Notes, 9.000% due 1/15/13 (a) | | | 229,500 | |
| | 225,000 | | CSK Auto Inc., Senior Subordinated Notes, 7.000% due 1/15/14 | | | 211,500 | |
| | 125,000 | | Eye Care Centers of America Inc., Senior Subordinated Notes,
10.750% due 2/15/15 (a) | | | 118,125 | |
| | 100,000 | | Finlay Fine Jewelry Corp., Senior Notes, 8.375% due 6/1/12 | | | 85,125 | |
| | 125,000 | | General Nutrition Centers Inc., Senior Subordinated Notes,
8.500% due 12/1/10 | | | 107,187 | |
See Notes to Financial Statements.
Salomon Brothers Variable Rate Strategic Fund Inc. 2005 Annual Report 17
Schedule of Investments (September 30, 2005) (continued)
| | | | | | | |
| | |
Face
Amount | | Security | | Value | |
| | | | | | | | |
| | Retail — 0.7% (continued) | | | | |
| $ | 225,000 | | Jafra Cosmetics International Inc./Distribuidora Comercial Jafra SA de CV,
Senior Subordinated Notes, 10.750% due 5/15/11 | | $ | 250,875 | |
| | 225,000 | | Jean Coutu Group Inc., Senior Subordinated Notes, 8.500% due 8/1/14 | | | 225,000 | |
| | 75,000 | | Neiman Marcus Group Inc., Senior Subordinated Notes,
Series A, 10.375% due 10/15/15 (a) | | | 75,000 | |
| | | | Rite Aid Corp.: | | | | |
| | 175,000 | | 7.500% due 1/15/15 | | | 168,000 | |
| | 50,000 | | Notes, 6.125% due 12/15/08 (a) | | | 47,750 | |
|
|
|
| | | | Total Retail | | | 1,518,062 | |
|
|
|
| | Semiconductors — 0.2% | | | | |
| | 400,000 | | Amkor Technology Inc., Senior Notes, 9.250% due 2/15/08 | | | 377,000 | |
|
|
|
| | Telecommunications — 1.4% | | | | |
| | 250,000 | | American Tower Corp., Senior Notes, 7.125% due 10/15/12 | | | 263,750 | |
| | 175,000 | | AT&T Corp., Senior Notes, 9.750% due 11/15/31 | | | 222,469 | |
| | | | Centennial Communications Corp./Cellular Operating Co. LLC, Senior Notes: | | | | |
| | 125,000 | | 10.125% due 6/15/13 | | | 141,250 | |
| | 75,000 | | 8.125% due 2/1/14 | | | 79,687 | |
| | 50,000 | | Intelsat Bermuda Ltd., Senior Notes, 8.695% due 1/15/12 (a)(b) | | | 51,125 | |
| | 275,000 | | Intelsat Ltd., Senior Discount Notes, step bond to yield 9.447% due 2/1/15 (a) | | | 182,875 | |
| | 125,000 | | IWO Holdings Inc., Secured Notes, 7.349% due 1/15/12 (b) | | | 130,625 | |
| | 500,000 | | Lucent Technologies Inc., Debentures, 6.450% due 3/15/29 | | | 440,000 | |
| | 10,000 | | MCI Inc., Senior Notes, 8.735% due 5/1/14 | | | 11,175 | |
| | 75,000 | | PanAmSat Corp., Senior Notes, 9.000% due 8/15/14 | | | 79,500 | |
| | 1,000,000 | | Qwest Corp., Senior Notes, 7.120% due 6/15/13 (a)(b) | | | 1,045,000 | |
| | 200,000 | | SBA Communications Corp., Senior Notes, 8.500% due 12/1/12 | | | 218,500 | |
| | 125,000 | | UbiquiTel Operating Co., Senior Notes, 9.875% due 3/1/11 | | | 139,375 | |
| | 175,000 | | US Unwired Inc., Second Priority Secured Notes, Series B, 10.000% due 6/15/12 | | | 202,125 | |
|
|
|
| | | | Total Telecommunications | | | 3,207,456 | |
|
|
|
| | Textiles — 0.1% | | | | |
| | 225,000 | | Collins & Aikman Floor Covering Inc., Senior Subordinated Notes,
Series B, 9.750% due 2/15/10 | | | 218,250 | |
| | | | Simmons Bedding Co.: | | | | |
| | 50,000 | | Senior Discount Notes, step bond to yield 13.508% due 12/15/14 (a) | | | 26,750 | |
| | 100,000 | | Senior Subordinated Notes, 7.875% due 1/15/14 | | | 92,500 | |
|
|
|
| | | | Total Textiles | | | 337,500 | |
|
|
|
| | | | TOTAL CORPORATE BONDS & NOTES
(Cost — $52,340,681) | | | 51,187,760 | |
|
|
|
| | ASSET-BACKED SECURITIES — 16.9% | | | | |
| | Home Equity — 16.9% | | | | |
| | | | Aegis Asset-Backed Securities Trust: | | | | |
| | 422,220 | | Series 2004-5N, 5.000% due 12/25/34 (a) | | | 418,720 | |
| | 1,052,014 | | Series 2004-6N, 4.750% due 3/25/35 (a) | | | 1,046,261 | |
| | 508,707 | | Series 2005-1N, Class N1, 4.250% due 3/25/35 (a) | | | 506,158 | |
See Notes to Financial Statements.
18 Salomon Brothers Variable Rate Strategic Fund Inc. 2005 Annual Report
Schedule of Investments (September 30, 2005) (continued)
| | | | | | | |
| | |
Face
Amount | | Security | | Value | |
| | | | | | | | |
| | Home Equity — 16.9% (continued) | | | | |
| | | | Ameriquest Mortgage Securities, Inc: | | | | |
| $ | 1,500,000 | | Series 2004-R08, Class M10, 6.330% due 9/25/34 (a)(b) | | $ | 1,415,677 | |
| | 3,000,000 | | Series 2004-R1, Class M10, 5.831% due 2/25/34 (a)(b) | | | 2,985,938 | |
| | 2,000,000 | | Argent Securities Inc., Series 2004-W8, Class M10, 7.330% due 5/25/34 (b) | | | 1,964,689 | |
| | | | Countrywide Asset-Backed Certificates: | | | | |
| | 163,046 | | Series 2004-05N, Class N1, 5.500% due 10/25/35 (a) | | | 162,491 | |
| | 615,891 | | Series 2004-11N, Class N, 5.250% due 4/25/36 (a) | | | 612,822 | |
| | 500,000 | | First Franklin Mortgage Loan Trust NIM, Series 2004-FF10, Class N2,
6.000% due 11/26/34 (a)(d) | | | 490,000 | |
| | 3,000,000 | | Fremont Home Loan Trust, Series 2004-D, Class M5,
4.830% due 11/25/34 (b) | | | 3,016,152 | |
| | | | GSAMP Trust: | | | | |
| | 1,500,000 | | Series 2004-OPT, Class B1, 5.430% due 11/25/34 (b) | | | 1,507,698 | |
| | 305,497 | | Series 2005-OPTN, 5.000% due 11/25/34 (a) | | | 305,223 | |
| | 6,864,847 | | Lehman XS Trust, Series 2005-1, Class 2A2, 4.660% due 7/25/35 (b)(d) | | | 6,790,712 | |
| | 858,344 | | Long Beach Asset Holdings Corp., Series 2004-06, Class N2,
7.500% due 11/25/34 (a) | | | 789,140 | |
| | 266,006 | | Merrill Lynch Mortgage Investors Inc., Series 2005-WM1N, Class N1,
5.000% due 9/25/35 (a) | | | 263,660 | |
| | | | Morgan Stanley Asset Backed Securities Capital I: | | | | |
| | 2,000,000 | | Series 2004-HE9, Class M6, 5.080% due 11/25/34 (b) | | | 2,025,103 | |
| | 1,000,000 | | Series 2004-OP1, Class M5, 4.880% due 11/25/34 (b) | | | 1,013,775 | |
| | | | Novastar Home Equity Loan: | | | | |
| | 1,500,000 | | Series 2004-4, Class M4, 4.930% due 3/25/35 (b) | | | 1,501,938 | |
| | 2,000,000 | | Series 2005-2, Class M11, 6.830% due 10/25/35 (b) | | | 1,801,250 | |
| | 1,500,000 | | Option One Mortgage Loan Trust, Series 2004-2, Class M7, 7.330% due 5/25/34 (b) | | | 1,464,617 | |
| | 2,000,000 | | Park Place Securities Inc., Series 2004-WWF1, Class M4, 4.930% due 2/25/35 (b) | | | 2,044,965 | |
| | | | Park Place Securities NIM Trust: | | | | |
| | 1,500,000 | | Series 2004-WWF1, Class B, 6.290% due 1/25/35 (a) | | | 1,496,250 | |
| | 679,871 | | Series 2005-WHQ2, Class A, 5.192% due 5/25/35 (a) | | | 679,021 | |
| | | | Sail Net Interest Margin Notes: | | | | |
| | 466,148 | | Series 2004-02A, Class A, 5.500% due 3/27/34 (a) | | | 466,465 | |
| | 360,802 | | Series 2004-10A, Class B, 7.000% due 11/27/34 (a) | | | 345,243 | |
| | | | Series 2004-11A: | | | | |
| | 178,069 | | Class A2, 4.750% due 1/27/35 (a) | | | 177,285 | |
| | 242,948 | | Class B, 7.500% due 1/27/35 (a) | | | 237,871 | |
| | | | Series 2004-BN2A: | | | | |
| | 222,486 | | Class A, 5.000% due 12/27/34 (a) | | | 222,236 | |
| | 315,017 | | Class B, 7.000% due 12/27/34 (a) | | | 243,130 | |
| | | | Series 2005-1A: | | | | |
| | 110,467 | | Class A, 4.250% due 2/27/35 (a) | | | 109,913 | |
| | 334,153 | | Class B, 7.500% due 2/27/35 (a) | | | 325,799 | |
| | 2,260,000 | | Structured Asset Investment Loan Trust, Series 2004-9, Class M4,
5.130% due 10/25/34 (b) | | | 2,276,282 | |
|
|
|
| | | | TOTAL ASSET-BACKED SECURITIES
(Cost — $38,527,781) | | | 38,706,484 | |
|
|
|
See Notes to Financial Statements.
Salomon Brothers Variable Rate Strategic Fund Inc. 2005 Annual Report 19
Schedule of Investments (September 30, 2005) (continued)
| | | | | | | |
| | |
Face
Amount | | Security | | Value | |
| | | | | | | | |
| | COLLATERALIZED MORTGAGE OBLIGATIONS — 16.0% | | | | |
| | | | Federal Home Loan Mortgage Corp. (FHLMC): | | | | |
| $ | 7,730,567 | | Series 2638, Class DI, PAC IO, 5.000% due 5/15/23 (e) | | $ | 1,337,467 | |
| | 8,272,889 | | Series 2639, Class UI, PAC-1 IO, 5.000% due 3/15/22 (e) | | | 1,269,463 | |
| | 18,296,310 | | Series 2645, Class IW, PAC IO, 5.000% due 7/15/26 (e) | | | 2,007,885 | |
| | 19,076,152 | | Series 2684, Class PI, PAC, IO, 5.000% due 5/15/23 (e) | | | 1,454,825 | |
| | 13,436,745 | | Series 2777, Class PI, PAC, IO, 5.000% due 5/15/24 | | | 1,137,369 | |
| | 7,826,193 | | Series 2839, Class TX, PAC, IO, 5.000% due 1/15/19 (e) | | | 1,228,142 | |
| | 7,543,000 | | Series 2866, Class IC, PAC, IO, 5.000% due 1/15/24 (e) | | | 1,008,323 | |
| | 2,614,595 | | Series 2927, Class 0Q, PAC-1, IO, 5.000% due 8/15/19 | | | 166,342 | |
| | | | Federal National Mortgage Association (FNMA): | | | | |
| | 17,605,639 | | Series 337, Class 2, IO, 5.000% due 6/1/33 (e) | | | 3,788,312 | |
| | 7,886,027 | | Series 339, Class 30, IO, 5.500% due 7/1/18 (b) | | | 1,358,015 | |
| | 720,067 | | Homestar NIM Trust, Series 2004-6, Class A1, 5.500% due 1/25/35 (a) | | | 720,854 | |
| | 5,990,200 | | Indymac Index Mortgage Loan Trust, Series 2005-AR21, Class 4A1,
5.474% due 10/25/35 (e) | | | 6,012,663 | |
| | | | Structured Asset Securities Corp.: | | | | |
| | 855,552 | | Series 1998-2, Class M1, 4.930% due 2/25/28 (b) | | | 856,314 | |
| | 353,907 | | Series 1998-3, Class M1, 4.830% due 3/25/28 (b) | | | 354,284 | |
| | 650,707 | | Series 1998-8, Class M1, 4.770% due 8/25/28 (b) | | | 651,375 | |
| | 13,107,353 | | Series 2005-RF3, Class 2A, 4.648% due 6/25/35 (a)(b)(e) | | | 13,344,924 | |
|
|
|
| | | | TOTAL COLLATERALIZED MORTGAGE OBLIGATIONS
(Cost — $35,521,545) | | | 36,696,557 | |
|
|
|
| | LOAN PARTICIPATIONS (b)(f) — 6.2% | | | | |
| | Auto Parts & Equipment — 0.5% | | | | |
| | 1,000,000 | | Delphi Corp., Term Loan, Tranche B, 10.300% due 6/14/11
(JPMorgan Chase & Co.) (c) | | | 1,021,172 | |
|
|
|
| | Electric — 0.7% | | | | |
| | | | Reliant Energy, Inc., Term Loan, Tranche B: | | | | |
| | 1,384,615 | | 6.089% due 4/30/10 (Bank of America) | | | 1,393,640 | |
| | 107,885 | | 6.205% due 4/30/10 (Bank of America) | | | 108,588 | |
|
|
|
| | | | Total Electric | | | 1,502,228 | |
|
|
|
| | Energy — 0.4% | | | | |
| | 1,000,000 | | Key Energy Services Inc., Term Loan, Tranche B,
0.000% due 7/29/12 (Lehman Brothers Inc.) | | | 1,016,875 | |
|
|
|
| | Entertainment — 0.3% | | | | |
| | 750,000 | | BLB Worldwide Holdings Inc., Term Loan, 7.830% due 8/15/12
(Merrill Lynch) | | | 762,188 | |
|
|
|
| | Forest Products & Paper — 0.4% | | | | |
| | | | New Page Corp., Term Loan, Tranche B: | | | | |
| | 533,333 | | 6 Month Tranche, 6.492% due 5/2/11 (Goldman Sachs) | | | 541,333 | |
| | 466,667 | | 2 Month Tranche, 6.680% due 5/2/11 (Goldman Sachs) | | | 473,667 | |
|
|
|
| | | | Total Forest Products & Paper | | | 1,015,000 | |
|
|
|
| | Health Care – Services — 0.4% | | | | |
| | 1,000,000 | | DaVita Inc., Term Loan, Tranche B, 1.000% due 6/25/12
(JPMorgan Chase & Co.) (e) | | | 1,016,042 | |
|
|
|
See Notes to Financial Statements.
20 Salomon Brothers Variable Rate Strategic Fund Inc. 2005 Annual Report
Schedule of Investments (September 30, 2005) (continued)
| | | | | | | |
| | |
Face
Amount | | Security | | Value | |
| | | | | | | | |
| | Media — 1.3% | | | | |
| $ | 988,746 | | Charter Communications Holdings LLC, Term Loan, Tranche B,
6.930% due 4/27/11 (JPMorgan Chase & Co.) | | $ | 994,596 | |
| | | | DirecTV Holdings LLC, Term Loan, Tranche B: | | | | |
| | 500,000 | | 5.385% due 4/13/13 (Bank of America) | | | 506,302 | |
| | 500,000 | | 5.289% due 4/13/13 (Bank of America) | | | 506,302 | |
| | 1,000,000 | | Spanish Broadcasting Systems, Term Loan, Second Lien,
7.510% due 6/8/13 (Lehman Brothers, Inc.) | | | 1,015,625 | |
|
|
|
| | | | Total Media | | | 3,022,825 | |
|
|
|
| | Metal Fabricate/Hardware — 0.5% | | | | |
| | 1,000,000 | | Mueller Group Inc., Term Loans, 1.000% due 10/3/12 (Bank of America) (e) | | | 1,017,625 | |
|
|
|
| | Oil & Gas — 0.6% | | | | |
| | | | Kerr-McGee Corp. Term Loan: | | | | |
| | 997,500 | | Tranche B, 6.310% due 5/24/11 (JPMorgan Chase & Co.) | | | 1,003,672 | |
| | 350,000 | | Tranche X, 6.110% due 5/24/07 (JPMorgan Chase & Co.) | | | 351,469 | |
|
|
|
| | | | Total Oil & Gas | | | 1,355,141 | |
|
|
|
| | Resorts/Casinos — 0.4% | | | | |
| | | | Venetian Casino Resort LLC, Term Loan: | | | | |
| | 170,940 | | Tranche B, 5.461% due 6/15/11 (Bank of Nova Scotia) | | | 172,636 | |
| | 829,060 | | Tranche L, 5.240% due 6/15/11 (Bank of Nova Scotia) | | | 837,286 | |
|
|
|
| | | | Total Resorts/Casinos | | | 1,009,922 | |
|
|
|
| | Telecommunications — 0.7% | | | | |
| | 1,500,000 | | UPC Broadband Inc. Term Loan, Tranche H2,
6.004% due 3/15/12 (Toronto Dominion Bank) | | | 1,518,281 | |
|
|
|
| | | | TOTAL LOAN PARTICIPATIONS
(Cost — $14,106,702) | | | 14,257,299 | |
|
|
|
| | MORTGAGE-BACKED SECURITIES — 16.3% | | | | |
| | FHLMC — 9.1% | | | | |
| | | | Federal Home Loan Mortgage Corp. (FHLMC), Gold: | | | | |
| | 3,147,551 | | 6.000% due 2/1/33 (e) | | | 3,204,009 | |
| | 7,562,432 | | 6.500% due 11/1/34 (e) | | | 7,779,376 | |
| | 9,764,911 | | 5.500% due 6/1/35 (e) | | | 9,772,845 | |
|
|
|
| | | | Total FHLMC | | | 20,756,230 | |
|
|
|
| | FNMA — 7.2% | | | | |
| | | | Federal National Mortgage Association (FNMA): | | | | |
| | 6,635,552 | | 6.000% due 5/1/33 (e) | | | 6,749,611 | |
| | 9,744,072 | | 5.500% due 4/1/35 (e) | | | 9,745,898 | |
|
|
|
| | | | Total FNMA | | | 16,495,509 | |
|
|
|
| | | | TOTAL MORTGAGE-BACKED SECURITIES
(Cost — $37,775,267) | | | 37,251,739 | |
|
|
|
See Notes to Financial Statements.
Salomon Brothers Variable Rate Strategic Fund Inc. 2005 Annual Report 21
Schedule of Investments (September 30, 2005) (continued)
| | | | | | |
| | |
Face
Amount† | | Security | | Value | |
| | | | | | | |
| SOVEREIGN BONDS — 20.6% | | | | |
| Argentina — 0.7% | | | | |
| | | Republic of Argentina: | | | | |
| 1,050,000 | | 4.005% due 8/3/12 (b) | | $ | 957,402 | |
| 1,351,796ARS | | 5.830% due 12/31/33 | | | 574,446 | |
| 270,000 | | step bond to yield 8.870% due 12/31/38 | | | 106,853 | |
|
|
| | | Total Argentina | | | 1,638,701 | |
|
|
| Brazil — 4.6% | | | | |
| 10,747,197 | | Federative Republic of Brazil, DCB, Series L, 4.313% due 4/15/12 (b) | | | 10,596,065 | |
|
|
| Bulgaria — 0.3% | | | | |
| 575,000 | | Republic of Bulgaria, 8.250% due 1/15/15 (a) | | | 708,688 | |
|
|
| Chile — 0.3% | | | | |
| 675,000 | | Republic of Chile, 5.500% due 1/15/13 | | | 704,699 | |
|
|
| Colombia — 1.0% | | | | |
| | | Republic of Colombia: | | | | |
| 440,000 | | 10.375% due 1/28/33 | | | 575,300 | |
| 1,275,000 | | 10.750% due 1/15/13 | | | 1,604,269 | |
| 75,000 | | MTN, 11.750% due 2/25/20 | | | 104,662 | |
|
|
| | | Total Colombia | | | 2,284,231 | |
|
|
| Ecuador — 0.3% | |
| 720,000 | | Republic of Ecuador, step bond to yield 10.521% due 8/15/30 (a) | | | 681,120 | |
|
|
| El Salvador — 0.1% | |
| 275,000 | | Republic of El Salvador, 7.750% due 1/24/23 (a) | | | 309,375 | |
|
|
| Malaysia — 0.2% | |
| 450,000 | | Federation of Malaysia, 7.500% due 7/15/11 | | | 511,097 | |
|
|
| Mexico — 4.3% | |
| | | United Mexican States: | | | | |
| 780,000 | | 11.375% due 9/15/16 | | | 1,153,620 | |
| 2,700,000 | | 8.125% due 12/30/19 | | | 3,283,875 | |
| 275,000 | | Bonds, Series XW, 10.375% due 2/17/09 | | | 321,819 | |
| | | MTN: | | | | |
| 275,000 | | 8.300% due 8/15/31 | | | 343,750 | |
| | | Series A: | | | | |
| 1,730,000 | | 6.375% due 1/16/13 | | | 1,845,478 | |
| 925,000 | | 8.000% due 9/24/22 | | | 1,123,875 | |
| 1,125,000 | | 7.500% due 4/8/33 | | | 1,305,000 | |
| 5,077,500MXN | | Series MI10, 9.500% due 12/18/14 | | | 498,139 | |
|
|
| | | Total Mexico | | | 9,875,556 | |
|
|
| Panama — 0.8% | |
| | | Republic of Panama: | | | | |
| 100,000 | | 7.250% due 3/15/15 | | | 109,375 | |
| 600,000 | | 9.375% due 1/16/23 | | | 760,500 | |
| 859,073 | | PDI, 4.688% due 7/17/16 (b) | | | 839,743 | |
|
|
| | | Total Panama | | | 1,709,618 | |
|
|
See Notes to Financial Statements.
22 Salomon Brothers Variable Rate Strategic Fund Inc. 2005 Annual Report
Schedule of Investments (September 30, 2005) (continued)
| | | | | | |
| | |
Face
Amount† | | Security | | Value | |
| | | | | | | |
| Peru — 0.9% | |
| | | Republic of Peru: | | | | |
| 150,000 | | 7.350% due 7/21/25 | | $ | 159,750 | |
| 145,000 | | 9.125% due 2/21/12 | | | 174,362 | |
| 1,862,000 | | FLIRB, 5.000% due 3/7/17 (b) | | | 1,801,485 | |
|
|
| | | Total Peru | | | 2,135,597 | |
|
|
| Philippines — 0.9% | |
| | | Republic of the Philippines: | | | | |
| 125,000 | | 8.250% due 1/15/14 | | | 130,075 | |
| 1,575,000 | | 9.875% due 1/15/19 | | | 1,762,031 | |
| 125,000 | | 10.625% due 3/16/25 | | | 146,169 | |
| 100,000 | | 9.500% due 2/2/30 | | | 106,935 | |
|
|
| | | Total Philippines | | | 2,145,210 | |
|
|
| Poland — 0.1% | |
| 225,000 | | Republic of Poland, 5.250% due 1/15/14 | | | 232,031 | |
|
|
| Russia — 2.7% | |
| | | Russian Federation: | | | | |
| 650,000 | | 11.000% due 7/24/18 (a) | | | 992,875 | |
| 2,700,000 | | 12.750% due 6/24/28 (a) | | | 5,096,250 | |
|
|
| | | Total Russia | | | 6,089,125 | |
|
|
| South Africa — 0.3% | | | | |
| | | Republic of South Africa: | | | | |
| 125,000 | | 9.125% due 5/19/09 | | | 142,656 | |
| 575,000 | | 6.500% due 6/2/14 | | | 631,782 | |
|
|
| | | Total South Africa | | | 774,438 | |
|
|
| Turkey — 1.5% | |
| | | Republic of Turkey: | | | | |
| 300,000 | | 7.250% due 3/15/15 | | | 316,500 | |
| 425,000 | | 7.000% due 6/5/20 | | | 420,750 | |
| 250,000 | | 11.875% due 1/15/30 | | | 367,500 | |
| 1,850,000 | | Collective Action Securities, 9.500% due 1/15/14 | | | 2,238,500 | |
|
|
| | | Total Turkey | | | 3,343,250 | |
|
|
| Ukraine — 0.3% | |
| 575,000 | | Republic of Ukraine, 7.650% due 6/11/13 (a) | | | 634,656 | |
|
|
| Uruguay — 0.2% | |
| | | Republic of Uruguay, Benchmark Bonds: | | | | |
| 175,000 | | 7.250% due 2/15/11 | | | 183,094 | |
| 250,000 | | 7.500% due 3/15/15 | | | 256,250 | |
|
|
| | | Total Uruguay | | | 439,344 | |
|
|
See Notes to Financial Statements.
Salomon Brothers Variable Rate Strategic Fund Inc. 2005 Annual Report 23
Schedule of Investments (September 30, 2005) (continued)
| | | | | | | |
| | |
Face
Amount† | | Security | | Value | |
| | | | | | | | |
| | Venezuela — 1.1% | |
| | | | Bolivarian Republic of Venezuela: | | | | |
| | | | Collective Action Securities: | | | | |
| | 375,000 | | Global Bonds, 7.650% due 4/21/25 | | $ | 380,437 | |
| | 1,450,000 | | 4.640% due 4/20/11 (a)(b) | | | 1,439,125 | |
| | 500,000 | | 10.750% due 9/19/13 | | | 625,250 | |
|
|
|
| | | | Total Venezuela | | | 2,444,812 | |
|
|
|
| | | | TOTAL SOVEREIGN BONDS
(Cost — $44,302,099) | | | 47,257,613 | |
|
|
|
| | | | TOTAL INVESTMENTS BEFORE SHORT-TERM INVESTMENT
(Cost — $222,574,075) | | | 225,357,452 | |
|
|
|
| | |
Face
Amount | | | | | |
| | SHORT-TERM INVESTMENT — 1.6% | |
| | Repurchase Agreement — 1.6% | |
| $ | 3,704,000 | | Interest in $603,193,000 joint tri-party repurchase agreement dated 9/30/05 with Merrill Lynch, Pierce, Fenner & Smith Inc., 3.810% due 10/3/05; Proceeds at maturity — $3,705,176; (Fully collateralized by U.S. government agency obligations, 4.125% to 8.875% due 8/15/08 to 7/15/20;
Market value — $3,778,099)
(Cost — $3,704,000) (e) | | | 3,704,000 | |
|
|
|
| | | | TOTAL INVESTMENTS — 100.0% (Cost — $226,278,075#) | | $ | 229,061,452 | |
|
|
|
| † | | Face amount is denominated in U.S. dollars unless otherwise indicated. |
| (a) | | Security is exempt from registration under Rule 144A of the Securities Act of 1933. This security may be resold in transactions that are exempt from registration, normally to qualified institutional buyers. This security has been deemed liquid pursuant to guidelines approved by the Board of Directors unless otherwise noted. |
| (b) | | Variable rate securities. Interest rates disclosed are those which are in effect at September 30, 2005. |
| (c) | | Security is currently in default. |
| (d) | | Securities are fair valued at September 30, 2005 in accordance with the policies adopted by the Board of Directors (see note 1). |
| (e) | | All or a portion of this security is segregated for extended settlements, swap transactions, and reverse repurchase agreements. |
| (f) | | Participation interest was acquired through the financial institutions indicated parenthetically. |
| # | | Aggregate cost for federal income tax purposes is $226,573,609. |
| | | | |
Abbreviations used in this schedule:
|
| ARS | | — | | Argentine Peso |
| DCB | | — | | Debt Conversion Bond |
| FLIRB | | — | | Front-Loaded Interest Reduction Bonds |
| GSAMP | | — | | Goldman Sachs Mortgage Securities Corporation |
| IO | | — | | Interest Only |
| MTN | | — | | Medium-Term Note |
| MXN | | — | | Mexican Peso |
| NIM | | — | | Net Interest Margin |
| PAC | | — | | Planned Amortization Cost |
| PDI | | — | | Past Due Interest |
See Notes to Financial Statements.
24 Salomon Brothers Variable Rate Strategic Fund Inc. 2005 Annual Report
Statement of Assets and Liabilities (September 30, 2005)
| | | | |
| ASSETS: | | | | |
Investments, at value (Cost — $226,278,075) | | $ | 229,061,452 | |
Cash | | | 169,784 | |
Interest receivable | | | 3,491,720 | |
Receivable for securities sold | | | 2,019,180 | |
Unrealized appreciation on interest rate swaps | | | 1,420,600 | |
Deposits with brokers for reverse repurchase agreement | | | 696,000 | |
Due from Manager | | | 57,803 | |
Prepaid expenses | | | 8,081 | |
|
|
Total Assets | | | 236,924,620 | |
|
|
| LIABILITIES: | | | | |
Payable for open reverse repurchase agreement (Notes 1 and 3) | | | 68,098,000 | |
Payable for securities purchased | | | 5,236,316 | |
Payable on interest rate swaps contracts (Note 3) | | | 1,077,904 | |
Interest payable (Note 3) | | | 163,044 | |
Management fee payable | | | 141,044 | |
Directors’ fees payable | | | 967 | |
Payable for open spot currency contracts | | | 101 | |
Accrued expenses | | | 141,155 | |
|
|
Total Liabilities | | | 74,858,531 | |
|
|
Total Net Assets | | $ | 162,066,089 | |
|
|
| NET ASSETS: | | | | |
Par value ($0.001 par value, 100,000,000 shares authorized; 8,323,434 shares outstanding) | | $ | 8,323 | |
Paid-in capital in excess of par value | | | 158,195,188 | |
Overdistributed net investment income | | | (7,473 | ) |
Accumulated net realized loss on investments, futures contracts, interest rate swap
contracts and foreign currency transactions | | | (333,732 | ) |
Net unrealized appreciation on investments, interest rate swap contracts and foreign currency transactions | | | 4,203,783 | |
|
|
Total Net Assets | | $ | 162,066,089 | |
|
|
Shares Outstanding | | | 8,323,434 | |
|
|
Net Asset Value | | | $19.47 | |
|
|
See Notes to Financial Statements.
Salomon Brothers Variable Rate Strategic Fund Inc. 2005 Annual Report 25
Statement of Operations (For the period ended September 30, 2005†)
| | | | |
| INVESTMENT INCOME: | | | | |
Interest | | $ | 9,538,879 | |
|
|
| EXPENSES: | | | | |
Management fee (Note 2) | | | 1,265,958 | |
Interest expense (Note 3) | | | 837,196 | |
Audit and tax | | | 55,879 | |
Custody fees | | | 49,415 | |
Shareholder reports | | | 43,700 | |
Legal fees | | | 43,625 | |
Directors’ fees | | | 43,452 | |
Transfer agent fees | | | 24,128 | |
Stock exchange listing | | | 18,466 | |
Insurance | | | 2,863 | |
Miscellaneous expenses | | | 5,802 | |
|
|
Total Expenses | | | 2,390,484 | |
|
|
Net Investment Income | | | 7,148,395 | |
|
|
REALIZED AND UNREALIZED GAIN (LOSS) ON INVESTMENTS,
FUTURES CONTRACTS, INTEREST RATE SWAP CONTRACTS
AND FOREIGN CURRENCY TRANSACTIONS (NOTES 1 AND 3): | | | | |
Net Realized Gain (Loss) From: | | | | |
Investments | | | 141,346 | |
Futures contracts | | | 122,748 | |
Interest rate swap contracts | | | (715,309 | ) |
Foreign currency transactions | | | (2,232 | ) |
|
|
Net Realized Loss | | | (453,447 | ) |
|
|
Change in Net Unrealized Appreciation/Depreciation From: | | | | |
Investments | | | 2,783,377 | |
Interest rate swap contracts | | | 1,420,600 | |
Foreign currency transactions | | | (194 | ) |
|
|
Change in Net Unrealized Appreciation/Depreciation | | | 4,203,783 | |
|
|
Net Gain on Investments, Futures Contracts, Interest Rate Swap Contracts
and Foreign Currency Transactions | | | 3,750,336 | |
|
|
Increase in Net Assets From Operations | | $ | 10,898,731 | |
|
|
| † | | For the period October 26, 2004 (commencement of operations) to September 30, 2005. |
See Notes to Financial Statements.
26 Salomon Brothers Variable Rate Strategic Fund Inc. 2005 Annual Report
Statement of Changes in Net Assets (For the period ended September 30, 2005†)
| | | | |
| |
| | | 2005 | |
| OPERATIONS: | | | | |
Net investment income | | $ | 7,148,395 | |
Net realized loss | | | (453,447 | ) |
Change in net unrealized appreciation/depreciation | | | 4,203,783 | |
|
|
Increase in Net Assets From Operations | | | 10,898,731 | |
|
|
| DISTRIBUTIONS TO SHAREHOLDERS FROM (NOTE 1): | | | | |
Net investment income | | | (7,036,900 | ) |
Paid-in capital | | | (407,388 | ) |
|
|
Decrease in Net Assets From
Distributions to Shareholders | | | (7,444,288 | ) |
|
|
| FUND SHARE TRANSACTIONS: | | | | |
Net proceeds from sale of shares (8,200,000 shares issued, net of $328,000 offering cost) | | | 156,292,000 | |
Proceeds from shares issued on reinvestment of distributions (118,188 shares issued) | | | 2,219,646 | |
|
|
Increase in Net Assets From Fund Share Transactions | | | 158,511,646 | |
|
|
Increase in Net Assets | | | 161,966,089 | |
| NET ASSETS: | | | | |
Beginning of period | | | 100,000 | |
|
|
End of period* | | $ | 162,066,089 | |
|
|
Includes overdistributed net investment income of: | | | (7,473 | ) |
|
|
| † | | For the period October 26, 2004 (commencement of operations) to September 30, 2005. |
See Notes to Financial Statements.
Salomon Brothers Variable Rate Strategic Fund Inc. 2005 Annual Report 27
Statement of Cash Flows (For the period ended September 30, 2005†)
| | | | |
| CASH FLOWS PROVIDED (USED) BY OPERATING ACTIVITIES: | | | | |
Interest and dividend received | | $ | 8,835,861 | |
Operating expenses paid | | | (1,336,006 | ) |
Net purchases of short-term investments | | | (3,704,000 | ) |
Realized loss on foreign currency transactions | | | (2,232 | ) |
Realized gain on futures contracts | | | 122,748 | |
Realized loss on interest rate swap contracts | | | (715,309 | ) |
Net change in unrealized depreciation on foreign currencies | | | (93 | ) |
Purchases of long-term investments | | | (293,913,657 | ) |
Proceeds from disposition of long-term investments | | | 72,987,266 | |
Interest paid | | | (674,152 | ) |
Deposits with brokers for reverse repurchase agreement | | | (696,000 | ) |
|
|
Net Cash Flows Used By Operating Activities | | | (219,095,574 | ) |
|
|
| CASH FLOWS PROVIDED (USED) BY FINANCING ACTIVITIES: | | | | |
Cash distributions paid on Common Stock | | | (7,444,288 | ) |
Proceeds from sale of shares | | | 156,292,000 | |
Proceeds from reverse repurchase agreements | | | 68,098,000 | |
Proceeds from reinvestment of dividends | | | 2,219,646 | |
|
|
Net Cash Flows Provided by Financing Activities | | | 219,165,358 | |
|
|
Net Increase in Cash | | | 69,784 | |
Cash, Beginning of period | | | 100,000 | |
|
|
Cash, End of period | | $ | 169,784 | |
|
|
| RECONCILIATION OF INCREASE IN NET ASSETS FROM OPERATIONS TO NET CASH FLOWS PROVIDED (USED) BY OPERATING ACTIVITIES: | | | | |
Increase in Net Assets From Operations | | $ | 10,898,731 | |
|
|
Accretion of discount on investments | | | (362,877 | ) |
Amortization of premium on investments | | | 2,073,675 | |
Increase in investments, at value | | | (232,192,850 | ) |
Increase in payable for securities purchased | | | 5,236,316 | |
Increase in interest receivable | | | (3,491,720 | ) |
Deposits with brokers for reverse repurchase agreement | | | (696,000 | ) |
Increase in interest rate swap contracts payable | | | 1,077,904 | |
Increase in receivable for securities sold | | | (2,019,180 | ) |
Increase in prepaid expenses | | | (8,081 | ) |
Increase in interest payable | | | 163,044 | |
Increase in accrued expenses | | | 225,363 | |
Increase in payable for currency spot contracts | | | 101 | |
|
|
Total Adjustments | | | (229,994,305 | ) |
|
|
Net Cash Flows Used By Operating Activities | | $ | (219,095,574 | ) |
|
|
| † | | For the period October 26, 2004 (commencement of operations) to September 30, 2005. |
See Notes to Financial Statements.
28 Salomon Brothers Variable Rate Strategic Fund Inc. 2005 Annual Report
Financial Highlights
For a share of capital stock outstanding throughout the period ended September 30, unless otherwise noted:
| | | | |
| |
| | | 2005(1) | |
Net Asset Value, Beginning of Period | | $ | 19.06 | (2) |
|
|
Income (Loss) From Operations: | | | | |
Net investment income | | | 0.86 | |
Net realized and unrealized gain | | | 0.45 | |
|
|
Total Income From Operations | | | 1.31 | |
|
|
Less Distributions From: | | | | |
Net investment income | | | (0.85 | ) |
Paid-in capital | | | (0.05 | ) |
|
|
Total Distributions | | | (0.90 | ) |
|
|
Net Asset Value, End of Period | | $ | 19.47 | |
|
|
Market Price, End of Period | | $ | 17.16 | |
|
|
Total Return, Based on Market Price Per Share(3) | | | (9.82 | )% |
|
|
Total Return Based on Net Asset Value(3) | | | 7.06 | % |
|
|
Net Assets, End of Period (000s) | | | $162,066 | |
|
|
Ratios to Average Net Assets: | | | | |
Expenses | | | 1.65 | %(4) |
Expenses excluding interest expense | | | 1.07 | %(4) |
Net investment income | | | 4.94 | (4) |
|
|
Portfolio Turnover Rate | | | 46 | % |
|
|
| (1) | | For the period October 26, 2004 (commencement of operations) to September 30, 2005. |
| (2) | | Initial public offering price of $20.00 per share less offering costs and sales load totaling $0.94 per share. |
| (3) | | The total return calculation assumes that dividends are reinvested in accordance with the Fund’s dividend reinvestment plan. Past performance is no guarantee of future results. Total returns for periods of less than one year are not annualized. |
See Notes to Financial Statements.
Salomon Brothers Variable Rate Strategic Fund Inc. 2005 Annual Report 29
Notes to Financial Statements
| 1. | Organization and Significant Accounting Policies |
The Salomon Brothers Variable Rate Strategic Fund Inc. (the “Fund”) was incorporated in Maryland on August 3, 2004 and is registered as a non-diversified, closed-end management investment company under the Investment Company Act of 1940 (“1940 Act”), as amended. The Fund’s Board of Directors authorized 100 million shares of $0.001 par value common stock. The Fund’s primary investment objective is to maintain a high level of current income.
The following are significant accounting policies consistently followed by the Fund and are in conformity with U.S. generally accepted accounting principles (“GAAP”). Estimates and assumptions are required to be made regarding assets, liabilities and changes in net assets resulting from operations when financial statements are prepared. Changes in the economic environment, financial markets and any other parameters used in determining these estimates could cause actual results to differ.
(a) Investment Valuation. Debt securities are valued at the mean between the bid and asked prices provided by an independent pricing service that are based on transactions in debt obligations, quotations from bond dealers, market transactions in comparable securities and various relationships between securities. Equity securities for which market quotations are available are valued at the last sale price or official closing price on the primary market or exchange on which they trade. Publicly traded foreign government debt securities are typically traded internationally in the over-the-counter market, and are valued at the mean between the bid and asked prices as of the close of business of that market. When prices are not readily available, or are determined not to reflect fair value, such as when the value of a security has been significantly affected by events after the close of the exchange or market on which the security is principally traded, but before the Fund calculates its net asset value, the Fund may value these investments at fair value as determined in accordance with the procedures approved by the Fund’s Board of Directors. Short-term obligations with maturities of 60 days or less are valued at amortized cost, which approximates market value.
(b) Repurchase Agreements. When entering into repurchase agreements, it is the Fund’s policy that its custodian or a third party custodian take possession of the underlying collateral securities, the market value of which at least equals the principal amount of the repurchase transaction, including accrued interest. To the extent that any repurchase transaction exceeds one business day, the value of the collateral is marked-to-market to ensure the adequacy of the collateral. If the seller defaults, and the market value of the collateral declines or if bankruptcy proceedings are commenced with respect to the seller of the security, realization of the collateral by the Fund may be delayed or limited.
(c) Reverse Repurchase Agreements. The Fund may enter into reverse repurchase agreements in which the Fund sells portfolio securities and agrees to repurchase them from the buyer at a specified date and price. Whenever the Fund enters into a reverse repurchase agreement, the Fund’s custodian delivers liquid assets to the counterparty in an amount at least equal to the repurchase price marked-to-market daily (including accrued interest). The Fund pays interest on amounts obtained pursuant to reverse repurchase agreements. Reverse repurchase agreements are considered to be borrowings which may create leverage risk by the Fund.
30 Salomon Brothers Variable Rate Strategic Fund Inc. 2005 Annual Report
Notes to Financial Statements (continued)
(d) Financial Futures Contracts. The Fund may enter into financial future contracts typically to hedge a portion of their portfolio. Upon entering into a financial futures contract, the Fund is required to deposit cash or securities as initial margin. Additional securities are also segregated up to the current market value of the financial futures contracts. Subsequent payments, known as variation margin, are made or received by the Fund each day, depending on the daily fluctuation in the value of the underlying financial instruments. The Fund recognizes an unrealized gain or loss equal to the daily variation margin. When the financial future contracts are closed, a realized gain or loss is recognized equal to the difference between the proceeds from (or cost of) the closing transactions and the Fund’s basis in the contracts.
The risks associated with entering into financial futures contracts include the possibility that a change in the value of the contract may not correlate with the changes in the value of the underlying instruments. In addition, investing in financial futures contracts involves the risk that the Fund could lose more than the original margin deposit and subsequent payments required for a futures transaction. Risks may also arise upon entering into these contracts from the potential inability of the counterparties to meet the terms of their contracts.
(e) Loan Participations. The Fund may invest in loans arranged through private negotiation between one or more financial institutions. The Fund’s investment in any such loan may be in the form of a participation in or an assignment of the loan. In connection with purchasing participations, the Fund generally will have no right to enforce compliance by the borrower with the terms of the loan agreement relating to the loan, nor any rights of set-off against the borrower and the Fund may not benefit directly from any collateral supporting the loan in which it has purchased the participation.
The Fund will assume the credit risk of both the borrower and the lender that is selling the participation and any other persons interpositioned between the Fund and the borrower. In the event of the insolvency of the lender selling the participation, the Fund may be treated as a general creditor of the lender and may not benefit from any set-off between the lender and the borrower.
(f) Interest Rate Swaps. In order to manage interest rate sensitivity (duration), the Fund has entered into an interest rate swap agreement with JPMorgan Chase Bank and Barclays Bank PLC New York (counterparty) pursuant to which, the Fund has guaranteed to make semi-annual payments to the counterparty at predetermined fixed rates, in exchange for floating payments from the counterparty at the 6-month LIBOR, based on notional principal amount. During the term of the outstanding swap agreement, changes in the underlying value of the swap are recorded as unrealized gains or losses. Net periodic interest payments to be received or paid are accrued daily and recorded in the Statement of Operations as an adjustment to realized gain or loss.
(g) Security Transactions and Investment Income. Security transactions are accounted for on a trade date basis. Interest income, adjusted for amortization of premium and accretion of discount, is recorded on the accrual basis. Dividend income is recorded on the ex-dividend date. The cost of investments sold is determined by use of the specific identification method. To the extent any issuer defaults on an expected interest payment, the Fund’s policy is to generally halt any additional interest income accruals and consider the realizability of interest accrued up to the date of default.
Salomon Brothers Variable Rate Strategic Fund Inc. 2005 Annual Report 31
Notes to Financial Statements (continued)
(h) Foreign Currency Translation. Investment securities and other assets and liabilities denominated in foreign currencies are translated into U.S. dollar amounts based upon prevailing exchange rates on the date of valuation. Purchases and sales of investment securities and income and expense items denominated in foreign currencies are translated into U.S. dollar amounts based upon prevailing exchange rates on the respective dates of such transactions.
The Fund does not isolate that portion of the results of operations resulting from changes in foreign exchange rates on investments from the fluctuations arising from changes in market prices of securities held. Such fluctuations are included with the net realized and unrealized gain or loss on investments.
Net realized foreign exchange gains or losses arise from sales of foreign currencies, including gains and losses on forward foreign currency contracts, currency gains or losses realized between the trade and settlement dates on securities transactions and the difference between the amounts of dividends, interest and foreign withholding taxes recorded on the Fund’s books and the U.S. dollar equivalent of the amounts actually received or paid. Net unrealized foreign exchange gains and losses arise from changes in the fair values of assets and liabilities, other than investments in securities, at the date of valuation, resulting from changes in exchange rates.
Foreign security and currency transactions may involve certain considerations and risks not typically associated with those of U.S. dollar denominated transactions as a result of, among other factors, the possibility of lower levels of governmental supervision and regulation of foreign securities markets and the possibility of political or economic instability.
(i) Credit and Market Risk. The Fund invests in high yield and emerging market instruments that are subject to certain credit and market risks. The yields of high yield and emerging market debt obligations reflect, among other things, perceived credit risk and markets risk. The Fund’s investment in securities rated below investment grade typically involve risks not associated with higher rated securities including, among others, greater risk related to timely and ultimate payment of interest and principal, greater market price volatility and less liquid secondary market trading. The consequences of political, social, economic or diplomatic changes may have disruptive effects on the market prices of investments held by the Fund. The Fund’s investment in non-dollar denominated securities may also result in foreign currency losses caused by devaluations and exchange rate fluctuations.
(j) Distributions to Shareholders. Distributions from net investment income for the Fund, if any, are declared and paid on a monthly basis. Distributions of net realized gains, if any, are declared at least annually. Distributions are recorded on the ex-dividend date and are determined in accordance with income tax regulations, which may differ from GAAP.
(k) Cash Flow Information. The Fund invests in securities and distributions to shareholders, which are paid in cash and may be reinvested at the discretion of shareholders. These activities are reported in the Statement of Changes in Net Assets and additional information on cash receipts and cash payments are presented in the Statement of Cash Flows.
(l) Federal and Other Taxes. It is the Fund’s policy to comply with the federal income and excise tax requirements of the Internal Revenue Code of 1986, as amended, applicable to regulated investment companies. Accordingly, the Fund intends to distribute substantially all
32 Salomon Brothers Variable Rate Strategic Fund Inc. 2005 Annual Report
Notes to Financial Statements (continued)
of its taxable income and net realized gains on investments, if any, to shareholders each year. Therefore, no federal income tax provision is required in the Fund’s financial statements.
(m) Reclassifications. GAAP requires that certain components of net assets be adjusted to reflect permanent differences between financial and tax reporting. These reclassifications have no effect on net assets or net asset values per share. During the period ended September 30, 2005, the following reclassifications have been made:
| | | | |
| | |
Overdistributed
Net Investment
Income | | Accumulated Net
Realized Loss | | Paid-in Capital |
(a) $747 | | — | | $(747) |
|
(b) (119,715) | | $119,715 | | — |
|
| (a) | | Reclassifications are primarily due to a non-deductible excise tax paid by the Fund. |
| (b) | | Reclassifications are primarily due to foreign currency transactions treated as ordinary income for tax purposes and differences between book and tax amortization of premium on fixed income securities and book/tax differences in the treatment on interest rate swap contracts. |
| 2. | Management Agreement and Other Transactions |
Salomon Brothers Asset Management Inc (“SBAM”), an indirect wholly-owned subsidiary of Citigroup Inc. (“Citigroup”), acts as investment manager and administrator to the Fund. SBAM is responsible on a day-to-day basis for the management of the Fund’s portfolio in accordance with the Fund’s investment objectives and policies and for making decisions to buy, sell or hold particular securities of the Fund. The fee for these services is payable monthly at an annual rate of 0.75% of the Fund’s average daily net assets plus the proceeds of any outstanding borrowings.
The Investment Manager has agreed to pay (i) all of the Fund’s organizational costs and (ii) offering costs of the Fund (other than sales load) that exceed $0.04 per Common Share.
At September 30, 2005, Citigroup Financial Products Inc., another indirectly, wholly-owned subsidiary of Citigroup, held 5,246 shares of the Fund.
Certain officers and/or directors of the Fund are also officers and/or directors of SBAM and do not receive compensation from the Fund.
During the period ended September 30, 2005, the aggregate cost of purchases and proceeds from sales of investments (excluding short-term investments) and U.S Government and Agency Obligations were as follows:
| | | | | | |
| | |
| | | Investments | | U.S. Government and
Agency Obligations |
Purchases | | $ | 215,237,534 | | $ | 83,912,440 |
|
Sales | | | 52,100,421 | | | 22,680,261 |
|
Salomon Brothers Variable Rate Strategic Fund Inc. 2005 Annual Report 33
Notes to Financial Statements (continued)
At September 30, 2005, the aggregate gross unrealized appreciation and depreciation of investments for federal income tax purposes were as follows:
| | | | |
Gross unrealized appreciation | | $ | 5,094,062 | |
Gross unrealized depreciation | | | (2,606,219 | ) |
|
|
Net unrealized appreciation | | $ | 2,487,843 | |
|
|
At September 30, 2005, the Fund had the following open reverse repurchase agreements:
| | | | | | |
| | |
Face
Amount | | Security | | Value |
| $ | 6,778,000 | | Reverse Repurchase Agreement with Lehman Brothers Inc., dated 9/8/05 bearing interest at 3.720% to be repurchased at $6,798,311 on 10/7/05, collateralized by: $6,635,552 Fannie Mae, 6.000% due 5/1/33; Market value (including accrued interest) — $6,782,788 | | $ | 6,778,000 |
| | 1,929,000 | | Reverse Repurchase Agreement with Lehman Brothers Inc., dated 9/8/05 bearing interest at 3.780% to be repurchased at $1,934,874 on 10/7/05, collateralized by: $1,996,733 Indymac Index Mortgage Loan Trust, Series 2005-AR21, Class 4A1, 5.474% due 10/25/35; Market value (including accrued interest) — $2,013,330 | | | 1,929,000 |
| | 3,638,000 | | Reverse Repurchase Agreement with Lehman Brothers Inc., dated 9/8/05 bearing interest at 3.720% to be repurchased at $3,648,902 on 10/7/05, collateralized by: $3,694,984 Fannie Mae, 5.500% due 4/1/35; Market value (including accrued interest) — $3,712,612 | | | 3,638,000 |
| | 5,985,000 | | Reverse Repurchase Agreement with Lehman Brothers Inc., dated 9/8/05 bearing interest at 3.72% to be repurchased at $6,002,935 on 10/7/05, collateralized by: $6,049,088 Fannie Mae, 5.500% due 4/1/35; Market value (including accrued interest) — $6,077,947 | | | 5,985,000 |
| | 3,218,000 | | Reverse Repurchase Agreement with Lehman Brothers Inc., dated 9/8/05 bearing interest at 3.720% to be repurchased at $3,227,643 on 10/7/05, collateralized by: $3,147,551 Freddie Mac, Gold, 6.000% due 2/1/33; Market value (including accrued interest) — $3,219,746 | | | 3,218,000 |
| | 7,574,000 | | Reverse Repurchase Agreement with Lehman Brothers Inc., dated 9/8/05 bearing interest at 3.720% to be repurchased at $7,596,697 on 10/7/05, collateralized by: $7,562,432 Freddie Mac, Gold, 6.500% due 11/1/34; Market value (including accrued interest) — $7,820,339 | | | 7,574,000 |
| | 9,650,000 | | Reverse Repurchase Agreement with Lehman Brothers Inc., dated 9/8/05 bearing interest at 3.720% to be repurchased at $9,678,918 on 10/7/05, collateralized by: $9,764,911 Freddie Mac, Gold, 5.500% due 6/1/35; Market value (including accrued interest) — $9,817,601 | | | 9,650,000 |
| | 3,168,000 | | Reverse Repurchase Agreement with Lehman Brothers Inc., dated 9/8/05 bearing interest at 3.780% to be repurchased at $3,177,647 on 10/7/05, collateralized by: $17,605,639 Fannie Mae Interest Strip, Series 337, Class 2, 5.000% due 6/1/33; Market value (including accrued interest) — $3,861,669 | | | 3,168,000 |
| | 1,281,000 | | Reverse Repurchase Agreement with Lehman Brothers Inc., dated 9/8/05 bearing interest at 3.780% to be repurchased at $1,284,901 on 10/7/05, collateralized by: $8,272,889 Freddie Mac, Series 2639, Class UI, 5.000% due 3/15/22; Market value (including accrued interest) — $1,303,934 | | | 1,281,000 |
34 Salomon Brothers Variable Rate Strategic Fund Inc. 2005 Annual Report
Notes to Financial Statements (continued)
| | | | | | |
| | |
Face
Amount | | Security | | Value |
| $ | 1,651,000 | | Reverse Repurchase Agreement with Lehman Brothers Inc., dated 9/8/05 bearing interest at 3.780% to be repurchased at $1,656,027 on 10/7/05, collateralized by: $18,296,310 Freddie Mac, Series 2645, Class IW, 5.000% due 7/15/26; Market value (including accrued interest) — $2,084,119 | | $ | 1,651,000 |
| | 6,692,000 | | Reverse Repurchase Agreement with Lehman Brothers Inc., dated 9/8/05 bearing interest at 3.780% to be repurchased at $6,712,377 on 10/7/05, collateralized by: $6,864,847 Lehman XS Trust, Series 2005-RF3, Class 2A, 4.648% due 7/25/35; Market value (including accrued interest) — $6,817,371 | | | 6,692,000 |
| | 12,717,000 | | Reverse Repurchase Agreement with Lehman Brothers Inc., dated 9/8/05 bearing interest at 3.780% to be repurchased at $12,755,723 on 10/7/05, collateralized by: $13,107,353 Structured Asset Securities Corp., 4.648% due 6/25/35; Market value (including accrued interest) — $13,395,408 | | | 12,717,000 |
| | 1,086,000 | | Reverse Repurchase Agreement with Lehman Brothers Inc., dated 9/8/05 bearing interest at 3.780% to be repurchased at $1,089,307 on 10/7/05, collateralized by: $7,730,567 Freddie Mac, Series 2638, Class DI, 5.000% due 5/15/23; Market value (including accrued interest) — $1,369,678 | | | 1,086,000 |
| | 1,057,000 | | Reverse Repurchase Agreement with Lehman Brothers Inc., dated 9/7/05 bearing interest at 3.780% to be repurchased at $1,060,219 on 10/7/05, collateralized by: $19,076,152 Freddie Mac, Series 2684, Class PI, 5.000% due 5/15/23; Market value (including accrued interest) — $1,534,310 | | | 1,057,000 |
| | 819,000 | | Reverse Repurchase Agreement with Lehman Brothers Inc., dated 9/8/05 bearing interest at 3.780% to be repurchased at $821,494 on 10/7/05, collateralized by: $7,826,193 Freddie Mac, Series 2839, Class TX, 5.000% due 1/15/19; Market value (including accrued interest) — $1,260,751 | | | 819,000 |
| | 855,000 | | Reverse Repurchase Agreement with Lehman Brothers Inc., dated 9/8/05 bearing interest at 3.780% to be repurchased at $857,603 on 10/7/05, collateralized by: $7,543,000 Freddie Mac, Series 2866, Class IC, 5.000% due 1/15/24; Market value (including accrued interest) — $1,039,752 | | | 855,000 |
|
|
| | | | TOTAL REVERSE REPURCHASE AGREEMENTS
(Cost — $68,098,000) | | $ | 68,098,000 |
|
|
Transactions in reverse repurchase agreements for the Fund during the period ended September 30, 2005 were as follows:
| | | | | | |
| | |
Average
Daily
Balance | | Weighted
Average
Interest Rate | | | Maximum
Amount
Outstanding |
| $26,492,787 | | 3.41 | % | | $ | 71,447,000 |
|
Interest rates on reverse repurchase agreements ranged from 3.07% to 3.78% during the period ended September 30, 2005. Interest expense incurred on reverse repurchase agreements totaled $837,196.
Salomon Brothers Variable Rate Strategic Fund Inc. 2005 Annual Report 35
Notes to Financial Statements (continued)
At September 30, 2005, the Fund held the following interest rate swap contracts:
| | |
| Swap Counterparty: | | Barclays Bank PLC New York |
| Effective Date: | | 1/7/05 |
| Notional Amount: | | $5,000,000 |
| Payments Made by Fund: | | Fixed Rate 4.104% |
| Payments Received by Fund: | | Floating Rate (6 month LIBOR) |
| Termination Date: | | 1/7/10 |
| Unrealized Appreciation | | $98,177 |
| | |
|
| Swap Counterparty: | | Barclays Bank PLC New York |
| Effective Date: | | 1/7/05 |
| Notional Amount: | | $30,000,000 |
| Payments Made by Fund: | | Fixed Rate 3.780% |
| Payments Received by Fund: | | Floating Rate (6 month LIBOR) |
| Termination Date: | | 1/7/08 |
| Unrealized Appreciation | | $491,440 |
| | |
|
| Swap Counterparty: | | JPMorgan Chase Bank |
| Effective Date: | | 1/7/05 |
| Notional Amount: | | $20,000,000 |
| Payments Made by Fund: | | Fixed Rate 3.778% |
| Payments Received by Fund: | | Floating Rate (6 month LIBOR) |
| Termination Date: | | 1/7/07 |
| Unrealized Appreciation | | $220,387 |
| | |
|
| Swap Counterparty: | | JPMorgan Chase Bank |
| Effective Date: | | 1/7/05 |
| Notional Amount: | | $10,000,000 |
| Payments Made by Fund: | | Fixed Rate 4.665% |
| Payments Received by Fund: | | Floating Rate (6 month LIBOR) |
| Termination Date: | | 1/7/15 |
| Unrealized Appreciation | | $65,569 |
| | |
|
| Swap Counterparty: | | JPMorgan Chase Bank |
| Effective Date: | | 12/7/04 |
| Notional Amount: | | $18,000,000 |
| Payments Made by Fund: | | Fixed Rate 4.655% |
| Payments Received by Fund: | | Floating Rate (6 month LIBOR) |
| Termination Date: | | 12/7/14 |
| Unrealized Appreciation | | $126,238 |
| | |
|
| Swap Counterparty: | | JPMorgan Chase Bank |
| Effective Date: | | 12/9/04 |
| Notional Amount: | | $18,000,000 |
| Payments Made by Fund: | | Fixed Rate 3.994% |
| Payments Received by Fund: | | Floating Rate (6 month LIBOR) |
| Termination Date: | | 12/9/09 |
| Unrealized Appreciation | | $418,789 |
| | |
|
At September 30, 2005, the Fund held loan participations with a total cost of $14,106,702 and a total market value of $14,257,299.
36 Salomon Brothers Variable Rate Strategic Fund Inc. 2005 Annual Report
Notes to Financial Statements (continued)
| 4. | Dividends Subsequent to September 30, 2005 |
On July 25, 2005, the Board of Directors of the Fund declared two common stock distributions, each in the amount of $0.0875 per share, payable on October 28, 2005, and November 25, 2005 to shareholders of record on October 18, 2005 and November 15, 2005.
| 5. | Income Tax Information and Distributions to Shareholders |
The tax character of distributions paid during the fiscal period ended September 30, 2005, was as follows:
| | | |
| |
| | | 2005 |
Distributions Paid From: | | | |
Ordinary income | | $ | 7,036,900 |
Tax return of capital | | | 407,388 |
|
Total Distributions Paid | | $ | 7,444,288 |
|
As of September 30, 2005, the components of accumulated earnings on a tax basis were as follows:
| | | | |
Other book/tax temporary differences(a) | | | $(45,671 | ) |
Unrealized appreciation(b) | | | 3,908,249 | |
|
|
Total accumulated earnings | | $ | 3,862,578 | |
|
|
| (a) | | Other book/tax temporary differences are attributable primarily to the deferral of post-October capital loss for tax purposes and differences in the book/tax treatment of various items. |
| (b) | | The difference between book-basis and tax-basis unrealized appreciation/(depreciation) is attributable primarily to the tax deferral of losses on wash sales and the difference between book & tax amortization methods for premiums on fixed income securities. |
On May 31, 2005, the U.S. Securities and Exchange Commission (“SEC”) issued an order in connection with the settlement of an administrative proceeding against Smith Barney Fund Management LLC (“SBFM”) and Citigroup Global Markets Inc. (“CGM”) relating to the appointment of an affiliated transfer agent for the Smith Barney family of mutual funds (the “Funds”).
The SEC order finds that SBFM and CGM willfully violated Section 206(1) of the Investment Advisers Act of 1940 (“Advisers Act”). Specifically, the order finds that SBFM and CGM knowingly or recklessly failed to disclose to the boards of the Funds in 1999 when proposing a new transfer agent arrangement with an affiliated transfer agent that: First Data Investors Services Group (“First Data”), the Funds’ then-existing transfer agent, had offered to continue as transfer agent and do the same work for substantially less money than before; and that Citigroup Asset Management (“CAM”), the Citigroup business unit that includes the Fund’s investment manager and other investment advisory companies, had entered into a side letter with First Data under which CAM agreed to recommend the appointment of First Data as sub-transfer agent to the affiliated transfer agent in exchange, among other things, for a guarantee by First Data of specified amounts of asset management and investment banking fees to CAM and CGM. The order also finds that SBFM
Salomon Brothers Variable Rate Strategic Fund Inc. 2005 Annual Report 37
Notes to Financial Statements (continued)
and CGM willfully violated Section 206(2) of the Advisers Act by virtue of the omissions discussed above and other representations and omissions in the materials provided to the Funds’ boards, including the failure to make clear that the affiliated transfer agent would earn a high profit for performing limited functions while First Data continued to perform almost all of the transfer agent functions, and the suggestion that the proposed arrangement was in the Funds’ best interests and that no viable alternatives existed. SBFM and CGM do not admit or deny any wrongdoing or liability. The settlement does not establish wrongdoing or liability for purposes of any other proceeding.
The SEC censured SBFM and CGM and ordered them to cease and desist from violations of Sections 206(1) and 206(2) of the Advisers Act. The order requires Citigroup to pay $208.1 million, including $109 million in disgorgement of profits, $19.1 million in interest, and a civil money penalty of $80 million. Approximately $24.4 million has already been paid to the Funds, primarily through fee waivers. The remaining $183.7 million, including the penalty, has been paid to the U.S. Treasury and will be distributed pursuant to a plan prepared by Citigroup and submitted for approval by the SEC. The order also requires that transfer agency fees received from the Funds since December 1, 2004 less certain expenses be placed in escrow and provides that a portion of such fees may be subsequently distributed in accordance with the terms of the order.
The order requires SBFM to recommend a new transfer agent contract to the Funds’ boards within 180 days of the entry of the order; if a Citigroup affiliate submits a proposal to serve as transfer agent or sub-transfer agent, an independent monitor must be engaged at the expense of SBFM and CGM to oversee a competitive bidding process. Under the order, Citigroup also must comply with an amended version of a vendor policy that Citigroup instituted in August 2004. That policy, as amended, among other things, requires that when requested by a Fund board, CAM will retain at its own expense an independent consulting expert to advise and assist the board on the selection of certain service providers affiliated with Citigroup.
At this time, there is no certainty as to how the proceeds of the settlement will be distributed, to whom such distributions will be made, the methodology by which such distributions will be allocated, and when such distributions will be made. Although there can be no assurance, Citigroup does not believe that this matter will have a material adverse effect on the Funds.
The Fund did not implement the contractual arrangement described above and will not receive any payments.
| 7. | Change in Independent Registered Public Accounting Firm (unaudited) |
PricewaterhouseCoopers LLP resigned as the independent registered public accounting firm for the Fund effective June 17, 2005. The Fund’s Audit Committee approved the engagement of KPMG LLP as the Fund’s new independent registered public accounting firm for the fiscal year ending September 30, 2005. A majority of the Fund’s Board of Directors, including a majority of the independent Directors, approved the appointment of KPMG LLP, subject to the right of the Fund, by a majority vote of the shareholders at any meeting called for that purpose, to terminate the appointment without penalty.
38 Salomon Brothers Variable Rate Strategic Fund Inc. 2005 Annual Report
Notes to Financial Statements (continued)
The report of PricewaterhouseCoopers LLP on the Fund’s statement of asset and liabilities dated October 6, 2004 contained no adverse opinion or disclaimer of opinion and was not qualified or modified as to uncertainty, audit scope or accounting principles. There have been no disagreements with PricewaterhouseCoopers LLP during the period from commencement of operations on any matter of accounting principles or practices, financial statement disclosure or auditing scope or procedure which, if not resolved to the satisfaction of PricewaterhouseCoopers LLP, would have caused them to make reference thereto in their report on the financial statements for such period.
Beginning in August 2005, five class action lawsuits alleging violations of federal securities laws and state law were filed against CGM and SBFM (collectively, the “Defendants”) based on the May 31, 2005 settlement order issued against the Defendants by the SEC described in Note 6. The complaints seek injunctive relief and compensatory and punitive damages, removal of SBFM as the advisor for the Smith Barney family of funds, rescission of the Funds’ management and other contracts with SBFM, recovery of all fees paid to SBFM pursuant to such contracts, and an award of attorneys’ fees and litigation expenses.
On October 5, 2005, a motion to consolidate the five actions and any subsequently filed, related action was filed. That motion contemplates that a consolidated amended complaint alleging substantially similar causes of action will be filed in the future.
As of the date of this report, CAM believes that resolution of the pending lawsuit will not have a material effect on the financial position or results of operations of the Funds or the ability of the Advisers and their affiliates to continue to render services to the Funds under their respective contracts.
On June 24, 2005, Citigroup announced that it has signed a definitive agreement under which Citigroup will sell substantially all of its worldwide asset management business to Legg Mason, Inc. (“Legg Mason”).
As part of this transaction, SBAM (the “Manager”), currently an indirect wholly owned subsidiary of Citigroup, would become an indirect wholly owned subsidiary of Legg Mason. The Manager is the investment manager to the Fund.
The transaction is subject to certain regulatory approvals, as well as other customary conditions to closing. Subject to such approvals and the satisfaction of the other conditions, Citigroup expects the transaction to be completed later this year.
Under 1940 Act, consummation of the transaction will result in the automatic termination of the investment management contract between the Fund and the Manager. Therefore, the Fund’s Board has approved a new investment management contract between the Fund and the Manager to become effective upon the closing of the sale to Legg Mason. The new investment management contract has been presented to the shareholders of the Fund for the approval.
The Fund has received information from CAM concerning SBAM, an investment advisory company that is part of CAM.
Salomon Brothers Variable Rate Strategic Fund Inc. 2005 Annual Report 39
Notes to Financial Statements (continued)
The information received from CAM is as follows:
On September 16, 2005, the staff of the Securities and Exchange Commission (the “Commission”) informed SBAM that the staff is considering recommending that the Commission institute administrative proceedings against SBAM for alleged violations of Sections 19(a) and 34(b) of the Investment Company Act (and related Rule 19a-1). The notification is a result of an industry wide inspection undertaken by the Commission and is based upon alleged deficiencies in disclosures regarding dividends and distributions paid to shareholders of certain funds. In connection with the contemplated proceedings, the staff may seek a cease and desist order and/or monetary damages from SBAM.
Although there can be no assurance, SBAM believes that this matter is not likely to have a material adverse effect on the Fund or SBAM’s ability to perform investment advisory services relating to the Fund.
The Commission staff ‘s recent notification will not affect the sale by Citigroup Inc. of substantially all of CAM’s worldwide business to Legg Mason, Inc., which Citigroup continues to expect will occur in the fourth quarter of this year.
40 Salomon Brothers Variable Rate Strategic Fund Inc. 2005 Annual Report
Report of Independent Registered Public Accounting Firm
The Board of Directors and Shareholders Salomon Brothers Variable Rate Strategic Fund Inc.
We have audited the accompanying statement of assets and liabilities, including the schedule of investments, of Salomon Brothers Variable Rate Strategic Fund Inc. as of September 30, 2005, and the related statement of operations, the statement of changes in net assets and the financial highlights for the period then ended from October 26, 2004 (commencement of operations) to September 30, 2005. These financial statements and financial highlights are the responsibility of the Fund’s management. Our responsibility is to express an opinion on these financial statements and financial highlights based on our audit.
We conducted our audit in accordance with the standards of the Public Company Accounting Oversight Board (United States). Those standards require that we plan and perform the audit to obtain reasonable assurance about whether the financial statements and financial highlights are free of material misstatement. An audit includes examining, on a test basis, evidence supporting the amounts and disclosures in the financial statements. Our procedures included confirmation of securities owned as of September 30, 2005, by correspondence with the custodian and brokers or by other appropriate auditing procedures. An audit also includes assessing the accounting principles used and significant estimates made by management, as well as evaluating the overall financial statement presentation. We believe that our audit provides a reasonable basis for our opinion.
In our opinion, the financial statements and financial highlights referred to above present fairly, in all material respects, the financial position of Salomon Brothers Variable Rate Strategic Fund Inc. as of September 30, 2005, and the results of its operations, the changes in its net assets and the financial highlights for the period from October 26, 2004 (commencement of operations) to September 30, 2005, in conformity with U.S. generally accepted accounting principles.

New York, New York
November 18, 2005
Salomon Brothers Variable Rate Strategic Fund Inc. 2005 Annual Report 41
Board Approval of Management Agreement (unaudited)
Background
The members of the Board of Salomon Brothers Variable Rate Strategic Fund Inc. (the “Fund”), including the Fund’s independent, or non-interested, Board members (the “Independent Board Members”), received extensive information from the Fund’s manager (the “Manager”) to assist them in their consideration of the Fund’s management agreement (the “Management Agreement”). This includes a variety of information about the Manager, including the advisory arrangements for the Fund and other funds overseen by the Board, certain portions of which are discussed below.
At an in-person meeting held on July 25 and 26, 2005, a presentation was made to the Board by the Manager that encompassed the Fund and all the funds for which the Board has responsibility. The Board evaluated information made available on a fund-by-fund basis and its determinations were made separately in respect of each fund, including the Fund. The Fund has a combined investment advisory and administration agreement. The discussion below covers both advisory and administrative functions being rendered by the Manager.
Board Approval of Management Agreement
The Board unanimously approved the continuation of the Management Agreement for a period of up to one year concluding, in doing so, that the Manager should continue to be the Fund’s investment adviser and that the compensation payable under the agreement is fair and reasonable in light of the services performed, expenses incurred and such other matters as the Board considered relevant in the exercise of its business judgment. In approving continuance of the Management Agreement, the Board considered the announcement on June 24, 2005 by Citigroup that it had signed a definitive agreement under which Citigroup will sell substantially all of its worldwide asset management business to Legg Mason, Inc. Upon completion of this transaction the Manager, currently an indirect wholly-owned subsidiary of Citigroup, would become an indirect wholly-owned subsidiary of Legg Mason, Inc. and the Management Agreement will terminate. Other factors considered and conclusions rendered by the Board in determining to approve the continuation of the Management Agreement included the following:
Nature, Extent and Quality of the Services under the Management Agreement
The Board received and considered information regarding the nature, extent and quality of services provided to the Fund by the Manager under the Management Agreement during the past year. The Board also received a description of the administrative and other services rendered to the Fund and its shareholders by the Manager. The Board noted that it had received information at regular meetings throughout the year related to the services rendered by the Manager about the management of the Fund’s affairs and the Manager’s role in coordinating the activities of the Fund’s other service providers. The Board’s evaluation of the services provided by the Manager took into account the Board’s knowledge and familiarity gained as Board members of funds in the Citigroup Asset Management (“CAM”) fund complex, including the scope and quality of the Manager’s investment
42 Salomon Brothers Variable Rate Strategic Fund Inc. 2005 Annual Report
Board Approval of Management Agreement (unaudited) (continued)
management and other capabilities and the quality of its administrative and other services. The Board considered that the scope of services provided by the Manager had expanded over time as a result of regulatory and other developments, including maintaining and monitoring its own and the Fund’s expanded compliance programs. The Board also considered the Manager’s response to recent regulatory compliance issues affecting it and the CAM fund complex. The Board reviewed information received from the Manager regarding the implementation to date of the Fund’s compliance policies and procedures established pursuant to Rule 38a-1 under the Investment Company Act of 1940.
The Board reviewed information describing the qualifications, backgrounds and responsibilities of the Fund’s senior personnel and the portfolio management team primarily responsible for the day-to-day portfolio management of the Fund. The Board also considered the willingness of the Manager to consider and implement organizational changes to improve investment results and the services provided to the CAM fund complex. The Board also considered financial information from the Manager and based on its general knowledge of the Manager, affiliates, the financial resources available to CAM and its parent organization, Citigroup Inc.
The Board also considered information presented regarding the Manager’s brokerage policies and practices, the standards applied in seeking best execution, the use of a broker affiliated with the Manager and the existence of quality controls applicable to brokerage allocation procedures. In addition, the Manager also reported to the Board on, among other things, its business plans, recent organizational changes and portfolio manager compensation plan.
The Board concluded that, overall, it was satisfied with the nature, extent and quality of services provided (and expected to be provided) under the Management Agreement.
Fund Performance
The Board received and considered performance information for the Fund as well as for a group of funds (the “Performance Universe”) selected by Lipper, Inc. (“Lipper”), an independent provider of investment company data. The Board was provided with a description of the methodology Lipper used to select the funds included in the Performance Universe. The Board also noted that it had received information prepared by the Manager throughout the year at periodic intervals comparing the Fund’s performance against its benchmark(s) and Lipper peers.
The information comparing the Fund’s performance to that of its Performance Universe, consisting of all closed-end funds classified as “global income funds” by Lipper, showed that the Fund’s performance since inception presented was below the median. Based on their review, which included consideration of all of the factors noted above, and recognizing the limited number of funds in the Performance Universe and given the Fund had been in existence for less than one year, the Board concluded that the investment performance of the Fund has been satisfactory.
Salomon Brothers Variable Rate Strategic Fund Inc. 2005 Annual Report 43
Board Approval of Management Agreement (unaudited) (continued)
Management Fees and Expense Ratios
The Board considered the contractual management fee (the “Contractual Management Fee”) payable by the Fund to the Manager in light of the nature, extent and quality of the management services provided by the Manager. Additionally, the Board received and considered information prepared by Lipper comparing the Fund’s Contractual Management Fees and the Fund’s overall expenses with those of funds in a relevant expense group and a broader group of funds, each selected and provided by Lipper. The Board also reviewed information regarding fees charged by the Manager to other U.S. clients investing primarily in an asset class similar to that of the Fund including, where applicable, separate accounts. The Manager reviewed with the Board the significant differences in scope of services provided to the Fund and the scope of the services provided to these other clients, noting that, unlike such other clients, the Fund is provided with administrative services, office facilities, Fund officers (including the Fund’s chief executive, chief financial and chief compliance officers), and that the Manager coordinates and oversees the provision of services to the Fund by other Fund providers. The Board considered the fee comparisons in light of the broader range of services provided to the Fund and did not place a significant weight on this factor. The Board received an analysis of complex-wide management fees provided by the Manager, which, among other things, set out a proposed framework of fees based on asset classes.
The information comparing the Fund’s Contractual Management Fees as well as its actual total expense ratio to its Expense Group, consisting of 5 closed-end funds (including the Fund) classified as “global income funds” by Lipper, showed that the Fund’s Contractual Management Fees were equal to the median range of management fees paid by the other funds in the Expense Group. The Board noted that the Fund’s actual total expense ratio was equal to the median, and concluded that the expense ratio of the Fund was acceptable in the light of the quality of the services the Fund received and such other factors as the Board considered relevant.
Taking all of the above into consideration, the Board determined that the Fund’s Management Fee was reasonable in light of the nature, extent and quality of the services provided to the Fund under the Management Agreement.
The material factors and conclusions that formed the basis for the Board’s determination to approve the continuance of the Management Agreement (including the determinations that the Manager should continue to serve as the investment adviser to the Fund and that the fees payable to the Manager pursuant to the Management Agreement are appropriate) included the following:
Manager Profitability
The Board considered information regarding the profitability to Manager and its affiliates of their relationships with the Fund. The Board also received profitability information with respect to the CAM fund complex as a whole. In addition, the Board received
44 Salomon Brothers Variable Rate Strategic Fund Inc. 2005 Annual Report
Board Approval of Management Agreement (unaudited) (continued)
information with respect to the Manager’s allocation methodologies used in preparing this profitability data as well as a report from an outside consultant that had reviewed the Manager’s methodology. Based upon their review of the information made available, the Board concluded that the Manager’s profitability was not excessive in light of the nature, extent and quality of the services provided to the Fund.
Economies of Scale
The Board received and considered information regarding whether there have been economies of scale with respect to the management of the Fund, whether the Fund has appropriately benefited from any economies of scale, and whether, given the Fund’s closed-end structure, there is a realistic potential for realization of any further economies of scale. The Board considered whether economies of scale in the provision of services to the Fund were being passed along to the shareholders. The Board also considered whether alternative fee structures (such as breakpoints at lower asset levels) would be more appropriate or reasonable taking into consideration economies of scale or other efficiencies.
The Board also noted that as the Fund’s assets have increased over time, it has realized other economies of scale, as certain expenses, such as fees for Board members, auditors and legal fees, become a smaller percentage of overall assets.
Generally, in light of the Manager’s profitability data, and such other factors as the Board considered relevant, the Board concluded that the Manager’s sharing of current economies of scale with the Fund was reasonable.
Other Benefits to the Manager
The Board considered other benefits received by the Manager and its affiliates as a result of their relationship with the Fund, including soft dollar arrangements and the opportunity to offer additional products and services to Fund shareholders.
In light of the costs of providing investment management and other services to the Fund and the Manager’s ongoing commitment to the Fund, other ancillary benefits that the Manager and its affiliates received were not considered unreasonable to the Board.
Other Benefits to the Manager
The Board considered other benefits received by the Manager and its affiliates as a result of their relationship with the Fund, including soft dollar arrangements and the opportunity to offer additional products and services to Fund shareholders. In light of the costs of providing investment management and other services to the Fund and the Manager’s ongoing commitment to the Fund, other ancillary benefits that the Manager and its affiliates received were not considered unreasonable to the Board.
Salomon Brothers Variable Rate Strategic Fund Inc. 2005 Annual Report 45
Additional Information (unaudited)
Information about Directors and Officers
The business and affairs of Salomon Brothers Variable Rate Strategic Fund Inc. (“Fund”) are managed under the direction of the Board of Directors. Information pertaining to the Directors and Officers of the Fund is set forth below:
| | | | | | | | | | |
| | | | | |
| Name, Address and Birth Year | | Position(s)
Held with
Fund(1) | | Term of
Office and
Length
of Time
Served(1) | | Principal
Occupation(s)
During Past
Five Years | | Number of
Portfolios
in Fund
Complex
Overseen by
Director
(including
the Fund) | | Other Board
Memberships
Held by
Director |
| Non-Interested Directors: | | | | | | | | | | |
Carol L. Colman Colman Consulting Co. 278 Hawley Road North Salem, NY 10560 Birth Year: 1946 | | Director and Member of the Audit and Nominating Committees, Class III | | Since 2004 | | President, Colman Consulting Co. | | 37 | | None |
| | | | | |
Daniel P. Cronin 24 Woodlawn Avenue New Rochelle, NY 10804 Birth Year: 1946 | | Director and Member of the Audit and Nominating Committees, Class III | | Since 2004 | | Formerly, Associate General Counsel, Pfizer Inc. | | 34 | | None |
| | | | | |
Leslie H. Gelb 150 East 69th Street New York, NY 10021 Birth Year: 1937 | | Director and Member of the Audit and Nominating Committees, Class II | | Since 2004 | | President Emeritus and Senior Board Fellow, The Council on Foreign Relations; Formerly, Columnist, Deputy Editorial Page Editor and Editor, Op-Ed Page, The New York Times | | 34 | | Director of two registered investment companies advised by Advantage Advisers, Inc. (“Advantage”) |
| | | | | |
William R. Hutchinson 535 N. Michigan Avenue Suite 1012 Chicago, IL 60611 Birth Year: 1942 | | Director and Member of the Audit and Nominating Committees, Class II | | Since 2004 | | President, W R. Hutchinson & Associates Inc.; Formerly Group Vice President, Mergers and Acquisitions, BP Amoco p.l.c. | | 44 | | Director, Associated Banc-Corp. |
| | | | | |
Riordan Roett The Johns Hopkins University 1740 Massachusetts Ave, NW Washington, DC 20036 Birth Year: 1938 | | Director and Member of the Audit and Nominating Committees, Class I | | Since 2004 | | Professor and Director, Latin American Studies Program, Paul H. Nitze School of Advanced International Studies, The Johns Hopkins University | | 34 | | None |
46 Salomon Brothers Variable Rate Strategic Fund Inc. 2005 Annual Report
Additional Information (unaudited) (continued)
| | | | | | | | | | |
| | | | | |
| Name, Address and Birth Year | | Position(s)
Held with
Fund(1) | | Term of
Office and
Length
of Time
Served(1) | | Principal
Occupation(s)
During Past
Five Years | | Number of
Portfolios
in Fund
Complex
Overseen by
Director
(including
the Fund) | | Other Board
Memberships
Held by
Director |
| Non-Interested Directors: | | | | | | | | |
Jeswald W. Salacuse Tufts University The Fletcher School of Law & Diplomacy Packard Avenue Medford, MA 02155 Birth Year: 1938 | | Director and Member of the Audit and Nominating Committees, Class I | | Since 2004 | | Henry J. Braker Professor of Commercial Law and formerly Dean, The Flecher School of Law & Diplomacy, Tufts University | | 34 | | Director of two registered investment companies advised by Advantage |
| | | | |
| Interested Director: | | | | | | | | |
R. Jay Gerken(2) Citigroup Asset Management (“CAM”) 399 Park Avenue Mezzanine New York, NY 10022 Birth Year: 1951 | | Director and Chairman, Class II | | Since 2004 | | Managing Director of Citigroup Global Markets Inc. (“CGM”); Chairman, President, Chief Executive Officer and Director of Smith Barney Fund Management LLC (“SBFM”), and Citi Fund Management Inc. (“CFM”); President and Chief Executive Officer of certain mutual funds associated with Citigroup Inc. (“Citigroup”); Formerly Portfolio Manager of Smith Barney Allocation Series Inc. (from 1996 to 2001) and Smith Barney Growth and Income Fund (from 1996 to 2000); Chairman, President and Chief Executive Officer of Travelers Investment Adviser, Inc. (“TIA”) (from 2002 to 2005) | | 171 | | None |
| Officers: | | | | | | | | | | |
Peter J. Wilby, CFA CAM 399 Park Avenue 4th Floor New York, NY 10022 Birth Year: 1958 | | President Executive Vice President | | Since 2004 1993-2004 | | Managing Director of CGM and Salomon Brothers Asset Management Inc. (“SBAM”) | | N/A | | N/A |
Salomon Brothers Variable Rate Strategic Fund Inc. 2005 Annual Report 47
Additional Information (unaudited) (continued)
| | | | | | | | | | |
| | | | | |
| Name, Address and Birth Year | | Position(s)
Held with
Fund(1) | | Term of
Office and
Length
of Time
Served(1) | | Principal
Occupation(s)
During Past
Five Years | | Number of
Portfolios
in Fund
Complex
Overseen by
Director
(including
the Fund) | | Other Board
Memberships
Held by
Director |
| Officers: | | | | | | | | |
Andrew B. Shoup CAM 125 Broad Street 11th Floor New York, NY 10004 Birth Year: 1956 | | Senior Vice President and Chief Administrative Officer | | Since 2004 | | Director of CAM; Senior Vice President and Chief Administrative Officer of mutual funds associated with Citigroup; Treasurer of certain mutual funds associated with Citigroup; Head of International Funds Administration of CAM (from 2001 to 2003); Director of Global Funds Administration of CAM (from 2000 to 2001); Head of U.S. Citibank Funds Administration of CAM (from 1998 to 2000) | | N/A | | N/A |
| | | | | |
Frances M. Guggino CAM 125 Broad Street, 10th Floor New York, NY 10004 Birth Year: 1957 | | Chief Financial Officer and Treasurer | | Since 2004 | | Director of CGM; Chief Financial Officer and Treasurer of certain mutual funds associated with Citigroup; Controller of certain mutual funds associated with Citigroup | | N/A | | N/A |
| | | | | |
James E. Craige, CFA CAM 399 Park Avenue,
4th Floor New York, NY 10022 Birth Year: 1967 | | Executive
Vice
President | | Since 2004 | | Managing Director of CGM and SBAM (since December of 1998); Director of CGM and SBAM (since January 1998) and Vice President of CGM and SBAM (since January 1996) | | N/A | | N/A |
| | | | | |
Roger M. Lavan, CFA CAM 399 Park Avenue 4th Floor New York, NY 10022 Birth Year: 1963 | | Executive Vice President | | Since 2004 | | Managing Director of CGM and SBAM | | N/A | | N/A |
| | | | | |
Beth A. Semmel, CFA
CAM
399 Park Avenue,
4th Floor New York, NY 10022 Birth Year: 1960 | | Executive Vice President | | Since
2004 | | Managing Director of CGM and SBAM (since December 1998); Director of CGM and SBAM (since January 1996) | | N/A | | N/A |
48 Salomon Brothers Variable Rate Strategic Fund Inc. 2005 Annual Report
Additional Information (unaudited) (continued)
| | | | | | | | | | |
| | | | | |
| Name, Address and Birth Year | | Position(s)
Held with
Fund(1) | | Term of
Office and
Length
of Time
Served(1) | | Principal
Occupation(s)
During Past
Five Years | | Number of
Portfolios
in Fund
Complex
Overseen by
Director
(including
the Fund) | | Other Board
Memberships
Held by
Director |
| Officers: | | | | | | | | |
David Torchia CAM 399 Park Avenue 4th Floor New York, NY 10022 Birth Year: 1959 | | Executive Vice President | | Since 2004 | | Managing Director of CGM and SBAM | | N/A | | N/A |
| | | | | |
Andrew Beagley CAM 399 Park Avenue, 4th Floor New York, NY 10022 Birth Year: 1962 | | Chief Compliance Officer | | Since 2004 | | Compliance Officer, Chief Compliance Officer and Vice President of certain mutual funds associated with Citigroup; Director of Compliance, Europe, the Middle East and Africa, Citigroup Asset Management (from 1999 to 2000); Chief Compliance Officer, SBFM and CFM; Formerly Chief Compliance Officer of TIA (from 2002 to 2005) | | N/A | | N/A |
| | | | | |
Wendy S. Setnicka CAM 125 Broad Street 10th Floor New York, NY 10004 Birth Year: 1964 | | Controller | | Since 2004 | | Vice President of CAM (since 2002); Controller of certain mutual funds associated with Citigroup; Assistant Controller of CAM (from 2002 to 2004); Accounting Manager of CAM (from 1998 to 2002) | | N/A | | N/A |
| | | | | |
Robert I. Frenkel CAM 300 First Stamford Place 4th Floor Stamford, CT 06902 Birth Year: 1954 | | Secretary and Chief Legal Officer | | Since 2004 | | Managing Director and General Counsel of Global Mutual Funds for CAM and its predecessor (since 1994); Secretary of CFM (from 2001 to 2004); Secretary and Chief Legal Officer of mutual funds associated with Citigroup | | N/A | | N/A |
| (1) | | Beginning with the first annual meeting of shareholders of the Fund (the “first annual meeting”) and if at such time, the number of directors shall be three (3) or more, the Board of Directors of the Fund shall be divided into three classes: Class I, Class II and Class III. At the first annual meeting, directors of Class I shall be elected to the Board of Directors for a term expiring at the next succeeding annual meeting of shareholders, directors of Class II shall be elected to the Board of Directors for a term expiring at the second succeeding annual meeting of shareholders and directors of Class III shall be elected to the Board of Directors for a term expiring at the third succeeding annual meeting of shareholders. At each subsequent annual meeting of shareholders, the directors chosen to succeed those whose terms are expiring shall be identified as being of the same class as the directors whom they succeed and shall be elected for a term expiring at the time of the third succeeding annual meeting of shareholders subsequent to their election, or thereafter in each case when their respective successors are elected and qualified. The Fund’s executive officers are chosen each year to hold office until the next year and until their successors are duly elected and qualified. |
| (2) | | Mr. Gerken is a Director who is an “interested person” of the Fund as defined in the Investment Company Act of 1940, as amended because Mr. Gerken is an officer of SBFM and certain of its affiliates. |
Salomon Brothers Variable Rate Strategic Fund Inc. 2005 Annual Report 49
Annual Chief Executive Officer and Chief Financial Officer Certification (unaudited)
The Fund’s CEO has submitted to the NYSE the required annual certification and the Fund also has included the Certifications of the Fund’s CEO and CFO required by Section 302 of the Sarbanes-Oxley Act in the Fund’s Form N-CSR filed with the SEC for the period of this report.
50 Salomon Brothers Variable Rate Strategic Fund Inc. 2005 Annual Report
Dividend Reinvestment Plan (unaudited)
Unless you elect to receive distributions in cash (i.e., opt-out), all distributions, on your Common Shares will be automatically reinvested by PFPC, as agent for the Common Shareholders (the “Plan Agent”), in additional Common Shares under the Dividend Reinvestment Plan (the “Plan”). You may elect not to participate in the Plan by contacting the Plan Agent. If you do not participate, you will receive all cash distributions paid by check mailed directly to you by PFPC, as dividend paying agent.
If you participate in the Plan, the number of Common Shares you will receive will be determined as follows:
(1) If the market price of the Common Shares on the record date (or, if the record date is not a New York Stock Exchange trading day, the immediately preceding trading day) for determining shareholders eligible to receive the relevant dividend or distribution (the “determination date”) is equal to or exceeds 98% of the net asset value per share of the Common Shares, the Fund will issue new Common Shares at a price equal to the greater of (a) 98% of the net asset value per share at the close of trading on the Exchange on the determination date or (b) 95% of the market price per share of the Common Shares on the determination date.
(2) If 98% of the net asset value per share of the Common Shares exceeds the market price of the Common Shares on the determination date, the Plan Agent will receive the distribution in cash and will buy Common Shares in the open market, on the Exchange or elsewhere, for your account as soon as practicable commencing on the trading day following the determination date and terminating no later than the earlier of (a) 30 days after the distribution payment date, or (b) the record date for the next succeeding distribution to be made to the Common Shareholders; except when necessary to comply with applicable provisions of the federal securities laws. If during this period: (i) the market price rises so that it equals or exceeds 98% of the net asset value per share of the Common Shares at the close of trading on the Exchange on the determination date before the Plan Agent has completed the open market purchases or (ii) if the Plan Agent is unable to invest the full amount eligible to be reinvested in open market purchases, the Plan Agent will cease purchasing Common Shares in the open market and the Fund shall issue the remaining Common Shares at a price per share equal to the greater of (a) 98% of the net asset value per share at the close of trading on the Exchange on the determination date or (b) 95% of the then current market price per share.
The Plan Agent maintains all participants’ accounts in the Plan and gives written confirmation of all transactions in the accounts, including information you may need for tax records. Common Shares in your account will be held by the Plan Agent in non-certificated form. Any proxy you receive will include all Common Shares you have received under the Plan.
You may withdraw from the Plan by notifying the Plan Agent in writing at P.O. Box 43027, Providence, Rhode Island 02940-3027 or by calling the Plan Agent at 1-800-331-1710. Such withdrawal will be effective immediately if notice is received by the Plan Agent not less than ten business days prior to any distribution record date; otherwise such withdrawal will be effective as soon as practicable after the Plan Agent’s investment of
Salomon Brothers Variable Rate Strategic Fund Inc. 2005 Annual Report 51
Dividend Reinvestment Plan (unaudited) (continued)
the most recently declared distribution on the Common Shares. The Plan may be terminated by the Fund upon notice in writing mailed to Common Shareholders at least 30 days prior to the record date for the payment of any distribution by the Fund for which the termination is to be effective. Upon any termination, you will be sent a certificate or certificates for the full Common Shares held for you under the Plan and cash for any fractional Common Shares. You may elect to notify the Plan Agent in advance of such termination to have the Plan Agent sell part or all of your shares on your behalf. You will be charged a service charge and the Plan Agent is authorized to deduct brokerage charges actually incurred for this transaction from the proceeds.
There is no service charge for reinvestment of your distributions in Common Shares. However, all participants will pay a pro rata share of brokerage commissions incurred by the Plan Agent when it makes open market purchases. Because all distributions will be automatically reinvested in additional Common Shares, this allows you to add to your investment through dollar cost averaging, which may lower the average cost of your Common Shares over time. Dollar cost averaging is a technique for lowering the average cost per share over time if the Fund’s net asset value declines. While dollar cost averaging has definite advantages, it cannot assure profit or protect against loss in declining markets. Investors will be subject to income tax on amounts reinvested under the plan.
Automatically reinvesting distributions does not mean that you do not have to pay income taxes due upon receiving distributions.
The Fund reserves the right to amend or terminate the Plan if, in the judgment of the Board of Directors, the change is warranted. There is no direct service charge to participants in the Plan; however, the Fund reserves the right to amend the Plan to include a service charge payable by the participants. Additional information about the Plan and your account may be obtained from the Plan Agent at 1-800-331-1710.
52 Salomon Brothers Variable Rate Strategic Fund Inc. 2005 Annual Report
Salomon Brothers Variable Rate Strategic Fund Inc.
| | |
DIRECTORS Carol L. Colman Daniel P. Cronin Leslie H. Gelb R. Jay Gerken, CFA William R. Hutchinson Riordan Roett Jeswald W. Salacuse OFFICERS R. Jay Gerken, CFA Chairman and Chief
Executive Officer Peter J. Wilby, CFA President Andrew B. Shoup Senior Vice President and
Chief Administrative Officer Frances M. GugginO Chief Financial Officer and Treasurer James E. Craige, CFA Executive Vice President Roger M. Lavan, CFA Executive Vice President Beth A. Semmel, CFA Executive Vice President David Torchia Executive Vice President David Scott Executive Vice President Andrew Beagley Chief Compliance Officer Wendy S. Setnicka Controller | | OFFICERS (continued) Robert I. Frenkel Secretary and
Chief Legal Officer SALOMON BROTHERS VARIABLE RATE STRATEGIC FUND INC. 125 Broad Street 10th Floor, MF-2 New York, New York 10004 Telephone 1-888-777-0102 INVESTMENT MANAGER
AND ADMINISTRATOR Salomon Brothers Asset Management Inc 399 Park Avenue New York, New York 10022 CUSTODIAN State Street Bank and Trust Company 225 Franklin Street Boston, Massachusetts 02110 DIVIDEND DISBURSING
AND TRANSFER AGENT PFPC Inc. P.O. Box 43027 Providence,
Rhode Island 02940-3027 INDEPENDENT REGISTERED PUBLIC ACCOUNTING FIRM KPMG LLP 345 Park Avenue New York, New York 10154 LEGAL COUNSEL Simpson Thacher & Bartlett LLP 425 Lexington Avenue New York, New York 10017-3909 NEW YORK STOCK EXCHANGE SYMBOL GFY |
This report is transmitted to the shareholders of the Fund for their information. This is not a prospectus, circular or representation intended for use in the purchase of shares of the Fund or any securities mentioned in this report.
| | |
PFPC Inc. P.O. Box 43027 Providence, RI 02940-3027 |
| |
| GFYANN 11/05 | | 05-9343 |
Salomon Brothers Variable Rate Strategic Fund Inc.
Notice is hereby given in accordance with Section 23(c) of the Investment Company Act of 1940 that the Fund may purchase at market prices from time to time shares of its common stock in the open market.
The Fund files its complete schedule of portfolio holdings with the Securities and Exchange Commission for the first and third quarters of each fiscal year on Form N-Q. The Fund’s Forms N-Q are available on the Commission’s website at www.sec.gov. The Funds’ Forms N-Q may be reviewed and copied at the Commission’s Public Reference Room in Washington D.C., and information on the operation of the Public Reference Room may be obtained by calling 1-800-SEC-0330. To obtain information on Form N-Q from the Fund, shareholders can call 1-800-446-1013.
Information on how the Fund voted proxies relating to portfolio securities during the most recent 12-month period ended June 30 and a description of the policies and procedures that the Fund uses to determine how to vote proxies relating to portfolio securities is available (1) without charge, upon request, by calling 1-800-446-1013, (2) on the Fund’s website at www.citigroupam.com and (3) on the SEC’s website at www.sec.gov.
The registrant has adopted a code of ethics that applies to the registrant’s principal executive officer, principal financial officer, principal accounting officer or controller.
| ITEM 3. | AUDIT COMMITTEE FINANCIAL EXPERT. |
The Board of Directors of the registrant has determined that William R. Hutchinson, the Chairman of the Board’s Audit Committee, possesses the technical attributes identified in Instruction 2(b) of Item 3 to Form N-CSR to qualify as an “audit committee financial expert,” and has designated Mr. Hutchinson as the Audit Committee’s financial expert. Mr. Hutchinson is an “independent” Director pursuant to paragraph (a)(2) of Item 3 to Form N-CSR.
| ITEM 4. | PRINCIPAL ACCOUNTANT FEES AND SERVICES. |
a) Audit Fees. Effective June 17, 2005 PricewaterhouseCoopers LLP (“PwC”) resigned as the Registrant’s principal accountant (the “Auditor”). The Registrant’s audit committee approved the engagement of KPMG LLP (“KPMG”) as the Registrant’s new principal accountant for the fiscal year ended September 30, 2005. The aggregate fees billed in the last two fiscal years ending September 30, 2004 and September 30, 2005 (the “Reporting Periods”) for professional services rendered by PwC for the audit of the Registrant’s annual financial statements, or services that are normally provided by the Auditor in connection with the statutory and regulatory filings or engagements for the Reporting Periods, were $0 in 2004 and $0 in 2005. KPMG has not billed the Registrant for professional services rendered as of September 30, 2005.
b) Audit-Related Fees. The aggregate fees billed in the Reporting Periods for assurance and related services by PwC or KPMG that are reasonably related to the performance of the audit of the Registrant’s financial statements and are not reported under paragraph (a) of this Item 4 were $0 in 2004 and $0 in 2005.
In addition, there were no Audit-Related Fees billed in the Reporting Period for assurance and related services by the Auditor to the Registrant’s investment adviser (not including any sub-adviser whose role is primarily portfolio management and is subcontracted with or overseen by another investment adviser), and any entity controlling, controlled by or under common control with the investment adviser that provides ongoing services to the Salomon Brothers Variable Rate Strategic Fund (“service affiliates”), that were reasonably related to the performance of the annual audit of the service affiliates. Accordingly, there were no such fees that required pre-approval by the Audit Committee for the Reporting Periods (prior to May 6, 2003 services provided by the Auditor were not required to be pre-approved).
(c) Tax Fees. The aggregate fees billed in the Reporting Periods for professional services rendered by PwC for tax compliance, tax advice and tax planning (“Tax Services”) were $0 in 2004 and $0 in 2005. These services consisted of (i) review or preparation of U.S.
federal, state, local and excise tax returns; (ii) U.S. federal, state and local tax planning, advice and assistance regarding statutory, regulatory or administrative developments, and (iii) tax advice regarding tax qualification matters and/or treatment of various financial instruments held or proposed to be acquired or held. As of September 30, 2005, KPMG has not billed the Registrant for any Tax Services rendered.
There were no fees billed for tax services by PwC or KPMG to service affiliates during the Reporting Periods that required pre-approval by the Audit Committee.
d) All Other Fees. The aggregate fees billed for all other non-audit services rendered by PwC to Salomon Brothers Asset Management (“SBAM”), and any entity controlling, controlled by or under common control with SBAM that provided ongoing services to Salomon Brothers Variable Rate Strategic Fund, requiring pre-approval by the Audit Committee for the period May 6, 2003 through September 30, 2004 and for the year ended September 30, 2005, which include the issuance of reports on internal control under SAS No. 70 related to various Citigroup Asset Management (“CAM”) entities a profitability review of the Adviser and phase 1 pf an analysis of Citigroup’s current and future real estate occupancy requirements in the tri-state area and security risk issues in the New York metro region were $0.0 and $1.3 million, respectively, all of which were pre-approved by the Audit Committee.
There were no non-audit services rendered by KPMG to SBAM, or any entity controlling, controlled by or under common control with SBAM that provided ongoing services to the Registrant.
All Other Fees. There were no other non-audit services rendered by PwC or KPMG to Smith Barney Fund Management LLC (“SBFM”), and any entity controlling, controlled by or under common control with SBFM that provided ongoing services to Salomon Brothers Variable Rate Strategic Fund requiring pre-approval by the Audit Committee in the Reporting Period.
(e) Audit Committee’s pre–approval policies and procedures described in paragraph (c) (7) of Rule 2-01 of Regulation S-X.
(1) The Charter for the Audit Committee (the “Committee”) of the Board of each registered investment company (the “Fund”) advised by Smith Barney Fund Management LLC or Salomon Brothers Asset Management Inc. or one of their affiliates (each, an “Adviser”) requires that the Committee shall approve (a) all audit and permissible non-audit services to be provided to the Fund and (b) all permissible non-audit services to be provided by the Fund’s independent auditors to the Adviser and any Covered Service Providers if the engagement relates directly to the operations and financial reporting of the Fund. The Committee may implement policies and procedures by which such services are approved other than by the full Committee.
The Committee shall not approve non-audit services that the Committee believes may impair the independence of the auditors. As of the date of the approval of this Audit Committee Charter,
permissible non-audit services include any professional services (including tax services), that are not prohibited services as described below, provided to the Fund by the independent auditors, other than those provided to the Fund in connection with an audit or a review of the financial statements of the Fund. Permissible non-audit services may not include: (i) bookkeeping or other services related to the accounting records or financial statements of the Fund; (ii) financial information systems design and implementation; (iii) appraisal or valuation services, fairness opinions or contribution-in-kind reports; (iv) actuarial services; (v) internal audit outsourcing services; (vi) management functions or human resources; (vii) broker or dealer, investment adviser or investment banking services; (viii) legal services and expert services unrelated to the audit; and (ix) any other service the Public Company Accounting Oversight Board determines, by regulation, is impermissible.
Pre-approval by the Committee of any permissible non-audit services is not required so long as: (i) the aggregate amount of all such permissible non-audit services provided to the Fund, the Adviser and any service providers controlling, controlled by or under common control with the Adviser that provide ongoing services to the Fund (“Covered Service Providers”) constitutes not more than 5% of the total amount of revenues paid to the independent auditors during the fiscal year in which the permissible non-audit services are provided to (a) the Fund, (b) the Adviser and (c) any entity controlling, controlled by or under common control with the Adviser that provides ongoing services to the Fund during the fiscal year in which the services are provided that would have to be approved by the Committee; (ii) the permissible non-audit services were not recognized by the Fund at the time of the engagement to be non-audit services; and (iii) such services are promptly brought to the attention of the Committee and approved by the Committee (or its delegate(s)) prior to the completion of the audit.
(2) For the Salomon Brothers Variable Rate Strategic Fund, the percentage of fees that were approved by the audit committee, with respect to: Audit-Related Fees were 100% and 100% for 2004 and 2005; Tax Fees were 100% and 100% for 2004 and 2005; and Other Fees were 100% and 100% for 2004 and 2005.
(f) N/A
(g) Non-audit fees billed by PwC for services rendered to Salomon Brothers Variable Rate Strategic Fund and CAM and any entity controlling, controlled by, or under common control with CAM that provides ongoing services to Salomon Brothers Variable Rate Strategic Fund during the reporting period were $6.4 million and $2.7 million for the years ended September 30, 2004 and September 30, 2005, respectively.
Non-audit fees billed by KPMG for services rendered to Salomon Brothers Variable Rate Strategic Fund and CAM and any entity controlling, controlled by, or under common control with CAM that provides ongoing services to Salomon Brothers Variable Rate Strategic Fund during the reporting period was $75,000 and $0 for the years ended September 30, 2004 and September 30, 2005,
respectively. Such fees relate to services provided in connection with the transfer agent matter as fully described in the notes to the financial statements.
(h) Yes. The Salomon Brothers Variable Rate Strategic Fund’s Audit Committee has considered whether the provision of non-audit services that were rendered to Service Affiliates which were not pre-approved (not requiring pre-approval) is compatible with maintaining the Accountant’s independence. All services provided by the Auditor to the Salomon Brothers Variable Rate Strategic Fund or to Service Affiliates, which were required to be pre-approved, were pre-approved as required.
| ITEM 5. | AUDIT COMMITTEE OF LISTED REGISTRANTS. |
a) Registrant has a separately-designated standing Audit Committee established in accordance with Section 3(a)58(A) of the Exchange Act. The Audit Committee consists of the following Board members:
Carol L. Colman
Daniel P. Cronin
Leslie H. Gelb
William R. Hutchinson
Riordan Roett
Jeswald W. Salacuse
b) Not applicable
| ITEM 6. | SCHEDULE OF INVESTMENTS. |
Not applicable.
| ITEM 7. | DISCLOSURE OF PROXY VOTING POLICIES AND PROCEDURES FOR CLOSED-END MANAGEMENT INVESTMENT COMPANIES. |
The Board of Directors of the Fund has delegated the authority to develop policies and procedures relating to proxy voting to the Manager. The Manager is part of Citigroup Asset Management (“CAM”), a group of investment adviser affiliates of Citigroup, Inc. (“Citigroup”). Along with the other investment advisers that comprise CAM, the Manager has adopted a set of proxy voting policies and procedures (the “Policies”) to ensure that the Manager votes proxies relating to equity securities in the best interest of clients.
In voting proxies, the Manager is guided by general fiduciary principles and seeks to act prudently and solely in the best interest of clients. The Manager attempts to consider all factors that could affect the value of the investment and will vote proxies in the manner that it believes will be consistent with efforts to maximize shareholder values. The Manager may utilize an external service provider to provide it with information and/or a recommendation with regard to proxy votes. However, such recommendations do not relieve the Manager of its responsibility for the proxy vote.
In the case of a proxy issue for which there is a stated position in the Policies, CAM generally votes in accordance with such stated position. In the case of a proxy issue for which there is a list of factors set forth in the Policies that CAM considers in voting on such issue, CAM votes on a case-by-case basis in accordance with the general principles set forth above and considering such enumerated factors. In the case of a proxy issue for which there is no stated position or list of factors that CAM considers in voting on such issue, CAM votes on a case-by-case basis in accordance with the general principles set forth above. Issues for which there is a stated position set forth in the Policies or for which there is a list of factors set forth in the Policies that CAM considers in voting on such issues fall into a variety of categories, including election of directors, ratification of auditors, proxy and tender offer defenses, capital structure issues, executive and director compensation, mergers and corporate restructurings, and social and environmental issues. The stated position on an issue set forth in the Policies can always be superseded, subject to the duty to act solely in the best interest of the beneficial owners of accounts, by the investment management professionals responsible for the account whose shares are being voted. Issues applicable to a particular industry may cause CAM to abandon a policy that would have otherwise applied to issuers generally. As a result of the independent investment advisory services provided by distinct CAM business units, there may be occasions when different business units or different portfolio managers within the same business unit vote differently on the same issue.
In furtherance of the Manager’s goal to vote proxies in the best interest of clients, the Manager follows procedures designed to identify and address material conflicts that may arise between the Manager’s interests and those of its clients before voting proxies on behalf of such clients. To seek to identify conflicts of interest, CAM periodically notifies CAM employees (including employees of the Manager) in writing that they are under an obligation (i) to be aware of the potential for conflicts of interest with respect to voting proxies on behalf of client accounts both as a result of their personal relationships and due to special circumstances that may arise during the conduct of CAM’s and the Manager’s business, and (ii) to bring conflicts of interest of which they become aware to the attention of compliance personnel. The Manager also maintains and considers a list of significant relationships that could present a conflict of interest for the Manager in voting proxies. The Manager is also sensitive to the fact that a significant, publicized relationship between an issuer and a non-CAM affiliate might appear to the public to influence the manner in which the Manager decides to vote a proxy with respect to such issuer. Absent special circumstances or a significant, publicized non-CAM affiliate relationship that CAM or the Manager for prudential reasons treats as a potential conflict of interest because such relationship might appear to the public to influence the manner in which the Manager decides to vote a proxy, the Manager generally takes the position that non-CAM relationships between Citigroup and an issuer (e.g. investment banking or banking) do not present a conflict of interest for the Manager in voting proxies with respect to such issuer. Such position is based on the fact that the Manager is operated as an independent business unit from
other Citigroup business units as well as on the existence of information barriers between the Manager and certain other Citigroup business units.
CAM maintains a Proxy Voting Committee, of which the Manager personnel are members, to review and address conflicts of interest brought to its attention by compliance personnel. A proxy issue that will be voted in accordance with a stated position on an issue or in accordance with the recommendation of an independent third party is not brought to the attention of the Proxy Voting Committee for a conflict of interest review because the Manager’s position is that to the extent a conflict of interest issue exists, it is resolved by voting in accordance with a pre-determined policy or in accordance with the recommendation of an independent third party. With respect to a conflict of interest brought to its attention, the Proxy Voting Committee first determines whether such conflict of interest is material. A conflict of interest is considered material to the extent that it is determined that such conflict is likely to influence, or appear to influence, the Manager’s decision-making in voting proxies. If it is determined by the Proxy Voting Committee that a conflict of interest is not material, the Manager may vote proxies notwithstanding the existence of the conflict.
If it is determined by the Proxy Voting Committee that a conflict of interest is material, the Proxy Voting Committee is responsible for determining an appropriate method to resolve such conflict of interest before the proxy affected by the conflict of interest is voted. Such determination is based on the particular facts and circumstances, including the importance of the proxy issue and the nature of the conflict of interest. Methods of resolving a material conflict of interest may include, but are not limited to, disclosing the conflict to clients and obtaining their consent before voting, or suggesting to clients that they engage another party to vote the proxy on their behalf.
| ITEM 9. | PURCHASES OF EQUITY SECURITIES BY CLOSED-END MANAGEMENT INVESTMENT COMPANY AND AFFILIATED PURCHASERS. |
None.
| ITEM 10. | SUBMISSION OF MATTERS TO A VOTE OF SECURITY HOLDERS. |
Not applicable.
| ITEM 11. | CONTROLS AND PROCEDURES. |
| | (a) | The registrant’s principal executive officer and principal financial officer have concluded that the registrant’s disclosure controls and procedures (as defined in Rule 30a- 3(c) under the Investment Company Act of 1940, as amended (the “1940 Act”)) are effective as of a date within 90 days of the filing date of this report that includes the disclosure required by this paragraph, based on their evaluation of the disclosure controls and procedures required by Rule 30a-3(b) |
| | under the 1940 Act and 15d-15(b) under the Securities Exchange Act of 1934. |
| | (b) | There were no changes in the registrant’s internal control over financial reporting (as defined in Rule 30a-3(d) under the 1940 Act) that occurred during the registrant’s last fiscal half-year (the registrant’s second fiscal half-year in the case of an annual report) that have materially affected, or are likely to materially affect the registrant’s internal control over financial reporting. |
| | (a) | Code of Ethics attached hereto. |
Exhibit 99.CODE ETH
| | |
| Exhibit 99.CERT | | Certifications pursuant to section 302 of the Sarbanes-Oxley Act of 2002 |
| |
| Exhibit 99.906CERT | | Certifications pursuant to Section 906 of the Sarbanes-Oxley Act of 2002 |
SIGNATURES
Pursuant to the requirements of the Securities Exchange Act of 1934 and the Investment Company Act of 1940, the registrant has duly caused this Report to be signed on its behalf by the undersigned, there unto duly authorized.
Salomon Brothers Variable Rate Strategic Fund Inc.
| | |
| |
| By: | | /s/ R. JAY GERKEN |
| | | R. Jay Gerken
Chief Executive Officer of |
| | | Salomon Brothers Variable Rate Strategic Fund Inc. |
Date: December 8, 2005 |
Pursuant to the requirements of the Securities Exchange Act of 1934 and the Investment Company Act of 1940, this report has been signed below by the following persons on behalf of the registrant and in the capacities and on the dates indicated.
| | |
| |
| By: | | /s/ R. JAY GERKEN |
| | | (R. Jay Gerken)
Chief Executive Officer of |
| | | Salomon Brothers Variable Rate Strategic Fund Inc. |
Date: | | December 8, 2005 |
| |
| By: | | /s/ FRANCES M. GUGGINO |
| | | Frances M. Guggino
Chief Financial Officer of |
| | | Salomon Brothers Variable Rate Strategic Fund Inc. |
Date: December 8, 2005 |