UNITED STATES
SECURITIES AND EXCHANGE COMMISSION
Washington, D.C. 20549
FORM N-CSR
CERTIFIED SHAREHOLDER REPORT OF REGISTERED
MANAGEMENT INVESTMENT COMPANIES
Investment Company Act file number 811-21609
Western Asset Variable Rate Strategic Fund Inc.
(Exact name of registrant as specified in charter)
620 Eighth Avenue, 49th Floor, New York, NY 10018
(Address of principal executive offices) (Zip code)
Robert I. Frenkel, Esq.
Legg Mason & Co., LLC
100 First Stamford Place
Stamford, CT 06902
(Name and address of agent for service)
Registrant’s telephone number, including area code: (888) 777-0102
Date of fiscal year end: September 30
Date of reporting period: March 31, 2016
ITEM 1. REPORT TO STOCKHOLDERS.
The Semi-Annual Report to Stockholders is filed herewith.

| | |
| Semi-Annual Report | | March 31, 2016 |
WESTERN ASSET
VARIABLE RATE
STRATEGIC FUND INC. (GFY)

|
| INVESTMENT PRODUCTS: NOT FDIC INSURED • NO BANK GUARANTEE • MAY LOSE VALUE |
Fund objective
The Fund’s investment objective is to maintain a high level of current income.
The Fund invests primarily in variable rate instruments of U.S. and non-U.S. issuers, including U.S. and non-U.S. investment grade and high-yield debt, senior loans, emerging market debt and derivatives related to these securities.
Letter from the chairman

Dear Shareholder,
We are pleased to provide the semi-annual report of Western Asset Variable Rate Strategic Fund Inc. for the six-month reporting period ended March 31, 2016. Please read on for Fund performance information and a detailed look at prevailing economic and market conditions during the Fund’s reporting period.
As always, we remain committed to providing you with excellent service and a full spectrum of investment choices. We also remain committed to supplementing the support you receive from your financial advisor. One way we accomplish this is through our website, www.lmcef.com. Here you can gain immediate access to market and investment information, including:
| • | | Fund prices and performance, |
| • | | Market insights and commentaries from our portfolio managers, and |
| • | | A host of educational resources. |
We look forward to helping you meet your financial goals.
Sincerely,

Jane Trust, CFA
Chairman, President and Chief Executive Officer
April 29, 2016
| | |
| II | | Western Asset Variable Rate Strategic Fund Inc. |
Investment commentary
Economic review
The pace of U.S. economic activity was mixed during the six months ended March 31, 2016 (the “reporting period”). Looking back, the U.S. Department of Commerce reported that third quarter 2015 U.S. gross domestic product (“GDP”)i growth was 2.0%. The U.S. Department of Commerce’s then reported that fourth quarter 2015 GDP growth was 1.4%. Slower growth was attributed to downturns in nonresidential fixed investment and state and local government spending, along with a deceleration in personal consumption expenditures (“PCE”) and less export activity. The U.S. Department of Commerce’s initial reading for first quarter 2016 GDP growth — released after the reporting period ended — was 0.5%. This further slowdown was attributed to a number of factors, including a decrease in nonresidential fixed investment, a deceleration in PCE and a downturn in federal government spending.
Job growth in the U.S. was solid overall and was a tailwind for the economy during the reporting period. When the period ended in March 2016, unemployment was 5.0%, close to its lowest level since February 2008.
| | |
| Western Asset Variable Rate Strategic Fund Inc. | | III |
Investment commentary (cont’d)
Market review
Q. How did the Federal Reserve Board (“Fed”)ii respond to the economic environment?
A. After an extended period of maintaining the federal funds rateiii at a historically low range between zero and 0.25%, the Fed increased the rate at its meeting on December 16, 2015. This marked the first rate hike since 2006. In particular, the U.S. central bank raised the federal funds rate to a range between 0.25% and 0.50%. In its official statement after the December 2015 meeting, the Fed said, “The stance of monetary policy remains accommodative after this increase, thereby supporting further improvement in labor market conditions and a return to 2 percent inflation….The Committee expects that economic conditions will evolve in a manner that will warrant only gradual increases in the federal funds rate; the federal funds rate is likely to remain, for some time, below levels that are expected to prevail in the longer run.” At its meetings that concluded on January 27, 2016, March 16, 2016 and April 27, 2016 (after the reporting period ended), the Fed kept rates on hold.
Q. Did Treasury yields trend higher or lower during the six months ended March 31, 2016?
A. Short-term Treasury yields moved higher, whereas long-term Treasury yields declined during the reporting period. When the period began, the yield on the two-year Treasury note was 0.64%. Its low for the period was 0.57% on October 14, 2015, and it peaked at 1.09% on December 29, 2015. The yield on the two-year Treasury note ended the period at 0.73%. The yield on the ten-year Treasury note began the period at 2.06%. Its peak of 2.36% occurred on November 9, 2015, and its low of 1.63% occurred on February 11, 2016. The yield on the ten-year Treasury note ended the period at 1.78%.
Q. What factors impacted the spread sectors (non-Treasuries) during the reporting period?
A. The spread sectors posted mixed results during the reporting period. Performance fluctuated with investor sentiment given the uncertainties regarding future Fed monetary policy, along with concerns over global growth and geopolitical issues. The broad U.S. bond market, as measured by the Barclays U.S. Aggregate Indexiv, returned 2.44% during the six months ended March 31, 2016.
Q. How did the high-yield bond market perform over the six months ended March 31, 2016?
A. The U.S. high-yield bond market, as measured by the Barclays U.S. Corporate High Yield — 2% Issuer Cap Indexv, returned 1.23% for the six months ended March 31, 2016. After a strong start in October 2015, the high-yield market declined during the next three months of the reporting period. This was triggered by a number of factors, including falling oil prices and poor investor demand. After stabilizing in February 2016, the high-yield market rallied sharply in March 2016. This turnaround occurred as oil prices started to rebound and the Fed reduced its expectations for rate hikes in 2016.
Q. How did the emerging markets debt asset class perform over the reporting period?
A. The JPMorgan Emerging Markets Bond Index Global (“EMBI Global”)vi gained 6.85% during the six months ended March 31, 2016. The asset class posted a strong return in October 2015, but then declined over the
| | |
| IV | | Western Asset Variable Rate Strategic Fund Inc. |
next three months of the reporting period due to concerns over economic growth in China, falling commodity prices and expectations for future Fed rate hikes. The asset class then rallied sharply in February and March 2016, as oil prices moved higher, global monetary policy remained accommodative and investor risk appetite improved.
Performance review
For the six months ended March 31, 2016, Western Asset Variable Rate Strategic Fund Inc. returned -1.41% based on its net asset value (“NAV”)vii and 1.56% based on its New York Stock Exchange (“NYSE”) market price per share. The total return based on NAV reflects the impact of the tender and repurchase of its shares by the Fund at the price equal to 98% of the net asset value per share on November 20, 2015. Absent this tender offer, the total return based on NAV would have been -2.29%. The Fund’s unmanaged benchmark, the BofA Merrill Lynch USD LIBOR 3-Month Constant Maturity Indexviii, returned 0.19% over the same time frame. The Lipper Global Income Closed-End Funds Category Averageix returned 2.27% for the same period. Please note that Lipper performance returns are based on each fund’s NAV.
During this six-month period, the Fund made distributions to shareholders totaling $0.47 per share. As of March 31, 2016, the Fund estimates that 64% of the distributions were sourced from net investment income and 36% constituted a return of capital.* The performance table shows the Fund’s six-month total return based on its NAV and market price as of March 31, 2016. Past performance is no guarantee of future results.
| | | | |
Performance Snapshot as of March 31, 2016
(unaudited) | |
| Price Per Share | | 6-Month
Total Return† | |
| $16.84 (NAV) | | | -1.41 | %‡** |
| $15.34 (Market Price) | | | 1.56 | %‡‡ |
All figures represent past performance and are not a guarantee of future results. Performance figures for periods shorter than one year represent cumulative figures and are not annualized.
† Total returns are based on changes in NAV or market price, respectively. Returns reflect the deduction of all Fund expenses, including management fees, operating expenses, and other Fund expenses. Returns do not reflect the deduction of brokerage commissions or taxes that investors may pay on distributions or the sale of shares.
‡ Total return assumes the reinvestment of all distributions, including returns of capital, if any, at NAV.
‡‡ Total return assumes the reinvestment of all distributions, including returns of capital, if any, in additional shares in accordance with the Fund’s Dividend Reinvestment Plan.
| * | These estimates are not for tax purposes. The Fund will issue a Form 1099 with final composition of the distributions for tax purposes after year-end. A return of capital is not taxable and results in a reduction in the tax basis of a shareholder’s investment. For more information about a distribution’s composition, please refer to the Fund’s distribution press release or, if applicable, the Section 19 notice located in the press release section of our website, www.lmcef.com. |
| ** | The total return based on NAV reflects the impact of the tender and repurchase of its shares by the Fund at the price equal to 98% of the net asset value per share on November 20, 2015. Absent this tender offer, the total return based on NAV would have been -2.29%. |
| | |
| Western Asset Variable Rate Strategic Fund Inc. | | V |
Investment commentary (cont’d)
Looking for additional information?
The Fund is traded under the symbol “GFY” and its closing market price is available in most newspapers under the NYSE listings. The daily NAV is available on-line under the symbol “XGFYX” on most financial websites. Barron’s and the Wall Street Journal’s Monday edition both carry closed-end fund tables that provide additional information. In addition, the Fund issues a quarterly press release that can be found on most major financial websites as well as www.lmcef.com.
In a continuing effort to provide information concerning the Fund, shareholders may call 1-888-777-0102 (toll free), Monday through Friday from 8:00 a.m. to 5:30 p.m. Eastern Time, for the Fund’s current NAV, market price and other information.
Thank you for your investment in Western Asset Variable Rate Strategic Fund Inc. As always, we appreciate that you have chosen us to manage your assets and we remain focused on achieving the Fund’s investment goals.
Sincerely,
Jane Trust, CFA
Chairman, President and Chief Executive Officer
April 29, 2016
RISKS: The Fund is a non-diversified, closed-end management investment company designed primarily as a long term investment and not as a trading vehicle. The Fund is not intended to be a complete investment program and, due to the uncertainty inherent in all investments, there can be no assurance that the Fund will achieve its investment objective. Common shares at any point in time may be worth less than when invested, even after taking into account the reinvestment of Fund dividends and distributions. The Fund invests in fixed-income securities which are subject to credit risks, including the risk of nonpayment of scheduled interest or loan payments, which could lower the Fund’s value. The Fund’s investments are subject to credit risk, inflation risk and interest rate risk. As interest rates rise, the value of a fixed-income portfolio generally declines, reducing the value of the Fund. However, the Fund can normally be expected to have less significant interest rate related fluctuations in its NAV than investment companies investing primarily in fixed-rate fixed-income securities (other than money market funds) because the floating or variable rate securities in which the Fund invests float in response to changes in prevailing market interest rates. The Fund may invest in high-yield and foreign securities, including emerging markets, which involve risks beyond those inherent solely in higher rated and domestic investments. Lower-rated high yield bonds, commonly known as “junk bonds,” involve greater credit and liquidity risks than investment grade bonds. Investing in foreign securities is subject to certain risks typically not associated with domestic investing, such as currency fluctuations and changes in political conditions. These risks are magnified in emerging or developing markets. Derivatives, such as options or futures, can be illiquid and hard to value, especially in declining markets. A small investment in certain derivatives may have a potentially large impact on Fund performance.
All investments are subject to risk including the possible loss of principal. Past performance is no guarantee of future results. All index performance reflects no deduction for fees,
| | |
| VI | | Western Asset Variable Rate Strategic Fund Inc. |
expenses or taxes. Please note that an investor cannot invest directly in an index.
The information provided is not intended to be a forecast of future events, a guarantee of future results or investment advice. Views expressed may differ from those of the firm as a whole.
| i | Gross domestic product (“GDP”) is the market value of all final goods and services produced within a country in a given period of time. |
| ii | The Federal Reserve Board (“Fed”) is responsible for the formulation of U.S. policies designed to promote economic growth, full employment, stable prices and a sustainable pattern of international trade and payments. |
| iii | The federal funds rate is the rate charged by one depository institution on an overnight sale of immediately available funds (balances at the Federal Reserve) to another depository institution; the rate may vary from depository institution to depository institution and from day to day. |
| iv | The Barclays U.S. Aggregate Index is a broad-based bond index comprised of government, corporate, mortgage- and asset-backed issues, rated investment grade or higher, and having at least one year to maturity. |
| v | The Barclays U.S. Corporate High Yield — 2% Issuer Cap Index is an index of the 2% Issuer Cap component of the Barclays U.S. Corporate High Yield Index, which covers the U.S. dollar-denominated, non-investment grade, fixed-rate, taxable corporate bond market. |
| vi | The JPMorgan Emerging Markets Bond Index Global (“EMBI Global”) tracks total returns for U.S. dollar-denominated debt instruments issued by emerging market sovereign and quasi-sovereign entities: Brady bonds, loans, Eurobonds and local market instruments. |
| vii | Net asset value (“NAV”) is calculated by subtracting total liabilities, including liabilities associated with financial leverage (if any), from the closing value of all securities held by the Fund (plus all other assets) and dividing the result (total net assets) by the total number of the common shares outstanding. The NAV fluctuates with changes in the market prices of securities in which the Fund has invested. However, the price at which an investor may buy or sell shares of the Fund is the Fund’s market price as determined by supply of and demand for the Fund’s shares. |
| viii | The BofA Merrill Lynch USD LIBOR 3-Month Constant Maturity Index is based on the assumed purchase of a synthetic instrument having three months to maturity and with a coupon equal to the closing quote for three-month LIBOR. That issue is sold the following day (priced at a yield equal to the current day closing three-month LIBOR rate) and is rolled into a new three-month instrument. The Index, therefore, will always have a constant maturity equal to exactly three months. |
| ix | Lipper, Inc., a wholly-owned subsidiary of Reuters, provides independent insight on global collective investments. Returns are based on the six-month period ended March 31, 2016, including the reinvestment of all distributions, including returns of capital, if any, calculated among the 14 funds in the Fund’s Lipper category. |
| | |
| Western Asset Variable Rate Strategic Fund Inc. | | VII |
Fund at a glance† (unaudited)
Investment breakdown (%) as a percent of total investments
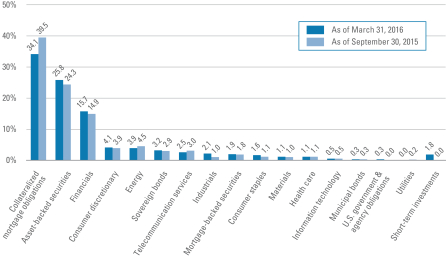
| † | The bar graph above represents the composition of the Fund’s investments as of March 31, 2016 and September 30, 2015 and does not include derivatives, such as futures contracts, forward foreign currency contracts and swap contracts. The Fund is actively managed. As a result, the composition of the Fund’s investments is subject to change at any time. |
| | |
| Western Asset Variable Rate Strategic Fund Inc. 2016 Semi-Annual Report | | 1 |
Spread duration (unaudited)
Economic exposure — March 31, 2016
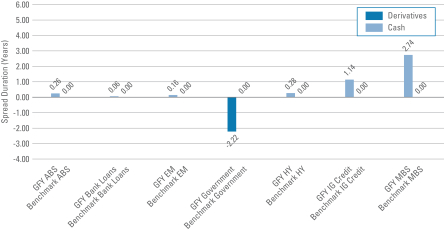
| | |
Total Spread Duration |
| GFY | | — 2.42 years |
| Benchmark | | — 0.00 years |
Spread duration measures the sensitivity to changes in spreads. The spread over Treasuries is the annual risk-premium demanded by investors to hold non-Treasury securities. Spread duration is quantified as the % change in price resulting from a 100 basis points change in spreads. For a security with positive spread duration, an increase in spreads would result in a price decline and a decline in spreads would result in a price increase. This chart highlights the market sector exposure of the Fund’s sectors relative to the selected benchmark sectors as of the end of the reporting period.
| | |
| ABS | | — Asset-Backed Securities |
| EM | | — Emerging Markets |
| GFY | | — Western Asset Variable Rate Strategic Fund Inc. |
| HY | | — High Yield |
| IG Credit | | — Investment-Grade Credit |
| MBS | | — Mortgage-Backed Securities |
| Benchmark | | — BofA Merrill Lynch USD LIBOR 3-Month Constant Maturity Index |
| | |
| 2 | | Western Asset Variable Rate Strategic Fund Inc. 2016 Semi-Annual Report |
Effective duration (unaudited)
Interest rate exposure — March 31, 2016
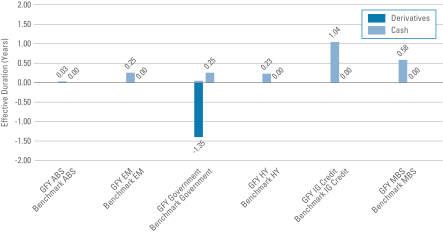
| | |
Total Effective Duration |
| GFY | | — 0.78 years |
| Benchmark | | — 0.25 years |
Effective duration measures the sensitivity to changes in relevant interest rates. Effective duration is quantified as the % change in price resulting from a 100 basis points change in interest rates. For a security with positive effective duration, an increase in interest rates would result in a price decline and a decline in interest rates would result in a price increase. This chart highlights the interest rate exposure of the Fund’s sectors relative to the selected benchmark sectors as of the end of the reporting period.
| | |
| ABS | | — Asset-Backed Securities |
| EM | | — Emerging Markets |
| GFY | | — Western Asset Variable Rate Strategic Fund Inc. |
| HY | | — High Yield |
| IG Credit | | — Investment-Grade Credit |
| MBS | | — Mortgage-Backed Securities |
| Benchmark | | — BofA Merrill Lynch USD LIBOR 3-Month Constant Maturity Index |
| | |
| Western Asset Variable Rate Strategic Fund Inc. 2016 Semi-Annual Report | | 3 |
Schedule of investments (unaudited)
March 31, 2016
Western Asset Variable Rate Strategic Fund Inc.
| | | | | | | | | | | | | | | | |
| Security | | Rate | | | Maturity
Date | | | Face
Amount† | | | Value | |
| Collateralized Mortgage Obligations — 48.9% | | | | | | | | | | | | | | | | |
Adjustable Rate Mortgage Trust, 2005-11 5A1 | | | 0.706 | % | | | 2/25/36 | | | | 160,970 | | | $ | 132,111 | (a) |
Banc of America Funding Corp., 2004-B 6A1 | | | 2.177 | % | | | 12/20/34 | | | | 338,258 | | | | 230,749 | (a) |
Banc of America Funding Corp., 2005-E 8A1 | | | 2.085 | % | | | 6/20/35 | | | | 403,320 | | | | 252,247 | (a) |
Banc of America Funding Corp., 2015-R3 3A2 | | | 1.045 | % | | | 4/29/47 | | | | 1,460,000 | | | | 1,275,425 | (a)(b) |
Bayview Commercial Asset Trust, 2006-1A B2 | | | 2.136 | % | | | 4/25/36 | | | | 539,645 | | | | 350,131 | (a)(b) |
Bear Stearns Alt-A Trust, 2004-03 A1 | | | 1.076 | % | | | 4/25/34 | | | | 437,212 | | | | 419,334 | (a) |
Bear Stearns Alt-A Trust, 2004-10 1A3 | | | 1.436 | % | | | 9/25/34 | | | | 39,405 | | | | 38,951 | (a) |
Bear Stearns ARM Trust, 2004-08 11A1 | | | 2.779 | % | | | 11/25/34 | | | | 289,081 | | | | 284,524 | (a) |
Chevy Chase Mortgage Funding Corp., 2004-2A A1 | | | 0.706 | % | | | 5/25/35 | | | | 329,521 | | | | 295,947 | (a)(b) |
Chevy Chase Mortgage Funding Corp., 2004-3A A1 | | | 0.686 | % | | | 8/25/35 | | | | 320,209 | | | | 284,881 | (a)(b) |
Connecticut Avenue Securities, 2013-C01 M2 | | | 5.686 | % | | | 10/25/23 | | | | 300,000 | | | | 311,786 | (a) |
Countrywide Alternative Loan Trust, 2004-6CB A | | | 1.016 | % | | | 5/25/34 | | | | 455,410 | | | | 438,488 | (a) |
Countrywide Alternative Loan Trust, 2005-24 4A1 | | | 0.664 | % | | | 7/20/35 | | | | 886,966 | | | | 757,872 | (a)(c) |
Countrywide Alternative Loan Trust, 2008-2R 3A1 | | | 6.000 | % | | | 8/25/37 | | | | 564,357 | | | | 450,560 | |
Countrywide Home Loans, 2004-20 2A1 | | | 2.605 | % | | | 9/25/34 | | | | 465,001 | | | | 353,237 | (a) |
Countrywide Home Loans, 2004-R1 2A | | | 6.500 | % | | | 11/25/34 | | | | 63,642 | | | | 61,361 | (b) |
Countrywide Home Loans, 2005-HYB9 3A1A | | | 2.592 | % | | | 2/20/36 | | | | 499,373 | | | | 462,021 | (a) |
Countrywide Home Loans, 2005-R2 2A1 | | | 7.000 | % | | | 6/25/35 | | | | 159,205 | | | | 163,144 | (b) |
Countrywide Home Loans, 2006-R2 AF1 | | | 0.856 | % | | | 7/25/36 | | | | 129,029 | | | | 117,035 | (a)(b) |
Countrywide Home Loans, Mortgage Pass-Through Trust, 2004-29 2A1 | | | 0.757 | % | | | 2/25/35 | | | | 42,615 | | | | 37,292 | (a) |
Countrywide Home Loans, Mortgage Pass-Through Trust, 2005-R1 1AF1 | | | 0.796 | % | | | 3/25/35 | | | | 210,580 | | | | 185,202 | (a)(b) |
Credit Suisse Mortgage Trust, 2014-5R 3A1 | | | 0.627 | % | | | 12/27/36 | | | | 310,428 | | | | 301,166 | (a)(b) |
Credit Suisse Mortgage Trust, 2015-10R 3A2 | | | 1.103 | % | | | 10/27/46 | | | | 1,110,000 | | | | 902,149 | (a)(b) |
Deutsche Mortgage Securities Inc., 2004-4 3AR1 | | | 3.014 | % | | | 6/25/34 | | | | 258,714 | | | | 244,313 | (a) |
Downey Savings & Loan Association Mortgage Loan Trust, 2006-AR1 1A1A | | | 1.205 | % | | | 3/19/46 | | | | 243,399 | | | | 175,245 | (a) |
Federal Home Loan Mortgage Corp. (FHLMC), 2638 DI, IO, PAC | | | 5.000 | % | | | 5/15/23 | | | | 134,465 | | | | 3,342 | |
Federal National Mortgage Association (FNMA), 2013-25 BI, IO | | | 3.000 | % | | | 3/25/33 | | | | 11,597,166 | | | | 1,353,669 | (c) |
Federal National Mortgage Association (FNMA), 2013-62 AI, IO | | | 3.000 | % | | | 6/25/33 | | | | 7,262,696 | | | | 947,561 | (c) |
Federal National Mortgage Association (FNMA), STRIPS, 347 2, IO | | | 5.000 | % | | | 1/25/34 | | | | 1,177,014 | | | | 211,986 | |
Federal National Mortgage Association (FNMA), STRIPS, IO, 339 30 | | | 5.500 | % | | | 8/25/18 | | | | 202,027 | | | | 7,682 | (a) |
Government National Mortgage Association (GNMA), 2010-H03 FA | | | 0.989 | % | | | 3/20/60 | | | | 142,827 | | | | 141,814 | (a)(c) |
Government National Mortgage Association (GNMA), 2010-H10 FC | | | 1.439 | % | | | 5/20/60 | | | | 120,271 | | | | 121,222 | (a)(c) |
See Notes to Financial Statements.
| | |
| 4 | | Western Asset Variable Rate Strategic Fund Inc. 2016 Semi-Annual Report |
Western Asset Variable Rate Strategic Fund Inc.
| | | | | | | | | | | | | | | | |
| Security | | Rate | | | Maturity
Date | | | Face
Amount† | | | Value | |
| Collateralized Mortgage Obligations — continued | | | | | | | | | | | | | | | | |
Government National Mortgage Association (GNMA), 2010-H11 FA | | | 1.439 | % | | | 6/20/60 | | | | 662,015 | | | $ | 668,246 | (a)(c) |
Government National Mortgage Association (GNMA), 2011-H01 AF | | | 0.875 | % | | | 11/20/60 | | | | 1,196,912 | | | | 1,182,492 | (a)(c) |
Government National Mortgage Association (GNMA), 2011-H03 FA | | | 0.925 | % | | | 1/20/61 | | | | 135,866 | | | | 134,576 | (a)(c) |
Government National Mortgage Association (GNMA), 2011-H05 FA | | | 0.925 | % | | | 12/20/60 | | | | 263,827 | | | | 261,671 | (a)(c) |
Government National Mortgage Association (GNMA), 2011-H05 FB | | | 0.925 | % | | | 12/20/60 | | | | 246,511 | | | | 244,077 | (a)(c) |
Government National Mortgage Association (GNMA), 2011-H06 FA | | | 0.875 | % | | | 2/20/61 | | | | 597,919 | | | | 590,977 | (a)(c) |
Government National Mortgage Association (GNMA), 2011-H07 FA | | | 0.925 | % | | | 2/20/61 | | | | 407,281 | | | | 403,716 | (a)(c) |
Government National Mortgage Association (GNMA), 2011-H08 FD | | | 0.930 | % | | | 2/20/61 | | | | 379,394 | | | | 375,774 | (a)(c) |
Government National Mortgage Association (GNMA), 2011-H09 AF | | | 0.925 | % | | | 3/20/61 | | | | 746,412 | | | | 739,226 | (a)(c) |
Government National Mortgage Association (GNMA), 2011-H11 FB | | | 0.925 | % | | | 4/20/61 | | | | 142,460 | | | | 141,061 | (a)(c) |
Government National Mortgage Association (GNMA), 2012-H18 NA | | | 0.945 | % | | | 8/20/62 | | | | 647,643 | | | | 642,071 | (a)(c) |
Government National Mortgage Association (GNMA), 2012-H23 SA | | | 0.955 | % | | | 10/20/62 | | | | 446,247 | | | | 441,771 | (a)(c) |
Government National Mortgage Association (GNMA), 2012-H23 WA | | | 0.945 | % | | | 10/20/62 | | | | 707,158 | | | | 700,446 | (a)(c) |
Government National Mortgage Association (GNMA), 2013-082 IT, IO, PAC | | | 3.500 | % | | | 5/20/43 | | | | 2,426,310 | | | | 418,927 | (c) |
GSMPS Mortgage Loan Trust, 2005-LT1 A1 | | | 0.896 | % | | | 2/25/35 | | | | 61,009 | | | | 58,435 | (a)(b) |
GSMPS Mortgage Loan Trust, 2005-RP2 1AF | | | 0.786 | % | | | 3/25/35 | | | | 632,498 | | | | 537,843 | (a)(b) |
GSMPS Mortgage Loan Trust, 2006-RP2 1AF1 | | | 0.836 | % | | | 4/25/36 | | | | 312,242 | | | | 258,385 | (a)(b) |
GSMSC Resecuritization Trust, 2014 | | | 0.308 | % | | | 4/26/37 | | | | 1,230,000 | | | | 951,226 | (a)(b) |
HarborView Mortgage Loan Trust, 2004-10 4A | | | 2.717 | % | | | 1/19/35 | | | | 208,292 | | | | 204,625 | (a) |
HarborView Mortgage Loan Trust, 2005-14 3A1A | | | 2.869 | % | | | 12/19/35 | | | | 107,659 | | | | 94,246 | (a) |
Homebanc Mortgage Trust, 2005-4 M1 | | | 0.906 | % | | | 10/25/35 | | | | 960,000 | | | | 636,239 | (a) |
IMPAC Secured Assets Corp., 2005-2 A1 | | | 0.756 | % | | | 3/25/36 | | | | 1,444,332 | | | | 1,039,230 | (a)(c) |
Indymac Index Mortgage Loan Trust, 2004-AR07 A2 | | | 1.296 | % | | | 9/25/34 | | | | 188,113 | | | | 170,671 | (a) |
Indymac Index Mortgage Loan Trust, 2004-AR12 A1 | | | 1.216 | % | | | 12/25/34 | | | | 233,624 | | | | 195,733 | (a) |
Indymac Index Mortgage Loan Trust, 2005-AR21 4A1 | | | 2.869 | % | | | 10/25/35 | | | | 306,722 | | | | 261,642 | (a) |
JPMorgan Chase Commercial Mortgage Securities Trust, 2006-LDP9 AJ | | | 5.411 | % | | | 5/15/47 | | | | 1,210,000 | | | | 911,130 | |
See Notes to Financial Statements.
| | |
| Western Asset Variable Rate Strategic Fund Inc. 2016 Semi-Annual Report | | 5 |
Schedule of investments (unaudited) (cont’d)
March 31, 2016
Western Asset Variable Rate Strategic Fund Inc.
| | | | | | | | | | | | | | | | |
| Security | | Rate | | | Maturity
Date | | | Face
Amount† | | | Value | |
| Collateralized Mortgage Obligations — continued | | | | | | | | | | | | | | | | |
JPMorgan Chase Commercial Mortgage Securities Trust, 2007-CB18 AJ | | | 5.502 | % | | | 6/12/47 | | | | 690,000 | | | $ | 631,333 | (a) |
JPMorgan Mortgage Trust, 2005-A3 3A4 | | | 2.336 | % | | | 6/25/35 | | | | 276,805 | | | | 274,521 | (a) |
Luminent Mortgage Trust, 2006-2 A1A | | | 0.636 | % | | | 2/25/46 | | | | 679,841 | | | | 444,058 | (a) |
MASTR Adjustable Rate Mortgages Trust, 2003-6 2A1 | | | 2.257 | % | | | 12/25/33 | | | | 79,892 | | | | 77,341 | (a) |
MASTR Reperforming Loan Trust, 2005-2 1A1F | | | 0.786 | % | | | 5/25/35 | | | | 940,301 | | | | 748,981 | (a)(b) |
MASTR Reperforming Loan Trust, 2006-2 1A1 | | | 4.619 | % | | | 5/25/36 | | | | 356,824 | | | | 325,495 | (a)(b) |
MASTR Reperforming Loan Trust, 2006-2 2A1 | | | 3.264 | % | | | 5/25/36 | | | | 114,502 | | | | 101,527 | (a)(b) |
Morgan Stanley Capital I Trust, 2007-HQ11 AJ | | | 5.508 | % | | | 2/12/44 | | | | 660,000 | | | | 649,462 | (a)(c) |
Morgan Stanley Mortgage Loan Trust, 2006-6AR 2A | | | 2.737 | % | | | 5/25/36 | | | | 681,335 | | | | 567,041 | (a) |
Morgan Stanley Reremic Trust, 2015-R2 1A1 | | | 0.966 | % | | | 12/26/46 | | | | 561,164 | | | | 542,354 | (a)(b) |
Morgan Stanley Reremic Trust, 2015-R2 1B | | | 0.966 | % | | | 12/26/46 | | | | 1,665,631 | | | | 715,097 | (a)(b) |
Morgan Stanley Reremic Trust, 2015-R4 1A1 | | | 0.677 | % | | | 8/26/47 | | | | 952,066 | | | | 901,160 | (a)(b) |
Morgan Stanley Reremic Trust, 2015-R6 1A1 | | | 0.687 | % | | | 7/26/45 | | | | 320,837 | | | | 299,469 | (a)(b) |
Morgan Stanley Reremic Trust, 2015-R6 2A1 | | | 0.686 | % | | | 7/26/45 | | | | 326,804 | | | | 304,322 | (a)(b) |
Morgan Stanley Reremic Trust, 2015-R6 2B | | | 0.686 | % | | | 7/26/45 | | | | 2,670,000 | | | | 1,093,453 | (a)(b) |
Mortgage IT Trust, 2005-3 A1 | | | 0.736 | % | | | 8/25/35 | | | | 407,677 | | | | 375,689 | (a) |
Nomura Resecuritization Trust, 2015-1R 2A2 | | | 0.856 | % | | | 10/26/36 | | | | 1,070,000 | | | | 1,007,792 | (a)(b) |
Prime Mortgage Trust, 2006-DR1 2A2 | | | 6.000 | % | | | 5/25/35 | | | | 532,161 | | | | 492,584 | (b) |
Residential Accredit Loans Inc., 2004-QA2 A2 | | | 0.876 | % | | | 6/25/34 | | | | 295,171 | | | | 287,242 | (a) |
Residential Accredit Loans Inc., 2005-QO4 2A1 | | | 0.716 | % | | | 12/25/45 | | | | 315,886 | | | | 220,688 | (a) |
Structured Agency Credit Risk Debt Notes, 2013-DN1 M2 | | | 7.586 | % | | | 7/25/23 | | | | 420,000 | | | | 474,803 | (a) |
Structured ARM Loan Trust, 2004-09XS A | | | 0.806 | % | | | 7/25/34 | | | | 512,285 | | | | 493,087 | (a) |
Structured Asset Mortgage Investments Inc., 2004-AR3 1A1 | | | 1.030 | % | | | 7/19/34 | | | | 311,832 | | | | 297,794 | (a) |
Structured Asset Mortgage Investments Inc., 2006-AR2 A1 | | | 0.666 | % | | | 2/25/36 | | | | 687,059 | | | | 530,547 | (a) |
Structured Asset Mortgage Investments Inc., 2006-AR3 11A1 | | | 0.646 | % | | | 4/25/36 | | | | 289,575 | | | | 206,630 | (a) |
Structured Asset Securities Corp., 2005-RF1 A | | | 0.786 | % | | | 3/25/35 | | | | 172,959 | | | | 142,480 | (a)(b) |
Structured Asset Securities Corp., 2005-RF2 A | | | 0.786 | % | | | 4/25/35 | | | | 189,377 | | | | 156,168 | (a)(b) |
Washington Mutual Inc., Mortgage Pass-Through Certificates, 2003-AR8 | | | 0.796 | % | | | 10/25/45 | | | | 517,166 | | | | 445,422 | (a) |
Washington Mutual Inc., Mortgage Pass-Through Certificates, 2004-AR11 | | | 2.553 | % | | | 10/25/34 | | | | 151,898 | | | | 152,533 | (a) |
Washington Mutual Inc., Mortgage Pass-Through Certificates, 2004-AR12 A2A | | | 0.826 | % | | | 10/25/44 | | | | 134,454 | | | | 129,427 | (a) |
Washington Mutual Inc., Mortgage Pass-Through Certificates, 2005-4 CB9 | | | 0.836 | % | | | 6/25/35 | | | | 645,868 | | | | 479,841 | (a) |
Washington Mutual Inc., Mortgage Pass-Through Certificates, 2005-AR01 A2A3 | | | 1.236 | % | | | 1/25/45 | | | | 107,152 | | | | 98,172 | (a) |
Washington Mutual Inc., Mortgage Pass-Through Certificates, 2005-AR08 2AB3 | | | 0.796 | % | | | 7/25/45 | | | | 820,267 | | | | 721,218 | (a) |
See Notes to Financial Statements.
| | |
| 6 | | Western Asset Variable Rate Strategic Fund Inc. 2016 Semi-Annual Report |
Western Asset Variable Rate Strategic Fund Inc.
| | | | | | | | | | | | | | | | |
| Security | | Rate | | | Maturity
Date | | | Face
Amount† | | | Value | |
| Collateralized Mortgage Obligations — continued | | | | | | | | | | | | | | | | |
Washington Mutual Inc., Mortgage Pass-Through Certificates, 2005-AR13 A1C3 | | | 0.926 | % | | | 10/25/45 | | | | 220,559 | | | $ | 181,842 | (a) |
Wells Fargo Commercial Mortgage Trust, 2015-C31 D | | | 3.852 | % | | | 11/15/48 | | | | 454,630 | | | | 320,963 | |
Total Collateralized Mortgage Obligations (Cost — $39,470,763) | | | | | | | | 38,467,419 | |
| Asset-Backed Securities — 37.0% | | | | | | | | | | | | | | | | |
ABFS Mortgage Loan Trust, 2002-3 M1 | | | 5.902 | % | | | 9/15/33 | | | | 685,067 | | | | 526,269 | |
Academic Loan Funding Trust, 2013-1A A | | | 1.236 | % | | | 12/26/44 | | | | 391,190 | | | | 384,890 | (a)(b) |
Access Group Inc., 2005-B A2 | | | 0.849 | % | | | 7/25/22 | | | | 6,649 | | | | 6,626 | (a) |
Ace Securities Corp., 2005-HE3 M4 | | | 1.381 | % | | | 5/25/35 | | | | 1,280,000 | | | | 811,122 | (a) |
Adams Mill CLO Ltd., 2014-1A A2 | | | 2.052 | % | | | 7/15/26 | | | | 500,000 | | | | 489,026 | (a)(b) |
ALM Loan Funding, 2013-10A B | | | 3.222 | % | | | 1/15/25 | | | | 250,000 | | | | 241,542 | (a)(b) |
Ameriquest Mortgage Securities Inc., 2002-AR1 M1 | | | 1.498 | % | | | 9/25/32 | | | | 130,922 | | | | 118,611 | (a) |
Ameriquest Mortgage Securities Inc., 2005-R1 M1 | | | 1.111 | % | | | 3/25/35 | | | | 196,698 | | | | 196,823 | (a) |
Apidos CLO, 2013-16A B | | | 3.420 | % | | | 1/19/25 | | | | 400,000 | | | | 379,191 | (a)(b) |
Argent Securities Inc., 2003-W3 M1 | | | 1.561 | % | | | 9/25/33 | | | | 24,094 | | | | 20,643 | (a) |
Atrium CDO Corp., 2009-A A | | | 1.936 | % | | | 2/28/24 | | | | 500,000 | | | | 496,409 | (a)(b) |
Bear Stearns Asset-Backed Securities Trust, 2001-3 A1 | | | 1.336 | % | | | 10/27/32 | | | | 175,298 | | | | 168,586 | (a) |
Bear Stearns Asset-Backed Securities Trust, 2007-SD1 1A2A | | | 6.000 | % | | | 10/25/36 | | | | 673,224 | | | | 500,417 | |
Carlyle Global Market Strategies, 2013-4A C | | | 3.422 | % | | | 10/15/25 | | | | 250,000 | | | | 241,156 | (a)(b) |
Carrington Mortgage Loan Trust, 2006-OPT1 M2 | | | 0.796 | % | | | 2/25/36 | | | | 1,230,000 | | | | 713,479 | (a) |
Cavalry CLO Ltd., 2002A A | | | 1.970 | % | | | 1/17/24 | | | | 250,000 | | | | 247,597 | (a)(b) |
Chase Funding Mortgage Loan Asset-Backed Certificates, 2004-1 1A7 | | | 3.985 | % | | | 11/25/33 | | | | 299,028 | | | | 306,930 | |
Citigroup Mortgage Loan Trust Inc., 2005-OPT1 M1 | | | 1.066 | % | | | 2/25/35 | | | | 244,419 | | | | 236,003 | (a) |
Citigroup Mortgage Loan Trust Inc., 2005-OPT4 M2 | | | 0.866 | % | | | 7/25/35 | | | | 247,316 | | | | 246,621 | (a) |
Countrywide Asset-Backed Certificates, 2003-5 AF5 | | | 5.461 | % | | | 2/25/34 | | | | 631,145 | | | | 636,544 | |
Countrywide Asset-Backed Certificates, 2004-BC1 M1 | | | 1.186 | % | | | 2/25/34 | | | | 106,940 | | | | 102,737 | (a) |
Countrywide Asset-Backed Certificates, 2007-13 2A1 | | | 1.336 | % | | | 10/25/47 | | | | 917,604 | | | | 823,938 | (a)(c) |
Countrywide Home Equity Loan Trust, 2006-HW 2A1B | | | 0.586 | % | | | 11/15/36 | | | | 579,262 | | | | 455,254 | (a) |
Credit-Based Asset Servicing and Securitization LLC, 2007-SP1 A4 | | | 6.020 | % | | | 12/25/37 | | | | 463,296 | | | | 486,043 | (b) |
Dryden Senior Loan Fund, 2014-31A C | | | 3.470 | % | | | 4/18/26 | | | | 500,000 | | | | 471,128 | (a)(b) |
Dryden Senior Loan Fund, 2014-34A D | | | 4.222 | % | | | 10/15/26 | | | | 250,000 | | | | 219,736 | (a)(b) |
EMC Mortgage Loan Trust, 2004-C A1 | | | 0.977 | % | | | 3/25/31 | | | | 29,030 | | | | 28,910 | (a)(b) |
Flatiron CLO Ltd., 2013-1A B | | | 3.370 | % | | | 1/17/26 | | | | 500,000 | | | | 465,865 | (a)(b) |
Greenpoint Home Equity Loan Trust, 2004-4 A | | | 0.996 | % | | | 8/15/30 | | | | 155,483 | | | | 144,682 | (a) |
Greenpoint Manufactured Housing, 1999-3 1A7 | | | 7.270 | % | | | 6/15/29 | | | | 161,482 | | | | 159,574 | |
GSAA Trust, 2006-5 2A3 | | | 0.706 | % | | | 3/25/36 | | | | 1,123,234 | | | | 738,081 | (a) |
See Notes to Financial Statements.
| | |
| Western Asset Variable Rate Strategic Fund Inc. 2016 Semi-Annual Report | | 7 |
Schedule of investments (unaudited) (cont’d)
March 31, 2016
Western Asset Variable Rate Strategic Fund Inc.
| | | | | | | | | | | | | | | | |
| Security | | Rate | | | Maturity
Date | | | Face
Amount† | | | Value | |
| Asset-Backed Securities — continued | | | | | | | | | | | | | | | | |
GSAMP Trust, 2004-OPT B1 | | | 2.836 | % | | | 11/25/34 | | | | 59,971 | | | $ | 35,158 | (a) |
GSAMP Trust, 2004-SEA2 M2 | | | 1.686 | % | | | 3/25/34 | | | | 1,250,000 | | | | 875,730 | (a)(c) |
GSRPM Mortgage Loan Trust, 2007-1 A | | | 0.836 | % | | | 10/25/46 | | | | 339,440 | | | | 273,403 | (a)(b) |
Home Equity Mortgage Trust, 2006-2 2A1 | | | 0.596 | % | | | 7/25/36 | | | | 358,300 | | | | 173,453 | (a) |
Indymac Seconds Asset Backed Trust, 2006-A A | | | 0.696 | % | | | 6/25/36 | | | | 2,249,530 | | | | 445,014 | (a) |
IXIS Real Estate Capital Trust, 2005-HE4 A3 | | | 1.116 | % | | | 2/25/36 | | | | 39,640 | | | | 39,301 | (a) |
Lehman XS Trust, (Structured Asset Securities Corp.), 2005-1 2A2 | | | 1.928 | % | | | 7/25/35 | | | | 608,891 | | | | 586,295 | (a) |
Lehman XS Trust, 2005-5N 3A1A | | | 0.736 | % | | | 11/25/35 | | | | 244,580 | | | | 207,993 | (a) |
Lehman XS Trust, 2006-8 2A4A | | | 0.696 | % | | | 6/25/36 | | | | 1,895,303 | | | | 1,156,455 | (a) |
Long Beach Mortgage Loan Trust, 2001-3 M1 | | | 1.261 | % | | | 9/25/31 | | | | 156,072 | | | | 143,728 | (a) |
Long Beach Mortgage Loan Trust, 2002-1 2M1 | | | 1.561 | % | | | 5/25/32 | | | | 122,942 | | | | 120,528 | (a) |
Madison Park Funding Ltd., 2013-11A C | | | 3.369 | % | | | 10/23/25 | | | | 250,000 | | | | 237,464 | (a)(b) |
Marathon CLO Ltd., 2015-8A C | | | 4.670 | % | | | 7/18/27 | | | | 250,000 | | | | 195,007 | (a)(b) |
Morgan Stanley Capital Inc., 2003-NC9 M | | | 1.561 | % | | | 9/25/33 | | | | 631,649 | | | | 559,386 | (a) |
Morgan Stanley Capital Inc., 2004-HE8 A7 | | | 1.496 | % | | | 9/25/34 | | | | 74,135 | | | | 67,762 | (a) |
Morgan Stanley Capital Inc., 2004-HES M2 | | | 2.311 | % | | | 6/25/34 | | | | 1,019,350 | | | | 936,158 | (a)(c) |
New Century Home Equity Loan Trust, 2004-3 M1 | | | 1.366 | % | | | 11/25/34 | | | | 638,898 | | | | 561,785 | (a) |
Novastar Home Equity Loan, 2004-1 M3 | | | 1.261 | % | | | 6/25/34 | | | | 690,000 | | | | 645,361 | (a) |
Option One Mortgage Loan Trust, 2005-1 A4 | | | 1.236 | % | | | 2/25/35 | | | | 76,118 | | | | 75,878 | (a) |
Option One Mortgage Loan Trust, 2005-3 M4 | | | 1.056 | % | | | 8/25/35 | | | | 1,040,000 | | | | 433,245 | (a) |
Origen Manufactured Housing Contract Trust, 2007-A A2 | | | 2.291 | % | | | 4/15/37 | | | | 481,680 | | | | 431,063 | (a) |
Park Place Securities Inc., 2004-WHQ2 M2 | | | 1.381 | % | | | 2/25/35 | | | | 250,127 | | | | 249,801 | (a) |
Park Place Securities Inc., 2005-WHQ1 M6 | | | 1.606 | % | | | 3/25/35 | | | | 830,000 | | | | 552,784 | (a) |
People’s Choice Home Loan Securities Trust, 2004-2 M1 | | | 1.336 | % | | | 10/25/34 | | | | 122,136 | | | | 120,773 | (a) |
RAAC Series, 2006-RP2 A | | | 0.677 | % | | | 2/25/37 | | | | 244,759 | | | | 242,265 | (a)(b) |
RAAC Series, 2006-RP3 A | | | 0.697 | % | | | 5/25/36 | | | | 560,357 | | | | 504,088 | (a)(b) |
RAAC Series, 2007-RP3 M1 | | | 1.227 | % | | | 10/25/46 | | | | 1,043,739 | | | | 375,606 | (a)(b) |
Regatta IV Funding Ltd., 2014-1A D | | | 4.119 | % | | | 7/25/26 | | | | 250,000 | | | | 209,823 | (a)(b) |
Renaissance Home Equity Loan Trust, 2003-1 A | | | 1.296 | % | | | 6/25/33 | | | | 581,338 | | | | 549,531 | (a) |
Renaissance Home Equity Loan Trust, 2003-2 A | | | 1.316 | % | | | 8/25/33 | | | | 71,289 | | | | 66,380 | (a) |
Renaissance Home Equity Loan Trust, 2005-3 AV3 | | | 0.816 | % | | | 11/25/35 | | | | 929,867 | | | | 816,091 | (a)(c) |
Renaissance Net Interest Margin Trust, 2007-2 N | | | 8.353 | % | | | 6/25/37 | | | | 128,633 | | | | 1 | *(b)(d)(e) |
Residential Asset Mortgage Products Inc., 2003-RS7 MII1 | | | 1.561 | % | | | 8/25/33 | | | | 33,676 | | | | 29,528 | (a) |
Residential Asset Mortgage Products Inc., 2003-RZ4 A7 | | | 5.290 | % | | | 6/25/33 | | | | 12,071 | | | | 12,358 | |
Residential Asset Mortgage Products Inc., 2003-SL1 M1 | | | 7.352 | % | | | 4/25/31 | | | | 553,663 | | | | 345,637 | (a) |
Residential Asset Securities Corp, 2006-KS2 M3 | | | 0.846 | % | | | 3/25/36 | | | | 1,260,000 | | | | 804,316 | (a) |
Residential Asset Securities Corp., 2005-EMX3 M5 | | | 1.086 | % | | | 9/25/35 | | | | 1,250,000 | | | | 945,937 | (a) |
See Notes to Financial Statements.
| | |
| 8 | | Western Asset Variable Rate Strategic Fund Inc. 2016 Semi-Annual Report |
Western Asset Variable Rate Strategic Fund Inc.
| | | | | | | | | | | | | | | | |
| Security | | Rate | | | Maturity
Date | | | Face
Amount† | | | Value | |
| Asset-Backed Securities — continued | | | | | | | | | | | | | | | | |
Residential Funding Mortgage Securities Trust, 2006-HSA3 A | | | 0.566 | % | | | 5/25/36 | | | | 876,770 | | | $ | 777,350 | (a) |
SACO I Trust, 2006-3 A3 | | | 0.896 | % | | | 4/25/36 | | | | 216,562 | | | | 368,399 | (a) |
SACO I Trust, 2006-4 A1 | | | 0.776 | % | | | 3/25/36 | | | | 218,422 | | | | 351,572 | (a) |
Saratoga Investment Corp. CLO Ltd., 2013-1A A1 | | | 1.924 | % | | | 10/20/23 | | | | 250,000 | | | | 248,617 | (a)(b) |
SLM Student Loan Trust, 2013-B B | | | 3.000 | % | | | 5/16/44 | | | | 700,000 | | | | 687,009 | (b) |
Soundview Home Equity Loan Trust, 2005-OPT4 M1 | | | 0.896 | % | | | 12/25/35 | | | | 1,360,000 | | | | 755,174 | (a) |
Structured Asset Investment Loan Trust, 2004-9 M4 | | | 2.386 | % | | | 10/25/34 | | | | 117,619 | | | | 86,646 | (a) |
Structured Asset Securities Corp., 2006-GEL1 A2 | | | 0.786 | % | | | 11/25/35 | | | | 4,228 | | | | 4,234 | (a)(b) |
Structured Asset Securities Corp., 2007-BC3 2A3 | | | 0.616 | % | | | 5/25/47 | | | | 290,000 | | | | 233,111 | (a) |
Venture CDO Ltd., 2014-16A A3L | | | 3.372 | % | | | 4/15/26 | | | | 500,000 | | | | 456,745 | (a)(b) |
Total Asset-Backed Securities (Cost — $29,367,425) | | | | | | | | 29,058,376 | |
| Corporate Bonds & Notes — 40.4% | | | | | | | | | | | | | | | | |
| Consumer Discretionary — 4.4% | | | | | | | | | | | | | | | | |
Auto Components — 0.4% | | | | | | | | | | | | | | | | |
Goodyear Tire & Rubber Co., Senior Bonds | | | 5.125 | % | | | 11/15/23 | | | | 90,000 | | | | 92,475 | |
ZF North America Capital Inc., Senior Notes | | | 4.750 | % | | | 4/29/25 | | | | 200,000 | | | | 199,750 | (b) |
Total Auto Components | | | | | | | | | | | | | | | 292,225 | |
Automobiles — 2.2% | | | | | | | | | | | | | | | | |
Ford Motor Credit Co., LLC, Senior Notes | | | 5.875 | % | | | 8/2/21 | | | | 250,000 | | | | 286,868 | (c) |
General Motors Financial Co. Inc., Senior Notes | | | 4.375 | % | | | 9/25/21 | | | | 400,000 | | | | 413,912 | (c) |
General Motors Financial Co. Inc., Senior Notes | | | 4.250 | % | | | 5/15/23 | | | | 1,000,000 | | | | 1,007,148 | (c) |
Total Automobiles | | | | | | | | | | | | | | | 1,707,928 | |
Diversified Consumer Services — 0.0% | | | | | | | | | | | | | | | | |
Service Corp. International, Senior Notes | | | 7.625 | % | | | 10/1/18 | | | | 30,000 | | | | 34,088 | |
Hotels, Restaurants & Leisure — 0.5% | | | | | | | | | | | | | | | | |
Choctaw Resort Development Enterprise, Senior Notes | | | 7.250 | % | | | 11/15/19 | | | | 200,000 | | | | 195,000 | (b) |
MGM Resorts International, Senior Notes | | | 7.625 | % | | | 1/15/17 | | | | 230,000 | | | | 239,200 | |
Total Hotels, Restaurants & Leisure | | | | | | | | | | | | | | | 434,200 | |
Media — 1.3% | | | | | | | | | | | | | | | | |
Comcast Corp., Senior Notes | | | 6.500 | % | | | 1/15/17 | | | | 400,000 | | | | 417,380 | (c) |
DISH DBS Corp., Senior Notes | | | 6.750 | % | | | 6/1/21 | | | | 400,000 | | | | 414,000 | |
DISH DBS Corp., Senior Notes | | | 5.875 | % | | | 7/15/22 | | | | 190,000 | | | | 180,500 | |
Total Media | | | | | | | | | | | | | | | 1,011,880 | |
Total Consumer Discretionary | | | | | | | | | | | | | | | 3,480,321 | |
| Consumer Staples — 2.4% | | | | | | | | | | | | | | | | |
Beverages — 0.6% | | | | | | | | | | | | | | | | |
Anheuser-Busch InBev Finance Inc., Senior Notes | | | 1.879 | % | | | 2/1/21 | | | | 440,000 | | | | 448,092 | (a)(c) |
See Notes to Financial Statements.
| | |
| Western Asset Variable Rate Strategic Fund Inc. 2016 Semi-Annual Report | | 9 |
Schedule of investments (unaudited) (cont’d)
March 31, 2016
Western Asset Variable Rate Strategic Fund Inc.
| | | | | | | | | | | | | | | | |
| Security | | Rate | | | Maturity
Date | | | Face
Amount† | | | Value | |
Food Products — 1.2% | | | | | | | | | | | | | | | | |
Kraft Heinz Foods Co., Senior Notes | | | 3.950 | % | | | 7/15/25 | | | | 920,000 | | | $ | 980,781 | (b)(c) |
Tobacco — 0.6% | | | | | | | | | | | | | | | | |
Altria Group Inc., Senior Notes | | | 9.250 | % | | | 8/6/19 | | | | 350,000 | | | | 432,790 | (c) |
Total Consumer Staples | | | | | | | | | | | | | | | 1,861,663 | |
| Energy — 5.6% | | | | | | | | | | | | | | | | |
Energy Equipment & Services — 0.2% | | | | | | | | | | | | | | | | |
Ensco PLC, Senior Notes | | | 5.200 | % | | | 3/15/25 | | | | 300,000 | | | | 168,375 | (c) |
Oil, Gas & Consumable Fuels — 5.4% | | | | | | | | | | | | | | | | |
Anadarko Petroleum Corp., Senior Notes | | | 6.375 | % | | | 9/15/17 | | | | 380,000 | | | | 398,368 | (c) |
Chesapeake Energy Corp., Senior Notes | | | 3.872 | % | | | 4/15/19 | | | | 400,000 | | | | 157,000 | (a) |
Continental Resources Inc., Senior Notes | | | 5.000 | % | | | 9/15/22 | | | | 500,000 | | | | 433,438 | (c) |
Ecopetrol SA, Senior Notes | | | 4.250 | % | | | 9/18/18 | | | | 240,000 | | | | 244,584 | (c) |
Enterprise Products Operating LLC, Junior Subordinated Notes | | | 8.375 | % | | | 8/1/66 | | | | 80,000 | | | | 63,300 | (a)(c) |
Enterprise Products Operating LLC, Junior Subordinated Notes | | | 7.034 | % | | | 1/15/68 | | | | 120,000 | | | | 121,980 | (a)(c) |
LUKOIL International Finance BV, Bonds | | | 6.356 | % | | | 6/7/17 | | | | 210,000 | | | | 219,366 | (f) |
LUKOIL International Finance BV, Senior Notes | | | 7.250 | % | | | 11/5/19 | | | | 240,000 | | | | 262,466 | (f) |
Petrobras Global Finance BV, Senior Notes | | | 3.000 | % | | | 1/15/19 | | | | 1,230,000 | | | | 1,060,167 | (c) |
Petroleos Mexicanos, Senior Notes | | | 3.500 | % | | | 7/23/20 | | | | 250,000 | | | | 245,625 | (f) |
Rosneft Finance SA, Senior Notes | | | 7.875 | % | | | 3/13/18 | | | | 200,000 | | | | 214,500 | (f) |
Transcontinental Gas Pipe Line Co., LLC, Senior Notes | | | 7.850 | % | | | 2/1/26 | | | | 210,000 | | | | 240,603 | (b) |
Whiting Petroleum Corp., Senior Notes | | | 5.000 | % | | | 3/15/19 | | | | 500,000 | | | | 348,750 | |
Williams Cos. Inc., Senior Notes | | | 4.550 | % | | | 6/24/24 | | | | 250,000 | | | | 191,250 | |
Total Oil, Gas & Consumable Fuels | | | | | | | | | | | | | | | 4,201,397 | |
Total Energy | | | | | | | | | | | | | | | 4,369,772 | |
| Financials — 19.8% | | | | | | | | | | | | | | | | |
Banks — 13.9% | | | | | | | | | | | | | | | | |
Bank of America Corp., Junior Subordinated Notes | | | 6.250 | % | | | 9/5/24 | | | | 650,000 | | | | 637,813 | (a)(g) |
Bank of America Corp., Senior Notes | | | 3.750 | % | | | 7/12/16 | | | | 600,000 | | | | 604,416 | (c) |
Bank of America Corp., Subordinated Notes | | | 4.000 | % | | | 1/22/25 | | | | 660,000 | | | | 662,218 | (c) |
Barclays Bank PLC, Senior Notes | | | 5.000 | % | | | 9/22/16 | | | | 200,000 | | | | 203,760 | (c) |
Citigroup Inc., Junior Subordinated Bonds | | | 6.300 | % | | | 5/15/24 | | | | 570,000 | | | | 548,188 | (a)(g) |
Citigroup Inc., Subordinated Bonds | | | 4.400 | % | | | 6/10/25 | | | | 900,000 | | | | 919,467 | (c) |
Cooperatieve Rabobank U.A., Junior Subordinated Notes | | | 11.000 | % | | | 6/30/19 | | | | 260,000 | | | | 312,949 | (a)(b)(c)(g) |
Credit Agricole SA, Junior Subordinated Notes | | | 8.375 | % | | | 10/13/19 | | | | 620,000 | | | | 686,774 | (a)(b)(c)(g) |
JPMorgan Chase & Co., Junior Subordinated Bonds | | | 5.150 | % | | | 5/1/23 | | | | 1,320,000 | | | | 1,270,764 | (a)(c)(g) |
M&T Bank Corp., Junior Subordinated Bonds | | | 6.875 | % | | | 6/15/16 | | | | 570,000 | | | | 573,563 | (c)(g) |
See Notes to Financial Statements.
| | |
| 10 | | Western Asset Variable Rate Strategic Fund Inc. 2016 Semi-Annual Report |
Western Asset Variable Rate Strategic Fund Inc.
| | | | | | | | | | | | | | | | |
| Security | | Rate | | | Maturity
Date | | | Face
Amount† | | | Value | |
Banks — continued | | | | | | | | | | | | | | | | |
M&T Bank Corp., Junior Subordinated Bonds | | | 6.450 | % | | | 2/15/24 | | | | 1,190,000 | | | $ | 1,279,250 | (a)(c)(g) |
PNC Financial Services Group Inc., Junior Subordinated Bonds | | | 4.850 | % | | | 6/1/23 | | | | 990,000 | | | | 936,787 | (a)(c)(g) |
Wachovia Capital Trust III, Junior Subordinated Bonds | | | 5.570 | % | | | 5/2/16 | | | | 1,800,000 | | | | 1,779,750 | (a)(c)(g) |
Wells Fargo & Co., Senior Notes | | | 3.500 | % | | | 3/8/22 | | | | 450,000 | | | | 480,093 | (c) |
Total Banks | | | | | | | | | | | | | | | 10,895,792 | |
Capital Markets — 2.4% | | | | | | | | | | | | | | | | |
Bank of New York Mellon Corp., Junior Subordinated Notes | | | 4.500 | % | | | 6/20/23 | | | | 1,340,000 | | | | 1,226,100 | (a)(c)(g) |
Goldman Sachs Capital III, Junior Subordinated Bonds | | | 4.000 | % | | | 5/2/16 | | | | 506,000 | | | | 361,988 | (a)(g) |
Goldman Sachs Group Inc., Senior Notes | | | 6.250 | % | | | 9/1/17 | | | | 300,000 | | | | 319,416 | (c) |
Total Capital Markets | | | | | | | | | | | | | | | 1,907,504 | |
Consumer Finance — 1.7% | | | | | | | | | | | | | | | | |
Ally Financial Inc., Senior Notes | | | 8.000 | % | | | 3/15/20 | | | | 225,000 | | | | 252,563 | |
American Express Co., Senior Notes | | | 2.650 | % | | | 12/2/22 | | | | 517,000 | | | | 516,159 | (c) |
HSBC Finance Corp., Senior Notes | | | 6.676 | % | | | 1/15/21 | | | | 500,000 | | | | 574,102 | (c) |
Total Consumer Finance | | | | | | | | | | | | | | | 1,342,824 | |
Diversified Financial Services — 0.7% | | | | | | | | | | | | | | | | |
International Lease Finance Corp., Senior Notes | | | 8.750 | % | | | 3/15/17 | | | | 490,000 | | | | 517,391 | |
Insurance — 0.8% | | | | | | | | | | | | | | | | |
MetLife Inc., Junior Subordinated Bonds | | | 5.250 | % | | | 6/15/20 | | | | 680,000 | | | | 651,525 | (a)(c)(g) |
Thrifts & Mortgage Finance — 0.3% | | | | | | | | | | | | | | | | |
Santander Holdings USA Inc., Senior Notes | | | 4.625 | % | | | 4/19/16 | | | | 240,000 | | | | 240,355 | (c) |
Total Financials | | | | | | | | | | | | | | | 15,555,391 | |
| Health Care — 1.2% | | | | | | | | | | | | | | | | |
Health Care Equipment & Supplies — 1.0% | | | | | | | | | | | | | | | | |
Becton, Dickinson & Co., Senior Notes | | | 3.734 | % | | | 12/15/24 | | | | 300,000 | | | | 319,962 | (c) |
Medtronic Inc., Senior Notes | | | 3.500 | % | | | 3/15/25 | | | | 440,000 | | | | 470,173 | (c) |
Total Health Care Equipment & Supplies | | | | | | | | | | | | | | | 790,135 | |
Health Care Providers & Services — 0.2% | | | | | | | | | | | | | | | | |
Tenet Healthcare Corp., Senior Secured Notes | | | 6.000 | % | | | 10/1/20 | | | | 170,000 | | | | 181,900 | |
Total Health Care | | | | | | | | | | | | 972,035 | |
| Industrials — 2.7% | | | | | | | | | | | | | | | | |
Airlines — 0.4% | | | | | | | | | | | | | | | | |
Air 2 US, Notes | | | 8.027 | % | | | 10/1/19 | | | | 29,944 | | | | 31,291 | (b) |
American Airlines, Pass Through Trust, Secured Bonds | | | 4.100 | % | | | 1/15/28 | | | | 250,000 | | | | 259,037 | |
Delta Air Lines Inc., Pass-Through Certificates, Secured Notes | | | 8.021 | % | | | 8/10/22 | | | | 40,474 | | | | 45,787 | |
Total Airlines | | | | | | | | | | | | | | | 336,115 | |
See Notes to Financial Statements.
| | |
| Western Asset Variable Rate Strategic Fund Inc. 2016 Semi-Annual Report | | 11 |
Schedule of investments (unaudited) (cont’d)
March 31, 2016
Western Asset Variable Rate Strategic Fund Inc.
| | | | | | | | | | | | | | | | |
| Security | | Rate | | | Maturity
Date | | | Face
Amount† | | | Value | |
Construction & Engineering — 0.6% | | | | | | | | | | | | | | | | |
Brundage-Bone Concrete Pumping Inc., Senior Secured Notes | | | 10.375 | % | | | 9/1/21 | | | | 200,000 | | | $ | 202,000 | (b) |
Odebrecht Finance Ltd., Senior Notes | | | 4.375 | % | | | 4/25/25 | | | | 500,000 | | | | 221,250 | (b) |
Total Construction & Engineering | | | | | | | | | | | | | | | 423,250 | |
Industrial Conglomerates — 1.7% | | | | | | | | | | | | | | | | |
General Electric Co., Junior Subordinated Bonds | | | 5.000 | % | | | 1/21/21 | | | | 1,312,000 | | | | 1,353,000 | (a)(c)(g) |
Total Industrials | | | | | | | | | | | | 2,112,365 | |
| Information Technology — 0.4% | | | | | | | | | | | | | | | | |
Electronic Equipment, Instruments & Components — 0.3% | | | | | | | | | | | | | | | | |
Interface Security Systems Holdings Inc./Interface Security Systems LLC, Senior Secured Notes | | | 9.250 | % | | | 1/15/18 | | | | 260,000 | | | | 245,375 | |
IT Services — 0.1% | | | | | | | | | | | | | | | | |
First Data Corp., Senior Secured Notes | | | 6.750 | % | | | 11/1/20 | | | | 65,000 | | | | 68,510 | (b) |
Total Information Technology | | | | | | | | | | | | 313,885 | |
| Materials — 1.5% | | | | | | | | | | | | | | | | |
Chemicals — 0.2% | | | | | | | | | | | | | | | | |
Jac Holding Corp., Senior Secured Notes | | | 11.500 | % | | | 10/1/19 | | | | 143,000 | | | | 140,855 | (b) |
Construction Materials — 0.8% | | | | | | | | | | | | | | | | |
Cemex SAB de CV, Senior Secured Notes | | | 5.372 | % | | | 10/15/18 | | | | 650,000 | | | | 648,375 | (a)(b)(c) |
Metals & Mining — 0.5% | | | | | | | | | | | | | | | | |
Vale Overseas Ltd., Senior Notes | | | 4.375 | % | | | 1/11/22 | | | | 500,000 | | | | 428,125 | (c) |
Total Materials | | | | | | | | | | | | 1,217,355 | |
| Telecommunication Services — 2.4% | | | | | | | | | | | | | | | | |
Diversified Telecommunication Services — 1.2% | | | | | | | | | | | | | | | | |
Cincinnati Bell Telephone Co., LLC, Senior Debentures | | | 6.300 | % | | | 12/1/28 | | | | 45,000 | | | | 41,962 | |
Verizon Communications Inc., Senior Notes | | | 6.550 | % | | | 9/15/43 | | | | 680,000 | | | | 898,974 | (c) |
Total Diversified Telecommunication Services | | | | | | | | | | | | | | | 940,936 | |
Wireless Telecommunication Services — 1.2% | | | | | | | | | | | | | | | | |
Sprint Corp., Senior Notes | | | 7.250 | % | | | 9/15/21 | | | | 530,000 | | | | 407,438 | |
Sprint Corp., Senior Notes | | | 7.625 | % | | | 2/15/25 | | | | 740,000 | | | | 553,150 | |
Total Wireless Telecommunication Services | | | | | | | | | | | | | | | 960,588 | |
Total Telecommunication Services | | | | | | | | | | | | 1,901,524 | |
Total Corporate Bonds & Notes (Cost — $30,780,926) | | | | | | | | | | | | 31,784,311 | |
| Mortgage-Backed Securities — 2.8% | | | | | | | | | | | | | | | | |
GNMA — 2.8% | | | | | | | | | | | | | | | | |
Government National Mortgage Association (GNMA) | | | 6.500 | % | | | 8/15/34 | | | | 184,039 | | | | 213,219 | (c) |
Government National Mortgage Association (GNMA) II | | | 1.746 | % | | | 8/20/58 | | | | 137,398 | | | | 139,170 | (a)(c) |
See Notes to Financial Statements.
| | |
| 12 | | Western Asset Variable Rate Strategic Fund Inc. 2016 Semi-Annual Report |
Western Asset Variable Rate Strategic Fund Inc.
| | | | | | | | | | | | | | | | |
| Security | | Rate | | | Maturity
Date | | | Face
Amount† | | | Value | |
GNMA — continued | | | | | | | | | | | | | | | | |
Government National Mortgage Association (GNMA) II | | | 2.090 | % | | | 10/20/59-1/20/60 | | | | 711,694 | | | $ | 728,560 | (a)(c) |
Government National Mortgage Association (GNMA) II | | | 3.690 | % | | | 10/20/59 | | | | 4,699 | | | | 5,079 | (a)(c) |
Government National Mortgage Association (GNMA) II | | | 2.052 | % | | | 12/20/59 | | | | 149,285 | | | | 152,573 | (a)(c) |
Government National Mortgage Association (GNMA) II | | | 2.060 | % | | | 12/20/59 | | | | 638,864 | | | | 652,466 | (a)(c) |
Government National Mortgage Association (GNMA) II | | | 1.604 | % | | | 7/20/60 | | | | 143,109 | | | | 145,416 | (a)(c) |
Government National Mortgage Association (GNMA) II | | | 1.918 | % | | | 7/20/60 | | | | 145,839 | | | | 148,111 | (a)(c) |
Total Mortgage-Backed Securities (Cost — $2,176,998) | | | | | | | | 2,184,594 | |
| Municipal Bonds — 0.5% | | | | | | | | | | | | | |
North Carolina — 0.5% | | | | | | | | | | | | | | | | |
North Carolina State Education Assistance Authority Revenue, Student Loan Backed Notes (Cost — $378,834) | | | 1.166 | % | | | 10/25/41 | | | | 400,000 | | | | 378,980 | (a) |
| Senior Loans — 3.5% | | | | | | | | | | | | | | | | |
| Consumer Discretionary — 1.4% | | | | | | | | | | | | | | | | |
Media — 1.0% | | | | | | | | | | | | | | | | |
Univision Communications Inc., Term Loan C4 | | | 4.000 | % | | | 3/1/20 | | | | 775,159 | | | | 768,516 | (h)(i) |
Specialty Retail — 0.4% | | | | | | | | | | | | | | | | |
Michaels Stores Inc., Term Loan B | | | 3.750 | % | | | 1/28/20 | | | | 243,734 | | | | 243,556 | (h)(i) |
Staples Escrow LLC, 2016 Term Loan | | | 4.750 | % | | | 2/2/22 | | | | 125,000 | | | | 124,911 | (h)(i) |
Total Specialty Retail | | | | | | | | | | | | | | | 368,467 | |
Total Consumer Discretionary | | | | | | | | | | | | | | | 1,136,983 | |
| Health Care — 0.3% | | | | | | | | | | | | | | | | |
Health Care Providers & Services — 0.3% | | | | | | | | | | | | | | | | |
Envision Healthcare Corp., Initial Term Loan | | | 4.250 | % | | | 5/25/18 | | | | 234,961 | | | | 235,313 | (h)(i) |
| Industrials — 0.4% | | | | | | | | | | | | | | | | |
Airlines — 0.4% | | | | | | | | | | | | | | | | |
American Airlines Inc., New Term Loan | | | 3.250 | % | | | 6/27/20 | | | | 295,489 | | | | 294,358 | (h)(i) |
| Information Technology — 0.3% | | | | | | | | | | | | | | | | |
IT Services — 0.3% | | | | | | | | | | | | | | | | |
First Data Corp., New 2018 Extended Term Loan | | | 3.932 | % | | | 3/24/18 | | | | 243,558 | | | | 243,388 | (h)(i) |
| Telecommunication Services — 1.1% | | | | | | | | | | | | | | | | |
Diversified Telecommunication Services — 1.1% | | | | | | | | | | | | | | | | |
Intelsat Jackson Holdings SA, Term Loan B2 | | | 3.750 | % | | | 6/30/19 | | | | 711,984 | | | | 665,927 | (h)(i) |
Virgin Media Investment Holdings Ltd., USD Term Loan F | | | 3.500 | % | | | 6/30/23 | | | | 168,330 | | | | 167,147 | (h)(i) |
Total Telecommunication Services | | | | | | | | | | | | | | | 833,074 | |
Total Senior Loans (Cost — $2,728,222) | | | | | | | | | | | | 2,743,116 | |
See Notes to Financial Statements.
| | |
| Western Asset Variable Rate Strategic Fund Inc. 2016 Semi-Annual Report | | 13 |
Schedule of investments (unaudited) (cont’d)
March 31, 2016
Western Asset Variable Rate Strategic Fund Inc.
| | | | | | | | | | | | | | | | |
| Security | | Rate | | | Maturity
Date | | | Face
Amount† | | | Value | |
| Sovereign Bonds — 4.6% | | | | | | | | | | | | | | | | |
Brazil — 2.5% | | | | | | | | | | | | | | | | |
Federative Republic of Brazil, Notes | | | 10.000 | % | | | 1/1/21 | | | | 7,582,000 | BRL | | $ | 1,852,071 | |
Federative Republic of Brazil, Senior Notes | | | 10.000 | % | | | 1/1/17 | | | | 384,000 | BRL | | | 104,399 | |
Total Brazil | | | | | | | | | | | | | | | 1,956,470 | |
Mexico — 1.6% | | | | | | | | | | | | | | | | |
United Mexican States, Medium-Term Notes | | | 6.750 | % | | | 9/27/34 | | | | 85,000 | | | | 109,863 | (c) |
United Mexican States, Senior Bonds | | | 6.500 | % | | | 6/9/22 | | | | 15,090,000 | MXN | | | 916,513 | |
United Mexican States, Senior Notes | | | 5.550 | % | | | 1/21/45 | | | | 210,000 | | | | 233,362 | (c) |
Total Mexico | | | | | | | | | | | | | | | 1,259,738 | |
Russia — 0.5% | | | | | | | | | | | | | | | | |
Russian Foreign Bond - Eurobond, Senior Bonds | | | 12.750 | % | | | 6/24/28 | | | | 254,000 | | | | 422,694 | (f) |
Total Sovereign Bonds (Cost — $4,158,348) | | | | | | | | | | | | 3,638,902 | |
| U.S. Government & Agency Obligations — 0.4% | | | | | | | | | | | | | |
U.S. Government Obligations — 0.4% | | | | | | | | | | | | | | | | |
U.S. Treasury Bonds (Cost — $302,050) | | | 3.000 | % | | | 11/15/45 | | | | 280,000 | | | | 302,291 | |
| | | | |
| | | | | | | | | Shares | | | | |
| Common Stocks — 0.1% | | | | | | | | | | | | | | | | |
| Industrials — 0.0% | | | | | | | | | | | | | | | | |
Marine — 0.0% | | | | | | | | | | | | | | | | |
DeepOcean Group Holding AS | | | | | | | | | | | 3,101 | | | | 16,931 | *(d)(j) |
| Telecommunication Services — 0.1% | | | | | | | | | | | | | | | | |
Diversified Telecommunication Services — 0.1% | | | | | | | | | | | | | | | | |
Axtel SAB de CV, ADR | | | | | | | | | | | 12,497 | | | | 43,440 | *(b) |
Total Common Stocks (Cost — $108,734) | | | | | | | | | | | | | | | 60,371 | |
| Preferred Stocks — 2.6% | | | | | | | | | | | | | | | | |
| Financials — 2.6% | | | | | | | | | | | | | | | | |
Capital Markets — 2.6% | | | | | | | | | | | | | | | | |
Northern Trust Corp. | | | 5.850 | % | | | | | | | 28,000 | | | | 754,600 | |
State Street Corp. | | | 5.900 | % | | | | | | | 49,000 | | | | 1,338,190 | (a) |
Total Preferred Stocks (Cost — $1,975,960) | | | | | | | | | | | | | | | 2,092,790 | |
Total Investments before Short-Term Investments (Cost — $111,448,260) | | | | 110,711,150 | |
| Short-Term Investments — 2.6% | | | | | | | | | | | | | | | | |
State Street Institutional U.S. Government Money Market Fund, Premier Class (Cost — $2,040,641) | | | 0.225 | % | | | | | | | 2,040,641 | | | | 2,040,641 | |
Total Investments — 143.4% (Cost — $113,488,901#) | | | | | | | | 112,751,791 | |
Liabilities in Excess of Other Assets — (43.4)% | | | | | | | | | | | | | | | (34,151,608 | ) |
Total Net Assets — 100.0% | | | | | | | | | | | | | | $ | 78,600,183 | |
See Notes to Financial Statements.
| | |
| 14 | | Western Asset Variable Rate Strategic Fund Inc. 2016 Semi-Annual Report |
Western Asset Variable Rate Strategic Fund Inc.
| * | Non-income producing security. |
| † | Face amount denominated in U.S. dollars, unless otherwise noted. |
| (a) | Variable rate security. Interest rate disclosed is as of the most recent information available. |
| (b) | Security is exempt from registration under Rule 144A of the Securities Act of 1933. This security may be resold in transactions that are exempt from registration, normally to qualified institutional buyers. This security has been deemed liquid pursuant to guidelines approved by the Board of Directors, unless otherwise noted. |
| (c) | All or a portion of this security is held by the counterparty as collateral for open reverse repurchase agreements. |
| (e) | The coupon payment on these securities is currently in default as of March 31, 2016. |
| (f) | Security is exempt from registration under Regulation S of the Securities Act of 1933. Regulation S applies to securities offerings that are made outside of the United States and do not involve direct selling efforts in the United States. This security has been deemed liquid pursuant to guidelines approved by the Board of Directors, unless otherwise noted. |
| (g) | Security has no maturity date. The date shown represents the next call date. |
| (h) | Senior loans may be considered restricted in that the Fund ordinarily is contractually obligated to receive approval from the agent bank and/or borrower prior to the disposition of a senior loan. |
| (i) | Interest rates disclosed represent the effective rates on senior loans. Ranges in interest rates are attributable to multiple contracts under the same loan. |
| (j) | Security is valued in good faith in accordance with procedures approved by the Board of Directors (See Note 1). |
| # | Aggregate cost for federal income tax purposes is substantially the same. |
| | |
Abbreviations used in this schedule: |
| ADR | | — American Depositary Receipts |
| ARM | | — Adjustable Rate Mortgage |
| BRL | | — Brazilian Real |
| CDO | | — Collateralized Debt Obligation |
| CLO | | — Collateral Loan Obligation |
| IO | | — Interest Only |
| MXN | | — Mexican Peso |
| PAC | | — Planned Amortization Class |
| STRIPS | | — Separate Trading of Registered Interest and Principal Securities |
See Notes to Financial Statements.
| | |
| Western Asset Variable Rate Strategic Fund Inc. 2016 Semi-Annual Report | | 15 |
Statement of assets and liabilities (unaudited)
March 31, 2016
| | | | |
| |
| Assets: | | | | |
Investments, at value (Cost — $113,488,901) | | $ | 112,751,791 | |
Deposits with brokers for centrally cleared swap contracts | | | 823,440 | |
Receivable for securities sold | | | 815,699 | |
Interest and dividends receivable | | | 629,815 | |
Deposits with brokers for open futures contracts | | | 212,508 | |
Receivable from broker — variation margin on open futures contracts | | | 39,399 | |
Principal paydown receivable | | | 27,161 | |
Prepaid expenses | | | 74,777 | |
Other receivables | | | 19,544 | |
Total Assets | | | 115,394,134 | |
| |
| Liabilities: | | | | |
Payable for open reverse repurchase agreements (Note 3) | | | 35,441,916 | |
Payable for securities purchased | | | 727,596 | |
Deposits from brokers for reverse repurchase agreements | | | 247,000 | |
Unrealized depreciation on forward foreign currency contracts | | | 100,549 | |
Payable to broker — variation margin on centrally cleared swaps | | | 96,751 | |
Investment management fee payable | | | 71,760 | |
Interest payable | | | 46,345 | |
Due to custodian | | | 8,267 | |
Directors’ fees payable | | | 1,011 | |
OTC swaps, at value (premiums paid — $127) | | | 952 | |
Payable for open OTC swap contracts | | | 15 | |
Accrued expenses | | | 51,789 | |
Total Liabilities | | | 36,793,951 | |
| Total Net Assets | | $ | 78,600,183 | |
| |
| Net Assets: | | | | |
Par value ($0.001 par value; 4,668,407 shares issued and outstanding; 100,000,000 shares authorized) | | $ | 4,668 | |
Paid-in capital in excess of par value | | | 95,843,104 | |
Overdistributed net investment income | | | (525,876) | |
Accumulated net realized loss on investments, futures contracts, swap contracts and foreign currency transactions | | | (15,894,134) | |
Net unrealized depreciation on investments, futures contracts, swap contracts and foreign currencies | | | (827,579) | |
| Total Net Assets | | $ | 78,600,183 | |
| |
| Shares Outstanding | | | 4,668,407 | |
| |
| Net Asset Value | | | $16.84 | |
See Notes to Financial Statements.
| | |
| 16 | | Western Asset Variable Rate Strategic Fund Inc. 2016 Semi-Annual Report |
Statement of operations (unaudited)
For the Six Months Ended March 31, 2016
| | | | |
| |
| Investment Income: | | | | |
Interest | | $ | 2,734,137 | |
Dividends | | | 56,608 | |
Total Investment Income | | | 2,790,745 | |
| |
| Expenses: | | | | |
Investment management fee (Note 2) | | | 442,090 | |
Interest expense (Note 3) | | | 138,342 | |
Audit and tax fees | | | 41,664 | |
Transfer agent fees | | | 35,335 | |
Legal fees | | | 29,996 | |
Shareholder reports | | | 14,555 | |
Directors’ fees | | | 13,089 | |
Stock exchange listing fees | | | 10,625 | |
Fund accounting fees | | | 5,534 | |
Custody fees | | | 2,763 | |
Insurance | | | 1,308 | |
Miscellaneous expenses | | | 6,764 | |
Total Expenses | | | 742,065 | |
| Net Investment Income | | | 2,048,680 | |
| |
Realized and Unrealized Gain (Loss) on Investments, Futures Contracts,
Swap Contracts and Foreign Currency Transactions (Notes 1, 3 and 4): | | | | |
Net Realized Gain (Loss) From: | | | | |
Investment transactions | | | (2,315,531) | |
Futures contracts | | | 450,321 | |
Swap contracts | | | (1,106,506) | |
Foreign currency transactions | | | 13,836 | |
Net Realized Loss | | | (2,957,880) | |
Change in Net Unrealized Appreciation (Depreciation) From: | | | | |
Investments | | | (404,626) | |
Futures contracts | | | (189,396) | |
Swap contracts | | | (15,912) | |
Foreign currencies | | | (89,190) | |
Change in Net Unrealized Appreciation (Depreciation) | | | (699,124) | |
| Net Loss on Investments, Futures Contracts, Swap Contracts and Foreign Currency Transactions | | | (3,657,004) | |
| Decrease in Net Assets From Operations | | $ | (1,608,324) | |
See Notes to Financial Statements.
| | |
| Western Asset Variable Rate Strategic Fund Inc. 2016 Semi-Annual Report | | 17 |
Statements of changes in net assets
| | | | | | | | |
For the Six Months Ended March 31, 2016 (unaudited) and the Year Ended September 30, 2015 | | 2016 | | | 2015 | |
| | |
| Operations: | | | | | | | | |
Net investment income | | $ | 2,048,680 | | | $ | 4,586,528 | |
Net realized loss | | | (2,957,880) | | | | (3,676,149) | |
Change in net unrealized appreciation (depreciation) | | | (699,124) | | | | (3,807,650) | |
Decrease in Net Assets From Operations | | | (1,608,324) | | | | (2,897,271) | |
| | |
| Distributions to Shareholders From (Note 1): | | | | | | | | |
Net investment income | | | (2,480,925) | | | | (4,355,980) | |
Return of capital | | | — | | | | (1,479,529) | |
Decrease in Net Assets From Distributions to Shareholders | | | (2,480,925) | | | | (5,835,509) | |
| | |
| Fund Share Transactions: | | | | | | | | |
Cost of shares repurchased through tender offer (2,000,746 and 0 shares repurchased, respectively) (Note 6) | | | (34,272,779) | | | | — | |
Decrease in Net Assets From Fund Share Transactions | | | (34,272,779) | | | | — | |
Decrease in Net Assets | | | (38,362,028) | | | | (8,732,780) | |
| | |
| Net Assets: | | | | | | | | |
Beginning of period | | | 116,962,211 | | | | 125,694,991 | |
End of period* | | $ | 78,600,183 | | | $ | 116,962,211 | |
*Includes overdistributed net investment income of: | | | $(525,876) | | | | $(93,631) | |
See Notes to Financial Statements.
| | |
| 18 | | Western Asset Variable Rate Strategic Fund Inc. 2016 Semi-Annual Report |
Statement of cash flows (unaudited)
For the Six Months Ended March 31, 2016
| | | | |
| |
| Increase (Decrease) in Cash: | | | | |
| Cash Provided (Used) by Operating Activities: | |
Net decrease in net assets resulting from operations | | $ | (1,608,324) | |
Adjustments to reconcile net decrease in net assets resulting from operations
to net cash provided (used) by operating activities: | | | | |
Purchases of portfolio securities | | | (17,685,896) | |
Sales of portfolio securities | | | 34,494,055 | |
Net purchases, sales and maturities of short-term investments | | | (2,040,641) | |
Net amortization of premium (accretion of discount) | | | (451,471) | |
Increase in receivable for securities sold | | | (650,191) | |
Decrease in interest and dividends receivable | | | 51,992 | |
Increase in receivable from broker — variation margin on open futures contracts | | | (39,399) | |
Decrease in receivable from broker — variation margin on open centrally cleared swaps | | | 3,099 | |
Increase in prepaid expenses | | | (63,549) | |
Increase in principal paydown receivable | | | (17,955) | |
Increase in other receivables | | | (19,544) | |
Decrease in receivable for open OTC swap contracts | | | 465 | |
Increase in deposits with brokers for open futures contracts | | | (24,003) | |
Increase in deposits with brokers for centrally cleared swap contracts | | | (145,571) | |
Decrease in net premiums paid for OTC swap contracts | | | 16 | |
Decrease in payable for open OTC swap contracts | | | (2,782) | |
Increase in payable for securities purchased | | | 556,490 | |
Decrease in investment management fee payable | | | (9,721) | |
Decrease in Directors’ fees payable | | | (2,351) | |
Increase in interest payable | | | 43,218 | |
Increase in deposits from brokers for reverse repurchase agreements | | | 247,000 | |
Decrease in accrued expenses | | | (58,669) | |
Decrease in payable to broker — variation margin on open futures contracts | | | (7,807) | |
Increase in payable to broker — variation margin on open centrally cleared swap contracts | | | 96,751 | |
Net realized loss on investments | | | 2,315,531 | |
Change in net unrealized appreciation (depreciation) of investments,
OTC swap contracts and forward foreign currency transactions | | | 509,649 | |
Net Cash Provided by Operating Activities* | | | 15,490,392 | |
| |
| Cash Flows From Financing Activities: | | | | |
Distributions paid on common stock | | | (2,480,925) | |
Payment for shares repurchased through tender offer | | | (34,272,779) | |
Increase in payable for open reverse repurchase agreements | | | 24,260,612 | |
Decrease in due to custodian | | | (2,997,300) | |
Net Cash Used in Financing Activities | | | (15,490,392) | |
| Cash at Beginning of Period | | | — | |
| Cash at End of Period | | | — | |
| * | Included in operating expenses is cash of $95,124 paid for interest on borrowings. |
See Notes to Financial Statements.
| | |
| Western Asset Variable Rate Strategic Fund Inc. 2016 Semi-Annual Report | | 19 |
Financial highlights
| | | | | | | | | | | | | | | | | | | | | | | | |
For a share of capital stock outstanding throughout each year ended September 30,
unless otherwise noted: | |
| | | 20161,2 | | | 20151 | | | 20141 | | | 20131 | | | 20121 | | | 20111 | |
| | | | | | |
| Net asset value, beginning of period | | | $17.54 | | | | $18.85 | | | | $18.71 | | | | $18.46 | | | | $16.80 | | | | $17.05 | |
| | | | | | |
| Income (loss) from operations: | | | | | | | | | | | | | | | | | | | | | | | | |
Net investment income | | | 0.39 | | | | 0.69 | | | | 0.78 | | | | 0.78 | | | | 0.90 | | | | 0.86 | |
Net realized and unrealized gain (loss) | | | (0.75) | | | | (1.12) | | | | 0.23 | | | | 0.34 | | | | 1.56 | | | | (0.43) | |
Total income (loss) from operations | | | (0.36) | | | | (0.43) | | | | 1.01 | | | | 1.12 | | | | 2.46 | | | | 0.43 | |
| | | | | | |
| Less distributions from: | | | | | | | | | | | | | | | | | | | | | | | | |
Net investment income | | | (0.47) | 3 | | | (0.66) | | | | (0.87) | | | | (0.87) | | | | (0.80) | | | | (0.64) | |
Net realized gains | | | — | | | | — | | | | — | | | | — | | | | — | | | | (0.04) | |
Return of capital | | | — | | | | (0.22) | | | | — | | | | — | | | | — | | | | — | |
Total distributions | | | (0.47) | | | | (0.88) | | | | (0.87) | | | | (0.87) | | | | (0.80) | | | | (0.68) | |
| Net increase due to shares repurchased through tender offer | | | 0.13 | | | | — | | | | — | | | | — | | | | — | | | | — | |
| | | | | | |
| Net asset value, end of period | | | $16.84 | | | | $17.54 | | | | $18.85 | | | | $18.71 | | | | $18.46 | | | | $16.80 | |
| | | | | | |
| Market price, end of period | | | $15.34 | | | | $15.56 | | | | $17.08 | | | | $17.00 | | | | $18.45 | | | | $15.43 | |
Total return, based on NAV4,5 | | | (1.41) | %6 | | | (2.38) | % | | | 5.47 | % | | | 6.16 | % | | | 15.05 | % | | | 2.45 | % |
Total return, based on Market Price7 | | | 1.56 | % | | | (3.95) | % | | | 5.66 | % | | | (3.25) | % | | | 25.59 | % | | | 1.44 | % |
| | | | | | |
| Net assets, end of period (000s) | | | $78,600 | | | | $116,962 | | | | $125,695 | | | | $124,760 | | | | $122,940 | | | | $111,894 | |
| | | | | | |
| Ratios to average net assets: | | | | | | | | | | | | | | | | | | | | | | | | |
Gross expenses | | | 1.64 | %8 | | | 1.12 | % | | | 1.14 | % | | | 1.08 | % | | | 1.20 | % | | | 0.99 | % |
Net expenses | | | 1.64 | 8 | | | 1.12 | | | | 1.14 | | | | 1.08 | | | | 1.20 | | | | 0.99 | |
Net investment income | | | 4.52 | 8 | | | 3.76 | | | | 4.10 | | | | 4.18 | | | | 5.17 | | | | 4.91 | |
| | | | | | |
| Portfolio turnover rate | | | 15 | % | | | 30 | % | | | 26 | % | | | 21 | % | | | 18 | % | | | 31 | % |
| 1 | Per share amounts have been calculated using the average shares method. |
| 2 | For the six months ended March 31, 2016 (unaudited). |
| 3 | The actual source of the Fund’s current fiscal year distributions may be from net investment income, return of capital or a combination of both. Shareholders will be informed of the tax characteristics of the distributions after the close of the fiscal year. |
| 4 | Performance figures may reflect compensating balance arrangements, fee waivers and/or expense reimbursements. In the absence of compensating balance arrangements, fee waivers and/or expense reimbursements, the total return would have been lower. Past performance is no guarantee of future results. Total returns for periods of less than one year are not annualized. |
| 5 | The total return calculation assumes that distributions are reinvested at NAV. Past performance is no guarantee of future results. Total returns for periods of less than one year are not annualized. |
| 6 | The total return based on NAV reflects the impact of the tender and repurchase of its shares by the Fund at the price equal to 98% of the net asset value per share on November 20, 2015. Absent this tender offer, the total return based on NAV would have been -2.29%. |
| 7 | The total return calculation assumes that distributions are reinvested in accordance with the Fund’s dividend reinvestment plan. Past performance is no guarantee of future results. Total returns for periods of less than one year are not annualized. |
See Notes to Financial Statements.
| | |
| 20 | | Western Asset Variable Rate Strategic Fund Inc. 2016 Semi-Annual Report |
Notes to financial statements (unaudited)
1. Organization and significant accounting policies
Western Asset Variable Rate Strategic Fund Inc. (the “Fund”) was incorporated in Maryland on August 3, 2004 and is registered as a non-diversified, closed-end management investment company under the Investment Company Act of 1940, as amended (the “1940 Act”). The Board of Directors authorized 100 million shares of $0.001 par value common stock. The Fund’s primary investment objective is to maintain a high level of current income. The Fund invests primarily in variable rate instruments of U.S. and non-U.S. issuers, including U.S. and non-U.S. investment grade and high-yield debt, senior loans, emerging market debt and derivatives related to these securities.
The following are significant accounting policies consistently followed by the Fund and are in conformity with U.S. generally accepted accounting principles (“GAAP”). Estimates and assumptions are required to be made regarding assets, liabilities and changes in net assets resulting from operations when financial statements are prepared. Changes in the economic environment, financial markets and any other parameters used in determining these estimates could cause actual results to differ. Subsequent events have been evaluated through the date the financial statements were issued.
(a) Investment valuation. The valuations for fixed income securities (which may include, but are not limited to, corporate, government, municipal, mortgage-backed, collateralized mortgage obligations and asset-backed securities) and certain derivative instruments are typically the prices supplied by independent third party pricing services, which may use market prices or broker/dealer quotations or a variety of valuation techniques and methodologies. The independent third party pricing services use inputs that are observable such as issuer details, interest rates, yield curves, prepayment speeds, credit risks/spreads, default rates and quoted prices for similar securities. Short-term fixed income securities that will mature in 60 days or less are valued at amortized cost, unless it is determined that using this method would not reflect an investment’s fair value. Investments in open-end funds are valued at the closing net asset value per share of each fund on the day of valuation. Futures contracts are valued daily at the settlement price established by the board of trade or exchange on which they are traded. Equity securities for which market quotations are available are valued at the last reported sales price or official closing price on the primary market or exchange on which they trade. When the Fund holds securities or other assets that are denominated in a foreign currency, the Fund will normally use the currency exchange rates as of 4:00 p.m. (Eastern Time). If independent third party pricing services are unable to supply prices for a portfolio investment, or if the prices supplied are deemed by the manager to be unreliable, the market price may be determined by the manager using quotations from one or more broker/dealers or at the transaction price if the security has recently been purchased and no value has yet been obtained from a pricing service or pricing broker. When reliable prices are not readily available, such as when the value of a security has been significantly affected by events after the close of the exchange or market on which the security is principally traded, but before the Fund calculates its net asset value, the Fund values these securities as determined in accordance with procedures approved by the Fund’s Board of Directors.
| | |
| Western Asset Variable Rate Strategic Fund Inc. 2016 Semi-Annual Report | | 21 |
Notes to financial statements (unaudited) (cont’d)
The Board of Directors is responsible for the valuation process and has delegated the supervision of the daily valuation process to the Legg Mason North Atlantic Fund Valuation Committee (the “Valuation Committee”). The Valuation Committee, pursuant to the policies adopted by the Board of Directors, is responsible for making fair value determinations, evaluating the effectiveness of the Fund’s pricing policies, and reporting to the Board of Directors. When determining the reliability of third party pricing information for investments owned by the Fund, the Valuation Committee, among other things, conducts due diligence reviews of pricing vendors, monitors the daily change in prices and reviews transactions among market participants.
The Valuation Committee will consider pricing methodologies it deems relevant and appropriate when making fair value determinations. Examples of possible methodologies include, but are not limited to, multiple of earnings; discount from market of a similar freely traded security; discounted cash-flow analysis; book value or a multiple thereof; risk premium/yield analysis; yield to maturity; and/or fundamental investment analysis. The Valuation Committee will also consider factors it deems relevant and appropriate in light of the facts and circumstances. Examples of possible factors include, but are not limited to, the type of security; the issuer’s financial statements; the purchase price of the security; the discount from market value of unrestricted securities of the same class at the time of purchase; analysts’ research and observations from financial institutions; information regarding any transactions or offers with respect to the security; the existence of merger proposals or tender offers affecting the security; the price and extent of public trading in similar securities of the issuer or comparable companies; and the existence of a shelf registration for restricted securities.
For each portfolio security that has been fair valued pursuant to the policies adopted by the Board of Directors, the fair value price is compared against the last available and next available market quotations. The Valuation Committee reviews the results of such back testing monthly and fair valuation occurrences are reported to the Board of Directors quarterly.
The Fund uses valuation techniques to measure fair value that are consistent with the market approach and/or income approach, depending on the type of security and the particular circumstance. The market approach uses prices and other relevant information generated by market transactions involving identical or comparable securities. The income approach uses valuation techniques to discount estimated future cash flows to present value.
GAAP establishes a disclosure hierarchy that categorizes the inputs to valuation techniques used to value assets and liabilities at measurement date. These inputs are summarized in the three broad levels listed below:
| • | | Level 1 — quoted prices in active markets for identical investments |
| • | | Level 2 — other significant observable inputs (including quoted prices for similar investments, interest rates, prepayment speeds, credit risk, etc.) |
| • | | Level 3 — significant unobservable inputs (including the Fund’s own assumptions in determining the fair value of investments) |
| | |
| 22 | | Western Asset Variable Rate Strategic Fund Inc. 2016 Semi-Annual Report |
The inputs or methodologies used to value securities are not necessarily an indication of the risk associated with investing in those securities.
The following is a summary of the inputs used in valuing the Fund’s assets and liabilities carried at fair value:
| | | | | | | | | | | | | | | | |
| ASSETS | |
| Description | | Quoted Prices
(Level 1) | | | Other Significant
Observable Inputs
(Level 2) | | | Significant
Unobservable
Inputs
(Level 3) | | | Total | |
| Long-Term Investments†: | | | | | | | | | | | | | | | | |
Collateralized Mortgage Obligations | | | — | | | $ | 38,467,419 | | | | — | | | $ | 38,467,419 | |
Asset-Backed Securities | | | — | | | | 29,058,376 | | | | — | | | | 29,058,376 | |
Corporate Bonds & Notes: | | | | | | | | | | | | | | | | |
Industrials | | | — | | | | 2,081,074 | | | $ | 31,291 | | | | 2,112,365 | |
Other Corporate Bonds & Notes | | | — | | | | 29,671,946 | | | | — | | | | 29,671,946 | |
Mortgage-Backed Securities | | | — | | | | 2,184,594 | | | �� | — | | | | 2,184,594 | |
Municipal Bonds | | | — | | | | 378,980 | | | | — | | | | 378,980 | |
Senior Loans | | | — | | | | 2,743,116 | | | | — | | | | 2,743,116 | |
Sovereign Bonds | | | — | | | | 3,638,902 | | | | — | | | | 3,638,902 | |
U.S. Government & Agency Obligations | | | — | | | | 302,291 | | | | — | | | | 302,291 | |
Common Stocks: | | | | | | | | | | | | | | | | |
Industrials | | | — | | | | — | | | | 16,931 | | | | 16,931 | |
Telecommunication Services | | | — | | | | 43,440 | | | | — | | | | 43,440 | |
Preferred Stocks | | $ | 2,092,790 | | | | — | | | | — | | | | 2,092,790 | |
| Total Long-Term Investments | | $ | 2,092,790 | | | $ | 108,570,138 | | | $ | 48,222 | | | $ | 110,711,150 | |
| Short-Term Investments† | | | 2,040,641 | | | | — | | | | — | | | | 2,040,641 | |
| Total Investments | | $ | 4,133,431 | | | $ | 108,570,138 | | | $ | 48,222 | | | $ | 112,751,791 | |
| Other Financial Instruments: | | | | | | | | | | | | | | | | |
Futures Contracts | | | 14,182 | | | | — | | | | — | | | | 14,182 | |
Centrally Cleared Interest Rate Swaps | | | — | | | | 61,829 | | | | — | | | | 61,829 | |
| Total Other Financial Instruments | | $ | 14,182 | | | $ | 61,829 | | | | — | | | $ | 76,011 | |
| Total | | $ | 4,147,613 | | | $ | 108,631,967 | | | $ | 48,222 | | | $ | 112,827,802 | |
|
| LIABILITIES | |
| Description | | Quoted Prices
(Level 1) | | | Other Significant
Observable Inputs
(Level 2) | | | Significant
Unobservable
Inputs
(Level 3) | | | Total | |
| Other Financial Instruments: | | | | | | | | | | | | | | | | |
Futures Contracts | | $ | 69,591 | | | | — | | | | — | | | $ | 69,591 | |
Forward Foreign Currency Contracts | | | — | | | $ | 100,549 | | | | — | | | | 100,549 | |
OTC Credit Default Swaps on Corporate Issues — Buy Protection‡ | | | — | | | | 952 | | | | — | | | | 952 | |
| Total | | $ | 69,591 | | | $ | 101,501 | | | | — | | | $ | 171,092 | |
| † | See Schedule of Investments for additional detailed categorizations. |
| ‡ | Value includes any premium paid or received with respect to swap contracts. |
| | |
| Western Asset Variable Rate Strategic Fund Inc. 2016 Semi-Annual Report | | 23 |
Notes to financial statements (unaudited) (cont’d)
(b) Repurchase agreements. The Fund may enter into repurchase agreements with institutions that its subadviser has determined are creditworthy. Each repurchase agreement is recorded at cost. Under the terms of a typical repurchase agreement, the Fund acquires a debt security subject to an obligation of the seller to repurchase, and of the Fund to resell, the security at an agreed-upon price and time, thereby determining the yield during the Fund’s holding period. When entering into repurchase agreements, it is the Fund’s policy that its custodian or a third party custodian, acting on the Fund’s behalf, take possession of the underlying collateral securities, the market value of which, at all times, at least equals the principal amount of the repurchase transaction, including accrued interest. To the extent that any repurchase transaction maturity exceeds one business day, the value of the collateral is marked-to-market and measured against the value of the agreement in an effort to ensure the adequacy of the collateral. If the counterparty defaults, the Fund generally has the right to use the collateral to satisfy the terms of the repurchase transaction. However, if the market value of the collateral declines during the period in which the Fund seeks to assert its rights or if bankruptcy proceedings are commenced with respect to the seller of the security, realization of the collateral by the Fund may be delayed or limited.
(c) Reverse repurchase agreements. The Fund may enter into reverse repurchase agreements. Under the terms of a typical reverse repurchase agreement, a fund sells a security subject to an obligation to repurchase the security from the buyer at an agreed-upon time and price. In the event the buyer of securities under a reverse repurchase agreement files for bankruptcy or becomes insolvent, the Fund’s use of the proceeds of the agreement may be restricted pending a determination by the counterparty, or its trustee or receiver, whether to enforce the Fund’s obligation to repurchase the securities. In entering into reverse repurchase agreements, the Fund will maintain cash, U.S. government securities or other liquid debt obligations at least equal in value to its obligations with respect to reverse repurchase agreements or will take other actions permitted by law to cover its obligations. If the market value of the collateral declines during the period, the Fund may be required to post additional collateral to cover its obligation. Cash collateral that has been pledged to cover obligations of the Fund under reverse repurchase agreements, if any, will be reported separately in the Statement of Assets and Liabilities. Securities pledged as collateral are noted in the Schedule of Investments. Interest payments made on reverse repurchase agreements are recognized as a component of “Interest expense” on the Statement of Operations. In periods of increased demand for the security, the Fund may receive a fee for use of the security by the counterparty, which may result in interest income to the Fund.
(d) Futures contracts. The Fund uses futures contracts generally to gain exposure to, or hedge against, changes in interest rates or gain exposure to, or hedge against, changes in certain asset classes. A futures contract represents a commitment for the future purchase or sale of an asset at a specified price on a specified date.
| | |
| 24 | | Western Asset Variable Rate Strategic Fund Inc. 2016 Semi-Annual Report |
Upon entering into a futures contract, the Fund is required to deposit cash or cash equivalents with a broker in an amount equal to a certain percentage of the contract amount. This is known as the ‘‘initial margin’’ and subsequent payments (‘‘variation margin’’) are made or received by the Fund each day, depending on the daily fluctuation in the value of the contract. For certain futures, including foreign denominated futures, variation margin is not settled daily, but is recorded as a net variation margin payable or receivable. The daily changes in contract value are recorded as unrealized gains or losses in the Statement of Operations and the Fund recognizes a realized gain or loss when the contract is closed.
Futures contracts involve, to varying degrees, risk of loss in excess of the amounts reflected in the financial statements. In addition, there is the risk that the Fund may not be able to enter into a closing transaction because of an illiquid secondary market.
(e) Swap agreements. The Fund invests in swaps for the purpose of managing its exposure to interest rate, credit or market risk, or for other purposes. The use of swaps involves risks that are different from those associated with other portfolio transactions. Swap agreements are privately negotiated in the over-the-counter market and may be entered into as a bilateral contract (“OTC Swaps”) or centrally cleared (“Centrally Cleared Swaps”). Unlike Centrally Cleared Swaps, the Fund has credit exposure to the counterparties of OTC Swaps.
In a Centrally Cleared Swap, immediately following execution of the swap, the swap agreement is submitted to a clearinghouse or central counterparty (the “CCP”) and the CCP becomes the ultimate counterparty of the swap agreement. The Fund is required to interface with the CCP through a broker, acting in an agency capacity. All payments are settled with the CCP through the broker. Upon entering into a Centrally Cleared Swap, the Fund is required to deposit initial margin with the broker in the form of cash or securities.
Swap contracts are marked-to-market daily and changes in value are recorded as unrealized appreciation (depreciation). The daily change in valuation of Centrally Cleared Swaps, if any, is recorded as a receivable or payable for variation margin on the Statement of Assets and Liabilities. Gains or losses are realized upon termination of the swap agreement. Collateral, in the form of restricted cash or securities, may be required to be held in segregated accounts with the Fund’s custodian in compliance with the terms of the swap contracts. Securities posted as collateral for swap contracts are identified in the Schedule of Investments and restricted cash, if any, is identified on the Statement of Assets and Liabilities. Risks may exceed amounts recorded in the Statement of Assets and Liabilities. These risks include changes in the returns of the underlying instruments, failure of the counterparties to perform under the contracts’ terms, and the possible lack of liquidity with respect to the swap agreements.
OTC swap payments received or made at the beginning of the measurement period are reflected as a premium or deposit, respectively, on the Statement of Assets and Liabilities. These upfront payments are amortized over the life of the swap and are recognized as realized gain or loss in the Statement of Operations. Net periodic payments received or paid by the Fund are recognized as a realized gain or loss in the Statement of Operations.
| | |
| Western Asset Variable Rate Strategic Fund Inc. 2016 Semi-Annual Report | | 25 |
Notes to financial statements (unaudited) (cont’d)
The Fund’s maximum exposure in the event of a defined credit event on a credit default swap to sell protection is the notional amount. As of March 31, 2016, the Fund did not hold any credit default swaps to sell protection.
For average notional amounts of swaps held during the six months ended March 31, 2016, see Note 4.
Credit default swaps
The Fund enters into credit default swap (“CDS”) contracts for investment purposes, to manage its credit risk or to add leverage. CDS agreements involve one party making a stream of payments to another party in exchange for the right to receive a specified return in the event of a default by a third party, typically corporate or sovereign issuers, on a specified obligation, or in the event of a write-down, principal shortfall, interest shortfall or default of all or part of the referenced entities comprising a credit index. The Fund may use a CDS to provide protection against defaults of the issuers (i.e., to reduce risk where the Fund has exposure to an issuer) or to take an active long or short position with respect to the likelihood of a particular issuer’s default. As a seller of protection, the Fund generally receives an upfront payment or a stream of payments throughout the term of the swap provided that there is no credit event. If the Fund is a seller of protection and a credit event occurs, as defined under the terms of that particular swap agreement, the maximum potential amount of future payments (undiscounted) that the Fund could be required to make under a credit default swap agreement would be an amount equal to the notional amount of the agreement. These amounts of potential payments will be partially offset by any recovery of values from the respective referenced obligations. As a seller of protection, the Fund effectively adds leverage to its portfolio because, in addition to its total net assets, the Fund is subject to investment exposure on the notional amount of the swap. As a buyer of protection, the Fund generally receives an amount up to the notional value of the swap if a credit event occurs.
Implied spreads are the theoretical prices a lender receives for credit default protection. When spreads rise, market perceived credit risk rises and when spreads fall, market perceived credit risk falls. The implied credit spread of a particular referenced entity reflects the cost of buying/selling protection and may include upfront payments required to enter into the agreement. Wider credit spreads and decreasing market values, when compared to the notional amount of the swap, represent a deterioration of the referenced entity’s credit soundness and a greater likelihood or risk of default or other credit event occurring as defined under the terms of the agreement. Credit spreads utilized in determining the period end market value of credit default swap agreements on corporate or sovereign issues are disclosed in the Notes to Financial Statements and serve as an indicator of the current status of the payment/performance risk and represent the likelihood or risk of default for credit derivatives. For credit default swap agreements on asset-backed securities and credit indices, the quoted market prices and resulting values, particularly in relation to the notional amount of the contract as well as the annual payment rate, serve as an indication of the current status of the payment/performance risk.
| | |
| 26 | | Western Asset Variable Rate Strategic Fund Inc. 2016 Semi-Annual Report |
The Fund’s maximum risk of loss from counterparty risk, as the protection buyer, is the fair value of the contract (this risk is mitigated by the posting of collateral by the counterparty to the Fund to cover the Fund’s exposure to the counterparty). As the protection seller, the Fund’s maximum risk is the notional amount of the contract. Credit default swaps are considered to have credit risk-related contingent features since they require payment by the protection seller to the protection buyer upon the occurrence of a defined credit event.
Entering into a CDS agreement involves, to varying degrees, elements of credit, market and documentation risk in excess of the related amounts recognized on the Statement of Assets and Liabilities. Such risks involve the possibility that there will be no liquid market for these agreements, that the counterparty to the agreement may default on its obligation to perform or disagree as to the meaning of the contractual terms in the agreement, and that there will be unfavorable changes in net interest rates.
Interest rate swaps
The Fund enters into interest rate swap contracts to manage its exposure to interest rate risk. Interest rate swaps are agreements between two parties to exchange cash flows based on a notional principal amount. The Fund may elect to pay a fixed rate and receive a floating rate, or receive a fixed rate and pay a floating rate, on a notional principal amount. Interest rate swaps are marked-to-market daily based upon quotations from market makers and the change, if any, is recorded as an unrealized gain or loss in the Statement of Operations. When a swap contract is terminated early, the Fund records a realized gain or loss equal to the difference between the original cost and the settlement amount of the closing transaction.
The risks of interest rate swaps include changes in market conditions that will affect the value of the contract or changes in the present value of the future cash flow streams and the possible inability of the counterparty to fulfill its obligations under the agreement. The Fund’s maximum risk of loss from counterparty credit risk is the discounted net value of the cash flows to be received from the counterparty over the contract’s remaining life, to the extent that amount is positive. This risk is mitigated by the posting of collateral by the counterparty to the Fund to cover the Fund’s exposure to the counterparty.
(f) Stripped securities. The Fund may invest in ‘‘Stripped Securities,’’ a term used collectively for components, or strips, of fixed income securities. Stripped securities can be principal only securities (“PO”), which are debt obligations that have been stripped of unmatured interest coupons, or interest only securities (“IO”), which are unmatured interest coupons that have been stripped from debt obligations. The market value of Stripped Securities will fluctuate in response to changes in economic conditions, rates of pre-payment, interest rates and the market’s perception of the securities. However, fluctuations in response to interest rates may be greater in Stripped Securities than for debt obligations of comparable maturities that pay interest currently. The amount of fluctuation may increase with a longer period of maturity.
| | |
| Western Asset Variable Rate Strategic Fund Inc. 2016 Semi-Annual Report | | 27 |
Notes to financial statements (unaudited) (cont’d)
The yield to maturity on IO’s is sensitive to the rate of principal repayments (including prepayments) on the related underlying debt obligation and principal payments may have a material effect on yield to maturity. If the underlying debt obligation experiences greater than anticipated prepayments of principal, the Fund may not fully recoup its initial investment in IO’s.
(g) Forward foreign currency contracts. The Fund enters into a forward foreign currency contract to hedge against foreign currency exchange rate risk on its non-U.S. dollar denominated securities or to facilitate settlement of a foreign currency denominated portfolio transaction. A forward foreign currency contract is an agreement between two parties to buy and sell a currency at a set price with delivery and settlement at a future date. The contract is marked-to-market daily and the change in value is recorded by the Fund as an unrealized gain or loss. When a forward foreign currency contract is closed, through either delivery or offset by entering into another forward foreign currency contract, the Fund recognizes a realized gain or loss equal to the difference between the value of the contract at the time it was opened and the value of the contract at the time it is closed.
Forward foreign currency contracts involve elements of market risk in excess of the amounts reflected on the Statement of Assets and Liabilities. The Fund bears the risk of an unfavorable change in the foreign exchange rate underlying the forward foreign currency contract. Risks may also arise upon entering into these contracts from the potential inability of the counterparties to meet the terms of their contracts.
(h) Foreign currency translation. Investment securities and other assets and liabilities denominated in foreign currencies are translated into U.S. dollar amounts based upon prevailing exchange rates on the date of valuation. Purchases and sales of investment securities and income and expense items denominated in foreign currencies are translated into U.S. dollar amounts based upon prevailing exchange rates on the respective dates of such transactions.
The Fund does not isolate that portion of the results of operations resulting from fluctuations in foreign exchange rates on investments from the fluctuations arising from changes in market prices of securities held. Such fluctuations are included with the net realized and unrealized gain or loss on investments.
Net realized foreign exchange gains or losses arise from sales of foreign currencies, including gains and losses on forward foreign currency contracts, currency gains or losses realized between the trade and settlement dates on securities transactions, and the difference between the amounts of dividends, interest, and foreign withholding taxes recorded on the Fund’s books and the U.S. dollar equivalent of the amounts actually received or paid. Net unrealized foreign exchange gains and losses arise from changes in the values of assets and liabilities, other than investments in securities, on the date of valuation, resulting from changes in exchange rates.
Foreign security and currency transactions may involve certain considerations and risks not typically associated with those of U.S. dollar denominated transactions as a result of,
| | |
| 28 | | Western Asset Variable Rate Strategic Fund Inc. 2016 Semi-Annual Report |
among other factors, the possibility of lower levels of governmental supervision and regulation of foreign securities markets and the possibility of political or economic instability.
(i) Loan participations. The Fund may invest in loans arranged through private negotiation between one or more financial institutions. The Fund’s investment in any such loan may be in the form of a participation in or an assignment of the loan. In connection with purchasing participations, the Fund generally will have no right to enforce compliance by the borrower with the terms of the loan agreement related to the loan, or any rights of off-set against the borrower and the Fund may not benefit directly from any collateral supporting the loan in which it has purchased the participation.
The Fund assumes the credit risk of the borrower, the lender that is selling the participation and any other persons interpositioned between the Fund and the borrower. In the event of the insolvency of the lender selling the participation, the Fund may be treated as a general creditor of the lender and may not benefit from any off-set between the lender and the borrower.
(j) Cash flow information. The Fund invests in securities and distributes dividends from net investment income and net realized gains, which are paid in cash and may be reinvested at the discretion of shareholders. These activities are reported in the Statement of Changes in Net Assets and additional information on cash receipts and cash payments is presented in the Statement of Cash Flows.
(k) Counterparty risk and credit-risk-related contingent features of derivative instruments. The Fund may invest in certain securities or engage in other transactions, where the Fund is exposed to counterparty credit risk in addition to broader market risks. The Fund may invest in securities of issuers, which may also be considered counterparties as trading partners in other transactions. This may increase the risk of loss in the event of default or bankruptcy by the counterparty or if the counterparty otherwise fails to meet its contractual obligations. The Fund’s subadviser attempts to mitigate counterparty risk by (i) periodically assessing the creditworthiness of its trading partners, (ii) monitoring and/or limiting the amount of its net exposure to each individual counterparty based on its assessment and (iii) requiring collateral from the counterparty for certain transactions. Market events and changes in overall economic conditions may impact the assessment of such counterparty risk by the subadviser. In addition, declines in the values of underlying collateral received may expose the Fund to increased risk of loss.
The Fund has entered into master agreements with certain of its derivative counterparties that provide for general obligations, representations, agreements, collateral, events of default or termination and credit related contingent features. The credit related contingent features include, but are not limited to, a percentage decrease in the Fund’s net assets or NAV over a specified period of time. If these credit related contingent features were triggered, the derivatives counterparty could terminate the positions and demand payment or require additional collateral.
| | |
| Western Asset Variable Rate Strategic Fund Inc. 2016 Semi-Annual Report | | 29 |
Notes to financial statements (unaudited) (cont’d)
Collateral requirements differ by type of derivative. Collateral or margin requirements are set by the broker or exchange clearinghouse for exchange traded derivatives while collateral terms are contract specific for over-the-counter traded derivatives. Cash collateral that has been pledged to cover obligations of the Fund under derivative contracts, if any, will be reported separately in the Statement of Assets and Liabilities. Securities pledged as collateral, if any, for the same purpose are noted in the Schedule of Investments.
Absent an event of default by the counterparty or a termination of the agreement, the terms of the master agreements do not result in an offset of reported amounts of financial assets and financial liabilities in the Statement of Assets and Liabilities across transactions between the Fund and the applicable counterparty. The enforceability of the right to offset may vary by jurisdiction.
As of March 31, 2016, the Fund held forward foreign currency contracts and OTC credit default swaps with credit related contingent features which had a liability position of $101,501. If a contingent feature in the master agreements would have been triggered, the Fund would have been required to pay this amount to its derivatives counterparties.
(l) Credit and market risk. The Fund invests in high-yield and emerging market instruments that are subject to certain credit and market risks. The yields of high-yield and emerging market debt obligations reflect, among other things, perceived credit and market risks. The Fund’s investments in securities rated below investment grade typically involve risks not associated with higher rated securities including, among others, greater risk related to timely and ultimate payment of interest and principal, greater market price volatility and less liquid secondary market trading. The consequences of political, social, economic or diplomatic changes may have disruptive effects on the market prices of investments held by the Fund. The Fund’s investments in non-U.S. dollar denominated securities may also result in foreign currency losses caused by devaluations and exchange rate fluctuations.
Investments in securities that are collateralized by real estate mortgages are subject to certain credit and liquidity risks. When market conditions result in an increase in default rates of the underlying mortgages and the foreclosure values of underlying real estate properties are materially below the outstanding amount of these underlying mortgages, collection of the full amount of accrued interest and principal on these investments may be doubtful. Such market conditions may significantly impair the value and liquidity of these investments and may result in a lack of correlation between their credit ratings and values.
(m) Foreign investment risks. The Fund’s investments in foreign securities may involve risks not present in domestic investments. Since securities may be denominated in foreign currencies, may require settlement in foreign currencies or pay interest or dividends in foreign currencies, changes in the relationship of these foreign currencies to the U.S. dollar can significantly affect the value of the investments and earnings of the Fund. Foreign investments may also subject the Fund to foreign government exchange restrictions, expropriation, taxation or other political, social or economic developments, all of which affect the market and/or credit risk of the investments.
| | |
| 30 | | Western Asset Variable Rate Strategic Fund Inc. 2016 Semi-Annual Report |
(n) Other risks. Consistent with its objective to seek high current income, the Fund may invest in instruments whose values and interest rates are linked to foreign currencies, interest rates, indices or some other financial indicator. The value at maturity or interest rates for these instruments will increase or decrease according to the change in the indicator to which they are indexed, amongst other factors. These securities are generally more volatile in nature, and the risk of loss of principal may be greater.
(o) Security transactions and investment income. Security transactions are accounted for on a trade date basis. Interest income, adjusted for amortization of premium and accretion of discount, is recorded on the accrual basis. Paydown gains and losses on mortgage- and asset-backed securities are recorded as adjustments to interest income. Dividend income is recorded on the ex-dividend date. Foreign dividend income is recorded on the ex-dividend date or as soon as practicable after the Fund determines the existence of a dividend declaration after exercising reasonable due diligence. The cost of investments sold is determined by use of the specific identification method. To the extent any issuer defaults or a credit event occurs that impacts the issuer, the Fund may halt any additional interest income accruals and consider the realizability of interest accrued up to the date of default or credit event.
(p) Distributions to shareholders. Distributions from net investment income of the Fund, if any, are declared quarterly and paid on a monthly basis. The actual source of the Fund’s monthly distributions may be from net investment income, return of capital or a combination of both. Shareholders will be informed of the tax characteristics of the distributions after the close of the fiscal year. Distributions of net realized gains, if any, are declared at least annually. Distributions to shareholders of the Fund are recorded on the ex-dividend date and are determined in accordance with income tax regulations, which may differ from GAAP.
(q) Compensating balance arrangements. The Fund has an arrangement with its custodian bank whereby a portion of the custodian’s fees is paid indirectly by credits earned on the Fund’s cash on deposit with the bank.
(r) Federal and other taxes. It is the Fund’s policy to comply with the federal income and excise tax requirements of the Internal Revenue Code of 1986 (the “Code”), as amended, applicable to regulated investment companies. Accordingly, the Fund intends to distribute its taxable income and net realized gains, if any, to shareholders in accordance with timing requirements imposed by the Code. Therefore, no federal or state income tax provision is required in the Fund’s financial statements.
Management has analyzed the Fund’s tax positions taken on income tax returns for all open tax years and has concluded that as of September 30, 2015, no provision for income tax is required in the Fund’s financial statements. The Fund’s federal and state income and federal excise tax returns for tax years for which the applicable statutes of limitations have not expired are subject to examination by the Internal Revenue Service and state departments of revenue.
| | |
| Western Asset Variable Rate Strategic Fund Inc. 2016 Semi-Annual Report | | 31 |
Notes to financial statements (unaudited) (cont’d)
Under the applicable foreign tax laws, a withholding tax may be imposed on interest, dividends and capital gains at various rates.
(s) Reclassification. GAAP requires that certain components of net assets be reclassified to reflect permanent differences between financial and tax reporting. These reclassifications have no effect on net assets or net asset value per share.
2. Investment management agreement and other transactions with affiliates
Legg Mason Partners Fund Advisor, LLC (“LMPFA”) is the Fund’s investment manager. Western Asset Management Company (“Western Asset”), Western Asset Management Company Limited (“Western Asset Limited”) and Western Asset Management Company Pte. Ltd. (“Western Singapore”) are the Fund’s subadvisers. LMPFA, Western Asset, Western Asset Limited and Western Singapore are wholly-owned subsidiaries of Legg Mason, Inc. (“Legg Mason”).
LMPFA provides administrative and certain oversight services to the Fund. The Fund pays an investment management fee, calculated daily and paid monthly, at an annual rate of 0.75% of the Fund’s average daily net assets plus the proceeds of any outstanding borrowings used for leverage and any proceeds from the issuance of preferred stocks.
LMPFA delegates to Western Asset the day-to-day portfolio management of the Fund. Western Asset Limited and Western Singapore provide certain subadvisory services to the Fund relating to currency transactions and investments in non-U.S. dollar denominated debt securities. Western Asset Limited and Western Singapore do not receive any compensation from the Fund. For its services, LMPFA pays Western Asset 70% of the net management fee it receives from the Fund. In turn, Western Asset pays Western Asset Limited and Western Singapore a subadvisory fee of 0.30% on the assets managed by each subadviser.
During periods in which the Fund utilizes financial leverage, the fees paid to LMPFA will be higher than if the Fund did not utilize leverage because the fees are calculated as a percentage of the Fund’s assets, including those investments purchased with leverage.
All officers and one Director of the Fund are employees of Legg Mason or its affiliates and do not receive compensation from the Fund.
3. Investments
During the six months ended March 31, 2016, the aggregate cost of purchases and proceeds from sales of investments (excluding short-term investments) and U.S. Government & Agency Obligations were as follows:
| | | | | | | | |
| | | Investments | | | U.S. Government &
Agency Obligations | |
| Purchases | | $ | 17,382,786 | | | $ | 303,110 | |
| Sales | | | 34,331,931 | | | | 162,124 | |
| | |
| 32 | | Western Asset Variable Rate Strategic Fund Inc. 2016 Semi-Annual Report |
At March 31, 2016, the aggregate gross unrealized appreciation and depreciation of investments for federal income tax purposes were substantially as follows:
| | | | |
| Gross unrealized appreciation | | $ | 4,880,916 | |
| Gross unrealized depreciation | | | (5,618,026) | |
| Net unrealized depreciation | | $ | (737,110) | |
Transactions in reverse repurchase agreements for the Fund during the six months ended March 31, 2016 were as follows:
| | | | |
Average Daily
Balance* | | Weighted Average
Interest Rate* | | Maximum Amount
Outstanding |
| $27,018,144 | | 1.024% | | $36,689,960 |
| * | Averages based on the number of days that Fund had reverse repurchase agreements outstanding. |
Interest rates on reverse repurchase agreements ranged from 0.250% to 2.232% during the six months ended March 31, 2016. Interest expense incurred on reverse repurchase agreements totaled $138,342.
At March 31, 2016, the Fund had the following open reverse repurchase agreements:
| | | | | | | | | | | | | | | | | | | | |
| Counterparty | | Rate | | | Effective
Date | | | Maturity
Date | | Face Amount
of Reverse
Repurchase
Agreements | | | Asset Class of Collateral* | | Collateral Value | |
| Barclays Capital Inc. | | | 1.800% | | | | 2/22/16 | | | TBD** | | $ | 256,088 | | | Sovereign bonds | | $ | 343,225 | |
| Barclays Capital Inc. | | | 1.850% | | | | 2/22/16 | | | TBD** | | | 203,100 | | | Corporate bonds & notes | | | 244,584 | |
| Barclays Capital Inc. | | | 1.950% | | | | 2/22/16 | | | TBD** | | | 1,203,050 | | | Corporate bonds & notes | | | 1,708,542 | |
| Barclays Capital Inc. | | | 2.083% | | | | 3/29/16 | | | 4/29/16 | | | 2,311,000 | | | Asset-backed securities | | | 2,635,826 | |
| | | | | | Collateralized mortgage obligations | | | 1,039,230 | |
| Deutsche Bank AG | | | 0.680% | | | | 3/22/16 | | | 6/22/16 | | | 8,348,231 | | | Collateralized mortgage obligations | | | 6,789,140 | |
| | | | | | Mortgage-backed securities | | | 2,184,594 | |
| Deutsche Bank AG | | | 1.378% | | | | 3/22/16 | | | 4/22/16 | | | 2,060,843 | | | Collateralized mortgage obligations | | | 2,720,157 | |
| Morgan Stanley | | | 1.250% | | | | 1/25/16 | | | 4/19/16 | | | 220,300 | | | Corporate bonds & notes | | | 240,355 | |
| Morgan Stanley | | | 1.250% | | | | 1/25/16 | | | 4/25/16 | | | 8,107,700 | | | Corporate bonds & notes | | | 8,903,235 | |
| Morgan Stanley | | | 1.250% | | | | 2/12/16 | | | 5/12/16 | | | 2,757,452 | | | Corporate bonds & notes | | | 3,132,750 | |
| Morgan Stanley | | | 1.500% | | | | 3/16/16 | | | 4/15/16 | | | 921,900 | | | Corporate bonds & notes | | | 1,260,337 | |
| Royal Bank of Canada | | | 1.070% | | | | 1/4/16 | | | 4/4/16 | | | 3,497,802 | | | Corporate bonds & notes | | | 3,820,878 | |
| Royal Bank of Canada | | | 1.090% | | | | 3/14/16 | | | 4/1/16 | | | 365,000 | | | — | | | — | |
| Royal Bank of Canada | | | 1.090% | | | | 3/14/16 | | | 6/13/16 | | | 2,035,950 | | | Corporate bonds & notes | | | 2,225,282 | |
| Royal Bank of Canada | | | 1.100% | | | | 1/25/16 | | | 4/25/16 | | | 412,500 | | | Corporate bonds & notes | | | 448,092 | |
| Royal Bank of Canada | | | 1.300% | | | | 1/25/16 | | | 4/25/16 | | | 1,112,000 | | | Corporate bonds & notes | | | 1,421,060 | |
| Royal Bank of Canada | | | 1.940% | | | | 3/16/16 | | | 6/16/16 | | | 599,000 | | | Collateralized mortgage obligations | | | 757,872 | |
| Royal Bank of Canada | | | 1.990% | | | | 3/16/16 | | | 6/16/16 | | | 580,000 | | | Asset-backed securities | | | 816,091 | |
| Royal Bank of Canada | | | 2.140% | | | | 3/16/16 | | | 6/16/16 | | | 450,000 | | | Collateralized mortgage obligations | | | 649,462 | |
| | | | | | | | | | | | | $ | 35,441,916 | | | | | $ | 41,340,712 | |
| * | Refer to the Schedule of Investments for positions held at the counterparty as collateral for reverse repurchase agreements. |
| ** | TBD — To Be Determined; These reverse repurchase agreements have no maturity dates because they are renewed daily and can be terminated by either the Fund or the counterparty in accordance with the terms of the agreements. |
| | |
| Western Asset Variable Rate Strategic Fund Inc. 2016 Semi-Annual Report | | 33 |
Notes to financial statements (unaudited) (cont’d)
At March 31, 2016, the Fund had the following open futures contracts:
| | | | | | | | | | | | | | | | | | | | |
| | | Number of
Contracts | | | Expiration
Date | | | Basis
Value | | | Market
Value | | | Unrealized
Appreciation
(Depreciation) | |
| Contracts to Buy: | | | | | | | | | | | | | | | | | |
| 90-Day Eurodollar | | | 16 | | | | 6/16 | | | $ | 3,969,452 | | | $ | 3,972,400 | | | $ | 2,948 | |
| U.S. Treasury 10-Year Notes | | | 98 | | | | 6/16 | | | | 12,846,740 | | | | 12,778,281 | | | | (68,459) | |
| U.S. Treasury Long-Term Bonds | | | 5 | | | | 6/16 | | | | 810,954 | | | | 822,188 | | | | 11,234 | |
| | | | | | | | | | | | | | | | | | | | (54,277) | |
| Contracts to Sell: | | | | | | | | | | | | | | | | | | | | |
| 90-Day Eurodollar | | | 22 | | | | 12/17 | | | | 5,441,943 | | | | 5,443,075 | | | | (1,132) | |
| Net unrealized depreciation on open futures contracts | | | | | | | $ | (55,409) | |
At March 31, 2016, the Fund had the following open forward foreign currency contracts:
| | | | | | | | | | | | | | | | | | | | |
Currency
Purchased | | | Currency
Sold | | | Counterparty | | Settlement
Date | | | Unrealized
Depreciation | |
| USD | | | 731,832 | | | BRL | | | 3,000,000 | | | Citibank N.A. | | | 4/12/16 | | | $ | (100,549) | |
| | |
Abbreviations used in this table: |
| BRL | | — Brazilian Real |
| USD | | — United States Dollar |
At March 31, 2016, the Fund had the following open swap contracts:
| | | | | | | | | | | | | | | | | | | | | | |
| CENTRALLY CLEARED INTEREST RATE SWAPS | |
| Central Counterparty | | Notional
Amount | | | Termination
Date | | | Payments
Made by
the Fund† | | Payments
Received by
the Fund† | | | Upfront
Premiums
Paid
(Received) | | | Unrealized
Appreciation | |
| Chicago Mercantile Exchange | | $ | 2,500,000 | | | | 2/11/23 | | | 1.384% semi-annually | | | 3-Month LIBOR quarterly | | | $ | (3,157) | | | $ | 6,209 | |
| Chicago Mercantile Exchange | | | 25,000,000 | | | | 2/11/26 | | | 1.658% semi-annually | | | 3-Month LIBOR quarterly | | | | (58,331) | | | | 55,620 | |
| Total | | $ | 27,500,000 | | | | | | | | | | | | | $ | (61,488) | | | $ | 61,829 | |
| | | | | | | | | | | | | | | | | | | | | | | | |
| OTC CREDIT DEFAULT SWAPS ON CORPORATE ISSUES — BUY PROTECTION1 | |
Swap Counterparty
(Reference Entity) | | Notional
Amount2 | | | Termination
Date | | | Implied Credit
Spread at
March 31,
20163 | | Periodic
Payments
Made by
the Fund† | | Market
Value | | | Upfront
Premiums
Paid
(Received) | | | Unrealized
Depreciation | |
| Goldman Sachs Group Inc. (Assured Guaranty Municipal Corp., 0.480%, due 3/20/20) | | $ | 10,000 | | | | 3/20/20 | | | 2.45% | | 5.000% quarterly | | $ | (952) | | | $ | 127 | | | $ | (1,079) | |
| 1 | If the Fund is a buyer of protection and a credit event occurs, as defined under the terms of that particular swap agreement, the Fund will either (i) receive from the seller of protection an amount equal to the notional amount of the swap and deliver the referenced obligation or the underlying securities comprising the referenced index or (ii) receive a net settlement amount in the form of cash or securities equal to the notional amount of the swap less the recovery value of the referenced obligation or the underlying securities comprising the referenced index. |
| 2 | The maximum potential amount the Fund could be required to pay as a seller of credit protection or receive as a buyer of credit protection if a credit event occurs as defined under the terms of that particular swap agreement. |
| | |
| 34 | | Western Asset Variable Rate Strategic Fund Inc. 2016 Semi-Annual Report |
| 3 | Implied credit spreads, utilized in determining the market value of credit default swap agreements on corporate or sovereign issues as of period end, serve as an indicator of the current status of the payment/performance risk and represent the likelihood or risk of default for the credit derivative. The implied credit spread of a particular referenced entity reflects the cost of buying/selling protection and may include upfront payments required to be made to enter into the agreement. Wider credit spreads represent a deterioration of the referenced entity’s credit soundness and a greater likelihood or risk of default or other credit event occurring as defined under the terms of the agreement. A credit spread identified as “Defaulted” indicates a credit event has occurred for the referenced entity or obligation. |
| † | Percentage shown is an annual percentage rate. |
4. Derivative instruments and hedging activities
Below is a table, grouped by derivative type, that provides information about the fair value and the location of derivatives within the Statement of Assets and Liabilities at March 31, 2016.
| | | | |
| ASSET DERIVATIVES1 | |
| | | Interest
Rate Risk | |
| Futures contracts2 | | $ | 14,182 | |
| Centrally cleared swap contracts3 | | | 61,829 | |
| Total | | $ | 76,011 | |
| | | | | | | | | | | | | | | | |
| LIABILITY DERIVATIVES1 | |
| | | Interest
Rate Risk | | | Foreign
Exchange Risk | | | Credit Risk | | | Total | |
| Futures contracts2 | | $ | 69,591 | | | | — | | | | — | | | $ | 69,591 | |
| OTC swap contracts4 | | | — | | | | — | | | $ | 952 | | | | 952 | |
| Forward foreign currency contracts | | | — | | | $ | 100,549 | | | | — | | | | 100,549 | |
| Total | | $ | 69,591 | | | $ | 100,549 | | | $ | 952 | | | $ | 171,092 | |
| 1 | Generally, the balance sheet location for asset derivatives is receivables/net unrealized appreciation (depreciation) and for liability derivatives is payables/net unrealized appreciation (depreciation). |
| 2 | Includes cumulative appreciation (depreciation) of futures contracts as reported in the footnotes. Only variation margin is reported within the receivables and/or payables on the Statement of Assets and Liabilities. |
| 3 | Includes cumulative appreciation (depreciation) of centrally cleared swap contracts as reported in the footnotes. Only variation margin is reported within the receivables and/or payables on the Statement of Assets and Liabilities. |
| 4 | Values include premiums paid (received) on swap contracts which are shown seperately in the Statement of Assets and Liabilities. |
The following tables provide information about the effect of derivatives and hedging activities on the Fund’s Statement of Operations for the six months ended March 31, 2016. The first table provides additional detail about the amounts and sources of gains (losses) realized on derivatives during the period. The second table provides additional information about the change in unrealized appreciation (depreciation) resulting from the Fund’s derivatives and hedging activities during the period.
| | | | | | | | | | | | | | | | |
| AMOUNT OF REALIZED GAIN (LOSS) ON DERIVATIVES RECOGNIZED | |
| | | Interest
Rate Risk | | | Foreign
Exchange Risk | | | Credit Risk | | | Total | |
| Futures contracts | | $ | 450,321 | | | | — | | | | — | | | $ | 450,321 | |
| Swap contracts | | | (1,106,236) | | | | — | | | $ | (270) | | | | (1,106,506) | |
| Forward foreign currency contracts1 | | | — | | | $ | 27,899 | | | | — | | | | 27,899 | |
| Total | | $ | (655,915) | | | $ | 27,899 | | | $ | (270) | | | $ | (628,286) | |
| 1 | Net realized gain (loss) from forward foreign currency contracts is reported in net realized gain (loss) from foreign currency transactions in the Statement of Operations. |
| | |
| Western Asset Variable Rate Strategic Fund Inc. 2016 Semi-Annual Report | | 35 |
Notes to financial statements (unaudited) (cont’d)
| | | | | | | | | | | | | | | | |
| CHANGE IN UNREALIZED APPRECIATION (DEPRECIATION) ON DERIVATIVES RECOGNIZED | |
| | | Interest
Rate Risk | | | Foreign
Exchange Risk | | | Credit Risk | | | Total | |
| Futures contracts | | $ | (189,396) | | | | — | | | | — | | | $ | (189,396) | |
| Swap contracts | | | (15,740) | | | | — | | | $ | (172) | | | | (15,912) | |
| Forward foreign currency contracts1 | | | — | | | $ | (100,549) | | | | — | | | | (100,549) | |
| Total | | $ | (205,136) | | | $ | (100,549) | | | $ | (172) | | | $ | (305,857) | |
| 1 | The change in unrealized appreciation (depreciation) from forward foreign currency contracts is reported in the change in net unrealized appreciation (depreciation) from foreign currencies in the Statement of Operations. |
During the six months ended March 31, 2016, the volume of derivative activity for the Fund was as follows:
| | | | |
| | | Average Market
Value | |
| Futures contracts (to buy) | | $ | 13,419,803 | |
| Futures contracts (to sell) | | | 2,334,593 | |
| Forward foreign currency contracts (to sell) | | | 437,183 | |
| |
| | | Average Notional
Balance | |
| Interest rate swap contracts | | $ | 27,500,000 | |
| Credit default swap contracts (to buy protection) | | | 10,000 | |
The following table presents by financial instrument, the Fund’s derivative assets net of the related collateral received by the Fund at March 31, 2016:
| | | | | | | | | | | | |
| | | Gross Amount of Derivative
Assets in the Statement of
Assets and Liabilities1 | | | Collateral
Received | | | Net
Amount | |
| Futures contracts2 | | $ | 39,399 | | | | — | | | $ | 39,399 | |
The following table presents by financial instrument, the Fund’s derivative liabilities net of the related collateral pledged by the Fund at March 31, 2016:
| | | | | | | | | | | | |
| | | Gross Amount of Derivative
Liabilities in the Statement of
Assets and Liabilities1 | | | Collateral
Pledged3,4 | | | Net
Amount | |
| Centrally cleared swap contracts2 | | $ | 96,751 | | | $ | (96,751) | | | | — | |
| OTC swap contracts | | | 952 | | | | — | | | $ | 952 | |
| Forward foreign currency contracts | | | 100,549 | | | | — | | | | 100,549 | |
| Total | | $ | 198,252 | | | $ | (96,751) | | | $ | 101,501 | |
| 1 | Absent an event of default or early termination, derivative assets and liabilities are presented gross and not offset in the Statement of Assets and Liabilities. |
| 2 | Amount represents the current day’s variation margin as reported in the Statement of Assets and Liabilities. It differs from the cumulative appreciation (depreciation) presented in the previous table. |
| 3 | Gross amounts are not offset in the Statement of Assets and Liabilities. |
| 4 | In some instances, the actual collateral received and/or pledged may be more than the amount shown here due to overcollateralization. |
| | |
| 36 | | Western Asset Variable Rate Strategic Fund Inc. 2016 Semi-Annual Report |
5. Distributions subsequent to March 31, 2016
The following distributions have been declared by the Fund’s Board of Directors and are payable subsequent to the period end of this report:
| | | | | | | | |
| Record Date | | Payable Date | | | Amount | |
| 4/22/16 | | | 4/29/16 | | | $ | 0.0775 | |
| 5/20/16 | | | 5/27/16 | | | $ | 0.0775 | |
| 6/17/16 | | | 6/24/16 | | | $ | 0.0775 | |
| 7/22/16 | | | 7/29/16 | | | $ | 0.0775 | |
| 8/19/16 | | | 8/26/16 | | | $ | 0.0775 | |
6. Tender offer
On October 22, 2015, the Fund announced that the Fund’s Board of Directors had approved a tender offer for up to 30% of the outstanding common stock (“Shares”) or 2,000,746 Shares of the Fund. The tender offer was to be conducted at a price equal to 98% of the net asset value per Share of the Fund’s Shares as determined as of the close of the regular trading session of the New York Stock Exchange on the tender offer expiration date. The tender offer commenced on October 22, 2015 and expired on November 20, 2015.
On November 30, 2015, the Fund announced the final results of the tender offer. A total of 4,423,133 Shares were duly tendered and not withdrawn, including Shares tendered pursuant to notices of guaranteed delivery. Because the number of Shares tendered exceeded 2,000,746 Shares, the tender offer was oversubscribed. Therefore, in accordance with the terms and conditions specified in the tender offer, the Fund purchased Shares from all tendering stockholders on a pro rata basis, disregarding fractions. Accordingly, on a pro rata basis, approximately 45.23% of Shares for each stockholder who properly tendered Shares were accepted for payment. The Fund transmitted payment to purchase the duly tendered and accepted Shares on November 27, 2015. The purchase price of properly tendered Shares was $17.13 per Share, equal to 98% of the per Share net asset value of $17.48 as of the close of the regular trading session of the New York Stock Exchange on November 20, 2015. Shares repurchased and the corresponding dollar amount are included on the Statement of Changes in Net Assets. Shares that were not tendered will remain outstanding. The difference between the purchase price of the tendered Shares and the net asset value per Share was recognized by the Fund in the Financial Highlights as an increase in net assets resulting from the tender and repurchase of Shares by the Fund.
7. Stock repurchase program
On November 16, 2015, the Fund announced that the Fund’s Board of Directors (the “Board”) had authorized the Fund to repurchase in the open market up to approximately 10% of the Fund’s outstanding common stock when the Fund’s shares are trading at a discount to net asset value. The Board has directed management of the Fund to repurchase shares of common stock at such times and in such amounts as management reasonably believes may enhance stockholder value. The Fund is under no obligation to purchase shares at any specific discount levels or in any specific amounts. During the period ended March 31, 2016, the Fund did not repurchase any shares pursuant to the stock repurchase program.
| | |
| Western Asset Variable Rate Strategic Fund Inc. 2016 Semi-Annual Report | | 37 |
Notes to financial statements (unaudited) (cont’d)
8. Capital loss carryforward
As of September 30, 2015, the Fund had the following net capital loss carryforward remaining:
| | | | |
| Year of Expiration | | Amount | |
| 9/30/2019 | | $ | (4,735,221) | |
This amount will be available to offset any future taxable capital gains, except that under applicable tax rules, deferred capital losses of $7,721,171, which have no expiration date, must be used first to offset any such gains.
| | |
| 38 | | Western Asset Variable Rate Strategic Fund Inc. 2016 Semi-Annual Report |
Board approval of management and subadvisory agreements (unaudited)
Background
The Investment Company Act of 1940, as amended (the “1940 Act”), requires that the Board of Directors (the “Board”) of Western Asset Variable Rate Strategic Fund Inc. (the “Fund”), including a majority of its members who are not considered to be “interested persons” under the 1940 Act (the “Independent Directors”) voting separately, approve on an annual basis the continuation of the investment management contract (the “Management Agreement”) with the Fund’s manager, Legg Mason Partners Fund Advisor, LLC (the “Manager”), and the sub-advisory agreements (individually, a “Sub-Advisory Agreement,” and collectively, the “Sub-Advisory Agreements”) with the Manager’s affiliates, Western Asset Management Company (“Western Asset”), Western Asset Management Company Limited in London (“Western Asset London”) and Western Asset Management Company Pte. Ltd. in Singapore (“Western Asset Singapore,” and together with Western Asset and Western Asset London, the “Sub-Advisers”). At a meeting (the “Contract Renewal Meeting”) held in-person on November 11 and 12, 2015, the Board, including the Independent Directors, considered and approved the continuation of each of the Management Agreement and the Sub-Advisory Agreements for an additional one-year term. To assist in its consideration of the renewals of the Management Agreement and the Sub-Advisory Agreements, the Board received and considered a variety of information (together with the information provided at the Contract Renewal Meeting, the “Contract Renewal Information”) about the Manager and the Sub-Advisers, as well as the management and sub-advisory arrangements for the Fund and the other closed-end funds in the same complex under the Board’s supervision (collectively, the “Legg Mason Closed-end Funds”), certain portions of which are discussed below. A presentation made by the Manager and Western Asset to the Board at the Contract Renewal Meeting in connection with its evaluations of the Management Agreement and the Sub-Advisory Agreements encompassed the Fund and other Legg Mason Closed-end Funds. In addition to the Contract Renewal Information, the Board received performance and other information throughout the year related to the respective services rendered by the Manager and the Sub-Advisers to the Fund. The Board’s evaluation took into account the information received throughout the year and also reflected the knowledge and familiarity gained as members of the Boards of the Fund and other Legg Mason Closed-end Funds with respect to the services provided to the Fund by the Manager and the Sub-Advisers.
The Manager provides the Fund with investment advisory and administrative services pursuant to the Management Agreement and the Sub-Advisers together provide the Fund with certain investment sub-advisory services pursuant to the Sub-Advisory Agreements. The discussion below covers both the advisory and administrative functions being rendered by the Manager, each such function being encompassed by the Management Agreement, and the investment sub-advisory functions being rendered by the Sub-Advisers.
Board approval of management agreement and sub-advisory agreements
In its deliberations regarding renewal of the Management Agreement and the Sub-Advisory Agreements, the Board, including the Independent Directors, considered the factors below.
| | |
| Western Asset Variable Rate Strategic Fund Inc. | | 39 |
Board approval of management and subadvisory agreements (unaudited) (cont’d)
Nature, extent and quality of the services under the management agreement and sub-advisory agreements
The Board received and considered Contract Renewal Information regarding the nature, extent, and quality of services provided to the Fund by the Manager and the Sub-Advisers under the Management Agreement and the Sub-Advisory Agreements, respectively, during the past year. The Board also reviewed Contract Renewal Information regarding the Fund’s compliance policies and procedures established pursuant to the 1940 Act.
The Board reviewed the qualifications, backgrounds and responsibilities of the Fund’s senior personnel and the portfolio management team primarily responsible for the day-to-day portfolio management of the Fund. The Board also considered, based on its knowledge of the Manager and its affiliates, the Contract Renewal Information and the Board’s discussions with the Manager and Western Asset at the Contract Renewal Meeting, the general reputation and investment performance records of the Manager, Western Asset and their affiliates and the financial resources available to the corporate parent of the Manager and the Sub-Advisers, Legg Mason, Inc. (“Legg Mason”), to support their activities in respect of the Fund and the other Legg Mason Closed-end Funds.
The Board reviewed the responsibilities of the Manager and the Sub-Advisers under the Management Agreement and the Sub-Advisory Agreements, respectively, including the Manager’s coordination and oversight of the services provided to the Fund by the Sub-Advisers and others and Western Asset’s coordination and oversight of the services provided to the Fund by Western Asset London and Western Asset Singapore. The Management Agreement permits the Manager to delegate certain of its responsibilities, including its investment advisory duties thereunder, provided that the Manager, in each case, will supervise the activities of the delegee. Pursuant to this provision of the Management Agreement, the Manager does not provide day-to-day portfolio management services to the Fund. Rather, portfolio management services for the Fund are provided by Western Asset pursuant to the Sub-Advisory Agreement (the “Western Asset Sub-Advisory Agreement”) between the Manager and Western Asset. The Western Asset Sub-Advisory Agreement permits Western Asset to delegate certain of its responsibilities, including its investment sub-advisory duties thereunder, provided that Western Asset, in each case, will supervise the activities of the delegee. Pursuant to this provision of the Western Asset Sub-Advisory Agreement, Western Asset London and Western Asset Singapore help to provide certain investment sub-advisory services to the Fund pursuant to separate Sub-Advisory Agreements with Western Asset.
In reaching its determinations regarding continuation of the Management Agreement and the Sub-Advisory Agreements, the Board took into account that Fund shareholders, in pursuing their investment goals and objectives, likely purchased their shares based upon the reputation and the investment style, philosophy and strategy of the Manager and Western Asset, as well as the resources available to the Manager and the Sub-Advisers.
| | |
| 40 | | Western Asset Variable Rate Strategic Fund Inc. |
The Board concluded that, overall, the nature, extent, and quality of the management and other services provided to the Fund under the Management Agreement and the Sub-Advisory Agreements have been satisfactory under the circumstances.
Fund performance
The Board received and considered performance information and analyses (the “Lipper Performance Information”) for the Fund, as well as for a group of funds (the “Performance Universe”) selected by Lipper, Inc. (“Lipper”), an independent provider of investment company data. The Board was provided with a description of the methodology Lipper used to determine the similarity of the Fund with the funds included in the Performance Universe. The Performance Universe included the Fund and all leveraged global income closed-end funds, as classified by Lipper, regardless of asset size. The Performance Universe consisted of twelve funds, including the Fund, for the 1-year period ended June 30, 2015; eleven funds, including the Fund, for the 3-year period ended June 30, 2015; four funds, including the Fund, for the 5-year period ended June 30, 2015; and six funds, including the Fund, for the 10-year period ended such date. The Board noted that it had received and discussed with the Manager and Western Asset information throughout the year at periodic intervals comparing the Fund’s performance against its benchmark and its peer funds as selected by Lipper.
The Lipper Performance Information comparing the Fund’s performance to that of the Performance Universe based on net asset value per share showed, among other things, that the Fund’s performance was ranked seventh among the funds in the Performance Universe for the 1-year period ended June 30, 2015 (first being best in these performance rankings), sixth among the funds in the Performance Universe for the 3-year period ended June 30, 2015, fourth among the funds in the Performance Universe for the 5-year period ended June 30, 2015, and sixth among the funds in the Performance Universe for the 10-year period ended such date. The Fund’s performance for each of the 1- and 10-year periods ended June 30, 2015 was worse than the Performance Universe median for that period, but its performance was at or better than the Performance Universe median for each of the 3- and 5-year periods ended such date. Among other things, the Manager has noted that unlike the other Performance Universe funds at least 80% of the Fund’s assets generally must be invested in floating rate instruments. According to the Manager, this requirement put the Fund at a disadvantage relative to the other Performance Universe funds in the declining global base interest rate environment in recent years. Since 2008, the Manager noted, global base interest rates have been cut to near zero. The Board considered that the Fund’s dissimilarity from the other funds in the small Performance Universe made meaningful performance comparisons difficult. In addition to the Fund’s performance relative to the Performance Universe, the Board considered the Fund’s performance in absolute terms and the Fund’s performance relative to its benchmark for each of the 1-, 3- and 5-year periods ended June 30, 2015. On a net asset value basis, the Fund underperformed its benchmark for the 1-year period ended June 30, 2015 but outperformed its benchmark for each of the 3- and 5-year periods ended such date.
| | |
| Western Asset Variable Rate Strategic Fund Inc. | | 41 |
Board approval of management and subadvisory agreements (unaudited) (cont’d)
Based on the reviews and discussions of Fund performance and considering other relevant factors, including those noted above, the Board concluded, under the circumstances, that continuation of the Management Agreement and the Sub-Advisory Agreements for an additional one-year period would be consistent with the interests of the Fund and its shareholders.
Management fees and expense ratios
The Board reviewed and considered the management fee (the “Management Fee”) payable by the Fund to the Manager under the Management Agreement and the sub-advisory fees (the “Sub-Advisory Fees”) payable to the Sub-Advisers under the Sub-Advisory Agreements in light of the nature, extent and overall quality of the management, investment advisory and other services provided by the Manager and the Sub-Advisers. The Board noted that the Sub-Advisory Fee payable to Western Asset under the Western Asset Sub-Advisory Agreement is paid by the Manager, not the Fund, and, accordingly, that the retention of Western Asset does not increase the fees or expenses otherwise incurred by the Fund’s shareholders. Similarly, the Board noted that the Sub-Advisory Fees payable to Western Asset London and Western Asset Singapore under their Sub-Advisory Agreements with Western Asset are paid by Western Asset, not the Fund, and, accordingly, that the retention of Western Asset London and Western Asset Singapore does not increase the fees or expenses otherwise incurred by the Fund’s shareholders.
Additionally, the Board received and considered information and analyses prepared by Lipper (the “Lipper Expense Information”) comparing the Management Fee and the Fund’s overall expenses with those of funds in an expense group (the “Expense Group”) selected and provided by Lipper. The comparison was based upon the constituent funds’ latest fiscal years. The Expense Group consisted of the Fund and five other leveraged global income closed-end funds, as classified by Lipper. The six funds in the Expense Group had average net common share assets ranging from $110.8 million to $372.7 million. Four of the other Expense Group funds were larger than the Fund and one was smaller.
The Lipper Expense Information, comparing the Management Fee as well as the Fund’s actual total expenses to the Fund’s Expense Group, showed, among other things, that the Management Fee on both a contractual basis and an actual basis (i.e., giving effect to any voluntary fee waivers implemented by the Manager with respect to the Fund and by the managers of the other Expense Group funds) was ranked first among the funds in the Expense Group whether compared on a common share assets only basis or on the basis of common share and leveraged assets (first being lowest and, therefore, best in these expense component rankings). The Fund’s actual total expenses also ranked first among the funds in the Expense Group whether compared on a common share assets only basis or on the basis of common share and leveraged assets. Each of the Fund’s expense components was better (i.e., lower) than the Expense Group median for that expense component. The Board noted that the small number of funds in the Expense Group made meaningful expense comparisons difficult.
| | |
| 42 | | Western Asset Variable Rate Strategic Fund Inc. |
The Board also reviewed Contract Renewal Information regarding fees charged by the Manager to other U.S. clients investing primarily in an asset class similar to that of the Fund, including, where applicable, institutional and separate accounts. The Board was advised that the fees paid by such institutional, separate account and other clients (collectively, “institutional clients”) generally are lower, and may be significantly lower, than the Management Fee. The Contract Renewal Information discussed the significant differences in scope of services provided to the Fund and to institutional clients. Among other things, institutional clients have fewer compliance, administration and other needs than the Fund and the Fund is subject not only to heightened regulatory requirements relative to institutional clients but also to requirements for listing on the New York Stock Exchange. The Contract Renewal Information noted further that the Fund is provided with administrative services, office facilities, Fund officers (including the Fund’s chief executive, chief financial and chief compliance officers), and that the Manager coordinates and oversees the provision of services to the Fund by other fund service providers. The Contract Renewal Information included information regarding management fees paid by open-end mutual funds in the same complex (the “Legg Mason Open-end Funds”) and such information indicated that the management fees paid by the Legg Mason Closed-end Funds generally were higher than those paid by the Legg Mason Open-end Funds. The Manager, in response to an inquiry from the Board as to the reasons for the fee differential, provided information as to differences between the services provided to the Fund and the other Legg Mason Closed-end Funds and the services provided to the Legg Mason Open-end Funds. The Board considered the fee comparisons in light of the different services provided in managing these other types of clients and funds.
Taking all of the above into consideration, the Board determined that the Management Fee and the Sub-Advisory Fees were reasonable in light of the nature, extent and overall quality of the management, investment advisory and other services provided to the Fund under the Management Agreement and the Sub-Advisory Agreements.
Manager profitability
The Board, as part of the Contract Renewal Information, received an analysis of the profitability to the Manager and its affiliates in providing services to the Fund for the Manager’s fiscal years ended March 31, 2015 and March 31, 2014. The Board also received profitability information with respect to the Legg Mason fund complex as a whole. In addition, the Board received Contract Renewal Information with respect to the Manager’s revenue and cost allocation methodologies used in preparing such profitability data. The profitability to each of the Sub-Advisers was not considered to be a material factor in the Board’s considerations since Western Asset’s Sub-Advisory Fee is paid by the Manager, not the Fund, and the Sub-Advisory Fees for Western Asset London and Western Asset Singapore are paid by Western Asset, not the Fund. The profitability analysis presented to the Board as part of the Contract Renewal Information indicated that profitability to the Manager had declined by 1 percent during the period covered by the analysis and remained at a level that
| | |
| Western Asset Variable Rate Strategic Fund Inc. | | 43 |
Board approval of management and subadvisory agreements (unaudited) (cont’d)
the Board did not consider to be excessive in light of judicial guidance and the nature, extent and overall quality of the investment advisory and other services provided to the Fund.
Economies of scale
The Board received and discussed Contract Renewal Information concerning whether the Manager realizes economies of scale if the Fund’s assets grow. The Board noted that because the Fund is a closed-end fund with no current plans to seek additional assets beyond maintaining its dividend reinvestment plan, any significant growth in its assets generally will occur through appreciation in the value of the Fund’s investment portfolio, rather than sales of additional shares in the Fund. The Board determined that the Management Fee structure, which incorporates no breakpoints reducing the Management Fee at specified increased asset levels, was appropriate under present circumstances.
Other benefits to the manager and the sub-advisers
The Board considered other benefits received by the Manager, the Sub-Advisers and their affiliates as a result of their relationship with the Fund and did not regard such benefits as excessive.
* * * * * *
In light of all of the foregoing and other relevant factors, the Board determined, under the circumstances, that continuation of the Management Agreement and the Sub-Advisory Agreements would be consistent with the interests of the Fund and its shareholders and unanimously voted to continue each Agreement for a period of one additional year. No single factor reviewed by the Board was identified by the Board as the principal factor in determining whether to approve continuation of the Management Agreement and the Sub-Advisory Agreements, and each Board member may have attributed different weights to the various factors. The Independent Directors were advised by separate independent legal counsel throughout the process. Prior to the Contract Renewal Meeting, the Board received a memorandum prepared by the Manager discussing its responsibilities in connection with the proposed continuation of the Management Agreement and the Sub-Advisory Agreements as part of the Contract Renewal Information and the Independent Directors separately received a memorandum discussing such responsibilities from their independent counsel. Prior to voting, the Independent Directors also discussed the proposed continuation of the Management Agreement and the Sub-Advisory Agreements in private sessions with their independent legal counsel at which no representatives of the Manager or any Sub-Adviser were present.
| | |
| 44 | | Western Asset Variable Rate Strategic Fund Inc. |
Additional shareholder information (unaudited)
Results of annual meeting of shareholders
The Annual Meeting of Shareholders of Western Asset Variable Rate Strategic Fund Inc. was held on January 29, 2016 for the purpose of considering and voting upon the election of Directors. The following table provides information concerning the matter voted upon at the Meeting:
Election of directors
| | | | | | | | |
| Nominees | | Votes For | | | Votes Withheld | |
| Robert D. Agdern | | | 4,273,558 | | | | 24,262 | |
| Paolo M. Cucchi | | | 4,271,740 | | | | 26,080 | |
| Riordan Roett | | | 4,272,033 | | | | 25,787 | |
Jane Trust | | | 4,272,518 | | | | 25,302 | |
At March 31, 2016, in addition to Robert D. Agdern, Paolo M. Cucchi, Riordan Roett and Jane Trust, the other Directors of the Fund were as follows:
Carol L. Colman
Daniel P. Cronin
Leslie H. Gelb
William R. Hutchinson
Eileen A. Kamerick
| | |
| Western Asset Variable Rate Strategic Fund Inc. | | 45 |
Dividend reinvestment plan (unaudited)
Unless you elect to receive distributions in cash (i.e., opt-out), all distributions, on your common shares (the “Common Shares”) will be automatically reinvested by Computershare, as agent for the holders of Common Shares (the “Common Shareholders”) (the “Plan Agent”), in additional Common Shares under the Dividend Reinvestment Plan (the “Plan”). You may elect not to participate in the Plan by contacting the Plan Agent. If you do not participate, you will receive all cash distributions paid by check mailed directly to you by Computershare, as dividend paying agent.
If you participate in the Plan, the number of Common Shares you will receive will be determined as follows:
1. If the market price of the Common Shares on the record date (or, if the record date is not a New York Stock Exchange (the “Exchange”) trading day, the immediately preceding trading day) for determining shareholders eligible to receive the relevant dividend or distribution (the “determination date”) is equal to or exceeds 98% of the net asset value per share of the Common Shares, the Fund will issue new Common Shares at a price equal to the greater of (a) 98% of the net asset value per share at the close of trading on the Exchange on the determination date or (b) 95% of the market price per share of the Common Shares on the determination date.
2. If 98% of the net asset value per share of the Common Shares exceeds the market price of the Common Shares on the determination date, the Plan Agent will receive the distribution in cash and will buy Common Shares in the open market, on the Exchange or elsewhere, for your account as soon as practicable commencing on the trading day following the determination date and terminating no later than the earlier of (a) 30 days after the distribution payment date, or (b) the record date for the next succeeding distribution to be made to the Common Shareholders; except when necessary to comply with applicable provisions of the federal securities laws. If during this period: (i) the market price rises so that it equals or exceeds 98% of the net asset value per share of the Common Shares at the close of trading on the Exchange on the determination date before the Plan Agent has completed the open market purchases or (ii) if the Plan Agent is unable to invest the full amount eligible to be reinvested in open market purchases, the Plan Agent will cease purchasing Common Shares in the open market and the Fund shall issue the remaining Common Shares at a price per share equal to the greater of (a) 98% of the net asset value per share at the close of trading on the Exchange on the determination date or (b) 95% of the then current market price per share.
The Plan Agent maintains all participants’ accounts in the Plan and gives written confirmation of all transactions in the accounts, including information you may need for tax records. Common Shares in your account will be held by the Plan Agent in noncertificated form. Any proxy you receive will include all Common Shares you have received under the Plan.
| | |
| 46 | | Western Asset Variable Rate Strategic Fund Inc. |
You may withdraw from the Plan by notifying the Plan Agent in writing at 211 Quality Circle, Suite 210, College Station, TX 77845-4470 or by calling the Plan Agent at 1-888-888-0151. Such withdrawal will be effective immediately if notice is received by the Plan Agent not less than ten business days prior to any distribution record date; otherwise such withdrawal will be effective as soon as practicable after the Plan Agent’s investment of the most recently declared distribution on the Common Shares. The Plan may be terminated by the Fund upon notice in writing mailed to Common Shareholders at least 30 days prior to the record date for the payment of any distribution by the Fund for which the termination is to be effective. Upon any termination, you will be sent a certificate or certificates for the full Common Shares held for you under the Plan and cash for any fractional Common Shares. You may elect to notify the Plan Agent in advance of such termination to have the Plan Agent sell part or all of your shares on your behalf. You will be charged a service charge and the Plan Agent is authorized to deduct brokerage charges actually incurred for this transaction from the proceeds.
There is no service charge for reinvestment of your distributions in Common Shares. However, all participants will pay a pro rata share of brokerage commissions incurred by the Plan Agent when it makes open market purchases. Because all distributions will be automatically reinvested in additional Common Shares, this allows you to add to your investment through dollar cost averaging, which may lower the average cost of your Common Shares over time. Dollar cost averaging is a technique for lowering the average cost per share over time if the Fund’s net asset value declines. While dollar cost averaging has definite advantages, it cannot assure profit or protect against loss in declining markets. Investors will be subject to income tax on amounts reinvested under the plan.
Automatically reinvesting distributions does not mean that you do not have to pay income taxes due upon receiving distributions.
The Fund reserves the right to amend or terminate the Plan if, in the judgment of the Board of Directors, the change is warranted. There is no direct service charge to participants in the Plan; however, the Fund reserves the right to amend the Plan to include a service charge payable by the participants. Additional information about the Plan and your account may be obtained from the Plan Agent at 1-888-888-0151.
| | |
| Western Asset Variable Rate Strategic Fund Inc. | | 47 |
Western Asset
Variable Rate Strategic Fund Inc.
Directors
Robert D. Agdern
Carol L. Colman
Daniel P. Cronin
Paolo M. Cucchi
Leslie H. Gelb
William R. Hutchinson
Eileen A. Kamerick
Riordan Roett
Jane Trust
Chairman
Officers
Jane Trust
President and Chief Executive Officer
Richard F. Sennett
Principal Financial Officer
Ted P. Becker
Chief Compliance Officer
Jenna Bailey
Identity Theft Prevention Officer
Robert I. Frenkel
Secretary and Chief Legal Officer
Thomas C. Mandia
Assistant Secretary
Steven Frank
Treasurer
Jeanne M. Kelly
Senior Vice President
Western Asset Variable Rate Strategic Fund Inc.
620 Eighth Avenue
49th Floor
New York, NY 10018
Investment manager
Legg Mason Partners Fund Advisor, LLC
Subadvisers
Western Asset Management Company
Western Asset Management Company Limited
Western Asset Management Company Pte. Ltd.
Custodian
State Street Bank and Trust Company
1 Lincoln Street
Boston, MA 02111
Transfer agent
Computershare lnc.*
211 Quality Circle, Suite 210
College Station, TX 77845-4470
| * | Effective March 14, 2016, Computershare Inc. serves as the Fund’s transfer agent. |
Independent registered public accounting firm
KPMG LLP
345 Park Avenue
New York, NY 10154
Legal counsel
Simpson Thacher & Bartlett LLP
425 Lexington Avenue
New York, NY 10017
New York Stock Exchange Symbol
GFY
Legg Mason Funds Privacy and Security Notice
Your Privacy and the Security of Your Personal Information is Very Important to the Legg Mason Funds
This Privacy and Security Notice (the “Privacy Notice”) addresses the Legg Mason Funds’ privacy and data protection practices with respect to nonpublic personal information the Funds receive. The Legg Mason Funds include any funds sold by the Funds’ distributor, Legg Mason Investor Services, LLC, as well as Legg Mason-sponsored closed-end funds and certain closed-end funds managed or sub-advised by Legg Mason or its affiliates. The provisions of this Privacy Notice apply to your information both while you are a shareholder and after you are no longer invested with the Funds.
The Type of Nonpublic Personal Information the Funds Collect About You
The Funds collect and maintain nonpublic personal information about you in connection with your shareholder account. Such information may include, but is not limited to:
| • | | Personal information included on applications or other forms; |
| • | | Account balances, transactions, and mutual fund holdings and positions; |
| • | | Online account access user IDs, passwords, security challenge question responses; and |
| • | | Information received from consumer reporting agencies regarding credit history and creditworthiness (such as the amount of an individual’s total debt, payment history, etc.). |
How the Funds Use Nonpublic Personal Information About You
The Funds do not sell or share your nonpublic personal information with third parties or with affiliates for their marketing purposes, or with other financial institutions or affiliates for joint marketing purposes, unless you have authorized the Funds to do so. The Funds do not disclose any nonpublic personal information about you except as may be required to perform transactions or services you have authorized or as permitted or required by law. The Funds may disclose information about you to:
| • | | Employees, agents, and affiliates on a “need to know” basis to enable the Funds to conduct ordinary business or comply with obligations to government regulators; |
| • | | Service providers, including the Funds’ affiliates, who assist the Funds as part of the ordinary course of business (such as printing, mailing services, or processing or servicing your account with us) or otherwise perform services on the Funds’ behalf, including companies that may perform marketing services solely for the Funds; |
| • | | The Funds’ representatives such as legal counsel, accountants and auditors; and |
| • | | Fiduciaries or representatives acting on your behalf, such as an IRA custodian or trustee of a grantor trust. |
|
| NOT PART OF THE SEMI-ANNUAL REPORT |
Legg Mason Funds Privacy and Security Notice (cont’d)
Except as otherwise permitted by applicable law, companies acting on the Funds’ behalf are contractually obligated to keep nonpublic personal information the Funds provide to them confidential and to use the information the Funds share only to provide the services the Funds ask them to perform.
The Funds may disclose nonpublic personal information about you when necessary to enforce their rights or protect against fraud, or as permitted or required by applicable law, such as in connection with a law enforcement or regulatory request, subpoena, or similar legal process. In the event of a corporate action or in the event a Fund service provider changes, the Funds may be required to disclose your nonpublic personal information to third parties. While it is the Funds’ practice to obtain protections for disclosed information in these types of transactions, the Funds cannot guarantee their privacy policy will remain unchanged.
Keeping You Informed of the Funds’ Privacy and Security Practices
The Funds will notify you annually of their privacy policy as required by federal law. While the Funds reserve the right to modify this policy at any time they will notify you promptly if this privacy policy changes.
The Funds’ Security Practices
The Funds maintain appropriate physical, electronic and procedural safeguards designed to guard your nonpublic personal information. The Funds’ internal data security policies restrict access to your nonpublic personal information to authorized employees, who may use your nonpublic personal information for Fund business purposes only.
Although the Funds strive to protect your nonpublic personal information, they cannot ensure or warrant the security of any information you provide or transmit to them, and you do so at your own risk. In the event of a breach of the confidentiality or security of your nonpublic personal information, the Funds will attempt to notify you as necessary so you can take appropriate protective steps. If you have consented to the Funds using electronic communications or electronic delivery of statements, they may notify you under such circumstances using the most current email address you have on record with them.
In order for the Funds to provide effective service to you, keeping your account information accurate is very important. If you believe that your account information is incomplete, not accurate or not current, or if you have questions about the Funds’ privacy practices, write the Funds using the contact information on your account statements, email the Funds by clicking on the Contact Us section of the Funds’ website at www.lmcef.com, or contact the Fund at 1-888-777-0102.
|
| NOT PART OF THE SEMI-ANNUAL REPORT |
Western Asset Variable Rate Strategic Fund Inc.
Western Asset Variable Rate Strategic Fund Inc.
620 Eighth Avenue
49th Floor
New York, NY 10018
Notice is hereby given in accordance with Section 23(c) of the Investment Company Act of 1940, as amended, that from time to time the Fund may purchase, at market prices, shares of its stock.
The Fund files its complete schedule of portfolio holdings with the Securities and Exchange Commission (“SEC”) for the first and third quarters of each fiscal year on Form N-Q. The Fund’s Forms N-Q are available on the SEC’s website at www.sec.gov. The Fund’s Forms N-Q may be reviewed and copied at the SEC’s Public Reference Room in Washington, D.C., and information on the operation of the Public Reference Room may be obtained by calling 1-800-SEC-0330. To obtain information on Form N-Q from the Fund, shareholders can call 1-888-777-0102.
Information on how the Fund voted proxies relating to portfolio securities during the prior 12-month period ended June 30th of each year and a description of the policies and procedures that the Fund uses to determine how to vote proxies related to portfolio transactions are available (1) without charge, upon request, by calling 1-888-777-0102, (2) on the Fund’s website at www.lmcef.com and (3) on the SEC’s website at www.sec.gov.
This report is transmitted to the shareholders of Western Asset Variable Rate Strategic Fund Inc. for their information. This is not a prospectus, circular or representation intended for use in the purchase of shares of the Fund or any securities mentioned in this report.
Computershare Inc.
211 Quality Circle, Suite 210
College Station, TX 77845-4470
WAS04036 5/16 SR16-2768
| | |
| ITEM 2. | | CODE OF ETHICS. |
| |
| | Not applicable. |
| |
| ITEM 3. | | AUDIT COMMITTEE FINANCIAL EXPERT. |
| |
| | Not applicable. |
| |
| ITEM 4. | | PRINCIPAL ACCOUNTANT FEES AND SERVICES. |
| |
| | Not applicable. |
| |
| ITEM 5. | | AUDIT COMMITTEE OF LISTED REGISTRANTS. |
| |
| | Not applicable. |
| |
| ITEM 6. | | SCHEDULE OF INVESTMENTS. |
| |
| | Included herein under Item 1. |
| |
| ITEM 7. | | DISCLOSURE OF PROXY VOITNG POLIIES AND PROCEDURES FOR CLOSED-END MANAGEMENT INVESTMENT COMPANIES. |
| |
| | Not applicable. |
| |
| ITEM 8 | | INVESTMENT PROFESSIONALS OF CLOSED-END MANAGEMENT INVESTMENT COMPANIES. |
| |
| | Not applicable. |
| |
| ITEM 9. | | PURCHASES OF EQUITY SECURITIES BY CLOSED-END MANAGEMENT INVESTMENT COMPANY AND AFFILIATED PURCHASERS. |
| |
| | Not applicable. |
| |
| ITEM 10. | | SUBMISSION OF MATTERS TO A VOTE OF SECURITY HOLDERS. |
| |
| | Not applicable. |
| |
| ITEM 11. | | CONTROLS AND PROCEDURES. |
| |
| | (a) The registrant’s principal executive officer and principal financial officer have concluded that the registrant’s disclosure controls and procedures (as defined in Rule 30a- 3(c) under the Investment Company Act of 1940, as amended (the “1940 Act”)) are effective as of a date within 90 days of the filing date of this report that includes the disclosure required by this paragraph, based on their evaluation of the disclosure controls and procedures required by Rule 30a-3(b) under the 1940 Act and 15d-15(b) under the Securities Exchange Act of 1934. |
| |
| | (b) There were no changes in the registrant’s internal control over financial reporting (as defined in Rule 30a-3(d) under the 1940 Act) that occurred during the second fiscal quarter of the period covered by this report that have materially affected, or are likely to materially affect the registrant’s internal control over financial reporting. |
| |
| ITEM 12. | | EXHIBITS. |
| |
| | (a) (1) Not applicable. Exhibit 99.CODE ETH |
| |
| | (a) (2) Certifications pursuant to section 302 of the Sarbanes-Oxley Act of 2002 attached hereto. Exhibit 99.CERT |
| |
| | (b) Certifications pursuant to Section 906 of the Sarbanes-Oxley Act of 2002 attached hereto. Exhibit 99.906CERT |
SIGNATURES
Pursuant to the requirements of the Securities Exchange Act of 1934 and the Investment Company Act of 1940, the registrant has duly caused this Report to be signed on its behalf by the undersigned, there unto duly authorized.
Western Asset Variable Rate Strategic Fund Inc.
| | |
| By: | | /s/ Jane Trust |
| | Jane Trust |
| | Chief Executive Officer |
| |
| Date: | | May 23, 2016 |
Pursuant to the requirements of the Securities Exchange Act of 1934 and the Investment Company Act of 1940, this report has been signed below by the following persons on behalf of the registrant and in the capacities and on the dates indicated.
| | |
| By: | | /s/ Jane Trust |
| | Jane Trust |
| | Chief Executive Officer |
| |
| Date: | | May 23, 2016 |
| | |
| By: | | /s/ Richard F. Sennett |
| | Richard F. Sennett |
| | Principal Financial Officer |
| |
| Date: | | May 23, 2016 |