Exhibit 99.2

First Quarter 2014

Supplemental Operating and Financial Data
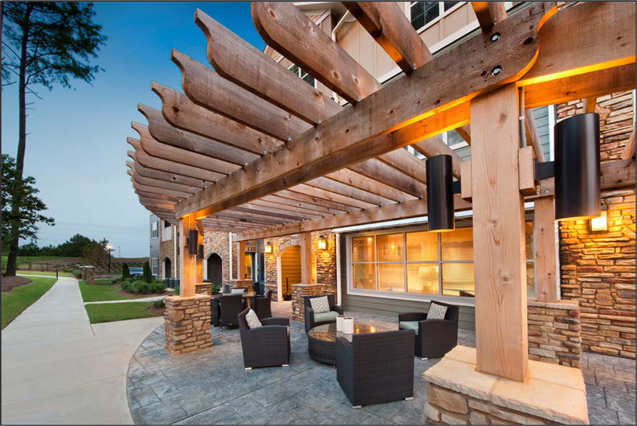
The Aventine Greenville
Greenville, SC
Trade Street Residential, Inc.
19950 W. Country Club Drive, Suite 800
Aventura, Florida 33180
786-248-5200
www.tradestreetresidential.com
| Trade Street Residential, Inc. | |
| First Quarter 2014 | Supplemental Financial Information |
| Table of Contents | Page |
| | |
| Earnings Release | 3 |
| | |
| Operating Results | 10 |
| | |
| Funds From Operations and Core Funds From Operations | 11 |
| | |
| Consolidated Balance Sheets | 12 |
| | |
| Operating Properties Table | 13 |
| | |
| Same Store Comparisons | 14 |
| | |
| Acquisitions and Dispositions / Land Investments | 16 |
| | |
| Debt Summary | 18 |
| | |
| Capitalized Cost Summary | 19 |
| | |
| Non-GAAP Financial Measures and Reconciliation | 20 |
| | |
| NOI Bridge | 22 |
Trade Street RESIDENTIAL Reports FiRST Quarter 2014 Results
– Same Store NOI Increases 6.3% –
– Average Occupancy Increases 190 bps to 95.5% –
– Acquires 5 Communities for $198 Million –
– Richard H. Ross Named Chief Executive Officer in April 2014 –
AVENTURA, FL, May 7, 2014 – Trade Street Residential, Inc. (NASDAQ: TSRE) (the “Company”), a vertically integrated and self-managed real estate investment trust focused on acquiring, owning, operating and managing high-quality, conveniently located, apartment communities in mid-sized cities and suburban submarkets of larger cities primarily in the southeastern United States and Texas, today announced consolidated results for the first quarter ended March 31, 2014.
Operational and Financial Highlights for First Quarter 2014
| · | Reported Core FFO of $0.9 million, or $0.03 per diluted share. |
| · | Same store net operating income, or same store NOI, increased 6.3% compared to the same period in the prior year. Over the same period, same store revenue increased 6.8% and same store expenses increased 7.4%. |
| · | Same store average occupancy was 95.5% at quarter end, a gain of 190 basis points compared to the same period last year. |
| · | Same store average rent increased to $871 per unit, an increase of 2.7% compared to the same period last year. Average rent across the entire portfolio was $948. |
| · | Acquired five communities totaling 1,530 units for an aggregate investment of $198 million. |
| · | Subsequent to the end of the first quarter, Richard H. Ross was appointed to the permanent position of Chief Executive Officer, and interim Chief Financial Officer. |
“We are pleased to report strong growth in revenue and net operating income for another consecutive quarter as we continue to capture higher rental rates and maintain our occupancy levels,” stated Richard Ross, Chief Executive Officer and interim Chief Financial Officer of Trade Street Residential. “During the quarter, we expanded our capital base, strengthened our balance sheet and further improved the quality and age of our operating property portfolio with the acquisition of five well-located luxury apartment communities for approximately $198 million. As we look to the balance of 2014, we believe our company is attractively positioned and we remain focused on continuing to improve our operating metrics, strengthen our balance sheet and generate stable cash flow.”
Financial Results for the Three Months Ended March 31, 2014
Net loss attributable to common stockholders for the first quarter of 2014 was a net loss of ($15.2) million as compared to net income of $6.8 million in the prior year period. The net loss for the first quarter of 2014 was primarily the result of a $9.0 million charge related to the costs associated with the separation from the Company of certain members of senior management (as discussed below under “Management and Director Transition”). Net income for the first quarter of 2013 included a one-time gain of $11.7 million related to the extinguishment of equity securities. The net loss per basic and diluted share for the first quarter of 2014 was ($0.48), a change from net income per share of $1.44 in the prior year period, primarily as a result of the foregoing factors.
Funds from Operations, or FFO, for the first quarter of 2014 was a deficit of ($10.6) million, or ($0.31) per diluted share, as compared to a deficit of ($1.6) million, or ($0.34) per diluted share in the prior year period. The decrease in FFO is largely the result of the charge related to the management transitions. Core FFO for the first quarter of 2014 was $0.9 million, or $0.03 per diluted share, as compared to a deficit of ($0.5) million, or ($0.11) per diluted share in the prior year period. The increase in Core FFO from the prior period is largely the result of $3.1 million of additional NOI from the ten properties acquired since March 2013, partially offset by increased interest expense and additional general and administrative expenses during the first quarter of 2014.
Portfolio Performance
Same store NOI for the first quarter of 2014 was $2.9 million as compared to $2.8 million in the same period in the prior year. Same store NOI increased 6.3% as compared to the first quarter of the prior year, driven primarily by a 6.8% increase in same store revenue, partially offset by a 7.4% increase in same store property expenses. The increase in same store revenue was primarily attributable to a 190 basis point increase in average occupancy to 95.5%, and a 2.7% increase in average rent to $871 per month. The increase in same store expenses was primarily attributable to increased property taxes, salaries and benefits as well as weather related expenses incurred during the first quarter 2014.
On a sequential quarter basis, first quarter 2014 same store revenue increased 0.2% compared to the fourth quarter of 2013, while same store property expenses decreased 3.8% resulting in a same store NOI increase of 4.0%. The reduction in property expenses is primarily due to lower repair and maintenance costs in the first quarter of 2014.
Transaction Activity
In January 2014, the Company acquired The Estates at Wake Forest, a newly-constructed 288-unit Class A luxury apartment community located in Wake Forest (Raleigh), North Carolina, for approximately $37.3 million. The Company obtained a mortgage of $18.6 million for seven years and used a portion of the cash received from its recently closed rights offering to fund the purchase price. The mortgage bears interest at a fixed rate of 3.9% with interest only payments for the full term of the loan.
In January 2014, the Company also acquired Miller Creek at Germantown, a newly-constructed 330-unit Class A luxury apartment community located in Germantown (Memphis), Tennessee, for approximately $43.8 million. The Company obtained a mortgage of $26.3 million and used a portion of the cash received from its recently closed rights offering to fund the purchase price. The mortgage bears interest at a fixed rate of 4.6% for ten years with three years of interest only payments followed by principal and interest payments based on a 30-year amortization schedule thereafter.
In February 2014, the Company acquired The Aventine Greenville, a newly constructed 346-unit Class A luxury apartment community located in Greenville, South Carolina, for approximately $41.9 million. The company obtained a mortgage of $21.0 million and used a portion of the cash received from its recently closed rights offering to fund the purchase price. The mortgage bears interest at a fixed rate of 3.7% for seven years with five years of interest only payments followed by principal and interest payments based on a 30-year amortization schedule thereafter.
In March 2014, the Company acquired Waterstone at Brier Creek, a newly-constructed 232-unit Class A luxury apartment community located in Raleigh, North Carolina, for approximately $32.7 million. The Company obtained a mortgage of $16.3 million and used a portion of the cash received from its recently closed rights offering to fund the purchase price. The mortgage bears interest at a fixed rate of 3.7% for eight years with interest only payments for the full term of the loan.
In March 2014, the Company also acquired The Avenues at Craig Ranch, a newly-constructed 334-unit Class A luxury apartment community located in McKinney (Dallas), Texas, for approximately $42.4 million. The Company obtained a mortgage of $21.2 million and used a portion of the cash received from its recently closed rights offering to fund the purchase price. The mortgage bears interest at a fixed rate of 3.8% for seven years with interest only payments for the full term of the loan.
Subsequent to the end of the first quarter, in April 2014, the Company closed on the previously announced acquisition of Waterstone at Big Creek, a newly-constructed 270-unit apartment community located in Alpharetta (Atlanta), Georgia, for approximately $40.5 million. The Company utilized cash on hand and borrowings under its current revolving credit facility to fund the purchase.
As a result of acquisition activity during the first quarter of 2014 and subsequent acquisition of Waterstone at Big Creek, the Company owns 21 properties comprising 5,255 units and with a weighted average age of 10.5 years as of the date of this release.
Balance Sheet and Financing Activity
As of March 31, 2014, the Company had total debt outstanding of $316.1 million at a weighted average interest rate of 3.9%, with 94.3% of the total debt at fixed rates and a weighted average term-to-maturity of 8.2 years.
In January 2014, the Company completed its $150 million recapitalization transaction, raising proceeds of $100 million in an offering of 15,797,789 shares of common stock at $6.33 per share to the holders of subscription rights granted to existing stockholders as of December 16, 2013, and a concurrent $50 million private placement of shares of common stock to certain investment entities managed or advised by Senator Investment Group LP (collectively, "Senator") at $6.33 per share. In addition, Senator agreed to a backstop commitment to purchase all shares not purchased by holders of rights in the rights offering. Holders of subscription rights in the rights offering acquired $98.5 million, or approximately 98.5% of the shares available in the rights offering. Following the completion of the transactions, Senator owned approximately 25.5% of the 36,576,096 shares of outstanding common stock of the Company as of March 31, 2014.
In January 2014, the Company entered into a new $75 million senior secured credit facility with an accordion feature allowing the Company to increase borrowing capacity to $250 million, subject to certain approvals. The credit facility has an initial three-year term that can be extended at the Company's option for up to two, one-year periods and has a variable interest rate of LIBOR plus a spread of 1.75% to 2.75%, depending on the Company's consolidated leverage ratio.
In addition, in conjunction with the closing of the new credit facility, the Company paid off approximately $29.6 million of variable rate debt and, in February 2014, the Company refinanced two of its properties, Estates at Millenia and Fountains Southend, which had 2014 debt maturities aggregating $65 million, with long-term fixed rate loans.
Management and Director Transition
In February 2014, Richard H. Ross, was appointed by the Company's Board of Directors as interim chief executive officer. Subsequent to the end of the first quarter, in April 2014, the Company’s Board of Directors appointed Mr. Ross to the permanent position of chief executive officer. Mr. Ross continues to serve as chief financial officer in an interim role.
Mr. Ross replaced Michael Baumann, who decided to step down as the Company's chief executive officer and as Chairman in February 2014. Mack Pridgen, chairman of the Company's audit committee and its lead independent director, was appointed as Chairman of the Company's Board of Directors.
Also in February 2014, Ryan Hanks, the Company's chief investment officer, was appointed as interim chief operating officer. On March 18, 2014, David Levin decided to step down as the Company’s President and Vice Chairman. As a result of these departures, the Company recorded a one-time charge in the first quarter of 2014 of approximately $9.0 million, of which approximately $3.2 million was paid in cash, $3.3 million was paid in shares of the Company’s stock, and $2.5 million was charged relating to the conversion of Class B contingent units in the Company's operating partnershipinto common units of operating partnership.
In addition, during the first quarter of 2014, Lewis Gold, Sergio Rok and James Boland resigned from the Company’s Board of Directors. Following these additional departures, the Board of Directors approved a reduction in the size of the board to five members, versus nine previously.
Dividend
On February 12, 2014, the Company’s Board of Directors declared a dividend in the amount of $0.095 per share and unit, payable to holders of record of common stock and common operating partnership units as of March 31, 2014, which was paid on April 15, 2014.
Conference Call and Webcast
The Company will host a webcast and conference call on Thursday, May 8, 2014 at 11:00 a.m. Eastern Time to review first quarter results and discuss recent events. To participate in the call, please dial 877-705-6003 (domestic) or 201-493-6725 (international). The live webcast will be available at www.tradestreetresidential.com in the Investors section. A replay of the conference call will be available through June 8, 2014, by dialing 877-870-5176 (domestic) or 858-384-5517 (international) and entering the pass code13580673. Supplemental financial information is available in the Investor Relations section of the Company’s website under Financial Information.
About Trade Street Residential, Inc.
Trade Street Residential, Inc. is a vertically integrated and self-managed real estate investment trust focused on acquiring, owning, operating and managing conveniently located, garden-style and mid-rise apartment communities in mid-sized cities and suburban submarkets of larger cities primarily in the southeastern United States, including Texas.
Forward-Looking Statements
This press release contains forward-looking statements within the meaning of the federal securities laws, including statements related to the offering and the expected use of the net proceeds therefrom, which are based on current expectations, forecasts and assumptions that involve risks and uncertainties that could cause actual outcomes and results to differ materially. Forward looking statements relate to expectations, beliefs, projections, future plans and strategies, anticipated events or trends and similar expressions concerning matters that are not historical facts. In some cases, you can identify forward-looking statements by the use of forward-looking terminology such as "may," "will," "should," "expects," "intends," "plans," "anticipates," "believes," "estimates," "predicts," or "potential" or the negative of these words and phrases or similar words or phrases, which are predictions of or indicate future events or trends and which do not relate solely to historical matters. While forward-looking statements reflect the Company's good faith beliefs, assumptions and expectations, they are not guarantees of future performance. Furthermore, the Company disclaims any obligation to publicly update or revise any forward-looking statement to reflect changes in underlying assumptions or factors, of new information, data or methods, future events or other changes, except as may be required by law. For a further discussion of these and other factors that could impact the Company's future results, performance or transactions, see the section entitled "Risk Factors" in the Company's Annual Report on Form 10-K for the year ended December 31, 2013, which the Company filed with the Securities and Exchange Commission on March 26, 2014.
Non-GAAP Financial Measures
As defined by the National Association of Real Estate Investment Trusts, FFO represents net income (loss) (computed in accordance with U.S. generally accepted accounting principles ("GAAP")), excluding gains (or losses) from sales of property and bargain purchase gains, plus real estate-related depreciation and amortization and after adjustments for unconsolidated partnerships and joint ventures. Adjustments for unconsolidated partnerships and joint ventures will be calculated to reflect FFO on the same basis. The Company presents FFO attributable to common stockholders because management considers it to be an important supplemental measure of the Company’s operating performance, believes it assists in the comparison of the Company’s operating performance between periods to that of different REITs and believes it is frequently used by securities analysts, investors and other interested parties in the evaluation of REITs, many of which present FFO when reporting their operating results. As such, the Company also excludes the impact of noncontrolling interests, only as they relate to operating partnership units, in the calculation. FFO is intended to exclude GAAP historical cost depreciation and amortization of real estate and related assets, which assumes that the value of real estate diminishes ratably over time. Historically, however, real estate values have risen or fallen with market conditions. Because FFO excludes depreciation and amortization unique to real estate, gains and losses from property dispositions and extraordinary items, it provides a performance measure that, when compared year over year, reflects the impact to operations from trends in occupancy rates, rental rates, operating costs, development activities and interest costs, providing perspective not immediately apparent from net income. In October 2011, NAREIT communicated to its members that the exclusion of impairment write-downs of depreciable real estate is consistent with the definition of FFO and prior periods should be restated to be consistent with this guidance.
The Company also uses core funds from operations, or Core FFO, as an operating measure. Core FFO includes adjustments to exclude the impact of straight-line adjustments for ground leases, gains and losses from extinguishment of debt, transaction costs related to acquisitions and reorganization, management transition costs and certain other non-cash items. The Company believes that these adjustments are appropriate in determining Core FFO as they are not indicative of the operating performance of the Company’s assets. In addition, the Company believes that Core FFO is a useful supplemental measure for the investing community to use in comparing the Company to other REITs as most REITs provide some form of adjusted or modified FFO.
Management believes that net operating income (“NOI”) is a useful measure of our operating performance. We define NOI as total property revenues less total property operating expenses, excluding depreciation and amortization. Other REITs may use different methodologies for calculating NOI, and accordingly, our NOI may not be comparable to other REITs. We believe that this measure provides an operating perspective not immediately apparent from GAAP operating income or net income. We use NOI to evaluate our performance on a same store and non-same store basis. NOI allows us to evaluate the operating performance of our properties because it measures the core operations of property performance by excluding corporate level expenses and other items not related to property operating performance and captures trends in rental housing and property operating expenses.
The Company defines same store communities as communities owned and stabilized for the entirety of both periods presented, excluding properties held for sale. Reconciliations of net income attributable to common stockholders to FFO, Core FFO, NOI, and same store NOI are included in the Supplemental Information posted on the Company’s website.
Investor Relations:
Stephen Swett
786-248-6099
ir@trade-street.com
| Trade Street Residential, Inc. | |
| 1st Quarter 2014 | Operating Results |
| (Unaudited) | |
| | | Three Months Ended March 31, | |
| in thousands, except per share amounts | | 2014 | | | 2013 | |
| | | | | | | |
| Property revenues | | | | | | | | |
| Rental revenue | | $ | 10,266 | | | $ | 4,847 | |
| Other property revenues | | | 1,144 | | | | 438 | |
| Total property revenues | | | 11,410 | | | | 5,285 | |
| | | | | | | | | |
| Property expenses | | | | | | | | |
| Property operations | | | 3,370 | | | | 1,636 | |
| Real estate taxes and insurance | | | 1,931 | | | | 795 | |
| Total property expenses | | | 5,301 | | | | 2,431 | |
| | | | | | | | | |
| Other expenses | | | | | | | | |
| General and administrative | | | 2,095 | | | | 1,559 | |
| Management transition expenses | | | 9,041 | | | | - | |
| Interest expense | | | 2,873 | | | | 1,889 | |
| Depreciation and amortization | | | 4,720 | | | | 2,245 | |
| Development and pursuit costs | | | 45 | | | | - | |
| Acquisition costs | | | 1,505 | | | | 222 | |
| Amortization of deferred financing cost | | | 316 | | | | 371 | |
| Loss on early extinguishment of debt | | | 1,629 | | | | 815 | |
| Total other expenses | | | 22,224 | | | | 7,101 | |
| | | | | | | | | |
| Other income | | | 43 | | | | 22 | |
| Income (loss) from unconsolidated joint venture | | | (9 | ) | | | 37 | |
| | | | | | | | | |
| LOSS FROM CONTINUING OPERATIONS | | | (16,081 | ) | | | (4,188 | ) |
| | | | | | | | | |
| DISCONTINUED OPERATIONS: | | | | | | | | |
| Loss on operations of rental property | | | - | | | | (109 | ) |
| Gain from sale of rental property | | | - | | | | 1,596 | |
| INCOME FROM DISCONTINUED OPERATIONS | | | - | | | | 1,487 | |
| | | | | | | | | |
| NET LOSS | | | (16,081 | ) | | | (2,701 | ) |
| Loss allocated to noncontrolling interest holders | | | 1,099 | | | | 555 | |
| Dividends declared and accreted on preferred stock and units | | | (228 | ) | | | (254 | ) |
| Extinguishment of equity securities | | | - | | | | 11,716 | |
| Adjustments attributable to participating securities | | | 16 | | | | (2,521 | ) |
| NET INCOME (LOSS) ATTRIBUTABLE TO COMMON STOCKHOLDERS | | $ | (15,194 | ) | | $ | 6,795 | |
| | | | | | | | | |
| Earnings (loss) per common share - basic and diluted | | | | | | | | |
| Continuing operations | | $ | (0.48 | ) | | $ | 1.12 | |
| Discontinued operations | | | - | | | | 0.32 | |
| Net earnings (loss) attributable to common stockholders | | $ | (0.48 | ) | | $ | 1.44 | |
| | | | | | | | | |
| Weighted average number of shares - basic and diluted | | | 31,746 | | | | 4,717 | |
| | | | | | | | | |
| Dividends declared per common share | | $ | 0.0950 | | | $ | 0.0855 | |
| Trade Street Residential, Inc. | |
| 1st Quarter 2014 | Funds From Operations and Core Funds from Operations |
| (Unaudited) | |
| | | Three Months Ended March 31, | |
| in thousands, except per share and property data amounts | | 2014 | | | 2013 | |
| | | | | | | |
| | | | | | | |
| Net income (loss) attributable to common stockholders | | $ | (15,194 | ) | | $ | 6,795 | |
| | | | | | | | | |
| Adjustments related to earnings per share computation (1) | | | (16 | ) | | | (9,195 | ) |
| Real estate depreciation and amortization - continuing operations | | | 4,480 | | | | 1,784 | |
| Real estate depreciation and amortization - discontinued operations | | | - | | | | 213 | |
| Real estate depreciation and amortization - unconsolidated joint venture | | | 93 | | | | 75 | |
| Gain on sale of discontinued operations | | | - | | | | (1,268 | ) |
| | | | | | | | | |
| Funds from operations attributable to common stockholders(2) | | | (10,637 | ) | | | (1,596 | ) |
| | | | | | | | | |
| Management transition expenses | | | 8,423 | | | | - | |
| Acquisition costs | | | 1,402 | | | | 176 | |
| Loss on early extinguishment of debt | | | 1,518 | | | | 648 | |
| Non-cash straight-line adjustment for ground lease expenses | | | - | | | | 83 | |
| Non-cash stock awards | | | 27 | | | | - | |
| Non-cash accretion of preferred stock and units | | | 152 | | | | 185 | |
| | | | | | | | | |
| Core funds from operations attributable to common stockholders (2) | | $ | 885 | | | $ | (504 | ) |
| | | | | | | | | |
| Per share data | | | | | | | | |
| Funds from operations - diluted | | $ | (0.31 | ) | | $ | (0.34 | ) |
| Core funds from operations - diluted | | $ | 0.03 | | | $ | (0.11 | ) |
| | | | | | | | | |
| Weighted average common shares outstanding - diluted(3)(4) | | | 34,293 | | | | 4,717 | |
| 1 | See notes B and G to consolidated financial statements as filed in our Annual Report on Form 10-K for the year ended December 31, 2013. |
| 2 | See page 20 for the Company's definition of these non-GAAP measures. Individual line items included in the computations are net of noncontrolling interests and include results from discontinued operations where applicable. |
| 3 | Includes non-vested portion of restricted stock awards. |
| 4 | Includes the conversion of 210,915 Class B contingent units into 2,343,500 Operating Partnership common units during the three months ended March 31, 2014. |
| Trade Street Residential, Inc. | |
| 1st Quarter 2014 | Consolidated Balance Sheets |
| (Unaudited) | |
| in thousands | | March 31, 2014 | | | December 31, 2013 | |
| | | | | | | |
| ASSETS | | | | | | | | |
| Real estate assets | | | | | | | | |
| Land and improvements | | $ | 84,688 | | | $ | 58,560 | |
| Buildings and improvements | | | 436,366 | | | | 272,849 | |
| Furniture, fixtures, and equipment | | | 14,751 | | | | 9,016 | |
| | | | 535,805 | | | | 340,425 | |
| Less accumulated depreciation | | | (17,363 | ) | | | (14,369 | ) |
| Net investment in operating properties | | | 518,442 | | | | 326,056 | |
| | | | | | | | | |
| Land held for future development (including $0 and $1,477 of consolidated variable interest entity, respectively) | | | 12,961 | | | | 31,963 | |
| Land held for sale | | | 19,125 | | | | - | |
| Net real estate assets | | | 550,528 | | | | 358,019 | |
| | | | | | | | | |
| | | | | | | | | |
| Investment in unconsolidated joint venture | | | 2,337 | | | | 2,421 | |
| Cash and cash equivalents (including $0 and $148 of consolidated variable interest entity, respectively) | | | 15,852 | | | | 9,037 | |
| Restricted cash and lender reserves | | | 8,574 | | | | 3,203 | |
| Deferred financing costs, net | | | 5,234 | | | | 3,022 | |
| Intangible assets, net | | | 3,064 | | | | 1,571 | |
| Prepaid expenses and other assets | | | 1,792 | | | | 10,363 | |
| Assets related to assets held for sale | | | 555 | | | | - | |
| | | | 37,408 | | | | 29,617 | |
| | | | | | | | | |
| TOTAL ASSETS | | $ | 587,936 | | | $ | 387,636 | |
| | | | | | | | | |
| LIABILITIES | | | | | | | | |
| Indebtedness | | $ | 316,053 | | | $ | 249,584 | |
| Accrued interest payable | | | 791 | | | | 840 | |
| Accounts payable and accrued expenses | | | 4,749 | | | | 6,119 | |
| Dividends payable | | | 3,773 | | | | 1,247 | |
| Security deposits, deferred rent and other liabilities | | | 1,856 | | | | 1,443 | |
| Liabilities related to assets held for sale | | | 24 | | | | - | |
| TOTAL LIABILITIES | | | 327,246 | | | | 259,233 | |
| | | | | | | | | |
| Commitments & contingencies | | | - | | | | - | |
| | | | | | | | | |
| STOCKHOLDERS' EQUITY | | | | | | | | |
| Class A preferred stock; $0.01 par value; 423 shares authorized, 309 shares issued and outstanding at March 31, 2014 and December 31, 2013 | | | 3 | | | | 3 | |
| Common stock, $0.01 par value per share; 1,000,000 authorized; 36,576 and 4,717 shares issued and outstanding at March 31, 2014 and December 31, 2013, respectively | | | 366 | | | | 115 | |
| Additional paid-in capital | | | 310,516 | | | | 162,681 | |
| Accumulated deficit | | | (67,035 | ) | | | (52,053 | ) |
| TOTAL STOCKHOLDERS' EQUITY - TRADE STREET RESIDENTIAL, INC. | | | 243,850 | | | | 110,746 | |
| Noncontrolling interests | | | 16,840 | | | | 17,657 | |
| TOTAL STOCKHOLDERS' EQUITY | | | 260,690 | | | | 128,403 | |
| | | | | | | | | |
| TOTAL LIABILITIES AND STOCKHOLDERS' EQUITY | | $ | 587,936 | | | $ | 387,636 | |
| Trade Street Residential, Inc. | |
| 1st Quarter 2014 | Operating Properties Table |
| (Unaudited) | |
| Property Name | | Location | | Year Built/
Renovated (1) | | | Date
Acquired | | Number of
Units | | | Average Unit Size
(Sq. Ft.) | | | Average Physical
Occupancy(2) | |
| | | | | | | | | | | | | | | | | |
| The Pointe at Canyon Ridge | | Sandy Springs, GA | | | 1986/2007 | | | 09/18/08 | | | 494 | | | | 920 | | | | 94.9 | % |
| Arbors River Oaks | | Memphis, TN | | | 1990/2010 | | | 06/09/10 | | | 191 | | | | 1,136 | | | | 96.3 | % |
| The Estates at Perimeter(3) | | Augusta, GA | | | 2007 | | | 09/01/10 | | | 240 | | | | 1,109 | | | | 97.0 | % |
| Lakeshore on the Hill | | Chattanooga, TN | | | 1969/2005 | | | 12/14/10 | | | 123 | | | | 1,168 | | | | 94.8 | % |
| The Trails of Signal Mountain | | Chattanooga, TN | | | 1975 | | | 05/26/11 | | | 172 | | | | 1,185 | | | | 97.3 | % |
| Post Oak | | Louisville, KY | | | 1982/2005 | | | 07/28/11 | | | 126 | | | | 881 | | | | 96.9 | % |
| Mercé Apartments | | Addison, TX | | | 1991/2007 | | | 10/31/11 | | | 114 | | | | 653 | | | | 98.1 | % |
| Park at Fox Trails | | Plano, TX | | | 1981 | | | 12/06/11 | | | 286 | | | | 960 | | | | 97.0 | % |
| Estates at Millenia | | Orlando, FL | | | 2012 | | | 12/03/12 | | | 297 | | | | 952 | | | | 90.6 | % |
| Westmont Commons | | Asheville, NC | | | 2003&2008 | | | 12/12/12 | | | 252 | | | | 1,009 | | | | 97.3 | % |
| Vintage at Madison Crossing | | Huntsville, AL | | | 2002 | | | 03/04/13 | | | 178 | | | | 1,047 | | | | 98.2 | % |
| St. James at Goose Creek | | Goose Creek, SC | | | 2009 | | | 05/16/13 | | | 244 | | | | 976 | | | | 96.7 | % |
| Creekstone at RTP | | Durham, NC | | | 2013 | | | 05/17/13 | | | 256 | | | | 1,043 | | | | 96.6 | % |
| Talison Row | | Charleston, SC | | | 2013 | | | 08/26/13 | | | 274 | | | | 989 | | | | 88.0 | % |
| Fountains Southend | | Charlotte, NC | | | 2013 | | | 09/24/13 | | | 208 | | | | 844 | | | | 98.4 | % |
| Estates at Wake Forest(4) | | Wake Forest, NC | | | 2013 | | | 01/21/14 | | | 288 | | | | 1,047 | | | | - | |
| Miller Creek at Germantown(4) | | Memphis, TN | | | 2012/2013 | | | 01/21/14 | | | 330 | | | | 1,049 | | | | - | |
| Aventine Greenville (4) | | Greenville SC | | | 2013 | | | 02/06/14 | | | 346 | | | | 961 | | | | - | |
| Waterstone at Brier Creek(4) | | Raleigh, NC | | | 2013/2014 | | | 03/10/14 | | | 232 | | | | 1,137 | | | | - | |
| Avenues of Craig Ranch (4) | | McKinney, TX | | | 2013 | | | 03/18/14 | | | 334 | | | | 1,006 | | | | - | |
| | | | | | | | | | | | | | | | | | | | | |
| Total / Weighted Average | | | | | | | | | | | 4,985 | | | | 1,003 | | | | 95.5 | % |
| | | Three Months Ended | |
| | | March 31, | |
| | | | |
| Total operating properties (end of period) | | | 20 | |
| Total operating apartment units (end of period) | | | 4,985 | |
| Total operating apartment units - wholly owned, continuing operations (end of period) | | | 4,745 | |
| Total operating apartment units (weighted average) | | | 4,235 | |
| Total operating apartment units - wholly owned, continuing operations (weighted average) | | | 3,995 | |
| 1 | The extent of the renovations included within the term “renovated” depends on the individual apartment community, but “renovated” generally refers to the replacement of siding, roof, wood, windows or boilers, updating of gutter systems, renovation of leasing centers and interior rehabilitation, including updated appliances, countertops, vinyl plank flooring, fixtures, fans and lighting, or some combination thereof. |
| 2 | Average physical occupancy represents the average occupancy for the three months ended March 31, 2014 of the total number of units occupied at each apartment community during the period divided by the total number of units at each apartment community. |
| 3 | We own a 50% interest in this apartment community through an unconsolidated joint venture. |
| 4 | We acquired these apartment communities during the first quarter of 2014 and, as such, average physical occupancy for these communities has been excluded from this table. |
| Trade Street Residential, Inc. | |
| 1st Quarter 2014 | Same Store NOI Comparisons(1) |
| (Unaudited) | |
| | | Quarter to Quarter Comparisons | |
| | | Three Months Ended March 31, | |
| in thousands, except property data amounts | | 2014 | | | 2013 | | | % Change | |
| | | | | | | | | | |
| Revenues | | $ | 5,507 | | | $ | 5,155 | | | | 6.8 | % |
| Expenses | | | 2,560 | | | | 2,383 | | | | 7.4 | % |
| Net operating income (NOI)(2) | | $ | 2,947 | | | $ | 2,772 | | | | 6.3 | % |
| | | | | | | | | | | | | |
| Average physical occupancy(3) | | | 95.5 | % | | | 93.6 | % | | | 2.0 | % |
| | | | | | | | | | | | | |
| Average monthly rental rate (4) | | $ | 871 | | | $ | 848 | | | | 2.7 | % |
| | | Sequential Quarter Comparisons | |
| | | Three Months Ended | |
| | | March 31, 2014 | | | December 31, 2013 | | | % Change | |
| | | | | | | | | | |
| Revenues | | $ | 5,507 | | | $ | 5,496 | | | | 0.2 | % |
| Expenses | | | 2,560 | | | | 2,661 | | | | -3.8 | % |
| Net operating income (NOI)(2) | | $ | 2,947 | | | $ | 2,835 | | | | 4.0 | % |
| | | | | | | | | | | | | |
| Average physical occupancy(3) | | | 95.5 | % | | | 95.6 | % | | | -0.1 | % |
| | | | | | | | | | | | | |
| Average monthly rental rate (4) | | $ | 871 | | | $ | 871 | | | | - | |
| 1 | We define “Same Store” as properties owned and stabilized since January 1, 2013 through March 31, 2014 excluding properties held for sale. For newly constructed or lease-up properties or properties undergoing significant redevelopment, we consider a property to be stabilized at the earlier of (i) attainment of 90% physical occupancy or (ii) the one-year anniversary of completion of development or redevelopment. No properties owned since January 1, 2013 were under construction or undergoing redevelopment and, as a result, no properties owned since January 1, 2013 were excluded from the same store portfolio. For the three months ended March 31, 2014, "Same Store" properties are comprised of: The Pointe at Canyon Ridge, Arbor River Oaks, Lakeshore on the Hill, The Trails of Signal Mountain, Post Oak, Mercé Apartments, Park at Fox Trails, Estates at Millenia, and Westmont Commons. |
| 2 | See page 20 for the Company's definition of this non-GAAP measure and page 22 for a reconciliation of this non-GAAP measure to net income attributable to common stockholders. |
| 3 | Average physical occupancy for the periods presented represent the average of the total number of units occupied at each apartment community during the respective period divided by the total number of units at each apartment community. |
| 4 | Average rental rates for the periods presented are the Company’s market rents after “loss to lease” and concessions, but before vacancy, discounted employee units, model units, and bad debt for the respective periods. |
| Trade Street Residential, Inc. | |
| 1st Quarter 2014 | Same Store Operating Expense Comparisons |
| (Unaudited) | |
| | | Quarter to Quarter Comparisons | |
| | | Three Months Ended March 31, | |
| in thousands | | 2014 | | | 2013 | | | $ Change | | | % Change | | | % of 2014 Actual | |
| | | | | | | | | | | | | | | | |
| Property taxes | | $ | 698 | | | $ | 659 | | | $ | 39 | | | | 5.9 | % | | | 27.3 | % |
| Salaries and benefits for on-site employees | | | 726 | | | | 690 | | | | 36 | | | | 5.2 | % | | | 28.3 | % |
| Utilities | | | 384 | | | | 369 | | | | 15 | | | | 4.1 | % | | | 15.0 | % |
| Repairs and maintenance | | | 131 | | | | 147 | | | | (16 | ) | | | (10.9 | )% | | | 5.1 | % |
| Make Ready/turnover | | | 114 | | | | 92 | | | | 22 | | | | 23.9 | % | | | 4.5 | % |
| Property insurance | | | 134 | | | | 124 | | | | 10 | | | | 8.1 | % | | | 5.2 | % |
| Other | | | 373 | | | | 302 | | | | 71 | | | | 23.5 | % | | | 14.6 | % |
| Total Same Property | | $ | 2,560 | | | $ | 2,383 | | | $ | 177 | | | | 7.4 | % | | | 100.0 | % |
| | | Sequential Quarter Comparisons | |
| | | Three Months Ended | |
| | | March 31, 2014 | | | December 31, 2013 | | | $ Change | | | % Change | | | % of 2014 Actual | |
| | | | | | | | | | | | | | | | |
| Property taxes | | $ | 698 | | | $ | 739 | | | $ | (41 | ) | | | (5.5 | )% | | | 27.3 | % |
| Salaries and benefits for on-site employees | | | 726 | | | | 659 | | | | 67 | | | | 10.2 | % | | | 28.3 | % |
| Utilities | | | 384 | | | | 360 | | | | 24 | | | | 6.7 | % | | | 15.0 | % |
| Repairs and maintenance | | | 131 | | | | 211 | | | | (80 | ) | | | (37.9 | )% | | | 5.1 | % |
| Make Ready/turnover | | | 114 | | | | 151 | | | | (37 | ) | | | (24.5 | )% | | | 4.5 | % |
| Property insurance | | | 134 | | | | 136 | | | | (2 | ) | | | (1.5 | )% | | | 5.2 | % |
| Other | | | 373 | | | | 405 | | | | (32 | ) | | | (7.9 | )% | | | 14.6 | % |
| Total Same Property | | $ | 2,560 | | | $ | 2,661 | | | $ | (101 | ) | | | -3.8 | % | | | 100.0 | % |
| Trade Street Residential, Inc. | | |
| 1st Quarter 2014 | Acquisitions and Dispositions / Land Investments | |
| (Unaudited) | |
| in thousands, except property data amounts | | | | | | | | | | | | | |
| | | | | | | | | | | | | | | | | | |
| Acquisitions: | | | | | | | Percent Leased at | | | Date | | | Gross | | | Debt Balance at | |
| Property | | Location | | Units | | | March 31, 2014 | | | Acquired | | | Purchase Price | | | March 31, 2014 | |
| | | | | | | | | | | | | | | | | | |
| Estates at Wake Forest | | Wake Forest, NC | | | 288 | | | | 60.4 | % | | | 1/21/2014 | | | $ | 37,250 | | | $ | 18,625 | |
| Miller Creek at Germantown | | Germantown, TN | | | 330 | | | | 93.3 | % | | | 1/21/2014 | | | | 43,750 | | | | 26,250 | |
| Aventine Greenville | | Greenville, SC | | | 346 | | | | 79.8 | % | | | 2/6/2014 | | | | 41,866 | | | | 21,000 | |
| Waterstone at Brier Creek | | Raleigh, NC | | | 232 | | | | 48.5 | % | | | 3/10/2014 | | | | 32,682 | | | | 16,250 | |
| Avenues of Craig Ranch | | McKinney, TX | | | 334 | | | | 77.5 | % | | | 3/18/2014 | | | | 42,375 | | | | 21,200 | |
| | | | | | | | | | | | | | | | | | | | | | | |
| Total acquisitions three months ended March 31 | | | 1,530 | | | | | | | | | | | $ | 197,923 | | | $ | 103,325 | |
| Land held for future development: | | | | | | | | | | Carrying | |
| | | | | Planned | | | | | | Value as of | |
| Project | | Location | | Units | | | Acreage | | | March 31, 2014 | |
| | | | | | | | | | | | |
| Estates at Millenia - Phase II | | Orlando, FL | | | 403 | | | | 7.0 | | | | 12,961 | |
| | | | | | | | | | | | | | | |
| Total land held for future development: | | | | | 403 | | | | 7.0 | | | $ | 12,961 | |
| Trade Street Residential, Inc. | | |
| 1st Quarter 2014 | Acquisitions Pipeline and NOI Summary |
| (Unaudited) | | |
| in thousand, except property data amounts | | | | | | | | | |
| | | | | | | | | | |
| Multifamily Communities: | | | | | | | | | |
| as of March 31, 2014 | | | | | | | | | |
| | | | | | | | | NOI | |
| | | Units | | | Communities | | | Quarter Ended | |
| | | | | | | | | | |
| Same Store Communities(1) | | | 2,055 | | | | 9 | | | $ | 2,947 | |
| Stabilized non-same store communities(2) | | | 886 | | | | 4 | | | | 1,760 | |
| Lease-up communities(3) | | | 1,804 | | | | 6 | | | | 1,402 | |
| Wholly-owned communities | | | 4,745 | | | | 19 | | | | 6,109 | |
| Joint venture communities | | | 240 | | | | 1 | | | | 199 | |
| | | | | | | | | | | | | |
| Total Multifamily communities | | | 4,985 | | | | 20 | | | $ | 6,308 | |
Acquisitions Subsequent to March 31, 2014:
| | | | | Acquired | | | Percent Leased at | | | Date | | | Purchase | | | Expected | |
| Project | | Location | | Units | | | March 31, 2014 | | | Closed | | | Price | | | Stabilized | |
| | | | | | | | | | | | | | | | | | |
| Waterstone at Big Creek | | Alpharetta, GA | | | 270 | | | | 90.0 | % | | | 4/7/2014 | | | $ | 40,500 | | | | 2Q14 | |
| Total acquisitions subsequent to March 31 | | | 270 | | | | 90.0 | % | | | | | | $ | 40,500 | | | | | |
| 1 | For 2014 "Same Store" properties are comprised of: The Pointe at Canyon Ridge, Arbor River Oaks, Lakeshore on the Hill, The Trails of Signal Mountain, Post Oak, Mercé Apartments, Park at Fox Trails, Estates at Millenia, and Westmont Commons. |
| 2 | Communities that were stabilized for the quarter ended March 31, 2014, but do not meet the criteria for "Same Store" properties. These include: Bridge Pointe, St. James at Goose Creek, Creekstone at RTP, and Fountains Southend. |
| 3 | Talison Row, Miller Creek at Germantown, Estates at Wake Forest, Aventine Greenville, Waterstone at Brier Creek, and Avenues of Craig Ranch are all currently in lease-up for the quarter ended March 31, 2014. |
| Trade Street Residential, Inc. | |
| 1st Quarter 2014 | Debt Summary |
| (Unaudited) | |
| in thousands | | | | | | | | | | | | |
| Debt Maturities(1) | | | | | | | | | | | | |
| as of March 31, 2014 | | | | | | | | | | | | |
| | | Scheduled Repayments | | | % of | |
| Year | | Amortization | | | Maturities | | | Total | | | Total | |
| | | | | | | | | | | | | |
| Remainder of 2014 | | $ | 328 | | | $ | - | | | $ | 328 | | | | 0.1 | % |
| 2015 | | | 1,211 | | | | - | | | | 1,211 | | | | 0.4 | % |
| 2016 | | | 1,978 | | | | - | | | | 1,978 | | | | 0.6 | % |
| 2017 | | | 3,411 | | | | 24,254 | | | | 27,665 | | | | 8.8 | % |
| 2018 | | | 3,803 | | | | 7,659 | | | | 11,462 | | | | 3.6 | % |
| Thereafter | | | 20,209 | | | | 253,199 | | | | 273,408 | | | | 86.5 | % |
| | | | | | | | | | | | | | | | | |
| Total | | $ | 30,940 | | | $ | 285,112 | | | $ | 316,052 | | | | 100.0 | % |
| Floating vs. Fixed Rate Debt(1): | | | | | | | | Weighted Average | |
| | | Balance at | | | % of | | | Interest | | | Years to | |
| | | March 31, 2014 | | | Total | | | Rate | | | Maturity | |
| | | | | | | | | | | | | |
| Fixed rate debt | | $ | 298,053 | | | | 94.3 | % | | | 4.03 | % | | | 8.49 | |
| Floating rate debt | | | 18,000 | | | | 5.7 | % | | | 2.18 | % | | | 2.83 | |
| | | | | | | | | | | | | | | | | |
| Total | | $ | 316,053 | | | | 100.0 | % | | | 3.93 | % | | | 8.17 | |
| | | | | | | | | | | | | | | | | |
| Unconsolidated Debt: | | | | | | | | | | | | | | | | |
| | | Balance at | | | YTD | | | Interest | | | | |
| Property | | March 31, 2014 | | | Amortization | | | Rate | | | Maturity | |
| | | | | | | | | | | | | | | | | |
| The Estates at Perimeter(2) | | $ | 17,522 | | | $ | 78 | | | | 4.245 | % | | | 9/1/2017 | |
| 1 | Wholly owned, continuing operations. |
| 2 | Reflects 100% of debt, JV interest is 50%. |
| Trade Street Residential, Inc. | |
| 1st Quarter 2014 | Capitalized Costs Summary |
| (Unaudited) | |
| | | Three Months Ended | |
| in thousands, except number of units | | March 31, 2014 | |
| | | Total | | | Per Unit | |
| Recurring capital expenditures: | | | | | | | | |
| | | | | | | | | |
| Flooring & Carpeting | | $ | 104 | | | $ | 26 | |
| Other | | | 3 | | | | 1 | |
| Total recurring capital expenditures | | $ | 107 | | | $ | 27 | |
| | | | | | | | | |
| Non-recurring capital expenditures: | | | | | | | | |
| | | | | | | | | |
| Plumbing | | $ | 2 | | | $ | - | |
| Rehab of Apartments | | | 64 | | | | 16 | |
| Furniture, Fixtures and Equipment | | | 18 | | | | 5 | |
| Other | | | 77 | | | | 19 | |
| Total non-recurring capital expenditures | | $ | 161 | | | $ | 40 | |
| | | | | | | | | |
| Weighted average units - wholly owned, continuing operations | | | | | | | 3,995 | |
| Trade Street Residential, Inc. | |
| 1st Quarter 2014 | Non-GAAP Financial Measures and Reconciliations |
| (Unaudited) | |
The supplemental financial data contained in this document contains certain non-GAAP financial measures management believes are useful in understanding our business and evaluating our performance. Our definitions and calculations of these non-GAAP financial measures may differ from those of other equity REITs, and thus may not be comparable to other REITs. The non-GAAP financial measures should not be considered as an alternative to net income as an indication of our operating performance, or to net cash provided by operating activities as a measure of our liquidity.
Funds from Operations ("FFO")
As defined by the National Association of Real Estate Investment Trusts, FFO represents net income (loss) (computed in accordance with U.S. generally accepted accounting principles ("GAAP")), excluding gains (or losses) from sales of property and bargain purchase gains, plus real estate-related depreciation and amortization and after adjustments for unconsolidated partnerships and joint ventures. Adjustments for unconsolidated partnerships and joint ventures will be calculated to reflect FFO on the same basis. The Company presents FFO attributable to common stockholders because management considers it to be an important supplemental measure of the Company’s operating performance, believes it assists in the comparison of the Company’s operating performance between periods to that of different REITs and believes it is frequently used by securities analysts, investors and other interested parties in the evaluation of REITs, many of which present FFO when reporting their operating results. As such, the Company also excludes the impact of noncontrolling interests, only as they relate to operating partnership units, in the calculation. FFO is intended to exclude GAAP historical cost depreciation and amortization of real estate and related assets, which assumes that the value of real estate diminishes ratably over time. Historically, however, real estate values have risen or fallen with market conditions. Because FFO excludes depreciation and amortization unique to real estate, gains and losses from property dispositions and extraordinary items, it provides a performance measure that, when compared year over year, reflects the impact to operations from trends in occupancy rates, rental rates, operating costs, development activities and interest costs, providing perspective not immediately apparent from net income. In October 2011, NAREIT communicated to its members that the exclusion of impairment write-downs of depreciable real estate is consistent with the definition of FFO and prior periods should be restated to be consistent with this guidance.
Core Funds from Operations ("Core FFO")
The Company also uses core funds from operations, or Core FFO, as an operating measure. Core FFO includes adjustments to exclude the impact of straight-line adjustments for ground leases, gains and losses from extinguishment of debt, transaction costs related to acquisitions and reorganization, management transition costs and certain other non-cash items. The Company believes that these adjustments are appropriate in determining Core FFO as they are not indicative of the operating performance of the Company’s assets. In addition, the Company believes that Core FFO is a useful supplemental measure for the investing community to use in comparing the Company to other REITs as most REITs provide some form of adjusted or modified FFO.
Net Operating Income ("NOI")
Management believes that net operating income (“NOI”) is a useful measure of our operating performance. We define NOI as total property revenues less total property operating expenses, excluding depreciation and amortization. Other REITs may use different methodologies for calculating NOI, and accordingly, our NOI may not be comparable to other REITs. We believe that this measure provides an operating perspective not immediately apparent from GAAP operating income or net income. We use NOI to evaluate our performance on a same store and non-same store basis. NOI allows us to evaluate the operating performance of our properties because it measures the core operations of property performance by excluding corporate level expenses and other items not related to property operating performance and captures trends in rental housing and property operating expenses.
The Company defines same store communities as communities owned and stabilized for the entirety of both periods presented, excluding properties held for sale. Reconciliations of net income attributable to common stockholders to FFO, Core FFO, NOI, and same store NOI are included in the Supplemental Information posted on the Company’s website.
The following table reflects same store and non-same store contributions to consolidated NOI together with a reconciliation of NOI to net income (loss) attributable to common stockholders, as computed in accordance with GAAP:
| Trade Street Residential, Inc. | |
| 1st Quarter 2014 | NOI Bridge |
| (Unaudited) | |
| | | Three Months Ended March 31, | |
| in thousands | | 2014 | | | 2013 | |
| Property Revenues(1) | | | | | | | | |
| Same Store (9 properties) | | $ | 5,507 | | | $ | 5,155 | |
| Non Same Store (10 properties) | | | 5,903 | | | | 130 | |
| | | | | | | | | |
| Total property revenues | | | 11,410 | | | | 5,285 | |
| | | | | | | | | |
| Property Expenses(1) | | | | | | | | |
| Same Store (9 properties) | | $ | 2,560 | | | $ | 2,383 | |
| Non Same Store (10 properties) | | | 2,741 | | | | 48 | |
| | | | | | | | | |
| Total property expenses | | | 5,301 | | | | 2,431 | |
| | | | | | | | | |
| Net Operating Income(1)(2) | | | | | | | | |
| Same Store (9 properties) | | $ | 2,947 | | | $ | 2,772 | |
| Non Same Store (10 properties) | | | 3,162 | | | | 82 | |
| | | | | | | | | |
| Total property net operating income | | $ | 6,109 | | | $ | 2,854 | |
| | | | | | | | | |
| Reconciliation of NOI to GAAP Net Loss | | | | | | | | |
| | | | | | | | | |
| Total property net operating income | | $ | 6,109 | | | $ | 2,854 | |
| Other income | | | 43 | | | | 22 | |
| Depreciation and amortization | | | (4,720 | ) | | | (2,245 | ) |
| Development and pursuit costs | | | (45 | ) | | | - | |
| Interest expense | | | (2,873 | ) | | | (1,889 | ) |
| Amortization of deferred financing costs | | | (316 | ) | | | (371 | ) |
| Loss on extinguishment of debt | | | (1,629 | ) | | | (815 | ) |
| General and administrative | | | (2,095 | ) | | | (1,559 | ) |
| Management transition expenses | | | (9,041 | ) | | | - | |
| Acquisition costs | | | (1,505 | ) | | | (222 | ) |
| Income (loss) from unconsolidated joint venture | | | (9 | ) | | | 37 | |
| Loss from continuing operations | | | (16,081 | ) | | | (4,188 | ) |
| Discontinued operations | | | - | | | | 1,487 | |
| Net loss | | | (16,081 | ) | | | (2,701 | ) |
| Loss allocated to noncontrolling interests | | | 1,099 | | | | 555 | |
| Adjustments related to earnings per share computation(3) | | | (212 | ) | | | 8,941 | |
| | | | | | | | | |
| Income (loss) attributable to common stockholders | | $ | (15,194 | ) | | $ | 6,795 | |
| | | | | | | | | |
| | | | | | | | | |
| Income from Discontinued Operations | | | | | | | | |
| Property revenues | | | - | | | | 2,105 | |
| Property expenses | | | - | | | | (1,132 | ) |
| Property net operating income | | | - | | | | 973 | |
| Other expenses | | | - | | | | (10 | ) |
| Depreciation and amortization | | | - | | | | (268 | ) |
| Interest expense | | | - | | | | (690 | ) |
| Amortization of deferred financing costs | | | - | | | | (10 | ) |
| Loss on extinguishment of debt | | | - | | | | - | |
| Deferred portion of ground lease amortization | | | - | | | | (104 | ) |
| Gain on sale of discontinued operations | | | - | | | | 1,596 | |
| Income from discontinued operations | | | - | | | | 1,487 | |
| 1 | The Company defines “Same Store” as properties owned and stabilized since January 1, 2013 through March 31, 2014 excluding properties held for sale. For newly constructed or lease-up properties or properties undergoing significant redevelopment, we consider a property to be stabilized at the earlier of (i) attainment of 90% physical occupancy or (ii) the one-year anniversary of completion of development or redevelopment. No properties owned since January 1, 2013 were under construction or undergoing redevelopment and, as a result, no properties owned since January 1, 2013 were excluded from the same store portfolio. |
| 2 | See page 20 for the Company's definition of this non-GAAP measure. |
| 3 | See notes B and G to consolidated financial statements as filed in our Annual Report on Form 10-K for the year ended December 31, 2013. |