
GREAT PANTHER SILVER LIMITED
MANAGEMENT’S DISCUSSION AND ANALYSIS
FOR THE YEAR ENDED DECEMBER 31, 2012
| GREAT PANTHER SILVER LIMITED | |
| YEAR ENDED DECEMBER 31, 2012 | 1 |
TABLE OF CONTENTS
| GREAT PANTHER SILVER LIMITED | |
| YEAR ENDED DECEMBER 31, 2012 | 2 |
This Management’s Discussion and Analysis (“MD&A”) prepared as of March 13, 2013 reviews the financial condition and results of operations of Great Panther Silver Limited (“Great Panther” or the “Company”) for the year ended December 31, 2012, and other material events up to the date of this report. The information in this MD&A is as at March 13, 2013 unless otherwise indicated. The following discussion should be read in conjunction with the annual audited consolidated financial statements and related notes for the year ended December 31, 2012.
The financial data included in the discussion provided in this report has been prepared in accordance with International Financial Reporting Standards (“IFRS”) as issued by the International Accounting Standards Board. All dollar amounts are in Canadian dollars, unless otherwise noted.
This MD&A contains forward-looking statements and should be read in conjunction with the risk factors described in the “Risks and Uncertainties” and “Cautionary Statement on Forward-Looking Statements” sections at the end of this MD&A, as well as “Description of the Business – Risk Factors” in the Company’s Annual Information Form (“AIF”) for the year ended December 31, 2012.
This MD&A also makes reference to Cash Cost per Ounce, EBITDA, and Adjusted EBITDA. These are considered Non-IFRS Measures. Please refer to the Non-IFRS Measures section of this MD&A for an explanation of these measures and a reconciliation to the Company’s reported financial results.
PROFILE AND STRATEGY
Great Panther Silver Limited is a primary silver mining and exploration company listed on the Toronto Stock Exchange trading under the symbol GPR, and on the NYSE MKT trading under the symbol GPL. The Company's current activities are focused on the mining of precious metals from its two wholly-owned operating mines in Mexico, Topia and Guanajuato, the development stage San Ignacio Project as well as the exploration project El Horcon. The Company is also pursuing additional mining opportunities within Latin America, with the goal of adding to its portfolio of mineral properties.
All of Great Panther’s assets in Mexico are held through Minera Mexicana el Rosario, S.A. de C.V. (“MMR”), a wholly-owned subsidiary acquired in February 2004. In 2005, the Company incorporated Metalicos de Durango, S.A. de C.V. (“MDU”) and Minera de Villa Seca, S.A. de C.V (“MVS”). These two operating subsidiaries of the Company are responsible for the day-to-day affairs and operations of the Topia and Guanajuato Mines, respectively, through service agreements with MMR.
The Company’s Topia Mine is located in the Sierra Madre Mountains in the state of Durango in northern Mexico and produces silver, gold, lead and zinc. The Guanajuato Mine Complex is located in the city of Guanajuato, in central Mexico, approximately 380 kilometres north-west of Mexico City, and produces silver and gold. Each mine has its own processing facility with capacity to support future expansion.
Great Panther’s development stage property, the San Ignacio Project, is approximately 20 kilometres by road from its Guanajuato processing plant. The Company also owns two exploration stage properties: the Santa Rosa Project, which is located approximately 15 kilometres northeast of Guanajuato, and the recently acquired El Horcon Project, located 60 kilometres northwest of Guanajuato.
Goals and Objectives
Great Panther's mission is to become a leading primary silver producer by acquiring, developing and profitably mining precious metals in Latin America.
The Company’s primary goal is that of profitable growth, as management feels this is the key to maximizing long-term shareholder value. Management’s specific objectives are to grow production and earnings from existing mining operations and realize positive cash flow while continuing to actively pursue the acquisition of new mining operations and exploration and development opportunities in Latin America.
Great Panther is committed to achieving the highest standards in Corporate Social Responsibility for its operations at every stage of project development, from early stage exploration to mature mining operations. The Company recognizes that the ability to generate long-term value for shareholders is firmly rooted in the manner in which the Company conducts itself, how employees are treated, how the Company interacts with the communities in which Great Panther operates, and how the Company respects the environment.
| GREAT PANTHER SILVER LIMITED | |
| YEAR ENDED DECEMBER 31, 2012 | 3 |
Great Panther is committed to working diligently with its stakeholders to achieve the responsible development of the Company’s projects and operations, and to contribute to the sustainable development of the communities in which the Company works.
Key Performance Drivers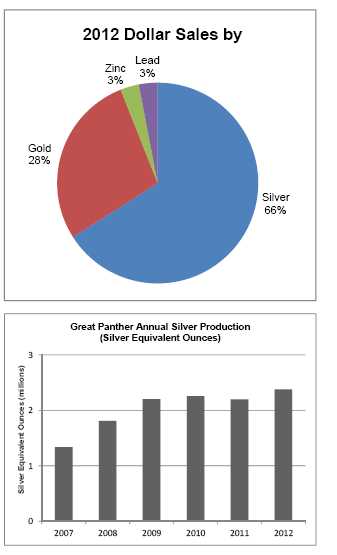
Great Panther’s ability to continue to successfully achieve its goals of increasing production while generating positive cash flow is dependent on a number of factors. These factors are regularly measured and monitored, with timely feedback provided about progress toward achieving our goals. The Company’s key performance drivers are the following:
Volume
The Company operates two producing mines in Mexico -one in Guanajuato and the second in Topia. Since commencing operations at these two mines in 2006, Great Panther achieved continuous growth in metal production in excess of 20% per year until 2010 when the Company achieved record production of 2.3 million silver equivalent ounces (“Ag eq oz”).
For 2011, the Company increased mined and processed ore by 19%, however, final metal production was impacted by lower ore grades which limited metal production for the year to 2.2 million silver equivalent ounces. For 2012, Great Panther increased metal production by 8% to 2.4 million silver equivalent ounces, primarily by increased ore production and improved gold grades.
Fundamental to the growth in production is the increase in Mineral Resources through exploration of the mineralized zones in the existing mines and also through the exploration and/or acquisition of other projects. Great Panther is committed to seeking out new opportunities to grow and develop its business.
Resources
Definition of resources is essential to the future production capability of the Company. When Great Panther acquired its two mines in Mexico in 2005, there were no NI 43-101 compliant resources on either property. Over the past eight years, the Company has incurred $13.7 million and $18.3 million on mineral property exploration expenditures at Topia and Guanajuato, respectively, as it continues to build its internal and NI 43-101 compliant resources.
The Company plans approximately 30,000 metres of exploration drilling in 2013 to further define resources, look for vein extensions and test new targets.
For more details on the Company’s resources, refer to the “Resource and Exploration Update” section.
| GREAT PANTHER SILVER LIMITED | |
| YEAR ENDED DECEMBER 31, 2012 | 4 |
Operating Costs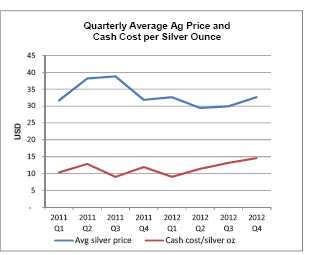
Attaining and maintaining a low unit operating cost structure has been critical to achieving profitability. Metal prices can be volatile as experienced through recent years. Having a low silver production cost base increases mine net earnings and allows the Company to remain profitable during times of low commodity prices.
During 2012, the Company experienced an increase in unit operating costs per silver ounce produced relative to the prior year. The Company measures and reports these as cash cost per ounce of silver, net of by-product credits. Cash cost per ounce of silver is a common metric reported by companies in the mining industry however it is a non-IFRS measure.
The increase in cash cost per ounce of silver in 2012 was the result of an increase in site costs, a decrease in ore grades at Topia resulting from variability in mineralization, and increases in smelting and refining costs due to higher cost contracts. Please refer to the “Mine Operating Results” and “Non-IFRS Measures” sections of this document for a more detailed discussion of cash cost per silver ounce. The Company’s reported cash cost per silver ounce is also affected by changes in metal prices of non-silver by-products, specifically gold at Guanajuato and lead, zinc and gold at Topia, relative to the silver price.
Prices
One of the Company’s objectives is to provide shareholders with leverage to future increases in the price of silver. To this end, the Company does not engage in any hedging arrangements on silver prices. As a result, Great Panther’s share price tends to correlate very strongly with the price of silver. Additional leverage comes through the participation in the growth of the Company itself.
While the average price of silver for 2012 decreased by 11% on a year-over-year basis, it has fluctuated significantly in recent years, and it continued to be volatile in 2012 reaching a high of $37.23 in February and low of $26.67 in July1.
The Company’s financial results are very sensitive to the price of silver. The following table summarizes the effect of changes in the silver price on the Company’s 2013 revenue outlook, based on an assumed production of 2.5 million silver equivalent ounces2.
Revenue Sensitivity to Change in Silver Price (in 000's except for silver price per ounce)
| Silver price per ounce | US$20.00 | US$25.00 | US$30.00 | US$35.00 | US$40.00 | US$45.00 | US$50.00 |
| Guanajuato Revenue (USD) | $ 37,314 | $ 41,690 | $ 46,067 | $ 50,242 | $ 54,354 | $ 58,465 | $ 62,576 |
| Topia Revenue (USD) | $ 13,365 | $ 16,501 | $ 19,638 | $ 22,597 | $ 25,290 | $ 27,984 | $ 30,677 |
| | | | | | | | |
| Total Revenue (CAD) | $ 48,966 | $ 56,225 | $ 63,484 | $ 70,378 | $ 76,953 | $ 83,527 | $ 90,102 |
Assumes gold price of US$1,680 per ounce, and zinc and lead prices of US$0.85/lb.
The Company’s reported cash cost per silver ounce is affected by changes in metal prices of the by-products of silver, specifically gold at Guanajuato and lead, zinc and gold at Topia, relative to the silver price (refer to “Non-IFRS Measures” section for discussion of cash cost per silver ounce). The following tables summarize the effect of changes in prices of gold, lead and zinc on the Company’s 2013 estimated combined cash cost per ounce of silver based on an assumed production of approximately 2.5 million Ag eq oz:
__________________________________
1 London Spot Fix
2 2.5 million silver equivalent ounces represents the top of the Company’s production guidance range of 2.4 – 2.5 million silver equivalent ounces for 2013.
| GREAT PANTHER SILVER LIMITED | |
| YEAR ENDED DECEMBER 31, 2012 | 5 |
Cash Cost per Payable Ounce of Silver: Sensitivity to Change in Gold Price
| Gold price per ounce | | US $1,500 | | | US $1,600 | | | US $1,700 | | | US $1,800 | | | US $1,900 | |
| Cash cost per ounce of silver (USD) | $ | 11.82 | | $ | 10.96 | | $ | 10.09 | | $ | 9.23 | | $ | 8.37 | |
Assumes silver price of US$28 per ounce, and zinc and lead prices of US$0.85 per pound.
Cash Cost per Payable Ounce of Silver: Sensitivity to Change in Zinc Price
| Zinc price per pound | | US $0.60 | | | US $0.70 | | | US $0.80 | | | US $0.90 | | | US $1.00 | |
| Cash cost per ounce of silver (USD) | $ | 10.66 | | $ | 10.50 | | $ | 10.33 | | $ | 10.22 | | $ | 10.11 | |
Assumes silver price of US$28 per ounce, gold price of US$1,680 per ounce, and lead price of US$0.85 per pound.
Cash Cost per Payable Ounce of Silver: Sensitivity to Change in Lead Price
| Lead price per pound | | US $0.60 | | | US $0.70 | | | US $0.80 | | | US $0.90 | | | US $1.00 | |
| Cash cost per ounce of silver (USD) | $ | 10.62 | | $ | 10.48 | | $ | 10.34 | | $ | 10.20 | | $ | 10.08 | |
Assumes silver price of US$28 per ounce, gold price of US$1,680 per ounce, and zinc price of US$0.85 per pound.
Capabilities to Deliver Results
Great Panther continues to emphasize three key elements of its business in order to achieve its goals and objectives. The Company believes that the emphasis of these three key elements will enable it to successfully execute its growth strategy.
People
One of Great Panther’s key strategies is to build the team that will help achieve the Company’s goals. This includes recruiting, training and developing the right people, as well as enhancing the productivity of the team by providing the tools and training needed to be effective.
The Company’s ability to attract and retain qualified employees is critical to its success. In addition to experienced key personnel, the Company looks for bright, hard-working individuals with positive attitudes, and is committed to providing its people with a great workplace and opportunities to grow with the Company.
As part of Great Panther’s commitment to its employees, the Company has a policy of granting stock options to all employees to build loyalty as well as align their performance with corporate goals and objectives.
Mining Operations and Exploration
Great Panther’s operations focus on silver mining, processing and exploration. The Guanajuato and Topia operations depend on the discovery of new mineralization and therefore the Company invests in the continued development of these properties. In 2013, the Company will be focused on the development of its San Ignacio Project which is approximately 20 kilometres by road from its Guanajuato processing plant.
The Company also owns two exploration stage properties: the Santa Rosa Project, located approximately 15 kilometres northeast of Guanajuato, and the recently acquired El Horcon Project, located 60 kilometres northwest of Guanajuato. New discoveries that are close to the existing operations mean that the time from discovery to production is reduced and capital requirements are lower as existing infrastructure can be utilized.
| GREAT PANTHER SILVER LIMITED | |
| YEAR ENDED DECEMBER 31, 2012 | 6 |
The performance of the mining and processing operations builds on a sound base and continues to improve to new record levels. Great Panther is fortunate to have a highly experienced team of underground miners and metallurgists. The Company processed a record 230,120 tonnes of ore in 2012, a 6% increase from the prior year.
Mine development focuses on accessing near term production targets and providing underground drilling platforms for deeper exploration to ensure resources and mine life are extended. At Guanajuato, targets include Rayas, Santa Margarita, Los Pozos, Valenciana, Deep Cata and the Guanajuatito North Zone, as well as the recently discovered silver-gold veins at the San Ignacio Project.
The Company was successful at increasing throughput at Topia however the mine experienced a decline in average silver grades in 2012. While grade variability is expected to continue, the Company is taking steps to improve its mine planning activities which should result in better operating efficiency. Over the years, the Company has also been successful in adding resources at Topia through a combination of underground development and surface exploration drilling and will continue to invest in these activities in the future.
Ore processing at both operations is supported by metallurgical testwork programs under the direction of the Company’s Country Manager, Metallurgy. This, together with the local expertise, has resulted in continuous improvement in processing performance.
Location of Operations
Great Panther is focused on Mexico for several reasons. Mexico has consistently been the leading silver producing country in the world and has a rich mineral endowment and a long history of mining. This mining culture continues today and mining companies in Mexico typically enjoy strong support from all levels of government and from the local people.
As part of the North American Free Trade Agreement, Mexico has a stable political and economic environment in which to operate. In addition, due to the climate, most projects can be worked on throughout the year and many can be reached in a single day from Vancouver by flight. Great Panther’s Guanajuato mine is serviced by an international airport in Leon, only 30 minutes away by road.
Although there are more than 200 mining/exploration companies working in Mexico, Great Panther has the advantage of extensive experience in Mexico and has a broad base of contacts that benefits its mining operations, exploration programs and provides access to new opportunities. The Company’s executive team has extensive experience and knowledge of business in Mexico to capitalize on future opportunities.
| GREAT PANTHER SILVER LIMITED | |
| YEAR ENDED DECEMBER 31, 2012 | 7 |
SIGNIFICANT TRANSACTIONS AND EVENTS AFFECTING OPERATIONS
During the year ended December 31, 2012, Great Panther continued to invest in its wholly-owned Mexican properties as part of its growth strategy to expand production and resources. Important developments in the Company’s business during the year are as follows.
On February 6, 2012, the Company announced the appointment of R. W. (Bob) Garnett, CA, ICD.D. as Independent Chairman of the Company's Board of Directors. Mr. Garnett has served as an independent Director of Great Panther since May 3, 2011 and is Chairman of the Audit Committee. Mr. Garnett replaced Kaare Foy, who retired after serving more than 18 years as a Director of the Company and almost eight years as Executive Chairman.
On May 9, 2012, the Company announced the completion of two Mineral Resource estimates for its Guanajuato Mine Complex and its San Ignacio Project in Guanajuato, Mexico. As San Ignacio is a satellite of the Guanajuato Mine Complex (20 kilometres by road), and any mineralization extracted from there will be processed at the Cata Plant, the Mineral Resource is considered part of the overall Guanajuato Operations. The new Measured and Indicated Mineral Resource at the Guanajuato Mine contains 5,649,000 ounces of silver equivalent. Inferred Mineral Resources are estimated at 2,503,000 Ag eq oz at the Guanajuato Mine and 6,894,000 Ag eq oz at San Ignacio. The new resource replaces production from the Guanajuato Mine Complex during the prior year and a half, and with the addition of San Ignacio almost doubles the overall resource base for Great Panther’s Guanajuato operations. The new estimate for San Ignacio increases tonnage by 35%, silver content by 29%, gold content by 51% and Ag eq oz by 53% over the previous estimate (refer to May 9, 2012 news release and the corresponding technical reports filed on SEDAR dated June 25, 2012 and June 26, 2012).
On June 28, 2012, the Company announced the re-election of Robert A. Archer, Kenneth W. Major and R.W. (Bob) Garnett and the election of new nominees John Jennings and J. Richard H. (Dick) Whittington as Directors of the Company. Former director John Kopcheff, of Australia, did not stand for re-election. John Jennings has almost three decades of experience in Canadian and international investment banking, having held positions at firms including BMO Nesbitt Burns, Lehman Brothers International, RBC Financial, HSBC Group and CIBC. Mr. Jennings recently joined Korn/Ferry International, the world’s largest executive search and talent management firm. Mr. Whittington is a mining engineer with over 35 years of experience in Canada and abroad. He was previously president, CEO and a director of PNG Gold, an advanced stage gold exploration company located in Papua New Guinea. Prior to this, he was president, CEO and a director of Farallon Mining, where he brought Farallon’s G-9 polymetallic zinc mine in Guerrero State, Mexico into production in less than four years. In November 2012, Mr. Whittington accepted the position of President and CEO of Northern Vertex Mining Corp. and resigned from the Board of Directors of Great Panther in January 2013.
On July 18, 2012, the Company announced a number of changes to its senior management structure. The changes included the separation of the President and CEO role, under which Mr. Robert Archer retained the role of CEO and Mr. Martin Carsky was appointed President of the Company. Mr. Carsky served as the Company’s Executive Vice President and CFO since May of 2011. Jim Zadra, CA, was appointed Chief Financial Officer of Great Panther after serving as Vice President, Finance since September 2011. Mr. Graham Parsons was promoted to the newly created role of Vice President, Operations based in Guanajuato, Mexico. Mr. Charles Brown was appointed to a newly created role as Senior Vice President, Corporate Development and his former position of Chief Operating Officer was eliminated. Mr. Parsons subsequently left Great Panther and was replaced by Mr. Juan Manuel Flores in March of 2013.
On August 21, 2012, the Company announced it had signed a definitive agreement for the purchase of a 100% interest in certain surface rights on its wholly-owned San Ignacio Project in Guanajuato, Mexico. A total of 19.4 hectares has been purchased, thereby allowing sufficient space for access to and construction of a portal for the development of a ramp, for waste dumps, and for auxiliary infrastructure. With the acquisition of the surface rights, the Company has proceeded with the application for permits required for the underground development. Permitting is expected to be completed by the end of the second quarter of 2013 and construction of a new portal and ramp is expected to begin shortly after the receipt of permits.
On September 5, 2012, the Company completed the purchase of a 100% interest in the El Horcon Silver-Gold Project (“El Horcon”) in Jalisco State, Mexico for total cash consideration of US$1.6 million. El Horcon is a past producing mine and covers 7,908 hectares in 17 contiguous mining concessions and is located 60 kilometres northwest of the Company’s Guanajuato Mine Complex. Its location allows for the potential for it to become a satellite mine for the Company’s Guanajuato operations. The Company has applied for permits for a Phase I drill program to delineate a resource and expects to commence drilling before the end of the second quarter of 2013.
| GREAT PANTHER SILVER LIMITED | |
| YEAR ENDED DECEMBER 31, 2012 | 8 |
As of the date of this MD&A, the Company had not fully secured mineral property titles for approximately 5,000 of its 7,908 hectares related to the El Horcon Project. Certain of the Company’s title claims have been cancelled due to what the Company believes is an administrative error on the part of the government agency which manages mineral claims in Mexico. The Company is currently in the process of attempting to reinstate the claims. Neither the status of the claims or the process to reinstate the claims has affected the Company’s currently planned permitting and drilling programs. The Company expects to be successful in reinstating the claims and therefore has not recorded any provision against the carrying value of the El Horcon Project.
The following events took place after the end of 2012:
On January 14, 2013, the Company announced an update to the ongoing mineral resource development at the Company's 100% owned Topia Silver-Gold-Lead-Zinc Mine in Durango, Mexico. The 2012 Measured & Indicated Mineral Resources total 156,000 tonnes at 806g/t silver, 1.47g/t gold, 6.48% lead and 4.29% zinc (5.60 million silver equivalent ounces). In addition, the estimate includes 273,000 tonnes of 837g/t silver, 0.8g/t gold, 5.7% lead and 3.9% zinc (9.54 million Ag eq oz) in the Inferred category. Although the total number of ounces was reduced from the 2011 estimate, the updated Resource Estimate reflects a more robust model and a better reconciliation to mine production. See the “Resource and Exploration Update” section for further details.
On February 5, 2013, the Company announced that underground drilling programs at the Company’s wholly owned Guanajuato Mine Complex were successful in intersecting high grade silver-gold mineralization in the historic Valenciana Mine area and discovered two new zones of silver-gold mineralization in the Guanajuatito Mine area. The drilling at Valenciana included an intercept of 2,900g/t silver and 26.00g/t gold over 1.30 metres, while the two new discoveries at Guanajuatito are highlighted by intersections of 1,010g/t silver and 6.67g/t gold over 1.10 metres and 1,460g/t silver and 4.79g/t gold over 1.15 metres.
| GREAT PANTHER SILVER LIMITED | |
| YEAR ENDED DECEMBER 31, 2012 | 9 |
FOURTH QUARTER AND FISCAL YEAR 2012 HIGHLIGHTS
| Highlights | | | | | | | | | | | | | | | | | | |
| (in 000s except ounces, amounts per share and | | | | | | | | | | | Year Ended | | | Year Ended | | | | |
| per ounce) | | Q4 2012 | | | Q4 2011 | | | Change | | | Dec 31, 2012 | | | Dec 31, 2011 | | | Change | |
| Revenue | $ | 17,789 | | $ | 17,520 | | | 2% | | $ | 61,139 | | $ | 57,818 | | | 6% | |
| Gross profit (Earnings from mining operations) | $ | 3,318 | | $ | 6,032 | | | -45% | | $ | 19,206 | | $ | 26,916 | | | -29% | |
| Net income (loss) | $ | (1,285) | | $ | (1,419) | | | 9% | | $ | 5,510 | | $ | 11,506 | | | -52% | |
| Adjusted EBITDA1 | $ | 3,800 | | $ | 6,265 | | | -39% | | $ | 16,893 | | $ | 24,723 | | | -32% | |
| Earnings (loss) per share – basic | $ | (0.01) | | $ | (0.01) | | | 0% | | $ | 0.04 | | $ | 0.09 | | | -56% | |
| Earnings (loss) per share – diluted | $ | (0.01) | | $ | (0.01) | | | 0% | | $ | 0.04 | | $ | 0.08 | | | -50% | |
| Silver ounces produced | | 453,934 | | | 354,754 | | | 28% | | | 1,560,040 | | | 1,495,372 | | | 4% | |
| Silver equivalent ounces produced2 | | 672,690 | | | 545,294 | | | 23% | | | 2,378,603 | | | 2,200,013 | | | 8% | |
| Silver payable ounces | | 446,077 | | | 425,225 | | | 5% | | | 1,472,269 | | | 1,332,262 | | | 11% | |
| Total cash cost per silver ounce (USD)3 | $ | 14.58 | | $ | 11.92 | | | 22% | | $ | 12.24 | | $ | 10.84 | | | 13% | |
| Average realized silver price (USD)4 | $ | 31.94 | | $ | 30.86 | | | 3% | | $ | 30.93 | | $ | 34.71 | | | -11% | |
Fiscal Year 2012 Financial and Operational Highlights (Compared to Fiscal Year 2011)
Revenues totalled $61.1 million for the year ended December 31, 2012, an increase of 6%;
Net income was $5.5 million for 2012, a decrease of 52%;
Cash-flow from operating activities was $13.1 million for 2012, compared to $19.1 million;
Cash position at year end was $25.9 million, inclusive of short term investments, compared to $39.5 million;
Net working capital at year end was $44.5 million, compared to $53.8 million;
Processed ore for 2012 totaled 230,120 tonnes, a 6% increase;
Record metal production was achieved for 2012 of 2,378,603 silver equivalent ounces (“Ag eq oz”), an 8% increase;
Silver production for 2012 increased 4% to 1,560,040 ounces;
Gold production for 2012 increased 36% to a record of 10,924 ounces;
Cash cost per silver ounce for 2012 increased 13% to US$12.24;
__________________________________
1 “Adjusted EBITDA” is a non-IFRS measure in which standard EBITDA (earnings before interest, taxes, depreciation and amortization) is adjusted for share-based payments expense, foreign exchange gains or losses, and non-recurring items. The Company has updated its definition of adjusted EBITDA and has restated 2011 comparative figures presented above and elsewhere in this MD&A to reflect the exclusion of interest income. The Company does not consider these changes to be material. Refer to the “Non-IFRS Measures” section for the definition and a reconciliation of standardized and adjusted EBITDA to the financial statements.
2Silver equivalent ounces in 2012 were established using prices of US$28 per oz, US$1,680 per oz, US$0.85 per lb, and US$0.85 per lb for silver, gold, lead and zinc, respectively, and applied to the recovered metal content of the concentrates that were produced by the two operations.
3“Cash cost per silver ounce” is a non-IFRS measure and is used by the Company to manage and evaluate operating performance at each of the Company’s mines and is widely reported in the silver mining industry as a benchmark for performance, but does not have a standardized meaning. Refer to the “Non-IFRS Measures” section.
4Average realized silver price is prior to treatment, refining and smelting charges.
| GREAT PANTHER SILVER LIMITED | |
| YEAR ENDED DECEMBER 31, 2012 | 10 |
Average silver grades at Guanajuato for 2012 were unchanged at 199g/t, while average gold grades increased to 2.02g/t from 1.52g/t;
Topia average silver grades for 2012 decreased to 345g/t from 400g/t; and
Guanajuato maintained strong metallurgical recoveries 2012 of 90.2% and 91.5% for silver and gold respectively.
Fourth Quarter 2012 Financial and Operational Highlights (Compared to Fourth Quarter 2011)
Revenues totalled $17.8 million for the three months ended December 31, 2012 (“Q4 2012”) compared to $17.5 million for the three months ended December 31, 2011 (“Q4 2011”), an increase of 2%;
Net loss for Q4 2012 was $1.3 million, compared to a net loss of $1.4 million in Q4 2011;
Cash-flow from operating activities was $4.5 million for Q4 2012, compared to $9.9 million for Q4 2011;
Processed ore for Q4 was 67,659 tonnes, representing an increase of 30%;
Metal production for Q4 2012 was 672,690 Ag eq oz, a quarterly record and an increase of 23% over Q4 2011;
Silver production for Q4 was 453,934 ounces, an increase of 28%; and
Gold production for Q4 was 2,826 ounces, an increase of 24%.
| GREAT PANTHER SILVER LIMITED | |
| YEAR ENDED DECEMBER 31, 2012 | 11 |
MINE OPERATING RESULTS
Consolidated Operations
| | | | | | | | | 2012 | | | | | | | | | | | | | | | 2011 | | | | | | | |
| | | FY | | | Q4 | | | Q3 | | | Q2 | | | Q1 | | �� | FY | | | Q4 | | | Q3 | | | Q2 | | | Q1 | |
| Tonnes milled | | 230,120 | | | 67,659 | | | 58,307 | | | 52,956 | | | 51,198 | | | 216,181 | | | 52,170 | | | 53,375 | | | 56,643 | | | 53,993 | |
| | | | | | | | | | | | | | | | | | | | | | | | | | | | | | | |
| Production | | | | | | | | | | | | | | | | | | | | | | | | | | | | | | |
| Silver (ounces) | | 1,560,040 | | | 453,934 | | | 371,857 | | | 374,723 | | | 359,526 | | | 1,495,372 | | | 354,754 | | | 343,768 | | | 386,210 | | | 410,640 | |
| Gold (ounces) | | 10,924 | | | 2,826 | | | 3,015 | | | 2,354 | | | 2,729 | | | 8,016 | | | 2,281 | | | 1,494 | | | 1,931 | | | 2,310 | |
| Lead (tonnes) | | 962 | | | 289 | | | 226 | | | 245 | | | 202 | | | 941 | | | 212 | | | 222 | | | 266 | | | 241 | |
| Zinc (tonnes) | | 1,478 | | | 446 | | | 369 | | | 351 | | | 312 | | | 1,314 | | | 327 | | | 294 | | | 348 | | | 345 | |
| | | | | | | | | | | | | | | | | | | | | | | | | | | | | | | |
| Silver equivalent ounces1 | | 2,378,603 | | | 672,690 | | | 592,586 | | | 555,721 | | | 557,606 | | | 2,200,013 | | | 545,294 | | | 484,550 | | | 562,944 | | | 607,225 | |
| | | | | | | | | | | | | | | | | | | | | | | | | | | | | | | |
| Silver payable ounces | | 1,472,269 | | | 446,077 | | | 314,146 | | | 395,405 | | | 316,641 | | | 1,332,262 | | | 425,225 | | | 364,684 | | | 193,914 | | | 348,439 | |
| | | | | | | | | | | | | | | | | | | | | | | | | | | | | | | |
| Cash cost per silver ounce (USD)2,3 | $ | 12.24 | | $ | 14.58 | | $ | 13.16 | | $ | 11.42 | | $ | 9.05 | | $ | 10.84 | | $ | 11.92 | | $ | 9.02 | | $ | 12.85 | | $ | 10.33 | |
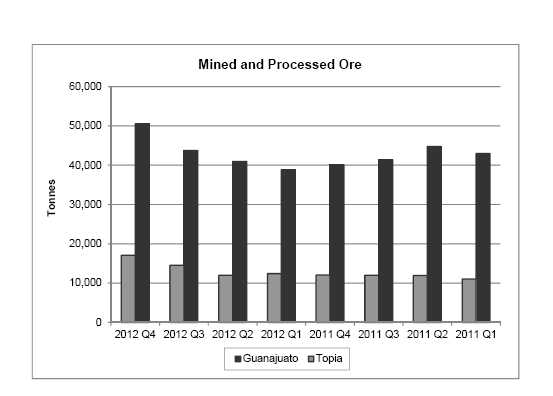
Total processed ore for the year ended December 31, 2012 was 230,120 tonnes, an increase of 6% over the prior year, with increases realized at both of the Company’s mines. The Guanajuato Mine Complex achieved an increase of 3% in throughput, and the Topia mine achieved a 19% increase in throughput as a result of increased mining activity.
Processed ore for the consolidated operations for the fourth quarter of 2012 was 67,659 tonnes, an increase of 16% compared to the third quarter of 2012, and an increase of 30% compared to the fourth quarter of 2011. The increase in throughput over the third quarter of 2012 included an increase of 17% at Topia as ore stockpiled due to water shortages in the first half of 2012 was processed during the second half of the year. The Guanajuato Mine Complex achieved a 16% increase in throughput over the third quarter due in part to the move from a six to seven day per week workweek. The increase in throughput over the third quarter of 2012 included a 42% increase at Topia and a 26% increase at Guanajuato.
Overall metal production for the year ended December 31, 2012 was a record 2,378,603 Ag eq oz, representing an increase of 8% over the prior year. The increase is attributable to increases in mined ore and throughput at both mines and increased gold grades at the Guanajuato Mine Complex. Overall metal production for the fourth quarter of 2012 was a quarterly record of 672,690 Ag eq oz, an increase of 14% from the third quarter of 2012 and an increase of 23% compared to the fourth quarter in 2011. The increased metal production is primarily the result of higher mined ore and throughput at both operations and higher average gold grades at Guanajuato.
Consolidated cash cost per silver ounce was US$12.24 for the year ended December 31, 2012, a 13% increase compared to US$10.84 for the year ended December 31, 2011. The increase is attributable to higher site costs and lower grades at Topia which resulted in higher unit production costs. In addition, the Company saw an increase in overall smelting and refining charges as a result of higher contractual charges for the Topia concentrates. The higher unit production costs and smelting and refining charges were offset somewhat by higher by-product credits as a result of higher gold production at Guanajuato.
Consolidated cash cost per silver ounce of US$14.58 for the fourth quarter increased from US$11.92 in the fourth quarter of 2011. Cash cost per silver ounce at Topia increased due to lower grades which resulted in higher unit production costs, and increased smelting and refining charges. Cash cost per silver ounce at Guanajuato increased in the fourth quarter due to higher unit production costs.
_________________________
| 1 | Silver equivalent ounces in 2012 were established using prices of US$28 per oz, US$1,680 per oz, US$0.85 per lb, and US$0.85 per lb for silver, gold, lead and zinc, respectively, and applied to the recovered metal content of the concentrates that were produced by the two operations. |
| 2 | “Cash cost per silver ounce” is a non-IFRS measure and is used by the Company to manage and evaluate operating performance at each of the Company’s mines and is widely reported in the silver mining industry as a benchmark for performance, but does not have a standardized meaning. Refer to the “Non-IFRS Measures” section. |
| 3 | Cash cost per silver ounce for the second quarter of 2011 presented in the table has been restated from amounts previously reported to reflect the application of correct foreign exchange rates. |
| GREAT PANTHER SILVER LIMITED | |
| YEAR ENDED DECEMBER 31, 2012 | 12 |
Topia Mine
Mill throughput for Topia for the year ended December 31, 2012 was 56,098 tonnes of ore, an increase of 19% over the 46,968 tonnes processed in the year ended December 31, 2011. Ore processed in the fourth quarter of 2012 was 17,109 tonnes of ore, representing an increase of 17% compared to the third quarter of 2012 and also a 42% increase over the fourth quarter of the prior year. Throughput increased over the fourth quarter of 2011 as a result of increased mining activity and processing which was stockpiled in the first half of 2012 when drought conditions caused water shortages and limited the Company’s ability to process ore. Processing of the stockpiled ore commenced in the third quarter of 2012 and the stockpile was completely processed by year end.
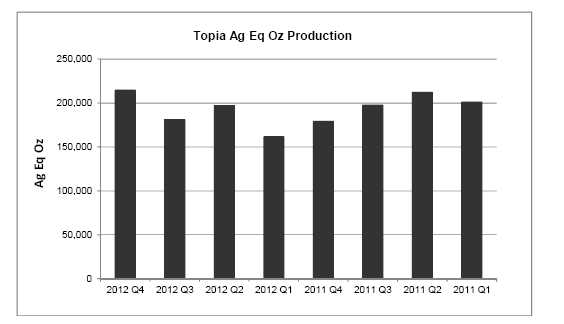
Metal production at Topia for the year ended December 31, 2012 was 753,298 Ag eq oz, comprising 555,710 silver (“Ag”) oz, 574 gold (“Au”) oz, 962 lead (“Pb”) tonnes, and 1,478 zinc (“Zn”) tonnes. Metal production at Topia for the fourth quarter of 2012 was 214,598 Ag eq oz comprising 155,185 Ag oz, 171 Au oz, 289 Pb tonnes, and 446 Zn tonnes. Metal production on a Ag eq oz basis increased 19% compared to the third quarter of 2012 as a result of higher throughput and higher grades for all metals. Production on an Ag eq oz basis increased 20% in the fourth quarter of 2012 compared to the fourth quarter of 2011 due mainly to increased throughput and higher gold, lead and zinc grades.
| GREAT PANTHER SILVER LIMITED | |
| YEAR ENDED DECEMBER 31, 2012 | 13 |
Topia Mine Production Data
| | | | | | | | | 2012 | | | | | | | | | | | | | | | 2011 | | | | | | | |
| | | FY | | | Q4 | | | Q3 | | | Q2 | | | Q1 | | | FY | | | Q4 | | | Q3 | | | Q2 | | | Q1 | |
| Tonnes milled | | 56,098 | | | 17,109 | | | 14,593 | | | 11,992 | | | 12,404 | | | 46,968 | | | 12,056 | | | 12,004 | | | 11,895 | | | 11,013 | |
| | | | | | | | | | | | | | | | | | | | | | | | | | | | | | | |
| Production | | | | | | | | | | | | | | | | | | | | | | | | | | | | | | |
| Silver (ounces) | | 555,710 | | | 155,185 | | | 131,865 | | | 148,439 | | | 120,221 | | | 535,882 | | | 117,182 | | | 137,707 | | | 143,774 | | | 137,219 | |
| Gold (ounces) | | 574 | | | 171 | | | 149 | | | 140 | | | 114 | | | 500 | | | 136 | | | 147 | | | 124 | | | 93 | |
| Lead (tonnes) | | 962 | | | 289 | | | 226 | | | 245 | | | 202 | | | 941 | | | 212 | | | 222 | | | 266 | | | 241 | |
| Zinc (tonnes) | | 1,478 | | | 446 | | | 369 | | | 351 | | | 312 | | | 1,314 | | | 327 | | | 294 | | | 348 | | | 345 | |
| | | | | | | | | | | | | | | | | | | | | | | | | | | | | | | |
| Silver equivalentounces1 | | 753,298 | | | 214,598 | | | 180,627 | | | 196,658 | | | 161,415 | | | 789,610 | | | 179,008 | | | 197,688 | | | 212,108 | | | 200,806 | |
| | | | | | | | | | | | | | | | | | | | | | | | | | | | | | | |
| Silver payable ounces | | 503,559 | | | 129,802 | | | 129,101 | | | 137,884 | | | 106,772 | | | 453,569 | | | 119,155 | | | 113,297 | | | 108,487 | | | 112,630 | |
| | | | | | | | | | | | | | | | | | | | | | | | | | | | | | | |
| Average ore grade | | | | | | | | | | | | | | | | | | | | | | | | | | | | | | |
| Silver (g/t) | | 345 | | | 319 | | | 316 | | | 424 | | | 326 | | | 400 | | | 345 | | | 420 | | | 418 | | | 420 | |
| Gold (g/t) | | 0.55 | | | 0.57 | | | 0.55 | | | 0.56 | | | 0.45 | | | 0.41 | | | 0.44 | | | 0.47 | | | 0.40 | | | 0.33 | |
| Lead (%) | | 1.86 | | | 1.86 | | | 1.69 | | | 2.18 | | | 1.71 | | | 2.13 | | | 1.85 | | | 2.02 | | | 2.34 | | | 2.32 | |
| Zinc (%) | | 2.91 | | | 2.87 | | | 2.78 | | | 3.21 | | | 2.73 | | | 3.05 | | | 2.97 | | | 2.67 | | | 3.18 | | | 3.42 | |
| | | | | | | | | | | | | | | | | | | | | | | | | | | | | | | |
| Metal recoveries | | | | | | | | | | | | | | | | | | | | | | | | | | | | | | |
| Silver | | 89.4% | | | 88.4% | | | 89.0% | | | 90.7% | | | 90.5% | | | 88.7% | | | 87.7% | | | 85.0% | | | 89.9% | | | 92.3% | |
| Gold | | 57.9% | | | 54.1% | | | 57.8% | | | 64.3% | | | 64.0% | | | 80.1% | | | 79.2% | | | 80.4% | | | 81.6% | | | 79.0% | |
| Lead | | 92.3% | | | 91.0% | | | 91.4% | | | 93.6% | | | 94.1% | | | 94.0% | | | 95.0% | | | 91.4% | | | 95.5% | | | 94.1% | |
| Zinc | | 90.6% | | | 90.7% | | | 90.9% | | | 91.2% | | | 92.1% | | | 91.7% | | | 91.3% | | | 91.9% | | | 92.2% | | | 91.5% | |
| | | | | | | | | | | | | | | | | | | | | | | | | | | | | | | |
| Concentrate grades | | | | | | | | | | | | | | | | | | | | | | | | | | | | | | |
| Lead | | | | | | | | | | | | | | | | | | | | | | | | | | | | | | |
| Silver (g/t) | | 8,409 | | | 7,493 | | | 8,997 | | | 8,708 | | | 8,757 | | | 8,837 | | | 8,528 | | | 9,205 | | | 8,463 | | | 9,167 | |
| Gold (g/t) | | 7.48 | | | 7.19 | | | 8.60 | | | 7.35 | | | 6.88 | | | 6.97 | | | 8.05 | | | 8.80 | | | 6.27 | | | 4.93 | |
| Lead (%) | | 49.86 | | | 48.69 | | | 52.82 | | | 48.79 | | | 49.80 | | | 52.77 | | | 52.83 | | | 50.31 | | | 53.33 | | | 54.61 | |
| Zinc (%) | | 10.48 | | | 11.48 | | | 10.33 | | | 10.49 | | | 9.16 | | | 8.84 | | | 9.78 | | | 10.68 | | | 8.65 | | | 9.46 | |
| Zinc | | | | | | | | | | | | | | | | | | | | | | | | | | | | | | |
| Silver (g/t) | | 715 | | | 779 | | | 692 | | | 735 | | | 636 | | | 656 | | | 619 | | | 640 | | | 674 | | | 687 | |
| Gold (g/t) | | 1.62 | | | 1.65 | | | 1.74 | | | 1.38 | | | 1.68 | | | 1.63 | | | 2.07 | | | 1.66 | | | 1.44 | | | 1.40 | |
| Lead (%) | | 1.72 | | | 1.77 | | | 1.75 | | | 1.67 | | | 1.68 | | | 1.35 | | | 1.26 | | | 0.83 | | | 1.50 | | | 1.68 | |
| Zinc (%) | | 51.31 | | | 50.66 | | | 50.02 | | | 51.71 | | | 53.45 | | | 53.93 | | | 53.60 | | | 55.49 | | | 52.89 | | | 54.08 | |
_____________________
| 1 Silver equivalent ounces in 2012 were established using prices US$28 per oz, US$1,680 per oz, US$0.85 per lb, and US$0.85 per lb for silver, gold, lead and zinc, respectively, and applied to the recovered metal content of the concentrates that were produced by the two operations. |
| GREAT PANTHER SILVER LIMITED | |
| YEAR ENDED DECEMBER 31, 2012 | 14 |
Average grades of ore processed from Topia in the year ended December 31, 2012 were 345g/t Ag, 0.55g/t Au, 1.86% Pb and 2.91% Zn, which represent decreases of 14%, 13% and 5% for Ag, Pb and Zn, respectively, and an increase of 34% for Au over the year ended December 31, 2011. The average grades of ore processed from Topia in the fourth quarter of 2012 were 319g/t Ag, 0.57g/t Au, 1.86% Pb and 2.87% Zn, which represent increases of 1%, 4%, 10%, and 3% for Ag, Au, Pb and Zn, respectively over the third quarter of 2012. Compared to the fourth quarter of 2011, these average grades represented an 8% and 3% decrease for Ag and Zn, respectively, and an increase of 30% and 1% for Au and Pb, respectively.
Plant metallurgical performance for the full year of 2012 included metal recoveries of 89.4% for Ag, 57.9% for Au, 92.3% for Pb and 90.6% for Zn. Plant metallurgical performance was satisfactory in the fourth quarter of 2012 with metal recoveries of 88.4% for Ag, 54.1% for Au, 91.0% for Pb and 90.7% for Zn.
Topia Mine Cash Cost per Silver Ounce
| | | 2012 | | | 2011 | |
(in 000s of CAD except per
ounce amounts or noted
otherwise) | |
FY | | |
Q4 | | |
Q3 | | |
Q2 | | |
Q1 | | |
FY | | |
Q4 | | |
Q3 | | |
Q2 | | |
Q1 | |
| | | | | | | | | | | | | | | | | | | | | | | | | | | | | | | |
| Cost of sales | $ | 11,943 | | $ | 3,478 | | $ | 3,184 | | $ | 2,737 | | $ | 2,544 | | $ | 9,712 | | $ | 2,741 | | $ | 2,177 | | $ | 2,516 | | $ | 2,278 | |
| | | | | | | | | | | | | | | | | | | | | | | | | | | | | | | |
| Smelting and refiningcharges | | 3,536 | | | 953 | | | 898 | | | 948 | | | 737 | | | 1,755 | | | 262 | | | 481 | | | 455 | | | 557 | |
| | | | | | | | | | | | | | | | | | | | | | | | | | | | | | | |
| Gross by-product revenue1 | | (4,407 | ) | | (1,194 | ) | | (1,187 | ) | | (1,076 | ) | | (950 | ) | | (3,885 | ) | | (684 | ) | | (1,056 | ) | | (1,051 | ) | | (1,094 | ) |
| | | | | | | | | | | | | | | | | | | | | | | | | | | | | | | |
| Cost of custom milling | | (302 | ) | | (130 | ) | | (44 | ) | | (63 | ) | | (65 | ) | | (378 | ) | | (118 | ) | | (92 | ) | | (102 | ) | | (66 | ) |
| | | | | | | | | | | | | | | | | | | | | | | | | | | | | | | |
| Cash operating costs | $ | 10,770 | | $ | 3,107 | | $ | 2,851 | | $ | 2,546 | | $ | 2,266 | | $ | 7,204 | | $ | 2,201 | | $ | 1,510 | | $ | 1,818 | | $ | 1,675 | |
| | | | | | | | | | | | | | | | | | | | | | | | | | | | | | | |
| | | | | | | | | | | | | | | | | | | | | | | | | | | | | | | |
| Cash operating costs (USD) | $ | 10,787 | | $ | 3,135 | | $ | 2,870 | | $ | 2,517 | | $ | 2,265 | | $ | 7,286 | | $ | 2,167 | | $ | 1,541 | | $ | 1,879 | | $ | 1,699 | |
| | | | | | | | | | | | | | | | | | | | | | | | | | | | | | | |
| Silver payable ounces (000s) | | 504 | | | 130 | | | 129 | | | 138 | | | 107 | | | 454 | | | 119 | | | 113 | | | 108 | | | 113 | |
| Cash cost per silverounce2,3(USD) | $ | 21.42 | | $ | 24.15 | | $ | 22.23 | | $ | 18.26 | | $ | 21.21 | | $ | 16.06 | | $ | 18.19 | | $ | 13.60 | | $ | 17.32 | | $ | 15.09 | |
Cash cost per silver ounce for Topia for the year ended December 31, 2012 was US$21.42, an increase of 33% from the cash cost per silver ounce of US$16.06 for the year ended December 31, 2011, primarily as a result of lower silver grades in the year and increased smelting and refining charges.
Cash cost per silver ounce for Topia increased to US$24.15 in the fourth quarter of 2012 from US$22.23 in the third quarter of 2012 due to higher site costs and lower recoveries. Cash cost per silver ounce for Topia in the fourth quarter of 2012 increased by 33% to US$24.15 from US$18.19 in the fourth quarter of 2011. The increase is mainly attributable to lower silver grades as well as higher smelting and refining charges.
Guanajuato Mine Complex
Processed ore at Guanajuato for the year ended December 31, 2012 was 174,022 tonnes, an increase of 3% over the prior year. Processed ore at Guanajuato was 50,550 tonnes for the fourth quarter of 2012, an increase of 16% compared to the third quarter of 2012, and an increase of 26% compared to the fourth quarter of 2011. The increase over the same period from the prior year is due in part to the move from a six day to seven day per week workweek, which began in June 2012.
Metal production of 1,625,305 Ag eq oz for the full year 2012 represented an increase of 15% over the prior year due to both increased throughput and higher gold grades. The high grade Cata development and stoping from the 510 metre level, plus the successful recovery of crown pillars at the 390 and 470 metre levels by long-hole mining methods have contributed significantly to the increase in production for the year. Metal production of 458,092 Ag eq oz for the fourth quarter of 2012 represented an increase of 11% compared to the third quarter of 2012 and an increase of 25% over the same quarter in the prior year due primarily to increased throughput as a result of increases in mining activity.
_______________________
| 1 | Gross by-product revenue is defined as revenue from the by-products of silver, specifically gold at Guanajuato and gold, lead and zinc at Topia, net of the respective smelting and refining charges. |
| 2 | “Cash cost per silver ounce” is a non-IFRS measure and is used by the Company to manage and evaluate operating performance at each of the Company’s mines and is widely reported in the silver mining industry as a benchmark for performance, but does not have a standardized meaning. Refer to the “Non-IFRS Measures” section. |
| 3 | Cash cost per silver ounce for the second quarter of 2011 presented in the table has been restated from amounts previously reported to reflect the application of correct foreign exchange rates. |
| GREAT PANTHER SILVER LIMITED | |
| YEAR ENDED DECEMBER 31, 2012 | 15 |
For the year ended December 31, 2012, silver production was 1,004,331 ounces, representing an increase of 5% over the year ended December 31, 2011. Silver production for the fourth quarter of 2012 of 298,750 ounces was up 24% compared to the third quarter of 2012, and up 26% compared to the fourth quarter of 2011. Gold production for 2012 at Guanajuato was 10,350 ounces, a record and an increase of 38% over the prior year. Guanajuato’s gold production for the fourth quarter of 2,656 ounces, represented a decrease of 7% compared to the third quarter of 2012 and an increase of 24% compared to the fourth quarter of 2011. Development and production from Guanajuato’s gold-rich Santa Margarita area continues to contribute to higher gold production.
Average ore grades for the year ended December 31, 2012 were 199g/t Ag and 2.02g/t Au, as compared to 199g/t Ag and 1.52g/t Au for 2011. Average ore grades for the fourth quarter of 2012, of 206g/t Ag and 1.80g/t Au, represented an increase of 10% and a decrease of 23% over the Ag and Au grades, respectively, for the third quarter of 2012. Compared to the fourth quarter of 2011, the fourth quarter 2012 ore grades represent a 0.5% and 2% decrease from 207g/t Ag and 1.84g/t Au, respectively.
Metal recoveries at the Guanajuato plant remain strong due to the addition of a re-grind mill, commissioned in April 2012, which improved process control. For the year ended December 31, 2012, metal recoveries were 90.2% for silver and 91.5% for gold compared to 88.5% and 90.3%, respectively, in 2011. Additional improvements were also made to the crushing section of the plant during the year where a new double-deck screen was installed. Recoveries of 89.2% for silver and 90.9% for gold were achieved in the quarter ended December 31, 2012.
Guanajuato Mine Complex Production Data
| | | | | | | | | 2012 | | | | | | | | | | | | | | | 2011 | | | | | | | |
| | | FY | | | Q4 | | | Q3 | | | Q2 | | | Q1 | | | FY | | | Q4 | | | Q3 | | | Q2 | | | Q1 | |
| Tonnes milled | | 174,022 | | | 50,550 | | | 43,714 | | | 40,964 | | | 38,794 | | | 169,213 | | | 40,114 | | | 41,371 | | | 44,748 | | | 42,980 | |
| | | | | | | | | | | | | | | | | | | | | | | | | | | | | | | |
| Production | | | | | | | | | | | | | | | | | | | | | | | | | | | | | | |
| Silver (ounces) | | 1,004,331 | | | 298,750 | | | 239,992 | | | 226,284 | | | 239,305 | | | 959,490 | | | 237,572 | | | 206,061 | | | 242,436 | | | 273,421 | |
| Gold (ounces) | | 10,350 | | | 2,656 | | | 2,866 | | | 2,213 | | | 2,615 | | | 7,516 | | | 2,145 | | | 1,347 | | | 1,807 | | | 2,217 | |
| | | | | | | | | | | | | | | | | | | | | | | | | | | | | | | |
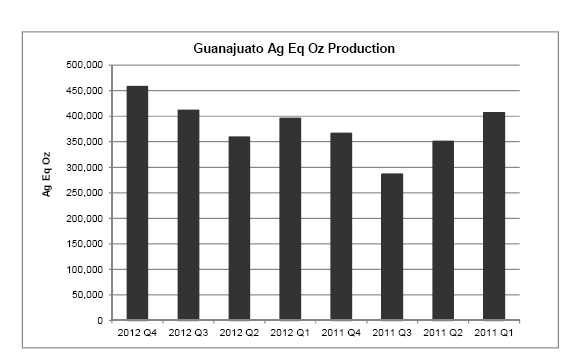
| Silver equivalentounces1 | | 1,625,305 | | | 458,092 | | | 411,958 | | | 359,063 | | | 396,192 | | | 1,410,403 | | | 366,286 | | | 286,862 | | | 350,836 | | | 406,419 | |
| | | | | | | | | | | | | | | | | | | | | | | | | | | | | | | |
| Silver payable ounces | | 968,710 | | | 316,275 | | | 185,045 | | | 257,521 | | | 209,869 | | | 878,693 | | | 306,070 | | | 251,387 | | | 85,427 | | | 235,809 | |
| | | | | | | | | | | | | | | | | | | | | | | | | | | | | | | |
| Average ore grade | | | | | | | | | | | | | | | | | | | | | | | | | | | | | | |
| Silver (g/t) | | 199 | | | 206 | | | 188 | | | 189 | | | 213 | | | 199 | | | 207 | | | 175 | | | 193 | | | 222 | |
| Gold (g/t) | | 2.02 | | | 1.80 | | | 2.22 | | | 1.82 | | | 2.30 | | | 1.52 | | | 1.84 | | | 1.12 | | | 1.38 | | | 1.75 | |
| | | | | | | | | | | | | | | | | | | | | | | | | | | | | | | |
| Metal recoveries | | | | | | | | | | | | | | | | | | | | | | | | | | | | | | |
| Silver | | 90.2% | | | 89.2% | | | 90.9% | | | 91.1% | | | 90.1% | | | 88.5% | | | 89.1% | | | 88.4% | | | 87.4% | | | 89.2% | |
| Gold | | 91.5% | | | 90.9% | | | 91.9% | | | 92.3% | | | 91.2% | | | 90.3% | | | 90.3% | | | 90.1% | | | 90.8% | | | 91.5% | |
| | | | | | | | | | | | | | | | | | | | | | | | | | | | | | | |
| Concentrate grades | | | | | | | | | | | | | | | | | | | | | | | | | | | | | | |
| Silver (g/t) | | 10,284 | | | 9,912 | | | 10,845 | | | 10,641 | | | 9,917 | | | 10,099 | | | 10,910 | | | 9,280 | | | 10,485 | | | 9,797 | |
| Gold (g/t) | | 106 | | | 88 | | | 130 | | | 104 | | | 108 | | | 79 | | | 99 | | | 61 | | | 78 | | | 79 | |
_______________________
| 1 | Silver equivalent ounces in 2012 were established using prices of US$28 per oz, US$1,680 per oz, US$0.85 per lb, and US$0.85 per lb for silver, gold, lead and zinc, respectively, and applied to the recovered metal content of the concentrates that were produced by the two operations. |
| GREAT PANTHER SILVER LIMITED | |
| YEAR ENDED DECEMBER 31, 2012 | 16 |
Development and production in the lower levels of Cata yielded 61,775 tonnes grading 327g/t Ag and 1.58g/t Au and constituted 48% of total metal production for the year ended December 31, 2012. Ore development on the 525 metre level in Cata commenced in the fourth quarter of 2012. Production from the Santa Margarita area continues to add gold production with 34,538 tonnes averaging 5.31g/t Au and 60g/t Ag during the year. Further increases in gold production are expected from Santa Margarita with the development of ramp 151 at the 510 metre level.
Ore produced from Los Pozos totaled 43,905 tonnes at grades of 192g/t Ag and 0.82g/t Au. Further improvements in ore quality are expected in the first quarter of 2013.
Production in the Guanajuatito area for the year totaled 16,611 tonnes at grades of 168g/t Ag and 0.89g/t Au. Ramp development at Guanajuatito connected with the Valenciana mine at the 245 metre level.
During the third quarter of 2012 the Rayas Shaft was shut down to begin a renovation program to enhance the overall safety conditions and increase efficiency in terms of the ability and capacity to transport personnel. The rehabilitation work is expected to be completed by the end of the second quarter of 2013. In the interim, workers are accessing the mine via the main San Vicente Ramp.
A new tertiary crusher was not installed as planned in the last half of 2012 due to delays by the supplier. It is expected that installation will be completed by the end of the first quarter of 2013.
| GREAT PANTHER SILVER LIMITED | |
| YEAR ENDED DECEMBER 31, 2012 | 17 |
Guanajuato Mine Complex Cash Cost per Silver Ounce
| | | 2012 | | | 2011 | |
| (in 000s of CAD except per ounceamounts or noted otherwise) | | FY | | | Q4 | | | Q3 | | | Q2 | | | Q1 | | | FY | | | Q4 | | | Q3 | | | Q2 | | | Q1 | |
| | | | | | | | | | | | | | | | | | | | | | | | | | | | | | | |
| Cost of sales | $ | 20,920 | | $ | 7,639 | | $ | 4,382 | | $ | 5,608 | | $ | 3,291 | | $ | 15,763 | | $ | 6,128 | | $ | 4,405 | | $ | 1,677 | | $ | 3,553 | |
| | | | | | | | | | | | | | | | | | | | | | | | | | | | | | | |
| Smelting and refining charges | | 3,012 | | | 891 | | | 558 | | | 756 | | | 807 | | | 2,381 | | | 1,287 | | | 482 | | | 163 | | | 449 | |
| | | | | | | | | | | | | | | | | | | | | | | | | | | | | | | |
| Gross by-product revenue1 | | (16,698 | ) | | (5,187 | ) | | (3,686 | ) | | (4,334 | ) | | (3,491 | ) | | (11,062 | ) | | (4,514 | ) | | (3,171 | ) | | (1,248 | ) | | (2,130 | ) |
| | | | | | | | | | | | | | | | | | | | | | | | | | | | | | | |
| Cash operating costs | | 7,234 | | $ | 3,343 | | $ | 1,254 | | $ | 2,030 | | $ | 607 | | $ | 7,082 | | $ | 2,901 | | $ | 1,716 | | $ | 592 | | $ | 1,872 | |
| | | | | | | | | | | | | | | | | | | | | | | | | | | | | | | |
| Cash operating costs (USD) | | 7,234 | | $ | 3,370 | | $ | 1,265 | | $ | 1,997 | | $ | 602 | | $ | 7,162 | | $ | 2,901 | | $ | 1,749 | | $ | 613 | | $ | 1,899 | |
| | | | | | | | | | | | | | | | | | | | | | | | | | | | | | | |
| Silver payable ounces (000s) | | 969 | | | 316 | | | 185 | | | 258 | | | 210 | | | 879 | | | 306 | | | 251 | | | 85 | | | 236 | |
| | | | | | | | | | | | | | | | | | | | | | | | | | | | | | | |
| Cash cost per silver ounce2,3(USD) | $ | 7.47 | | $ | 10.66 | | $ | 6.84 | | $ | 7.75 | | $ | 2.87 | | $ | 8.15 | | $ | 9.48 | | $ | 6.96 | | $ | 7.17 | | $ | 8.05 | |
Cash cost per silver ounce for the year ended December 31, 2012 of US$7.47 represented an 8% decrease compared to the year ended December 31, 2011. The decrease in cash cost per silver ounce is mainly attributable to higher gold by-product revenues per silver payable ounce.
Cash cost per silver ounce at Guanajuato for the fourth quarter of 2012 was US$10.66, compared to US$6.84 realized in the third quarter of 2012 and US$9.48 in the fourth quarter of 2011. The increase was primarily due to increased site costs which translated to an increase in unit production costs.
RESOURCE AND EXPLORATION UPDATE
Topia Mine
During the fourth quarter of 2012 there were four surface holes drilled totaling 211 metres (5,499 metres in 40 holes in 2012). There also were 18 underground drill holes completed for a total of 657 metres in the fourth quarter (2,565 metres in 66 holes in 2012).
The surface drilling in 2012, along with fourth quarter development on the 1510 level at Durangueno has given a better understanding of the anastomosing nature of the San Gregorio, Oxidada, San Pablo, and Higueras veins. Surface drilling was also conducted along the south-west extension of the El Rosario vein. The shallow holes had good vein intersections while the deeper intersects were too low in the epithermal system. ST12-195 (El Rosario) had the widest intersection of any at Topia mine to date with a 3.4 metre intersection of barite breccia and excellent galena and sphalerite. Surface drilling during 2012 targeted the Argentina, Santa Cruz (hanging wall vein to Argentina), San Gregorio, Oxidada, Oxi, Higueras, El Rosario, Animas, and Australia veins.
Drilling during the fourth quarter of 2012 was conducted on the Madre, Argentina, Recompensa, Don Benito, and La Oliva veins.
On January 14, 2013, the Company announced the completion of the Mineral Resource estimate from the Topia Mine. This updated Mineral Resource estimate is valid as of June 30, 2012.
_____________________
| 1 | Gross by-product revenue is defined as revenue from the by-products of silver, specifically gold at Guanajuato and gold, lead and zinc at Topia, net of the respective smelting and refining charges. |
| 2 | “Cash cost per silver ounce” is a non-IFRS measure and is used by the Company to manage and evaluate operating performance at each of the Company’s mines and is widely reported in the silver mining industry as a benchmark for performance, but does not have a standardized meaning. Refer to the “Non-IFRS Measures” section. |
| 3 | Cash cost per silver ounce for the second quarter of 2011 presented in the table has been restated from amounts previously reported to reflect the application of correct foreign exchange rates. |
| GREAT PANTHER SILVER LIMITED | |
| YEAR ENDED DECEMBER 31, 2012 | 18 |
| Topia Measured, Indicated and Inferred Mineral Resources – June 30, 2012 |
| Tonnage
(t) | Ag
(g/t) | Au
(g/t) | Pb
(%) | Zn
(%) | Ag eq
(oz) |
| Measured | 60,400 | 801 | 1.65 | 6.73 | 5.20 | 2,230,000 |
| Indicated | 95,400 | 809 | 1.35 | 6.33 | 3.70 | 3,370,000 |
| Inferred | 273,000 | 837 | 0.8 | 5.70 | 3.90 | 9,540,000 |
The updated estimate represents a decrease over the resource reported in 2011 (see news release March 7, 2011), however a direct comparison of the present and past mineral resources is not accurate due to differing metal prices and minimum Net Smelter Return (“NSR”) values between the two dates. Aside from normal mine depletion, the decrease in mineral resources can be attributed to a combination of factors, some of which resulted in some pre-existing resource blocks being dropped out of the model. For example, 1) change in metal prices and less silver equivalent contribution from base metals, 2) increased costs and cut-off NSR, 3) increase in the mining dilution provision in the NSR calculation from 50 to 100%, 4) better reconciliation guiding metal capping, and 5) a demonstrated insufficient continuity of mineralization, which resulted in a portion of Inferred Mineral Resources from this area being removed. This overall decrease has been partially countered by some excellent exploration successes at El Rosario, San Pablo, Oxi, Oxidada, and Higueras.
Guanajuato Mine Complex
A total of 9,119 metres (42 holes) of underground drilling was completed in the fourth quarter of 2012 for a total of 29,254 metres (217 holes) for the year ended December 31, 2012. Fourth quarter drilling was completed at the Guanajuatito, Cata, Pozos, Santa Margarita, Valenciana, and San Cayetano (Rayas area) zones.
Drilling in the Guanajuatito area, in the northwest part of the Guanajuato Mine Complex, has intersected mineralization both to the northwest (GTTO NW), and to the southeast (GTTO SE) of the existing development, between the 100 and 245 metre levels. The GTTO NW zone is approximately 50 metres in strike length, 140 metres down the dip, and open to depth and upward. The GTTO SE zone is approximately 50 metres along strike, 70 metres down the dip, and open to depth.
Highlights of the drilling in the GTTO NW zone include 2.25 metres grading 380g/t Ag and 1.28g/t Au in UGG12-057, and 1.10 metres grading 1,010g/t Ag and 6.67g/t Au in UGG12-061 (within a wider interval grading 285g/t Ag and 2.61g/t Au over 4.40 metres). Drilling in the GTTO SE zone was highlighted by an intercept of 1.15 metres grading 1,460g/t Ag and 4.79g/t Au in UGG12-070.
In the Valenciana Mine area, remnants of old stope walls and pillars intersected in drilling above the 390 metre level include 7.45 metres grading 275g/t Ag and 2.47g/t Au in UGV12-039, 1.10 metres grading 299g/t Ag and 3.66g/t Au in UGV 12-050, and 1.30 metres grading 2,900g/t Ag and 26.00g/t Au in UGV12-051. Drilling below the 390 metre level has intersected new mineralization including 3.10 metres grading 624g/t Ag and 4.59g/t Au in UGV12-012.
The pillars and hanging wall and footwall stope walls are being tested mainly from drill stations on a new footwall ramp connecting the 320 Cata level (southeast side of the Valenciana deposit) to the 245 Valenciana level (northwest side of the Valenciana deposit). Drilling in 2013 will continue to test the old Valenciana Mine area that extends approximately 400 metres along strike and 280 metres on the dip.
Detailed exploration drilling northwest of the stoping on Veta Madre has intersected multiple zones. Drill hole UG12-172 intersected 1.2 metre grading, 382g/t Ag and 0.56g/t Au in the Contact zone, and 2.8 metre grading, 596g/t Ag and 1.35g/t Au in the Veta Madre zone. From the same location, drill hole UGC12-043 intersected 2.85 metre grading, 318g/t Ag and 5.97g/t Au in the Contact zone, and 2.10 metre grading 303g/t Ag and 0g/t Au in the Veta Madre zone.
Drilling at Santa Margarita down to the 510 metre level continues to improve ore definition of the multiple gold-rich veins and stockworks, hence guiding mine development.
| GREAT PANTHER SILVER LIMITED | |
| YEAR ENDED DECEMBER 31, 2012 | 19 |
On May 9, 2012, the Company announced the completion of two Mineral Resource estimates at the Company’s Guanajuato Mine Complex and its San Ignacio Project in Guanajuato, Mexico (refer to May 9, 2012 news release and the corresponding technical reports filed on SEDAR dated June 25, 2012 and June 26, 2012, respectively).
The new Measured and Indicated Mineral Resource at the Guanajuato Mine Complex contains 5,649,000 Ag eq oz. Inferred Mineral Resources are estimated at 2,503,000 Ag eq oz at the Guanajuato Mine and 6,894,000 Ag eq oz at San Ignacio. For now, the Inferred resources are being reported separately as different parameters were used in their estimation.
The Measured and Indicated Mineral Resources of 5,649,000 Ag eq oz and Inferred mineral resources estimated at 2,503,000 Ag eq oz, are contained in the Cata Clavo, Los Pozos, Santa Margarita and Guanajuatito zones. The Guanajuatito zone, with its first estimate, has been greatly expanded from present mining on the 120 and 160 metre levels to the 390 metre level and is open to depth, illustrating that additional mineralization may be found and could add to inventory with systematic and focused drilling.
The new resource base replaces production from the Guanajuato Mine Complex during the past year and a half, and adds additional resources of the San Ignacio Project.
The updated Mineral Resource estimate for the Guanajuato Mine Complex is valid as of January 31, 2012.
| Guanajuato Measured, Indicated and Inferred Mineral Resources – January 31, 2012 (Cut-off 50 g/t Ag eq) |
| Tonnage
(Kt) | Ag
(g/t) | Ag
(oz) | Au
(g/t) | Au
(oz) | Ag eq
(oz) |
| Measured | 275.8 | 264 | 2,339,900 | 2.21 | 19,570 | 3,530,000 |
| Indicated | 232.6 | 122 | 909,781 | 2.66 | 19,890 | 2,119,000 |
| Inferred | 223.2 | 221 | 1,587,000 | 2.10 | 15,060 | 2,503,000 |
Exploration drilling is continuing at Cata Clavo, Santa Margarita, Rayas Deeps, and Guanajuatito. The programs are configured to explore down-dip extensions of the mineralized zones at 25- to 50-metre spacing. For 2013, the Company plans approximately 24,000 metres of exploration drilling at the Guanajuato Mine Complex.
San Ignacio Project
The San Ignacio Project covers approximately four kilometres of strike length on the La Luz vein system, which is parallel to, and five kilometres west of, the principal Veta Madre structure that hosts Great Panther's Guanajuato Mine Complex.
The property was part of the Guanajuato Mine purchase by Great Panther in 2005 from a mining cooperative called the “Sociedad Cooperativa Minero Metalúrgica Santa Fe de Guanajuato” which owned these since 1939. Due to the Company’s focus on the main Guanajuato Mine Complex, it did not commence any work at San Ignacio until 2010.
The Company did not conduct any drilling on San Ignacio in the third and fourth quarters of 2012 but completed 9,310 metres of drilling at the Project in the first half of 2012. Further surface drilling has been deferred, awaiting the completion of preliminary underground development on the Melladito, Intermediate, and Nombre de Dios zones.
During the first quarter of 2012, a total of 4,535 metres of drilling in 18 holes was completed on the San Ignacio Project. This was sufficient to infill, and to extend the combined strike length of the four dominant known veins to 700 metres. This includes the initial 73 drill holes and is the basis for the second version of the San Ignacio Mineral Resource estimate.
Highlights from section 1000N include an intersection from the Nombre de Dios 2 vein of 3.9 metres (2.99 metres true width) grading 195g/t Ag and 3.70g/t Au in ESI12-067. Fill-in hole ESI12-073 includes an intersection from the Intermediate vein of 4.30 metres (2.76 metres true width) grading 252g/t Ag and 3.97g/t Au, and an intersection from the Melladito vein of 4.70 metres (2.70 metres true width) grading 102g/t Ag and 1.95g/t Au.
| GREAT PANTHER SILVER LIMITED | |
| YEAR ENDED DECEMBER 31, 2012 | 20 |
During the second quarter of 2012, surface drilling focused on an area from 300-400N and on an area from 0-200S. The drilling continued to extend the limits of the known mineralized zones beyond the resource model.
In the 300-400N area the mineralized Intermediate vein continues south of the model. Mineralization in the Nombre de Dios, Melladito, and Intermediate is typical with highly variable widths and grades in the structures. Highlights include 2.65 metres grading 533g/t Ag and 7.59g/t Au in the Intermediate vein and 1.15 metres grading 249g/t Ag and 2.99g/t Au in the Nombre de Dios vein. In addition, new but as yet irregular, high grade silver-gold veins between the Intermediate and Nombre de Dios vein structures have also been discovered. These zones returned intercepts of 794g/t Ag and 3.70g/t Au over 2.22 metres, as well as 422g/t Ag and 10.50g/t Au over 0.60 metres, and 131g/t Ag and 19.20g/t Au over 0.50 metres.
As noted above, the Company released an updated Mineral Resource estimate to March 31, 2012 for the San Ignacio Project on May 9, 2012 (refer to May 9, 2012 news release and the corresponding technical report filed on SEDAR dated June 26, 2012). This updated Mineral Resource estimate at San Ignacio supersedes the original estimate. The new Inferred Mineral Resource is estimated to contain 6,894,000 Ag eq oz in 826,000 tonnes averaging 121g/t Ag and 2.28g/t Au (using a 125g/t Ag eq cut-off). This updated estimate both fills in and expands the strike length of the mineralized zones to 650 metres. This estimate increases the tonnage by 35%, the silver content by 29%, the gold content by 51% and the Ag eq oz by 53% over the previous estimate. It should be noted that this estimate used only four of the seven previously identified zones, leaving three zones to be more thoroughly tested at a later date.
| San Ignacio Measured Mineral Resources – March 31, 2012 (Cut-off 125 g/t Ag eq) |
| | Tonnage | Ag | Ag | Au | Au | Ag Eq |
| | (Kt) | (g/t) | (oz) | (g/t) | (oz) | (oz) |
| Inferred | 826 | 121 | 3,205,000 | 2.28 | 60,700 | 6,894,000 |
El Horcon Project
On September 5, 2012, the Company completed the purchase of a 100% interest in the El Horcon Silver-Gold Project in Jalisco State, Mexico for total cash consideration of US$1.6 million. El Horcon covers 7,908 hectares in 17 contiguous mining concessions and is located 60 kilometres northwest of the Company’s Guanajuato Mine Complex, allowing for the potential to become a satellite mine for the Company’s Guanajuato operations. El Horcon is a past producing mine and the Company expects to commence a drill program before the end of the second quarter of 2013 to delineate a resource.
During the fourth quarter of 2012, exploration activities included the re-sampling of historical underground workings, geological mapping, and surface sampling of all veins and mineralized structures. In total, 1,187 samples have been submitted for assay and 16 underground workings have been geologically mapped and sampled. The majority of the sampling corresponds to surface exposures of veins and mineralized structures. Geological mapping has outlined multiple vein zones along a northwest trend of five kilometers. The baseline studies for the Ministry of Environmental and Natural Resources in Mexico (SEMARNAT) have been completed, along with the location of 24 drill sites, and the permit to drill at El Horcon has been submitted for approval.
A surface drill program is planned to commence before the end of the second quarter of 2013. It will consist of 30 drill holes for a total of 3,000 metres. The program is laid out along an 800 metre length of the Diamantillo vein, and will test the Diamantillo vein as well as various splays and nearby parallel structures and veins.
As of the date of this MD&A, the Company had not fully secured mineral property titles for approximately 5,000 of its 7,908 hectares related to the El Horcon Project. Certain of the Company’s title claims have been cancelled due to what the Company believes is an administrative error on the part of the government agency which manages mineral claims in Mexico. The Company is currently in the process of attempting to reinstate the claims. Neither the status of the claims or the process to reinstate the claims has affected the Company’s currently planned permitting and drilling programs. The Company expects to be successful in reinstating the claims and therefore has not recorded any provision against the carrying value of the El Horcon Project.
| GREAT PANTHER SILVER LIMITED | |
| YEAR ENDED DECEMBER 31, 2012 | 21 |
Santa Rosa Project
After the completion of a drill program (five drill holes totaling 1,653 metres) in the first quarter of 2012, no further drilling has been completed at Santa Rosa. A reassessment of the property and regional geology, involving geological mapping and sampling will be undertaken in order to better understand the structural controls on mineralization before planning another drill program.
SELECTED QUARTERLY INFORMATION
The following table sets out selected quarterly financial results which have been prepared in accordance with International Financial Reporting Standards (“IFRS”) except as noted:
| (in thousands, except per share | | | | | | | | | | | | | | | | | | | | | | | | |
| amounts) | | Q4 2012 | | | Q3 2012 | | | Q2 2012 | | | Q1 2012 | | | Q4 2011 | | | Q3 2011 | | | Q2 2011 | | | Q1 2011 | |
| Revenue | $ | 17,789 | | $ | 15,286 | | $ | 14,439 | | $ | 13,625 | | $ | 17,520 | | $ | 16,278 | | $ | 8,560 | | $ | 15,460 | |
| Cost of sales (excluding amortization,depletion and share-based payments) | | 11,117 | | | 7,566 | | | 8,346 | | | 5,835 | | | 8,870 | | | 6,581 | | | 4,193 | | | 5,831 | |
| Earnings from mining operations1 | | 3,319 | | | 5,791 | | | 3,771 | | | 6,325 | | | 6,032 | | | 8,320 | | | 3,951 | | | 8,613 | |
| Net income (loss) for the period | | (1,285) | | | 1,758 | | | 354 | | | 4,683 | | | (1,419) | | | 3,415 | | | 2,501 | | | 7,009 | |
| Basic earnings (loss) per share | | (0.01) | | | 0.01 | | | 0.00 | | | 0.03 | | | (0.01) | | | 0.03 | | | 0.02 | | | 0.06 | |
| Diluted earnings (loss) per share | | (0.01) | | | 0.01 | | | 0.00 | | | 0.03 | | | (0.01) | | | 0.02 | | | 0.02 | | | 0.05 | |
| Adjusted EBITDA2 | | 3,800 | | | 4,961 | | | 3,691 | | | 4,441 | | | 6,265 | | | 7,752 | | | 2,833 | | | 7,874 | |
| Cash and cash equivalents (includingshort-term investments) | | 25,899 | | | 26,827 | | | 28,675 | | | 40,322 | | | 39,437 | | | 35,074 | | | 36,760 | | | 15,166 | |
| Total assets | | 116,729 | | | 114,057 | | | 110,717 | | | 110,024 | | | 102,944 | | | 95,513 | | | 91,938 | | | 66,154 | |
| Total non-current liabilities | | 8,193 | | | 5,569 | | | 6,128 | | | 5,997 | | | 3,978 | | | 1,758 | | | 1,917 | | | 1,901 | |
| Working capital | $ | 44,539 | | $ | 45,911 | | $ | 49,889 | | $ | 53,537 | | $ | 53,810 | | $ | 53,783 | | $ | 51,947 | | $ | 29,291 | |
Refer to the “Results of Operations” section for a complete discussion of the financial results for the quarter and year ended December 31, 2012.
____________________________
| 1 | “Earnings from mining operations” are defined as gross profit. |
| 2 | “Adjusted EBITDA” is a non-IFRS measure in which standard EBITDA (earnings before interest, taxes, depreciation and amortization) is adjusted for share- based payments expense, foreign exchange gains or losses, and non-recurring items. The Company has updated its definition of adjusted EBITDA and has restated 2011 comparative figures presented above and elsewhere in this MD&A to reflect the exclusion of interest income. The Company does not consider these changes to be material. Refer to the “Non-IFRS Measures” section for the definition and a reconciliation of standardized and adjusted EBITDA to the financial statements. |
| GREAT PANTHER SILVER LIMITED | |
| YEAR ENDED DECEMBER 31, 2012 | 22 |
SELECTED ANNUAL INFORMATION
The following table sets out selected annual financial results which have been prepared in accordance with International Financial Reporting Standards (“IFRS”) except as noted:
| (in thousands, except per share amounts) | | | | | | | | | | |
| | | | 2012 | | | 2011 | | | 2010 | |
| Revenue | | $ | 61,139 | | $ | 57,818 | | $ | 42,206 | |
| Cost of sales (excluding amortization, depletion and share-based payments) | | | 32,864 | | | 25,475 | | | 21,161 | |
| Earnings from mining operations1 | | | 19,206 | | | 26,916 | | | 16,447 | |
| Net income for the year | | | 5,510 | | | 11,506 | | | 10,660 | |
| Basic earnings per share | | | 0.04 | | | 0.09 | | | 0.09 | |
| Diluted earnings per share | | | 0.04 | | | 0.08 | | | 0.09 | |
| Adjusted EBITDA2 | | | 16,893 | | | 24,723 | | | 15,068 | |
| Cash and cash equivalents (including short-term investments) | | | 25,899 | | | 39,517 | | | 13,967 | |
| Total assets | | | 116,729 | | | 102,944 | | | 55,451 | |
| Total non-current liabilities | | | 8,193 | | | 3,978 | | | 2,160 | |
| Working capital | | $ | 44,539 | | $ | 53,810 | | $ | 18,812 | |
QUARTERLY TRENDS AND MARKET DATA
The climate in Mexico allows mining and exploration activities to be conducted throughout the year. Therefore, revenue and cost of sales generally do not exhibit variations due to seasonality. The exceptions are periods of excessive drought which may limit mineral processing. The dry season in Mexico generally extends from October through April. The Company did experience water shortages at its Topia operations in the second quarter of 2012 as a result of unusually dry conditions which led the Company to limit processing and stockpile mined ore. The stockpiled ore was subsequently processed in the second half of 2012 as water shortages were alleviated. Revenue will vary based on the quantity of metal produced, metal prices and terms of sales agreements.
There can also be significant variances in the Company’s reported net income from quarter to quarter arising from factors that are often difficult to anticipate in advance or to predict from past results. For example, the granting of incentive stock options, which results in the recording of amounts for share-based payments can be quite large in any given quarter. Fluctuations in foreign currency, specifically the Mexican peso and US dollar against the Canadian dollar may also result in considerable variances in foreign exchange gains and losses due primarily to a significant intercompany loan which is re-valued for each period end. Fluctuations in the price of silver and gold, and to a lesser extent, lead and zinc, can also have a significant impact on the Company’s net income.
________________________
| 1“Earnings from mining operations” are defined as gross profit. |
2“Adjusted EBITDA” is a non-IFRS measure in which standard EBITDA (earnings before interest, taxes, depreciation and amortization) is adjusted for share- based payments expense, foreign exchange gains or losses, and non-recurring items. The Company has updated its definition of adjusted EBITDA and has restated 2011 comparative figures presented above and elsewhere in this MD&A to reflect the exclusion of interest income. The Company does not consider these changes to be material. Refer to the “Non-IFRS Measures” section for the definition and a reconciliation of standardized and adjusted EBITDA to the financial statements. |
| GREAT PANTHER SILVER LIMITED | |
| YEAR ENDED DECEMBER 31, 2012 | 23 |
The Company’s past quarterly mineral sales revenue is as follows:

The Company’s average realized metal prices and the average Canadian exchange rates against the United States dollar and Mexican peso for the quarter and year ended December 31, 2012 and 2011 are as follows:
| | | | | | | | | Year Ended | | | Year Ended | |
| | | 2012 Q4 | | | 2011 Q4 | | | Dec 31, 2012 | | | Dec 31, 2011 | |
| Silver (U.S. $ / oz.) | $ | 31.94 | | $ | 30.86 | | $ | 30.93 | | $ | 34.71 | |
| Gold (U.S. $ / oz.) | $ | 1,697.32 | | $ | 1,655.99 | | $ | 1,671.88 | | $ | 1,627.04 | |
| Lead (U.S. $ / lb.) | $ | 1.01 | | $ | 0.91 | | $ | 0.95 | | $ | 1.07 | |
| Zinc (U.S. $ / lb.) | $ | 0.90 | | $ | 0.87 | | $ | 0.89 | | $ | 1.00 | |
| USD / CAD | | 1.0087 | | | 0.978 | | | 1.0007 | | | 1.011 | |
| MXP / CAD | | 13.053 | | | 13.330 | | | 13.154 | | | 12.542 | |
| GREAT PANTHER SILVER LIMITED | |
| YEAR ENDED DECEMBER 31, 2012 | 24 |
RESULTS OF OPERATIONS
Year Ended December 31, 2012
Revenue from the sale of metals in concentrate is recognized in the financial statements when it is probable that the economic benefits associated with the transaction will flow to the Company, the risks and rewards of ownership are transferred to the customer and the revenue can be reliably measured. Revenues from the sale of metals in concentrate are recorded in the statements of comprehensive income net of treatment, refining and penalty charges paid to the buyer under the terms of the sales contract and are recognized based on quoted market prices in periods subsequent to the date of sale. The estimated revenue on the sale of metals in concentrate is recorded based on forward metal prices for the expected date of final settlement. As a result, revenues include estimated prices for sales in the period, adjusted at period-end based on expected silver, gold, lead and zinc prices for final settlement, as well as price adjustments for sales that occurred in prior periods, based on the actual prices received. These adjustments also reflect changes arising from final weight and assay calculations.
Details of revenue, cost of sales and gross profit are as follows:
| | | 2012 | | | % of | | | 2011 | | | % of | |
| (in thousands) | | | | | Revenue | | | | | | Revenue | |
| Revenue | $ | 61,139 | | | 100% | | $ | 57,818 | | | 100% | |
| Cost of sales | | | | | | | | | | | | |
| Production costs | | 32,864 | | | 54% | | | 25,475 | | | 44% | |
| Amortization and depletion | | 8,684 | | | 14% | | | 4,465 | | | 7% | |
| Share-based payments | | 385 | | | 1% | | | 962 | | | 2% | |
| | | | | | | | | | | | | |
| | | 41,933 | | | 69% | | | 30,902 | | | 53% | |
| | | | | | | | | | | | | |
| Gross profit | $ | 19,206 | | | 31% | | $ | 26,916 | | | 47% | |
For the year ended December 31, 2012, the Company earned revenues of $61.1 million, compared to $57.8 million for the year ended December 31, 2011, an increase of 6%. The increase is primarily due to the result of a 16% increase in silver equivalent ounces sold in 2012 as compared to 2011, offset by a decrease in average realized metals prices ($30.93 in 2012 compared to $34.71 in 2011). The Company recognized revenue on shipments representing 2.2 million silver equivalent ounces in 2012 as compared to 1.9 million silver equivalent ounces in 2011.
Revenue related to contained metals in concentrates for the years ended December 31, 2012 and 2011 is comprised as follows:
| | | Year ended December 31, 2012 | | | Year ended December 31, 2011 | |
| (in thousands) | | Guanajuato | | | Topia | | | Total | | | Guanajuato | | | Topia | | | Total | |
| Silver revenue | $ | 30,425 | | $ | 15,463 | | $ | 45,888 | | $ | 30,414 | | $ | 15,751 | | $ | 46,165 | |
| Gold revenue | | 16,709 | | | 525 | | | 17,234 | | | 11,126 | | | 474 | | | 11,600 | |
| Lead revenue | | - | | | 1,772 | | | 1,772 | | | - | | | 1,880 | | | 1,880 | |
| Zinc revenue | | - | | | 2,109 | | | 2,109 | | | - | | | 1,901 | | | 1,901 | |
| Ore processing revenue and other | | - | | | 701 | | | 701 | | | - | | | 848 | | | 848 | |
| Treatment charges, refining charges and deductions | | (3,030) | | | (3,535) | | | (6,565) | | | (2,444) | | | (2,132) | | | (4,576) | |
| Total Revenue | $ | 44,104 | | $ | 17,035 | | $ | 61,139 | | $ | 39,096 | | $ | 18,722 | | $ | 57,818 | |
For 2012, the Company had contracts in place for all of its planned concentrate production by the start of the second quarter of the year. The Company’s concentrate inventory balances arise due to shipments which are in transit at the end of the reporting period.
Cost of sales, excluding amortization and depletion and share-based payments, was $32.9 million for the year ended December 31, 2012 compared to $25.5 million for 2011. The increase in cost of sales, excluding amortization and depletion and share-based payments is attributable to increased silver payable ounces sold, higher site costs at Guanajuato and Topia, and lower grades at Topia which resulted in higher unit cost of sales. Silver grades at Topia were 345g/t in 2012, a 14% decrease from the silver grades realized in 2011.
| GREAT PANTHER SILVER LIMITED | |
| YEAR ENDED DECEMBER 31, 2012 | 25 |
Cost of sales before non-cash items as a percentage of revenues was 54% for 2012, compared to 44% in 2011. The increase is a due to an increase in unit production costs.
Amortization and depletion of mineral properties, plant and equipment relating to cost of sales for the year ended December 31, 2012 was $8.7 million, compared to $4.5 million for the year ended December 31, 2011. The increase in amortization expense is due to increased investments in mine development, exploration of operating mines, and plant and equipment during 2012. Share-based payments relating to cost of sales for the year ended December 31, 2012 were $0.4 million compared to $1.0 million for the year ended December 31, 2011.
For the year ended December 31, 2012, the Company earned gross profit of $19.2 million compared to $26.9 million for the year ended December 31, 2011. The decrease in gross profit is due to higher unit cost of sales and higher amortization and depletion charges realized as a result of increased investment in mineral properties, plant and equipment over the past year.
For the year ended December 31, 2012, the Company had a gross profit percentage of 31% compared to 47% for the year ended December 31, 2011. The lower gross profit percentage is attributed to lower average realized silver prices, higher unit cost of sales, and higher amortization and depletion charges.
General and administrative expenses were $10.1 million for the year ended December 31, 2012, compared to $8.6 million for the year ended December 31, 2011. The increase over the prior year is the result of a one-time payment of $0.7 million in connection with the retirement of an executive director and a $0.3 million increase in occupancy costs reflecting a new office lease and the remaining payments on the lease for the former premises. Other factors in the increase include a one-time tax assessment in Mexico and an increase in salaries and wages.
Exploration and evaluation expenses were $2.4 million for the year ended December 31, 2012 compared to $0.9 million for the year ended December 31, 2011. The increase over the prior year is primarily due to an increase in exploration and business development activities outside of the Company’s operating mines. These include exploration activities at Santa Rosa and the El Horcon Project and increased evaluation activities in connection with prospective acquisitions.
Finance and other income was $3.0 million for the year ended December 31, 2012, as compared to finance and other expense of $3.9 million for the year ended December 31, 2011. The increase is primarily attributable to favourable fluctuations in foreign exchange rates, primarily the US dollar and Mexican peso compared to the Canadian dollar. In 2012, the Company recorded a foreign exchange gain of $2.8 million compared to a foreign exchange loss of $4.6 million in 2011. Foreign exchange gains and losses arise from the translation of foreign denominated transactions and balances relative to the functional currency of the Company’s subsidiaries and the Company’s reporting currency. The Company has significant Canadian and US dollar loans receivable from one of its Mexican subsidiaries and fluctuations in the Mexican peso create significant unrealized foreign exchange gains and losses on the loans owing to the Canadian parent. These unrealized gains and losses are recognized in the consolidated net income of the Company.
The Company recorded income tax expense of $4.2 million for year ended December 31, 2012, consisting of $0.6 million in current income tax expense and $3.6 million in deferred tax expense. This compares to $2.0 million in income tax expense for the year ended December 31, 2011, consisting of $0.1 million current tax expense and $1.9 million deferred tax expense. The Company incurs deferred income tax expense as a result of capital expenditures which, for tax purposes, are deductible at a faster rate than for accounting purposes. During 2012 the Company saw in increase in such expenditures.
Net income for the year ended December 31, 2012 was $5.5 million, which compares to net income of $11.5 million for the year ended December 31, 2011. The decrease in net income is primarily attributable to a decrease in gross profit of $7.7 million, an increase in general and administrative expenses of $1.5 million, an increase in exploration and evaluation expenses of $1.5 million, and an increase in tax expense of $2.2 million. These were offset by an increase in finance and other income of $6.9 million resulting primarily from foreign exchange gains.
| GREAT PANTHER SILVER LIMITED | |
| YEAR ENDED DECEMBER 31, 2012 | 26 |
Adjusted EBITDA1was $16.9 million for the year ended December 31, 2012 compared to $24.7 million for the year ended December 31, 2011. The decrease in adjusted EBITDA primarily reflects a decrease in gross profit and an increase in general and administrative expenses before amortization and share-based payment expenses, as well as an increase in exploration and evaluation expenses.
Three Months Ended December 31, 2012
Details of revenue, cost of sales and gross profit for the three months ended December 31, 2012 and 2011 are as follows:
| | | Q4 2012 | | | % of | | | Q4 2011 | | | % of | |
| (in thousands) | | | | | Revenues | | | | | | Revenues | |
| Revenue | $ | 17,789 | | | 100% | | $ | 17,520 | | | 100% | |
| Cost of sales | | | | | | | | | | | | |
| Production costs | | 11,117 | | | 63% | | | 8,870 | | | 51% | |
| Amortization and depletion | | 3,256 | | | 18% | | | 1,656 | | | 10% | |
| Share-based payments | | 98 | | | 0% | | | 962 | | | 5% | |
| | | | | | | | | | | | | |
| | | 14,471 | | | 81% | | | 11,488 | | | 66% | |
| | | | | | | | | | | | | |
| Gross profit | $ | 3,318 | | | 19% | | $ | 6,032 | | | 34% | |
For the three months ended December 31, 2012, the Company earned revenues of $17.8 million, compared to $17.5 million for the same period in 2011, an increase of 2%, due to an increase in silver equivalent ounces sold and higher average realized metal prices, offset by increased treatment and refining charges. Revenue of $17.8 million for the fourth quarter of 2012 increased by $2.5 million, or 16%, compared to the third quarter of 2012. The increase over the third quarter is primarily the result of higher silver equivalent ounces sold, offset by lower average realized metal prices.
During the fourth quarter of 2012, the Company recognized revenue on shipments representing 681,000 silver equivalent ounces, compared to 628,000 silver equivalent ounces for the same period in 2011, an increase of 8%. Average realized silver prices increased, with prices of US$31.94 for the quarter ended December 31, 2012 compared to US$30.86 for the quarter ended December 31, 2011. During the third quarter of 2012, the Company recognized revenue on shipments representing 470,000 silver equivalent ounces at an average realized silver price of US$31.92.
Revenue related to contained metals in concentrate for the three months ended December 31, 2012 and 2011 is comprised as follows:
| | | Q4 2012 | | | Q4 2011 | |
| (in thousands) | | Guanajuato | | | Topia | | | Total | | | Guanajuato | | | Topia | | | Total | |
| Silver revenue | $ | 9,117 | | $ | 3,845 | | $ | 12,962 | | $ | 9,715 | | $ | 3,779 | | $ | 13,494 | |
| Gold revenue | | 5,187 | | | 126 | | | 5,313 | | | 4,566 | | | 146 | | | 4,712 | |
| Lead revenue | | - | | | 523 | | | 523 | | | - | | | 410 | | | 410 | |
| Zinc revenue | | - | | | 545 | | | 545 | | | - | | | 424 | | | 424 | |
| Ore processing revenue and other | | - | | | 290 | | | 290 | | | - | | | 291 | | | 291 | |
| Treatment charges, refining charges and deductions | | (890) | | | (954) | | | (1,844) | | | (1,208) | | | (603) | | | (1,811) | |
| Total Revenue | $ | 13,414 | | $ | 4,375 | | $ | 17,789 | | $ | 13,073 | | $ | 4,447 | | $ | 17,520 | |
Cost of sales excluding amortization and depletion and share-based payments was $11.1 million for the three months ended December 31, 2012, compared to $8.9 million for the same period in 2011, an increase of 25%. The increase in cost of sales is due in part to an 8% increase in metal sales volume to 681,000 silver equivalent ounces. Higher site costs and unit cost of sales, particularly at Topia, also contributed to the increase in cost of sales excluding amortization and depletion and share-based payments. Cost of sales excluding amortization and depletion and share-based payments of $11.1 million for the fourth quarter of 2012 compares to $7.6 million for third quarter of 2012, an increase of 46%. The increase was primarily due to an increase in metal sales volume to 681,000 silver equivalent ounces from 470,000 silver equivalent ounces in the third quarter of 2012.
______________________
| 1 | “Adjusted EBITDA” is a non-IFRS measure. Please refer to the “Non-IFRS Measures” section for the reconciliation of reported financial results to Non-IFRS measures. |
| GREAT PANTHER SILVER LIMITED | |
| YEAR ENDED DECEMBER 31, 2012 | 27 |
Cost of sales before non-cash items as a percentage of revenues was 63% for Q4 2012, compared to 51% for Q4 2011. The increase is due to higher unit production costs.
Amortization and depletion of mineral properties, plant and equipment relating to cost of sales for the three months ended December 31, 2012 was $3.3 million, compared to $1.7 million for the same period in 2011. The increase in amortization expense is primarily due to higher sales volume and increased investments in mine development, exploration of operating mines, and plant and equipment during 2012. Amortization and depletion of mineral properties, plant and equipment relating to cost of sales for the fourth quarter of 2012 of $3.3 million, compared to $1.7 million in the third quarter of 2012.
Share-based payments relating to cost of sales for the three months ended December 31, 2012 were $0.1 million, compared to $1.0 million for the three months ended December 31, 2011. The higher expense in the fourth quarter of 2011 is the result of share options which were only granted in the fourth quarter of that year. In 2012, the Company adopted a policy of quarterly grants and vesting.
For the three months ended December 31, 2012, the Company had gross profit of $3.3 million or 19% compared to $6.0 million or 34% in the same period in 2011. Despite an increase in unit sales, the Company saw a decrease in gross profit and gross profit percentage as a result of lower average realized metal prices, higher unit production costs, higher smelting and refining charges and increased unit amortization and depletion costs. From the third quarter of 2012 to the fourth quarter of 2012, gross profit decreased by $2.5 million, or 43%.
General and administrative expenses, before amortization and share-based payments, were $1.8 million for the three months ended December 31, 2012, compared to $2.0 million for the same period in 2011. Share-based payments expense related to general and administrative expenses was $0.03 million for the three months ended December 31, 2012, compared to $1.2 million for the fourth quarter of 2011. As noted above, during 2011 the Company only granted share options in the fourth quarter, whereas in 2012 the Company granted options throughout the year. In 2012, the Company also introduced longer vesting schedules for options which resulted in lower share-based payments expense in the current period.
Exploration and evaluation expenses were $0.7 million for the three months ended December 31, 2012 compared to $0.3 million for the same period in 2011. The increase over the prior year is primarily due to exploration costs associated with the El Horcon and Santa Rosa Projects, and increased business development activities outside of the Company’s existing properties.
Finance and other income was $0.3 million for the three months ended December 31, 2012 compared to finance and other expense of $2.1 million for the same period in 2011. The increase is primarily attributable to a foreign exchange gain of $0.6 million recognized in the three months ended December 31, 2012, as compared to a foreign exchange loss of $2.1 million recognized in the three months ended December 31, 2011. Foreign exchange gains and losses arise from the translation of foreign denominated transactions and balances relative to the functional currency of the Company’s subsidiaries and the Company’s reporting currency. The Company has significant Canadian and US dollar loans receivable from one of its Mexican subsidiaries and fluctuations in the Mexican peso create significant unrealized foreign exchange gains and losses on the loans owing to the Canadian parent. These unrealized gains and losses are recognized in the consolidated net income of the Company.
The Company recorded an income tax expense of $2.3 million for the three months ended December 31, 2012, consisting of $2.0 million in deferred tax expense and $0.3 million in current tax expense. This compares to $1.9 million in primarily deferred tax expense recognized in the same period in 2011. The Company incurs deferred income tax expense as a result of capital expenditures which, for tax purposes, are deductible at a faster rate than for accounting purposes. During 2012 the Company saw an increase in such expenditures.
Net loss for the three months ended December 31, 2012 was $1.3 million, compared to net loss of $1.4 million for the same period in 2011. The decrease in net loss is primarily attributable to a decrease in share-based payment expense and favourable foreign exchange movements in the fourth quarter of 2012 as compared to the same period in 2011. These were offset by an increase in tax expense in the fourth quarter of 2012 as compared to the same quarter in 2011.
| GREAT PANTHER SILVER LIMITED | |
| YEAR ENDED DECEMBER 31, 2012 | 28 |
Adjusted EBITDA1was $3.8 million for the three months ended December 31, 2012 compared to adjusted EBITDA of $6.3 million for the comparable period in 2011. The decrease is primarily attributable to a decrease in gross profit and an increase in exploration and evaluation expenses.
NON-IFRS MEASURES
Throughout this MD&A references are made to cash cost per silver ounce, EBITDA, and adjusted EBITDA, each as defined in this section. These are not recognized measures under IFRS, but are provided by the Company as supplemental measures of performance and to provide a basis for comparison to similar measures commonly reported in the industry. As there are no standardized methods of calculating these measures, the Company’s methods may differ from those used by others and, accordingly, the Company’s use of these measures may not be directly comparable to similarly titled measures used by others.
Cash Cost per Silver Ounce
The non-IFRS measure of cash cost per silver ounce is used by the Company to manage and evaluate operating performance at each of the Company’s mines and is widely reported in the silver mining industry as a benchmark for performance, but does not have a standardized meaning.
Management of the Company believes that the Company’s ability to control the cash cost per silver ounce is one of its key performance drivers impacting both the Company’s financial condition and results of operations. Having a low silver production cost base allows the Company to remain profitable even during times of declining commodity prices and provides more flexibility in responding to changing market conditions. In addition, a profitable operation results in the generation of positive cash flows, which then improves the Company’s financial condition.
To facilitate a better understanding of this measure as calculated by the Company, a detailed reconciliation between the cash cost per silver ounce and the Company’s cost of sales as reported in the Company’s Condensed Interim Consolidated Statements of Comprehensive Income is provided.
Reconciliation of Cash Cost per Silver Ounce
| (in 000s, except ounces and | | Guanajuato | | | Topia | | | Consolidated | |
| amounts per ounce) | | 2012 Q4 | | | 2011 Q4 | | | 2012 Q4 | | | 2011 Q4 | | | 2012 Q4 | | | 2011 Q4 | |
| CAD Cost of sales | $ | 7,639 | | $ | 6,128 | | $ | 3,477 | | $ | 2,741 | | $ | 11,116 | | $ | 8,869 | |
| Smelting and refining | | 891 | | | 1,287 | | | 953 | | | 262 | | | 1,844 | | | 1,549 | |
| CAD Gross by-product revenue2 | | (5,187 | ) | | (4,514 | ) | | (1,194 | ) | | (684 | ) | | (6,381 | ) | | (5,198 | ) |
| Cost of custom milling | | - | | | - | | | (130 | ) | | (118 | ) | | (130 | ) | | (118 | ) |
| CAD Cash operating costs | $ | 3,343 | | $ | 2,901 | | $ | 3,106 | | $ | 2,201 | | $ | 6,449 | | $ | 5,102 | |
| | | | | | | | | | | | | | | | | | | |
| USD Cash operating costs | $ | 3,370 | | $ | 2,901 | | $ | 3,135 | | $ | 2,167 | | $ | 6,553 | | $ | 5,068 | |
| Silver payable ounces | | 316,275 | | | 306,070 | | | 129,802 | | | 119,155 | | | 446,077 | | | 425,225 | |
| Cash cost per silver ounce (USD) | $ | 10.66 | | $ | 9.48 | | $ | 24.15 | | $ | 18.19 | | $ | 14.58 | | $ | 11.92 | |
______________________
| 1 | “Adjusted EBITDA” is a non-IFRS measure. Please refer to the “Non-IFRS Measures” section for the reconciliation of reported financial results to Non-IFRS measures. |
| 2 | Gross by-product revenue is defined as revenue from the by-products of silver, specifically gold at Guanajuato and gold, lead and zinc at Topia, net of the respective smelting and refining charges. |
| GREAT PANTHER SILVER LIMITED | |
| YEAR ENDED DECEMBER 31, 2012 | 29 |
| (in 000s, except ounces and | | Guanajuato | | | Topia | | | Consolidated | |
| amounts per ounce) | | Year Ended, | | | Year Ended, | | | Year Ended, | | | Year Ended, | | | Year Ended, | | | Year Ended, | |
| | | Dec 31, 2012 | | | Dec 31, 2011 | | | Dec 31, 2012 | | | Dec 31, 2011 | | | Dec 31, 2012 | | | Dec 31, 2011 | |
| CAD Cost of sales | $ | 20,921 | | $ | 15,763 | | $ | 11,943 | | $ | 9,712 | | $ | 32,864 | | $ | 25,475 | |
| Smelting and refining | | 3,012 | | | 2,381 | | | 3,536 | | | 1,755 | | | 6,548 | | | 4,136 | |
| CAD Gross by-product revenue1 | | (16,699 | ) | | (11,063 | ) | | (4,407 | ) | | (3,885 | ) | | (21,107 | ) | | (14,948 | ) |
| Cost of custom milling | | - | | | - | | | (302 | ) | | (378 | ) | | (301 | ) | | (378 | ) |
| CAD Cash operating costs | $ | 7,234 | | $ | 7,081 | | $ | 10,770 | | $ | 7,204 | | $ | 18,004 | | $ | 14,285 | |
| | | | | | | | | | | | | | | | | | | |
| USD Cash operating costs | $ | 7,234 | | $ | 7,162 | | $ | 10,787 | | $ | 7,286 | | $ | 18,020 | | $ | 14,448 | |
| Silver payable ounces | | 968,710 | | | 878,693 | | | 503,559 | | | 453,569 | | | 1,472,270 | | | 1,332,262 | |
| Cash cost per silver ounce (USD) | $ | 7.47 | | $ | 8.15 | | $ | 21.42 | | $ | 16.06 | | $ | 12.24 | | $ | 10.84 | |
EBITDA and Adjusted EBITDA
EBITDA is a non-IFRS measure that provides an indication of the Company’s continuing capacity to generate income from operations before taking into account management’s financing decisions and costs of amortizing capital assets. Accordingly, EBITDA comprises revenue less operating expenses before interest expense, interest income, capital asset amortization and impairment charges, and income taxes.
Adjusted EBITDA is a non-IFRS measure in which standard EBITDA (earnings before interest expense, interest income, taxes, and depreciation and amortization) is adjusted for share-based payments expense, foreign exchange gains or losses, and non-recurring items. Foreign exchange gains or losses may consist of both realized and unrealized losses. Under IFRS, entities must reflect in compensation expense the cost of share-based payments. In the Company’s circumstances, share-based payments involve a significant accrual of amounts that will not be settled in cash but are settled by the issuance of shares in exchange. The Company discloses adjusted EBITDA to aid in understanding the results of the Company and is meant to provide further information about the Company’s financial results to investors.
The following table provides a reconciliation of EBITDA and adjusted EBITDA to the 2012 and 2011 financial statements:
| | | | | | | | | Year Ended | | | Year Ended | |
| (in 000s) | | Q4 2012 | | | Q4 2011 | | | Dec 31, 2012 | | | Dec 31, 2011 | |
| Income (loss) for the period | $ | (1,285 | ) | $ | (1,419 | ) | $ | 5,510 | | $ | 11,506 | |
| Provision for income taxes | | 2,257 | | | 1,872 | | | 4,200 | | | 1,985 | |
| Interest income | | (78 | ) | | (146 | ) | | (442 | ) | | (435 | ) |
| Interest expense | | 7 | | | 16 | | | 34 | | | 324 | |
| Amortization and depletion of mineral properties, plant and equipment | | 3,326 | | | 1,658 | | | 8,890 | | | 4,561 | |
| EBITDA | | 4,227 | | | 1,981 | | | 18,192 | | | 17,941 | |
| Foreign exchange | | (559 | ) | | 2,074 | | | (2,828 | ) | | 4,572 | |
| Share-based payments | | 132 | | | 2,210 | | | 1,529 | | | 2,210 | |
| Adjusted EBITDA | $ | 3,800 | | $ | 6,265 | | $ | 16,893 | | $ | 24,723 | |
_______________________
| 1 | Gross by-product revenue is defined as revenue from the by-products of silver, specifically gold at Guanajuato and gold, lead and zinc at Topia, net of the respective smelting and refining charges. |
| GREAT PANTHER SILVER LIMITED | |
| YEAR ENDED DECEMBER 31, 2012 | 30 |
LIQUIDITY AND CAPITAL RESOURCES
At December 31, 2012, the Company had net working capital of $44.5 million and cash and cash equivalents, including short term investments, of $25.9 million compared to net working capital of $53.8 million and cash and cash equivalents, including short term investments, of $39.5 million at December 31, 2011. The decrease in cash and cash equivalents, including short term investments, during the year ended December 31, 2012 is attributed to investing activities which exceeded cash provided from operations by $14.4 million.
Operating Activities
Net cash flows provided by operating activities for the year ended December 31, 2012 were $13.1 million, as compared to cash flows provided by operating activities of $19.1 million in the prior year. The decrease is attributable primarily to a decrease in gross profit for the year before the impact of amortization and depletion as a result of rising unit operating costs, decreased average realized silver prices, and increased treatment and refining charges.
Investing Activities
For the year ended December 31, 2012, the Company had net cash outflows related to investing activities of $27.5 million, compared to outflows related to investing activities of $28.8 million for the year ended December 31, 2011. Investing activities for 2011 included $5.2 million of short term investments in guaranteed investment certificates. Excluding such activities, cash-flows from investing activities were $27.5 million for 2012 compared to $23.5 million for 2011. Excluding short-term investments, the increase in investment activities were primarily related to the development of mineral properties, capitalized exploration and evaluation expenditures, and the purchase of plant and equipment relating to the Company’s two operating mines. Investing activities for the year ended December 31, 2012 also include $1.6 million paid for the purchase of the El Horcon Project.
Financing Activities
Cash flows provided by financing activities were $0.4 million for the year ended December 31, 2012, compared to $30.1 million in the year ended December 31, 2011. During the year ended December 31, 2012, the Company received proceeds from the exercise of options of $0.5 million and repaid capital lease obligations in the amount of $0.1 million. During the year ended December 31, 2011, the Company issued shares for total proceeds, net of share issuance costs, of $22.5 million, received proceeds from the exercise of options and warrants of $8.5 million, and repaid capital lease obligations, promissory notes and convertible loan notes in the aggregate amount of $0.9 million.
Trends in Liquidity and Capital Resources
Cash necessary to fund the Company’s short-term operating needs are invested in highly liquid short-term investments with maturities of three months or less. The funds are not exposed to liquidity risk and there are no restrictions on the ability of the Company to use these funds to meet its obligations.
Although the Company made significant investments in its existing mines and purchased the El Horcon Project which drew on cash reserves in 2012, the Company anticipates that cash flow generated from mining activities along with working capital will be sufficient to fund the Company’s operations without requiring any additional capital to meet its planned growth and to fund development activities during the next twelve months. The Company had $25.9 million in cash and short-term investments at December 31, 2012 and expects to generate cash-flow from operations of between $15 million and $18 million in 2013 based on budgeted silver prices of $28 and production of 2.4 to 2.5 million Ag eq oz. Based on achieving overall operating cash-flow targets, the Company expects to invest approximately $15 to $20 million in capital expenditures in 2013, including mine development and capitalized exploration and evaluation expenditures. These investments will include development of the San Ignacio Project with the view to commencing production from this area in 2014, continued mine development and diamond drilling at both Guanajuato and Topia, rehabilitation of the Rayas Shaft at Guanajuato, and the acquisition of new mining and plant equipment.
The Company’s 2013 operating cash-flow forecast provided above is very sensitive to the price of silver and the Company may adjust its capital spending plans in response to fluctuations in cash-flow. An increase in average silver prices from the budgeted $28.00 could result in more aggressive expenditures in the latter half of 2013 and, conversely, weaker average silver prices could result in a reduction of capital expenditures.
| GREAT PANTHER SILVER LIMITED | |
| YEAR ENDED DECEMBER 31, 2012 | 31 |
Should the Company adopt additional expansion plans or undertake an acquisition, the Company would need to consider the funds required relative to the funds available in treasury at such time, including expected cash flows from operations, to determine whether additional sources would be required for those pending additional expansion plans.
Contractual Obligations
As of December 31, 2012 the Company had the following commitments:
| (in 000’s) | | | Total | | | 1 year | | | 2-3 years | | | 4-5 years | |
| Drilling services | | $ | 293 | | $ | 293 | | $ | - | | $ | - | |
| Operating lease payments | | | 1,333 | | | 528 | | | 805 | | | - | |
| Equipment purchases with third party vendors | | | 216 | | | 216 | | | - | | | - | |
| Environmental program | | | 32 | | | 32 | | | - | | | - | |
| Total commitments | | $ | 1,874 | | $ | 1,069 | | $ | 805 | | $ | - | |
OFF-BALANCE SHEET ARRANGEMENTS
At the date of this MD&A, the Company had no material off-balance sheet arrangements that have, or are reasonably likely to have, a current or future effect on the financial performance or financial condition of the Company.
FINANCIAL INSTRUMENTS
| (in thousands) | Fair value as at | | |
| | Dec 31, 2012 | Basis of Measurement | Associated Risks |
| Cash and cash equivalents | $ | 20,735 | Carrying value | Concentration, credit, currency, interest rate |
| | | | | |
| Short term investments | $ | 5,085 | Carrying value | Concentration, interest rate |
| | | | | |
| Marketable securities(1) | $ | 79 | Fair value through other
comprehensive income | Exchange |
| | | | | |
| Trade and other receivables | $ | 18,099 | Carrying value | Concentration, credit, currency, commodity |
| | | | | price |
| Trade and other payables | $ | 8,111 | Carrying value | Currency |
(1) Classified as short-term investments in the Company’s Statement of Financial Position
The carrying values of cash and cash equivalents, short term investments, trade and other receivables, and trade and other payables approximate their fair values due to the short-term nature of the items. The fair values of marketable securities are based on current bid prices at December 31, 2012.
On September 25, 2012, the Company entered into contracts with INTL FCStone (Europe) Limited to hedge a total of 250 tonnes of lead production from the Topia Mine between October 31, 2012 and February 28, 2013. The derivative instruments entered into were in the form of zero-cost put/call collars with a floor price of US $1,975 per tonne of lead and a ceiling price of US $2,550 per tonne of lead. As at December 31, 2012, 100 tonnes of lead remained outstanding under the lead collar contracts. These derivatives are not designated as hedges by the Company, and are marked to their market values at the end of each reporting date. Adjustments to the market value are included in the statement of comprehensive income within other income. For the year ended December 31, 2012, the Company’s unrealized losses with respect to the lead collar contracts were insignificant.
During the reporting period, the Company did not incur any material gains or losses in respect of its financial instruments.
The Company is exposed in varying degrees to a number of risks arising from financial instruments. Management’s close involvement in the operations allows for the identification of risks and variances from expectations. The Company’s main objectives for managing risks are to ensure liquidity, the fulfillment of obligations, the continuation of the Company’s mining operations and exploration programs, and to limit exposure to credit and market risks.
| GREAT PANTHER SILVER LIMITED | |
| YEAR ENDED DECEMBER 31, 2012 | 32 |
The risks associated with the financial instruments used by the Company and the way in which such exposures are managed are as follows:
| | (a) | Concentration risk |
| | | |
| | | Concentration risk exists in cash and cash equivalents and short-term investments because significant balances are maintained with four financial institutions. To mitigate the risk, the Company diversifies its cash and cash equivalents and short-term investments by holding guaranteed investment certificates and similar securities with a number of different financial institutions. The primary investment products include, but are not limited to, high interest savings accounts and guaranteed investment certificates. |
| | | |
| | | Concentration risk also exists in trade accounts receivable because the Company’s revenues are currently substantially derived from sales to four customers. To mitigate the risk, the Company continues to seek other viable customers for the sale of its metal concentrates. |
| | | |
| | (b) | Credit risk |
| | | |
| | | Credit risk primarily arises from the Company’s cash and cash equivalents, short-term investments, and trade and other receivables. The risk exposure is limited to their carrying amounts at the balance sheet date. The risk is mitigated by holding cash and cash equivalents with highly rated Canadian and Mexican financial institutions. The Company does not invest in asset-backed deposits or investments and does not expect any credit losses. The Company periodically assesses the quality of its investments and is satisfied with the credit rating of the financial institutions and the investment grade of its guaranteed investment certificates. |
| | | |
| | (c) | Market risk |
| | | |
| | | The significant market risks to which the Company is exposed are currency, interest rate, commodity price and exchange risk. |
| | (i) | Currency risk |
| | | |
| | | The operating results and financial position of the Company are reported in Canadian dollars. As the Company operates in an international environment, some of the Company’s financial instruments and transactions are denominated in currencies other than the Canadian dollar, namely the US dollar and Mexican peso. The results of the Company’s operations are subject to currency transaction and translation risks. |
| | | |
| | (ii) | Interest rate risk |
| | | |
| | | The Company’s approach is to invest cash in high interest savings accounts and guaranteed investment certificates at fixed or floating rates of interest in order to maintain liquidity, while achieving a satisfactory return for shareholders. The Company manages risk by monitoring changes in interest rates and by maintaining a relatively short duration for its portfolio of cash equivalent securities. Many of these instruments can be immediately redeemed and those of a fixed term do not exceed one year. |
| | | |
| | (iii) | Commodity price risk |
| | | |
| | | The value of the Company’s mineral and exploration and evaluation properties depends on the price of silver, gold, lead and zinc and the outlook for these minerals. |
| | | |
| | | Silver and gold, as well as lead and zinc prices have historically fluctuated widely and are affected by numerous factors outside of the Company’s control, including, but not limited to, market fluctuations, government regulations relating to prices, taxes, royalties, allowable production, imports, exports, supply, industrial and retail demand, forward sales by producers and speculators, levels of worldwide production and short-term changes in supply and demand because of speculative hedging activities. The value of trade receivables depends on changes in metal prices over the quotation period. The Company has not hedged silver and gold prices. The Company has entered into option contracts to mitigate the price risk associated with the sales of its lead and zinc by-products for periods not exceeding one year. |
| GREAT PANTHER SILVER LIMITED | |
| YEAR ENDED DECEMBER 31, 2012 | 33 |
| | (iv) | Exchange risk |
| | | |
| | | The fair value of marketable securities is based on quoted market prices which the shares of the investments can be exchanged for. The exchange price of the shares may fluctuate significantly depending on various other market factors. To mitigate the risk, the Company’s approach is to maintain minimal investments in marketable securities. |
OUTLOOK
The Company’s primary focus for the 2013 fiscal year is to improve and strengthen the operational efficiency of the existing operations and build the platform for more significant growth in 2014 and beyond. The Company’s goals are to:
| | 1. | Increase cash flow from mine operations by cutting costs and improving operating efficiency; |
| | 2. | Aggressively drive the development of the San Ignacio Project with the view to commencing production in 2014 to augment existing production at Guanajuato; |
| | 3. | Commence the exploration drilling at the El Horcon Project; and |
| | 4. | Develop acquisition opportunities. |
The Company expects metal production for 2013 to be in the range of 2.4 to 2.5 million Ag eq oz, and cash costs to be in the range of US$10.00 to US$11.00 per silver ounce.
| 2013 Production and Cash Cost per Silver Ounce Guidance | 2012 Actual | 2013 Guidance Range |
| Silver Equivalent Ounces | 2,378,603 | 2,400,000 – 2,500,000 |
| | | |
| Cash costs per silver ounce (USD) | $ 12.24 | $ 10.00 – 11.00 |
On August 21, 2012, the Company purchased surface rights totalling 19.4 hectares on its wholly-owned San Ignacio Project in Guanajuato, Mexico allowing sufficient space for the development of a ramp, waste dumps, and for auxiliary infrastructure. With the acquisition of the surface rights, the Company has applied for the permits required for the underground development. Permitting is expected to be completed by the end of the second quarter of 2013 and construction of a new portal and ramp is expected to begin shortly after the receipt of permits.
Great Panther continues to seek out opportunities to add production in the districts within which it is already operating. The Company expects to commence a drill program before the end of the second quarter of 2013 with the goal of delineating a resource at the recently acquired El Horcon Project located 60 kilometres northwest of the Guanajuato Mine Complex.
In addition, the Company is continually evaluating acquisition opportunities outside of its existing operations, with the goal of adding near-term production.
| GREAT PANTHER SILVER LIMITED | |
| YEAR ENDED DECEMBER 31, 2012 | 34 |
TRANSACTIONS WITH RELATED PARTIES
The Company has entered into the following transactions with related parties:
| | | | | | | | | Year Ended | | | Year Ended | |
| (in 000’s) | | Q4 2012 | | | Q4 2011 | | | Dec 31, 2012 | | | Dec 31, 2011 | |
| Consulting fees paid or accrued to companies controlled by directors of theCompany | $ | 99 | | $ | 343 | | $ | 1,045 | | $ | 781 | |
| | | | | | | | | | | | | |
| Consulting fees paid or accrued to companies controlled by officers of the Company | | - | | | 137 | | | - | | | 290 | |
| | | | | | | | | | | | | |
| Director fees paid or accrued | | 70 | | | 189 | | | 233 | | | 189 | |
| | | | | | | | | | | | | |
| Consulting fees paid or accrued to a company with a common director of theCompany | | - | | | - | | | 34 | | | - | |
| | | | | | | | | | | | | |
| Office and administration fees paid or accrued to a company controlled by a directorof the Company | | - | | | 21 | | | 21 | | | 85 | |
| | | | | | | | | | | | | |
| | $ | 169 | | $ | 690 | | $ | 1,333 | | $ | 1,345 | |
As at December 31, 2012, $30,000 (December 31, 2011 - $42,000) was due to companies controlled by officers and directors of the Company and was included in accounts payable. Amounts due from companies with common directors were $17,000 (December 31, 2011 - $24,000) and were included in trade and other receivables.
The above transactions occurred in the normal course of operations and are measured at fair value.
CRITICAL ACCOUNTING POLICIES AND ESTIMATES
The preparation of the consolidated financial statements in conformity with International Financial Reporting Standards (“IFRS”) requires management to make judgments, estimates and assumptions which affect the reported amounts of assets and liabilities, the disclosure of contingent assets and liabilities at the date of the consolidated financial statements and the reported amounts of revenues and expenses during the reporting period. The Company is not required to make any significant judgments in the application of its accounting policies.
Estimates are based on historical experience and other factors considered to be reasonable, and are reviewed on an ongoing basis. Revision to estimates and the resulting effects on the carrying amounts of the Company’s assets and liabilities are accounted for prospectively. A summary of the Company’s significant accounting policies is set out in Note 3 of the consolidated financial statements for the year ended December 31, 2012.
The Company has identified the following areas where estimates and assumptions are made and where actual results may differ from the estimates under different assumptions and conditions and may materially affect financial results of the Company’s statement of financial position reported in future periods.
Useful lives of mineral properties, plant and equipment
The Company estimates the remaining lives of its producing mineral properties using a combination of quantitative and qualitative factors including historical results, mineral resources reported under National Instrument 43-101 (“NI 43-101”), estimates of ore production from areas not included in the NI 43-101 reports, and management’s intent to operate the property. The estimated remaining lives of the producing mineral properties are used to calculate amortization and depletion expense, assess impairment charges and the carrying values of assets, and for forecasting the timing of the payment of reclamation and remediation costs.
There are numerous uncertainties inherent in the estimation of the remaining lives of the producing mineral properties, and assumptions that are valid at the time of estimation may change significantly when new information becomes available. Changes in the forecast prices of commodities, exchange rates, or production costs may change the economic status of the resources, estimates of production from areas not included in the NI 43-101 reports, and management’s intent to operate the property and may ultimately have a material impact on the estimated remaining lives of the properties.
| GREAT PANTHER SILVER LIMITED | |
| YEAR ENDED DECEMBER 31, 2012 | 35 |
Reclamation and remediation provisions
The amounts recorded for reclamation and remediation provisions are based on estimates prepared by third party environmental specialists, if available, or by persons within the Company who have the relevant skills and experience. These estimates are based on remediation activities required by environmental laws in Mexico, the expected timing of cash flows, and the pre-tax risk free interest rates on which the estimated cash flows have been discounted. These estimates also include an assumption of the rate at which costs may inflate in future periods. Actual results could differ from these estimates. The estimates require extensive judgment about the nature, cost and timing of the work to be completed, and may change with future changes to costs, environmental laws and regulations and remediation practices.
Review of asset carrying values and assessment of impairment
The Company reviews each asset or cash generating unit at each reporting date to determine whether there are any indicators of impairment. If any such indication exists, a formal estimate of recoverable amount is performed and an impairment loss is recognized to the extent that the carrying amount exceeds the recoverable amount. The recoverable amount of an asset or cash generating unit is measured at the higher of fair value less costs to sell and value in use.
The determination of fair value and value in use requires management to make estimates and assumptions about expected production and sales volumes, metal prices, ore tonnage and grades, operating costs, reclamation and remediation costs, future capital expenditures and appropriate discount rates for future cash flows. The estimates and assumptions are subject to risk and uncertainty, and as such there is the possibility that changes in circumstances will alter these projections, which may impact the recoverable amount of the assets. In such circumstances, some or all of the carrying value of the assets may be further impaired or the impairment charge reduced with the impact recorded in the statement of comprehensive income.
Allocation of costs between mine development and production
The Company performs capital mine development and production activities within the same areas of the Guanajuato mine. Therefore, the Company is required to allocate costs between mine development and production. The Company allocates costs between mine development and production using the percentage of cubic metres of material moved. The allocation requires estimates about the nature of the work performed and the volume of material moved. Actual costs could vary from the estimated costs.
Revenue from concentrate sales
Revenue from the sale of metals in concentrate is recorded at the time when it is probable that the economic benefits associated with the transaction will flow to the Company, the risks and rewards of ownership are transferred to the customer and the revenue can be reliably measured. Variations between the sales price recorded at the initial recognition date and the actual final sales price at the settlement date caused by changes in market metals prices result in an embedded derivative in the related trade accounts receivable. The embedded derivative is recorded at fair value each period until final settlement occurs, with changes in fair value classified as a component of revenue. During periods of high price volatility, the effect of mark-to-market price adjustments related to the concentrate shipments which remain to be settled could be significant. In addition, actual settlement prices could vary significantly from the estimated prices at each reporting date.
Income taxes and recoverability of deferred tax assets
In assessing the probability of realizing income tax assets, the Company makes estimates related to expected future taxable income, potential tax planning opportunities, estimated timing of reversals of temporary differences, and the likelihood that tax positions taken will be sustained upon examination by applicable tax authorities. Where applicable tax laws and regulations are unclear or subject to ongoing varying interpretations, it is reasonably possible that changes in these estimates can occur which may materially affect the amounts of income tax assets recognized. In addition, future changes in tax laws could limit the Company’s ability to realize the benefits from deferred tax assets.
| GREAT PANTHER SILVER LIMITED | |
| YEAR ENDED DECEMBER 31, 2012 | 36 |
CHANGES IN ACCOUNTING STANDARDS
The following are accounting standards anticipated to be effective January 1, 2013 or later:
Presentation of Items of Other Comprehensive Income (“OCI”)
IAS 1 Presentation of Financial Statements will be amended to change the disclosure of items presented in OCI, including a requirement to separate items presented in OCI into two groups based on whether or not they may be recycled to profit or loss in the future. This amendment is effective for annual periods beginning on or after July 1, 2012. The Company is currently evaluating the impact the final standard is expected to have on its consolidated financial statements.
Financial Instruments
The IASB intends to replace IAS 39 Financial Instruments: Recognition and Measurement (“IAS 39”) in its entirety with IFRS 9 Financial Instruments (“IFRS 9”) in three main phases. IFRS 9 will be the new standard for the financial reporting of financial instruments that is principles-based and less complex than IAS 39, and is effective for annual periods beginning on or after January 1, 2015, with earlier adoption permitted. IFRS 9 requires that all financial assets be classified as subsequently measured at amortized cost or at fair value based on the Company’s business model for managing financial assets and the contractual cash flow characteristics of the financial assets. Financial liabilities are classified as subsequently measured at amortized cost except for financial liabilities classified as at fair value through profit or loss, financial guarantees and certain other exceptions.
In December 2011, the IASB amended the IFRS 7 (Financial Instruments: Disclosures) requiring additional disclosures on offsetting of financial assets and financial liabilities. This amendment is effective for annual periods beginning on or after January 1, 2013. This standard also requires additional disclosures about the initial application of IFRS 9. This amendment is effective for annual periods beginning on or after January 1, 2015 (or otherwise when IFRS 9 is first applied). IAS 32 (Financial Instruments: Presentation) was amended in December 2011 relating to application guidance on the offsetting of financial assets and financial liabilities. This standard is effective for annual periods beginning on or after January 1, 2014.
The Company is currently evaluating the impact these standards are expected to have on its consolidated financial statements.
Consolidation
IFRS 10 Consolidated Financial Statements establishes principles for the presentation and preparation of consolidated financial statements when an entity controls one or more other entities. This standard (i) requires a parent entity (an entity that controls one or more other entities) to present consolidated financial statements; (ii) defines the principle of control, and establishes control as the basis for consolidation; (iii) sets out how to apply the principle of control to identify whether an investor controls an investee and therefore must consolidate the investee; and (iv) sets out the accounting requirements for the preparation of consolidated financial statements. IFRS 10 supersedes IAS 27 Consolidated and Separate Financial Statements and SIC-12 Consolidation –Special Purpose Entities and is effective for annual periods beginning on or after January 1, 2013, with early application permitted. IAS 27 and IAS 28 – Investments in Associates were revised and reissued as IAS 27 –Separate Financial Statements and IAS 28 – Investments in Associates and Joint Ventures to align with the new consolidation guidance. The Company is currently evaluating the impact the final standard is expected to have on its consolidated financial statements.
Joint Arrangements
IFRS 11 Joint Arrangements establishes the core principle that a party to a joint arrangement determines the type of joint arrangement in which it is involved by assessing its rights and obligations and accounts for those rights and obligations in accordance with that type of joint arrangement. This standard is effective for annual periods beginning on or after January 1, 2013, with early application permitted. The Company does not expect this standard to have significant impact on its consolidated financial statements.
| GREAT PANTHER SILVER LIMITED | |
| YEAR ENDED DECEMBER 31, 2012 | 37 |
Disclosure of Involvement with Other Entities
IFRS 12 Disclosure of Involvement with Other Entities requires the disclosure of information that enables users of financial statements to evaluate the nature of, and risks associated with, its interests in other entities and the effects of those interests on its financial position, financial performance and cash flows. This standard is effective for annual periods beginning on or after January 1, 2013, with early application permitted. The Company is currently evaluating the impact the final standard is expected to have on its consolidated financial statements.
Fair Value Measurement
IFRS 13 Fair Value Measurement defines fair value, sets out in a single IFRS framework for measuring fair value and requires disclosures about fair value measurements. IFRS 13 applies when another IFRS requires or permits fair value measurements or disclosures about fair value measurements (and measurements, such as fair value less costs to sell, based on fair value or disclosures about those measurements), except for: share-based payment transactions within the scope of IFRS 2 Share-based Payment; leasing transactions within the scope of IAS 17 Leases; and, measurements that have some similarities to fair value but that are not fair value, such as net realizable value in IAS 2 Inventories or value in use in IAS 36 Impairment of Assets. This standard is effective for annual periods beginning on or after January 1, 2013, with early application permitted. The Company is currently evaluating the impact the final standard is expected to have on its consolidated financial statements.
Stripping Costs in the Production Phase of a Mine
In October of 2011, the IASB issued IFRIC 20 – Stripping Costs in the Production Phase of a Mine, which clarifies the requirements for accounting for costs of stripping activities in the production phase when two benefits accrue: (1) usable ore that can be used to produce concentrate inventory and (2) improved access to further quantities of material that will be mined in future periods. IFRIC 20 is effective for annual reporting periods beginning on or after January 1, 2013 with earlier application permitted and includes guidance on transition for pre-existing stripping costs. The Company does not expect this standard to have significant impact on its consolidated financial statements.
SECURITIES OUTSTANDING
At the date of this MD&A, the Company had 137,860,052 common shares issued, 316,250 warrants and 5,332,600 options outstanding.
INTERNAL CONTROLS OVER FINANCIAL REPORTING
The Company’s management is responsible for establishing and maintaining adequate internal control over financial reporting, and have designed such internal controls over financial reporting to provide reasonable assurance regarding the reliability of financial reporting and the preparation of the financial statements for external purposes in accordance with International Financial Reporting Standards. Any system of internal control over financial reporting, no matter how well designed, has inherent limitations. Therefore even those systems determined to be effective can provide only reasonable assurance with respect to financial statement preparation and presentation.
The Company’s management, including the Chief Executive Officer, the President and the Chief Financial Officer, conducted an evaluation of the effectiveness of the Company’s internal control over financial reporting based on the framework in Internal Control – Integrated Framework issued by the Committee of Sponsoring Organizations of the Treadway Commission. Based on this evaluation, management has concluded that, as of December 31, 2012, the Company’s internal control over financial reporting was effective.
There have been no changes in the Company’s internal control over financial reporting during the year ended December 31, 2012 that have materially affected, or are reasonably likely to materially affect the Company’s internal control over financial reporting.
| GREAT PANTHER SILVER LIMITED | |
| YEAR ENDED DECEMBER 31, 2012 | 38 |
DISCLOSURE CONTROLS AND PROCEDURES
The Company’s management is responsible for the design and effectiveness of disclosure controls and procedures which are designed to provide a reasonable level of assurance that information required to be disclosed in reports filed or submitted under securities laws is recorded, processed, summarized and reported accurately and within the time periods specified.
Management, including the Chief Executive Officer, the President, and the Chief Financial Officer, has evaluated the effectiveness of the design and operation of the Company’s disclosure controls and procedures as at December 31, 2012. Based on this evaluation, management has concluded that the Company’s disclosure controls and procedures were effective as at December 31, 2012.
RISKS AND UNCERTAINTIES
Commodity Price Risk
The market price of precious metals and other minerals is volatile and cannot be controlled. Our profitability and long-term viability will depend on the market price of silver, gold, lead and zinc. If these prices should drop significantly, the economic prospects of the projects in which the Company has an interest could be significantly reduced or rendered uneconomic. There is no assurance that, even if commercial quantities of ore are discovered, a profitable market may exist for the sale of same. Factors beyond the Company’s control may affect the marketability of any minerals discovered.
The marketability of minerals is also affected by numerous other factors beyond the Company’s control, including government regulations relating to royalties, allowable production and importing and exporting of minerals, regional or global consumption, expectations for inflation, and economic and political conditions, including currency fluctuations and interest rates, the effect of which cannot be accurately predicted.
Mineral prices have fluctuated widely, particularly in recent years. As noted in the “Profile and Strategy” section above, metal price changes can significantly affect the cost per ounce. Management, from time to time, will explore entering into possible hedging arrangements to limit the Company’s exposure to changes in prices of base metals, specifically lead and zinc.
Currency Risk
As the Company operates in an international environment, some of the Company’s financial instruments and transactions are denominated in currencies other than the Canadian dollar, and as a result fluctuations in currency exchange rates may significantly impact the Company’s earnings and cash flows. Revenues from the sale of concentrates are primarily denominated in US dollars, while operating costs are primarily denominated in Canadian dollars and Mexican pesos. The appreciation of the Mexican peso against the Canadian dollar would increase the cost of exploration, development and operations at the Company’s mineral properties in Mexico. The Company does not actively manage its foreign exchange risk with hedging instruments.
Interest Rate Risk
The Company’s exposure to interest rate risk is limited to cash invested in high interest savings accounts and guaranteed investment certificates at fixed rates of interest and cash equivalents that are maintained in floating rates of interest. The Company manages the risk by monitoring changes in interest rates in comparison to prevailing market rates. The Company does not carry any material financial liabilities which bear interest.
Credit Risk
The Company’s credit risk exposure is limited to the carrying amounts of cash and cash equivalents and amounts receivable. Cash and cash equivalents are held as cash deposits or invested in high interest savings accounts and guaranteed investment certificates with various maturity dates. The Company does not invest in asset-backed deposits or investments and does not expect any credit losses. The Company periodically assesses the quality of its investments and is satisfied with the credit rating of the financial institutions and the investment grade of its guaranteed investment certificates.
| GREAT PANTHER SILVER LIMITED | |
| YEAR ENDED DECEMBER 31, 2012 | 39 |
The Company also assesses the collectability of its trade receivables by reviewing the creditworthiness of its customers. The Company historically has not had difficulty collecting receivables from its customers, nor have customers defaulted on any payments.
Concentration of Customers
The Company sells refined concentrates containing silver, gold, lead and zinc to metal traders and smelters. The Company believes that a limited number of customers will continue to represent a significant portion of its total revenue. Although the Company does not consider itself economically dependent upon any single customer or combination of customers due to the existence of other potential metal traders or smelters capable of purchasing the Company’s supply, there can be no assurance that the Company will be able to maintain its current significant customers or secure significant new customers on similar terms and this may have a material adverse effect on the Company’s business, financial condition, operating results and cash flows.
Liquidity Risk
Liquidity risk is the risk that the Company will not be able to meet its financial obligations as they become due. The Company ensures there is sufficient working capital to meet short term business requirements. One of management’s goals is to maintain an optimal level of liquidity through the active management of the Company’s assets, liabilities and cash flows. The Company prepares annual budgets which are approved by the Board of Directors and prepares cash flows and liquidity forecasts on a quarterly basis.
For the year ended December 31, 2012, cash flows provided by operations were used to fund the operating costs associated with the producing properties as well as mineral property exploration expenditures, capital expenditures and head office costs. The Company’s cash and cash equivalents are invested in high interest savings accounts and guaranteed investment certificates which are available on demand to fund the Company’s operating costs and other financial demands.
Exploration and Development Stage of the Properties
The Company has made a significant investment to expand the NI 43-101 compliant Mineral Resource estimates for both the Guanajuato and Topia mines. Exploration work on the Company’s mines and mineral properties has expanded as the Company seeks to define additional resources. Even in the event commercial quantities of minerals are discovered, exploration and development stage properties, such as San Ignacio, El Horcon and Santa Rosa, might not be brought into a state of commercial production. The search for valuable minerals as a business is extremely risky. Finding mineral deposits is dependent on a number of factors, not the least of which is the technical skill of exploration personnel involved.
The commercial viability of a mineral deposit, once discovered, is also dependent on a number of factors, some of which are the particular attributes of the deposit, such as size, grade and proximity to infrastructure, as well as metal prices. Most of these factors are beyond the control of the entity conducting such mineral exploration. There can be no assurance that operations will be profitable in the future.
The Company is subject to risks associated with exploration and development stages of the properties including the timing and cost of the construction of mining and processing facilities, the availability and cost of skilled labour and mining equipment, the availability and cost of appropriate smelting and refining arrangements, the need to obtain necessary environmental and other governmental approvals and permits, and potential increases in construction and operating costs due to changes in the cost of fuel, materials and supplies.
Competition and Agreements with Other Parties
The mineral industry is intensely competitive in all phases. The Company competes with many companies possessing greater financial resources and technical facilities than ourselves for the acquisition of mineral concessions, claims, leases and other mineral interests as well as for the recruitment and retention of qualified employees.
| GREAT PANTHER SILVER LIMITED | |
| YEAR ENDED DECEMBER 31, 2012 | 40 |
The Company’s management consists of individuals with vast experience, knowledge, and contacts to capitalize on future opportunities.
Market Forces Outside the Control of the Company
The marketability of minerals is affected by numerous factors beyond the control of the entity involved in their mining and processing. These factors include market fluctuations, government regulations relating to prices, taxes, royalties, allowable production, imports, exports and supply and demand. One or more of these risk elements could have an impact on costs of an operation and if significant enough, reduce the prospects of profitability of operations and threaten commercial continuation.
To mitigate these risks and uncertainties that affect our operations and improve on predictability, the Company enters into contracts with customers and vendors.
Environmental Factors
There is no assurance that environmental regulations will not change in a manner that could have an adverse effect on the Company’s financial condition, liquidity or results of operations. Environmental legislation is constantly expanding and evolving in ways that impose stricter standards and more rigorous enforcement, with higher fines and more severe penalties for non-compliance, and increased scrutiny of proposed projects. There is an increased level of responsibility for companies, and trend towards criminal liability for officers and directors for violations of environmental laws, whether inadvertent or not.
The Company has taken a proactive approach to managing environmental risk. The Company participated in a voluntary audit of its Guanajuato operations and conducted a multi-year environmental program completed in 2011, working in cooperation with the Mexican environmental authority to ensure compliance with regulations governing the protection of the environment in Mexico. The Company is waiting for final certification from the government authorities.
Inherent Dangers with Mining
The development and operation of a mine involves risks that even experience and knowledge may not be able to overcome. These risks include unusual or unexpected geological formations, metallurgical and other processing problems, environmental hazards, power outages, labour disruptions, accidents, weather condition interruptions, explosions, fires and the inability to obtain suitable or adequate machinery, equipment or labour.
These risks could result in damage or destruction of mineral properties, production facilities, personal injury, environmental damage, mining delays, increased production costs, monetary losses and legal liability. The Company may not be able to obtain insurance to cover these risks at economically feasible premiums. Insurance against certain environmental risks, including potential liability for pollution and other hazards as a result of the disposal of waste products occurring from production, is not generally available to companies within the mining industry. The Company may suffer a material adverse effect on its business if the Company incurs losses related to any significant events that are not covered by its insurance policies.
Safety is the Company’s highest priority in operating its mines. A comprehensive safety program is in place at both mines and meetings with employees and contractors are held on a regular basis to reinforce standards and practices. The Company also reviews its insurance coverage on an annual basis to maintain its adequacy and relevancy.
CAUTIONARY STATEMENT ON FORWARD-LOOKING STATEMENTS
Certain of the statements and information in this document constitute “forward-looking statements” within the meaning of the United StatesPrivate Securities Litigation Reform Actof 1995 and “forward-looking information” within Canadian securities laws (collectively “forward-looking statements”). All statements, other than statements of historical fact, that address activities, events or developments that the Company expects or anticipates will or may occur in the future are forward-looking statements. Forward-looking statements are often, but not always, identified by the words “anticipates”, “believes”, “expects”, “may”, “likely”, “plans” and similar words. Forward-looking statements reflect the Company’s current expectations and assumptions, and are subject to a number of known and unknown risks, uncertainties and other factors which may cause the Company’s actual results, performance or achievements to be materially different from any anticipated future results, performance or achievements expressed or implied by the forward-looking statements.
| GREAT PANTHER SILVER LIMITED | |
| YEAR ENDED DECEMBER 31, 2012 | 41 |
In particular, this MD&A includes forward-looking statements, principally under the section titled “Outlook”, but also elsewhere in this document relating to estimates, forecasts, and statements as to management’s expectations with respect to the future production of silver, gold, lead and zinc; profit, operating costs and cash flow; sales volume and selling prices of products; capital expenditures, plans and expectations for the development of the Company’s mines and projects; progress in the development of mineral properties; the timing of production and the cash and total costs of production; sensitivity of earnings to changes in commodity prices and exchange rates; the impact of foreign currency exchange rates; and the future plans and expectations for the Company’s properties and operations. Examples of specific information in this MD&A that may constitute forward looking statements are:
- The Company’s objective to acquire additional mines or projects in Latin America
- Plans and targets for exploration drilling for 2013
- Silver equivalent ounce production guidance for 2013
- Cash cost per silver ounce guidance for 2013
- Expectations for grade variability
- Expectations for permitting and construction for the Company’s San Ignacio project
- Permitting expectations, plans to commence drilling, and expectations to reinstate certain claims at the Company’s El Horcon project
- Capital expenditure forecasts for 2013
- Expected cash-flows for 2013
- Expectation to start production at San Ignacio in 2014
These forward-looking statements are necessarily based on a number of factors and assumptions that, while considered reasonable by the Company as of the date of such statements, are inherently subject to significant business, economic and competitive uncertainties and contingencies, as described below. These assumptions made by the Company in preparing the forward looking information contained in this MD&A, which may prove to be incorrect, include, but are not limited to, general business and economic conditions; the supply and demand for, deliveries of, and the level and volatility of prices of, silver, gold, lead and zinc; expected Canadian dollar, Mexican peso and US dollar exchange rates; the timing of the receipt of regulatory and governmental approvals for development projects and other operations; costs of production and production and productivity levels; estimated future capital expenditures and cash flows; the continuing availability of water and power resources for operations; the accuracy of the interpretation and assumptions used in calculating reserve and resource estimates (including with respect to size, grade and recoverability); the accuracy of the information included or implied in the various independently produced and published technical reports; the geological, operational and price assumptions on which these technical reports are based; conditions in the financial markets; the ability to attract and retain skilled staff; the ability to procure equipment and operating supplies and that there are no material unanticipated variations in the cost of energy or supplies; the ability to secure contracts for the sale of the Company’s products (metals concentrates); the execution and outcome of current or future exploration activities; the ability to obtain adequate financing for planned activities and to complete further exploration programs; the Company’s ability to maintain adequate internal control over financial reporting; the ability of contractors to perform their contractual obligations; and operations not being disrupted by issues such as mechanical failures, labour disturbances and adverse weather conditions.
This list is not exhaustive of the factors that may affect any of the Company’s forward-looking statements or information. Forward-looking statements or information are statements about the future and are inherently uncertain, and actual achievements of the Company or other future events or conditions may differ materially from those reflected in the forward-looking statements or information due to a variety of risks, uncertainties and other factors, including, without limitation, changes in commodity prices; changes in foreign currency exchange rates; acts of foreign governments; political risk and social unrest; uncertainties related to title to the Company’s mineral properties and the surface rights thereon, including the Company’s ability to acquire, or economically acquire, the surface rights to certain of the Company’s exploration and development projects; unanticipated operational difficulties due to adverse weather conditions, failure of plant or mine equipment and unanticipated events related to health, safety, and environmental matters; failure of counterparties to perform their contractual obligations; and deterioration of general economic conditions.
| GREAT PANTHER SILVER LIMITED | |
| YEAR ENDED DECEMBER 31, 2012 | 42 |
The Company’s forward-looking statements and information are based on the assumptions, beliefs, expectations and opinions of management as of the date of this MD&A, and other than as required by applicable securities laws, and to the extent required by applicable securities laws, the Company does not assume any obligation to update forward-looking statements and information. Accordingly, readers should not place undue reliance on forward-looking statements. The forward-looking statements contained herein are expressly qualified by this cautionary statement.
Further information can be found in the section entitled “Description of the Business – Risk Factors” in the Company’s Annual Information Form (“AIF”) for the year ended December 31, 2012, which is available on SEDAR athttp://www.sedar.com,and in “Risks and Uncertainties” in this MD&A. Readers are advised to carefully review and consider the risk factors identified in the AIF for a discussion of the factors that could cause the Company’s actual results, performance and achievements to be materially different from any anticipated future results, performance or achievements expressed or implied by the forward-looking statements. Readers are further cautioned that the foregoing list of assumptions and risk factors is not exhaustive and it is recommended that prospective investors consult the more complete discussion of the Company’s business, financial condition and prospects that is included in the AIF.
QUALIFIED PERSON
Robert F. Brown, P. Eng., a Qualified Person as defined by National Instrument 43-101 and the Company's Vice President of Exploration, has reviewed and approved the technical disclosure contained in this MD&A.
CAUTIONARY NOTE TO U.S. INVESTORS
This MD&A has been prepared in accordance with the requirements of the securities laws in effect in Canada, which differ from the requirements of United States securities laws. The terms “mineral reserve”, “proven mineral reserve” and “probable mineral reserve” are Canadian mining terms as defined in accordance with Canadian National Instrument 43-101 – Standards of Disclosure for Mineral Projects (“NI 43-101”) and the Canadian Institute of Mining, Metallurgy and Petroleum (the “CIM”) - CIM Definition Standards on Mineral Resources and Mineral Reserves, adopted by the CIM Council, as amended. These definitions differ from the definitions in SEC Industry Guide 7 under the United States Securities Act of 1933, as amended (the “Securities Act”). Under SEC Industry Guide 7 standards, mineralization may not be classified as a “reserve” unless the determination has been made that the mineralization could be economically and legally produced or extracted at the time the reserve determination is made. Among other things, all necessary permits would be required to be in hand or issuance imminent in order to classify mineralized material as reserves under the SEC standards. Under SEC Industry Guide 7 standards, a “final” or “bankable” feasibility study is required to report reserves, the three-year historical average price is used in any reserve or cash flow analysis to designate reserves and the primary environmental analysis or report must be filed with the appropriate governmental authority.
In addition, the terms “mineral resource”, “measured mineral resource”, “indicated mineral resource” and “inferred mineral resource” are defined in and required to be disclosed by NI 43-101; however, these terms are not defined terms under SEC Industry Guide 7 and are normally not permitted to be used in reports and registration statements filed with the SEC. Investors are cautioned not to assume that any part or all of mineral deposits in these categories will ever be converted into reserves. “Inferred mineral resources” have a great amount of uncertainty as to their existence, and great uncertainty as to their economic and legal feasibility. It cannot be assumed that all or any part of an inferred mineral resource will ever be upgraded to a higher category. Under Canadian rules, estimates of inferred mineral resources may not form the basis of feasibility or pre-feasibility studies, except in rare cases. Investors are cautioned not to assume that all or any part of an inferred mineral resource exists or is economically or legally mineable. Disclosure of “contained ounces” in a resource is permitted disclosure under Canadian regulations; however, the SEC normally only permits issuers to report mineralization that does not constitute “reserves” by SEC Industry Guide 7 standards as in place tonnage and grade without reference to unit measures.
Accordingly, information contained in this MD&A and the documents incorporated by reference herein contain descriptions of our mineral deposits that may not be comparable to similar information made public by U.S. companies subject to the reporting and disclosure requirements under the United States federal securities laws and the rules and regulations thereunder.
| GREAT PANTHER SILVER LIMITED | |
| YEAR ENDED DECEMBER 31, 2012 | 43 |
ADDITIONAL SOURCES OF INFORMATION
Additional information relating to Great Panther Silver Limited can be found on SEDAR athttp://www.sedar.comand EDGAR athttp://www.sec.gov/edgar.shtmlor the Company’s website athttp://www.greatpanther.com.
| GREAT PANTHER SILVER LIMITED | |
| YEAR ENDED DECEMBER 31, 2012 | 44 |