Exhibit 99.3

GREAT PANTHER SILVER LIMITED
MANAGEMENT’S DISCUSSION AND ANALYSIS
FOR THE YEAR ENDED DECEMBER 31, 2017
TABLE OF CONTENTS
| PROFILE | 3 |
| HIGHLIGHTS | 4 |
| SIGNIFICANT EVENTS | 5 |
| OVERALL PERFORMANCE - OPERATIONAL AND FINANCIAL HIGHLIGHTS | 6 |
| SELECTED ANNUAL INFORMATION | 16 |
| SUMMARY OF SELECTED QUARTERLY INFORMATION | 17 |
| RESULTS OF OPERATIONS | 19 |
| OUTLOOK | 25 |
| METAL PRICE SENSITIVITIES | 26 |
| LIQUIDITY AND CAPITAL RESOURCES | 27 |
| TRANSACTIONS WITH RELATED PARTIES | 29 |
| CRITICAL ACCOUNTING ESTIMATES | 29 |
| CHANGES IN ACCOUNTING POLICIES | 30 |
| FINANCIAL INSTRUMENTS | 30 |
| SECURITIES OUTSTANDING | 30 |
| NON-GAAP MEASURES | 30 |
| INTERNAL CONTROLS OVER FINANCIAL REPORTING | 37 |
| CAUTIONARY STATEMENT ON FORWARD-LOOKING STATEMENTS | 38 |
| CAUTIONARY NOTE TO U.S. INVESTORS | 40 |
GREAT PANTHER SILVER LIMITED Management’s Discussion & Analysis | Page 2 |
MANAGEMENT'S DISCUSSION AND ANALYSIS
This Management’s Discussion and Analysis (“MD&A”) should be read in conjunction with the annual audited consolidated financial statements of Great Panther Silver Limited (“Great Panther” or the “Company”) for the year ended December 31, 2017 and the notes related thereto, which are prepared in accordance with International Financial Reporting Standards (“IFRS”) as issued by the International Accounting Standards Board, and the most recent annual Form 40-F/Annual Information Form (“AIF”) on file with the US Securities and Exchange Commission (“SEC”) and Canadian provincial securities regulatory authorities.
All information in this MD&A is current as at February 22, 2018, unless otherwise indicated. All dollar amounts are expressed in US dollars ("$", or “USD”), unless otherwise noted.
This MD&A contains forward-looking statements and should be read in conjunction with the Cautionary Statement on Forward-Looking Statements section at the end of this MD&A.
This MD&A contains references to non-GAAP measures. Refer to the section entitled «Non-GAAP Measures» for explanations of these measures and reconciliations to the Company’s reported financial results.
Some tables contained in this MD&A may not sum exactly, due to rounding.
PROFILE
Great Panther Silver Limited is a primary silver and precious metals producer and exploration company listed on the Toronto Stock Exchange trading under the symbol GPR, and on the NYSE American trading under the symbol GPL. The Company’s wholly-owned mining operations in Mexico are the Topia Mine (or “Topia”), and the Guanajuato Mine Complex (the “GMC”) which comprises the Company’s Guanajuato Mine, the San Ignacio Mine (or “San Ignacio”), and the Cata processing plant. The GMC produces silver and gold concentrate and is located in central Mexico, approximately 380 kilometres north-west of Mexico City, and approximately 30 kilometres from the Guanajuato International Airport. The Topia Mine is located in the Sierra Madre Mountains in the state of Durango in northwestern Mexico, producing concentrates containing silver, gold, lead and zinc and earning revenue from custom milling of third-party material at its processing facility.
On June 30, 2017, Great Panther completed the acquisition of the Coricancha Mine Complex (“Coricancha”) in Peru. Coricancha is a gold-silver-copper-lead-zinc mine located in the central Andes of Peru, approximately 90 kilometres east of Lima, and has been on care and maintenance since August 2013. Coricancha has a 600 tonnes per day processing facility along with supporting mining infrastructure. The Company is conducting evaluations of the underground mine and infrastructure, as well as undertaking technical and environmental studies with a view to restarting the operation. In addition, the Company recently updated Coricancha’s Mineral Resource Estimate and expects to release further technical studies in the second quarter of 2018. Depending on the outcome of the Company's evaluations, development and capital investments in support of a restart of the mine could commence in 2018.
The Company’s exploration properties also include the El Horcón, Santa Rosa, and Plomo projects in Mexico; and the Argosy project in Canada. The El Horcón project is located 100 kilometres by road northwest of Guanajuato, Santa Rosa is located 15 kilometres northeast of Guanajuato, and the Plomo property is located in Sonora, Mexico. The Argosy property is located in the Red Lake Mining District in northwestern Ontario, Canada.
The Company continues to evaluate additional mining opportunities located in the Americas. Additional information on the Company, including its Annual Information Form, can be found on SEDAR atwww.sedar.com and EDGAR atwww.sec.gov/edgar.shtml or on the Company’s website atwww.greatpanther.com.
GREAT PANTHER SILVER LIMITED Management’s Discussion & Analysis | Page 3 |
HIGHLIGHTS
Highlights of fiscal year 2017 compared to fiscal year 2016
| · | Metal production increased 2% to 3,978,731 silver equivalent ounces (“Ag eq oz”); |
| · | Silver production decreased 3% to 1,982,685 silver ounces; |
| · | Gold production increased 1% to 22,501 gold ounces; |
| · | Cash cost1 increased by $2.11 to $5.76; |
| · | Cash cost per Ag eq oz1 increased by $1.76 to $12.11; |
| · | AISC1 increased by $4.08 to $15.07; |
| · | Revenue increased 3% to $63.7 million; |
| · | Mine operating earnings1 before non-cash items were $22.0 million, a decrease of 21%; |
| · | Adjusted EBITDA1 decreased to $6.0 million, compared to $16.5 million; |
| · | Net income totaled $1.3 million, compared to a net loss of $4.1 million; |
| · | Cash flows from operating activities, before changes in non-cash net working capital was $6.4 million, compared to $16.0 million; |
| · | Cash and short-term deposits remained relatively unchanged at $56.9 million at December 31, 2017 from $56.7 million at December 31, 2016; and |
| · | Net working capital decreased to $66.0 million at December 31, 2017 from $66.6 million at December 31, 2016. |
Highlights of the fourth quarter 2017 compared to fourth quarter 2016, unless otherwise noted:
| · | Metal production increased 21% to 1,065,773 Ag eq oz; |
| · | Silver production increased 12% to 514,218 silver ounces; |
| · | Gold production increased 14% to 5,931 ounces; |
| · | Cash cost1 increased by $1.42 to $7.25; |
| · | Cash cost per Ag eq oz1 increased by $2.70 to $13.18; |
| · | AISC1 decreased by $1.72 to $14.72 |
| · | Revenue increased 39% to $17.4 million; |
| · | Mine operating earnings1 before non-cash items were $5.0 million, an increase of 11%; |
| · | Net loss totaled $1.9 million, compared to $1.5 million; |
| · | Adjusted EBITDA1 amounted to $0.9 million, compared to $1.4 million; and, |
| · | Cash flows from operating activities, before changes in non-cash net working capital was $0.6 million, compared to $1.1 million. |
| 1 | See section entitled «Non-GAAP measures» in this MD&A |
GREAT PANTHER SILVER LIMITED Management’s Discussion & Analysis | Page 4 |
SIGNIFICANT EVENTS
On April 13, 2017, the Company announced that Elise Rees, FCPA, FCA, ICD.D, had joined the Company’s Board of Directors.
In June 2017, the Company announced that it had successfully completed the commissioning phase of the refurbished processing plant at Topia and that the plant was operating at planned capacity. Milling operations had been suspended from early December 2016 until early April 2017 to facilitate the construction of a tailings filtration plant, the execution of plant upgrades, and the transition to a new tailings handling facility (the “Topia Project”). In December 2017, SEMARNAT (the Mexican environmental permitting agency) granted the Company all permits for the construction and operation of the new Phase II tailings storage facility (“TSF”) at its Topia Mine. The Company is utilizing the existing Phase I TSF during the construction of Phase II.
In June 2017, surface drilling at San Ignacio confirmed the continuation of strong gold-silver mineralization along strike of the current mine workings.
On June 30, 2017, the Company completed the acquisition of the Coricancha Mine Complex from subsidiaries of Nyrstar N.V. (“Nyrstar”).
On August 16, 2017, James Bannantine was appointed President and Chief Executive Officer of the Company, succeeding Robert Archer. Mr. Archer remains on the Board of Directors.
In August 2017, the Company announced the results of the exploration drilling program conducted at Coricancha and focused on three main veins – Wellington, Constancia and Colquipallana, in addition to a new exploration target, the Animas vein. Highlights included Wellington hole Cori-15-003, which intersected 10.46g/t Au, 388g/t Ag, 1.64% Cu, 0.53% Pb and 2.86% Zn over a true width of 0.53 metres, and Constancia hole Cori-15-013 that intersected 22.64g/t Au, 83g/t Ag, 0.19% Cu, 1.12% Pb and 2.30% Zn over a true width of 0.41 metres.
On December 20, 2017, the Company completed an updated Mineral Resource Estimate in accordance with National Instrument 43-101 for Coricancha, with an effective date of December 20, 2017. The Measured and Indicated (“M&I”) tonnes and grades in the estimate compare well with those from the Historical Resource Estimate of 2012. The M&I Mineral Resource was estimated at 24.2 million Ag eq oz and the Inferred Mineral Resource was estimated at 28.4 million Ag eq oz. The Company is completing optimization studies and is evaluating alternative mining methods to improve productivity, and to reduce dilution, costs and project risk. The Company plans to release additional technical studies for the project in the second quarter of 2018.
On January 25, 2018, the Company provided an update to the Mineral Resource at the GMC, with an effective date of August 31, 2017. Compared to the previous update which had an effective date of August 31, 2016, M&I Mineral Resources increased by 91% to 13,619,794 Ag eq oz due to increases in both resource categories at both San Ignacio and Guanajuato Mines. Specifically, M&I Mineral Resources increased by 110% to 11,362,323 Ag eq oz and 31% to 2,257,472 Ag eq oz at the San Ignacio Mine and Guanajuato Mine, respectively, compared to the previous update. Inferred Mineral Resources at the GMC remained essentially unchanged at 6,997,306 Ag eq oz.
On February 22, 2018, Great Panther regretfully announced the passing away of Mr. Kenneth W. Major, who served as Director of the Company since March of 2011, including distinguished service as Chair of Safety, Health and Environment Committee in addition to service on other committees of the Board of Directors. Ken graduated from McGill University with a bachelor's degree in metallurgical engineering and established an over 40-year career in the mining industry. He was a founder/partner of Rescan Engineering Ltd. which was later acquired by Hatch. During his career, he provided engineering, operations and management services to major mining companies. Ken was the recipient of the Art MacPherson Comminution Award, a peer recognition awarded by the Canadian Mineral Processors ("CMP"), in recognition of his outstanding contribution in the field. In 2018, he received the Lifetime Achievement Award by from the CMP for his enduring contributions to mineral processing.
GREAT PANTHER SILVER LIMITED Management’s Discussion & Analysis | Page 5 |
OVERALL PERFORMANCE - OPERATIONAL AND FINANCIAL HIGHLIGHTS
| | | Q4 2017 | | Q4 2016 | | Change | | 2017 | | 2016 | | Change |
| OPERATING RESULTS | | | | | | | | | | | | | | | | | | | | | | | | |
| Tonnes milled (excluding custom milling) | | | 98,396 | | | | 92,869 | | | | 6 | % | | | 373,709 | | | | 376,739 | | | | -1 | % |
| Ag eq oz produced1 | | | 1,065,773 | | | | 883,772 | | | | 21 | % | | | 3,978,731 | | | | 3,884,960 | | | | 2 | % |
| Silver production – ounces | | | 514,218 | | | | 460,571 | | | | 12 | % | | | 1,982,685 | | | | 2,047,260 | | | | -3 | % |
| Gold production – ounces | | | 5,931 | | | | 5,206 | | | | 14 | % | | | 22,501 | | | | 22,238 | | | | 1 | % |
| Payable silver ounces | | | 516,078 | | | | 488,428 | | | | 6 | % | | | 1,937,702 | | | | 2,010,252 | | | | -4 | % |
| Ag eq oz sold | | | 1,038,023 | | | | 883,348 | | | | 18 | % | | | 3,793,516 | | | | 3,742,733 | | | | 1 | % |
| Cost per tonne milled2 | | $ | 116 | | | $ | 86 | | | | 35 | % | | $ | 106 | | | $ | 88 | | | | 20 | % |
| Cash cost2 | | $ | 7.25 | | | $ | 5.83 | | | | 24 | % | | $ | 5.76 | | | $ | 3.65 | | | | 58 | % |
| Cash cost per Ag eq oz2 | | $ | 13.18 | | | $ | 10.48 | | | | 26 | % | | $ | 12.11 | | | $ | 10.35 | | | | 17 | % |
| AISC2 | | $ | 14.72 | | | $ | 16.44 | | | | -10 | % | | $ | 15.07 | | | $ | 10.99 | | | | 37 | % |
| AISC per Ag eq oz2 | | $ | 16.89 | | | $ | 16.35 | | | | 3 | % | | $ | 16.87 | | | $ | 14.29 | | | | 18 | % |
| (in 000’s, unless otherwise noted) | | Q4 2017 | | Q4 2016 | | Change | | 2017 | | 2016 | | Change |
| FINANCIAL RESULTS | | | | | | | | | | | | | | | | | | | | | | | | |
| Revenue | | $ | 17,384 | | | $ | 12,515 | | | | 39 | % | | $ | 63,746 | | | $ | 61,881 | | | | 3 | % |
| Mine operating earnings before non-cash items2 | | $ | 4,962 | | | $ | 4,476 | | | | 11 | % | | $ | 21,994 | | | $ | 27,728 | | | | -21 | % |
| Mine operating earnings | | $ | 3,755 | | | $ | 2,411 | | | | 56 | % | | $ | 17,689 | | | $ | 22,022 | | | | -20 | % |
| Net income (loss) | | $ | (1,918 | ) | | $ | (1,498 | ) | | | -28 | % | | $ | 1,290 | | | $ | (4,118 | ) | | | 131 | % |
| Adjusted EBITDA2 | | $ | 904 | | | $ | 1,376 | | | | -34 | % | | $ | 6,009 | | | $ | 16,519 | | | | -64 | % |
| Operating cash flows before changes in non-cash net working capital | | $ | 618 | | | $ | 1,119 | | | | -45 | % | | $ | 6,369 | | | $ | 15,975 | | | | -60 | % |
| Cash and short-term deposits at end of period | | $ | 56,888 | | | $ | 56,662 | | | | 0 | % | | $ | 56,888 | | | $ | 56,662 | | | | 0 | % |
| Net working capital at end of period | | $ | 65,965 | | | $ | 66,560 | | | | -1 | % | | $ | 65,965 | | | $ | 66,560 | | | | -1 | % |
| Average realized silver price per oz3 | | $ | 16.86 | | | $ | 14.99 | | | | 12 | % | | $ | 17.11 | | | $ | 17.15 | | | | 0 | % |
| Average realized gold price per oz3 | | $ | 1,292 | | | $ | 1,073 | | | | 20 | % | | $ | 1,291 | | | $ | 1,267 | | | | 2 | % |
| Earnings (loss) per share – basic and diluted | | $ | (0.01 | ) | | $ | (0.01 | ) | | | | | | $ | 0.01 | | | $ | (0.03 | ) | | | | |
| 1 | Silver equivalent ounces are referred to throughout this document. For 2017, Ag eq oz are calculated using a 70:1 Ag:Au ratio and ratios of 1:0.0559 and 1:0.0676 for the price/ounce of silver to lead and zinc price/pound, respectively, and applied to the relevant metal content of the concentrates produced, expected to be produced, or sold from operations. Comparatively, in 2016, Ag eq oz are calculated using a 70:1 Ag:Au ratio and ratios of 1:0.0504 and 1:0.0504 for the price/ounce of silver to lead and zinc price/pound, respectively, and applied to the relevant metal content of the concentrates produced, expected to be produced, or sold from operations. |
| 2 | The Company has included the non-GAAP performance measures cost per tonne milled, cash cost, cash cost per Ag eq oz, AISC, AISC per Ag eq oz, mine operating earnings before non-cash items, cost of sales before non-cash items and adjusted EBITDA throughout this document. Refer to theNon-GAAP Measures section of this MD&A for an explanation of these measures and reconciliation to the Company’s reported financial results in accordance with IFRS. As these are not standardized measures, they may not be directly comparable to similarly titled measures used by others. |
| 3 | Average realized silver and gold prices are prior to smelting and refining charges. |
GREAT PANTHER SILVER LIMITED Management’s Discussion & Analysis | Page 6 |
MINING OPERATIONS
Consolidated operations
| | | 2017 | | 2016 |
| | | FY | | Q4 | | Q3 | | Q2 | | Q1 | | FY | | Q4 | | Q3 | | Q2 | | Q1 |
| Tonnes mined1 | | | 370,017 | | | | 97,407 | | | | 87,974 | | | | 92,578 | | | | 92,058 | | | | 378,121 | | | | 98,867 | | | | 94,310 | | | | 100,219 | | | | 84,725 | |
| Tonnes milled | | | 373,708 | | | | 98,396 | | | | 94,080 | | | | 98,576 | | | | 82,656 | | | | 376,739 | | | | 92,869 | | | | 95,282 | | | | 99,905 | | | | 88,683 | |
| Custom milling (tonnes) | | | – | | | | – | | | | – | | | | – | | | | – | | | | 5,125 | | | | 1,202 | | | | 1,197 | | | | 1,199 | | | | 1,527 | |
| Total tonnes milled | | | 373,708 | | | | 98,396 | | | | 94,080 | | | | 98,576 | | | | 82,656 | | | | 381,864 | | | | 94,071 | | | | 96,479 | | | | 101,104 | | | | 90,210 | |
| Production | | | | | | | | | | | | | | | | | | | | | | | | | | | | | | | | | | | | | | | | |
| Silver (ounces) | | | 1,982,685 | | | | 514,218 | | | | 532,803 | | | | 569,229 | | | | 366,435 | | | | 2,047,260 | | | | 460,571 | | | | 510,491 | | | | 536,726 | | | | 539,472 | |
| Gold (ounces) | | | 22,500 | | | | 5,931 | | | | 5,848 | | | | 5,543 | | | | 5,178 | | | | 22,238 | | | | 5,206 | | | | 5,423 | | | | 6,010 | | | | 5,599 | |
| Lead (tonnes) | | | 1,291 | | | | 441 | | | | 442 | | | | 405 | | | | 3 | | | | 1,033 | | | | 213 | | | | 248 | | | | 290 | | | | 282 | |
| Zinc (tonnes) | | | 1,757 | | | | 551 | | | | 562 | | | | 638 | | | | 6 | | | | 1,496 | | | | 315 | | | | 324 | | | | 433 | | | | 424 | |
| Ag eq oz | | | 3,978,731 | | | | 1,065,773 | | | | 1,080,483 | | | | 1,102,290 | | | | 730,185 | | | | 3,884,960 | | | | 883,772 | | | | 953,632 | | | | 1,037,728 | | | | 1,009,828 | |
| Sales | | | | | | | | | | | | | | | | | | | | | | | | | | | | | | | | | | | | | | | | |
| Payable silver ounces | | | 1,937,702 | | | | 516,078 | | | | 552,218 | | | | 524,411 | | | | 344,995 | | | | 2,010,252 | | | | 488,428 | | | | 442,277 | | | | 601,449 | | | | 478,098 | |
| Ag eq oz sold | | | 3,793,516 | | | | 1,038,023 | | | | 1,082,451 | | | | 992,058 | | | | 680,984 | | | | 3,742,733 | | | | 883,348 | | | | 864,605 | | | | 1,148,467 | | | | 846,313 | |
| Cost metrics | | | | | | | | | | | | | | | | | | | | | | | | | | | | | | | | | | | | | | | | |
| Cost per tonne milled2 | | $ | 106 | | | $ | 116 | | | $ | 116 | | | $ | 103 | | | $ | 88 | | | $ | 88 | | | $ | 86 | | | $ | 86 | | | $ | 86 | | | $ | 95 | |
| Cash cost | | $ | 5.76 | | | $ | 7.25 | | | $ | 5.82 | | | $ | 5.67 | | | $ | 3.54 | | | $ | 3.65 | | | $ | 5.83 | | | $ | 3.30 | | | $ | 1.72 | | | $ | 4.20 | |
| Cash cost per Ag eq oz2 | | $ | 12.11 | | | $ | 13.18 | | | $ | 12.37 | | | $ | 11.47 | | | $ | 10.99 | | | $ | 10.35 | | | $ | 10.48 | | | $ | 10.99 | | | $ | 9.67 | | | $ | 10.49 | |
| AISC2 | | $ | 15.07 | | | $ | 14.72 | | | $ | 13.75 | | | $ | 14.93 | | | $ | 19.55 | | | $ | 10.99 | | | $ | 16.44 | | | $ | 11.97 | | | $ | 7.19 | | | $ | 9.25 | |
| AISC per Ag eq oz2 | | $ | 16.87 | | | $ | 16.89 | | | $ | 16.42 | | | $ | 16.37 | | | $ | 19.10 | | | $ | 14.29 | | | $ | 16.35 | | | $ | 15.43 | | | $ | 12.54 | | | $ | 13.35 | |
| 2 | Refer to theNon-GAAP Measuressection of this MD&A for an explanation of these measures and reconciliation to the Company’s reported financial results in accordance with IFRS. |
GREAT PANTHER SILVER LIMITED Management’s Discussion & Analysis | Page 7 |
Tonnes Milled
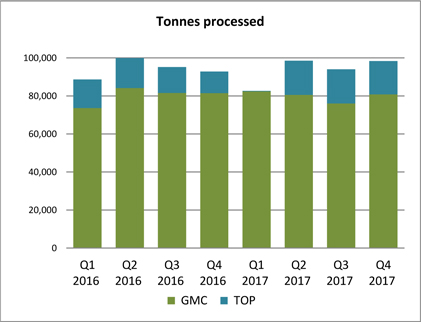
Ore processed for the year ended December 31, 2017 decreased by 1% compared to the prior year. Although milling operations at the Topia Mine were suspended from early December 2016 to early April 2017 to facilitate plant upgrades and the transition to a new tailings handling facility, the Company continued to mine and stockpile ore to mitigate the impact of the suspension of processing.
The Company processed 98,396 tonnes of ore during the fourth quarter of 2017, a 6% increase from 92,869 tonnes compared to the fourth quarter of 2016. The fourth quarter of 2016 reflected the suspension of processing at Topia in December.
Compared to the third quarter of 2017, the throughput during the fourth quarter of 2017 increased by 5% which can be attributed to more ore mined and processed from San Ignacio.
Metal Production
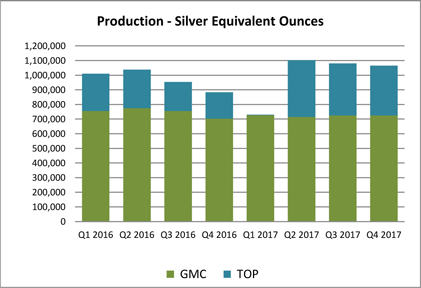
Metal production for the year ended December 31, 2017 increased by 2% compared to the prior year despite a 1% decrease in tonnes milled. This was due to a higher proportion of production from the higher grade Topia Mine.
Metal production increased 21% compared to the fourth quarter of 2016, predominantly due to the 54% increase in mill throughput at the Topia Mine which mainly resulted from the temporary suspension in processing at the Topia plant in December 2016.
Metal production decreased 1% compared to the third quarter of 2017 despite an increase in tonnes milled by 5%, due to lower ore grades at both GMC and Topia.
GREAT PANTHER SILVER LIMITED Management’s Discussion & Analysis | Page 8 |
Cash Cost and AISC
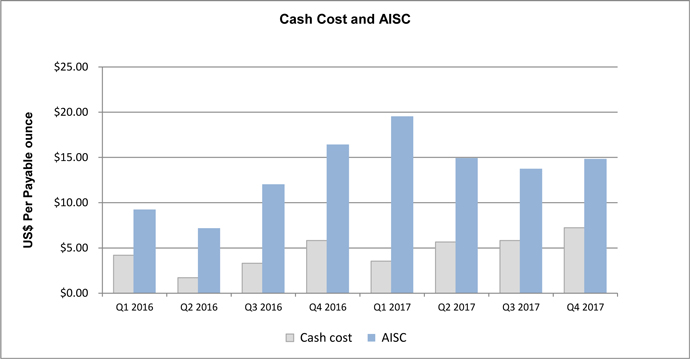
Cash cost for fiscal year 2017 was $5.76 compared to $3.65 in fiscal 2016.
The increase of $2.11 was due to the impact of higher Mexican peso (“MXN”) production costs at both operating mines ($4.79/oz effect) (refer to discussion on increase in production costs in the Results of Operations section). These factors were partly offset by higher by-product credits associated with higher volumes sold and higher realized average prices for gold, lead and zinc ($1.75/oz effect), the strengthening of the USD relative to the MXN which reduced cash operating costs in USD terms as these are predominantly incurred in MXN ($0.63/oz effect) and lower smelting and refining charges ($0.59/oz effect).
Cash cost per Ag eq oz for fiscal 2017 was $12.11 compared to $10.35 in fiscal 2016.
The increase of $1.76 over 2016, was due to the impact of higher MXN production costs, but was partly offset by lower smelting and refining charges, higher silver equivalent ounces sold which had the effect of decreasing fixed production cost on a per-unit basis, and the strengthening of the USD relative to the MXN which reduced cash operating costs in USD terms.
All in sustaining cost for fiscal 2017 was $15.07 compared to $10.99 in fiscal 2016.
The increase of $4.08 compared to the prior year was primarily due to the increase in cash cost described above ($2.11/oz effect). In addition, increased general and administrative (“G&A”) expenses and share-based compensation expenditures and higher exploration, evaluation, and development costs ("EE&D") costs at the operating mines contributed to the increase in AISC ($1.92/oz effect). A significant portion of the higher G&A costs was attributed to a non-recurring charge which accounted for about $0.44 per payable ounce. These factors were partly offset by the decrease in sustaining capital expenditures ($0.20/oz effect).
All in sustaining cost per Ag eq oz for fiscal 2017 was $16.87 compared to $14.29 in fiscal 2016.
The increase of $2.58 over 2016, was mainly attributable to the $1.76 increase in cash cost per Ag eq oz, the increase in G&A expenses, the increase in EE&D costs at the operating mines, and the increase in share-based compensation expense. These factors were partly offset by the decrease in sustaining capital expenditures.
GREAT PANTHER SILVER LIMITED Management’s Discussion & Analysis | Page 9 |
Guanajuato Mine Complex
| | | 2017 | | 2016 |
| | | FY | | Q4 | | Q3 | | Q2 | | Q1 | | FY | | Q4 | | Q3 | | Q2 | | Q1 |
| Tonnes milled | | | 319,963 | | | | 80,896 | | | | 76,076 | | | | 80,535 | | | | 82,456 | | | | 320,903 | | | | 81,518 | | | | 81,602 | | | | 84,134 | | | | 73,649 | |
| Production | | | | | | | | | | | | | | | | | | | | | | | | | | | | | | | | | | | | | | | | |
| Silver (ounces) | | | 1,386,964 | | | | 332,203 | | | | 341,636 | | | | 348,130 | | | | 364,995 | | | | 1,473,229 | | | | 347,415 | | | | 383,598 | | | | 366,943 | | | | 375,273 | |
| Gold (ounces) | | | 21,501 | | | | 5,606 | | | | 5,471 | | | | 5,247 | | | | 5,177 | | | | 21,627 | | | | 5,071 | | | | 5,306 | | | | 5,817 | | | | 5,433 | |
| Silver equivalent ounces | | | 2,892,068 | | | | 724,643 | | | | 724,630 | | | | 715,423 | | | | 727,372 | | | | 2,987,074 | | | | 702,351 | | | | 755,008 | | | | 774,160 | | | | 755,555 | |
| Sales | | | | | | | | | | | | | | | | | | | | | | | | | | | | | | | | | | | | | | | | |
| Payable silver ounces | | | 1,404,696 | | | | 341,069 | | | | 369,663 | | | | 349,836 | | | | 344,128 | | | | 1,477,695 | | | | 359,947 | | | | 335,817 | | | | 450,167 | | | | 331,764 | |
| Ag eq oz sold | | | 2,892,243 | | | | 731,403 | | | | 769,485 | | | | 710,795 | | | | 680,560 | | | | 2,954,567 | | | | 684,864 | | | | 708,366 | | | | 927,800 | | | | 633,537 | |
| Average ore grades | | | | | | | | | | | | | | | | | | | | | | | | | | | | | | | | | | | | | | | | |
| Silver (g/t) | | | 151 | | | | 144 | | | | 155 | | | | 150 | | | | 155 | | | | 163 | | | | 149 | | | | 164 | | | | 159 | | | | 179 | |
| Gold (g/t) | | | 2.41 | | | | 2.48 | | | | 2.54 | | | | 2.32 | | | | 2.30 | | | | 2.43 | | | | 2.25 | | | | 2.36 | | | | 2.52 | | | | 2.58 | |
| Metal recoveries | | | | | | | | | | | | | | | | | | | | | | | | | | | | | | | | | | | | | | | | |
| Silver | | | 89.2 | % | | | 88.5 | % | | | 89.8 | % | | | 89.5 | % | | | 88.8 | % | | | 87.9 | % | | | 88.7 | % | | | 88.9 | % | | | 85.3 | % | | | 88.5 | % |
| Gold | | | 86.9 | % | | | 87.0 | % | | | 88.1 | % | | | 87.2 | % | | | 85.0 | % | | | 86.4 | % | | | 85.9 | % | | | 85.8 | % | | | 85.2 | % | | | 89.0 | % |
Metal production
The tonnes of ore processed for the year ended December 31, 2017 remained consistent with the prior year, and metal production (in Ag eq oz terms) at the GMC for the year ended December 31, 2017 decreased 3%. The decrease reflected the impact of lower silver and gold grades which was partly offset by the higher metal recoveries for both silver and gold.
During the fourth quarter of 2017, the GMC processed 80,896 tonnes, a decrease of 1% compared to the fourth quarter of 2016. Metal production, however, increased 3% reflecting the impact of higher gold grades and recoveries. Increased throughput during the fourth quarter of 2017, compared to the third quarter of 2017, made up for lower head grades and recoveries encountered in the quarter.
Cash cost
| | | 2017 | | 2016 |
| | | FY | | Q4 | | Q3 | | Q2 | | Q1 | | FY | | Q4 | | Q3 | | Q2 | | Q1 |
| Cost per tonne milled1 | | $ | 92 | | | $ | 99 | | | $ | 96 | | | $ | 91 | | | $ | 83 | | | $ | 78 | | | $ | 77 | | | $ | 76 | | | $ | 76 | | | $ | 83 | |
| Cash cost1 | | $ | 4.32 | | | $ | 5.65 | | | $ | 3.75 | | | $ | 5.44 | | | $ | 2.48 | | | $ | 0.85 | | | $ | 4.27 | | | $ | 0.15 | | | $ | (1.19 | ) | | $ | 0.61 | |
| Cash cost per Ag eq oz1 | | $ | 11.58 | | | $ | 12.49 | | | $ | 11.58 | | | $ | 11.78 | | | $ | 10.41 | | | $ | 9.48 | | | $ | 9.51 | | | $ | 10.05 | | | $ | 8.97 | | | $ | 9.56 | |
Cash cost for the GMC for the year ended December 31, 2017 was $4.32, a $3.47 increase over the prior year. The increase is primarily due to the impact of higher MXN production cost and lower silver and gold grades. These factors were partly offset by the effect of lower smelting and refining charges and higher by-product credits associated with higher volumes of gold sold as well as higher realized average gold prices. In addition, the strengthening of the USD relative to the MXN reduced cash operating costs in USD terms as these are predominantly incurred in MXN.
Cash cost for the GMC was $5.65 in the fourth quarter of 2017, compared to $4.27 during the fourth quarter of 2016. The increase was primarily a result of higher MXN production costs (mainly due to higher contractor rates and mining of narrower vein widths), the strengthening of the MXN against the USD which had the effect of increasing production costs in USD terms and the effect of lower payable silver ounces. These factors were partly offset by an increase in gold by-product credits associated with higher volumes of gold sold as well as higher realized average gold prices and lower smelting and refining charges.
| 1 | Refer to theNon-GAAP Measuressection of this MD&A for an explanation of these measures and reconciliation to the Company’s reported financial results in accordance with IFRS. |
GREAT PANTHER SILVER LIMITED Management’s Discussion & Analysis | Page 10 |
Cash cost per Ag eq oz for the GMC for the year ended December 31, 2017 was $11.58, an increase of $2.10 over the year ended December 31, 2016. This was primarily a result of higher MXN production cost, and the effect of lower payable silver ounces. These factors were partly offset by the decrease in smelting and refining charges and the strengthening of the USD against the MXN which had the effect of reducing production costs in USD terms.
Cash cost per Ag eq oz during the fourth quarter of 2017 was $12.49, an increase of $2.98 over the fourth quarter of 2016. The primary factors were the increase in MXN production costs and the strengthening of the MXN compared to the USD. These factors were partly offset by an increase in sales volumes and the decrease in smelting and refining charges.
AISC
| | | 2017 | | 2016 |
| | | FY | | Q4 | | Q3 | | Q2 | | Q1 | | FY | | Q4 | | Q3 | | Q2 | | Q1 |
| AISC | | $ | 9.17 | | | $ | 10.38 | | | $ | 7.90 | | | $ | 10.89 | | | $ | 7.59 | | | $ | 5.20 | | | $ | 10.88 | | | $ | 5.58 | | | $ | 2.22 | | | $ | 2.72 | |
| AISC per Ag eq oz | | $ | 13.94 | | | $ | 14.69 | | | $ | 13.57 | | | $ | 14.46 | | | $ | 13.00 | | | $ | 11.66 | | | $ | 12.98 | | | $ | 12.62 | | | $ | 10.62 | | | $ | 10.66 | |
AISC for the year ended December 31, 2017 increased to $9.17 compared to the year ended December 31, 2016, primarily due to the above-noted increase in cash cost. In addition, there was an increase in sustaining EE&D expenditures mainly due to increased exploration drilling at San Ignacio to increase mineral resources.
AISC for the fourth quarter of 2017 of $10.38 remained consistent when compared to the fourth quarter of 2016. While cash cost per Ag eq oz increased as noted above, it was offset by lower sustaining EE&D expenditures and capital expenditures.
AISC per Ag eq oz for the year ended December 31, 2017 increased to $13.94 compared to the prior year, primarily due to the above-noted increase in cash cost per Ag eq oz and increase in sustaining EE&D expenditures.
AISC per Ag eq oz for the fourth quarter of 2017 increased to $14.69 compared to the fourth quarter of 2016, primarily due to the above-noted increase in cash cost per Ag eq oz, which was partly offset by lower sustaining EE&D expenditures and capital expenditures.
GMC Development
A total of 12,002 metres of development were completed at the GMC during the year ended December 31, 2017, compared to 9,540 metres of development in 2016.
The Company completed 22,207 metres of exploration drilling at the GMC during 2017, compared to 15,685 metres in 2016. Drilling at the Guanajuato Mine totaled 4,322 metres, and was focused on the Cata, Promontorio and Valenciana mines. This compares to 7,200 metres of drilling at the Guanajuato Mine in 2016. At San Ignacio, total drilling amounted to 17,885 metres for the year, compared to 8,458 metres in 2016.
The majority of mine development during the fourth quarter was focused on the San Ignacio Mine. A total of 3,351 metres of development was completed during the fourth quarter of 2017.
The Company’s fourth quarter 2017 drill program at the GMC included 4,538 metres which was focused on San Ignacio, with the objective of improving the resource definition in these areas.
GREAT PANTHER SILVER LIMITED Management’s Discussion & Analysis | Page 11 |
GMC Permitting
In a February 2016 meeting, the Mexican national water authority, CONAGUA, required that the Company make formal applications for permits associated with the occupation and construction of the TSF at the GMC. Following the meeting, the Company filed its applications and CONAGUA carried out an inspection of the TSF and requested further technical information which the Company submitted. In December 2017, the Company also filed with the Mexican environmental permitting authority, SEMARNAT, an amendment to the environmental impact statement reflecting the proposed normal TSF construction activities. This is under review by the regulator, and once approved, will satisfy a requirement by CONAGUA for the processing of its permits. The Company believes its current tailings footprint can be maintained and can support operations at the GMC until at least 2020. The Company also believes, based on its meetings and other communication with CONAGUA, that it will be able to obtain all the above noted permits as required, with no suspension of the GMC operations. While the Company is confident that it will obtain the tailings permits, the Company cannot provide complete assurance that it will complete the review process with CONAGUA without any actions that may suspend its operations. The Company cannot assure that the tailings permits will be obtained or renewed on reasonable terms, or at all. Delays or a failure to obtain such required permits, or the issuance of permits on unfavourable terms or the expiry, revocation or failure by the Company to comply with the terms of any such permits, if obtained, could limit the ability of the Company to expand the tailings facility and could adversely affect the Company’s ability to continue operating at the GMC. In either case, the Company’s results of operations could be adversely affected.
Since the February 2016 meeting with CONAGUA, the Company has also discovered through its own undertakings that additional CONAGUA permits may be needed in connection with water discharge and water use at the GMC TSF and at San Ignacio. The Company is assessing technical options and whether it requires an additional water use permit. The Company believes that it will be able to address or mitigate the need for any necessary water discharge and use permits without any impact to its operations, but the Company cannot provide complete assurance that there is no risk in this regard.
GREAT PANTHER SILVER LIMITED Management’s Discussion & Analysis | Page 12 |
Topia Mine
| | | 2017 | | 2016 |
| | | FY | | Q4 | | Q3 | | Q2 | | Q1 | | FY | | Q4 | | Q3 | | Q2 | | Q1 |
| Tonnes milled | | | 53,745 | | | | 17,500 | | | | 18,004 | | | | 18,041 | | | | 200 | | | | 55,836 | | | | 11,351 | | | | 13,680 | | | | 15,771 | | | | 15,034 | |
| Custom milling tonnes | | | – | | | | – | | | | – | | | | – | | | | – | | | | 5,125 | | | | 1,202 | | | | 1,197 | | | | 1,199 | | | | 1,527 | |
| Total tonnes milled | | | 53,745 | | | | 17,500 | | | | 18,004 | | | | 18,041 | | | | 200 | | | | 60,961 | | | | 12,553 | | | | 14,877 | | | | 16,970 | | | | 16,561 | |
| Production | | | | | | | | | | | | | | | | | | | | | | | | | | | | | | | | | | | | | | | | |
| Silver (ounces) | | | 595,721 | | | | 182,015 | | | | 191,167 | | | | 221,099 | | | | 1,440 | | | | 574,030 | | | | 113,156 | | | | 126,892 | | | | 169,783 | | | | 164,199 | |
| Gold (ounces) | | | 999 | | | | 325 | | | | 377 | | | | 296 | | | | 1 | | | | 612 | | | | 136 | | | | 117 | | | | 192 | | | | 167 | |
| Lead (tonnes) | | | 1,291 | | | | 441 | | | | 442 | | | | 405 | | | | 3 | | | | 1,033 | | | | 213 | | | | 248 | | | | 290 | | | | 282 | |
| Zinc (tonnes) | | | 1,757 | | | | 551 | | | | 562 | | | | 638 | | | | 6 | | | | 1,496 | | | | 315 | | | | 324 | | | | 433 | | | | 424 | |
| Ag eq oz | | | 1,086,663 | | | | 341,129 | | | | 355,853 | | | | 386,867 | | | | 2,814 | | | | 897,886 | | | | 181,421 | | | | 198,624 | | | | 263,568 | | | | 254,273 | |
| Sales | | | | | | | | | | | | | | | | | | | | | | | | | | | | | | | | | | | | | | | | |
| Payable silver ounces | | | 533,006 | | | | 175,009 | | | | 182,555 | | | | 174,575 | | | | 867 | | | | 532,557 | | | | 128,481 | | | | 106,460 | | | | 151,282 | | | | 146,334 | |
| Ag eq oz sold | | | 901,273 | | | | 306,620 | | | | 312,966 | | | | 281,263 | | | | 424 | | | | 788,166 | | | | 198,484 | | | | 156,239 | | | | 220,667 | | | | 212,776 | |
| Average feed grade | | | | | | | | | | | | | | | | | | | | | | | | | | | | | | | | | | | | | | | | |
| Silver (g/t) | | | 376 | | | | 352 | | | | 362 | | | | 414 | | | | 255 | | | | 354 | | | | 349 | | | | 322 | | | | 367 | | | | 373 | |
| Gold (g/t) | | | 0.89 | | | | 0.95 | | | | 0.97 | | | | 0.74 | | | | 0.28 | | | | 0.56 | | | | 0.63 | | | | 0.49 | | | | 0.59 | | | | 0.55 | |
| Lead (%) | | | 2.58 | | | | 2.68 | | | | 2.63 | | | | 2.45 | | | | 1.60 | | | | 1.96 | | | | 2.03 | | | | 1.92 | | | | 1.93 | | | | 1.97 | |
| Zinc (%) | | | 3.47 | | | | 3.35 | | | | 3.33 | | | | 3.73 | | | | 3.40 | | | | 2.82 | | | | 2.97 | | | | 2.46 | | | | 2.87 | | | | 2.96 | |
| Metal recoveries | | | | | | | | | | | | | | | | | | | | | | | | | | | | | | | | | | | | | | | | |
| Silver | | | 91.7 | % | | | 91.8 | % | | | 91.1 | % | | | 92.0 | % | | | 87.6 | % | | | 90.4 | % | | | 88.8 | % | | | 89.7 | % | | | 91.3 | % | | | 91.0 | % |
| Gold | | | 65.3 | % | | | 60.8 | % | | | 67.1 | % | | | 68.6 | % | | | 65.7 | % | | | 60.6 | % | | | 59.4 | % | | | 54.3 | % | | | 64.0 | % | | | 62.9 | % |
| Lead | | | 93.1 | % | | | 94.1 | % | | | 93.5 | % | | | 91.8 | % | | | 88.7 | % | | | 94.4 | % | | | 92.5 | % | | | 94.6 | % | | | 95.2 | % | | | 95.0 | % |
| Zinc | | | 94.2 | % | | | 93.8 | % | | | 93.8 | % | | | 94.9 | % | | | 92.7 | % | | | 95.1 | % | | | 93.4 | % | | | 96.0 | % | | | 95.7 | % | | | 95.1 | % |
Metal Production
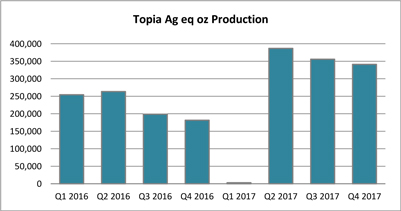
Mill throughput for Topia (excluding tonnes milled for third parties) for the year ended December 31, 2017 decreased 4% compared to the prior year. This was mainly due to the suspension of milling operations for the first quarter of 2017 to complete plant upgrades and a new tailings handling facility (the “Topia Project”).
Mill throughput for Topia (excluding tonnes milled for third parties) in the fourth quarter of 2017 increased by 54% compared to the fourth quarter of 2016 reflecting the temporary suspension of milling operations noted above which commenced in early December 2016.
Metal production at Topia for the year ended December 31, 2017 increased 21% compared to 2016 despite the decrease in tonnes milled. The increase was primarily attributable to the improvement in average ore grades of feed material and in silver and gold recoveries. These factors were partly offset by the lower lead and zinc recoveries.
GREAT PANTHER SILVER LIMITED Management’s Discussion & Analysis | Page 13 |
Metal production in the fourth quarter of 2017 increased 88% compared to the fourth quarter of 2016. The increase was primarily attributed to the higher mill throughput (reflecting the impact of the Topia Project on fourth quarter 2016 processing) and improvement in average ore grades of feed material and metal recoveries.
Cash cost and AISC
| | | 2017 | | 2016 |
| | | FY | | Q4 | | Q3 | | Q2 | | Q11 | | FY | | Q4 | | Q3 | | Q2 | | Q1 |
| Cost per tonne milled2 | | $ | 190 | | | $ | 194 | | | $ | 199 | | | $ | 157 | | | | nm | | | $ | 143 | | | $ | 146 | | | $ | 144 | | | $ | 136 | | | $ | 148 | |
| Cash cost2 | | $ | 9.53 | | | $ | 10.35 | | | $ | 10.01 | | | $ | 6.15 | | | | nm | | | $ | 11.43 | | | $ | 10.19 | | | $ | 13.25 | | | $ | 10.35 | | | $ | 12.32 | |
| Cash cost per Ag eq oz2 | | $ | 13.79 | | | $ | 14.82 | | | $ | 14.31 | | | $ | 10.70 | | | | nm | | | $ | 13.62 | | | $ | 13.83 | | | $ | 15.27 | | | $ | 12.59 | | | $ | 13.27 | |
| AISC2 | | $ | 14.98 | | | $ | 11.70 | | | $ | 10.71 | | | $ | 10.78 | | | | nm | | | $ | 15.31 | | | $ | 18.56 | | | $ | 19.52 | | | $ | 11.49 | | | $ | 13.34 | |
| AISC per Ag eq oz2 | | $ | 17.01 | | | $ | 15.59 | | | $ | 14.72 | | | $ | 13.58 | | | | nm | | | $ | 16.24 | | | $ | 19.25 | | | $ | 19.54 | | | $ | 13.38 | | | $ | 13.97 | |
Cash cost for 2017 was $9.53 compared to $11.43 in 2016.
The decrease was primarily the result of higher by-product credits, due to higher volumes of gold, lead and zinc produced and sold as well as due to higher realized metal prices for these by-products. Lower smelting and refining charges and the strengthening of the USD against the MXN also contributed to the decrease. These factors were partly offset by the higher MXN production costs due to an increase in mining contractor unit costs, higher operations and maintenance costs for the tailings handling facility and higher mine overhead costs.
Cash cost per Ag eq oz for 2017 was $13.79 compared to $13.62 in 2016.
The increase was primarily due to the higher MXN production costs but mostly offset by higher Ag eq oz sales volume.
AISC for 2017 was $14.98 compared to $15.31 in 2016.
The decrease was primarily due to the higher by-product credits, lower smelting and refining charges and the strengthening of the USD against the MXN. These factors were partly offset by the higher MXN production costs, higher sustaining EE&D expenses and higher capital expenditures.
AISC per Ag eq oz for 2017 was $17.01 compared to $16.24 in 2016.
The increase was primarily due to higher sustaining EE&D expenses and capital expenditures. These factors were partly offset by the higher Ag eq oz sales volume.
Cash cost for the fourth quarter of 2017 was $10.35 compared to $10.19 for the fourth quarter of 2016.
The increase was primarily the result of higher production costs in MXN terms (due to an increase in mining contractor unit costs, higher operations and maintenance costs for the tailings handling facility and higher mine overhead costs), the strengthening of the MXN against the USD and higher smelting and refining charges. These factors were partly offset by greater by-product credits due to higher volumes of gold, lead and zinc produced and sold as well as due to higher realized metal prices for these by-products. Increased sales volumes also contributed to the decrease in the cash cost per silver payable ounce.
Cash cost per Ag eq oz for the fourth quarter of 2017 was $14.82 compared to $13.83 for the fourth quarter of 2016.
The increase was primarily due to an increase in production costs, the strengthening of the MXN compared to the USD and higher smelting and refining charges. These factors were partly offset by an increase in Ag eq sales volumes.
| 1 | Milling operations at Topia were suspended for the duration of the first quarter of 2017. Tonnes milled and metal produced were incidental and related to the testing of plant upgrades. As a result, the Company considers its usual non-GAAP disclosures for the Topia Mine, such as cost per tonne milled, cash cost, cash cost per Ag eq oz, AISC and ASIC per Ag eq oz, to be not meaningful (“nm”). |
| 2 | Refer to theNon-GAAP Measuressection of this MD&A for an explanation of these measures and reconciliation to the Company’s reported financial results in accordance with IFRS. |
GREAT PANTHER SILVER LIMITED Management’s Discussion & Analysis | Page 14 |
AISC for the fourth quarter of 2017 was $11.70 compared to $18.56 for the fourth quarter of 2016.
The decrease was primarily due to the higher by-product credits and lower sustaining capital expenditures. The sustaining capital expenditures in the fourth quarter of 2016 related to work associated with the new tailings filtration plant and certain plant upgrades. Increased sales volumes also contributed to the decrease in AISC per silver payable ounce. These factors were partly offset by the higher production costs in MXN terms, the strengthening of the MXN against the USD, and higher smelting and refining charges.
AISC per Ag eq oz for the fourth quarter of 2017 was $15.59 compared to $19.25 for the fourth quarter of 2016.
The decrease was primarily due to the lower sustaining capital expenditures, partly offset by the higher cash cost per Ag eq oz.
Topia Development
For the year ended December 31, 2017, underground development totaled 5,167 metres, compared to 7,118 metres in 2016. The majority of the development was carried out at the Argentina, 15-22, San Miguel and Recompensa mines.
Underground development for the fourth quarter of 2017 was 1,552 metres, compared to 1,833 metres in the 2016 comparative period, and focused on the same mines as noted above.
The Company completed 2,485 metres of surface exploration drilling during 2017 compared to nil in 2016.
TSF Permitting Status
On December 18, 2017, the Company announced that SEMARNAT, the Mexican environmental authority, had granted all permits for the construction and operation of the new Phase II TSF. Construction of the Phase II TSF is currently underway and the Company will continue to utilize the Phase I TSF until completion of the Phase II TSF.
Reviews by the regulatory authorities dating back to 2015, coupled with permitting work undertaken by the Company in connection with the expansion of the Topia TSF, have led to a broader review by PROFEPA (the Mexican environmental compliance authority) and the Company of all the Topia operations’ permitting status and environmental compliance, including the historical tailings dating back to the period prior to Great Panther’s ownership, and clarification of land titles. Devised as a cooperative management strategy, the Topia Mine has been accepted into a voluntary environmental audit program supported by PROFEPA. The audit commenced during the second quarter of 2017 and work on any mitigation measures that may arise from the audit will extend beyond 2017. The Company anticipates that it will be able to address any potential gaps in existing compliance through a mitigation plan; however, the Company cannot provide complete assurance that these reviews will not lead to a future suspension of operations. If the environmental or technical reviews identify any non-compliance of the existing facility, there is no assurance that Mexican regulatory authorities will agree to any mitigation plan proposed by the Company.
GREAT PANTHER SILVER LIMITED Management’s Discussion & Analysis | Page 15 |
SELECTED ANNUAL INFORMATION
The following table sets out selected annual financial results which have been prepared in accordance with IFRS, except as noted:
| (in 000’s, unless otherwise noted) | | 2017 | | 2016 | | 2015 |
| Revenue | | $ | 63,746 | | | $ | 61,881 | | | $ | 56,218 | |
| Average realized silver price ($/oz) | | | 17.11 | | | | 17.15 | | | | 15.11 | |
| Average realized gold price ($/oz) | | | 1,291 | | | | 1,267 | | | | 1,110 | |
| Production costs | | | 41,752 | | | | 34,153 | | | | 37,802 | |
| Mine operating earnings | | | 17,689 | | | | 22,022 | | | | 4,366 | |
| Net income (loss) | | | 1,290 | | | | (4,118 | ) | | | (7,157 | ) |
| Basic and diluted loss per share | | | 0.01 | | | | (0.03 | ) | | | (0.05 | ) |
| Adjusted EBITDA | | | 6,009 | | | | 16,519 | | | | 7,138 | |
| | | | December 31, 2017 | | | December 31, 2016 | | | December 31, 2015 |
| Cash and short-term deposits | | | 56,888 | | | | 56,662 | | | | 13,685 | |
| Total assets | | | 121,880 | | | | 89,441 | | | | 51,553 | |
| Total non-current liabilities | | | 24,895 | | | | 5,600 | | | | 6,713 | |
| Working capital | | | 65,965 | | | | 66,560 | | | | 25,477 | |
Total assets at December 31, 2017 increased $32.4 million from those at December 31, 2016 due mainly to the acquisition of Coricancha which had the effect of increasing the Company’s assets by $26.5 million (mainly comprised of exploration and evaluation assets of $13.5 million, reimbursement rights of $11.0 million and inventories of $1.6 million).
Non-current liabilities totalled $24.9 million at December 31, 2017, compared to $5.6 million at December 31, 2016. The increase is due to the $23.7 million reclamation and remediation provision related to Coricancha which was acquired during 2017.
Please refer to the Results of Operations section for a discussion of the changes relating to earnings.
GREAT PANTHER SILVER LIMITED Management’s Discussion & Analysis | Page 16 |
SUMMARY OF SELECTED QUARTERLY INFORMATION
| (000’s, except per-share amounts) | | Q4 2017 | | Q3 2017 | | Q2 2017 | | Q1 2017 | | Q4 2016 | | Q3 2016 | | Q2 2016 | | Q1 2016 |
| Revenue | | $ | 17,384 | | | $ | 18,260 | | | $ | 15,731 | | | $ | 12,371 | | | $ | 12,515 | | | $ | 15,631 | | | $ | 19,596 | | | $ | 14,139 | |
| Production costs | | | 12,422 | | | | 12,092 | | | | 10,313 | | | | 6,926 | | | | 8,039 | | | | 8,400 | | | | 9,509 | | | | 8,204 | |
| Mine operating earnings before non-cash items1 | | | 4,962 | | | | 6,168 | | | | 5,418 | | | | 5,445 | | | | 4,476 | | | | 7,231 | | | | 10,087 | | | | 5,935 | |
| Amortization and share-based compensation | | | 1,207 | | | | 1,362 | | | | 953 | | | | 783 | | | | 2,065 | | | | 1,159 | | | | 1,256 | | | | 1,225 | |
| Mine operating earnings | | | 3,755 | | | | 4,806 | | | | 4,465 | | | | 4,662 | | | | 2,411 | | | | 6,072 | | | | 8,831 | | | | 4,710 | |
| Net income (loss) for the period | | | (1,918 | ) | | | (666 | ) | | | 833 | | | | 3,040 | | | | (1,498 | ) | | | 2,130 | | | | (1,332 | ) | | | (3,418 | ) |
| Basic and diluted earnings (loss) per share | | | (0.01 | ) | | | (0.00 | ) | | | 0.00 | | | | 0.02 | | | | (0.01 | ) | | | 0.01 | | | | (0.01 | ) | | | (0.02 | ) |
| Adjusted EBITDA1 | | | 904 | | | | 1,482 | | | | 1,489 | | | | 2,134 | | | | 1,376 | | | | 4,738 | | | | 7,545 | | | | 2,860 | |
The following paragraphs describe the trends in results over the quarters presented and the factors that have contributed to these trends.
Trends in revenue over the last eight quarters
Revenue varies based on the quantity of metal sold, metal prices, terms of sales agreements and, for periods prior to the third quarter of 2016, foreign exchange rates. The climate in Mexico allows mining and exploration activities to be conducted throughout the year, and there are no notable variations due to seasonality.
Revenue increased from the first quarter of 2016 to the second quarter of 2016, generally due to rising metal prices. Metal prices, and silver in particular, declined through to the fourth quarter of 2016 which primarily accounted for the decline in revenue quarter over quarter. During 2017, silver prices averaged about $17 per ounce, ranging from $15.00 per ounce to $18.50 per ounce during the year.
Milling operations at Topia were suspended from December 2016 until April 2017 to allow for upgrades to the processing facility. This resulted in the large decrease in revenue in the first quarter of 2017. Revenues subsequently increased starting in the second quarter of 2017 as operations at the Topia Mine resumed.
Trends in net income over the last eight quarters
The variance in production costs is due primarily to the costs of mining operations. Mining costs increased as a result of mining narrower veins, which caused more waste material to be mined, and added to bolting, anchoring, and hauling costs. Further, there were rate increases in 2017 for mining contractors. Plant costs at Topia increased slightly due to the operation of the dry tails filter press at Topia. On-site administrative costs were fairly steady, with additional costs being incurred for security and safety.
The relationship between the MXN (in which the bulk of the Company’s production costs and EE&D expenses are incurred) and the USD (in which the Company’s results are reported) has a significant impact on production costs, which in turn affect cost of sales, mine operating earnings and net income (loss). Furthermore, the majority of the Company’s administrative expenses are denominated in Canadian dollars ("CAD"). The Company enters into foreign currency forward contracts from time to time in order to manage its exposure to fluctuations in these exchange rates and, consequently, foreign currency gains or losses may arise when marking these forward contracts to market at each reporting date. During the first quarter of 2017, the Company recorded approximately $1.8 million in foreign exchange gains related primarily to the foreign currency contracts. During the first two quarters of 2016, the Company had incurred foreign exchange losses of approximately $4.7 million per quarter.
| 1 | The Company has included the non-GAAP performance measures, cost of sales before non-cash items, mine operating earnings before non-cash items, and Adjusted EBITDA throughout this document. Refer to theNon-GAAP Measures section of this MD&A for an explanation of these measures and reconciliation to the Company’s reported financial results in accordance with IFRS. As these are not standardized measures, they may not be directly comparable to similarly titled measures used by others. |
GREAT PANTHER SILVER LIMITED Management’s Discussion & Analysis | Page 17 |
Foreign exchange gains and losses also arise from the translation of foreign currency denominated transactions and balances into the functional currencies of the Company and its subsidiaries. The Company funds its Mexican subsidiaries through USD and CAD loans, and a significant portion of the Company’s working capital is denominated in USD.
EE&D expenses also vary significantly from quarter to quarter as a function of the Company’s planned mine development and exploration activities. Exploration and evaluation expenditures have increased subsequent to the acquisition of Coricancha. In the third and fourth quarters of 2017, the Company incurred approximately $2.6 million per quarter on EE&D; it had averaged approximately $1.7 million per quarter in EE&D expenses in the previous six quarters.
General and administrative costs are fairly steady from quarter to quarter; although there were non-recurring G&A costs relating to changes in senior management in the third quarter of 2017.
A significant contributor to the loss in the second quarter of 2016 was an impairment charge of $1.7 million related to Coricancha (the purchase of which was subsequently renegotiated and then completed on June 30, 2017).
GREAT PANTHER SILVER LIMITED Management’s Discussion & Analysis | Page 18 |
RESULTS OF OPERATIONS
Year ended December 31, 2017
Revenue
| | | FY 2017 | | FY 2016 | | Change |
| | | GMC | | Topia | | Total | | GMC | | Topia | | Total | | |
| Sales quantities | | | | | | | | | | | | | | | | | | | | | | | | | | | | |
| Silver (ounces) | | | 1,404,696 | | | | 533,006 | | | | 1,937,702 | | | | 1,477,696 | | | | 532,556 | | | | 2,010,252 | | | | -4 | % |
| Gold (ounces) | | | 21,251 | | | | 587 | | | | 21,838 | | | | 21,093 | | | | 424 | | | | 21,517 | | | | 1 | % |
| Lead (tonnes) | | | – | | | | 1,135 | | | | 1,135 | | | | – | | | | 942 | | | | 942 | | | | 20 | % |
| Zinc (tonnes) | | | – | | | | 1,257 | | | | 1,257 | | | | – | | | | 1,023 | | | | 1,023 | | | | 23 | % |
| Silver equivalent ounces | | | 2,892,243 | | | | 901,273 | | | | 3,793,516 | | | | 2,954,567 | | | | 788,166 | | | | 3,742,733 | | | | 1 | % |
| Revenue (000’s) | | | | | | | | | | | | | | | | | | | | | | | | | | | | |
| Silver revenue | | $ | 24,129 | | | $ | 9,016 | | | $ | 33,145 | | | $ | 25,287 | | | $ | 9,188 | | | $ | 34,475 | | | | -4 | % |
| Gold revenue | | | 27,432 | | | | 755 | | | | 28,187 | | | | 26,749 | | | | 521 | | | | 27,270 | | | | 3 | % |
| Lead revenue | | | – | | | | 2,741 | | | | 2,741 | | | | | | | | 1,808 | | | | 1,808 | | | | 52 | % |
| Zinc revenue | | | – | | | | 3,853 | | | | 3,853 | | | | | | | | 2,318 | | | | 2,318 | | | | 66 | % |
| Ore processing revenue and other | | | – | | | | – | | | | – | | | | | | | | 410 | | | | 410 | | | | -100 | % |
| Smelting and refining charges | | | (2,195 | ) | | | (1,985 | ) | | | (4,180 | ) | | | (2,955 | ) | | | (2,323 | ) | | | (5,278 | ) | | | -21 | % |
| Impact of change in functional currency1 | | | – | | | | – | | | | – | | | | 750 | | | | 128 | | | | 878 | | | | -100 | % |
| Total revenue | | $ | 49,366 | | | $ | 14,380 | | | $ | 63,746 | | | $ | 49,831 | | | $ | 12,050 | | | $ | 61,881 | | | | 3 | % |
| Average realized metal prices and foreign exchange rates | | | | | | | | | | | | | | | | | | | | | | | | | | | | |
| Silver (per ounce) | | | | | | | | | | $ | 17.11 | | | | | | | | | | | $ | 17.15 | | | | 0 | % |
| Gold (per ounce) | | | | | | | | | | $ | 1,291 | | | | | | | | | | | $ | 1,267 | | | | 2 | % |
| Lead (per pound) | | | | | | | | | | $ | 1.10 | | | | | | | | | | | $ | 0.87 | | | | 26 | % |
| Zinc (per pound) | | | | | | | | | | $ | 1.39 | | | | | | | | | | | $ | 1.03 | | | | 35 | % |
| CAD/USD | | | | | | | | | | | 1.29 | | | | | | | | | | | | 1.32 | | | | -2 | % |
| MXN/USD | | | | | | | | | | | 18.93 | | | | | | | | | | | | 18.63 | | | | 2 | % |
During the year ended December 31, 2017, the Company earned revenues of $63.7 million, compared to $61.9 million in 2016. The increase in revenue relative to the prior year was primarily attributable to increases in the average realized metal prices of gold, lead and zinc. This accounted for a $2.0 million improvement in revenues while the effect of lower smelting and refining charges, which are netted against revenue, had an estimated positive impact of $1.1 million. These factors were partly offset by the impact of third party ore processing revenue which declined by about $0.4 million. In addition, revenue during the prior year included a $0.9 million favourable effect of foreign exchange rates which did not recur in 2017 following the change in functional currency to US dollars on July 1, 2016.
| 1 | The change in functional currency was accounted for on a prospective basis, with prior period comparative information translated to the USD at the foreign exchange rates on July 1, 2016. The July 1, 2016 exchange rates differ from the historical exchange rates used to calculate the previously-disclosed cost per tonne milled, cash cost and AISC metrics, requiring an adjustment in the reconciliation for the prior-period comparatives. |
GREAT PANTHER SILVER LIMITED Management’s Discussion & Analysis | Page 19 |
Production Costs
Production costs for the year ended December 31, 2017 were $41.8 million, an increase of 22% over the same period in 2016. This was predominantly attributable to higher mining costs at both of the Company’s operating mines ($7.3 million effect), primarily driven by mining narrower veins at the GMC and increased contractor rates, as well as increased processing costs at Topia associated with the change to the processing of dry tailings. The increase in metal sales volumes ($0.5 million effect) and certain non-recurring charges related to land use payments at Topia ($0.3 million effect) also contributed to the increase in production costs. These factors were partly offset by the strengthening of the USD relative to the MXN which reduced production costs in USD terms as these are predominantly incurred in MXN ($0.5 million effect).
Mine Operating Earnings
| (000’s) | | FY 2017 | | FY 2016 | | Change | | Change% |
| Revenue | | $ | 63,746 | | | $ | 61,881 | | | $ | 1,865 | | | | 3 | % |
| Production costs | | | 41,752 | | | | 34,153 | | | | 7,599 | | | | 22 | % |
| Mine operating earnings before non-cash items1 | | $ | 21,994 | | | $ | 27,728 | | | $ | (5,734 | ) | | | –21 | % |
| Amortization and depletion | | | 3,878 | | | | 5,436 | | | | (1,558 | ) | | | –29 | % |
| Share-based compensation | | | 427 | | | | 270 | | | | 157 | | | | 58 | % |
| Mine operating earnings | | $ | 17,689 | | | $ | 22,022 | | | $ | (4,333 | ) | | | –20 | % |
| Mine operating earnings before non-cash items (% of revenue) | | | 35% | | | | 45% | | | | | | | | | |
| Mine operating earnings (% of revenue) | | | 28% | | | | 36% | | | | | | | | | |
Mine operating earnings before non-cash items for 2017 decreased by $5.7 million as a result of the $7.6 million increase in production costs which was partly offset by the above-noted increase in revenue of $1.9 million.
Amortization and depletion were lower for 2017 compared to 2016, as the Phase I TSF at Topia was fully depreciated at December 31, 2016. This factor was partly offset by the impact of the Company starting the amortization of the tailings filtration plant at Topia which was commissioned in the second quarter of 2017.
General and administrative expenses
G&A expenses for the year ended December 31, 2017 were $7.8 million compared to $5.8 million in 2016. Approximately, $1.1 million of the increase was associated with the transition to a new President and CEO in August 2017. These costs were comprised of primarily non-recurring charges such as a retirement salary and benefits package during a transition period, executive search fees, and relocation costs. Share-based compensation expense in G&A also increased by $0.2 million, in part, reflecting the management transition. Other increases in G&A were attributed to other recruitment costs and increases in salary and benefit expense, increases in audit fees and consulting fees, travel expenses, board fees and regulatory fees.
Exploration, evaluation, and development expenses
EE&D expenses for the year ended December 31, 2017 were $9.5 million compared to $6.1 million in 2016. Approximately $1.4 million of the increase was attributed to an increase in exploration drilling at the Guanajuato, San Ignacio and Topia mines. In addition, EE&D expenses included all Coricancha project and other costs as the Company has not made a decision to restart production and therefore is not capitalizing costs related to evaluation, development or exploration. These expenditures totaled $2.8 million for the year including $2.3 million since closing the acquisition on June 30, 2017. The Company also incurred $0.7 million more in corporate development expenditures as it continues to seek other acquisitions in the Americas.
| 1 | The Company has included non-GAAP performance measures such as mine operating earnings before non-cash items, throughout this document. Refer to theNon-GAAP Measures section of this MD&A for an explanation of these measures and reconciliation to the Company’s reported financial results in accordance with IFRS. As these are not standardized measures, they may not be directly comparable to similarly titled measures used by others. |
GREAT PANTHER SILVER LIMITED Management’s Discussion & Analysis | Page 20 |
Impairment
The Company did not incur any impairment charges in 2017. A $1.7 million impairment charge was recognized during the year ended December 31, 2016 related to the termination of the then-active Coricancha option agreement.
Finance and other income
Finance and other income for the year ended December 31, 2017 amounted to $2.4 million, compared to finance and other expense of $11.0 million for the year ended December 31, 2016.
The change was primarily attributable to foreign exchange gains and losses, as the Company recorded foreign exchange gains of $2.3 million for the year ended December 31, 2017, compared to a $11.1 million foreign exchange losses in prior year, an increase of $13.4 million. The 2016 loss was related predominantly to unrealized losses on the revaluation of foreign-denominated assets and liabilities, including certain intercompany loan balances, in the first half of 2016 prior to the change to USD functional currency. The 2017 gains were related primarily to the realized foreign exchange gain of $2.1 million resulting from forward contracts to purchase Mexican pesos to fund operating expenditures in Mexico.
Finance and other income also increased as a result of a $0.6 million increase in interest income as a result of higher interest rates and higher cash balances, and a $0.2 million increase in proceeds from disposal of plant and equipment. These factors were partly offset by an increase of $0.8 million in accretion of reclamation provisions, primarily attributable to Coricancha.
Tax expense
For the year ended December 31, 2017, income tax expense remained unchanged at $1.5 million, compared to 2016.
Income tax expense for the year ended December 31, 2017 was predominantly attributable to an accrual for special mining duty payable in Mexico, which is charged at 7.5% of an adjusted taxable net income, as well as an accrual for Mexican withholding taxes.
Net income (loss)
Net income for 2017 amounted to $1.3 million, compared to a net loss of $4.1 million in 2016.
The improvement in net income was primarily due to the $13.4 million increase in finance and other income. The Company changed its functional currency from Canadian dollars to US dollars in 2016, and upon the change on July 1, 2016, significant foreign exchange differences associated with large intercompany balances were recorded. This represented the main component of the foreign exchange losses during 2016.
In addition, the net loss for the year ended December 31, 2016 reflected a $1.7 million impairment charge taken in connection with the termination of an option to purchase Coricancha (the purchase of which was subsequently renegotiated and completed on June 30, 2017). These factors were partly offset by the $4.3 million decrease in mine operating earnings, a $3.4 million increase in EE&D expenditures and a $2.0 million increase in G&A expenses, of which approximately $1.1 million represents non-recurring expenditures as discussed above.
Adjusted EBITDA
For the year ended December 31, 2017, adjusted EBITDA was $6.0 million, compared to $16.5 million in 2016.
The decrease in adjusted EBITDA was due to a $5.7 million decrease in mine operating earnings before non-cash items, a $3.2 million increase in EE&D expenses (net of changes in non-cash share based compensation and changes in estimate of reclamation provisions), and a $1.9 million increase in G&A expenses before non-cash items. These factors were partly offset by a $0.3 million increase in other income.
GREAT PANTHER SILVER LIMITED Management’s Discussion & Analysis | Page 21 |
Three months ended December 31, 2017
Revenue
| | | Q4 2017 | | Q4 2016 | | Change |
| | | GMC | | Topia | | Total | | GMC | | Topia | | Total | | |
| Sales quantities | | | | | | | | | | | | | | | | | | | | | | | | | | | | |
| Silver (ounces) | | | 341,069 | | | | 175,009 | | | | 516,078 | | | | 359,947 | | | | 128,481 | | | | 488,428 | | | | 6 | % |
| Gold (ounces) | | | 5,576 | | | | 207 | | | | 5,783 | | | | 4,642 | | | | 110 | | | | 4,752 | | | | 22 | % |
| Lead (tonnes) | | | – | | | | 421 | | | | 421 | | | | - | | | | 247 | | | | 247 | | | | 70 | % |
| Zinc (tonnes) | | | – | | | | 438 | | | | 438 | | | | - | | | | 274 | | | | 274 | | | | 60 | % |
| Silver equivalent ounces | | | 731,403 | | | | 306,620 | | | | 1,038,023 | | | | 684,864 | | | | 198,484 | | | | 883,348 | | | | 18 | % |
| Revenue (000’s) | | | | | | | | | | | | | | | | | | | | | | | | | | | | |
| Silver revenue | | $ | 5,709 | | | $ | 2,992 | | | $ | 8,701 | | | $ | 5,277 | | | $ | 2,046 | | | $ | 7,323 | | | | 19 | % |
| Gold revenue | | | 7,205 | | | | 269 | | | | 7,474 | | | | 4,973 | | | | 127 | | | | 5,100 | | | | 47 | % |
| Lead revenue | | | – | | | | 1,035 | | | | 1,035 | | | | - | | | | 540 | | | | 540 | | | | 92 | % |
| Zinc revenue | | | – | | | | 1,429 | | | | 1,429 | | | | - | | | | 769 | | | | 769 | | | | 86 | % |
| Ore processing revenue and other | | | – | | | | – | | | | – | | | | - | | | | 91 | | | | 91 | | | | -100 | % |
| Smelting and refining charges | | | (532 | ) | | | (723 | ) | | | (1,255 | ) | | | (704 | ) | | | (604 | ) | | | (1,308 | ) | | | -4 | % |
| Total revenue | | $ | 12,382 | | | $ | 5,002 | | | $ | 17,384 | | | $ | 9,546 | | | $ | 2,969 | | | $ | 12,515 | | | | 39 | % |
| Average realized metal prices and FX rates | | | | | | | | | | | | | | | | | | | | | | | | | | | | |
| Silver (per ounce) | | | | | | | | | | $ | 16.86 | | | | | | | | | | | $ | 14.99 | | | | 12 | % |
| Gold (per ounce) | | | | | | | | | | | 1,292 | | | | | | | | | | | | 1,073 | | | | 20 | % |
| Lead (per pound) | | | | | | | | | | | 1.11 | | | | | | | | | | | | 0.99 | | | | 12 | % |
| Zinc (per pound) | | | | | | | | | | | 1.48 | | | | | | | | | | | | 1.27 | | | | 17 | % |
| USD/CAD | | | | | | | | | | | 1.251 | | | | | | | | | | | | 1.345 | | | | 7 | % |
| USD/MXN | | | | | | | | | | | 18.95 | | | | | | | | | | | | 20.01 | | | | 4 | % |
Revenues were $17.4 million in the fourth quarter of 2017, compared to $18.3 million in the third quarter of 2017 and $12.5 million in the fourth quarter of 2016. The decrease from the previous quarter was primarily due to lower sales volumes ($0.8 million effect) and lower metal prices ($0.1 million effect).
Compared to the fourth quarter of 2016, revenue increased due to an increase in precious metal prices ($2.5 million effect) and higher metal sales volume ($2.4 million effect), as detailed in the table above.
GREAT PANTHER SILVER LIMITED Management’s Discussion & Analysis | Page 22 |
| (000’s) | | Q4 2017 | | Q4 2016 | | Change | | Q3 2017 | | Change |
| Revenue | | $ | 17,384 | | | $ | 12,515 | | | $ | 4,869 | | | | 39 | % | | $ | 18,260 | | | $ | (876 | ) | | | –5 | % |
| Production costs | | | 12,422 | | | $ | 8,039 | | | | 4,383 | | | | 55 | % | | | 12,092 | | | | 330 | | | | 3 | % |
| Mine operating earnings before non-cash items1 | | $ | 4,962 | | | $ | 4,476 | | | $ | 486 | | | | 11 | % | | $ | 6,168 | | | $ | (1,206 | ) | | | –20 | % |
| Amortization and depletion | | | 1,096 | | | $ | 1,987 | | | | (891 | ) | | | –45 | % | | | 1,244 | | | | (148 | ) | | | –12 | % |
| Share-based compensation | | | 111 | | | $ | 78 | | | | 33 | | | | 42 | % | | | 118 | | | | (7 | ) | | | –6 | % |
| Mine operating earnings | | | 3,755 | | | $ | 2,411 | | | | 1,344 | | | | 56 | % | | | 4,806 | | | | (1,051 | ) | | | –22 | % |
| Mine operating earnings before non-cash items (% of revenue) | | | 29 | % | | | 36 | % | | | | | | | | | | | 34 | % | | | | | | | | |
| Mine operating earnings (% of revenue) | | | 22 | % | | | 19 | % | | | | | | | | | | | 26 | % | | | | | | | | |
| G&A expenses | | $ | 1,802 | | | $ | 1,662 | | | $ | 140 | | | | 8 | % | | $ | 2,485 | | | $ | (683 | ) | | | –27 | % |
| EE&D expenses | | | 2,568 | | | | 1,286 | | | | 1,282 | | | | 100 | % | | | 2,652 | | | | (84 | ) | | | –3 | % |
| Finance and other expense (income) | | | 459 | | | | 694 | | | | (235 | ) | | | –34 | % | | | (50 | ) | | | 509 | | | | –1018 | % |
| Tax expense | | | 844 | | | | 267 | | | | 577 | | | | 216 | % | | | 385 | | | | 459 | | | | 119 | % |
| Net income (loss) | | $ | (1,918 | ) | | $ | (1,498 | ) | | $ | (420 | ) | | | –28 | % | | $ | (666 | ) | | $ | (1,252 | ) | | | –188 | % |
Production Costs
Production costs were $12.4 million in the fourth quarter of 2017, compared to $12.1 million in the third quarter of 2017 and $8.0 million in the fourth quarter of 2016. The increase was attributable to higher mining costs at both GMC and Topia and the weakening of the USD against the MXN which had the impact of increasing MXN production costs in USD terms.
Production costs for the fourth quarter of 2017 increased by $4.4 million compared to the fourth quarter of 2016. The increase was attributable to a greater proportion of production from the higher cost Topia Mine, higher mining costs at the GMC due to higher contractor rates and mining of narrower widths, and a 4% stronger MXN against the USD ($3.0 million effect). In addition, metal sales volumes increased by 18% which increased production costs by $1.4 million.
Mine Operating Earnings
Mine operating earnings before non-cash items were $5.0 million in the fourth quarter of 2017, compared to $6.2 million in the third quarter of 2017 and $4.5 million in the fourth quarter of 2016.
Relative to the third quarter of 2017, mine operating earnings before non-cash items decreased by $1.2 million mainly due to a $0.9 million decrease in revenue and a $0.3 million increase in production costs.
Mine operating earnings before non-cash items increased by $0.5 million relative to the fourth quarter of 2016 as revenue increased by $4.9 million but was mostly offset by the $4.4 million increase in production costs.
General and administrative expenses
G&A expenses were $1.8 million in the fourth quarter of 2017, compared to $2.5 million in the third quarter of 2017 and $1.7 million in the fourth quarter of 2016. The decrease was mainly due to a one-time G&A charge of $1.1 million during the third quarter of 2017.
G&A expenses for the fourth quarter of 2017 increased by $0.1 million mainly due to increased business development and related activity.
| 1 | The Company has included the non-GAAP performance measures, cost of sales before non-cash items and mine operating earnings before non-cash items, throughout this document. Refer to theNon-GAAP Measures section of this MD&A for an explanation of these measures and reconciliation to the Company’s reported financial results in accordance with IFRS. As these are not standardized measures, they may not be directly comparable to similarly titled measures used by others. |
GREAT PANTHER SILVER LIMITED Management’s Discussion & Analysis | Page 23 |
Exploration, evaluation and development expenses
EE&D expenses were $2.6 million in the fourth quarter of 2017, compared to $2.7 million in the third quarter of 2017 and $1.3 million in the fourth quarter of 2016.
The Company incurred $0.9 million of expenditures related to Coricancha during the quarter ended December 31, 2017. Coricancha was acquired on June 30, 2017. The Company will continue to expense costs associated with the ongoing care and maintenance of Coricancha and any project costs associated with evaluating the return of Coricancha to production until such time as a positive decision is made to restart the mine.
EE&D expenses increased by $1.3 million in the fourth quarter of 2017 compared to the same period in 2016 mainly due to an increase in spending at Coricancha partially offset by a reduction in exploration drilling at San Ignacio and changes in reclamation estimates recorded in EE&D. Compared to the third quarter of 2017, EE&D expenses decreased by $0.1 million due to decrease in spending at Coricancha partly offset by the increase in costs associated with corporate development activities and an increase in exploration drilling at San Ignacio.
Finance and other expenses (income)
Finance and other expenses were $0.5 million in the fourth quarter of 2017, compared to nil in the third quarter of 2017 and $0.7 million in the fourth quarter of 2016.
Finance and other income (expense) primarily reflects interest income or expense and foreign exchange gains and losses. During the quarter ended December 31, 2017, the Company recorded a foreign exchange loss of $0.3 million compared to $0.7 million in the fourth quarter of the 2016, as a result of a decline in the USD value of foreign currencies held by the Company.
Net income (loss)
Net loss was $1.9 million in the fourth quarter of 2017, compared to $0.7 million in the third quarter of 2017 and $1.5 million in the fourth quarter of 2016.
Compared to the net loss of $0.7 million for the third quarter of 2017, the change was primarily due to a $1.2 million decrease in mine operating earnings, a $0.5 million decrease in finance and other income and a $0.5 million increase in income tax expense. These factors were partly offset by a $0.7 million decrease in G&A expenses and a $0.1 million decrease in EE&D expenses.
Compared to the net loss of $1.5 million for the fourth quarter of 2016, the increase in net loss was largely due to a $1.3 million increase in EE&D expenses, a $0.6 million increase in income tax expense and a $0.1 million increase in G&A expenses. These were partly offset by a $1.3 million increase in mine operating earnings and a $0.2 million decrease in finance and other expense.
Adjusted EBITDA
Adjusted EBITDA was $0.9 million in the fourth quarter of 2017, compared to $1.5 million in the third quarter of 2017 and $1.4 million in the fourth quarter of 2016.
Adjusted EBITDA decreased by $0.5 million in the fourth quarter of 2017 compared to the same period in 2016. The decrease reflected a $0.9 million increase in EE&D expenses (net of changes in non-cash share based compensation and changes in estimate of reclamation provisions) and a $0.1 million increase in G&A cash expenses. These factors were partly offset by a $0.5 million increase in mine operating earnings before non-cash items.
Adjusted EBITDA decreased by $0.6 million compared to the third quarter of 2017. The decrease reflected a $1.2 million decrease in mine operating earnings before non-cash items and a $0.2 million gain on sale of equipment recorded in the third quarter of 2017. These factors were partly offset by a $0.7 million decrease in G&A cash expenses and a $0.1 million decrease in EE&D expenses.
GREAT PANTHER SILVER LIMITED Management’s Discussion & Analysis | Page 24 |
OUTLOOK
| Production and cash cost guidance | | FY 2018 Guidance | | FY 2017 Actual |
| Total silver equivalent ounces1 | | 4,000,000 – 4,100,000 | | | 3,978,731 | |
| Cash cost2 | | $5.00 – $6.50 | | $ | 5.76 | |
| AISC2 | | $12.50 – $14.50 | | $ | 15.07 | |
For 2018, the Company expects production to be in the range of 4.0 to 4.1 million Ag eq oz (at a 70:1 silver to gold ratio). Cash cost per silver ounce guidance for 2018 is $5.00 to $6.50 and the AISC guidance range is $12.50 to $14.50. While these represent the Company’s best estimates at the current date, it is advised that cash cost and AISC are very sensitive to the Mexican peso foreign exchange rate and metal prices through the computation of by-product credits.
The following provides the Company’s guidance for capital expenditures and EE&D expenses for the year ended December 31, 2018:
| Capex and EE&D expense guidance | | FY 2018 Guidance | | FY 2017 Actual |
| Capital expenditures, excluding acquisition cost and capital expenditures associated with Coricancha | | $2.5 – $3.5 million | | $ | 4.4 million | |
| EE&D – operating mines (excluding Coricancha) | | $5.0 – $6.0 million | | $ | 5.2 million | |
The focus for 2018 will be to maintain steady and efficient operations in Mexico, while advancing the Company’s Coricancha Mine in Peru to set a platform for production growth in 2019 and 2020. While still in the early stage of evaluation, based upon historic production records, Coricancha has the potential to add 3 million Ag eq oz of annual production.
The acquisition of Coricancha was completed effective June 30, 2017 and an updated Mineral Resource Estimate was announced in December 2017 which confirmed the potential of Coricancha. The Company is also conducting evaluations of the mine and processing infrastructure and undertaking certain environmental studies. Remediation activities are also being conducted for which the Company is being reimbursed under the terms of the acquisition agreement. Depending on the outcome of the Company's evaluations, investments in support of a restart of mine development could commence in 2018. The Company plans to release additional technical studies for the project in the second quarter of 2018.
The Company has been undertaking the reclamation of certain legacy tailing facilities at Coricancha under a remediation plan approved by the Ministry of Energy and Mines (the “MEM”), the relevant regulatory body. The Company is seeking approval of a modification to the remediation plan from MEM in accordance with the recommendations of an independent consultant to preserve the stability of nearby areas. The Company has changed the scheduling of the reclamation work, pending a decision from the MEM regarding the proposal to modify the approved remediation plan. Concurrently, the Company has undertaken various legal measures to protect itself from any pending or future fines, penalties, regulatory action or charges from government authorities which may be initiated as a result of the change in timing of the reclamation under the approved plan. The Company believes this matter can be resolved favorably but cannot provide any assurance. If it is not resolved favorably, it may result in fines and impact the Company’s stated plans and objectives for Coricancha.
| 1 | For 2017 guidance, Ag eq oz have been established using a 70:1 Ag:Au ratio, and ratios of 1:0.0559 and 1:0.0676 for the USD price of silver ounces to the USD price for lead and zinc pounds, respectively.For 2016, Ag eq oz were calculated using a 70:1 Ag:Au ratio, and a ratio of 1:0.0504for the USD price of silver ounces to the USD price for both lead and zinc pounds. |
| 2 | Cash cost and AISC are non-GAAP measures. Refer to the Non-GAAP Measures section of this MD&A for an explanation of these measures and reconciliation to the Company’s reported financial results in accordance with IFRS. As these are not standardized measures, they may not be directly comparable to similarly titled measures used by others. |
GREAT PANTHER SILVER LIMITED Management’s Discussion & Analysis | Page 25 |
The Company continues to seek and evaluate additional acquisition opportunities in the Americas to meet the Company's growth objectives.
METAL PRICE SENSITIVITIES
The Company’s financial results are very sensitive to the price of silver and gold, and to a lesser extent, lead and zinc. The following table summarizes the effect of changes in the silver price on the Company’s 2018 revenue outlook, based on an assumed production of 4.1 million silver equivalent ounces, which represents the top of the Company’s production guidance range for 2018:
Revenue Sensitivity to Change in Silver Price
| Silver price per ounce | | | | | | $ | 13.50 | | | $ | 15.50 | | | $ | 17.50 | | | $ | 19.50 | | | $ | 21.50 | |
| GMC revenue | | | 000’s | | | $ | 41,037 | | | $ | 44,140 | | | $ | 47,244 | | | $ | 50,347 | | | $ | 53,450 | |
| Topia revenue | | | 000’s | | | | 15,915 | | | | 17,115 | | | | 18,314 | | | | 19,514 | | | | 20,713 | |
| Total revenue | | | 000’s | | | $ | 56,952 | | | $ | 61,255 | | | $ | 65,558 | | | $ | 69,861 | | | $ | 74,163 | |
Assumes gold price of $1,300/oz, zinc price of $1.45/lb., lead price of $1.10/lb., and production of 4.1 million Ag eq oz.
Revenue Sensitivity to Change in Gold Price
| Gold price per ounce | | | | | | $ | 1,100 | | | $ | 1,200 | | | $ | 1,300 | | | $ | 1,400 | | | $ | 1,500 | |
| GMC revenue | | | 000’s | | | $ | 44,181 | | | $ | 45,906 | | | $ | 47,631 | | | $ | 49,356 | | | $ | 51,081 | |
| Topia revenue | | | 000’s | | | | 18,204 | | | | 18,334 | | | | 18,464 | | | | 18,594 | | | | 18,724 | |
| Total revenue | | | 000’s | | | $ | 62,385 | | | $ | 64,240 | | | $ | 66,095 | | | $ | 67,950 | | | $ | 69,805 | |
Assumes silver price of $17.75/oz, zinc price of $1.45/lb., lead price of $1.10/lb., and production of 4.1 million Ag eq oz.
The Company’s cash cost is affected by changes in metal prices of the by-products of silver, specifically gold at GMC and lead, zinc and gold at Topia. The following tables summarize the effect of changes in prices of gold, lead and zinc on the Company’s 2018 estimated cash cost based on an assumed production of 4.1 million Ag eq oz and assumed cash cost of $6.50, which represent the top of the Company’s production guidance range and top of the cash cost guidance range for 2018, respectively.
GREAT PANTHER SILVER LIMITED Management’s Discussion & Analysis | Page 26 |
Cash Cost: Sensitivity to Change in Gold Price
| Gold price per ounce | | $ | 1,100 | | | $ | 1,200 | | | $ | 1,300 | | | $ | 1,400 | | | $ | 1,500 | |
| Cash cost | | $ | 8.46 | | | $ | 7.60 | | | $ | 6.74 | | | $ | 5.89 | | | $ | 5.03 | |
Assumes silver price of $17.75/oz, zinc price of $1.45/lb., lead price of $1.10/lb., and production of 4.1 million Ag eq oz.
Cash Cost: Sensitivity to Change in Zinc Price
| Zinc price per pound | | $ | 1.25 | | | $ | 1.35 | | | $ | 1.45 | | | $ | 1.55 | | | $ | 1.65 | |
| Cash cost | | $ | 6.90 | | | $ | 6.82 | | | $ | 6.74 | | | $ | 6.66 | | | $ | 6.58 | |
Assumes gold price of $1,300/oz, silver price of $17.75/oz., lead price of $1.10/lb., and production of 4.1 million Ag eq oz.
Cash Cost: Sensitivity to Change in Lead Price
| Lead price per pound | | $ | 0.90 | | | $ | 1.00 | | | $ | 1.10 | | | $ | 1.20 | | | $ | 1.30 | |
| Cash cost | | $ | 6.93 | | | $ | 6.82 | | | $ | 6.74 | | | $ | 6.66 | | | $ | 6.58 | |
Assumes gold price of $1,300/oz, zinc price of $1.45/lb., silver price of $17.75/oz., and production of 4.1 million Ag eq oz.
LIQUIDITY AND CAPITAL RESOURCES
Net working capital including cash and cash equivalents
| (000’s) | | December 31,
2017 | | December 31,
2016 | | Change |
| Cash and cash equivalents | | $ | 36,797 | | | $ | 41,642 | | | $ | (4,845 | ) |
| Short-term deposits | | $ | 20,091 | | | $ | 15,020 | | | $ | 5,071 | |
| Net working capital | | $ | 65,965 | | | $ | 66,560 | | | $ | (595 | ) |
Cash and short-term deposits increased by $0.2 million during 2017 primarily due to $5.7 million of cash generated by operating activities, $1.2 million in proceeds from the exercise of stock options, $0.2 million in proceeds from disposal of plant and equipment and $0.1 million of cash received upon acquisition of Coricancha. These factors were offset by $5.3 million in additions to mineral property, plant and equipment, $1.2 million issued as restricted cash in respect of a Coricancha environmental bond, and a $0.5 million foreign exchange adjustment on cash balances.
Net working capital was $66.0 million as at December 31, 2017, a decrease of $0.6 million from December 31, 2016. Factors that reduced net working capital were capital expenditures of $4.4 million, the funding of an environmental bond at Coricancha in the amount of $1.2 million, and the accounting for a negative net working capital position for Coricancha on acquisition. These were partly offset by operating cash flow of $6.5 million, $1.2 million in proceeds from the exercise of stock options and $0.2 million from the sale of equipment.
Operating activities
For the year ended December 31, 2017, cash flows provided by operating activities amounted to $5.7 million, compared to $13.6 million in 2016. The $7.9 million decrease was primarily due to a reduction in mine operating earnings before non-cash items of $5.7 million (mainly due to higher production costs), an increase in EE&D cash expenses of $3.2 million, an increase in income taxes paid of $2.0 million and an increase in G&A cash expenses of $1.9 million. These factors were offset by a positive fluctuation in net realized foreign exchange gains and losses of $2.6 million, net increase in non-cash net working capital items of $1.7 million and an increase in net interest received of $0.5 million.
GREAT PANTHER SILVER LIMITED Management’s Discussion & Analysis | Page 27 |
For the quarter ended December 31, 2017, cash flows provided by operating activities amounted to $4.0 million, compared to $5.5 million for the fourth quarter of 2016. The $1.5 million decrease was due primarily to the cash outflow associated with changes in non-cash net working capital items of $0.9 million, an increase in EE&D cash expenses of $0.9 million, an increase in income taxes paid of $0.2 million, and an increase in G&A cash expenses of $0.1 million. These factors were partly offset by the increase in mine operating earnings before non-cash items of $0.5 million, and an increase in interest received of $0.1 million.
Investing activities
For the year ended December 31, 2017, the Company had net cash outflows from investing activities of $11.3 million, compared to $19.7 million during the year ended December 31, 2016. During the year ended December 31, 2017, the Company invested $5.3 million in mineral properties, plant and equipment, $5.1 million in short-term deposits, and set aside $1.2 million for a Coricancha environmental bond. These were partly offset by proceeds from disposal of plant and equipment of $0.2 million and cash received upon the acquisition of Coricancha of $0.1 million. During the year ended December 31, 2016, the Company invested $4.7 million in mineral properties, plant and equipment.
For the quarter ended December 31, 2017, the Company had net cash outflows from investing activities of $2.7 million, compared to $16.8 million during the comparative period in 2016. The Company invested $1.3 million in mineral properties, plant and equipment and set aside $1.2 million for a Coricancha environmental bond. For the quarter ended December 31, 2016, the Company invested $15.0 million and $1.8 million in short-term deposits and mineral properties, plant and equipment, respectively.
Financing activities
For the year ended December 31, 2017, the Company received $1.2 million of cash from the exercise of stock options, compared to $33.1 million received in the year ended December 31, 2016 as a result of two separate financings and $2.2 million from the exercise of stock options.
Trends in liquidity and capital resources
The Company anticipates that cash flows generated from mining activities, along with its current cash and other net working capital, will be sufficient to fund the Company’s operations without requiring any additional capital to meet its planned growth initiatives (including plans for Coricancha), and to fund investment and exploration, evaluation, and development activities for the foreseeable future. However, this is highly dependent on metal prices and the ability of the Company to maintain cost and grade controls at its operations, and is subject to changes in the Company’s growth plans and strategy. The Company has stated its objective to grow by acquisition, and accordingly, opportunities to execute and complete such acquisitions may require additional capital.
The Company’s operating cash flows are very sensitive to the prices of silver and gold, foreign exchange rate fluctuations, as well as ore grade fluctuations, and any cash flow outlook provided may vary significantly. Spending and capital investment plans may also be adjusted in response to changes in operating cash-flow expectations. An increase in average silver and gold prices from current levels may result in an increase in planned expenditures in 2018 and, conversely, weaker average silver prices and gold prices could result in a reduction of planned expenditures.
The Company has no debt, other than trade and other payables and its reclamation and remediation liabilities.
The Company does not enter into any long-term hedging arrangement in respect of its silver and gold production.
GREAT PANTHER SILVER LIMITED Management’s Discussion & Analysis | Page 28 |
Contractual Obligations
| (000’s) | | Total | | 1 year | | 2-3 years | | 4-5 years | | Thereafter |
| Operating lease payments | | $ | 1,645 | | | $ | 537 | | | $ | 551 | | | $ | 537 | | | $ | 20 | |
| Drilling services | | | 36 | | | | 36 | | | | – | | | | – | | | | – | |
| Equipment purchases | | | 306 | | | | 306 | | | | – | | | | – | | | | – | |
| Reclamation and remediation (undiscounted) | | | 38,984 | | | | 4,633 | | | | 6,953 | | | | 10,698 | | | | 16,700 | |
| Total | | $ | 40,971 | | | $ | 5,512 | | | $ | 7,504 | | | $ | 11,235 | | | $ | 16,720 | |
Under the terms of the acquisition agreement for Coricancha, Nyrstar has agreed to indemnify the Company for up to $20 million on account of certain reclamation and remediation expenses incurred in connection with Coricancha, including certain of the reclamation and remediation obligations noted in the table above. As at December 31, 2017, the Company had recorded a reimbursement right in the amount of $8.9 million due from Nyrstar in respect of these reclamation and remediation obligations.
Under the terms of the acquisition agreement for Coricancha, Nyrstar has agreed to indemnify the Company for up to $4 million in respect of legal claims and fines and sanctions that the Company may be required to pay in connection with Coricancha. As at December 31, 2017, the Company had recorded a reimbursement right in the amount of $2.1 million recoverable from Nyrstar in respect of certain legal claims.
Off-Balance sheet arrangements
Other than as disclosed, the Company had no material off-balance sheet arrangements as at the date of this MD&A, that have, or are reasonably likely to have, a current or future effect on the financial performance or financial condition of the Company.
TRANSACTIONS WITH RELATED PARTIES
The Company had no material transactions with related parties. Refer to note 21 of the accompanying annual audited consolidated financial statements for the year ended December 31, 2017.
CRITICAL ACCOUNTING ESTIMATES
The preparation of the consolidated financial statements in conformity with IFRS requires management to make judgments, estimates and assumptions which affect the reported amounts of assets and liabilities, the disclosure of contingent assets and liabilities at the date of the consolidated financial statements and the reported amounts of revenues and expenses during the reporting period. Estimates are based on historical experience and other factors considered to be reasonable, and are reviewed on an ongoing basis. Actual results may differ from these estimates.
See note 4 of the 2017 annual audited financial statements for a detailed discussion of the areas in which critical accounting estimates are made and where actual results may differ from the estimates under different assumptions and conditions and may materially affect financial results of its statement of financial position reported in future periods.
Significant new judgments during the year ended December 31, 2017, are those associated with (i) the determination that the acquisition of Coricancha is an asset purchase, (ii) the determination that the fair value of the contingent consideration is nil, (iii) the relative fair values of assets and liabilities acquired as part of the acquisition of Coricancha and (iv) the possible outcome of contingent liabilities associated with Coricancha.
Estimates and underlying assumptions are reviewed on an ongoing basis. Revisions to accounting estimates are recognized in the period in which the estimates are revised and in any future periods affected.
GREAT PANTHER SILVER LIMITED Management’s Discussion & Analysis | Page 29 |
CHANGES IN ACCOUNTING POLICIES
The Company has not adopted any new accounting standards for the year ended December 31, 2017 that have had a material impact on the Company’s financial results. See note 3(r) of the 2017 annual audited financial statements, for a discussion of the accounting standards anticipated to be effective January 1, 2018 or later.
FINANCIAL INSTRUMENTS
| (000’s) | | Fair value1 | | Basis of measurement | | Associated risks |
| Cash and cash equivalents | | $ | 36,797 | | | Amortized cost | | Credit, currency, interest rate |
| Short-term deposits | | $ | 20,091 | | | Amortized cost | | Credit, interest rate |
| Marketable securities | | $ | 2 | | | Fair value through other comprehensive income (loss) | | Exchange |
| Trade receivables | | $ | 7,679 | | | Fair value through profit or loss | | Credit, commodity price |
| Other receivables | | $ | 2,103 | | | Amortized cost | | Credit, currency |
| Derivative instruments | | $ | 85 | | �� | Fair value through profit or loss | | Credit, currency, interest rate |
| Trade and other payables | | $ | 7,369 | | | Amortized cost | | Currency, liquidity |
The Company is exposed in varying degrees to a few risks from financial instruments. Management’s close involvement in the operations allows for the identification of risks and variances from expectations. The types of risk exposure and the way in which such exposures are managed by the Company are provided in note 19 of the annual audited consolidated financial statements for the year ended December 31, 2017.
SECURITIES OUTSTANDING
As of the date of this MD&A, the Company had 168,504,756 common shares issued and outstanding. There were nil warrants, 8,059,398 options, 89,200 deferred share units and 445,984 restricted share units outstanding.
NON-GAAP MEASURES
The Company has included certain non-GAAP performance measures throughout this MD&A, including cost per tonne milled, cash cost, cash cost per Ag eq oz, AISC, AISC per Ag eq oz and mine operating earnings before non-cash items, each as defined in this section. The Company employs these measures internally to measure its operating and financial performance and to assist in business decision making. The Company believes that, in addition to conventional measures prepared in accordance with IFRS, certain investors and other stakeholders also use these non-GAAP measures as information to evaluate the Company’s operating and financial performance. As there are no standardized methods of calculating these non-GAAP measures, the Company’s methods may differ from those used by others and, therefore, the use of these measures may not be directly comparable to similarly titled measures used by others. Accordingly, these non-GAAP measures are intended to provide additional information and should not be considered in isolation or as a substitute for measures of performance prepared in accordance with IFRS.
EBITDA and Adjusted EBITDA
EBITDA is a non-GAAP measure that provides an indication of the Company’s continuing capacity to generate income from operations before taking into account the Company’s financing decisions and costs of amortizing capital assets. Accordingly, EBITDA comprises net income (loss) excluding interest expense, interest income, amortization and depletion, and income taxes.
| 1 | As at December 31, 2017. |
GREAT PANTHER SILVER LIMITED Management’s Discussion & Analysis | Page 30 |
Adjusted EBITDA is also a non-GAAP measure in which EBITDA is adjusted to exclude share-based compensation expense, foreign exchange gains or losses, impairment charges, changes in reclamation estimates recorded in EE&D, and non-recurring items. Foreign exchange gains or losses may consist of both realized and unrealized gains or losses. Under IFRS, entities must reflect in compensation expense the cost of share-based compensation. In the Company’s circumstances, share-based compensation can involve a significant accrual of amounts that will not be settled in cash but are settled by the issuance of shares in exchange. The Company discloses adjusted EBITDA to aid in understanding of the results of the Company and is meant to provide further information about the Company’s financial results to investors.
| (000’s) | | Q4 2017 | | Q4 2016 | | FY 2017 | | FY 2016 |
| Income (loss) for the period | | $ | (1,918 | ) | | $ | (1,498 | ) | | $ | 1,290 | | | $ | (4,118 | ) |
| Income tax expense | | | 843 | | | | 267 | | | | 1,466 | | | | 1,509 | |
| Interest income | | | (205 | ) | | | (107 | ) | | | (808 | ) | | | (225 | ) |
| Finance costs | | | 413 | | | | 25 | | | | 962 | | | | 99 | |
| Amortization of mineral properties, plant and equipment | | | 1,120 | | | | 2,005 | | | | 3,954 | | | | 5,576 | |
| EBITDA | | $ | 253 | | | $ | 692 | | | $ | 6,864 | | | $ | 2,841 | |
| Impairment of mineral properties, plant and equipment | | | – | | | | – | | | | – | | | | 1,679 | |
| Foreign exchange loss (gain) | | | 268 | | | | 730 | | | | (2,292 | ) | | | 11,135 | |
| Share-based compensation | | | 353 | | | | 233 | | | | 1,413 | | | | 1,026 | |
| Changes in reclamation estimates recorded in EE&D | | | 30 | | | | (279 | ) | | | 24 | | | | (162 | ) |
| Adjusted EBITDA | | $ | 904 | | | $ | 1,376 | | | $ | 6,009 | | | $ | 16,519 | |
Mine operating earnings before non-cash items
Mine operating earnings before non-cash items is a non-GAAP measure that provides a measure of the Company’s mine operating earnings on a cash basis. This measure is provided to better assess the cash generation ability of the Company’s operations, before G&A expenses and EE&D expenses. A reconciliation of mine operating earnings is provided in the Results of Operations section.
Cost per tonne milled
The Company uses the non-GAAP measure of cost per tonne milled to manage and evaluate operating performance at each of its mines. Cost per tonne milled is calculated based on the total production costs on a sales basis, adjusted for changes in inventory, to arrive at total production costs that relate to metal production during the period. These total production costs are then divided by the number of tonnes milled during the period.
Management believes that the Company’s ability to control cost per tonne milled is one of its key performance indicators of results of operations. The Company believes this measure provides investors and analysts with useful information about its underlying cost of operations and how management controls those costs.
To facilitate a better understanding of this measure as calculated by the Company, a detailed reconciliation between cost per tonne milled and the Company’s cost of sales as reported in the Company’s consolidated statements of comprehensive income (loss) is provided below.
GREAT PANTHER SILVER LIMITED Management’s Discussion & Analysis | Page 31 |
The following table reconciles cost per tonne milled to production costs, a component of cost of sales, for the year ended December 31, 2017 and 2016:
| (000’s, unless otherwise noted) | | GMC | | Topia | | Consolidated |
| | | FY 2017 | | FY 2016 | | FY 2017 | | FY 2016 | | FY 2017 | | FY 2016 |
| Production costs (sales basis) | | $ | 31,308 | | | $ | 25,246 | | | $ | 10,444 | | | $ | 8,907 | | | $ | 41,752 | | | $ | 34,153 | |
| Change in concentrate inventory | | | (460 | ) | | | (70 | ) | | | 301 | | | | (76 | ) | | | (159 | ) | | | (146 | ) |
| Selling costs | | | (1,366 | ) | | | – | | | | (549 | ) | | | – | | | | (1,915 | ) | | | – | |
| Impact of change in functional currency | | | – | | | | (225 | ) | | | – | | | | (92 | ) | | | – | | | | (317 | ) |
| Production costs (production basis) | | $ | 29,482 | | | $ | 24,951 | | | $ | 10,196 | | | $ | 8,739 | | | $ | 39,678 | | | $ | 33,690 | |
| Tonnes milled, including custom milling | | | 319,964 | | | | 320,903 | | | | 53,745 | | | | 60,961 | | | | 373,709 | | | | 381,864 | |
| Cost per tonne milled | | $ | 92 | | | $ | 78 | | | $ | 190 | | | $ | 143 | | | $ | 106 | | | $ | 88 | |
The following table reconciles cost per tonne milled to production costs, a component of cost of sales, for the three months ended December 31, 2017 and 2016:
| (000’s, unless otherwise noted) | | GMC | | Topia | | Consolidated |
| | | Q4 2017 | | Q4 2016 | | Q4 2017 | | Q4 2016 | | Q4 2017 | | Q4 2016 |
| Production costs (sales basis) | | $ | 8,601 | | | $ | 5,807 | | | $ | 3,821 | | | $ | 2,232 | | | $ | 12,422 | | | $ | 8,039 | |
| Change in concentrate inventory | | | (262 | ) | | | 460 | | | | (245 | ) | | | (394 | ) | | | (507 | ) | | | 66 | |
| Selling costs | | | (356 | ) | | | – | | | | (186 | ) | | | – | | | | (542 | ) | | | – | |
| Production costs (production basis) | | | 7,983 | | | | 6,267 | | | | 3,390 | | | | 1,838 | | | | 11,373 | | | | 8,105 | |
| Tonnes milled, including custom milling | | | 80,896 | | | | 81,518 | | | | 17,500 | | | | 12,553 | | | | 98,396 | | | | 94,071 | |
| Cost per tonne milled | | $ | 99 | | | $ | 77 | | | $ | 194 | | | $ | 146 | | | $ | 116 | | | $ | 86 | |
Cash cost
The Company uses the non-GAAP measure of cash cost to manage and evaluate operating performance at each of its mines. It is a widely-reported measure in the silver mining industry as a benchmark for performance, but does not have a standardized meaning. Cash cost is calculated based on the total cash operating costs with the deduction of revenues attributable to sales of by-product metals net of the respective smelting and refining charges. By-products consist of gold at the GMC, and gold, lead and zinc at Topia.
Management believes that the Company’s ability to control cash cost is one of the key performance indicators for its operations. Having low cash cost facilitates profitability even during times of declining commodity prices and provides more flexibility in responding to changing market conditions. In addition, a profitable operation results in the generation of positive cash flows, which then improves the Company’s financial condition. The Company believes these measures provide investors and analysts with useful information about its underlying cash cost of operations and the impact of by-product revenue on the Company’s cost structure and is a relevant metric used to understand the Company’s operating profitability and ability to generate cash flow.
The Company’s primary business is silver production and its future development and current operations focus on maximizing returns from silver production, and other metal production is associated with the silver production process. Accordingly, gold, zinc and lead produced from operations are considered by-products. As a result, the Company’s non-GAAP cost performance measures are disclosed on a per payable silver ounce basis. When deriving the production costs associated with an ounce of silver, the Company includes by-product credits from gold, zinc and lead sales that are associated with the silver production process, thereby allowing the Company’s management and other stakeholders to assess the net costs of silver production.
GREAT PANTHER SILVER LIMITED Management’s Discussion & Analysis | Page 32 |
To facilitate a better understanding of this measure as calculated by the Company, a detailed reconciliation between the cash cost and the Company’s cost of sales as reported in the Company’s consolidated statements of comprehensive income (loss) is provided below. A breakdown is provided as to how the by-product revenues applied are attributed to the individual by-product metals.
Cash cost and the associated by-product credits are computed based on sales during the period as opposed to a production basis. As such, the amount of the by-product credit may not directly correlate to the production reported for the period. Similarly, the cost per tonne milled during the period may not directly correlate to the cash cost and cash cost per Ag eq oz reported for the same period due to differences between production and sales volumes. Furthermore, the determination of cash cost per Ag eq oz differs from the determination of cash cost. Refer to «Non-GAAP Measures» for a detailed reconciliation of cash cost and of cash cost per Ag eq oz.
The following table reconciles cash cost to production costs for the year ended December 31, 2017 and 2016:
| (000’s, unless otherwise noted) | | GMC | | Topia | | Consolidated |
| | | FY 2017 | | FY 2016 | | FY 2017 | | FY 2016 | | FY 2017 | | FY 2016 |
| Production costs | | $ | 31,308 | | | $ | 25,246 | | | $ | 10,444 | | | $ | 8,907 | | | $ | 41,752 | | | $ | 34,153 | |
| Smelting and refining charges | | | 2,195 | | | | 2,955 | | | | 1,985 | | | | 2,323 | | | | 4,180 | | | | 5,278 | |
| Revenue from custom milling | | | – | | | | – | | | | – | | | | (410 | ) | | | – | | | | (410 | ) |
| Cash operating costs | | | 33,503 | | | $ | 28,201 | | | | 12,429 | | | | 10,820 | | | $ | 45,932 | | | $ | 39,021 | |
| Gross by-product revenue | | | | | | | | | | | | | | | | | | | | | | | | |
| Gold by-product revenue | | | (27,432 | ) | | | (26,749 | ) | | | (755 | ) | | | (521 | ) | | | (28,187 | ) | | | (27,270 | ) |
| Lead by-product revenue | | | – | | | | – | | | | (2,741 | ) | | | (1,808 | ) | | | (2,741 | ) | | | (1,808 | ) |
| Zinc by-product revenue | | | – | | | | – | | | | (3,853 | ) | | | (2,318 | ) | | | (3,853 | ) | | | (2,318 | ) |
| | | $ | 6,071 | | | $ | 1,452 | | | $ | 5,080 | | | $ | 6,173 | | | $ | 11,151 | | | $ | 7,625 | |
| Impact of change in functional currency1 | | | – | | | | (195 | ) | | | – | | | | (85 | ) | | | – | | | | (280 | ) |
| Cash operating costs, net of by-product revenue | | $ | 6,071 | | | $ | 1,257 | | | $ | 5,080 | | | $ | 6,088 | | | $ | 11,151 | | | $ | 7,345 | |
| Payable silver ounces sold | | | 1,404,696 | | | | 1,477,695 | | | | 533,006 | | | | 532,557 | | | | 1,937,702 | | | | 2,010,252 | |
| Cash cost | | $ | 4.32 | | | $ | 0.85 | | | $ | 9.53 | | | $ | 11.43 | | | $ | 5.76 | | | $ | 3.65 | |
| 1 | The change in functional currency was accounted for on a prospective basis, with prior period comparative information translated to the USD at the foreign exchange rates on July 1, 2016. The July 1, 2016 exchange rates differ from the historical exchange rates used to calculate the previously-disclosed cost per tonne milled, cash cost and AISC metrics, requiring an adjustment in the reconciliation for the prior-period comparatives. |
GREAT PANTHER SILVER LIMITED Management’s Discussion & Analysis | Page 33 |
The following table reconciles cash cost to production costs for the three months ended December 31, 2017 and 2016:
| (000’s, unless otherwise noted) | | GMC | | Topia | | Consolidated |
| | | Q4 2017 | | Q4 2016 | | Q4 2017 | | Q4 2016 | | Q4 2017 | | Q4 2016 |
| Production costs | | $ | 8,601 | | | $ | 5,807 | | | $ | 3,821 | | | $ | 2,232 | | | $ | 12,422 | | | $ | 8,039 | |
| Smelting and refining charges | | | 532 | | | | 704 | | | | 723 | | | | 604 | | | | 1,255 | | | | 1,308 | |
| Revenue from custom milling | | | – | | | | – | | | | – | | | | (91 | ) | | | – | | | | (91 | ) |
| Cash operating costs | | $ | 9,133 | | | $ | 6,511 | | | $ | 4,544 | | | $ | 2,745 | | | $ | 13,677 | | | $ | 9,256 | |
| Gross by-product revenue | | | | | | | | | | | | | | | | | | | | | | | | |
| Gold by-product revenue | | | (7,205 | ) | | | (4,973 | ) | | | (269 | ) | | | (127 | ) | | | (7,474 | ) | | | (5,100 | ) |
| Lead by-product revenue | | | – | | | | – | | | | (1,035 | ) | | | (540 | ) | | | (1,035 | ) | | | (540 | ) |
| Zinc by-product revenue | | | – | | | | – | | | | (1,429 | ) | | | (769 | ) | | | (1,429 | ) | | | (769 | ) |
| Cash operating costs, net of by-product revenue | | $ | 1,928 | | | $ | 1,538 | | | $ | 1,811 | | | $ | 1,309 | | | $ | 3,739 | | | $ | 2,847 | |
| Payable silver ounces sold | | | 341,069 | | | | 359,947 | | | | 175,009 | | | | 128,481 | | | | 516,078 | | | | 488,428 | |
| Cash cost | | $ | 5.65 | | | $ | 4.27 | | | $ | 10.35 | | | $ | 10.19 | | | $ | 7.25 | | | $ | 5.83 | |
Cash cost per Ag eq oz
Cash cost per Ag eq oz is calculated based on the total cash operating costs divided by silver equivalent ounces sold. The cash cost per Ag eq oz calculation does not deduct revenues attributable to sales of by-product metals from the costs associated with metal production process, thereby allowing the Company’s management and other stakeholders to assess the total costs associated with all metal production. Management believes this non-GAAP measure provides investors and analysts with useful information about its underlying cash cost of operations as it is not influenced by fluctuations in metal prices.
To facilitate a better understanding of this measure as calculated by the Company, a detailed reconciliation between the cash cost per Ag eq oz and the Company’s cost of sales as reported in the Company’s consolidated statements of comprehensive income (loss) is provided below.
The following table reconciles cash cost per Ag eq oz to production costs for the year ended December 31, 2017 and 2016:
| | | GMC | | Topia | | Consolidated |
| (000’s, unless otherwise noted) | | FY 2017 | | FY 2016 | | FY 2017 | | FY 2016 | | FY 2017 | | FY 2016 |
| Production costs | | $ | 31,308 | | | $ | 25,246 | | | $ | 10,444 | | | $ | 8,907 | | | $ | 41,752 | | | $ | 34,153 | |
| Smelting and refining charges | | | 2,195 | | | | 2,955 | | | | 1,985 | | | | 2,323 | | | | 4,180 | | | | 5,278 | |
| Revenue from custom milling | | | – | | | | – | | | | – | | | | (410 | ) | | | – | | | | (410 | ) |
| | | $ | 33,503 | | | $ | 28,201 | | | $ | 12,429 | | | $ | 10,820 | | | $ | 45,932 | | | $ | 39,021 | |
| Impact of change in functional currency | | | – | | | | (195 | ) | | | – | | | | (85 | ) | | | – | | | | (280 | ) |
| Cash operating costs | | $ | 33,503 | | | $ | 28,006 | | | $ | 12,429 | | | $ | 10,735 | | | $ | 45,932 | | | $ | 38,741 | |
| Silver equivalent ounces sold | | | 2,892,243 | | | | 2,954,567 | | | | 901,273 | | | | 788,166 | | | | 3,793,516 | | | | 3,742,733 | |
| Cash cost per Ag eq oz | | $ | 11.58 | | | $ | 9.48 | | | $ | 13.79 | | | $ | 13.62 | | | $ | 12.11 | | | $ | 10.35 | |
GREAT PANTHER SILVER LIMITED Management’s Discussion & Analysis | Page 34 |
The following table reconciles cash cost per Ag eq oz to production costs for the three months ended December 31, 2017 and 2016:
| (000’s, unless otherwise noted) | | GMC | | Topia | | Consolidated |
| | | Q4 2017 | | Q4 2016 | | Q4 2017 | | Q4 2016 | | Q4 2017 | | Q4 2016 |
| Production costs | | $ | 8,601 | | | $ | 5,807 | | | $ | 3,821 | | | $ | 2,232 | | | $ | 12,422 | | | $ | 8,039 | |
| Smelting and refining charges | | | 532 | | | | 704 | | | | 723 | | | | 604 | | | | 1,255 | | | | 1,308 | |
| Revenue from custom milling | | | – | | | | – | | | | – | | | | (91 | ) | | | – | | | | (91 | ) |
| Cash operating costs | | $ | 9,133 | | | $ | 6,511 | | | $ | 4,544 | | | $ | 2,745 | | | $ | 13,677 | | | $ | 9,256 | |
| Silver equivalent ounces sold | | | 731,403 | | | | 684,864 | | | | 306,620 | | | | 198,484 | | | | 1,038,023 | | | | 883,348 | |
| Cash cost per Ag eq oz | | $ | 12.49 | | | $ | 9.51 | | | $ | 14.82 | | | $ | 13.83 | | | $ | 13.18 | | | $ | 10.48 | |
All-in sustaining cost (AISC)
AISC is a non-GAAP measure and has been calculated based on World Gold Council (“WGC”) guidance released in 2013. The WGC is not a regulatory organization and does not have the authority to develop accounting standards for disclosure requirements. The Company believes that the disclosure of this measure provides a broader measure of the cost of producing an ounce of silver at its operations as the measure includes sustaining capital and EE&D expenditures, G&A costs, and other costs not commonly included in the cost of production and therefore not included in cash cost.
AISC starts with cash cost net of by-product revenues and adds G&A expenditures inclusive of share-based compensation (“SBC”), accretion of reclamation provision, sustaining exploration, evaluation and development expenses, and sustaining capital expenditures. Sustaining expenditures are those costs incurred to sustain and maintain existing assets at current productive capacity and constant planned levels of productive output. Excluded are non-sustaining capital expenditures, which result in a material increase in the life of assets, materially increase resources or reserves, productive capacity, future earning potential, or result in significant improvements in recovery or grade. Management believes that the AISC measure represents the total sustainable costs of producing silver from current operations, and provides additional information of the Company’s operational performance and ability to generate cash flows.
Expenses incurred in respect of Coricancha, El Horcón, Santa Rosa, and other exploration projects were considered non-sustaining.
GREAT PANTHER SILVER LIMITED Management’s Discussion & Analysis | Page 35 |
The following table reconciles cash operating costs, net of by-product revenue, to AISC for the year ended December 31, 2017 and 2016:
| (000’s, unless otherwise noted) | | GMC | | Topia | | Corporate | | Consolidated |
| | | FY 2017 | | FY 2016 | | FY 2017 | | FY 2016 | | FY 2017 | | FY 2016 | | FY 2017 | | FY 2016 |
| Cash operating costs, net of by-product revenue1 | | $ | 6,071 | | | $ | 1,257 | | | $ | 5,080 | | | $ | 6,088 | | | $ | – | | | $ | – | | | $ | 11,151 | | | $ | 7,345 | |
| G&A costs | | | – | | | | – | | | | – | | | | – | | | | 6,818 | | | | 4,959 | | | | 6,818 | | | | 4,959 | |
| Share-based compensation | | | – | | | | – | | | | – | | | | – | | | | 1,413 | | | | 1,026 | | | | 1,413 | | | | 1,026 | |
| Accretion | | | 91 | | | | 8 | | | | 69 | | | | 12 | | | | – | | | | – | | | | 160 | | | | 20 | |
| Sustaining EE&D costs | | | 4,598 | | | | 3,590 | | | | 527 | | | | 222 | | | | 105 | | | | 371 | | | | 5,230 | | | | 4,183 | |
| Sustaining capital expenditures | | | 2,122 | | | | 2,843 | | | | 2,307 | | | | 1,835 | | | | – | | | | – | | | | 4,429 | | | | 4,678 | |
| | | $ | 12,882 | | | $ | 7,698 | | | $ | 7,983 | | | $ | 8,157 | | | $ | 8,336 | | | $ | 6,356 | | | $ | 29,201 | | | $ | 22,211 | |
| Impact of change in functional currency | | | – | | | | (10 | ) | | | – | | | | (5 | ) | | | – | | | | (94 | ) | | | – | | | | (109 | ) |
| All-in sustaining costs | | $ | 12,882 | | | $ | 7,688 | | | $ | 7,983 | | | $ | 8,152 | | | $ | 8,336 | | | $ | 6,262 | | | $ | 29,201 | | | $ | 22,102 | |
| Payable silver ounces sold | | | 1,404,696 | | | | 1,477,695 | | | | 533,006 | | | | 532,557 | | | | n/a | | | | n/a | | | | 1,937,702 | | | | 2,010,252 | |
| AISC | | $ | 9.17 | | | $ | 5.20 | | | $ | 14.98 | | | $ | 15.31 | | | | n/a | | | | n/a | | | $ | 15.07 | | | $ | 10.99 | |
The following table reconciles cash operating costs, net of by-product revenue, to AISC for the three months ended December 31, 2017 and 2016:
| (000’s, unless otherwise noted) | | GMC | | Topia | | Corporate | | Consolidated |
| | | Q4 2017 | | Q4 2016 | | Q4 2017 | | Q4 2016 | | Q4 2017 | | Q4 2016 | | Q4 2017 | | Q4 2016 |
| Cash operating costs, net of by-product revenue1 | | $ | 1,928 | | | $ | 1,538 | | | $ | 1,811 | | | $ | 1,309 | | | $ | – | | | $ | – | | | $ | 3,739 | | | $ | 2,847 | |
| G&A costs | | | – | | | | – | | | | – | | | | – | | | | 1,556 | | | | 1,457 | | | | 1,556 | | | | 1,457 | |
| Share-based compensation | | | – | | | | – | | | | – | | | | – | | | | 353 | | | | 233 | | | | 353 | | | | 233 | |
| Accretion | | | 45 | | | | 2 | | | | 34 | | | | 3 | | | | – | | | | – | | | | 79 | | | | 5 | |
| Sustaining EE&D costs | | | 1,081 | | | | 1,480 | | | | 27 | | | | 31 | | | | 98 | | | | 40 | | | | 1,206 | | | | 1,551 | |
| Sustaining capital expenditures | | | 488 | | | | 895 | | | | 175 | | | | 1,041 | | | | – | | | | – | | | | 663 | | | | 1,936 | |
| All-in sustaining costs | | $ | 3,542 | | | $ | 3,915 | | | $ | 2,047 | | | $ | 2,384 | | | $ | 2,007 | | | $ | 1,730 | | | $ | 7,596 | | | $ | 8,029 | |
| Payable silver ounces sold | | | 341,069 | | | | 359,947 | | | | 175,009 | | | | 128,481 | | | | n/a | | | | n/a | | | | 516,078 | | | | 488,428 | |
| AISC | | $ | 10.38 | | | $ | 10.88 | | | $ | 11.70 | | | $ | 18.56 | | | | n/a | | | | n/a | | | $ | 14.72 | | | $ | 16.44 | |
AISC per Ag eq oz
AISC per Ag eq oz starts with operating cash cost and adds G&A expenditures inclusive of share-based compensation, accretion of reclamation provision, sustaining exploration, evaluation and development expenses, and sustaining capital expenditures. The Company believes that the disclosure of this measure provides a broader measure of the cost of all metal production at its operations, as measured by silver equivalent ounces, as the cost metric includes sustaining capital and EE&D expenditures, G&A costs, and other costs not commonly included in the cost of production and therefore not included in cash cost per Ag eq oz.
| 1 | Cash operating costs, net of by-product revenue, are reconciled to the Company’s financial statements in the cash cost table. |
GREAT PANTHER SILVER LIMITED Management’s Discussion & Analysis | Page 36 |
The following table reconciles cash operating costs, net of by-product revenue, to AISC for the year ended December 31, 2017 and 2016:
| (000’s, unless otherwise noted) | | GMC | | Topia | | Corporate | | Consolidated |
| | | FY 2017 | | FY 2016 | | FY 2017 | | FY 2016 | | FY 2017 | | FY 2016 | | FY 2017 | | FY 2016 |
| Cash operating costs1 | | $ | 33,503 | | | $ | 28,006 | | | $ | 12,429 | | | $ | 10,735 | | | $ | – | | | $ | – | | | $ | 45,932 | | | $ | 38,741 | |
| G&A costs | | | – | | | | – | | | | – | | | | – | | | | 6,818 | | | | 4,959 | | | | 6,818 | | | | 4,959 | |
| Share-based compensation | | | – | | | | – | | | | – | | | | – | | | | 1,413 | | | | 1,026 | | | | 1,413 | | | | 1,026 | |
| Accretion | | | 91 | | | | 8 | | | | 69 | | | | 12 | | | | – | | | | – | | | | 160 | | | | 20 | |
| Sustaining EE&D costs | | | 4,598 | | | | 3,590 | | | | 527 | | | | 222 | | | | 105 | | | | 371 | | | | 5,230 | | | | 4,183 | |
| Sustaining capital expenditures | | | 2,122 | | | | 2,843 | | | | 2,307 | | | | 1,835 | | | | – | | | | – | | | | 4,429 | | | | 4,678 | |
| | | $ | 40,314 | | | $ | 34,447 | | | $ | 15,332 | | | $ | 12,804 | | | $ | 8,336 | | | $ | 6,356 | | | $ | 63,982 | | | $ | 53,607 | |
| Impact of change in functional currency | | | – | | | | (10 | ) | | | – | | | | (5 | ) | | | – | | | | (94 | ) | | | – | | | | (109 | ) |
| All-in sustaining costs | | $ | 40,314 | | | $ | 34,437 | | | $ | 15,332 | | | $ | 12,799 | | | $ | 8,336 | | | $ | 6,262 | | | $ | 63,982 | | | $ | 53,498 | |
| Silver equivalent ounces sold | | | 2,892,243 | | | | 2,954,567 | | | | 901,273 | | | | 788,166 | | | | n/a | | | | n/a | | | | 3,793,516 | | | | 3,742,733 | |
| AISC per Ag eq oz | | $ | 13.94 | | | $ | 11.66 | | | $ | 17.01 | | | $ | 16.24 | | | | n/a | | | | n/a | | | $ | 16.87 | | | $ | 14.29 | |
The following table reconciles cash operating costs to AISC per Ag eq oz for the three months ended December 31, 2017 and 2016:
| (000’s, unless otherwise noted) | | GMC | | Topia | | Corporate | | Consolidated |
| | | Q4 2017 | | Q4 2016 | | Q4 2017 | | Q4 2016 | | Q4 2017 | | Q4 2016 | | Q4 2017 | | Q4 2016 |
| Cash operating costs1 | | $ | 9,133 | | | $ | 6,511 | | | $ | 4,544 | | | $ | 2,745 | | | $ | – | | | $ | – | | | $ | 13,677 | | | $ | 9,256 | |
| G&A costs | | | – | | | | – | | | | – | | | | – | | | | 1,556 | | | | 1,457 | | | | 1,556 | | | | 1,457 | |
| Share-based compensation | | | – | | | | – | | | | – | | | | – | | | | 353 | | | | 233 | | | | 353 | | | | 233 | |
| Accretion | | | 45 | | | | 2 | | | | 34 | | | | 3 | | | | – | | | | – | | | | 79 | | | | 5 | |
| Sustaining EE&D costs | | | 1,081 | | | | 1,480 | | | | 27 | | | | 31 | | | | 98 | | | | 40 | | | | 1,206 | | | | 1,551 | |
| Sustaining capital expenditures | | | 488 | | | | 895 | | | | 175 | | | | 1,041 | | | | – | | | | – | | | | 663 | | | | 1,936 | |
| All-in sustaining costs | | $ | 10,747 | | | $ | 8,888 | | | $ | 4,780 | | | $ | 3,820 | | | $ | 2,007 | | | $ | 1,730 | | | $ | 17,534 | | | $ | 14,438 | |
| Silver equivalent ounces sold | | | 731,403 | | | | 684,864 | | | | 306,620 | | | | 198,484 | | | | n/a | | | | n/a | | | | 1,038,023 | | | | 883,348 | |
| AISC per Ag eq oz | | $ | 14.69 | | | $ | 12.98 | | | $ | 15.59 | | | $ | 19.25 | | | | n/a | | | | n/a | | | $ | 16.89 | | | $ | 16.35 | |
INTERNAL CONTROLS OVER FINANCIAL REPORTING
Disclosure controls and procedures within the Company have been designed to provide reasonable assurance that all relevant information is identified to its President and Chief Executive Officer (“CEO”), its Chief Financial Officer (“CFO”) to ensure appropriate and timely decisions are made regarding public disclosure.
Internal controls over financial reporting have been designed by management under the supervision of, and with the participation of the Company's CEO and CFO, to provide reasonable assurance regarding the reliability of the Company’s financial reporting and its preparation of financial statements for external purposes in accordance with IFRS.
| 1 | Cash operating costs are reconciled to the Company’s financial statements in the cash cost per Ag eq oz table. |
GREAT PANTHER SILVER LIMITED Management’s Discussion & Analysis | Page 37 |
On June 30, 2017, the Company acquired a Peruvian subsidiary which holds Coricancha. Other than the additional controls resulting from the acquisition of Coricancha, there have been no changes in internal controls over financial reporting that occurred during the year ended December 31, 2017, that have materially affected, or are reasonably likely to materially affect, internal controls over financial reporting.
Management's Report on Disclosure Controls and Procedures
Management, under the supervision of and with the participation of the Company's CEO and CFO, evaluated the effectiveness of the Company's disclosure controls and procedures and concluded, as at December 31, 2017, that such disclosure controls and procedures were effective.
Management's Report on Internal Controls Over Financial Reporting
Management, under the supervision of and with the participation of the Company’s CEO and CFO, evaluated the effectiveness of the Company’s internal controls over financial reporting. In making this evaluation, management used the criteria set forth by the Committee of Sponsoring Organizations of the Treadway Commissions (“COSO”) in «Internal Control - Integrated Framework (2013)». Based on that evaluation, management and the CEO and CFO have concluded that, as at December 31, 2017, the Company’s internal controls over financial reporting were effective.
CAUTIONARY STATEMENT ON FORWARD-LOOKING STATEMENTS
Certain of the statements and information in this document constitute “forward-looking statements” within the meaning of the United States "Private Securities Litigation Reform Act" of 1995 and “forward-looking information” within Canadian securities laws (collectively, “forward-looking statements”). All statements, other than statements of historical fact, addressing activities, events or developments that the Company expects or anticipates will or may occur in the future are forward-looking statements. Forward-looking statements are often, but not always, identified by the words “anticipates”, “believes”, “expects”, “may”, “likely”, “plans”, “intends”, “expects”, “may”, “forecast”, “project”, “budgets”, “potential”, and “outlook”, or similar words, or statements that certain events or conditions “may”, “might”, “could”, “can”, “would”, or “will” occur. Forward-looking statements reflect the Company’s current expectations and assumptions, and are subject to a number of known and unknown risks, uncertainties and other factors, which may cause the Company’s actual results, performance or achievements to be materially different from any anticipated future results, performance or achievements expressed or implied by the forward-looking statements.
In particular, this MD&A includes forward-looking statements, principally under the section titled "Outlook", but also elsewhere in this document relating to estimates, forecasts, and statements as to management’s expectations, opinions and assumptions with respect to the future production of silver, gold, lead and zinc; profit, operating costs and cash flows; grade improvements; sales volume and selling prices of products; capital and exploration expenditures, plans, timing, progress, and expectations for the development of the Company’s mines and projects; the timing of production and the cash and total costs of production; sensitivity of earnings to changes in commodity prices and exchange rates; the impact of foreign currency exchange rates; expenditures to increase or determine reserves and resources; sufficiency of available capital resources; title to claims; expansion and acquisition plans; and the future plans and expectations for the Company’s properties and operations. Examples of specific information in this MD&A that may constitute forward-looking statements are:
| · | The compilation and submission of technical information by CONAGUA, and CONAGUA’s review of such information is expected to continue; |
| · | Expectations that the current tailings footprint at the GMC can be maintained and can support operations at the GMC until at least 2022; |
| · | Expectations that permits associated with the use and expansion of the TSF at the GMC will be granted in due course, with no suspension of the GMC operations; |
| · | Expectations that permits associated with the use of the TSF at Topia will continue to be granted in due course, with no suspension of Topia operations; |
GREAT PANTHER SILVER LIMITED Management’s Discussion & Analysis | Page 38 |
| · | The expectation that any mitigation measures that may arise from the PROFEPA audit of Topia will extend through 2018 and beyond; |
| · | The expectation that pending proposals for modification of the approved closure plan for Coricancha will conclude with the approval of the authorities, which will also resolve any related fines or penalties; |
| · | Expectations that any potential gaps in existing compliance associated with the ongoing environmental review of Topia’s operations will be capable of being addressed through a mitigation plan; |
| · | Expectations of the Company’s silver equivalent ounce production for 2018; |
| · | Guidance for cash cost and AISC for 2018; |
| · | Guidance for capital expenditures and EE&D expenses for 2018 and beyond for each of the Company’s operating mines and projects; |
| · | The Company’s plans for Coricancha, including further evaluations of the current mine and processing infrastructure, mine rehabilitation and development in preparation for underground drilling and environmental studies; |
| · | Expectations that development in support of operations at the Coricancha could commence in 2018; |
| · | Expectations that cash flows from operations along with current net working capital will be sufficient to fund capital investment and development programs for 2018 and the foreseeable future; |
| · | Expectations regarding access to additional capital to fund additional expansion or development plans, or to undertake an acquisition; |
| · | Expectations in respect of permitting and development activities; and |
| · | The Company’s objective to acquire additional mines or projects. |
These forward-looking statements are necessarily based on a number of factors and assumptions that, while considered reasonable by the Company as of the date of such statements, are inherently subject to significant business, economic and competitive uncertainties and contingencies, as described below. These assumptions made by the Company in preparing the forward looking information contained in this MD&A, which may prove to be incorrect, include, but are not limited to, general business and economic conditions; the supply and demand for, deliveries of, and the level and volatility of prices of, silver, gold, lead and zinc; expected CAD, MXN, Peruvian soles and USD exchange rates; the timing of the receipt of regulatory and governmental approvals for development projects and other operations; costs of production, and production and productivity levels; estimated future capital expenditures and cash flows; the continuing availability of water and power resources for operations; the accuracy of the interpretation and assumptions used in calculating reserve and resource estimates (including with respect to size, grade and recoverability); the accuracy of the information included or implied in the various independently produced and published technical reports; the geological, operational and price assumptions on which these technical reports are based; conditions in the financial markets; the ability to attract and retain skilled staff; the ability to procure equipment and operating supplies and that there are no material unanticipated variations in the cost of energy or supplies; the ability to secure contracts for the sale of the Company’s products (metals concentrates); the execution and outcome of current or future exploration activities; that current financial resources will be sufficient for planned activities and to complete further exploration programs; the possibility of project delays and cost overruns, or unanticipated excessive operating costs and expenses; the Company’s ability to maintain adequate internal control over financial reporting, and disclosure controls and procedures; the ability of contractors to perform their contractual obligations; operations not being disrupted by issues such as mechanical failures, labour or social disturbances, illegal occupations and adverse weather conditions; that financial resources will be sufficient to fund new acquisitions, if any.
This list is not exhaustive of the factors that may affect any of the Company’s forward-looking statements or information. Forward-looking statements or information are statements about the future and are inherently uncertain, and actual achievements of the Company or other future events or conditions may differ materially from those reflected in the forward-looking statements or information due to a variety of risks, uncertainties and other factors, including, without limitation, changes in commodity prices; changes in foreign currency exchange rates; acts of foreign governments; political risk and social unrest; uncertainties related to title to the Company’s mineral properties and the surface rights thereon, including the Company’s ability to acquire, or economically acquire, the surface rights to certain of the Company’s exploration and development projects; unanticipated operational difficulties due to adverse weather conditions; failure of plant or mine equipment and unanticipated events related to health, safety, and environmental matters; failure of counterparties to perform their contractual obligations; delays in obtaining necessary permits for extension of operations; inability to maintain or obtain permits for operations; deterioration of general economic conditions, and other risks described herein or in the Company’s most recent Form 40-F/AIF.
GREAT PANTHER SILVER LIMITED Management’s Discussion & Analysis | Page 39 |
The Company’s forward-looking statements and information are based on the assumptions, beliefs, expectations and opinions of management as of the date of this MD&A. The Company will update forward-looking statements and information if and when, and to the extent required by applicable securities laws. Readers should not place undue reliance on forward-looking statements. The forward-looking statements contained herein are expressly qualified by this cautionary statement.
Further information can be found in the section entitled "Description of the Business – Risk Factors" in the most recent Form 40-F/AIF on file with the SEC and Canadian provincial securities regulatory authorities. Readers are advised to carefully review and consider the risk factors identified in the Form 40-F/AIF for a discussion of the factors that could cause the Company’s actual results, performance and achievements to be materially different from any anticipated future results, performance or achievements expressed or implied by the forward-looking statements. It is recommended that prospective investors consult the more complete discussion of the Company’s business, financial condition and prospects that is included in the Form 40-F/AIF.
CAUTIONARY NOTE TO U.S. INVESTORS
This MD&A has been prepared in accordance with Canada securities regulations, which differs from the securities regulations of the United States. The terms “Mineral Resource”, “Measured Mineral Resource”, “Indicated Mineral Resource” and “Inferred Mineral Resource” are used in accordance with Canadian NI 43-101, however, these terms are not defined terms under SEC Industry Guide 7 and are normally not permitted to be used in reports and registration statements filed with the SEC. Investors are cautioned not to assume that any part or all the mineral deposits in these categories will ever be converted into reserves. “Inferred Mineral Resources” have a great amount of uncertainty as to their existence, and great uncertainty as to their economic and legal feasibility. It cannot be assumed that all or any part of an Inferred Mineral Resource will ever be upgraded to a higher category. In accordance with Canadian rules, estimates of Inferred Mineral Resources cannot form the basis of feasibility or other advanced economic studies. Investors are cautioned not to assume that all or any part of an Inferred Mineral Resource exists or is economically or legally mineable.
GREAT PANTHER SILVER LIMITED Management’s Discussion & Analysis | Page 40 |