Exhibit 99.1
![]()
NI 43-101 Mineral Resource Update Technical
Report on the Guanajuato Mine Complex,
Guanajuato and San Ignacio operations,
Guanajuato STATE, Mexico
-Prepared for-
Great Panther Mining Limited
1330 – 200 Granville Street
Vancouver, B.C., Canada, V6C 1S4
Prepared by:
Robert F. Brown, P. Eng., Qualified Person & Geological Consultant
Mohammad Nourpour, P. Geo., Qualified Person & Resource Geologist
Effective Date:
July 31, 2020
Report Date:
December 22, 2020
NI 43-101 Technical Report | December 22, 2020 |
Title Page
NI 43-101 Mineral Resource Update Technical Report on the Guanajuato Mine Complex, Guanajuato and San Ignacio Operations, Guanajuato State, Mexico.
Authors:
| ¢ | Robert F. Brown, P. Eng., Qualified Person & Geological Consultant |
| ¢ | Mohammad Nourpour, P. Geo., Qualified Person & Resource Geologist |
Effective Date of the Report:
July 31, 2020
| ii | Page |
NI 43-101 Technical Report | December 22, 2020 |
Date & Signature Page
This NI 43-101 Mineral Resource Update Technical Report on the Guanajuato Mine Complex, Guanajuato and San Ignacio Operations, Guanajuato State, Mexico is submitted to Great Panther Mining Limited and has an effective date of July 31, 2020.
| Qualified Person | Responsible for Parts | |
| Signed “Robert F. Brown” | ||
| Signed By: ______________________________ | Items 1-10, 13, 15-27 and co-responsible for Items 11, 12 & 14 in the Technical Report | |
| Robert F. Brown, P. Eng. | ||
| QP for Great Panther Mining Limited | ||
| Date: December 22, 2020 | ||
| Signed “Mohammad Nourpour” | ||
| Signed By: ______________________________ | Co-responsible for Items 11, 12 & 14 in the Technical Report | |
| Mohammad Nourpour, P. Geo. | ||
| QP for Great Panther Mining Limited | ||
| Date: December 22, 2020 |
| iii | Page |
NI 43-101 Technical Report | December 22, 2020 |
Certificate of Qualified Person
I, Robert F. Brown, 3977 Westridge Ave., West Vancouver, B.C., Canada, am a co-author of this technical report entitled “NI 43-101 Mineral Resource Update Technical Report on the Guanajuato Mine Complex, Guanajuato and San Ignacio Operations, Guanajuato State, Mexico” prepared for Great Panther Mining Limited, dated December 22, 2020, with an effective date of July 31, 2020 (the “Technical Report”) and do hereby certify that;
| 1. | I am a graduate of the Queen’s University at Kingston, Ontario (1975) and hold a B. Sc. degree in Geology. |
| 2. | I am presently contracted by Great Panther Mining Limited as a geological consultant. |
| 3. | I have been employed in my profession by various companies since graduation in 1975. |
| 4. | I am a registered Professional Engineer with Association of Professional Engineers and Geoscientists of B.C. since 1982 (Membership No. 14527). |
| 5. | I have read the definitions of “Qualified Person” set out in National Instrument 43-101 Standards of Disclosure for Mineral Projects (“NI 43-101”) and certify that by reason of my education, affiliation with a professional association and past relevant work experience, I fulfil the requirements to be a “Qualified Person” for the purposes of NI 43-101. My relevant experience includes practice as a geologist in the fields of exploration, resource definition and estimation, and mining on projects at various stages of development (green fields through to established operation) within Mexico, Canada, and USA. I have worked primarily with gold and silver deposits hosted within various geological environments in both open pit and underground operating environments. |
| 6. | I have visited the Guanajuato Mine Complex on numerous occasions since 2005, most recently from August 20th to 24th and December 6th to 12th, 2019. |
| 7. | I am the author responsible for sections 1-10, 13, and 15-27 of this Technical Report and co-responsible for sections 11, 12 and 14 of this Technical Report. |
| 8. | To the best of my knowledge, information, and belief, as of the effective date, this Technical Report contains all the scientific and technical information that is required to be disclosed to make this Technical Report not misleading. |
| 9. | I am not independent of Great Panther Mining Limited as defined in Section 1.5 of NI 43-101 as I was appointed VP Exploration in April of 2004, retired at year end 2016, and presently am a Qualified Person and consultant for Great Panther Mining Limited. |
| 10. | I have had prior involvement with the Guanajuato Mine Complex that is the subject of the Technical Report. I have been a co-author in previous technical reports prepared for Great Panther Mining Limited in respect of the Guanajuato Mine Complex entitled NI 43-101 Mineral Resource Update Technical Report on the Guanajuato Mine Complex, Guanajuato Mine, Guanajuato State, Mexico and NI 43-101 Mineral Resource Update Technical Report on the Guanajuato Mine Complex, San Ignacio Mine, Guanajuato State, Mexico. |
| 11. | I have read NI 43-101, NI 43-101F1 and have prepared the section of the Technical Report I am responsible for in compliance with both that instrument and form. |
| 12. | I consent to the filing of the Technical Report with any stock exchange and other regulatory authority and any publication by them for regulatory purposes, including electronic publication in the public company files on their websites accessible by the public, of the Technical Report. |
Signed and sealed “Robert F. Brown”
____________________________
Robert F. Brown, P. Eng., B.C.
DATED at Vancouver, British Columbia, this 22nd day of December 2020
| iv | Page |
NI 43-101 Technical Report | December 22, 2020 |
Certificate of Qualified Person
I, Mohammad Nourpour, 972 Berkley Rd., North Vancouver, B.C., Canada, am a co-author of this technical report entitled “NI 43-101 Mineral Resource Update Technical Report on the Guanajuato Mine Complex, Guanajuato and San Ignacio Operations, Guanajuato State, Mexico” prepared for Great Panther Mining Limited, dated December 22, 2020, with an effective date of July 31, 2020 (the “Technical Report”) and do hereby certify that;
| 1. | I am a graduate of the North Tehran University, Iran (1996) and hold a B. Sc. degree in Geology. |
| 2. | I am presently employed by Great Panther Mining Limited as Resource Geologist. |
| 3. | I have been employed in my profession by various companies since graduation in 1996. |
| 4. | I am a registered Professional Geoscientist with Association of Professional Engineers and Geoscientists of B.C. since 2019 (Membership #178066) |
| 5. | I have read the definitions of “Qualified Person” set out in National Instrument 43-101 Standards of Disclosure for Mineral Projects (“NI 43-101”) and certify that by reason of my education, affiliation with a professional association and past relevant work experience, I fulfil the requirements to be a “Qualified Person” for the purposes of NI 43-101. My relevant experience includes practice as a geologist in the fields of exploration, resource definition and estimation, and mining on different Great Panther Mining exploration and mining projects within Mexico and Peru. Previously, I worked on exploration projects in Canada. |
| 6. | I have visited the Guanajuato Mine Complex on numerous occasions since 2012, most recently from August 20th to 24th, 2019. |
| 7. | I am the author co-responsible for sections 11, 12, and 14 of this report. |
| 8. | To the best of my knowledge, information, and belief, as of the effective date of this Technical Report, this Technical Report contains all the scientific and technical information that is required to be disclosed to make this Technical Report not misleading. |
| 9. | I am not independent of Great Panther Mining Limited as defined in Section 1.5 of NI 43-101 by reason of my employment with Great Panther Mining Limited. |
| 10. | I have had prior involvement with the Guanajuato Mine Complex that is the subject of the Technical Report. I have been a co-author in previous technical reports prepared for Great Panther Mining Limited in respect of the Guanajuato Mine Complex entitled NI 43-101 Mineral Resource Update Technical Report on the Guanajuato Mine Complex, Guanajuato Mine, Guanajuato State, Mexico and NI 43-101 Mineral Resource Update Technical Report on the Guanajuato Mine Complex, San Ignacio Mine, Guanajuato State, Mexico. |
| 11. | I have read NI 43-101 and NI 43-101F1 and have prepared the sections of the Technical Report for which I am responsible in compliance with both that instrument and form. |
| 12. | I consent to the filing of the Technical Report with any stock exchange and other regulatory authority and any publication by them for regulatory purposes, including electronic publication in the public company files on their websites accessible by the public, of the Technical Report. |
Signed and sealed “Mohammad Nourpour”
_________________________________
Mohammad Nourpour, P. Geo., B.C.
DATED at Vancouver, British Columbia, this 22nd day of December 2020
| v | Page |
NI 43-101 Technical Report | December 22, 2020 |
Consent of Qualified Person
Pursuant to Section 8.3 of
National Instrument 43-101 Standards of Disclosure for Mineral Projects
| To: | British Columbia Securities Commission |
| Alberta Securities Commission | |
| Financial and Consumer Affairs Authority of Saskatchewan | |
| Manitoba Securities Commission | |
| Ontario Securities Commission | |
| Financial and Consumer Services Commission (New Brunswick) | |
| Nova Scotia Securities Commission | |
| Office of the Superintendent of Securities Office Newfoundland and Labrador | |
| Office of the Superintendent of Securities (Prince Edward Island) |
I, Robert F. Brown, P. Eng., consent to the public filing of the Technical Report, titled “NI 43-101 Mineral Resource Update Technical Report on the Guanajuato Mine Complex, Guanajuato and San Ignacio Operations, Guanajuato State, Mexico, and dated effective July 31, 2020” (the “Technical Report”) by Great Panther Mining Limited (the “Issuer”).
I also consent to the public filing by the Issuer of extracts from, or a summary of the Technical Report, in the news release issued by the Issuer on November 23, 2020 (the “News Release”). I certify that I have read the News Release filed by the Issuer and that it fairly and accurately represents the information in the Technical Report.
Signed on December 22, 2020.
Signed “Robert F. Brown”
____________________________
Robert F. Brown, P. Eng.
Association of Professional Engineers and Geoscientists of the Province of British Columbia
Qualified Person (QP) and Geological Consultant for Great Panther Mining Limited
| vi | Page |
NI 43-101 Technical Report | December 22, 2020 |
Consent of Qualified Person
Pursuant to Section 8.3 of
National Instrument 43-101 Standards of Disclosure for Mineral Projects
| To: | British Columbia Securities Commission |
| Alberta Securities Commission | |
| Financial and Consumer Affairs Authority of Saskatchewan | |
| Manitoba Securities Commission | |
| Ontario Securities Commission | |
| Financial and Consumer Services Commission (New Brunswick) | |
| Nova Scotia Securities Commission | |
| Office of the Superintendent of Securities Office Newfoundland and Labrador | |
| Office of the Superintendent of Securities (Prince Edward Island) |
I, Mohammad Nourpour, P. Geo., consent to the public filing of the Technical Report, titled “NI43-101 Mineral Resource Update Technical Report on the Guanajuato Mine Complex, Guanajuato and San Ignacio Operations, Guanajuato State, Mexico”, and dated effective July 31, 2020” (the “Technical Report”) by Great Panther Mining Limited (the “Issuer”).
I also consent to the public filing by the Issuer of extracts from, or a summary of the Technical Report, in the news release issued by the Issuer on November 23, 2020 (the “News Release”). I certify that I have read the News Release filed by the Issuer and that it fairly and accurately represents the information in the Technical Report.
Signed on December 22, 2020.
Signed “Mohammad Nourpour”
_______________________________
Mohammad Nourpour, P. Geo.
Association of Professional Engineers and Geoscientists of the Province of British Columbia
Qualified Person (QP) and Geologist for Great Panther Mining Limited
| vii | Page |
NI 43-101 Technical Report | December 22, 2020 |
Table of Contents
| TITLE PAGE | II | ||||
| DATE & SIGNATURE PAGE | III | ||||
| CERTIFICATE OF QUALIFIED PERSON | IV | ||||
| CERTIFICATE OF QUALIFIED PERSON | V | ||||
| CONSENT OF QUALIFIED PERSON | VI | ||||
| CONSENT OF QUALIFIED PERSON | VII | ||||
| TABLE OF CONTENTS | VIII | ||||
| TABLES | XIII | ||||
| FIGURES | XIV | ||||
| GLOSSARY | XVI | ||||
| 1.0 | SUMMARY | 1 | |||
| 1.1 | Project Description & Location | 2 | |||
| 1.2 | Geology & Mineralization | 2 | |||
| 1.2.1 | Guanajuato | 3 | |||
| 1.2.2 | San Ignacio | 4 | |||
| 1.3 | Exploration Status | 4 | |||
| 1.3.1 | Guanajuato | 4 | |||
| 1.3.2 | San Ignacio | 5 | |||
| 1.4 | Development & Operations Status | 5 | |||
| 1.4.1 | Guanajuato | 5 | |||
| 1.4.2 | San Ignacio | 5 | |||
| 1.5 | Mineral Processing & Recovery Methods | 5 | |||
| 1.6 | Mineral Resource Estimate | 6 | |||
| 1.6.1 | Guanajuato | 7 | |||
| 1.6.2 | San Ignacio | 7 | |||
| 1.7 | Cautionary Note Regarding Absence of Mineral Reserve Estimates | 8 | |||
| 1.8 | Permitting & Environmental Conditions | 8 | |||
| 1.9 | Conclusions | 9 | |||
| 1.9.1 | Guanajuato | 9 | |||
| 1.9.2 | San Ignacio | 9 | |||
| 1.10 | Recommendations | 10 | |||
| 2.0 | INTRODUCTION | 12 | |||
| 2.1 | Terms of Reference | 12 | |||
| 2.2 | Effective Date | 12 | |||
| 2.3 | Sources of Information | 12 | |||
| 2.4 | Qualified Persons & Current Personal Inspection | 13 | |||
| 2.5 | Language, Currency, & Measurement Standards | 13 | |||
| 3.0 | RELIANCE ON OTHER EXPERTS | 14 | |||
| 3.1 | Legal Status & Mineral Tenure | 14 | |||
| 3.2 | Environmental Matters | 14 | |||
| 4.0 | PROPERTY DESCRIPTION & LOCATION | 15 | |||
| 4.1 | Description & Location | 15 | |||
| 4.2 | Mineral Tenure | 15 | |||
| 4.3 | Surface Rights | 18 | |||
| 4.4 | Agreements & Encumbrances | 19 | |||
| 4.5 | Mining Royalties & Taxes | 19 | |||
| 4.6 | Environmental Liabilities | 19 | |||
| 4.7 | Permitting | 19 | |||
| 4.8 | Other Significant Factors & Risks that May Affect Access, Title, or the Right or Ability to Perform Work on the Property | 20 | |||
| viii | Page |
NI 43-101 Technical Report | December 22, 2020 |
| 5.0 | ACCESSIBILITY, CLIMATE, LOCAL RESOURCES, INFRASTRUCTURE, & PHYSIOGRAPHY | 21 | |||
| 5.1 | Accessibility | 21 | |||
| 5.2 | Climate | 21 | |||
| 5.3 | Local Resources & Infrastructure | 22 | |||
| 5.4 | Physiography | 22 | |||
| 6.0 | HISTORY | 23 | |||
| 6.1 | Ownership & Development History | 23 | |||
| 6.1.1 | Guanajuato | 23 | |||
| 6.1.2 | San Ignacio | 23 | |||
| 6.2 | Exploration | 24 | |||
| 6.2.1 | Guanajuato | 24 | |||
| 6.2.2 | San Ignacio | 24 | |||
| 6.3 | Historical Mineral Resource & Reserve Statements | 25 | |||
| 6.4 | Production History | 26 | |||
| 6.4.1 | San Ignacio | 27 | |||
| 7.0 | GEOLOGICAL SETTING AND MINERALIZATION | 28 | |||
| 7.1 | Regional Geology | 28 | |||
| 7.2 | Local & Property Geology | 29 | |||
| 7.2.1 | Guanajuato | 30 | |||
| 7.2.2 | San Ignacio | 31 | |||
| 7.3 | Mineralization | 33 | |||
| 7.3.1 | Guanajuato | 33 | |||
| 7.3.1.1 | Guanajuatito Veins | 33 | |||
| 7.3.1.2 | Valenciana Veins | 34 | |||
| 7.3.1.3 | Cata Veins | 34 | |||
| 7.3.1.4 | Los Pozos Veins | 34 | |||
| 7.3.1.5 | Santa Margarita Veins | 34 | |||
| 7.3.1.6 | San Cayetano Veins | 34 | |||
| 7.3.1.7 | Promontorio Veins | 34 | |||
| 7.3.2 | San Ignacio | 41 | |||
| 7.3.2.1 | Melladito veins | 44 | |||
| 7.3.2.2 | Intermediate veins | 44 | |||
| 7.3.2.3 | Nombre de Dios veins | 44 | |||
| 7.3.2.4 | Purisima veins | 45 | |||
| 8.0 | DEPOSIT TYPE | 46 | |||
| 9.0 | EXPLORATION | 47 | |||
| 9.1 | Summary of Non-Drilling Exploration Activity | 47 | |||
| 9.1.1 | Guanajuato | 47 | |||
| 9.1.2 | San Ignacio | 47 | |||
| 10.0 | DRILLING | 51 | |||
| 10.1 | Drilling Summary | 51 | |||
| 10.1.1 | Guanajuato | 51 | |||
| 10.1.2 | San Ignacio | 53 | |||
| 10.2 | Drilling Procedures & Methodology | 56 | |||
| 10.2.1 | Drilling Methodology | 56 | |||
| 10.2.1.1 | Guanajuato | 56 | |||
| 10.2.1.2 | San Ignacio | 56 | |||
| 10.2.2 | Core Handling & Visual Logging | 56 | |||
| 10.3 | Drilling Results & Interpretation | 57 | |||
| 10.3.1 | Guanajuato | 57 | |||
| 10.3.2 | San Ignacio | 58 | |||
| 10.4 | Drilling Factors Impacting Accuracy & Reliability of Results | 58 | |||
| 11.0 | SAMPLING METHODOLOGY & PROCEDURES | 63 | |||
| 11.1 | Drill Core Sampling | 63 | |||
| 11.2 | Channel Sampling Procedures | 63 | |||
| ix | Page |
NI 43-101 Technical Report | December 22, 2020 |
| 11.3 | Sample Preparation, Analytical Methodology, & Procedures | 63 | |||
| 11.3.1 | Analytical Laboratory | 63 | |||
| 11.3.2 | Density Determination | 64 | |||
| 11.4 | Sample Security | 64 | |||
| 11.5 | Quality Assurance & Quality Control Methodology & Procedures | 64 | |||
| 11.5.1 | Blanks | 65 | |||
| 11.5.2 | Standards | 66 | |||
| 11.5.3 | Duplicates | 76 | |||
| 11.5.4 | Umpire Checks | 77 | |||
| 11.6 | Qualified Persons Statement on Sampling, Analysis, & Quality Control | 78 | |||
| 12.0 | DATA VERIFICATION | 79 | |||
| 12.1 | Data Verification Procedures | 79 | |||
| 12.2 | Limitations of Data Verification | 79 | |||
| 12.3 | Qualified Persons Statement on Data Verification | 79 | |||
| 13.0 | MINERAL PROCESSING AND METALLURGICAL TESTING | 80 | |||
| 14.0 | MINERAL RESOURCE ESTIMATES | 81 | |||
| 14.1 | Introduction | 81 | |||
| 14.1.1 | Definition of Mineral Resource Estimates | 81 | |||
| 14.2 | Geological Database | 82 | |||
| 14.2.1 | Guanajuato | 82 | |||
| 14.2.2 | San Ignacio | 82 | |||
| 14.3 | Geological Interpretation | 82 | |||
| 14.3.1 | Topography & Underground Workings | 82 | |||
| 14.3.2 | Geological Modelling Domains | 82 | |||
| 14.3.2.1 | Guanajuato | 83 | |||
| 14.3.2.2 | San Ignacio | 83 | |||
| 14.3.3 | Assay Composites & Descriptive Statistics | 84 | |||
| 14.3.3.1 | Guanajuato | 84 | |||
| 14.3.3.2 | San Ignacio | 89 | |||
| 14.3.4 | Outliers (High Grade Capping of Assay Composite) | 91 | |||
| 14.3.4.1 | Guanajuato | 91 | |||
| 14.3.4.2 | San Ignacio | 93 | |||
| 14.4 | Mineral Resource Estimation | 95 | |||
| 14.4.1 | Block Model Parameters | 95 | |||
| 14.4.2 | Grade Variography | 96 | |||
| 14.4.2.1 | Guanajuato | 96 | |||
| 14.4.2.2 | San Ignacio | 96 | |||
| 14.4.3 | Estimation Methodology (Grade Interpolation) | 96 | |||
| 14.4.3.1 | Guanajuato | 97 | |||
| 14.4.3.2 | San Ignacio | 97 | |||
| 14.4.4 | Core Recovery and RQD | 97 | |||
| 14.4.4.1 | Guanajuato | 97 | |||
| 14.4.4.2 | San Ignacio | 97 | |||
| 14.4.5 | Density | 98 | |||
| 14.4.5.1 | Guanajuato | 98 | |||
| 14.4.5.2 | San Ignacio | 99 | |||
| 14.5 | Mineral Resource Classification | 99 | |||
| 14.6 | Block Model Validation | 99 | |||
| 14.6.1 | Visual Inspection | 99 | |||
| 14.6.2 | Comparison to Means | 100 | |||
| 14.6.2.1 | Guanajuato | 100 | |||
| 14.6.2.2 | San Ignacio | 100 | |||
| 14.7 | Cut-Off Grade | 101 | |||
| 14.8 | Statement of Mineral Resources | 102 | |||
| 14.8.1 | Guanajuato | 102 | |||
| 14.8.2 | San Ignacio | 104 | |||
| 14.9 | Comparison with Previous Mineral Resource Estimates | 106 | |||
| x | Page |
NI 43-101 Technical Report | December 22, 2020 |
| 14.9.1 | Guanajuato | 106 | |||
| 14.9.2 | San Ignacio | 107 | |||
| 14.10 | Reconciliation | 107 | |||
| 14.10.1 | Guanajuato | 107 | |||
| 14.10.2 | San Ignacio | 107 | |||
| 15.0 | MINERAL RESERVE ESTIMATES | 109 | |||
| 16.0 | MINING METHODS | 110 | |||
| 16.1 | Cut and Fill Mining Method | 110 | |||
| 16.1.1 | Guanajuato | 111 | |||
| 16.1.1.1 | Guanajuatito Zone | 111 | |||
| 16.1.1.2 | Valenciana Zone | 111 | |||
| 16.1.1.3 | Cata Zone | 111 | |||
| 16.1.1.4 | Los Pozos Zone | 112 | |||
| 16.1.1.5 | Santa Margarita Zone | 112 | |||
| 16.1.1.6 | San Cayetano Zone | 112 | |||
| 16.1.1.7 | Promontorio Zone | 112 | |||
| 16.1.2 | San Ignacio | 112 | |||
| 17.0 | RECOVERY METHODS | 124 | |||
| 17.1 | Ore Processing Description | 124 | |||
| 17.1.1 | Crushing & Grinding Circuits | 124 | |||
| 17.1.2 | Milling | 125 | |||
| 17.1.3 | Flotation Circuits | 125 | |||
| 17.1.4 | Thickening & Filtration | 125 | |||
| 17.1.5 | Production History | 126 | |||
| 17.2 | Metallurgical Tests Summary | 126 | |||
| 18.0 | PROJECT INFRASTRUCTURE | 129 | |||
| 18.1 | Guanajuato | 129 | |||
| 18.2 | San Ignacio | 129 | |||
| 19.0 | MARKET STUDIES & CONTRACTS | 130 | |||
| 19.1 | Market Studies | 130 | |||
| 19.2 | Contracts | 130 | |||
| 19.2.1 | Guanajuato | 130 | |||
| 19.2.2 | San Ignacio | 130 | |||
| 20.0 | ENVIRONMENTAL STUDIES, PERMITTING, & SOCIAL OR COMMUNITY IMPACT | 131 | |||
| 20.1 | Environmental Regulatory Framework in Mexico | 131 | |||
| 20.2 | Environmental Studies & Permits | 132 | |||
| 20.2.1 | Exploration | 132 | |||
| 20.2.2 | Mining & Mineral Processing | 133 | |||
| 20.2.3 | Mine Tails Disposal | 134 | |||
| 20.2.4 | Mine Closure | 135 | |||
| 20.3 | Social & Community Factors | 135 | |||
| 21.0 | CAPITAL AND OPERATING COSTS | 136 | |||
| 22.0 | ECONOMIC ANALYSIS | 137 | |||
| 23.0 | ADJACENT PROPERTIES | 138 | |||
| 24.0 | OTHER RELEVANT DATA AND INFORMATION | 139 | |||
| 24.1 | Cautionary Statement on Forward-Looking Statements | 139 | |||
| 24.2 | Cautionary Note to United States Investors Concerning Estimates of Measured, Indicated and Inferred Resources | 143 | |||
| 25.0 | INTERPRETATION AND CONCLUSIONS | 145 | |||
| 25.1 | Guanajuato | 145 | |||
| 25.2 | San Ignacio | 146 | |||
| xi | Page |
NI 43-101 Technical Report | December 22, 2020 |
| 26.0 | RECOMMENDATIONS | 148 | |||
| 27.0 | REFERENCES | 149 | |||
| 28.0 | OTHER RELEVANT DOCUMENTS | 152 | |||
| xii | Page |
NI 43-101 Technical Report | December 22, 2020 |
Tables
| Table 1.1: | Total Great Panther drilling at Guanajuato and San Ignacio | 4 |
| Table 1.2: | Summary of Mineral Resource Estimate 2020, GMC (Guanajuato and San Ignacio) | 7 |
| Table 1.3: | Summary of Mineral Resource Estimate 2020, Guanajuato | 7 |
| Table 1.4: | Summary of Mineral Resource Estimate 2020, San Ignacio | 8 |
| Table 1.5: | 2020-2021 Budget for Proposed Exploration, GMC (San Ignacio and Guanajuato) | 11 |
| Table 4.1: | Mineral Concessions that comprise the Great Panther holdings at the GMC | 16 |
| Table 6.1: | Summary of Great Panther drilling at Guanajuato & San Ignacio | 24 |
| Table 6.2: | Historical Mineral Resources & Reserve Estimates, Guanajuato | 25 |
| Table 6.3: | Historical Mineral Resources & Reserve Estimates, San Ignacio | 26 |
| Table 6.4: | Production Summary, GMC | 26 |
| Table 6.5: | Production Summary, San Ignacio | 27 |
| Table 10.1: | Drilling per year, Guanajuato | 59 |
| Table 10.2: | Drilling per year, San Ignacio | 62 |
| Table 11.1: | Blanks outside QA/QC accepted parameters | 65 |
| Table 11.2: | Expected values for the GMC Standards used for QA/QC | 67 |
| Table 11.3: | Standard sample results outside 3 standard deviations, U/G sampling | 68 |
| Table 11.4: | Standard sample results outside 3 standard deviations, DDH sampling | 68 |
| Table 14.1: | Vein and vein orientation, Guanajuato | 83 |
| Table 14.2: | Vein and vein orientation, San Ignacio | 84 |
| Table 14.3: | DDH sample statistics by area, Guanajuato | 84 |
| Table 14.4: | U/G sample statistics by area, Guanajuato | 85 |
| Table 14.5: | Descriptive statistics of composited silver grade by domain, Guanajuato | 86 |
| Table 14.6: | Descriptive statistics of composited gold grade by domain, Guanajuato | 87 |
| Table 14.7: | Descriptive statistics of Ag grade grouped by domain, San Ignacio | 89 |
| Table 14.8: | Descriptive statistics of Au grade grouped by domain, San Ignacio | 90 |
| Table 14.9: | Drill hole assay capping, Guanajuato | 91 |
| Table 14.10: | U/G sample assay capping, Guanajuato | 92 |
| Table 14.11: | Capping levels for Ag and Au grouped by domain, San Ignacio | 93 |
| Table 14.12: | Descriptive statistics of composited Ag grade by domain, San Ignacio | 94 |
| Table 14.13: | Descriptive statistics of composited Au grade by domain, San Ignacio | 94 |
| Table 14.14: | Size and extent of block models, Guanajuato | 95 |
| Table 14.15: | Size and extent of block models, San Ignacio | 95 |
| Table 14.16: | Recovery and RQD by area, Guanajuato | 97 |
| Table 14.17: | Recovery and RQD by area, San Ignacio | 98 |
| Table 14.18: | Bulk density grouped by area, Guanajauato | 98 |
| Table 14.19: | Bulk density grouped by vein, San Ignacio | 99 |
| Table 14.20: | Comparison of block and all DDH samples, Guanajuato | 100 |
| Table 14.21: | Comparison of block and all U/G samples, Guanajuato | 100 |
| Table 14.22: | Comparing block grade vs DDH samples, San Ignacio | 100 |
| Table 14.23: | Comparing block grade vs U/G samples, San Ignacio | 101 |
| Table 14.24: | GMC Full operating cost cut-off by area | 101 |
| Table 14.25: | GMC Mineral Resource Estimate, Highlights | 102 |
| Table 14.26: | Mineral Resources Estimate as of July 31, 2020, Guanajuato (Highlights) | 103 |
| Table 14.27: | Mineral Resources Estimate as of July 31, 2020, Guanajuato | 103 |
| Table 14.28: | Mineral Resource Estimate 2020, San Ignacio (Highlights) | 104 |
| Table 14.29: | Mineral Resource Estimate 2020, San Ignacio | 104 |
| Table 14.30: | Comparison of 2019 to 2020 Mineral Resources, Guanajuato | 106 |
| Table 14.31: | Comparison of 2019 to 2020 Mineral Resources, San Ignacio | 107 |
| Table 14.32: | Reconciliation of block model to production, San Ignacio | 108 |
| Table 16.1: | GMC production as of July 31, 2020 | 110 |
| Table 17.1: | GMC production as of July 31, 2020 | 126 |
| Table 17.2: | 2015 metallurgical test summary | 126 |
| Table 20.1: | Summary of permits in place for the GMC | 133 |
| Table 20.2: | Monitoring activities in place at the GMC | 134 |
| Table 21.1: | Planned variable and fixed costs per tonne milled (US$) | 136 |
| Table 26.1: | 2020-2021 Budget for Proposed Exploration, GMC (San Ignacio and Guanajuato) | 148 |
| xiii | Page |
NI 43-101 Technical Report | December 22, 2020 |
Figures
| Figure 1.1: | Project Location | 2 |
| Figure 1.2: | Regional Geology Map | 3 |
| Figure 4.1: | Project Location Map | 15 |
| Figure 4.2: | GMC Mineral Concession groups | 17 |
| Figure 4.3: | Mineral Concessions, Guanajuato | 17 |
| Figure 4.4: | Mineral Concessions, San Ignacio | 18 |
| Figure 4.5: | Surface rights and tailings disposal location | 19 |
| Figure 5.1: | Regional access for the GMC | 21 |
| Figure 5.2: | Historical Guanajuato City climate data | 22 |
| Figure 7.1: | Guanajuato regional geology | 29 |
| Figure 7.2: | Local geology, Guanajuato | 30 |
| Figure 7.3: | Long section along the plane of the Veta Madre, Guanajuato | 31 |
| Figure 7.4: | Local geology, San Ignacio | 32 |
| Figure 7.5: | Guanajuato mineralization interpretation and zones, plan view | 35 |
| Figure 7.6: | Guanajuato mineralization interpretation and zones, longitudinal view | 35 |
| Figure 7.7: | Geology and mineralization, section view 2925N, Guanajuatito area | 36 |
| Figure 7.8: | 3D model of mineralization and U/G workings, Guanajuatito area | 36 |
| Figure 7.9: | Geology and mineralization, section view 2150N, Valenciana area | 37 |
| Figure 7.10: | 3D model of mineralization and U/G workings, Valenciana area | 37 |
| Figure 7.11: | Geology and mineralization, section view 600N, Cata area | 38 |
| Figure 7.12: | 3D model of mineralization model and U/G workings, Cata area | 38 |
| Figure 7.13: | Geology and mineralization, section view 175N, Los Pozos area | 39 |
| Figure 7.14: | 3D model of mineralization model and U/G workings, Los Pozos area | 39 |
| Figure 7.15: | Geology and mineralization, section view 75S, Santa Margarita & San Cayetano areas | 40 |
| Figure 7.16: | 3D model of mineralization model and U/G workings, Santa Margarita & San Cayetano areas | 40 |
| Figure 7.17: | Geology and mineralization, section view 450S, Promontorio area | 41 |
| Figure 7.18: | 3D model of mineralization model and U/G workings, Promontorio area | 41 |
| Figure 7.19: | 3D model of mineralization and U/G workings, San Ignacio | 42 |
| Figure 7.20: | Mine access and Melladito, Intermediate & Nombre de Dios veins, cross section 450N, San Ignacio | 43 |
| Figure 7.21: | Nombre de Dios 2N vein, cross section 1000N, San Ignacio | 43 |
| Figure 7.22: | Purisima & Melladito South veins, cross section 450S, San Ignacio | 44 |
| Figure 9.1: | Guanajuato U/G exploration sampling, plan view | 49 |
| Figure 9.2: | Guanajuato U/G exploration sampling, longitudinal view | 49 |
| Figure 9.3: | San Ignacio exploration surface and short adit sampling activity | 50 |
| Figure 10.1: | Guanajuato drilling activity, plan view | 52 |
| Figure 10.2: | Guanajuato drilling activity, longitutidinal view | 52 |
| Figure 10.3: | San Ignacio drilling activity, plan view | 54 |
| Figure 10.4: | San Ignacio drilling activity, longitudinal view A-A’ | 55 |
| Figure 10.5: | San Ignacio drilling activitiy, longitudinal view B-B’ | 55 |
| Figure 11.1: | Ag assays of “Blank” material, U/G sampling | 65 |
| Figure 11.2: | Au assays of “Blank” material, U/G sampling | 66 |
| Figure 11.3: | Ag assays of “Blank” material, DDH sampling | 66 |
| Figure 11.4: | Au assays of “Blank” material, DDH sampling | 66 |
| Figure 11.5: | Ag assays of Standard “GTS10”, U/G sampling | 69 |
| Figure 11.6: | Au assays of Standard “GTS10”, U/G sampling | 69 |
| Figure 11.7: | Ag assays of Standard “GTS11”, U/G sampling | 69 |
| Figure 11.8: | Au assays of Standard “GTS11”, U/G sampling | 69 |
| Figure 11.9: | Ag assays of Standard “GTS12”, U/G sampling | 70 |
| Figure 11.10: | Au assays of Standard “GTS12”, U/G sampling | 70 |
| Figure 11.11: | Ag assays of Standard “GTS13”, U/G sampling | 70 |
| Figure 11.12: | Au assays of Standard “GTS13”, U/G sampling | 70 |
| Figure 11.13: | Ag assays of Standard "GTS14", U/G sampling | 71 |
| Figure 11.14: | Au assays of Standard "GTS14", U/G sampling | 71 |
| Figure 11.15: | Ag assays of Standard "GTS15", U/G sampling | 71 |
| Figure 11.16: | Au assays of Standard "GTS15", U/G sampling | 71 |
| Figure 11.17: | Ag assays of Standard “GTS17”, U/G sampling | 72 |
| xiv | Page |
NI 43-101 Technical Report | December 22, 2020 |
| Figure 11.18: | Au assays of Standard “GTS17”, U/G sampling | 72 |
| Figure 11.19: | Ag assays of Standard “GTS10”, DDH sampling | 72 |
| Figure 11.20: | Au assays of Standard “GTS10”, DDH sampling | 72 |
| Figure 11.21: | Ag assays of Standard “GTS11”, DDH sampling | 73 |
| Figure 11.22: | Au assays of Standard “GTS11”, DDH sampling | 73 |
| Figure 11.23: | Ag assays of Standard “GTS12”, DDH sampling | 73 |
| Figure 11.24: | Au assays of Standard “GTS12”, DDH sampling | 73 |
| Figure 11.25: | Ag assays of Standard “GTS13”, DDH sampling | 74 |
| Figure 11.26: | Au assays of Standard “GTS13”, DDH sampling | 74 |
| Figure 11.27: | Ag assays of Standard “GTS14”, DDH sampling | 74 |
| Figure 11.28: | Au assays of Standard “GTS14”, DDH sampling | 74 |
| Figure 11.29: | Ag assays of Standard “GTS15”, DDH sampling | 75 |
| Figure 11.30: | Au assays of Standard “GTS15”, DDH sampling | 75 |
| Figure 11.31: | Ag assays of Standard “GTS16”, DDH sampling | 75 |
| Figure 11.32: | Au assays of Standard "GTS16", DDH sampling | 75 |
| Figure 11.33: | Ag assays of Standard "GTS17", DDH sampling | 76 |
| Figure 11.34: | Au assays of Standard "GTS17", DDH sampling | 76 |
| Figure 11.35: | Ag analysis of duplicate-original pair results in U/G sample batches | 76 |
| Figure 11.36: | Au analysis of duplicate-original pair results in U/G sample batches | 77 |
| Figure 11.37: | Ag analysis of duplicate-original pair results in DDH sample batches | 77 |
| Figure 11.38: | Au analysis of duplicate-original pair results in DDH sample batches | 77 |
| Figure 11.39: | Ag lab result sample correlation, DDH sampling | 78 |
| Figure 11.40: | Au lab result sample correlation, DDH sampling | 78 |
| Figure 14.1: | Histogram of channel sample length, Guanajuato | 89 |
| Figure 14.2: | Histogram of drill hole sample length, Guanajuato | 89 |
| Figure 14.3: | Histogram of channel sample length, San Ignacio | 91 |
| Figure 14.4: | Histogram of drill hole sample length, San Ignacio | 91 |
| Figure 16.1: | Development and Mineral Resource in the Guanajuatito zone, section view 2925N | 114 |
| Figure 16.2: | Development and Mineral Resource in the Guanajuatito zone, plan view | 114 |
| Figure 16.3: | Development and Mineral Resource in the Valenciana zone, section view 2150N | 115 |
| Figure 16.4: | Development and Mineral Resource in the Valenciana zone, plan view | 115 |
| Figure 16.5: | Development and Mineral Resource in the Cata zone, section view 600N | 116 |
| Figure 16.6: | Development and Mineral Resource in the Cata zone, plan view | 116 |
| Figure 16.7: | Development and Mineral Resource in the Los Pozos zone, section view 175N | 117 |
| Figure 16.8: | Development and Mineral Resource in the Los Pozos zone, plan view | 117 |
| Figure 16.9: | Development and Mineral Resource in the Santa Margarita and San Cayetano zones, section view 75S | 118 |
| Figure 16.10: | Development and Mineral Resource in the Santa Margarita and San Cayetano zones, plan view | 118 |
| Figure 16.11: | Development and Mineral Resource in the Promontorio zone, section view 450S | 119 |
| Figure 16.12: | Development and Mineral Resource in the Promontorio, plan view | 119 |
| Figure 16.13: | Mine development along Melladito, Intermediate & Nombre de Dios structures, cross section 450N | 120 |
| Figure 16.14: | Mine development along Nombre de Dios 2N structure, cross section 1000N | 120 |
| Figure 16.15: | Mine development along Purisima & Melladito South structures, cross section 450S | 121 |
| Figure 16.16: | Mine development and veins along 2275masl, northern plan view | 122 |
| Figure 16.17: | Mine development and veins along 2175masl, southern plan view | 123 |
| Figure 17.1: | Process flow sheet, GMC metallurgical plant | 124 |
| xv | Page |
NI 43-101 Technical Report | December 22, 2020 |
Glossary
| Abbreviation | Description | Abbreviation | Description |
| % | Percent | km² | Square Kilometer |
| ° | Degrees (Azimuth or Dip) | kt | Kilotonnes |
| °C | Degrees Celsius | lb | Pound |
| 3D | Three Dimensional | m | Meter |
| Ag | Silver | Ma | Million years ago |
| Ag eq | Silver Equivalent | masl | Meters Above Sea Level |
| APGO | Association of Professional Geoscientists of Ontario | m² | Square meter |
| AAS | Atomic Absorption Spectography | m³ | Cubed meter |
| As | Arsenic | mm | Millimeter |
| AsPy | Arsenopyrite | m/s | Meters per Second |
| Au | Gold | MFW | MFW Geoscience Inc |
| Au eq | Gold Equivalent | MMR | Minera Mexicana El Rosario, S.A. de C.V. |
| BQ | 36.5 mm diameter drill core | Mt | Million Tonnes |
| cm | Centimeter | MVS | Minera Villa Seca S.A. de C.V. |
| C&M | Care and Maintenance | NI 43-101 | National Instrument 43-101 |
| CIM | Canadian Institute of Mining Metallurgy and Petroleum | NI 43-101CP | National Instrument 43-101 Companion Policy |
| CIMDS | Canadian Institute of Mining Metallurgy and Petroleum Definitions Standards | NI 43-101F1 | National Instrument 43-101 Form 1 - Technical Report |
| CRM’s | Certified Reference Material Standards | NQ | 47.6 mm diameter drill core |
| CV | Coefficient of variation | NSR | Net Smelter Return |
| DDH | Drill hole | NW | Northwest |
| DEM | Digital Elevation Models | oz | Ounce |
| DSM | Digital Surface Model | P. Geo. | Professional Geologist |
| EIA | Environmental Impact Assessment | PROM | Promontorio |
| et al. | and Others | Py | Pyrite |
| ft | Foot | QA/QC | Quality Assurance/Quality Control |
| FW | Foot wall | Qtz | Quartz |
| g/cm³ | Grams per Cubic Centimeter | ROM | Run of mine |
| g/t | Grams per Tonne | RQD | Rock Quality Designation |
| GPS | Global Positioning System | SC | San Cayetano |
| Great Panther | Great Panther Mining Limited | SE | Southeast |
| GMC | Guanajuato Mine Complex | SG | Specific Gravity |
| GTTO | Guanajuatito | SM | Santa Margarita |
| Ha | Hectares | Std Dev | Standard Deviation |
| HQ | 63.5 mm diameter drill core | t | Tonnes |
| HW | Hanging wall | t/m³ | Tonnes per cubic meter |
| ICP-OES analysis | Inductively Coupled Plasma Atomic Emission Spectroscopy analysis | tpd | Tonnes per day |
| ID2 | Inverse Distance Squared | tpm | Tonnes per month |
| ID3 | Inverse Distance Cubed | TR | Technical Report |
| INEGI | Instituto Nacional de Estadistica y Geografia | U/G | Underground |
| INT | Intermediate | US$ | USA Dollar |
| IP | Induced Polarization Survey | UTM | Universal Transverse Mercator |
| km | Kilometer | VAL | Valenciana |
| VM | Veta Madre | ||
| wt.% | Weight Percent | ||
| WGS84 | World Geodetic System 1984 |
| xvi | Page |
NI 43-101 Technical Report | December 22, 2020 |
| 1.0 | Summary |
This is a brief summary of important information in this Technical Report (“TR” or “report”) entitled “NI 43-101 Mineral Resource Update Technical Report on the Guanajuato Mine Complex, Guanajuato and San Ignacio Operations, Guanajuato State, Mexico”, prepared for Great Panther Mining Limited (“Great Panther” or the “Company”) including property description and ownership, geology and mineralization, the status of exploration, project development, mineral resource estimates, and the qualified person’s conclusions and recommendations.
The purpose of this TR is to support Great Panther’s public disclosure related to the Guanajuato Mine Complex Mineral Resource Estimate. The Guanajuato Mine Complex is in Guanajuato State, Mexico and comprised of the Guanajuato and San Ignacio operations, the GMC processing plant, associated infrastructure, and the exploration projects El Horcon and Santa Rosa. This TR conforms to National Instrument 43-101 Standards of Disclosure for Mineral Projects (“NI 43-101”) and, as Great Panther is a producing issuer as defined in NI 43-101, this report and the Mineral Resource Estimates for the deposits were completed by company personnel. The Company owns a 100% interest in the claims through Great Panther’s wholly owned Mexican subsidiary, Minera Mexicana el Rosario SA de CV (“MMR”).
Robert F. Brown, P. Eng., Geological Consultant and Mohammad Nourpour, P. Geo., Geologist for Great Panther supervised the preparation of the Mineral Resource Estimate, included herein for the GMC.
Great Panther is a publicly traded company listed on the Toronto Stock Exchange and on the New York Stock Exchange (“NYSE”) American, engaged in the exploration, development, and production of mineral properties. It is primarily a gold (“Au”) and silver (“Ag”) producing company with operating mines in Brazil, including Tucano (Au), and Mexico, including the GMC (Ag, Au) in the state of Guanajuato, and Topia (Ag, Au, lead (“Pb”) and zinc (“Zn”)) located in the state of Durango.
This TR was prepared by the Qualified Persons in accordance with the following documents published by the Canadian securities’ regulatory authorities:
| ¢ | NI 43-101: Standards of Disclosure for Mineral Projects (effective date May 9, 2016). |
| ¢ | NI 43-101 Companion Policy (NI 43-101CP): Standards of Disclosure for Mineral Projects (effective date February 25, 2016). |
| ¢ | Form NI 43-101F1: TR (effective date June 30, 2011). |
| ¢ | Canadian Institute of Mining, Metallurgy, and Petroleum (CIM): Estimation of Mineral Resources and Mineral Reserves Best Practice Guidelines (November 2019). |
| ¢ | CIM Definitions Standards (May 2014). |
This TR includes statements and information about expectations for the future that are not historical facts. In this TR when we discuss the strategy, opportunities, projections, plans and future financial and operating performance of the GMC, or other things that have not yet taken place, we are making statements considered to be forward-looking information or forward-looking statements under Canadian and US securities laws. We refer to them in this TR as forward-looking statements. Forward-looking statements reflect the current expectations and assumptions and are subject to a number of known and unknown risks, uncertainties and other factors, which may cause the actual results, performance or achievements to be materially different from any anticipated future results, performance or achievements expressed or implied by the forward-looking statements. See Section 24.0 for a discussion about the forward-looking statements included in this TR and the key assumptions upon which they are based and risks and uncertainties associated with such forward-looking statements. For this reason, readers should read this summary solely in the context of the full TR, and after reading the TR in its entirety.
| Summary | 1 | Page |
NI 43-101 Technical Report | December 22, 2020 |
| 1.1 | Project Description & Location |
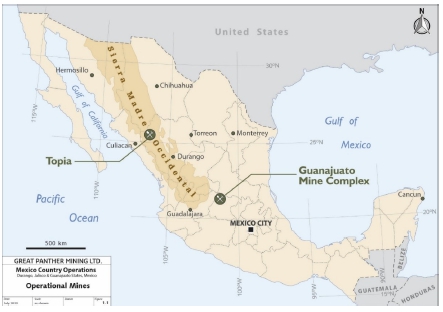
The GMC properties are situated north of the city of Guanajuato, Guanajuato State, Mexico, approximately 380 km northwest of Mexico City (Figure 1.1). The GMC claims total 10,355.39ha.
This report is an updated Mineral Resource Estimate building on former Mineral Resource Estimates for the GMC (Wunder, 2018; Brown, 2017; Brown, 2016; Brown, 2015), Guanajuato (Brown & Nourpour, 2020a; Brown & Sprigg, 2013), and San Ignacio (Brown & Nourpour, 2020b; Waldegger & Brown, 2014; Waldegger, 2012; Smith, 2011).
Presently, the GMC processing plant at Guanajuato processes mined mineralization from San Ignacio and Guanajuato operations. This report will document the results of new exploration, and mineral resource development.
Figure 1.1: Project Location
| 1.2 | Geology & Mineralization |
A map of the regional geology is presented in Figure 1.2.
| Summary | 2 | Page |
NI 43-101 Technical Report | December 22, 2020 |
Figure 1.2: Regional Geology Map
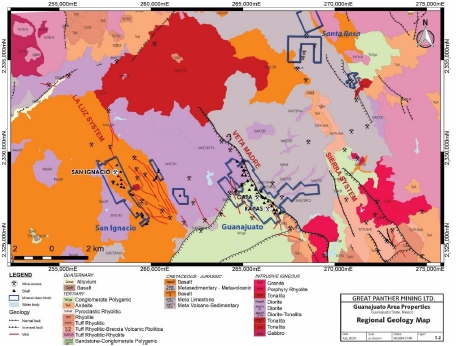
Source: modified from Servicio Geologico Mexicano, 1998. Carta Geologico-Minera, Guanajuato F14-C43, & Servicio Geologico Mexicano, 1999. Carta Geologico-Minera, Guanajuato F14-C42 1: 50,000 regional geology maps
1.2.1 Guanajuato
Guanajuato is in Guanajuato State, Mexico, and comprises two operating shafts and three ramps in the second largest (historically) producing silver district in Mexico. Silver-bearing mineralization was first discovered in 1548, and over the past 470 years more than one billion ounces of silver has been mined in the Guanajuato district. Great Panther acquired the property in 2005 and owns a 100% interest through MMR. The principal metals of interest are gold and silver. Mineralization occurs along regional scale faults, the largest of which is the Veta Madre with a strike length of 25 km. Mining is being conducted predominantly from four locations, Guanajuatito, Los Pozos, Valenciana, and Promontorio using cut and fill mining methods, with minor production from Promontorio, and pillar recovery from the Rayas area. Ore is milled at the mining facilities at the centrally located Cata plant with a 1,000tpd capacity.
Guanajuato lies within the central part of the Guanajuato Mining District, which is in the southern part of the Mesa Central physiographic province. The Mesa Central is an elevated plateau of Cenozoic volcanic and volcanoclastic rocks located in central Mexico. It is bounded to the north and east by the Sierra Madre Oriental, to the west by the Sierra Madre Occidental, and to the south by the Trans-Mexican Volcanic Belt. Faulted Tertiary age volcanic rocks are juxtaposed alongside Mesozoic basement stratigraphy, Tertiary intrusive units, and Quaternary conglomerates.
The strata in the area are transected by northwest, north, east-to-west, and northeast-trending regional scale faults. Normal fault movement along northeast-trending faults resulted in the downward displacement of certain blocks and the preservation of strata that was eroded in other areas. It is predominantly the northwest-trending structures that control the position of mineralization.
| Summary | 3 | Page |
NI 43-101 Technical Report | December 22, 2020 |
The Guanajuato mine consists of several deposits along an approximately 4.2 km strike length. The deposits on the Veta Madre trend, the principal host structure, have been mined since the 16th century.
1.2.2 San Ignacio
San Ignacio is underlain by a monotonous package of basalt and andesite volcanic rocks belonging to the lower Cretaceous La Luz andesite (Randall R. et al., 1994; Stewart, 2006; Baker, 2011). The basalt generally has subtle to well-developed pillow structures that are locally flattened. In a few localities, inter-pillow hyaloclastite is present and is characterized by a fine breccia composed of devitrified glass shards in a fine groundmass.
Locally, these volcanic rocks have interbeds composed of sandstone, siltstone, or fine, pale ash layers (generally sericite-quartz). A more coarse-grained felsic (possibly dacite) unit is exposed northwest of the San Jose mine in the southern part of the property. Where observed, bedding is generally shallowly dipping.
The mineralization on the property including the San Ignacio mine consists of epithermal silver-gold veins. Average silver grades of the sixteen veins range from 82g/t to 248g/t and the average gold grades from 1.80g/t to 3.39g/t.
| 1.3 | Exploration Status |
Table 1.1 summarizes the drilling completed by Great Panther at GMC.
Table 1.1: Total Great Panther drilling at Guanajuato and San Ignacio
| Year | GUANAJUATO | SAN IGNACIO | SUBTOTAL | |||
| No. of Drill Holes | Total Depth (m) | No. of Drill Holes | Total Depth (m) | No. of Drill Holes | Total Depth (m) | |
| 2005 | 8 | 1,567.3 | - | - | 8 | 1,567.3 |
| 2006 | 44 | 6,388.1 | - | - | 44 | 6,388.1 |
| 2007 | 65 | 10,148.0 | - | - | 65 | 10,148.0 |
| 2008 | 61 | 8,214.9 | - | - | 61 | 8,214.9 |
| 2009 | 32 | 1,559.4 | - | - | 32 | 1,559.4 |
| 2010 | 125 | 17,565.0 | 5 | 2,294.0 | 130 | 19,859.0 |
| 2011 | 157 | 22,343.4 | 56 | 16,878.5 | 213 | 39,221.9 |
| 2012 | 189 | 29,295.9 | 43 | 9,556.3 | 232 | 38,852.2 |
| 2013 | 159 | 26,253.3 | 13 | 1,143.7 | 172 | 27,397.0 |
| 2014 | 138 | 12,510.1 | 27 | 3,832.2 | 165 | 16,342.3 |
| 2015 | 109 | 12,339.0 | 34 | 4,739.4 | 143 | 17,078.4 |
| 2016 | 31 | 6,677.2 | 43 | 9,029.7 | 74 | 15,706.9 |
| 2017 | 77 | 13,696.8 | 102 | 22,165.0 | 179 | 35,861.8 |
| 2018 | 76 | 10,169.1 | 53 | 11,722.4 | 129 | 21,891.5 |
| 2019 | 123 | 8,792.70 | 75 | 10,721.20 | 198 | 19,513.90 |
| 20201 | 52 | 4,368.00 | 40 | 4,306.70 | 92 | 8,674.70 |
| Total | 1,446 | 191,888.20 | 491 | 96,389.10 | 1,937 | 288,277.30 |
Note:
| 1. | As of July 31, 2020 |
1.3.1 Guanajuato
Great Panther purchased the property in 2005 and recommenced underground operations and milling the following year. The Company has carried out exploration since the acquisition and continues to explore the property to date.
Exploration drilling is being carried out with the use of three contract underground drills. The three contract drills are focused on building mineral resource. New areas of Guanajuato are being targeted through the compilation of historical data and re-evaluation of all accessible mine areas using geological mapping and sampling. Drilling is being carried out at the Los Pozos, Valenciana, and Promontorio zones.
| Summary | 4 | Page |
NI 43-101 Technical Report | December 22, 2020 |
Great Panther had a 14,400-metre drill budget for Guanajuato in 2020. By July 31, 2020, a total of 4,368m of drilling were completed in 52 holes. The author is in full agreement with its focus and functionality.
1.3.2 San Ignacio
Great Panther has completed detailed surface mapping and outcrop rock chip sampling, including mapping, and sampling all accessible underground workings pre-2016. Exploration at San Ignacio since September 2017 has been by surface and underground drilling.
Great Panther has completed 491 diamond drill holes at the San Ignacio property. Drilling commenced in October 2010 and the last hole into the database was completed before July 31, 2020. Of these holes, 292 holes were drilled from surface and 199 from underground with drill holes typically oriented to intersect the mineralized veins at a high angle. A total of 54 additional drill holes have been completed at San Ignacio since the previous Mineral Resource estimate (Brown and Nourpour, 2020b).
| 1.4 | Development & Operations Status |
1.4.1 Guanajuato
Currently, the major facilities associated with the Guanajuato operation are:
| ¢ | Production prior to July 31, 2020 was at a rate of approximately 111 tonnes per operating day (August 1, 2019 to July 31, 2020) |
| ¢ | Extensive underground workings along 4.2km veins including five main shafts used for ventilation and access, levels, three access ramps, and internal shafts |
| ¢ | The operations at Guanajuato were suspended from April 2, 2020 through June 3, 2020 on account of the directive of the Mexican Federal Government to mitigate the spread of COVID-19. |
1.4.2 San Ignacio
In late November 2013, Great Panther commenced ramping and developing along the Intermediate and Melladito veins. New surface facilities, including roads, a mechanical shop, an electrical substation, diesel storage, waste dumps, and security facilities, have been built as part of the San Ignacio infrastructure.
Currently, the major facilities associated with the San Ignacio mine are:
| ¢ | An operating underground mine producing approximately at a rate of 668 tonnes per operating day from August 1, 2019 to July 31, 2020 |
| ¢ | Underground workings along a 1,000-metre-long trend on eight veins including one old shaft and adit used for ventilation, levels, and one main access ramp |
| ¢ | The operations at San Ignacio were suspended from April 2, 2020 through June 3, 2020 on account of the directive of the Mexican Federal Government to mitigate the spread of COVID-19. |
| 1.5 | Mineral Processing & Recovery Methods |
The GMC mineral processing plant processes approximately 779 tonnes per operating day (mill operating days in 2019 / 2020 dropped appreciably). The processing plant utilized five stages as follows: crushing, milling, flotation, thickening and filtering and produces a concentrate of iron sulphide (pyrite) with high values of gold and silver which are marketed and sold as the final product.
Processing and recoveries are discussed in Item 17 of this TR.
| Summary | 5 | Page |
NI 43-101 Technical Report | December 22, 2020 |
| 1.6 | Mineral Resource Estimate |
Geological modelling and subsequent Mineral Resource estimation were performed by Great Panther under the supervision of the Qualified Persons in accordance with the CIM Estimation of Mineral Resources and Mineral Reserves Best Practice Guidelines (November 2019 edition). The geological data compilation, interpretation, geological modelling and Mineral Resource estimation methods and procedures are described in the following Items.
For estimating the Mineral Resources for the Great Panther GMC, the Qualified Person has applied the definitions of “Mineral Resource” as set forth in the CIM Definitions Standards, adopted May 10, 2014 (“CIMDS”).
Under CIMDS, a Mineral Resource is defined as:
“…a concentration or occurrence of solid material of economic interest in or on the Earth’s crust in such form, grade or quality and quantity that there are reasonable prospects for eventual economic extraction. The location, quantity, grade or quality, continuity and other geological characteristics of a Mineral Resource are known, estimated or interpreted from specific geological evidence and knowledge, including sampling.”
Mineral Resources are subdivided into classes of Measured, Indicated, and Inferred, with the level of confidence reducing with each class, respectively. Mineral Resources are reported as in-situ tonnage and are not adjusted for mining losses or mining recovery. If Mineral Resources are developed in areas with historical mine workings, such as in the Purisima / Melladito South area of San Ignacio, or the Los Pozos / Promontorio area of Guanajuato they are classified only as Inferred, until such work can be done to establish the full extent of historical mining.
The Measured, Indicated, and Inferred Mineral Resource Estimate statement for the GMC is presented in Table 1.2. Results are reported in accordance with Canadian Institute of Mining, Metallurgy and Petroleum Standards on Mineral Resources and Reserves: Definitions and Guidelines (CIM, 2014) as well as disclosure requirements of NI 43-101.
The Mineral Resource Estimate presented below is considered current and has an effective date of July 31, 2020. It was completed by the Company under supervision of the Qualified Persons.
It is the Qualified Persons’ opinion that the estimation approach is applicable based on the quantity and spacing of available data, the interpreted controls on mineralization, and the type of deposit. For details on all the input parameters used to determine Mineral Resources, see Item 14.0 of this TR.
Mineral Resource Estimate updates are given specifically for San Ignacio and Guanajuato (collectively GMC), as both operations have been in operation and depleting resources, as well, active exploration has been ongoing since the date of former estimates contributing to a better understanding of several mineralized zones. GMC contains estimated Measured and Indicated Mineral Resources of 821,851 tonnes above varying US$ NSR full operational cost cut-offs, at an average grade of 199g/t silver and 2.07g/t gold, for a total of 10,171,912 equivalent silver ounces (“Ag eq oz”) or 113,021 equivalent gold ounces (“Au eq oz”). This includes Measured Mineral Resources of 600,941 tonnes at an average grade of 195g/t silver and 2.16g/t gold, for a total of 7,520,049 Ag eq oz or 83,556 Au eq oz and Indicated Mineral Resources of 220,910 tonnes at an average grade of 209g/t silver and 1.83g/t gold, for a total of 2,651,863 Ag eq oz or 29,465 Au eq oz. In addition, estimated Inferred Mineral Resources are 1,453,008 tonnes at an average grade of 185g/t silver and 2.25g/t gold, for 18,109,823 Ag eq oz or 201,220 Au eq oz. Table 1.2 provides a summary of the Mineral Resource Estimate for GMC.
| Summary | 6 | Page |
NI 43-101 Technical Report | December 22, 2020 |
Table 1.2: Summary of Mineral Resource Estimate 2020, GMC (Guanajuato and San Ignacio)
| Classification | Tonnes | Ag (g/t) | Ag (oz) | Au (g/t) | Au (oz) | Ag eq (g/t) | Ag eq (oz) | Au eq (g/t) | Au eq (oz) |
| Total Measured | 600,941 | 195 | 3,763,303 | 2.16 | 41,741 | 389 | 7,520,049 | 4.32 | 83,556 |
| Total Indicated | 220,910 | 209 | 1,483,209 | 1.83 | 12,951 | 373 | 2,651,863 | 4.15 | 29,465 |
| Total M&I | 821,851 | 199 | 5,246,512 | 2.07 | 54,693 | 385 | 10,171,912 | 4.28 | 113,021 |
| Total Inferred | 1,453,008 | 185 | 8,664,244 | 2.25 | 105,219 | 388 | 18,109,823 | 4.31 | 201,220 |
Note: See detailed notes in Table 1.3 and Table 1.4.
1.6.1 Guanajuato
Guanajuato contains estimated Measured and Indicated Mineral Resources of 433,953 tonnes above varying US$ NSR full operational cost cut-offs, at an average grade of 249g/t silver and 1.64g/t gold, for a total of 5,529,111 Ag eq oz or 61,435 Au eq oz (Table 1.3). This includes Measured Mineral Resources of 286,139 tonnes at an average grade of 253g/t silver and 1.63g/t gold, for a total of 3,677,663 Ag eq oz or 40,863 Au eq oz and Indicated Mineral Resources of 147,814 tonnes at an average grade of 241g/t silver and 1.65g/t gold, for a total of 1,851,448 Ag eq oz or 20,572 Au eq oz. In addition, estimated Inferred Mineral Resources are 460,174 tonnes at an average grade of 220g/t silver and 2.07g/t gold, for 6,020,031 Ag eq oz or 66,889 Au eq oz.
The Mineral Resources detailed at Guanajuato cover the Guanajuatito, Valenciana, Cata, Los Pozos, Santa Margarita, San Cayetano, and Promontorio areas. This Mineral Resource Estimate for Guanajuato has an effective date of July 31, 2020 and updates the previous resource estimate for reasons of depletion mining and resource definition resulting from successful exploration activities.
Table 1.3: Summary of Mineral Resource Estimate 2020, Guanajuato
| Classification | Tonnes | Ag (g/t) | Ag (oz) | Au (g/t) | Au (oz) | Ag eq (g/t) | Ag eq (oz) | Au eq (g/t) | Au eq (oz) |
| Totals Measured | 286,139 | 253 | 2,328,051 | 1.63 | 14,995 | 400 | 3,677,663 | 4.44 | 40,863 |
| Totals Indicated | 147,814 | 241 | 1,144,963 | 1.65 | 7,816 | 390 | 1,851,448 | 4.33 | 20,572 |
| Total M&I | 433,953 | 249 | 3,473,014 | 1.64 | 22,811 | 396 | 5,529,111 | 4.40 | 61,435 |
| Totals Inferred | 460,174 | 220 | 3,258,101 | 2.07 | 30,689 | 407 | 6,020,031 | 4.52 | 66,889 |
Notes:
| 1. | Cut-offs are based on the full operating costs per mining area being US$115/tonne for Cata, US$115/tonne for Santa Margarita / San Cayetano, US$89/tonne for Los Pozos, US$100/tonne for Guanajuatito, US$125/tonne for Promontorio, and US$102/tonne for Valenciana. |
| 2. | Block model grades converted to US$ value using plant recoveries of 85.5% Ag, 83.9% Au, and net smelter terms negotiated for concentrates. |
| 3. | A vein bulk density for all veins of 2.64t/m³ is used in the estimates. |
| 4. | Totals may not agree due to rounding. |
| 5. | Grades are estimated in metric units and contained silver and gold are estimated in troy ounces. |
| 6. | Ag eq oz were calculated using 90:1 Ag:Au ratio. The ratios are reflective of average metal prices for 2020. |
| 7. | A minimum true width of 0.5m is used in the estimate. |
| 8. | Mineral Resources are estimated using metal prices of US$17.64/oz silver, and US$1,694/oz gold (CIBC 2021 forecast). |
| 9. | The Mineral Resource estimates have an effective date of July 31, 2020. |
| 10. | Inferred Mineral Resources have a great amount of uncertainty as to their existence and as to whether they can be mined legally or economically. It cannot be assumed that all or part of the Inferred Mineral Resources will ever be upgraded to a higher category. |
| 11. | Mineral Resources that are not Mineral Reserves have no demonstrated economic viability. |
| 1.6.2 | San Ignacio |
The San Ignacio property contains estimated Measured and Indicated Mineral Resources of 387,898 tonnes above a US$100 NSR cut-off, at an average grade of 142g/t silver and 2.56g/t gold, for a total of 4,642,801 Ag eq oz or 51,587 Au eq oz. This includes Measured Mineral Resources of 314,802 tonnes at an average grade of 142g/t silver and 2.64g/t gold, for a total of 3,842,386 Ag eq oz or 42,693 Au eq oz and Indicated Mineral Resources of 73,096 tonnes at an average grade of 144g/t silver and 2.19g/t gold, for a total of 800,416 Ag eq oz or 8,894 Au eq oz. In addition, estimated Inferred Mineral Resources are 992,835 tonnes at an average grade of 169g/t silver and 2.33g/t gold, for 12,089,792 Ag eq oz or 134,331 Au eq oz. Table 1.4 summarizes the Mineral Resource Estimates for San Ignacio, with an effective date of July 31, 2020.
| Summary | 7 | Page |
NI 43-101 Technical Report | December 22, 2020 |
This Mineral Resource Estimate for San Ignacio has an effective date of July 31, 2020 and updates the previous resource estimate for reasons of depletion due to mining and resource definition resulting from successful exploration activities.
Table 1.4: Summary of Mineral Resource Estimate 2020, San Ignacio
| Classification | Tonnes | Ag (g/t) | Ag (oz) | Au (g/t) | Au (oz) | Ag eq (g/t) | Ag eq (oz) | Au eq (g/t) | Au eq (oz) |
| Total Measured | 314,802 | 142 | 1,435,252 | 2.64 | 26,746 | 384 | 3,842,386 | 4.27 | 42,693 |
| Total Indicated | 73,096 | 144 | 338,246 | 2.19 | 5,135 | 349 | 800,416 | 3.87 | 8,894 |
| Total M&I | 387,898 | 142 | 1,773,498 | 2.56 | 31,881 | 377 | 4,642,801 | 4.19 | 51,587 |
| Total Inferred | 992,835 | 169 | 5,406,142 | 2.33 | 74,530 | 384 | 12,089,792 | 4.27 | 134,331 |
Notes:
| 1. | A vein bulk density of 2.68 tonnes / m³ is used in the estimates. |
| 2. | Measured, Indicated, and Inferred Mineral Resources are reported at a full cost cut-off Net Smelter Return (NSR) of US$100/tonne. |
| 3. | Totals may not agree due to rounding. |
| 4. | Grades have been estimated in metric units and contained silver and gold estimated in troy ounces. |
| 5. | A minimum mining width of 0.50 meters was used in the estimates. |
| 6. | Mineral Resources are estimated using metal prices of US$17.64/oz Ag and US$1,694/oz Au (CIBC 2021 forecast); and metallurgical recoveries of 85.3% for Ag, 83.9% for Au. |
| 7. | 2020 Mineral Resource Ag eq oz were calculated using 90:1 Ag:Au ratio. The ratios are reflective of average metal prices for 2020. |
| 8. | The Mineral Resource estimates have an effective date of July 31, 2020. |
| 9. | Inferred Mineral Resources have a great amount of uncertainty as to their existence and as to whether they can be mined legally or economically. It cannot be assumed that all or part of the Inferred Mineral Resources will ever be upgraded to a higher category. |
| 10. | Mineral Resources that are not Mineral Reserves have no demonstrated economic viability. |
The Mineral Resource estimates included in this TR are forward-looking statements. There are material factors that could cause actual results to differ materially from the conclusions, forecasts, or projections set out in this TR. Some of the material factors include differences from the assumptions made in the TR regarding grades, metals prices, currency exchange rates, metals production rates, schedule of development, labour, consumables and other material costs, markets and market prices, and other circumstances such that the project proceeds, as described in the TR. See Section 24.0 for a discussion about the forward-looking statements included in this TR and the key assumptions upon which they are based and risks and uncertainties associated with such forward-looking statements. Mineral Resources that are not Mineral Reserves have no demonstrated economic viability.
| 1.7 | Cautionary Note Regarding Absence of Mineral Reserve Estimates |
There are no current estimates of Mineral Reserves for any of the GMC. The Company made decisions to enter production at Guanajuato and San Ignacio without having completed final feasibility studies. Accordingly, the Company did not base its production decisions on any feasibility studies of Mineral Reserves demonstrating economic and technical viability of the GMC. As a result, there may be increased uncertainty and risks of achieving any particular level of recovery of minerals from the GMC or the costs of such recovery. As the GMC does not have established Mineral Reserves, the Company faces higher risks that anticipated rates of production and production costs, such as those provided in this TR, will not be achieved. These risks could have a material adverse impact on the Company’s ability to continue to generate anticipated revenues and cash flows to fund operations from and ultimately achieve or maintain profitable operations at the GMC.
| 1.8 | Permitting & Environmental Conditions |
The permitting and environmental framework requirements are outlined in Item 20.0 of this TR. In addition, a complete list of permits and monitoring processes for GMC are also listed in Item 20.0 of this TR.
| Summary | 8 | Page |
NI 43-101 Technical Report | December 22, 2020 |
| 1.9 | Conclusions |
An updated Mineral Resource Estimate has been prepared by Great Panther under the supervision of the Company’s Qualified Persons for the GMC. The Mineral Resource estimate used industry standard practices and is based on drilling and underground sampling data of adequate quality to meet CIM guidelines. Veins were modelled in three dimensions (3D) including all the information available. Inverse Distance cubed (ID3) estimation technique was used for each of the veins.
1.9.1 Guanajuato
| ¢ | The Qualified Persons consider the Guanajuato Mineral Resource estimates presented to conform to CIM standards and definitions for estimating resources, as required under NI 43-101. There are no Guanajuato Mineral Reserve estimates. Mineral Resources that are not Mineral Reserves have no demonstrated economic viability. |
| ¢ | Mineralization occurs in structurally complex multi-generational vein quartz dominated stockwork and breccia zones along the Veta Madre. Structural geology mapping indicates that up to eight cross-cutting breccia events occur with associated precious metal mineralization. Fluid inclusion studies reflect the complex structural history with boiling (indicative event associated with precious metal deposition) occurring from the 2100masl to 1500masl elevations (surface to the deepest levels drilled) in the GMC. The potential to find further mineralization both laterally, and in parallel breccia structures to know precious metal mineralization zones is considered excellent. |
| ¢ | Seven mineralized areas (34 block models) comprising the resource models are defined as Cata, Los Pozos, Santa Margarita, San Cayetano, Promontorio, Valenciana, and Guanajuatito. |
| ¢ | If Mineral Resources are developed in areas with historical mine workings, such as in the Los Pozos / Promontorio area of Guanajuato they are classified only as Inferred, until such work is done to establish the extent of historical mining. |
| ¢ | Guanajuato contains estimated Measured and Indicated Mineral Resources of 433,953 tonnes above varying US$ NSR full operational cost cut-offs, at an average grade of 249g/t silver and 1.64g/t gold, for a total of 5,529,111 Ag eq oz or 61,435 Au eq oz. This includes Measured Mineral Resources of 286,139 tonnes at an average grade of 253g/t silver and 1.63g/t gold, for a total of 3,677,663 Ag eq oz or 40,863 Au eq oz and Indicated Mineral Resources of 147,814 tonnes at an average grade of 241g/t silver and 1.65g/t gold, for a total of 1,851,448 Ag eq oz or 20,572 Au eq oz. In addition, estimated Inferred Mineral Resources are 460,174 tonnes at an average grade of 220g/t silver and 2.07g/t gold, for 6,020,031 Ag eq oz or 66,889 Au eq oz. |
| ¢ | For Measured and Indicated Resources, there is a 47% increase in contained Ag eq oz over the previous year's estimate. For Inferred, there is an 154% increase in contained Ag eq oz over the previous year's estimate. |
1.9.2 San Ignacio
| ¢ | The Qualified Persons consider the GMC San Ignacio Mineral Resource estimates presented to conform to CIM standards and definitions for estimating resources, as required under NI 43-101. There are no San Ignacio Mineral Reserve estimates. Mineral Resources that are not Mineral Reserves have no demonstrated economic viability. |
| ¢ | The La Luz area structures consist of numerous mineralized fractures in a north-westerly-trending orientation, which extends for a known strike of approximately 8 km long. Historically productive veins on the property include Veta Melladito, and Veta Purisima. Veins identified in the recent Great Panther drilling are the Melladito, Melladito BO, Intermediate, Intermediate 2, Nombre de Dios, Nombre de Dios 1.5, Nombre de Dios 2, Nombre de Dios 1.5, Nombre de Dios 3, Melladito South, Purisima, Purisima BO, Purisima HW, Purisima Int., 700, and Santo Nino. Mineralization is contained within tabular veins, vein stockwork, and breccias. The sixteen veins with structural continuity inferred from surface mapping and diamond drilling from surface, and now with extensive underground development, have been defined up to 2,200 meters along strike and 150 meters down dip. |
| Summary | 9 | Page |
NI 43-101 Technical Report | December 22, 2020 |
| ¢ | If Mineral Resources are developed in areas with historical mine workings, such as in the Purisima / Melladito South area of San Ignacio they are classified only as Inferred, until such work is done to establish the extent of historical mining. |
| ¢ | The San Ignacio property contains estimated Measured and Indicated Mineral Resources of 387,898 tonnes above a US$100 NSR cut-off, at an average grade of 142g/t silver and 2.56g/t gold, for a total of 4,642,801 Ag eq oz or 51,587 Au eq oz. This includes Measured Mineral Resources of 314,802 tonnes at an average grade of 142g/t silver and 2.64g/t gold, for a total of 3,842,386 Ag eq oz or 42,693 Au eq oz and Indicated Mineral Resources of 73,096 tonnes at an average grade of 144g/t silver and 2.19g/t gold, for a total of 800,416 Ag eq oz or 8,894 Au eq oz. In addition, estimated Inferred Mineral Resources are 992,835 tonnes at an average grade of 169g/t silver and 2.33g/t gold, for 12,089,792 Ag eq oz or 134,331 Au eq oz. |
| ¢ | For Measured and Indicated Resources, there is a 7% decrease in contained Ag eq oz over the previous year's estimate. For Inferred, there is a 106% increase in contained Ag eq oz from the previous year's estimate. This decrease in Measured and Indicated Resources is due to mine depletion, offset by higher metal prices. Extensive infill and expansion drilling allowed for the increase in Inferred Resources with the addition of five veins, along with high metal prices. |
| 1.10 | Recommendations |
The 2020-2021 (August 2020 to December 2021) exploration budget recommended for Guanajuato Mine Complex is estimated at US$4,055,000 and includes 36,500 meters of core drilling (see Table 1.5).
Recommendations are that Great Panther continues present levels of exploration at Guanajuato in current and other prospective areas to define further Mineral Resources to increase production. Mineral Resources that are not Mineral Reserves have no demonstrated economic viability.
The exploration includes core drilling, detailed rehabilitation of old levels, historical data re-evaluation, geological mapping and interpretation, and re-sampling in old-mined areas, and along and down dip of past mining. During 2020 an ongoing drill program detailed the Los Pozos, Promontorio, and Valenciana areas along the Veta Madre and parallel structures, and as such an underground drill program of 22,000 meters is recommended. For 2020-2021 the exploration program should continue with in-fill drilling in the Pozos and Promontorio areas, and evaluations starting in the upper Cata, Cata to Valenciana, and Valenciana to Guanajuatito areas. The budget for this program is summarized in Table 1.5, and includes 22,000 of drilling and compilation, sampling and geological work for upper mine areas that can be safely re-opened, totalling US$2,351,000.
Recommendations are that Great Panther continues mining operations at San Ignacio. For 2020-2021 recommendations also include a concerted effort focused on detail in-fill drilling the Melladito South, Purisima, and Nombre de Dios veins is essential and as such an underground drill program of 3,500 metres is recommended. Surface drilling for 2020-2021 is budgeted at 11,000 metres and will focus on detailing areas south of present mining along the Melladito and Purisima vein structures in the San Pedro and Mexiamora areas, and on targeting exploration targets along the Purisima vein system and parallel structures. At $120 cost per month/meter, the estimated budget for this program is US$1,704,000 (Table 1.5).
| Summary | 10 | Page |
NI 43-101 Technical Report | December 22, 2020 |
Table 1.5: 2020-2021 Budget for Proposed Exploration, GMC (San Ignacio and Guanajuato)
| Project | Type | Months / Meters | Cost per month and /or meter US$ | Cost US$ |
| 2020 - 2021 Guanajuato | Compilation, Sampling, Geology | 5 | $11,000 | $55,000 |
| Compilation, Sampling, Geology | 12 | $4,000 | $48,000 | |
| Drilling, BQ & NQ core (all-in costs) | 22,000 | $100 | $2,200,000 | |
| Guanajuato Total | 22,000m | $2,351,000 | ||
| 2020 - 2021 San Ignacio | Compilation, Sundry, Planning | 17 | $2,000 | $34,000 |
| Underground Drilling | 3,500 | $100.00 | $350,000 | |
| Surface Drilling | 11,000 | $120 | $1,320,000 | |
| San Ignacio Total | 14,500m | $1,704,000 | ||
| Grand Total | 36,500m | $4,055,000 |
| Summary | 11 | Page |
NI 43-101 Technical Report | December 22, 2020 |
| 2.0 | Introduction |
| 2.1 | Terms of Reference |
This TR was completed by Great Panther personnel and provides an update of the mineral resource estimates for Guanajuato and San Ignacio operations only. The Guanajuato Mine Complex is in Guanajuato State, Mexico and comprises the Guanajuato and San Ignacio operations, the GMC processing plant, associated infrastructure, and the exploration projects El Horcon and Santa Rosa. No update is given for the mineral resource at El Horcon (Brown, 2017), and no exploration was done on either the El Horcon or Santa Rosa projects since the effective date of proceeding reports. Presently, the GMC processing plant at Guanajuato processes mined mineralization from the San Ignacio and limited ore from Guanajuato. Guanajuato was on C&M December 31, 2018 to July 2019 with limited stoping of remnants and mining of ore drives since that time.
Great Panther is a publicly traded company listed on the Toronto Stock Exchange and on the NYSE American, engaged in the exploration, development, and production of mineral properties. It is primarily a gold and silver producing company with operating mines in Brazil, including Tucano; and Mexico, including the GMC in the state of Guanajuato and Topia silver, gold, lead, and zinc mine located in the state of Durango.
In accordance with the definitions set out in NI 43-101, Great Panther is a “producing issuer” and is therefore able to have company personnel complete mineral resource estimates internally. The new Mineral Resource estimates in this report are from Guanajuato and San Ignacio, and supersede those for the GMC (Wunder, 2018; Brown, 2017; Brown, 2016; Brown, 2015), Guanajuato (Brown & Nourpour, 2020a; Brown & Sprigg, 2013), and San Ignacio (Brown & Nourpour, 2020b; Waldegger & Brown, 2014; Waldegger, 2012; Smith, 2011).
This TR was prepared by Robert F. Brown, P. Eng., Geological Consultant and Mohammad Nourpour, P. Geo., Resource Geologist both Qualified Persons for Great Panther in accordance with the following documents published by the Canadian securities’ regulatory authorities:
| ¢ | NI 43-101: Standards of Disclosure for Mineral Projects (effective date May 9, 2016). |
| ¢ | NI 43-101 Companion Policy (NI 43-101CP): Standards of Disclosure for Mineral Projects (effective date February 25, 2016). |
| ¢ | Form NI 43-101F1: TR (effective date June 30, 2011). |
| ¢ | Canadian Institute of Mining, Metallurgy, and Petroleum (CIM): Estimation of Mineral Resources and Mineral Reserves Best Practice Guidelines (November 2019). |
| ¢ | CIM Definitions Standards (May 2014). |
| 2.2 | Effective Date |
The effective date of this TR titled “NI 43-101 Mineral Resource Update Technical Report on the Guanajuato Mine Complex, Guanajuato and San Ignacio Operations, Guanajuato State, Mexico.” is July 31, 2020. The signature and submission date of the TR is December 22, 2020. There were no material changes to the scientific and technical information on the GMC between the effective date and the signature date of the TR.
| 2.3 | Sources of Information |
The primary source of information used in the preparation of this Mineral Resource Estimate and TR are the data, observations and analytical results collected by Great Panther personnel and their consultants related to surface exploration drilling, underground drilling and surface/underground sampling and analytical results as of the effective date of this TR.
| Introduction | 12 | Page |
NI 43-101 Technical Report | December 22, 2020 |
| 2.4 | Qualified Persons & Current Personal Inspection |
The Qualified Persons responsible for the preparation of the report are Mr. Robert F. Brown, P. Eng., Geological Consultant, and Mr. Mohammad Nourpour, P. Geo., Resource Geologist, both non-independent Qualified Persons for Great Panther.
Geological data review, interpretation, geological modelling, Mineral Resource estimation, Mineral Resource classification, and all other related activities completed in the preparation of this Report were performed under the supervision of the Great Panther Qualified Person.
Mr. Brown has travelled to the GMC on numerous occasions and most recently from August 20-24, and December 6-11, 2019 to perform the Qualified Person site visit and inspection as required under NI 43-101. Mr. Nourpour travelled to the GMC from August 20-24, 2019 to perform the Qualified Person site visit and inspection as required under NI 43-101. During the site visit the Qualified Persons reviewed the accessible underground workings along mineralized horizons and reviewed all relevant data including core logging, splitting, sampling and analytical methods and procedures at the core logging and storage facility as well as verifying the locations of drill holes and reviewing the project property geology and access.
| 2.5 | Language, Currency, & Measurement Standards |
Unless otherwise indicated, this TR uses Canadian English spelling, United States of America dollar currency (US$) and System International (metric) units.
Coordinates in this TR are presented in metric units’ meters (m) or kilometers (km), using the Universal Transverse Mercator (UTM) projection (Zone 14N), World Geodetic System 1984 (WGS1984) datum. Elevations are reported as meters above sea level (masl). Block Models and wireframes are created in local grid coordinates.
| Introduction | 13 | Page |
NI 43-101 Technical Report | December 22, 2020 |
| 3.0 | Reliance on Other Experts |
For certain Items in this TR (described below in Sections 3.1 and 3.2) the Qualified Person relied on a report, opinion, or statement of another expert who is not a Qualified Person, or internal information provided by Great Panther personnel. In each case, the Qualified Persons disclaims responsibility for such information to the extent of his reliance on such reports, opinions, or statements.
This TR has been compiled in-house by Great Panther personnel, under the supervision of Robert F. Brown, P. Eng., Geological Consultant and Mohammad Nourpour, P. Geo., Resource Geologist, both Qualified Persons for Great Panther. The information, conclusions, opinions, and estimates contained herein are based upon internal information available at the time of writing this TR and assumptions, conditions, and qualifications as set forth in this report.
| 3.1 | Legal Status & Mineral Tenure |
For Section 4.2 of this report and the related portions of Section 1 of this report, Mr. Robert F. Brown, the Qualified Person for Section 4 of this TR, has reviewed property title records or mineral rights for the Guanajuato Mine Complex properties and opinions prepared by the Company’s third-party legal counsel as of July 31, 2019 and on this basis confirms title in the name of Minera Mexicana El Rosario S.A. de C.V. (100% beneficially owned Mexican subsidiary of Great Panther).
| 3.2 | Environmental Matters |
For Section 20.0 of this report, Mr. Robert F. Brown, the Qualified Person for Section 20.0 of this TR, has fully relied upon the work of Guanajuato staff from the Health, Safety, and Environment department who are not qualified persons concerning the environmental, socioeconomic, and permitting matters relevant to this TR. Environmental matters have been summarized from various audits and reviews, and opinions provided by Guanajuato staff to the effective date of this TR.
| Reliance on Other Experts | 14 | Page |
NI 43-101 Technical Report | December 22, 2020 |
| 4.0 | Property Description & Location |
| 4.1 | Description & Location |
The Guanajuato Mine Complex properties are situated north of the City of Guanajuato, Guanajuato State, Mexico, approximately 380 km northwest of Mexico City (see Figure 4.1).
Figure 4.1: Project Location Map
| 4.2 | Mineral Tenure |
The properties consist of 50 contiguous and non-contiguous mineral concessions that cover approximately 10,355.39ha in area (see Table 4.1). The claim groups are located at approximately 21° 03' N latitude and 101° 15' W longitude (NAD 27 UTM 265500E, 2327500N). Great Panther holds a 100% interest in the properties through its wholly beneficially owned Mexican subsidiary, MMR.
For display and description purposes the claims have been subdivided into the Guanajuato, San Ignacio, El Horcon and Santa Rosa areas as illustrated on Figure 4.2 and as listed in Table 4.1. Updates for El Horcon and Santa Rosa are not included in this TR.
The mineral concessions that comprise the Great Panther holdings at Guanajuato and San Ignacio are presented in Figure 4.3 and Figure 4.4 respectively. Claim boundaries have been legally surveyed.
| Property Description & Location | 15 | Page |
NI 43-101 Technical Report | December 22, 2020 |
Table 4.1: Mineral Concessions that comprise the Great Panther holdings at the GMC
| Mineral Concessions | Title No. | Hectares | Date of Record (DD/MM/YYYY) | Expiration Date (DD/MM/YYYY) |
| Guanajuato | ||||
| La Victoria | 168162 | 28.7718 | 2/3/1981 | 1/3/2031 |
| Cata | 168163 | 91.604 | 2/3/1981 | 1/3/2031 |
| Esperanza | 168164 | 47.489 | 2/3/1981 | 1/3/2031 |
| Valenciana | 168165 | 91.9428 | 2/3/1981 | 1/3/2031 |
| Rayas | 168167 | 88.6727 | 2/3/1981 | 1/3/2031 |
| 1ra. Ampliacion de Esperanza | 168169 | 8.9073 | 2/3/1981 | 1/3/2031 |
| Primera Ampl. de Valenciana | 168170 | 97.3097 | 2/3/1981 | 1/3/2031 |
| El Borrego | 168171 | 24 | 2/3/1981 | 1/3/2031 |
| El Progreso | 180370 | 30.8635 | 25/03/1987 | 24/03/2037 |
| El Promontorio | 180371 | 10.3232 | 26/03/1987 | 25/03/2037 |
| El Caliche | 233320 | 7.8465 | 10/2/2009 | 9/2/2059 |
| Animas o Espiritu Santo | 233312 | 4.14 | 23/05/1930 | 4/2/2059 |
| San Vicente | 233311 | 3.0552 | 5/2/2009 | 4/2/2059 |
| Pipichagua | 160650 | 6 | 10/10/1974 | 9/10/2024 |
| Nueva Seguridad | 160674 | 27 | 10/10/1974 | 9/10/2024 |
| La Guadalupana | 161526 | 16 | 25/04/1975 | 24/04/2025 |
| Socavon de La Fe | 189664 | 15 | 5/12/1990 | 4/12/2040 |
| El Zapote | 214890 | 80.7106 | 4/12/2001 | 3/12/2051 |
| El Triangulo | 229058 | 0.1237 | 28/02/2007 | 27/02/2057 |
| San Ignacio | ||||
| San Francisco de Pili | 168161 | 97.2871 | 2/3/1981 | 1/3/2031 |
| Purísima Conception | 168166 | 66 | 2/3/1981 | 1/3/2031 |
| San Pedro Gilmonene | 168168 | 72.1458 | 2/3/1981 | 1/3/2031 |
| San Francisco de Asis | 169359 | 6.8808 | 11/11/1981 | 10/11/2031 |
| La Chuparrosa | 169360 | 1.2 | 11/11/1981 | 10/11/2031 |
| San Antonio | 177934 | 49 | 29/05/1986 | 28/05/2036 |
| Primera Ampl. de San Antonio | 215568 | 32.1847 | 5/3/2002 | 4/3/2052 |
| Robledo | 191436 | 49.486 | 19/12/1991 | 18/12/2041 |
| Primera Ampliacion de Sirio | 192176 | 24 | 19/12/1991 | 18/12/2041 |
| El Horcon | ||||
| Ampl. San Ignacio de Loyola | 214853 | 420 | 4/12/2001 | 3/12/2051 |
| La Perlita I | 215054 | 226.7442 | 7/2/2002 | 6/2/2052 |
| La Perlita Frac. I | 215055 | 280.8344 | 7/2/2002 | 6/2/2052 |
| La Perlita Frac. II | 215056 | 181.3383 | 7/2/2002 | 6/2/2052 |
| Comanja | 215375 | 99.927 | 19/02/2002 | 18/02/2052 |
| Ana Camila | 222078 | 700 | 7/5/2004 | 6/5/2054 |
| Ana Camila I | 224984 | 100 | 6/7/2005 | 5/7/2055 |
| Horcon 1 | 225451 | 222.9318 | 8/9/2005 | 7/9/2055 |
| Horcon 2 Fracción I | 225467 | 1222.0977 | 9/9/2005 | 8/9/2055 |
| Horcon 2 Fracción II | 225468 | 15 | 9/9/2005 | 8/9/2055 |
| Horcon 3 Fracción I | 226421 | 33.183 | 17/01/2006 | 16/01/2056 |
| Horcon 3 Fracción II | 226422 | 6.2134 | 17/01/2006 | 16/01/2056 |
| Horcon 4 Fracc. II | 228453 | 10 | 22/11/2006 | 21/11/2056 |
| Horcon 4 Fracc. III | 228454 | 2.2936 | 22/11/2006 | 21/11/2056 |
| Horcon 4 Fracc. IV | 228455 | 0.1251 | 22/11/2006 | 21/11/2056 |
| Horcon 4 Fracc. V | 228456 | 0.0205 | 22/11/2006 | 21/11/2056 |
| Santa Rosa | ||||
| Canada de la Virgen | 214875 | 30.0 | 4/12/2001 | 3/12/2051 |
| Jardin de Oro | 243423 | 4,213.0 | 3/10/2014 | 2/10/2064 |
| Reducción Salaverna | 219875 | 178.8078 | 29/04/2003 | 22/05/2050 |
| Reducción Salaverna Norte 1 | 217140 | 1187.0675 | 18/06/2002 | 15/01/2048 |
| Clavellina | 211241 | 120 | 18/04/2000 | 17/04/2050 |
| Nuevo Guerrero | 186242 | 27.8617 | 22/03/1990 | 21/03/2040 |
| Total | 10,355.39 | |||
| Property Description & Location | 16 | Page |
NI 43-101 Technical Report | December 22, 2020 |
Figure 4.2: GMC Mineral Concession groups
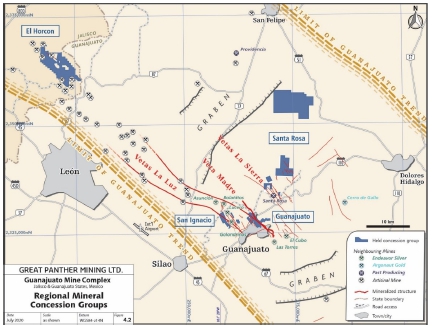
Figure 4.3: Mineral Concessions, Guanajuato
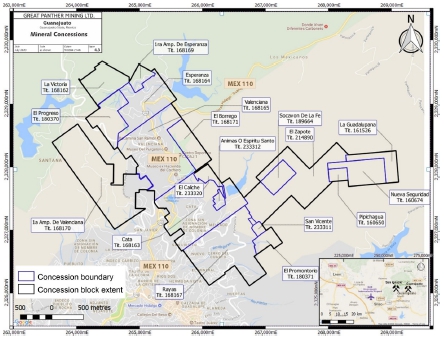
| Property Description & Location | 17 | Page |
NI 43-101 Technical Report | December 22, 2020 |
Figure 4.4: Mineral Concessions, San Ignacio
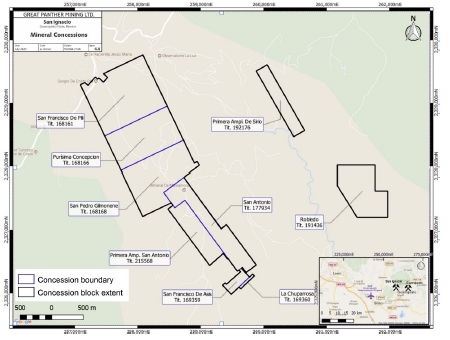
| 4.3 | Surface Rights |
The GMC tailings disposal area and the San Ignacio waste rock dump are contained within the property boundaries in areas where the Company holds surface rights (Figure 4.5).
Surface rights owned by the Company are limited to blocks of ground over the present underground development (new roads, mine rock dumps, and surface infrastructure). Surface access is negotiated with various individual owners. There are no known environmental liabilities associated with the mineral claims.
Surface rights for the GMC operations are presented in Figure 4.5.
| Property Description & Location | 18 | Page |
NI 43-101 Technical Report | December 22, 2020 |
Figure 4.5: Surface rights and tailings disposal location
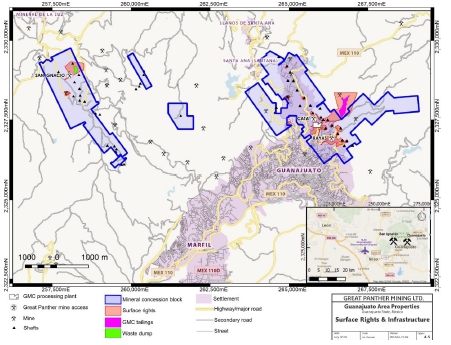
| 4.4 | Agreements & Encumbrances |
The major Agreements and Contracts are listed in Item 19.2 of this TR. There are no encumbrances related to the GMC as of the effective date of this TR.
| 4.5 | Mining Royalties & Taxes |
Mexican taxes on mineral claims are due bi-annually in January and July (the Company is up to date), and assessment must be filed annually each May (the Company is up to date).
MMR pays 0.5% of the silver and gold sales related to the GMC to the Minister of the Economy (Secretaria de Economia). As well, there is a 2% royalty over Reduccion Salverna, title #219875, Reduccion Salverna Norte 1, title # 217140, Clavellina, title # 211241, and Nuevo Guerro, title # 186242.
| 4.6 | Environmental Liabilities |
There are no known environmental liabilities associated with the GMC as of the effective date of this TR.
| 4.7 | Permitting |
All permits are in-place to allow exploration and exploitation at Guanajuato and San Ignacio and are summarized in Item 20.0 of this TR.
| Property Description & Location | 19 | Page |
NI 43-101 Technical Report | December 22, 2020 |
| 4.8 | Other Significant Factors & Risks that May Affect Access, Title, or the Right or Ability to Perform Work on the Property |
Other than metal price fluctuations, there are no other known significant factors or risks that are expected to affect access, title or right or ability to perform work at the GMC as of the effective date of this TR.
| Property Description & Location | 20 | Page |
NI 43-101 Technical Report | December 22, 2020 |
| 5.0 | Accessibility, Climate, Local Resources, Infrastructure, & Physiography |
| 5.1 | Accessibility |
Refer to Figure 5.1 for a map of regional access for the GMC.
Figure 5.1: Regional access for the GMC

The Guanajuato property is located approximately 380 km by road northwest of Mexico City and is situated along the north-eastern side of the city of Guanajuato. The property is accessible via city streets. The municipality of Guanajuato has a population of approximately 184,239 (2015 census) and is located approximately 50 km, by road, from the Guanajuato International Airport (Del Bajío international airport at León), Mexico. The mine area is easily accessible from major population centers in central Mexico via a system of modern roads. The San Ignacio property is located approximately 8 km northwest of the City of Guanajuato, in Guanajuato State, Mexico, and is accessed via a 35-minute drive from the outskirts of the city, mostly by paved road through the towns of Santa Ana and Cristo Del Rey.
| 5.2 | Climate |
The Guanajuato area has a dry climate with annual mean temperature of 25°C, however, winters can be cool, with lows approaching 0°C. Annual precipitation averages approximately 600mm which generally falls between June and October. The exploration and mining work can be conducted year-round uninterrupted by weather.
A summary of the historical climate data for Guanajuato City, as compiled over 60 years on the www.weatherbase.com website, is presented in Figure 5.2. Mean daylight hours were compiled over a 30-year period.
| Accessibility, Climate, Local Resources, Infrastructure, & Physiography | 21 | Page |
NI 43-101 Technical Report | December 22, 2020 |
Figure 5.2: Historical Guanajuato City climate data
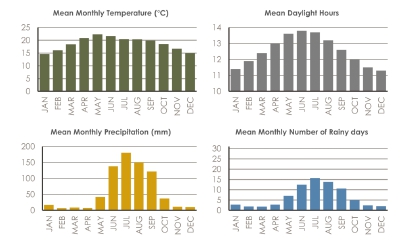
Source: www.weatherbase.com website
| 5.3 | Local Resources & Infrastructure |
Most of the supplies and labour required for the exploration programs were sourced from the cities of Guanajuato or León. The area has a long history of mining, and there is an ample supply of skilled personnel and the surface facilities enough for a mining operation. Storage, waste disposal, and plant sites are well established.
The Company has negotiated surface rights sufficient for mining operations at San Ignacio. Grid power is available to the property, and some buildings and storage sheds exist on site at the old San Ignacio shaft. New surface facilities near the ramp (within the last five years) include roads, a mechanical shop, an electrical substation, diesel storage, waste dumps, and security facilities. Electrical Power for the GMC is provided by the Federal Electricity Commission (CFE Comision Federal de Electricidad) which is owned by the Mexican Government. There is one power transmission line (13,200V) that provide the electrical power supply for the plant and mine. At Guanajuato, there are eight electrical substations of different capacities, including two compact substations, one for the Cata shaft hoist and Cata compressors. There are seven transformers with different capacities, two of 1500KVA, one of 600KVA, three of 500KVA and one of 225KVA. At San Ignacio, there are four electrical substations of different capacities, including a substation for the compressor’s operation. There are four transformers with different capacities, one of 1500KVA, one of 900KVA, one of 600KVA and one of 75KVA. Water for the operations comes from storage in historical underground workings.
| 5.4 | Physiography |
Guanajuato is located within the Central Plateau of Mexico in the Sierra Guanajuato Mountains. The terrain is moderately rugged, with elevations on the property ranging from 1,600 to 2,200 masl. Hillsides are deeply incised by drainage and slopes are moderately to extremely steep. Vegetation consists of grasses, small trees, shrubs, and cacti. Larger trees grow in the valley bottoms where there is more water.
San Ignacio is characterized by rolling hills with small-incised drainages, which generally provide windows through thin soil cover to bedrock exposures. Two small villages (San Pedro and Mexiamora) are located within the property, as are several other isolated homes and small farms. Some of the property is underlain by cultivated land on which local farmers grow corn.
| Accessibility, Climate, Local Resources, Infrastructure, & Physiography | 22 | Page |
NI 43-101 Technical Report | December 22, 2020 |
| 6.0 | History |
| 6.1 | Ownership & Development History |
6.1.1 Guanajuato
Exploration in the Guanajuato mining district dates to 1548 when silver mineralization was first discovered in the La Luz area by Spanish colonists. Two years later an outcrop of the Veta Madre was found on what is now the Rayas mineral claim. Mining took place on a relatively small scale until the early 1700s when application of explosives for tunnelling resulted in a significant increase in productive capacity. In the latter portion of the 18th century, Antonio Obregón y Alcocer financed the discovery and development of the Valenciana Mine (within the present Valenciana mineral claim). This mine became one of the premier silver mines in the world, at the time accounting for a third of global annual silver production. The Spanish controlled mining in the district until 1816 when mining ceased, and all production facilities were destroyed during the Mexican War of Independence. The Valenciana Mine was reopened in 1868 with British capital. The British interests ran the mines for ten years but did not enjoy much success, losing a considerable amount of money. Operations at that time were hampered by a lack of rail facilities and the necessity for hauling heavy equipment from the coast by mule. Mining production declined during the early 1900s due to low metal prices. At that time, American interests acquired and reopened many of the mines. Old ore dumps and tailings were reprocessed to extract gold and silver using the newly discovered cyanide process; however, the onset of the Civil War in 1910 severely curtailed mining activity in the country, resulting in a decades-long slump in production.
By the mid-1930s, demands for higher pay and better working conditions resulted in the mines being turned over to the Sociedad Cooperativa Minera Metalurgica Santa Fe de Guanajuato (the Cooperative) in 1939. The Cooperative operated several mines in the district throughout the latter half of the 20th century and into the 2000s. Great Panther acquired Guanajuato from the Cooperative in 2005. The operation included two main properties (Guanajuato and San Ignacio claims), a plant, workshops and administration facilities, mining infrastructure, and certain surface rights (real estate). The total purchase price was US$7,250,000 (paid) consisting of staged cash payments to the end of 2006.
Currently, the major assets and facilities associated with Guanajuato are:
| ¢ | Silver-gold deposits within the Veta Madre trend |
| ¢ | The physical plant site including crushing, grinding, flotation and dewatering, the tailings storage facility, mine shafts and associated facilities, coarse ore bin, main ventilation fan, workshops, warehouses, administration buildings and dry facilities |
| ¢ | Facilities providing basic infrastructure to the mine, including electric power from the national power grid and water supply from mine workings. The Cata plant site is served by community provided services such as water and sewerage |
| ¢ | Underground infrastructure including mine shafts, ramps, ventilation raises, maintenance shops, and mobile equipment fleet |
| ¢ | Access by paved roads to the plant and unsealed roads to the tailing’s facility |
6.1.2 San Ignacio
Exploration in the Guanajuato mining district dates to 1548, when silver mineralization was first discovered in La Luz area by Spanish miners on their way to find their fortune on the newly discovered bonanza veins in the Mexican state of Zacatecas. Historical documentation has indicated that mining activity on the La Luz vein system has passed through numerous “boom and bust” cycles. No mining records remain of work undertaken in the area from 1548 until 1793. Research by Great Panther geologists has turned up a few maps post-dating 1793, depicting the development and mining from several shafts and adits.
| History | 23 | Page |
NI 43-101 Technical Report | December 22, 2020 |
The Cooperative amassed what is now San Ignacio.
On the San Ignacio property, there are twelve known historical workings including major shafts at San Ignacio, Purisima, Pili, and San Jose de Gracia. No production figures for these workings are available except for those relating to the mining by the Cooperative from the San Ignacio shaft. Cooperative records from 1977 to 2001 indicate that 617,455 tonnes at a grade of 113g/t Ag and 1.01g/t Au were extracted from the San Ignacio shaft along the Purisima vein structure, at an average rate of 85t/d. As there was no processing facility at San Ignacio, ore was trucked back to Guanajuato plant in the main GMC, approximately 20 km by road.
Great Panther began underground development at San Ignacio in late November 2013 using a surface portal and ramping to access both the Intermediate and Melladito veins. Ore continues to be trucked by road to GMC plant.
| 6.2 | Exploration |
Table 6.1 summarizes the Company’s GMC drilling to date at Guanajuato and San Ignacio.
Table 6.1: Summary of Great Panther drilling at Guanajuato & San Ignacio
| Year | GUANAJUATO | SAN IGNACIO | SUBTOTAL | |||
| No. of Drill Holes | Total Depth (m) | No. of Drill Holes | Total Depth (m) | No. of Drill Holes | Total Depth (m) | |
| 2005 | 8 | 1,567.3 | - | - | 8 | 1,567.3 |
| 2006 | 44 | 6,388.1 | - | - | 44 | 6,388.1 |
| 2007 | 65 | 10,148.0 | - | - | 65 | 10,148.0 |
| 2008 | 61 | 8,214.9 | - | - | 61 | 8,214.9 |
| 2009 | 32 | 1,559.4 | - | - | 32 | 1,559.4 |
| 2010 | 125 | 17,565.0 | 5 | 2,294.0 | 130 | 19,859.0 |
| 2011 | 157 | 22,343.4 | 56 | 16,878.5 | 213 | 39,221.9 |
| 2012 | 189 | 29,295.9 | 43 | 9,556.3 | 232 | 38,852.2 |
| 2013 | 159 | 26,253.3 | 13 | 1,143.7 | 172 | 27,397.0 |
| 2014 | 138 | 12,510.1 | 27 | 3,832.2 | 165 | 16,342.3 |
| 2015 | 109 | 12,339.0 | 34 | 4,739.4 | 143 | 17,078.4 |
| 2016 | 31 | 6,677.2 | 43 | 9,029.7 | 74 | 15,706.9 |
| 2017 | 77 | 13,696.8 | 102 | 22,165.0 | 179 | 35,861.8 |
| 2018 | 76 | 10,169.1 | 53 | 11,722.4 | 129 | 21,891.5 |
| 2019 | 123 | 8,792.7 | 75 | 10,721.2 | 198 | 19,513.9 |
| 20201 | 52 | 4,368.0 | 40 | 4,306.7 | 92 | 8,674.7 |
| Total: | 1,446 | 191,888.2 | 491 | 96,389.1 | 1,937 | 288,277.3 |
Note:
| 1. | Drilling to July 31, 2020 |
6.2.1 Guanajuato
The Cooperative conducted limited surface and underground diamond drilling on Guanajuato. The authors have been informed through personal communication that the drill core from these holes no longer exists, although the logs and assays from these holes are available in the Mine Geology Department at the Cata mine site in Guanajuato and in electronic format. The Cooperative data was not included in the resource estimate.
At Guanajuato, the Company has drilled 1,446 holes totalling 191,888.2m. Between the last TR effective date (October 31, 2019) to July 31, 2020 the Company has drilled 79 holes totalling 6,154.1m.
6.2.2 San Ignacio
The Cooperative initiated diamond drilling on the San Ignacio property in 1979 with drilling from underground workings at the San Ignacio shaft. Holes from surface were drilled sporadically during the period from 1982 until 1990 and focused on a vein system parallel to, and to the east of, the mineral resource in this report. The authors have been informed through personal communication that the drill core from these holes no longer exists, although the logs and assays from these holes are available in the Mine Geology Department at the Cata mine site in Guanajuato and in electronic format. The Cooperative data was not included in the resource estimate.
At San Ignacio, the Company has drilled 491 holes totalling 96,389.1m. Between the last TR effective date (July 31, 2019) to July 31, 2020 the Company has drilled 54 holes totalling 5,879m.
| History | 24 | Page |
NI 43-101 Technical Report | December 22, 2020 |
| 6.3 | Historical Mineral Resource & Reserve Statements |
A summary of the historical mineral resource estimates for the property are presented in Table 6.2 (Guanajuato) and Table 6.3 (San Ignacio). Great Panther is not treating the below historical estimates as current Mineral Resource estimates and the Qualified Persons have not done sufficient work to classify historical estimates as current Mineral Resource estimates. Historical estimates should not be relied on and are presented for historical reference only.
Table 6.2: Historical Mineral Resources & Reserve Estimates, Guanajuato
| Effective Date | Company | Class | Tonnes | Au g/t | Ag g/t | Method | Cut off |
| May 31 2009 | Wardrop Engineering Inc. | Indicated | 351,995 | 1.19 | 359 | ID2 | US$37.50 |
| Inferred | 24,233 | 0.98 | 296 | ||||
| Jan 31 2011 | Scott Wilson Roscoe Postle Associates Inc. | Measured | 188,000 | 1.64 | 306 | ID3 | 136 g/t Ag eq |
| Indicated | 211,000 | 2.55 | 270 | ||||
| M&I | 399,000 | 2.12 | 287 | ||||
| Inferred | 212,000 | 4.39 | 106 | ||||
| Jan 31 2012 | Robert F. Brown | Measured | 275,800 | 2.21 | 264 | ID3 | Measured and Indicated Mineral Resources are estimated at a cut-off grade of 50 g/t Ag eq. For Inferred: Cut-off grades are 145, 115, 150 and 180g/t Ag eq for Cata, Pozos, SM and GTTO |
| Indicated | 232,600 | 2.66 | 122 | ||||
| M&I | 508,500 | 2.41 | 199 | ||||
| Inferred | 223,200 | 2.10 | 221 | ||||
| Jul 1 2013 | Robert F. Brown & Linda Sprigg | Measured | 362,000 | 1.82 | 179 | ID3 | Measured Mineral Resources are estimated at a cut-off grade of 50g/t Ag eq. Inferred Mineral Resources are reported at area-specific cut-offs as follows: Cata 176 g/t Ag eq, Guanajuatito 164g/t Ag eq, Pozos 178g/t Ag eq, San Cayetano 169g/t Ag eq, Santa Margarita 166g/t Ag eq, Valenciana 167g/t Ag eq and Promontorio 166g/t Ag eq. |
| Indicated | 142,600 | 1.22 | 163 | ||||
| M&I | 504,700 | 1.65 | 174 | ||||
| Inferred | 433,900 | 2.32 | 140 | ||||
| Jul 31 2014 | Robert F. Brown | Measured | 184,530 | 3.24 | 309 | ID3 | Ag eq cut-off for Cata 248g/t, Pozos 260g/t, Guanajuatito 352g/t, Santa Margarita 274g/t, Valenciana 360g/t, Promontorio 260g/t, San Cayetano 274g/t. |
| Indicated | 36,017 | 2.20 | 335 | ||||
| M&I | 220,546 | 3.07 | 313 | ||||
| Inferred | 163,583 | 3.37 | 101 | ||||
| Jul 1 2015 | Robert F. Brown | Measured | 90,365 | 1.81 | 285 | ID3 | US$74 per tonne Cut-off |
| Indicated | 59,352 | 1.04 | 245 | ||||
| M&I | 149,716 | 1.50 | 269 | ||||
| Inferred | 135,571 | 2.30 | 151 | ||||
| Jul 31 2016 | Robert F. Brown | Measured | 114,695 | 1.53 | 264 | ID3 | Cut-offs are based on the marginal operating costs per mining area being US$76/tonne for Cata, US$85/tonne for Santa Margarita / San Cayetano, US$72/tonne for Los Pozos, US$66/tonne for Guanajuatito, and US$74/tonne for Valenciana |
| Indicated | 36,480 | 1.19 | 216 | ||||
| M&I | 151,175 | 1.45 | 253 | ||||
| Inferred | 147,327 | 2.13 | 129 | ||||
| Aug 31 2017 | Matthew C. Wunder | Measured | 170,978 | 1.50 | 227 | ID3 | Cut-offs are based on the marginal operating costs per mining area being US$76/tonne for Cata, US$70/tonne for Santa Margarita / San Cayetano, US$68/tonne for Los Pozos, US$93/tonne for Guanajuatito, and US$80/tonne for Valenciana / Promontorio. |
| Indicated | 43,929 | 1.25 | 215 | ||||
| M&I | 214,907 | 1.45 | 224 | ||||
| Inferred | 158,846 | 2.04 | 136 | ||||
| Oct 31 2019 | Robert F. Brown & Mohammad Nourpour | Measured | 256,260 | 1.72 | 206 | ID3 | Cut-offs are based on the marginal operating costs per mining area being US$113/tonne for Cata, US$75/tonne for Santa Margarita / San Cayetano, US$77/tonne for Los Pozos, US$124/tonne for Guanajuatito, US$60/tonne for Promontorio, and US$197/tonne for Valenciana. |
| Indicated | 87,476 | 1.62 | 199 | ||||
| M&I | 343,736 | 1.69 | 204 | ||||
| Inferred | 208,609 | 2.32 | 168 |
| History | 25 | Page |
NI 43-101 Technical Report | December 22, 2020 |
Table 6.3: Historical Mineral Resources & Reserve Estimates, San Ignacio
| Effective Date | Author | Class | Tonnes | Au g/t | Ag g/t | Method | Cut off |
| Aug 30 2011 | Janelle Smith | Inferred | 611,000 | 2.05 | 127 | Ordinary Kriging | Base case cut-off grade of 118g/t silver equivalent, with a 50:1 ratio of silver to gold value. |
| Mar 31 2012 | Michael Waldegger | Inferred | 826,000 | 2.28 | 121 | Ordinary Kriging | Base case cut-off grade of 125g/t silver equivalent, with a 60.8:1 ratio of silver to gold value. |
| Apr 06 2014 | Robert F. Brown & Michael Waldegger | Indicated | 103,000 | 3.54 | 165 | ID3 | Base case cut-off grade of 125g/t silver equivalent, with a 60:1 ratio of silver to gold value. |
| Inferred | 737,000 | 2.04 | 115 | ||||
| July 31 2014 | Robert F. Brown | Indicated | 180,300 | 3.03 | 173 | ID3 | US$100 NSR per tonne Cut-off based on full cost. |
| Inferred | 787,700 | 3.26 | 160 | ||||
| July 31 2015 | Robert F. Brown | Measured | 249,810 | 3.39 | 151 | ID3 | US$74 NSR per tonne marginal operating costs Cut-off. |
| Indicated | 110,542 | 2.79 | 133 | ||||
| M&I | 360,352 | 3.20 | 145 | ||||
| Inferred | 770,950 | 2.76 | 138 | ||||
| July 31 2016 | Robert F. Brown | Measured | 408,327 | 2.88 | 116 | ID3 | Cut-offs are based on the marginal operating costs per mining area being US$57/tonne. |
| Indicated | 133,398 | 2.56 | 106 | ||||
| M&I | 541,725 | 2.80 | 114 | ||||
| Inferred | 645,318 | 2.15 | 121 | ||||
| Aug 31 2017 | Matthew C. Wunder | Measured | 801,468 | 3.09 | 142 | ID3 | Cut-offs are based on the marginal operating costs per mining area being US$71/tonne. |
| Indicated | 196,949 | 2.68 | 215 | ||||
| M&I | 998,417 | 3.01 | 141 | ||||
| Inferred | 573,431 | 2.44 | 130 | ||||
| July 31 2019 | Robert F. Brown & Mohammad Nourpour | Measured | 314,863 | 3.06 | 156 | ID3 | Cut-offs are based on the marginal operating costs per mining area being US$100/tonne |
| Indicated | 71,554 | 2.87 | 173 | ||||
| M&I | 386,417 | 3.03 | 159 | ||||
| Inferred | 501,870 | 2.69 | 149 |
| 6.4 | Production History |
Production achieved by Great Panther to the end of July 2020 for the GMC is summarized in Table 6.4 below. Blending of the Guanajuato and San Ignacio material began in July 2016 and the processing (milling) of the blended ore continued to December 2018 and then on limited basis. Guanajuato was on C&M from January 2019 to July 2019 and presently produces from limited stoping of remnants and mining of ore drives.
Table 6.4: Production Summary, GMC
| Year | Tonnes Mill/Mine GTO | Tonnes Mill/Mine San Ignacio | Tonnes (milled) | Ag (oz) | Au (oz) |
| 2006 | 86,111 | - | 86,111 | 105,480 | 988 |
| 2007 | 203,968 | - | 203,968 | 521,225 | 3,794 |
| 2008 | 155,079 | - | 155,079 | 848,083 | 5,488 |
| 2009 | 138,517 | - | 138,517 | 1,019,751 | 6,748 |
| 2010 | 144,112 | - | 144,112 | 1,019,856 | 6,619 |
| 2011 | 169,213 | - | 169,213 | 959,490 | 7,515 |
| 2012 | 174,022 | - | 174,022 | 1,004,331 | 10,350 |
| 20131 | 220,463 | 1,082 | 221,545 | 1,079,980 | 15,063 |
| 20141 | 213,658 | 54,154 | 267,812 | 1,239,009 | 15,906 |
| 20151 | 180,691 | 129,253 | 309,944 | 1,708,061 | 21,126 |
| 20161 | 136,349 | 183,694 | 320,043 | 1,473,229 | 21,626 |
| 20171 | 131,335 | 185,475 | 316,810 | 1,386,964 | 21,501 |
| History | 26 | Page |
NI 43-101 Technical Report | December 22, 2020 |
Table 6.4: Production Summary, GMC
| Year | Tonnes Mill/Mine GTO | Tonnes Mill/Mine San Ignacio | Tonnes (milled) | Ag (oz) | Au (oz) |
| 20181 | 88,364 | 212,650 | 301,014 | 1,096,757 | 19,073 |
| 20191 | 7,610 | 179,886 | 187,610 | 590,781 | 11,588 |
| 20201,2,3 | 15,563 | 65,851 | 82,639 | 291,105 | 3,977 |
| Total | 994,033 | 1,012,045 | 3,078,439 | 14,344,102 | 171,362 |
Source: Great Panther Annual reports for 2006 to 2019 inclusive
| 1. | 2006-2015 reported figures reflect tonnes milled, 2016-2020 reported figures reflect tonnes mined which has a small discrepancy to tonnes milled. |
| 2. | 2020 details from production records to July 31, 2020 |
| 3. | The operations at the GMC were suspended from April 2, 2020 through June 3, 2020 on account of the directive of the Mexican Federal Government to mitigate the spread of COVID-19. |
| 6.4.1 | San Ignacio |
Great Panther has recovered material from low-grade surface stockpiles (San Jose de Gracia shaft area) on the San Ignacio property and processed it in the GMC plant. A total of 10,252 tonnes averaging 0.42g/t Au and 61g/t Ag were processed since the start of the campaign in March 2011 ending in March 2012. Mine development by Great Panther commenced in October 2013. Production from San Ignacio is tabulated from production records from late 2013 to July 31, 2020 (see Table 6.5) and totals 1,012,044 tonnes grading 118g/t Ag and 2.83g/t Au. Blending of the Guanajuato & San Ignacio began in July 2016 and the processing (milling) of the blended ore has continued to the present.
Table 6.5: Production Summary, San Ignacio
| Year | Tonnes | Ag (g/t) | Au (g/t) |
| 2013 | 1,082 | 121 | 2.11 |
| 2014 | 54,154 | 129 | 2.49 |
| 2015 | 129,253 | 147 | 3.19 |
| 2016 | 183,694 | 120 | 2.99 |
| 2017 | 185,475 | 115 | 3.11 |
| 2018 | 212,650 | 105 | 2.57 |
| 2019 | 179,885 | 110 | 2.31 |
| 20201, 2 | 65,851 | 113 | 1.89 |
| Total | 1,012,044 | 118 | 2.83 |
Note:
| 1. | 2020 details from production records to July 31, 2020 |
| 2. | The operations at the GMC were suspended from April 2, 2020 through June 3, 2020 on account of the directive of the Mexican Federal Government to mitigate the spread of COVID-19. |
During the effective period of this report, September 1, 2019 to July 31, 2020, San Ignacio produced 139,583 tonnes grading 116g/t silver and 2.08g/t gold, at a rate of 668 tonnes per operating day.
| History | 27 | Page |
NI 43-101 Technical Report | December 22, 2020 |
| 7.0 | Geological Setting and Mineralization |
| 7.1 | Regional Geology |
The GMC is in the Guanajuato Mining District, which is in the southern part of the Mesa Central physiographic province. The Mesa Central is an elevated plateau of Cenozoic volcanic and volcaniclastic rock (66 Ma to present) located in central Mexico. It is bounded to the north and east by the Sierra Madre Oriental, to the west by the Sierra Madre Occidental, and to the south by the Trans-Mexican Volcanic Belt.
Rocks within the Mesa Central consist of a Paleocene to Pliocene sequence of dacite-rhyolite, andesite, and basalt, (66 Ma to present), with related intrusive bodies and intercalated local basin fill deposits of coarse sandstones and conglomerates. This Cenozoic volcanic-sedimentary sequence overlies a package of deformed and weakly metamorphosed Mesozoic submarine mafic volcanic and turbidite rocks.
Within the Mesa Central, the GMC is situated within the Sierra de Guanajuato, a northwest-trending anticlinal structure approximately 100 km long and 20 km wide (see Figure 7.1). The strata within the belt are transected by northwest, north, east-to-west, and northeast-trending regional scale faults. It is predominantly the northwest-trending structures that control the position of mineralization. Normal fault movement along northeast-trending faults resulted in the downward displacement of certain blocks and the preservation of strata that was eroded in other areas. The northwest faults and structural intersections along these faults are therefore important locators of mineral camps within the belt.
Cretaceous volcanic rocks (145 Ma – 79 Ma) of La Luz Basalt underlie the San Ignacio property. These rocks are part of a volcanic-sedimentary complex that has various tectonic interpretations, but in general preserves a tectonic history though to be related to a north-eastward tectonic thrust event. By contrast, much of the area to the south (e.g., in and around Guanajuato property) is underlain by a series of Tertiary volcanic rocks that lie unconformably on top of the La Luz Basalt. The lower Guanajuato Conglomerate is widespread and is of mid-Eocene to early Oligocene (41.2 Ma - 27.82 Ma). Later volcanic rocks were deposited unconformably on the Guanajuato conglomerate in a caldera setting at the intersection of regional northeast and northwest mid-Oligocene extensional fracture systems.
Three main northwest-trending precious metal-bearing vein systems occur in the district as follows: The Sierra, Veta Madre, and La Luz systems (see Figure 7.1).
The low sulphidation epithermal system deposit characteristics encountered in the Rayas, Cata, Valenciana, Guanajuatito, Pozos, San Vicente, San Cayetano and Santa Margarita zones in the Guanajuato mine are:
| ¢ | Quartz-adularia vein / breccia system |
| ¢ | Shear controlled |
| ¢ | Vertical extension over 700m |
| ¢ | Native Silver |
| ¢ | Electrum |
| ¢ | Sulphides and Ag-sulphides |
| ¢ | Sulphosalts |
| ¢ | Quartz and calcite |
| ¢ | accessory pyrite, galena, sphalerite, and chalcopyrite |
| Geological Setting and Mineralization | 28 | Page |
NI 43-101 Technical Report | December 22, 2020 |
San Ignacio includes low sulphidation epithermal system deposits characterized by:
| ¢ | quartz-calcite vein / breccia system |
| ¢ | shear controlled |
| ¢ | vertical extension 200m |
| ¢ | silver (acanthite and pyrargyrite), gold (electrum) |
| ¢ | very low sulphide content (pyrite) |
Figure 7.1: Guanajuato regional geology
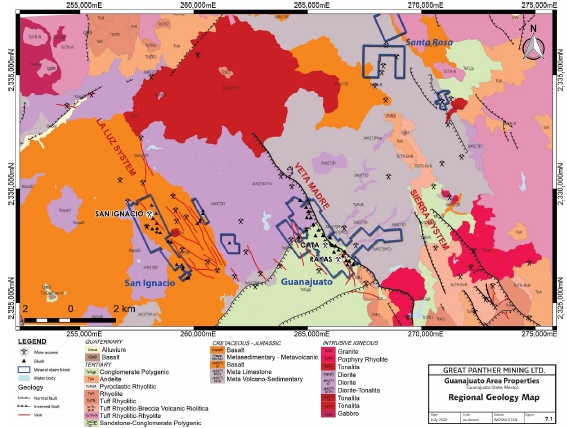
Source: modified from Servicio Geologico Mexicano, 1998. Carta Geologico-Minera, Guanajuato F14-C43, & Servicio Geologico Mexicano, 1999. Carta Geologico-Minera, Guanajuato F14-C42 1: 50,000 regional geology maps
| 7.2 | Local & Property Geology |
The Guanajuato Mining District is underlain by Mesozoic marine sediments and predominantly mafic submarine lava flows, (252 Ma – 66 Ma), of the Luz and Esperanza Formations, which are weakly metamorphosed and intensely deformed. This basal sequence is cut by a variety of intrusive bodies ranging in composition from pyroxenite to granite with tonalitic and dioritic intrusive being the most volumetrically significant.
| Geological Setting and Mineralization | 29 | Page |
NI 43-101 Technical Report | December 22, 2020 |
7.2.1 Guanajuato
At Guanajuato, Cenozoic volcanic and volcanogenic sediments unconformably overlie the Mesozoic basement rocks. In the area, the oldest Cenozoic unit is the Paleocene Comanja granite, (66 Ma – 56 Ma), this was followed by the Eocene extrusion of andesite (56 Ma – 33.9 Ma) which was sporadically deposited and contemporaneous with the deposition of the Guanajuato conglomerate in localized grabens. The Guanajuato conglomerate underlies an unconformity beneath a sequence of felsic to mafic volcanic rocks that consist of Oligocene ignimbrites, lava flows and domes (33.9 Ma – 23 Ma). The local area geology is shown on Figure 7.2.
The country rocks are transected by numerous faults which host precious metal-bearing veins, stockworks and breccia. The veining and mineralization is early Oligocene in age and hence contemporaneous with the eruption of felsic – intermediate volcanic rocks. The primary strike direction of the faults which host the mineralized veins is northwest. Of lesser significant are the north-south, east-west, and northeast orientations. Principal fault systems in the Guanajuato camp are the La Luz, Sierra, and Veta Madre as displayed on Figure 7.1. The Veta Madre hosts the Mineral Resource that is the subject of this report. The Veta Madre structure is traceable for 25 km through the district. It strikes northwest southeast and dips at ~45 degrees to the southwest. A longitudinal section along the plane of the main productive portion of the Veta Madre is shown as Figure 7.3.
Figure 7.2: Local geology, Guanajuato
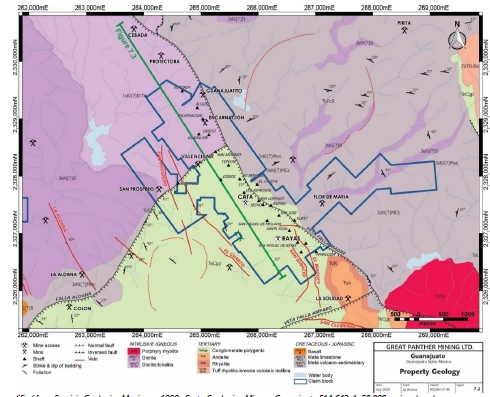
Source: modified from Servicio Geologico Mexicano, 1998. Carta Geologico-Minera, Guanajuato F14-C43, 1: 50,000 regional geology map.
| Geological Setting and Mineralization | 30 | Page |
NI 43-101 Technical Report | December 22, 2020 |
Figure 7.3: Long section along the plane of the Veta Madre, Guanajuato
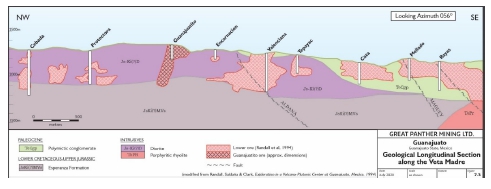
7.2.2 San Ignacio
The San Ignacio property is underlain by a monotonous package of basalt (Kbas) and andesite (Kanlf) volcanic rocks belonging to the lower Cretaceous La Luz andesite (Randall R. et al., 1994; Stewart, 2006; Baker, 2012). The basalt generally has subtle to well-developed pillow structures that are locally flattened. In a few localities, inter-pillow hyaloclastite is present and is characterized by a fine breccia composed of devitrified glass shards in a fine groundmass. Primary layering and tops-up indicators are generally difficult to determine from the small outcrops typical of the property, but according to Stewart (2006), the San Ignacio property stratigraphy is not overturned.
Andesite is generally massive to locally feldspar-phyric to laminated (very rarely) and was probably formed by accumulation of a series of extrusive flows and ash falls.
Locally, these volcanic rocks have interbeds composed of sandstone, siltstone, or fine, pale ash layers (generally sericite-quartz). A more coarse-grained felsic (possibly dacite) unit is exposed northwest of the San Jose mine in the southern part of the property. Where observed, bedding is generally shallowly dipping.
The mapped distribution of basalt and andesite units is consistent with a lower unit of pillowed basalt, overlain and broadly in-folded with andesite. Although Stewart (2006) mapped mostly basalt across the San Ignacio property, he also reported that the stratigraphy east of Guanajuato generally consists of a lower pillowed basalt unit overlain by varied andesite volcanic rocks, so it is likely that similar stratigraphy is present at San Ignacio.
The mapped distribution of basalt and andesite units is consistent with open, shallowly plunging, property-scale folding.
Two types of dykes are present on the property, and both are quite rare. In the northern part of the property, a few fine-grained mafic dykes are exposed and preserve foliation and fractures like the host volcanic rocks, so these dykes are probably quite early. Fine-grained felsic dykes occur locally near the Veta Nombre de Dios structure, and are generally moderately silicified with minor fine-grained pyrite.
The interpreted property geology map is presented in Figure 7.4.
| Geological Setting and Mineralization | 31 | Page |
NI 43-101 Technical Report | December 22, 2020 |
Figure 7.4: Local geology, San Ignacio
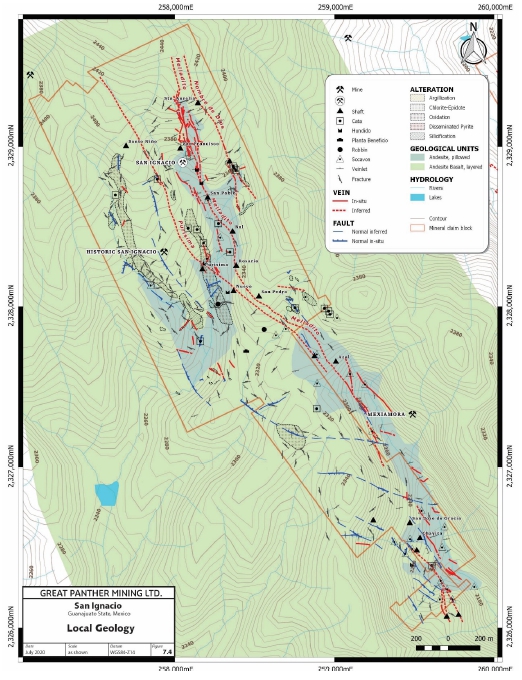
| Geological Setting and Mineralization | 32 | Page |
NI 43-101 Technical Report | December 22, 2020 |
| 7.3 | Mineralization |
Mineralization at the GMC is closely associated with the structural history.
7.3.1 Guanajuato
The “Veta Madre” quartz-adularia vein / breccia system is closely associated with the Veta Madre fault and an associated diorite dyke (thickness varying from discontinuous lenses at Guanajuatito to a 50-100m thick body in the Cata, Los Pozos, and Santa Margarita areas), oriented 325-degrees with a 45-degree southwest dip. The Veta Madre forms along the dyke contacts, and in the footwall Esperanza Formation. Plan and longitudinal map depictions of the mineralized zones along the Veta Madre are shown in Figure 7.5, and Figure 7.6.
The mineralizing event is thought to have taken place during the early Oligocene, a period of intense felsic volcanic activity in the area, and comprised three stages termed pre-ore, ore, and post-ore. Pre-ore mineralization consists of trace silver and gold with accessory quartz and adularia. Ore mineralization comprises an early silver-rich phase associated with adularia, as well as a later low-silver variant, which is typified by calcite and quartz. The post-ore mineralization is also precious metal poor, with accessory calcite, dolomite, and fluorite. Zone thickness ranges from centimeter-scale to tens of meters.
The vertical extent of the deposits at Guanajuato spans over 600 meters. Mineralization occurring above the 2,100-meter elevation was termed “upper ore”, between 2,100 meter and 1,700 meter “lower ore”, and below the 1,700-meter elevation “deep ore” (Randall, 1994). Fluid inclusion data (Moncada, 2011) from over 850 samples gathered through the mine and in deep drilling from the Santa Margarita area, indicated boiling zones from the 2,100-meter to 1500-meter (deepest drilling at the GMC) elevations. Moncada’s work, along with Barclay and Rhys’s structural observations suggest up to eight (8) stages of crosscutting brecciation. The variable range of Ag:Au ratios indicate that the mineralization along the Veta Madre is associated with multi-phase structural activity and fluid flow.
The best mineralization is often found related to bends in the Veta Madre orientation (Barclay, 2007 and Rhys, 2013) such as at San Vicente in the Rayas area, and at Cata and Santa Margarita. These structural bends may be due to changes in rock type competencies, and varying thickness of the diorite dyke. The potential to find further mineralization both laterally, and in parallel breccia structures to know precious metal mineralization zones is considered excellent.
The primary commodities of economic importance are silver and gold, with silver the more important of the two. Base metals do not normally occur in economic concentrations. Average silver grades of the ore are typically in the 100g/t Ag to 500g/t Ag range but locally can be over 1,000g/t Ag. Gold grades are generally in the 0.5g/t Au to 2g/t Au range, except for Santa Margarita where average grades are in the range of 5-7g/t Au. Relative gold and silver contents at Santa Margarita are quite different from Cata, Los Pozos and Guanajuatito. The average silver to gold ratio in Cata is roughly 225:1, at Pozos 250:1, at Guanajuatito 275:1 while at Santa Margarita 3.5:1. Within the mine, drill core and channel samples are not normally analysed for base metals so an average grade for Cu, Pb or Zn is not obtainable.
There are no current estimates of Mineral Reserves for any of the GMC. The Company made decisions to enter into production at Guanajuato and San Ignacio without having completed final feasibility studies. Accordingly, the Company did not base its production decisions on any feasibility studies of Mineral Reserves demonstrating economic and technical viability of the GMC.
| 7.3.1.1 | Guanajuatito Veins |
At the Guanajuatito area the main mineralization occurs just into the footwall Esperanza Formation deformed siltstone and shale. Six zones were block modelled at Guanajuatito, with the Veta Madre and the closely associated footwall (FW) zone being dominant below the 80 level. The Guanajuatito area geology and mineralization, and 3D models and workings are depicted on sections in Figure 7.7 and Figure 7.8.
| Geological Setting and Mineralization | 33 | Page |
NI 43-101 Technical Report | December 22, 2020 |
| 7.3.1.2 | Valenciana Veins |
At the Valenciana area there are parallel mineralized structures (Veta Madre) at the Esperanza Formation – Diorite contact, and into the Esperanza Formation. A total of seven Valenciana zones were block modelled. The Valenciana area geology and mineralization, and 3D models and workings are depicted on sections in Figure 7.9 and Figure 7.10.
| 7.3.1.3 | Cata Veins |
At the Cata area, Veta Madre mineralization occurs along the base of the diorite dyke near the footwall contact with the Esperanza Formation, and as seven separately block modelled zones within the diorite. Several of these zones are shallow dipping structural splays. The Cata area geology and mineralization, and 3D models and workings are depicted on sections in Figure 7.11 and Figure 7.12.
| 7.3.1.4 | Los Pozos Veins |
The Los Pozos area zones, between Cata and Rayas shafts, are comprised of five vein stockwork to breccia systems (Veta Madre) at the base of the diorite dyke and into the Esperanza Formation, as well as on the upper diorite dyke contact with the Guanajuato Formation conglomerates. The Los Pozos area geology and mineralization, and 3D models and workings are depicted on sections in Figure 7.13 and Figure 7.14.
| 7.3.1.5 | Santa Margarita Veins |
The Santa Margarita area zones form a complex structural set of three bodies within the diorite dyke and at its upper contact with the Guanajuato Formation conglomerates or basal andesite. These are above the Veta Madre breccia which is at the diorite contact with the footwall Esperanza Formation. The Santa Margarita area geology and mineralization, and 3D models and workings are depicted on sections in Figure 7.15 and Figure 7.16.
| 7.3.1.6 | San Cayetano Veins |
The San Cayetano area zone occurs deep in the Veta Madre south of the Rayas shaft and tend to be narrow and often in the upper portion of the Veta Madre structure. Notable at San Cayetano is that the two breccia zones contain minor amount of chalcopyrite, galena, and sphalerite, along with pyrite, in association with gold and silver values. The San Cayetano area geology and mineralization, and 3D models and workings are depicted on sections in Figure 7.15 and Figure 7.16.
| 7.3.1.7 | Promontorio Veins |
The Promontorio area zones occur in the hanging-wall Guanajuato Formation conglomerates immediately above the Veta Madre structure at the contact of the Guanajuato Formation and the diorite dyke, and as well in the diorite dyke. The Promontorio area geology and mineralization, and 3D models and workings are depicted on sections in Figure 7.17 and Figure 7.18.
| Geological Setting and Mineralization | 34 | Page |
NI 43-101 Technical Report | December 22, 2020 |
Figure 7.5: Guanajuato mineralization interpretation and zones, plan view
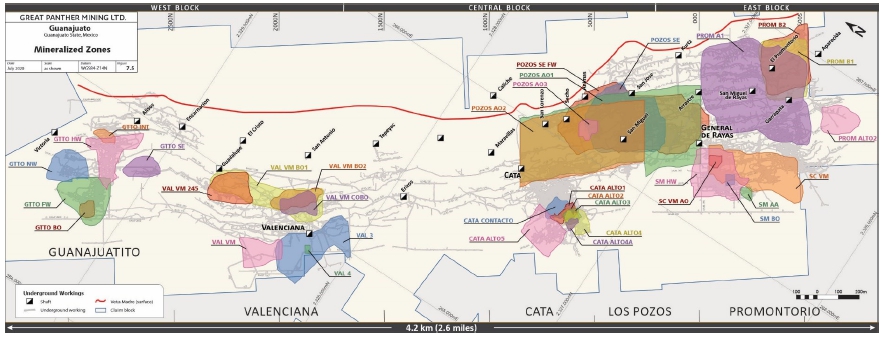
Figure 7.6: Guanajuato mineralization interpretation and zones, longitudinal view
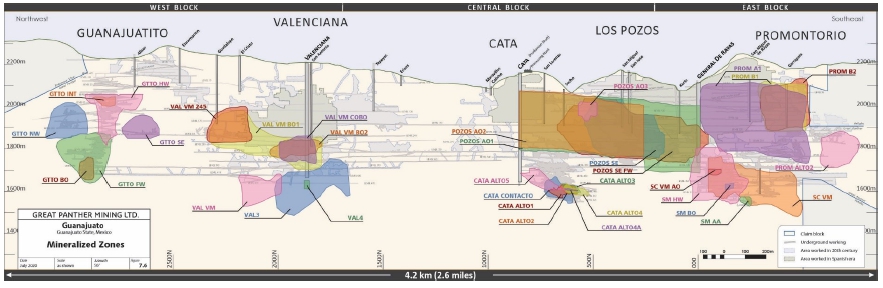
| Geological Setting and Mineralization | 35 | Page |
NI 43-101 Technical Report | December 22, 2020 |
Figure 7.7: Geology and mineralization, section view 2925N, Guanajuatito area
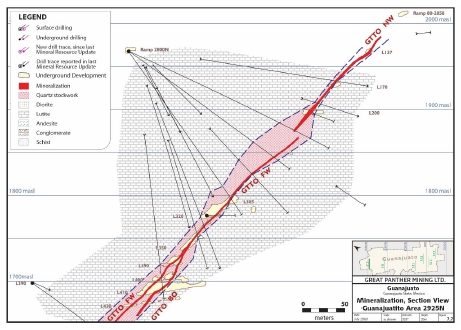
Figure 7.8: 3D model of mineralization and U/G workings, Guanajuatito area
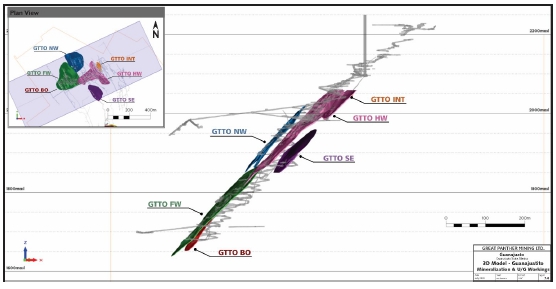
| Geological Setting and Mineralization | 36 | Page |
NI 43-101 Technical Report | December 22, 2020 |
Figure 7.9: Geology and mineralization, section view 2150N, Valenciana area
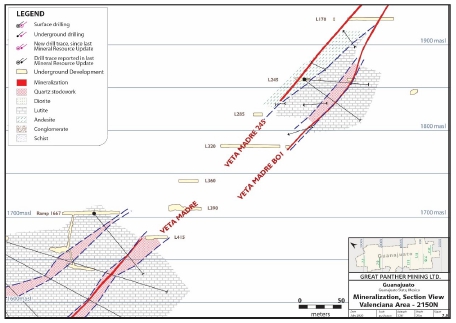
Figure 7.10: 3D model of mineralization and U/G workings, Valenciana area
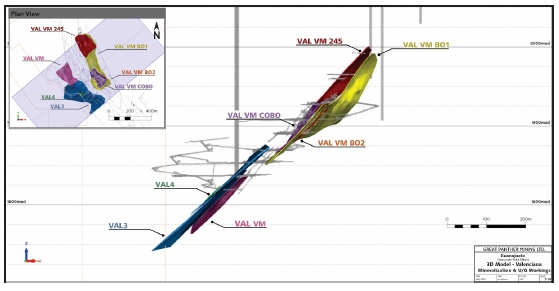
| Geological Setting and Mineralization | 37 | Page |
NI 43-101 Technical Report | December 22, 2020 |
Figure 7.11: Geology and mineralization, section view 600N, Cata area
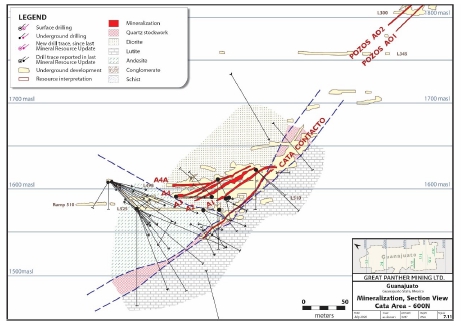
Figure 7.12: 3D model of mineralization model and U/G workings, Cata area
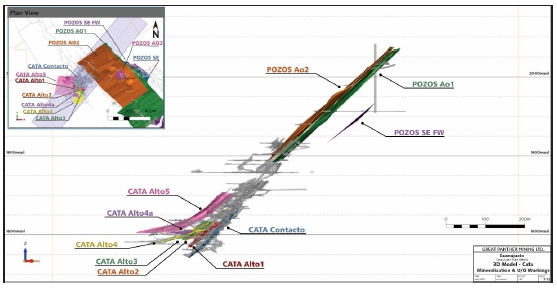
| Geological Setting and Mineralization | 38 | Page |
NI 43-101 Technical Report | December 22, 2020 |
Figure 7.13: Geology and mineralization, section view 175N, Los Pozos area
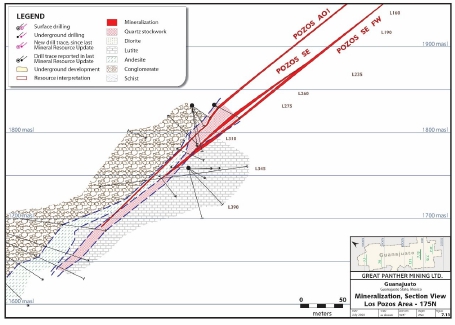
Figure 7.14: 3D model of mineralization model and U/G workings, Los Pozos area
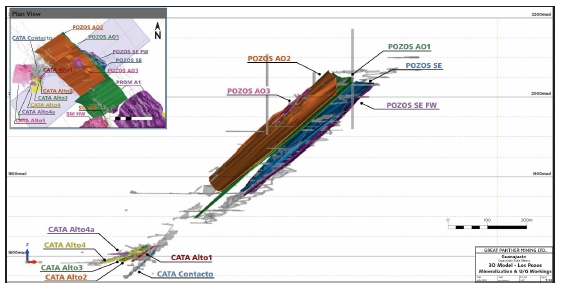
| Geological Setting and Mineralization | 39 | Page |
NI 43-101 Technical Report | December 22, 2020 |
Figure 7.15: Geology and mineralization, section view 75S, Santa Margarita & San Cayetano areas
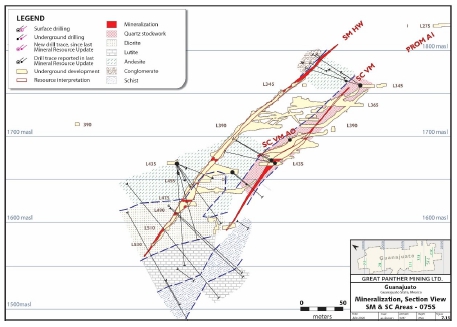
Figure 7.16: 3D model of mineralization model and U/G workings, Santa Margarita & San Cayetano areas
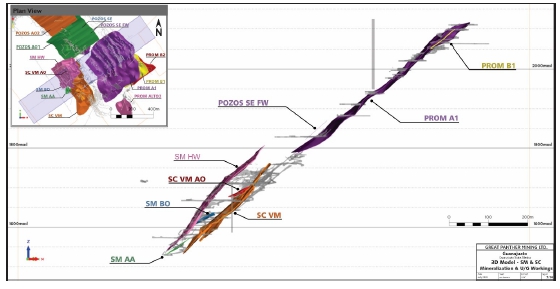
| Geological Setting and Mineralization | 40 | Page |
NI 43-101 Technical Report | December 22, 2020 |
Figure 7.17: Geology and mineralization, section view 450S, Promontorio area
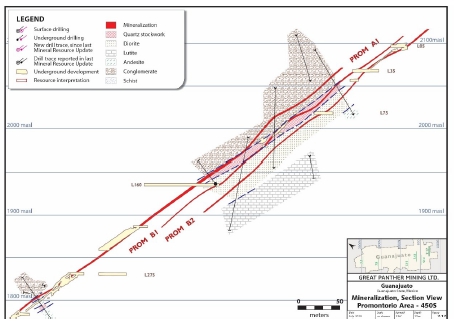
Figure 7.18: 3D model of mineralization model and U/G workings, Promontorio area
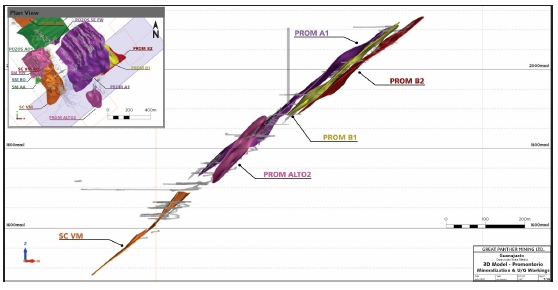
7.3.2 San Ignacio
The most important phase of mineralization in the Guanajuato district consists of epithermal silver-gold veins contained within northwest-trending, Cenozoic-age faults. La Luz structure consists of numerous mineralized fractures in a north-westerly trending orientation, which extends for a known strike of approximately 8 km long. Historically productive veins on the property include Veta Melladito, and Veta Purisima. Veins identified in the recent Great Panther drilling are the Melladito, Melladito BO, Intermediate, Intermediate 2, Nombre de Dios, Nombre de Dios 1.5, Nombre de Dios 2, Nombre de Dios 2S, Nombre de Dios 3, Melladito South, 700, Purisima, Purisima HW, Purisima Int., Purisima Bo, and Santo Nino (Figure 7.19). Mineralization is contained within tabular veins, vein stockwork, and breccias. The sixteen veins with structural continuity inferred from surface mapping and diamond drilling from surface, and now with extensive underground development, have been defined up to 2,200 meters along strike and 150 meters down dip. The Melladito and Intermediate veins (6) of the veins are very steeply dipping, the Nombre de Dios veins (5) are shallowly dipping (45-50 degrees west) and are likely off-shoots of the Intermediate veins, and the Purisima veins (5) are shallowly dipping at 45-50 degrees to the west (Figure 7.20 to Figure 7.22). The veins are accompanied by hydrothermal alteration, consisting of argillic, phyllic, silicic, and propylitic facies.
| Geological Setting and Mineralization | 41 | Page |
NI 43-101 Technical Report | December 22, 2020 |
The primary commodities of economic importance are silver and gold with approximately equal contributions of each. Mineralization consists of fine-grained disseminations of acanthite and pyrargyrite (silver minerals), electrum (gold-silver mineral), with accessory pyrite, and very minor sphalerite and chalcopyrite. Mineral textures in this zone are typically fracture filling, drusy, and coliform masses.
Average silver grades of the sixteen veins range from 58g/t to 237g/t and the average gold grades from 1.65g/t to 3.84g/t.
Figure 7.19: 3D model of mineralization and U/G workings, San Ignacio
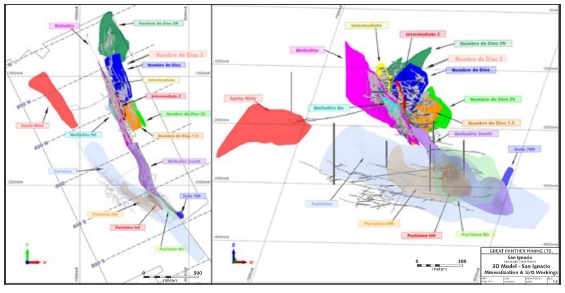
| Geological Setting and Mineralization | 42 | Page |
NI 43-101 Technical Report | December 22, 2020 |
Figure 7.20: Mine access and Melladito, Intermediate & Nombre de Dios veins, cross section 450N, San Ignacio
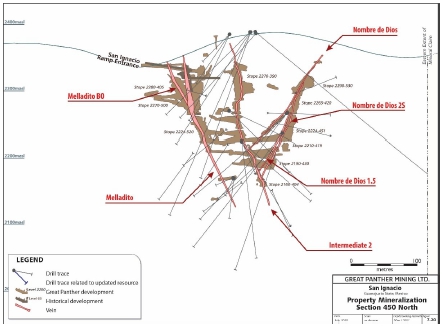
Figure 7.21: Nombre de Dios 2N vein, cross section 1000N, San Ignacio
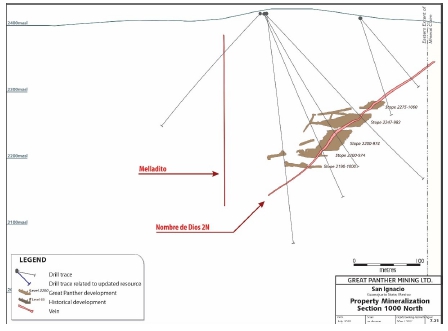
| Geological Setting and Mineralization | 43 | Page |
NI 43-101 Technical Report | December 22, 2020 |
Figure 7.22: Purisima & Melladito South veins, cross section 450S, San Ignacio
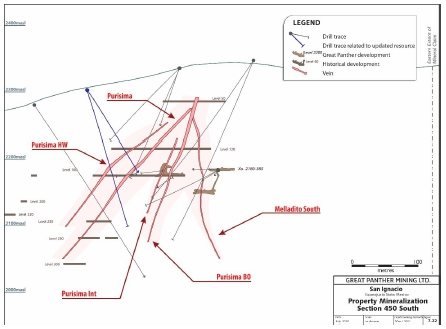
| 7.3.2.1 | Melladito veins |
The Melladito vein is a steep east dip vein with true width ranging 0.25 meters to 19.5 meters. It has been delineated to a maximum of 1,450 meters along strike and 350 meters below surface. The structure is open at depth and along strike; however, the strongest mineralization has been observed in a core zone 550 meters in strike length and from surface to 150 meters down dip.
The Melladito BO vein is a sigmoidal loop on the footwall side of the Melladito vein between 200-500N. It is steeply east dipping and has an average width of 2.5 meters. Silver-gold grades in the thicker sections are often on the footwall side.
The Melladito South vein, a steep east dipping structure of 1-2m width, is noted from 0S to ~650S where it both traces off the property and plunges below the Purisima vein.
| 7.3.2.2 | Intermediate veins |
The Intermediate vein is also steeply dipping and narrow with true width ranging 0.25 to 8.5 meters. It has been delineated for 400 meters along strike and 350 meters below surface. It is a splay of the Melladito vein and merges into the Melladito vein at approximately 475N. Further south the structure continues as the Melladito vein.
The Intermediate 2 vein is positioned east of the Intermediate vein, and likewise is a near vertically dipping relatively narrow (approximately 1.0 meter) vein.
| 7.3.2.3 | Nombre de Dios veins |
The Nombre de Dios vein is shallow dipping at 45 to 60 degrees to the southwest and narrow with true width ranging from 0.25 to 4 meters. It has been delineated for 600 meters along strike and 180 meters down dip. The vein is open to the south. At depth, Nombre de Dios appears to intersect the Intermediate and Melladito veins and is therefore limited in its potential down dip extent. To the north, it terminates at line 850N where it may continue in Nombre de Dios 2N with a 40-meter offset to the east.
| Geological Setting and Mineralization | 44 | Page |
NI 43-101 Technical Report | December 22, 2020 |
Nombre de Dios 2S is a parallel vein to Nombre de Dios and Nombre de Dios 1.5 structures. It has been delineated for 300m from 150N to 450N. The vein dips 70 degrees to the southwest. The average width of this vein is 1.5 meters.
The Nombre de Dios 2 vein is shallow dipping at 45 degrees to the southwest and narrow with true width ranging from 0.25 to 4 meters. It has been delineated for 400 meters along strike and 100 metres down dip. The vein is open to the north. To the south, it terminates at line 850N where it may continue in Nombre de Dios 1 with a 40-metre offset to the west.
The Nombre de Dios 1.5 is a parallel vein located between the Nombre de Dios and Nombre de Dios 2S veins. It has been delineated for 400m from 150N to 550N. The vein dips 60 degrees to the southwest. The average width of this vein is 1 meter.
The Nombre de Dios 3 vein is a small segment which is near vertical dipping and could be a fault offset of the Intermediate 2 vein.
| 7.3.2.4 | Purisima veins |
The Purisima vein dips at 45-50 degrees to the southwest, and ranges in width from 0.5 to 3 meters. It strikes NNW north of the old San Ignacio mine shaft, but at the shaft swings to a northwest orientation, then merges with the Melladito South vein at 400S where it bends back to a north-northwest orientation.
Purisima BO is a footwall splay to Purisima dipping at 75 degrees to the southwest. It includes a 10-meter-wide bulge in the northern part, but generally is 1-2 meters thick vein. Both Purisima and Purisima BO were sites of mining from the 17th to early 20th centuries (old San Pedro and Mexiamora shafts) and the Company is looking at in-situ remnants below old exploitation levels or along strike of old development.
The Purisima Int. vein occurs between the Purisima Bo and Purisima vein, in a complex area where the Purisima veins are merging with the Melladito vein system.
The Purisima HW vein is being defined by core drilling and is ~20m above the Purisima vein. Most of the Purisima HW vein, typically 0.5-2m thick, seems to be mostly in-situ, but some historical mining has occurred along the structure.
The Santo Nino vein is the northern continuation of the Purisima vein in the old Santo Nino shaft area. Some mining has occurred along the Santo Nino vein, where width is typically 0.5-1.5m.
| Geological Setting and Mineralization | 45 | Page |
NI 43-101 Technical Report | December 22, 2020 |
| 8.0 | Deposit Type |
The mineral deposits in the Guanajuato area are classic fissure-hosted low-sulphidation epithermal gold-silver-bearing quartz veins and stockwork. Mineralization of economic importance consists of fine-grained disseminations of acanthite, electrum, aguilarite, and naumannite with accessory pyrite, and relatively minor sphalerite, galena, and chalcopyrite. Gangue minerals include quartz, calcite, adularia, and sericite. The veins are accompanied by hydrothermal alteration consisting of argillic, phyllic, silicic, and propylitic facies. Mineral textures in this zone are typically fracture-filling, drusy, and coliform masses.
Epithermal systems, form near surface, usually in association with hot springs, and at depths in the order of several hundred’s meters below the paleosurface. Hydrothermal processes are driven by remnant heat from volcanic activity, which in the case of Guanajuato occurred in the middle to late Tertiary. Circulating thermal waters, rising through fissures, eventually reach the “boiling level” where the hydrostatic pressure is low enough to allow boiling to occur. This can impart a limit to the vertical extent of the mineralization as the boiling and deposition of minerals is confined to a relatively narrow band of thermal and hydrostatic conditions. In many cases, however, repeated healing and reopening of host structures can occur, which causes cyclical vertical movement of the boiling zone, resulting in mineralization that spans a much broader range of elevations. This appears to have occurred at Guanajuato.
Epithermal type precious metal deposits in the La Luz vein system and specifically in the San Ignacio operation area are strongly vertically controlled and pinch to centimeter scale at surface, associated with weak shear zones, minor argillic alteration, and weakly anomalous precious metal values. The mineralized vertical interval typically is 100 meters to 150 meters; however, it can range from 50 meters to well beyond 250 meters.
Epithermal type precious metal deposits in the Veta Madre vein system and specifically in the Guanajuato operation area are strongly vertically controlled. The mineralization at Guanajuato is more related to fault filling silica breccias than specific veins. Historically, mineralization was between 2,100 and 1,800m masl, with specific steep plunging shots going down to. 1,600masl. Great Panther is focusing exploration attention on the upper portion of the system, specifically on parallel structures both in the hanging and foot-walls of the Veta Madre.
| Deposit Type | 46 | Page |
NI 43-101 Technical Report | December 22, 2020 |
| 9.0 | Exploration |
| 9.1 | Summary of Non-Drilling Exploration Activity |
9.1.1 Guanajuato
Exploration work conducted by Great Panther has consisted almost exclusively of diamond drilling, primarily from underground. The drilling is described in more detail in Section 10 of this report. In 2016 a program was initiated to re-evaluate the “Old Stopes” throughout Guanajuato looking for unmined mineralized segments of the Veta Madre or hanging and foot-wall structures. This work started in the upper part of the Rayas area and is progressing at depth and to the northwest. It continued through 2017 and into 2018 on an ad-hoc basis. In late 2018 with the temporary closure of Guanajuato imminent, the program was re-initiated using geological staff from Guanajuato being seconded into the Exploration group. A program of geological mapping and sampling was carried out on all accessible levels from November 2018 to July 2020 and will continue as further historical levels are checked and rehabilitated.
Underground exploration sampling since the last TR (effective date October 31, 2019) until July 31, 2020 totals 10,252 samples. The sampling was done as part of a comprehensive review of historical data, and re-mapping and re-sampling of accessible historical areas to develop zones of interest for targeting by core drilling. These samples are represented in plan and longitudinal section as Figure 9.1 and Figure 9.2.
Three underground drill rigs were contracted in May 2019 to begin an aggressive drilling program based on historical and recently acquired data. The drilling program is focused on the upper levels of the mine in the Promontorio, Los Pozos, Santa Margarita, and Valenciana areas.
9.1.2 San Ignacio
Great Panther has conducted geological and structural mapping, including sampling of outcrops and from exposures in historical underground workings; and underground development including geological mapping, sampling, and mining.
Great Panther completed detailed surface mapping and outcrop rock chip sampling, including mapping and sampling of all accessible underground workings pre-2014. Further detailed geological and structural mapping was completed in 2015 and is ongoing which includes 717 surface and various short adit chip and channel samples as seen in Figure 9.3. As of the effective date of this TR, 67,398 chip and channel underground samples have been collected, of which 8,289 were collected after the previous TR effective date.
Dr. Darcy Baker of Equity Exploration Consultants completed structural mapping and logging of one diamond core hole in February 2011. David Rhys (2013) spent one day reviewing the structural geology and collecting petrographic samples from drill core. Petrographic and Scanning Electron Microscope work was completed by Katherina Ross (2013) on core samples of Melladito and Intermediate veins.
The exploration work has confirmed that the top of the mineralized epithermal system is below surface, estimated at approximately 2,350 masl in the northern portion of the project and 2,250 masl in the southern part of the project. This vertical limit was indicated on longitudinal sections from the historical operations of the Cooperative on veins on the San Ignacio property, and from longitudinal sections of deposits on an adjacent property owned by Endeavour Silver. The strong vertical control on mineralization is characteristic of the area and the mineralized intervals are typically 100m to 150m in vertical range; however, in cases, it can range from 50m to greater than 250m.
Detailed geological mapping, structural geological studies, outcrop sampling, drift development and re-sampling of old underground workings are ongoing to highlight additional priority targets along the 4km of prospective structures. The underground development along both Intermediate and Melladito veins confirms the geological and grade continuity of the veins.
| Exploration | 47 | Page |
NI 43-101 Technical Report | December 22, 2020 |
During 2018 and 2019 exploration efforts were focused on both surface and underground drilling at San Ignacio. Mining is on-going in the northern extent of the project along the Nombre de Dios veins, and an exploration / development ramp is being driven south into the old San Pedro mine area, where the Purisima vein system merges with the Melladito vein system. In 2019 surface exploration efforts have been focused on both the Nombre de Dios vein extension north, and on the Melladito and Purisima veins orientation in the old San Pedro mine area. In 2020 surface drilling has exclusively focused on the old San Pedro mine to old San Ignacio shaft area, along the Purisima vein trend.
| Exploration | 48 | Page |
NI 43-101 Technical Report | December 22, 2020 |
Figure 9.1: Guanajuato U/G exploration sampling, plan view
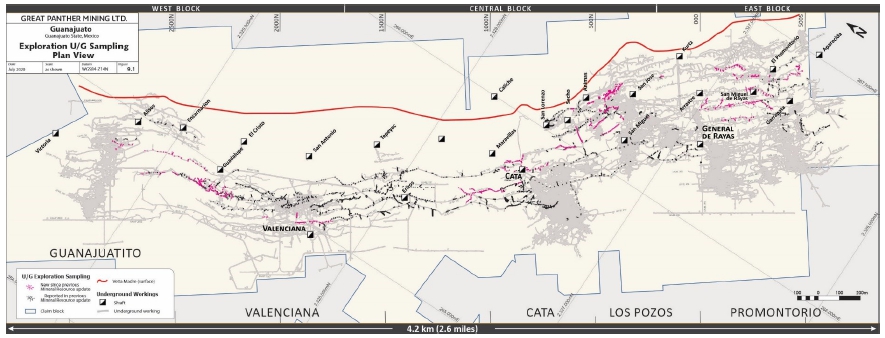
Figure 9.2: Guanajuato U/G exploration sampling, longitudinal view
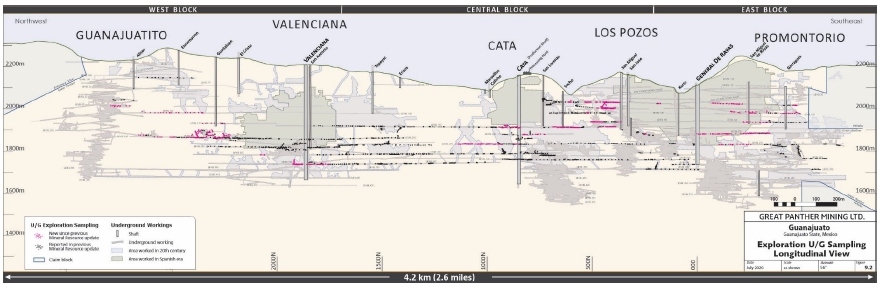
| Exploration | 49 | Page |
NI 43-101 Technical Report | December 22, 2020 |
Figure 9.3: San Ignacio exploration surface and short adit sampling activity
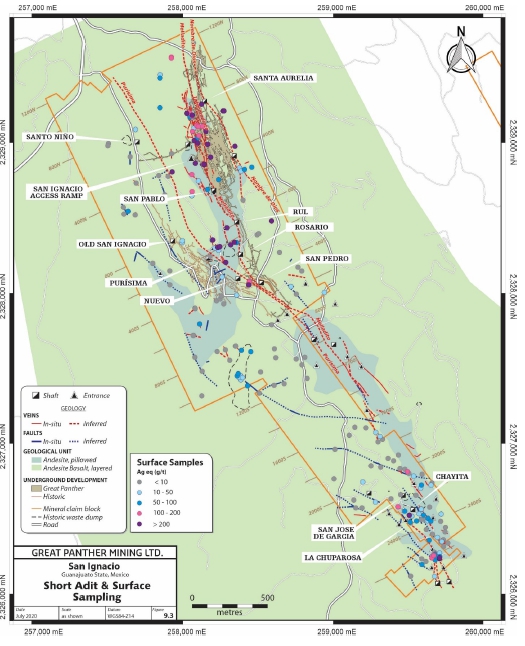
| Exploration | 50 | Page |
NI 43-101 Technical Report | December 22, 2020 |
| 10.0 | Drilling |
| 10.1 | Drilling Summary |
Diamond drilling at GMC is conducted under two general modes of operation: one by the exploration staff (exploration drilling) and the other by the mine staff (production and exploration drilling). Production drilling is predominantly concerned with definition and extension of the known zones, to confirm and upgrade the resources and to guide development and mining and is generally done to provide access for sampling and localized knowledge of the vein position which regularly pinches and swells.
Exploration drilling is conducted further from the active mining area with the goal of expanding the mineral resource base. Drilling results from both programs are used in the estimation of Mineral Resources. Since Guanajuato went into C&M status at the end of 2018, all post-2018 drilling has been conducted by the exploration staff.
10.1.1 Guanajuato
Since the start of C&M exploration staff have made a concerted effort compiling historical data, geological mapping, sampling, and drilling to find extensions of various orebodies and new targets for exploration. Drilling to date in 2020 has been focused in the Promontorio, Los Pozos, Santa Margarita, and Valenciana areas. A drill-hole location plan map current as at the end of July 2020 is presented as Figure 10.1 and a longitudinal view of the drill holes is shown as Figure 10.2. Exploration drilling is carried out with the use of three underground contract drills. The three contract drills are focused on upgrading mineral resource definition, and in drilling new targets. Upgrading of resources is being carried out at the Los Pozos, Valenciana, and Promontorio zones.
Overall, the core recovery of mineralized zones was excellent averaging 95%. There are no other significant drilling or sampling factors that are expected to materially influence the accuracy and reliability of the results.
Great Panther had a 14,400-meter drill budget for Guanajuato in 2020. By July 31, 2020, a total of 6,154.1 meters of drilling were completed in 79 holes. The author is in full agreement with the focus and functionality of the Guanajuato exploration program.
| Drilling | 51 | Page |
NI 43-101 Technical Report | December 22, 2020 |
Figure 10.1: Guanajuato drilling activity, plan view
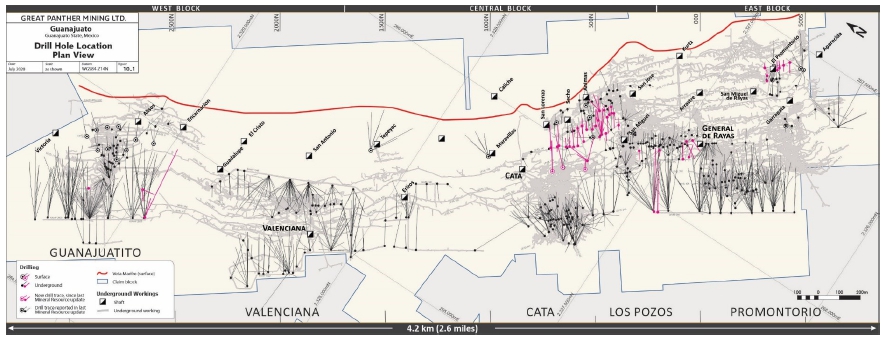
Figure 10.2: Guanajuato drilling activity, longitutidinal view
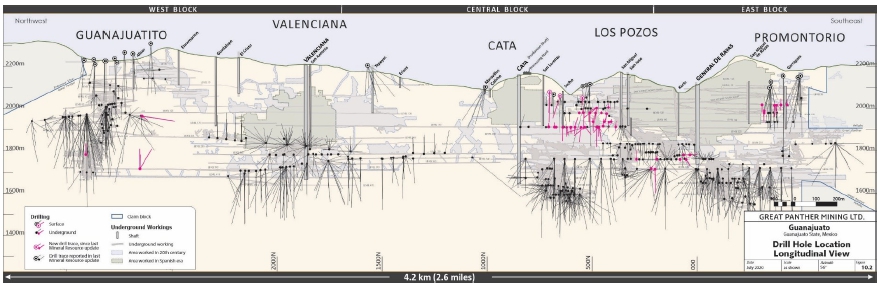
| Drilling | 52 | Page |
NI 43-101 Technical Report | December 22, 2020 |
10.1.2 San Ignacio
Great Panther has completed 491 diamond drill holes at San Ignacio. Drilling commenced in October 2010 and the last hole into the database was completed on July 31, 2020. From the total, 292 holes were drilled from surface and 199 from underground. A map illustrating the drill-hole locations is presented in Figure 10.3 and a longitudinal view of the drill holes is shown as Figure 10.4 and Figure 10.5.
Drill holes were usually oriented to intersect the veins at a high angle. A total of 54 additional drill holes have been completed at San Ignacio since the previous Mineral Resource Estimate (Brown and Nourpour 2020a).
The drilling and development programs since 2019 provided the geological information to support a re-interpretation of the mineralized zones. This included the delineation of nine veins in the northern portion of the property between grid line 100N and 1150N where 326 of the 491 holes were completed, and seven veins in the southern part of the property (San Pedro area) between 100N and 1100S where 165 holes were completed. The nine northern veins demonstrating structural continuity were identified from diamond drill hole intersections, underground mapping, and sampling, and to some extent surface mapping. These veins have a demonstrated a strike length of up to 1,000 meters and a dip length of up to 350 meters. Seven of the veins are very steeply dipping and four are shallowly dipping and are likely off shoots of the other veins. Between 100N and 1150N, five drill holes intersected voids which were interpreted to represent historical workings limited in extent. Holes ES11-039 (450N), ES13-105 (475N), ES13-112 (625N), ES13-116 (725N), and ESI14-121 (300N) intersected broken core or voids ranging from 1 to 3 meters in core length. These areas of historic workings were excluded from the resource models. Historical maps from the Melladito vein system from ~400N to 100N have been accurate in indicating areas of historical exploitation. These historical maps show exploitation further south on Melladito and Purisima vein systems. South of 100N 80 of 165 holes drill holes intersected voids which were interpreted to represent the old San Pedro shaft historical workings. The drill hole void locations match well with historical workings known from longitudinal sections. These areas of historical workings were excluded from the resource models.
Drilling in the San Pedro shaft area since 2016, and into 2020, and the driving of the San Pedro ramp (presently at ~450S) has defined several zones including the Melladito South, 700, Purisima, Purisima HW, and Purisima BO (footwall splay). Detailed drilling from the San Pedro ramp has defined areas left un-mined by previous operators (below lowest levels, and in lower grade areas).
Overall, the core recovery of mineralized zones was excellent averaging 92%. There are no other significant drilling or sampling factors that are expected to materially influence the accuracy and reliability of the results.
| Drilling | 53 | Page |
NI 43-101 Technical Report | December 22, 2020 |
Figure 10.3: San Ignacio drilling activity, plan view
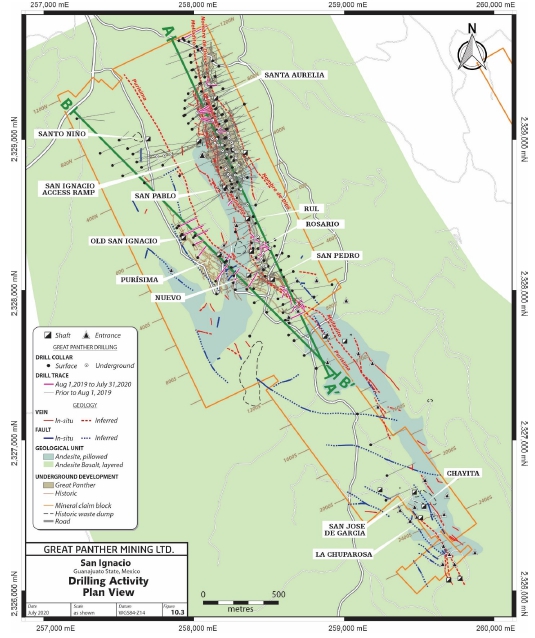
| Drilling | 54 | Page |
NI 43-101 Technical Report | December 22, 2020 |
Figure 10.4: San Ignacio drilling activity, longitudinal view A-A’
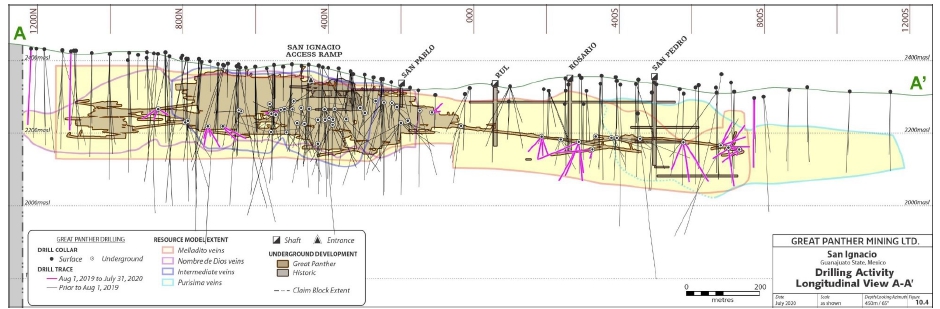
Figure 10.5: San Ignacio drilling activitiy, longitudinal view B-B’
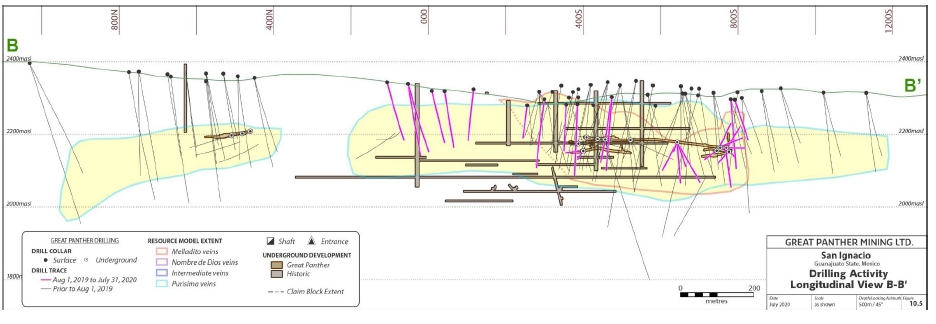
| Drilling | 55 | Page |
NI 43-101 Technical Report | December 22, 2020 |
| 10.2 | Drilling Procedures & Methodology |
10.2.1 Drilling Methodology
All drill-hole data was stored in Great Panther’s SQL database (the database) at the Cata office in Guanajuato. The database contents were backed up every two hours and copied daily to a master database in Great Panther’s head office.
Drill collar surveys are conducted by total station instrument and uploaded directly to a database for merging with the drill hole logging data. Down hole surveys are currently performed every 50 meters using a Reflex instrument, and the survey data are manually input to the database. For the shorter production holes, typically less than about 60 meters, down-hole surveys are not performed, and the orientation is measured at the collar only. Also, the UGG holes from UGG10-001 to UGG11-021 had no down-hole survey measurements collected.
| 10.2.1.1 | Guanajuato |
The management, monitoring, surveying, and logging of the current 2010 to 2020 series of UGG prefix exploration holes and production holes are carried out under the supervision of the Great Panther mine geological staff. Pre-2010 Guanajuato drilling, on surface and underground was under the supervision of the Great Panther Exploration staff.
A summary of the yearly areas drilled, drilling contractor, drill rig location (surface / underground), hole numbers, total meters drilled, and number of holes drilled is provided in Table 10.1.
| 10.2.1.2 | San Ignacio |
The contractor BD Drilling of Guadalajara, Mexico, drilled the first 104 surface diamond core holes (2010-2012) at San Ignacio for a total of 28,728.8 meters. The autumn 2013 program of 13 surface holes was drilled by Servicios Drilling of San Luis de Potosi, Mexico for a total of 1,143.7 meters. During the autumn-winter program of 2014 a total of 25 surface holes were drilled by Rock Drill of Aguascalientes, Mexico for a total of 3,728 meters. Rock Drill also completed the late autumn 2015 surface drill program of 16 holes totalling 2,257 meters. The mine geologists drilled two core holes in late 2014 for a total of 104 meters, and in 2015 Servicios Drilling drilled 18 underground drill holes for a total of 2,482.5 meters. Maza Drilling completed surface drill programs in 2016 of 17 holes for 3,766m, in 2017 of 56 holes for 13,963m, in 2018 of 20 holes for 6,122m, and in 2019 30 holes for 7,482.2m. Surface drilling in 2020 is contracted to Versa Drilling who has drilled 11 holes totalling 2,055m to July 31. Underground drilling by the mine geologists using Versa Drilling was active from 2016, with 26 holes for 5,264m completed in 2016, with 46 holes for 8,203m in 2017, with 33 holes for 5,601m in 2018, and with 45 holes for 3,239m in 2019. Underground drilling in 2020 is contracted to DR Drilling who has drilled 29 holes totalling 2,251.7m to July 31, 2020. A total of 96,389.1 meters of drilling on 491 holes have been completed by MMR at San Ignacio.
A summary of the yearly areas drilled, drilling contractor, drill rig location (surface / underground), hole numbers, total meters drilled, and number of holes drilled is given in Table 10.2.
10.2.2 Core Handling & Visual Logging
Drill-hole collar locations are surveyed using a total station instrument and the location data is uploaded directly into the database.
Bore-hole deviation surveys are completed at 50 metres intervals using a single shot instrument by Reflex™. Survey data is recorded onto paper logs by the driller or driller’s helper.
Drill core is transported twice per day from the drill site by pick-up truck to the core storage and logging facility located at the company’s Guanajuato plant site, which is gated, guarded, and secure.
| Drilling | 56 | Page |
NI 43-101 Technical Report | December 22, 2020 |
Core boxes are laid out by field technicians onto angled tables suitable for logging. The technicians fitted the core pieces together and cleaned the core surface in preparation for logging by the geologist. Depth markers are checked for proper labelling, and the boxes are labelled with the drill core intervals. The technicians also completed measurements of core recovery and rock quality designation (RQD) and recorded the data onto paper logs.
Up to mid-2016 all sample and geological data was entered into a DataShed© database via the LogChief software. GMC (all geological staff) now use an in-house software installed on Toughbook™ computers for later upload to the Microsoft SQL database. The contents of the SQL databases are copied daily to a master SQL database in the Great Panther head office in Vancouver with a backup made every evening.
Sample intervals for assaying are marked on the core boxes by the geologists. Sample lengths are generally determined by mineralogical or lithological characteristics and the protocol is for maximum sample lengths to be 1.5 meters and the minimum length to be 0.5 meters. Field technicians then photograph the core.
The field technician selects samples for bulk density measurements from several locations within the mineralized intervals, usually one density sample per assay sample interval. The water immersion procedure is followed, and the data is recorded onto paper logs. The samples are returned to the core box after the tests were completed.
Core samples for assaying are collected by the field technicians. Sample interval data is recorded in a numbered ticket book. Each ticket has three portions: a stub and two tags. All portions of the sample ticket share the same unique identification number. The two tag portions of each ticket are detached from the stub and stapled to the core tray at the start of the sample interval. The drill core is then cut using a diamond-tipped blade with clean water being used to lubricate and cool the blade. Half of the sample interval is placed inside a clear plastic rock sample bag labelled with the same ID as the ticket number. One tag is then removed from the core box and inserted into the sample bag along with the cut sample. The remaining stub, retained in the sample book, is completed with details such as drill hole ID and depth interval. The bag is then sealed, and 25 samples are inserted into rice sacks and delivered with other samples from the same hole. One sample submission sheet per hole accompanied the samples to the on-site SGS assay laboratory which is usually sent every other day.
Assay certificates are received directly from the laboratory (Cata laboratory managed by SGS until December 31, 2018) via email. Site geologists review quality control sample results for out of tolerance failures prior to merging the assay results with sample intervals in the database.
The first nine diamond core holes at San Ignacio (ESI10-001 – ESI11-009) were completed under the management of the Guanajuato Geology Department. Mine geologists logged and sampled the core. Following an internal audit by the company, which identified deficiencies in core handling and sampling procedures, the responsibility for diamond drilling and exploration at San Ignacio changed to Great Panther’s exploration department. The exploration staff re-logged and re-sampled all nine drill holes. The remaining surface drill holes were completed under the management and direction of the exploration department. All underground drill holes have been completed during the production stage and were completed under the management and direction on the Guanajuato Mine Complex Geological department.
| 10.3 | Drilling Results & Interpretation |
10.3.1 Guanajuato
Drilling results are compiled and based on the geological setting categorized to their situation relative to, or within, the Veta Madre. This interpretation is done using historical level mapping, and mapping and core drilling by the Company. The interpretation is completed by competent on-site exploration geologists with experience working in Guanajuato and outlined as wireframes using MICROMINE 3D geological software. The interpretation is then reviewed by the Company QP’s, who in turn may modestly modify the interpretation and the MICROMINE wireframes, or who may duplicate the wireframes using Leapfrog 3D geological software. These final wireframes will then be the basis for the block models of all areas and zones.
| Drilling | 57 | Page |
NI 43-101 Technical Report | December 22, 2020 |
10.3.2 San Ignacio
Drill hole logs, sample lists, and associated analysis were entered into a proprietary database at the GMC offices in Guanajuato, Guanajuato. Sections we created, and geological interpretations made by both the on-site Exploration and Operations geologists. These were matched with historical records, and as well with Great Panthers’ surface and underground geological mapping. A final interpretation was agreed to by all involved and turned over to technicians for wire-frame construction and the authors for resource estimation.
| 10.4 | Drilling Factors Impacting Accuracy & Reliability of Results |
There are no other significant drilling or sampling factors that are expected to materially influence the accuracy and reliability of the results.
| Drilling | 58 | Page |
NI 43-101 Technical Report | December 22, 2020 |
Table 10.1: Drilling per year, Guanajuato
| Year | Zones | Drilling Company | Location | ID | Total Depth (m) | No. of Holes | |
| 2005 | Esperanza | BD Drilling Mexico | Surface | GTT05-001 to GTT05-006, GTT-317 and GTT-318 | 1,567.3 | 8 | |
| 2006 | Animas | MMR | Underground | GTM06-001 to GTM06-013 | 687.1 | 13 | |
| Esperanza | BD Drilling Mexico | Surface | GTT06-007 to GTT06-019 | 3205 | 13 | ||
| Animas | BD Drilling Mexico | Surface | GTT06-020 to GTT06-027 | 1375.1 | 8 | ||
| Promontorio | BD Drilling Mexico | Surface | GTT06-028 to GTT06-034 | 1010.0 | 7 | ||
| Guanajuatito | Canrock Drilling / HD Drilling (name change) | Underground | UG06-014 to UG06-016 | 111 | 3 | ||
| 2007 | Cata | Canrock Drilling / HD Drilling (name change) | Underground | EUG07-001 to EUG07-009 | 1664.3 | 9 | |
| SVS | Canrock Drilling / HD Drilling (name change) | Surface | SG07-035 to SG07-045 | 2135.0 | 12 | ||
| Tepeyac | Canrock Drilling / HD Drilling (name change) | Surface | SG07-046 to SG07-052 | 1477.4 | 7 | ||
| Remedios | Canrock Drilling / HD Drilling (name change) | Surface | SG07-053 to SG07-058 | 1154.6 | 6 | ||
| Promontorio | Canrock Drilling / HD Drilling (name change) | Surface | SG07-059 to SG07-068 | 2641.6 | 10 | ||
| Animas | MMR | Underground | UG07-017 to UG07-021, UG07-028 | 180.3 | 6 | ||
| SVN | MMR | Underground | UG07-022 to UG07-025, UG07-032 | 239.1 | 5 | ||
| Rayas | MMR | Underground | UG07-029 to UG07-031, UG07-034 to UG07-035, UG07-037 | 366.2 | 6 | ||
| Guanajuatito | MMR | Underground | UG07-033, UG07-036, UG07-039 to UG07-040 | 289.5 | 4 | ||
| 2008 | Cata | Canrock Drilling / HD Drilling (name change) | Underground | EUG07-010 to EUG07-037, UG08-043, UG08-049 to UG08-056, UG08-060, UG08-067 | 6494.2 | 35 | |
| Guanajuatito | BD Drilling Mexico MMR | Surface/ Underground | SG08-069 to SG08-070, UG07-038, UG07-041, UG07-044 to UG07-048, UG07-050, UG07-052 to UG07-053, UG07-057 to UG07-058, UG07-061 to UG07-063 | 1178.6 | 17 | ||
| Rayas | MMR | Underground | UG07-042 | 44.2 | 1 | ||
| Pozos | MMR | Underground | UG08-055, UG08-059, UG08-064 to UG08-066, UG08-068, UG08-070 to UG08-071 | 497.9 | 8 | ||
| 2009 | Cata | MMR | Underground | UG08-069, UG08-072 to UG08-078, UGC09-001 to UGC09-011 | 1088.3 | 19 | |
| Guanajuatito | MMR | Underground | UG09-079 to UG09-087, UG09-093 to UG09-094 | 337.4 | 11 | ||
| Pozos | MMR | Underground | UG09-091 to UG09-092 | 133.7 | 2 | ||
| 2010 | Cata | Landdrill International, Mexico MMR Energold Drilling Corp. | Underground | EUG10-079 to EUG10-081, UG10-115, UG10-118, UGC10-012 to UGC10-017, UGC10-037 to UGC10-041 | 1707.9 | 16 | |
| Guanajuatito | Energold Drilling Corp. | Underground | UG09-095 to UG09-097, UGG10-001 to UGG10-021 | 2519.6 | 24 | ||
| Rayas | Landdrill International, Mexico | Underground | EUG10-038 to EUG10-078, UG10-112 to UG10-113, UG10-116 to UG10-117 | 10827.8 | 45 | ||
| Pozos | Landdrill International, Mexico | Underground | UG10-098 to UG10-107, UGC10-018 to UGC10-036 | 1661.8 | 29 | ||
| SV | Landdrill International, Mexico | Underground | UG10-108 to UG10-111 | 69.8 | 4 | ||
| Valenciana | Energold Drilling Corp. | Underground | UGV10-042 to UGV10-048 | 778.1 | 7 | ||
| 2011 | Cata | Landdrill International, Mexico MMR | Underground | EUG11-082 to EUG11-090, UG11-132 to UG11-158 | 2363.5 | 36 | |
| Guanajuatito | Landdrill International, Mexico | Underground | UGG11-022 to UGG11-054 | 6937.4 | 33 | ||
| Rayas | Landdrill International, Mexico | Underground | EUG11-101 to EUG11-131, EUG11-133, UG11-119 to UG11-131, UGM11-003 to UGM11-010 | 8516.3 | 52 | ||
| Pozos | MMR | Underground | UGM11-001 UGM11-002 | 51.2 | 2 | ||
| Drilling | 59 | Page |
NI 43-101 Technical Report | December 22, 2020 |
| Year | Zones | Drilling Company | Location | ID | Total Depth (m) | No. of Holes | |
| Santa Margarita | Landdrill International, Mexico | Underground | UGSM11-001 to UGSM11-019 | 1630.0 | 19 | ||
| Valenciana | Landdrill International, Mexico | Underground | EUG11-091 to EUG11-100, UGV11-001 to UGV11-005 | 2845.0 | 15 | ||
| 2012 | Cata | MMR Servicios Drilling, Mexico | Underground | UG12-159 to UG12-174, UGC12-042 to UGC12-043, UGM12-029 to UGM12-030, UGM12-051 | 1262.8 | 22 | |
| Guanajuatito | Landdrill International, Mexico Major Drilling, Mexico | Underground | UGG12-055 to UGG12-095, UGM12-012 to UGM12-015, UGM12-027 to UGM12-028 | 11685.8 | 47 | ||
| Rayas | MMR Servicios Drilling, Mexico | Underground | UGM12-011, UGM12-016 to UGM12-023, UGM12-025 to UGM12-026, UGM12-031 to UGM12-035, UGM12-046 to UGM12-047, UGM12-050, UGSM12-020 to UGSM12-021, UGSM12-037, UGSM12-039 | 1731.2 | 23 | ||
| Pozos | MMR | Underground | UGM12-048 to UGM12-049 | 93.2 | 2 | ||
| San Cayetano | Servicios Drilling, Mexico | Underground | UGSC12-001 to UGSC12-011 | 2786.2 | 11 | ||
| Santa Margarita | Servicios Drilling, Mexico Landdrill International, Mexico | Underground | UGM12-036 to UGM12-055, UGSM12-022 to UGSM12-036, UGSM12-038, UGSM12-040 to UGSM12-045 | 4947.8 | 36 | ||
| Valenciana | Landdrill International, Mexico Servicios Drilling, Mexico | Underground | UGV12-006 to UGV12-020, UGV12-021 to UGV12-053 | 6,788.9 | 48 | ||
| 2013 | Cata | Diamec 232 | Underground | UGC13-044 to UGC13-084, UGDC13-032 to UGDC13-034 | 5626.6 | 45 | |
| Guanajuatito | Servicios Drilling, Mexico | Underground | UGG13-096 to UGG13-117 | 4062.4 | 22 | ||
| Rayas | Diamec 232 | Underground | UGD13-056 to UGD13-058 | 296.8 | 3 | ||
| Pozos | Diamec 232 | Underground | UGP13-001 to UGP13-031 | 1924.4 | 31 | ||
| San Cayetano | Servicios Drilling, Mexico | Underground | UGSC13-012 to UGSC13-015 | 1118.7 | 4 | ||
| Santa Margarita | Servicios Drilling, Mexico | Underground | UGSM13-046 to UGSM13-080 | 9565.1 | 35 | ||
| Valenciana | Servicios Drilling, Mexico | Underground | UGV13-054 to UGV13-072 | 3659.3 | 19 | ||
| 2014 | Cata | Diamec 232 | Underground | UGC14-004 to UGC14-010, UGC14-040 to UGC14-050, UGC14-079 to UGC14-084, UGC14-169, UGC14-02A, UGC14-03A, UGC14-001 | 2,953.2 | 28 | |
| Guanajuatito | Servicios Drilling, Mexico | Underground | UGG14-001 to UGG14-005 | 208.7 | 5 | ||
| Pozos | Diamec 232 | Underground | UGDP13-035 to UGDP14-041 | 329.8 | 7 | ||
| San Cayetano | Servicios Drilling, Mexico | Underground | UGSC14-016 to UGSC14-040 | 1,970.35 | 25 | ||
| Santa Margarita | Servicios Drilling, Mexico | Underground | UGDSM14-001 to UGDSM14-028, UGSM14-081 to UGSM14-090 | 3,763.8 | 37 | ||
| Valenciana | Servicios Drilling, Mexico | Underground | UGMV14-001 to UGMV14-009, UGV14-001 to UGV14-0029 | 3284.2 | 36 | ||
| 2015 | Cata | Diamec 232 | Underground | UGC15-053, UGC15-055, UGC15-057 to UGC15-073, UGCN15-001 to UGCN15-006 | 3,310.55 | 27 | |
| Pozos | Diamec 232 | Underground | UGDP15-042 to UGDP15-051, UGP15-001 to UGP15-010, UGP15-047 | 1932.15 | 21 | ||
| Drilling | 60 | Page |
NI 43-101 Technical Report | December 22, 2020 |
| Year | Zones | Drilling Company | Location | ID | Total Depth (m) | No. of Holes | |
| San Cayetano | Servicios Drilling, Mexico | Underground | UGSC15-041 UGSC15-049 | 940.4 | 8 | ||
| Santa Margarita | Servicios Drilling, Mexico | Underground | UGDSM15-001 to UGDSM15-004, UGSM15-005 to UGSM15-007 | 688.9 | 7 | ||
| Valenciana | Servicios Drilling, Mexico | Underground | UGV15-030 to UGV15-073, UGVN15-002, UGVN15-004 | 5,467 | 46 | ||
| 2016 | Los Pozos | Versa Perforaciones SA de CV | Underground | UGP-001 to UGP16-003 | 792 | 3 | |
| Guanajuatito | Underground | UGG16-001 to UGG16-010, UGGM16-001, UGGM16-003/005/006 | 3,108.7 | 14 | |||
| Santa Margarita | Underground | UGDSM16-001 to UGDSM16-002, UGMP16-001, UGP16-004 | 421.5 | 4 | |||
| Valenciana | Underground | UGV16-001 to UGV16-010 | 2355 | 10 | |||
| 2017 | Cata, GTTO, Santa Margarita, Rayas, Valenciana | Versa Perforaciones SA de CV | Underground | UGV17-001 to UGV17-039, UGC17-001 to UGC17-010, UGG17-001 to UGG17-011, UGSM17-001 to 003, UGMPM17-001 to 004, UGP17-001 to 002, UGPM17-001 to 004. UGDC17-001, UGDV17-001, UGG16-001 | 13,696.8 | 77 | |
| 2018 | Rayas | DR Drilling | Underground | PZDR18-001 to PZDR18-013 | 740 | 13 | |
| Cata, GTTO, Santa Margarita, Rayas | Versa Perforaciones SA de CV | Underground | UGCM18-003 to UGCM17-006, UGG18-001 to UGG18-018, UGGD18-001/ 004, UGGD19-006, UGMPM18-001, UGMR18-001-UGMR18-003, UGPM18-001/002-UGPM18-004, UGDSM18-001 to UGDSM18-004 | 5,638.05 | 39 | ||
| Valenciana | Versa Perforaciones SA de CV | Underground/ Surface | UGV18-001 to UGV18-021, UGDV18-001/002, UGV17-040 | 3,791 | 24 | ||
| 2019 | Los Pozos | OV Drilling | Underground/ Surface | UGP19-001 to 044, SP19-001 to SP19-007, UGDP19-001 to 015 | 4,450.7 | 66 | |
| Promontorio | Underground | UGPM19-001 to UGPM19-040 | 2,523.1 | 39 | |||
| Valenciana | Underground | UGV19-001 to UGV19-018 | 1,819 | 18 | |||
| 20201 | Guanajuatito | Kav Drilling | Underground | UGG20-001 to 004 | 350.5
| 4 | |
| Los Pozos | Kav Drilling | Underground | UGP20-001 to 043 | 2815.5 | 43 | ||
| Santa Margarita | Kav Drilling | Underground | UGSM20-001 to 003 | 743.5 | 3 | ||
| Valenciana | Kav Drilling | Underground | UGV20-001 to 002 | 458.5 | 2 | ||
| Total | 191,888.2 | 1,446 | |||||
Note:
| 1. | January 1, 2020 to July 31, 2020 |
| Drilling | 61 | Page |
NI 43-101 Technical Report | December 22, 2020 |
Table 10.2: Drilling per year, San Ignacio
| Year | Drilling Company | Location | ID | Total Depth (m) | Number of Holes |
| 2010 | BD Drilling Mexico | Surface | ESI10-001 to ESI10-005 | 2,294.0 | 5 |
| 2011 | BD Drilling Mexico | Surface | ESI11-006 to ESI11-061 | 16,878.5 | 56 |
| 2012 | BD Drilling Mexico | Surface | ESI12-062 to ESI12-103 | 9,556.3 | 43 |
| 2013 | Servicios Drilling | Surface | ESI13-104 to ESI13-116 | 1,143.7 | 13 |
| 2014 | Rock Drill | Surface | ESI14-117 to ESI14-141 | 3,728.1 | 25 |
| Servicios Drilling, Mexico | Underground | UGSI14-001 to UGSI14-002 | 104.1 | 2 | |
| 2015 | Rock Drill | Surface | ESI15-142 to ESI15-157 | 2,256.9 | 16 |
| Servicios Drilling, Mexico | Underground | UGSI15-001 to UGSI15-018 | 2,482.5 | 18 | |
| 2016 | Maza Drilling | Surface | ESI16-158 to ESI16-174 | 3,765.8 | 17 |
| Versa Perforaciones SA de CV | Underground | UGSI16-001 to UGSI16-026 | 5,263.9 | 26 | |
| 2017 | Maza Drilling | Surface | ESI17-175 to ESI17-230 | 13,962.5 | 56 |
| Versa Perforaciones SA de CV | Underground | UGDSI17-001 to UGDSI17-003 UGSI17-001 to UGSI17-043 | 8,202.5 | 46 | |
| 2018 | Maza Drilling | Surface | ESI18-231 to ESI18-250 | 6,121.6 | 20 |
| Versa Perforaciones SA de CV | Underground | UGSI18-001 to UGSI18-033 | 5,600.8 | 33 | |
| 2019 | Maza Drilling | Surface | ESI19-251 to ESI19-280 | 7,482.2 | 30 |
| Versa Perforaciones SA de CV | Underground | UGSI19-001 to UGSI19-045 | 3,239.0 | 45 | |
| 20201 | Versa Perforaciones SA de CV | Surface | ESI20-281 to ESI20-291 | 2,055.0 | 11 |
| DR Drilling | Underground | UGSI20-046 to UGSI20-074 | 2,251.7 | 29 | |
| Total | 96,389.10 | 491 |
Note:
| 1. | January 1, 2020 to July 31, 2020 |
| Drilling | 62 | Page |
NI 43-101 Technical Report | December 22, 2020 |
| 11.0 | Sampling Methodology & Procedures |
| 11.1 | Drill Core Sampling |
The drill core samples were prepared by technicians working under the direction of the Mine and Exploration Geologists. The exploration diamond drill core is of HQ and NQ diameter. The production holes drilled prior to July 2011 were generally AQ diameter. During July 2011, a BQ diameter rig (Diamec) was added to the production drilling capacity.
Depending on the diameter of the drill core to be sampled, it is either cut in half using a diamond bladed saw (NQ and HQ) or sampled whole (AQ and BQ). A technician then records the intervals for sampling in a numbered and perforated ticket book, a numbered part of each ticket is stapled to the core tray at the appropriate sample interval and the butt portion of the ticket book is completed with drill hole number and interval information. For each sample interval, the core (or half core) is placed along with a numbered ticket inside a pre-numbered clear plastic sample bag. The bag is then tied with string and delivered with other samples from the same hole to the onsite Cata laboratory. Sample numbers and intervals are written on the ticket books for later data capture.
Sample lengths are generally determined by mineralogical or lithological characteristics. For the exploration drilling, the protocol is for maximum sample lengths to be 1.5m and the minimum length to be 0.5 meters. For production drilling, in areas of little or no obvious mineralization, maximum sample lengths are from 1.5 to 2.0 meters. In mineralized or silicified zones, the maximum sample length is reduced to 0.6 meters while the minimum length is 0.3 meters. There are several instances where drill samples with lengths greater than 2.0 meters occur in the database, the reason being that for broken and/or small diameter core.
In the authors’ opinion, drill sample preparation methods carried out by Great Panther personnel are appropriate and of industry standard.
| 11.2 | Channel Sampling Procedures |
Channel sampling is carried out daily in accessible stopes and development headings by technicians after the sample positions are marked out by a geologist and a detailed drawing of the face is made. The samples consist of chips broken along a line across the structure using a rock hammer and chisel.
The quality of the channel samples is more variable than the drill samples. The rock is observed to be highly variable in hardness and competence and it is therefore difficult to achieve volumetrically consistent representation along the entire sample length. Sample bias can result where higher grades happen to correlate with zones of hardness characteristics.
The increased variance may also be due to the use of the mat rolling technique to reduce the channel sample mass. It is recommended that an alternative method to mat rolling be used to reduce the sample size if possible.
The channel sample data is stored digitally in Microsoft SQL© database, along with grade information and notes regarding the location from which the sample was taken. Improvements in the documentation of underground sampling were instituted in 2012 so that continuous channel sampling is recorded as a pseudo-drill hole. This system has made compositing of samples possible.
In the authors’ opinion, channel sample preparation methods carried out by Great Panther are appropriate and of industry standard.
| 11.3 | Sample Preparation, Analytical Methodology, & Procedures |
11.3.1 Analytical Laboratory
Most of the analytical work was carried out at an on-site laboratory managed by Great Panther staff, which is located within the confines of the Cata facility. The laboratory is equipped to perform Aqua Regia digest, fire assay, gravimetric and atomic absorption spectroscopy (AAS). The laboratory reverted to Company management (Cata lab) at the beginning of 2019, and therefore lost its accreditation that was gained when under management of the SGS Group.
| Sampling Methodology & Procedures | 63 | Page |
NI 43-101 Technical Report | December 22, 2020 |
The analysis process involves initial receipt of samples by Cata lab from Geology personnel followed by oven-drying of samples. Dry samples are then run through a crusher (10 mesh) and subsequently a 200g split is run through a disc mill for pulverizing to 98% passing 200 mesh. Samples are analysed by Aqua Regia with an AA finish, and any that report greater than 10g/t Au or 300g/t Ag are re-analysed by fire assay with a gravimetric finish. The laboratory can also perform determinations for arsenic, copper, lead, zinc, and antimony but these elements are not typically analysed for drill hole or channel samples.
The authors visited the Cata laboratory and found it to be orderly and appropriately configured for the analytical work required. Internal QA/QC conducted, and analytical methods used, are to industry standard. The laboratory was ISO certified under SGS Group to the end of 2018. An enhanced umpire assay regime was commenced in early 2019, by submitting GMC core sample pulps to SGS-Durango for re-assay. This includes re-assay of core samples and Company inserted standards, blanks, and duplicates.
11.3.2 Density Determination
Samples approximately 10cm in length were selected from whole or half-core (NQ or HQ) by the field technician and returned to the core box after bulk density determinations were completed.
The test work was completed on site by field technicians and followed the water submersion method on air-dried samples (not in an oven). Non-friable, non-porous core samples were weighed in air and then weighed while suspended from the scale in a basket, which was submerged in water. The raw information was recorded on paper logs.
Although no formal QA/QC program was in place to provide confidence in the precision or accuracy of the results, the results are within the range of expected density values for the material tested. It is recommended that duplicate samples selected at a standard frequency be sent to an external laboratory for testing and the scale monitored regularly using a standard weight to add confidence to the dataset.
The authors believes the bulk density test work was conducted using appropriate procedures and is reliable for Mineral Resource estimation.
| 11.4 | Sample Security |
Sample security is considered by the authors to be acceptable and in line with common industry practices. The Geology Department and Exploration core sheds and the Cata laboratory are located within the Cata Facility which is fenced and guarded around the clock.
| 11.5 | Quality Assurance & Quality Control Methodology & Procedures |
Until the end of 2018 the SGS-GTO / Cata laboratory manager conducted routine Quality Assurance/Quality Control (QA/QC) and instrument calibration and maintained a database of the results. This was continued with the reversion of the laboratory to Company management.
Additional to internal laboratory QA/QC monitoring, Great Panther personnel also insert quarter-core duplicates, standards, and blanks into the channel and drill sample streams as well as arranging regular umpire checks. The protocol is for a duplicate for every 19 samples, and one blank and a standard for every 40 samples. Suspicious QA/QC results are detected by the Database Administrator who informs the relevant Geologist. Re-assaying is performed in cases where data entry and sample collection issues such as sample swaps are ruled out by the Geologist.
In January 2013, Great Panther Topia and Guanajuato QA/QC data were audited by Dr. Wesley M. Johnson of Quality Analysis Consultants. Regarding SGS GTO laboratory, the author has stated that 'There is no obvious problem with the data generated in the laboratory from either an accuracy or a precision standpoint.’ (Johnson, 2013).
| Sampling Methodology & Procedures | 64 | Page |
NI 43-101 Technical Report | December 22, 2020 |
As a precaution with the laboratory reverting to the Company the authors have run parallel analytical work on GMC drill program whereby samples are initially prepared and assayed at Cata lab, and pulps sent to SGS-Durango certified assay facility for re-assay, including inserted blanks, duplicates, and standards.
QA/QC material herein considered and reviewed for this report include samples from August 1, 2019 to July 31, 2020 inclusive for San Ignacio and November 1, 2019 to July 31, 2020 inclusive for Guanajuato.
In the authors’ opinion, the QA/QC program employed by Great Panther is appropriate and is in line with industry standards.
11.5.1 Blanks
The blank material was collected from a barren rhyolite tuff (La Bufa Formation) on the south side of Guanajuato. It was crushed, pulverized, and homogenized at the Cata laboratory. During the period considered herein, blanks were analysed in the laboratory by either Aqua Regia digest with Atomic Absorption finish (Ag, Au). The results of each are charted below. Values limits for gold and silver should not exceed 0.05 g/t and 3 g/t, respectively. Figure 11.1 through Figure 11.4 illustrates the assay results for blank samples.
Table 11.1 below provides details of Blanks result outliers from the established accepted parameters inserted on underground channel and DDH sampling activities.
It is the authors’ opinion that the blank insertion program is adequate and that the results are of sufficient quality for use in the Mineral Resource estimation.
Table 11.1: Blanks outside QA/QC accepted parameters
| Element | Material | Total | No. over (Au<0.05 & Ag< 3 ppm) | Percentage outside limits |
| U/G Sampling | ||||
| Au | Blank | 253 | 0 | 0.00% |
| Ag | Blank | 253 | 0 | 0.00% |
| DDH Sampling | ||||
| Au | Blank | 195 | 1 | 1% |
| Ag | Blank | 195 | 4 | 2% |
Figure 11.1: Ag assays of “Blank” material, U/G sampling
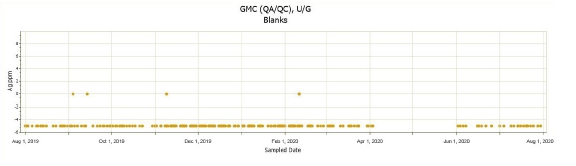
| Sampling Methodology & Procedures | 65 | Page |
NI 43-101 Technical Report | December 22, 2020 |
Figure 11.2: Au assays of “Blank” material, U/G sampling
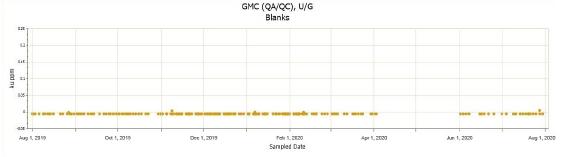
Figure 11.3: Ag assays of “Blank” material, DDH sampling
Figure 11.4: Au assays of “Blank” material, DDH sampling
11.5.2 Standards
Between 2017-2018, two standards (GTS11 and GTS12) were produced by SGS-Durango laboratory and certified by SGS© after Round Robin assaying by five laboratories (4 external). African Mineral Standards (AMIS) supplied a standard GTS13, starting July 2019. In 2020, GTS14 and GTS15 were purchased from OREAS, and GTS16 and GTS17 from SGS in Durango. Previously, thirteen (13) other standards developed by WCM Minerals© (PM929, PM1140, PM114 and PM1129), SGS© Durango (GTS03, GTS05, GTS06, GTS07, GTS08, GTS09, and GTS10), SKYLINE© (GTS04), and Rocklabs© (SP49) had been in usage prior to 2017. Eight standards, GTS10 through GTS17, were used during the time of this TR. Table 11.2 provides the limits for each standard used at GMC. Table 11.3 below, provide details of the standard sample results for underground channel samples which fall outside three standard deviations of the expected value.
| Sampling Methodology & Procedures | 66 | Page |
NI 43-101 Technical Report | December 22, 2020 |
Table 11.4 below, provide details of the standard sample results for drill core samples which fall outside three standard deviations of the expected value.
Figure 11.5 through Figure 11.34 illustrate the assay results for standards samples from August 1, 2019 through July 31, 2020 at San Ignacio and November 1, 2019 through July 31, 2020 at Guanajuato.
Table 11.2: Expected values for the GMC Standards used for QA/QC
| STD | Element | Method | Certified Value | Tolerance Interval | Date of Usage | Source | ||
| Low | High | From | To | |||||
| GTS03 | Ag | ICP12B | 45.64 | 27.76 | 63.52 | 3/2/2009 | 6/1/2013 | Internal standard prepared from Guanajuato Vein Material by SGS-Durango |
| Au | ICP12B | 0.3 | 0.06 | 0.54 | ||||
| GTS04 | Ag | ICP12B | 165 | 141 | 189 | 3/31/2009 | 12/5/2012 | Internal standard prepared from Guanajuato Vein Material by Skyline |
| Au | ICP12B | 1.15 | 0.73 | 1.57 | ||||
| GTS05 | Ag | 4A_AAS | 36.86 | 26.51 | 47.21 | 10/19/2012 | 12/29/2015 | Internal standard prepared from Guanajuato Vein Material by SGS-Durango |
| Au | Au_AA23 | 0.353 | 0.245 | 0.461 | ||||
| GTS06 | Ag | 4A_AAS | 121 | 94.39 | 147.61 | 10/17/2012 | 12/23/2014 | Internal standard prepared from Guanajuato Vein Material by SGS-Durango |
| Au | Au_AA23 | 1.133 | 0.773 | 1.493 | ||||
| GTS07 | Ag | 4A_AAS | 48.5 | 40.4 | 56.6 | 4/7/2014 | 1/21/2016 | Internal standard prepared from Guanajuato Vein Material by SGS-Durango |
| Au | Au_AA23 | 0.372 | 0.282 | 0.462 | ||||
| GTS08 | Ag | 4A_AAS | 7.6 | 4 | 11.2 | 4/23/2014 | 11/30/2015 | Internal standard prepared from Guanajuato Vein Material by SGS-Durango |
| Au | Au_AA23 | 0.615 | 0.405 | 0.825 | ||||
| GTS09 | Ag | GE_AA321E | 155.2 | 120.7 | 189.7 | 9/1/2015 | 4/28/2017 | Internal standard prepared from Guanajuato Vein Material by SGS-Durango |
| Au | GE_FA313 | 1.369 | 0.979 | 1.759 | ||||
| GTS10 | Ag | FAA313 | 114.8 | 100.25 | 129.35 | 2/4/2017 | Current | Internal standard prepared from Guanajuato Vein Material by SGS-Durango |
| Au | GE_FA313 | 0.549 | 0.429 | 0.669 | ||||
| GTS11 | Ag | FAA313 | 137.63 | 123.56 | 151.70 | 6/4/2017 | Current | Internal standard prepared from Guanajuato Vein Material by SGS-Durango |
| Au | FAA313 | 0.798 | 0.648 | 0.948 | ||||
| GTS12 | Ag | FAA313 | 302.10 | 278.10 | 326.10 | 6/4/2017 | Current | Internal standard prepared from Guanajuato Vein Material by SGS-Durango |
| Au | FAA313 | 1.579 | 1.399 | 1.759 | ||||
| GTS13 | Ag | FAA_GE/GC | 158 | 135.2 | 180.8 | 07/27/2019 | Current | AMIS |
| Au | FAA_GE/GC | 2.49 | 1.650 | 3.329 | ||||
| GTS14 | Ag | ASS_GE | 50.1 | 44.88 | 55.32 | 01/20/2020 | Current | OREAS |
| Au | FAG_GC | 0.712 | 0.712 | 0.838 | ||||
| GTS15 | Ag | ASS_GE | 118 | 103.6 | 132.4 | 02/05/2020 | Current | OREAS |
| Au | FAG_GC | 1.95 | 1.75 | 2.15 | ||||
| GTS16 | Ag | FAG_GC | 28.6 | 24.5 | 32.8 | 03/09/2020 | Current | SGS |
| Au | FAG_GCAA | 0.77 | 0.62 | 0.91 | ||||
| GTS17 | Ag | FAG_GC | 433 | 410 | 455 | 03/30/2020 | Current | SGS |
| Au | FAG_GCAA | 2.74 | 2.31 | 3.17 | ||||
| PM1129 | Ag | FAA313 | 34 | 32 | 38.1 | 7/27/2011 | 5/16/2012 | WCM Minerals Commercial Gold and Silver Reference Material |
| Au | FAA313 | 3.46 | 3.18 | 3.99 | ||||
| PM1114 | Ag | FAA313 | 330 | 315 | 355 | 1/28/2011 | 9/13/2011 | WCM Minerals Commercial Gold and Silver Reference Material |
| Au | FAA313 | 1.61 | 1.545 | 1.72 | ||||
| PM1140 | Ag | FAA313 | 48.4 | 46 | 51 | 9/12/2012 | 12/12/2012 | WCM Minerals Commercial Gold and Silver Reference Material |
| Au | FAA313 | 1658 | 1577.2 | 1748.5 | ||||
| PM929 | Ag | FAA313 | 65 | 60.45 | 67.1 | 8/25/2012 | 9/25/2012 | WCM Minerals Commercial Gold and Silver Reference Material |
| Au | FAG313 | 5.1 | 4.87 | 5.428 | ||||
| SP49 | Ag | FAG313 | 60.2 | 59.2 | 61.2 | 8/8/2011 | 12/27/2012 | Rocklabs. Feldspar minerals, basalt and iron pyrite with Feldspar minerals, basalt, and iron pyrite with minor quantities of finely divided gold and silver-containing minerals |
| Au | FAG313 | 18.34 | 18.22 | 18.46 | ||||
| Sampling Methodology & Procedures | 67 | Page |
NI 43-101 Technical Report | December 22, 2020 |
Table 11.3: Standard sample results outside 3 standard deviations, U/G sampling
| Element | Standard ID | Total | No. outside 3 Std. Dev. | Percentage outside 3Std. Dev. |
| Ag | GTS10 | 8 | 0 | 0% |
| Au | GTS10 | 8 | 0 | 0% |
| Ag | GTS11 | 65 | 3 | 5% |
| Au | GTS11 | 65 | 6 | 9% |
| Ag | GTS12 | 2 | 0 | 0% |
| Au | GTS12 | 2 | 0 | 0% |
| Ag | GTS13 | 138 | 2 | 1% |
| Au | GTS13 | 138 | 0 | 0% |
| Ag | GTS14 | 34 | 7 | 21% |
| Au | GTS14 | 34 | 3 | 9% |
| Ag | GTS15 | 3 | 0 | 0% |
| Au | GTS15 | 3 | 0 | 0% |
| Ag | GTS17 | 1 | 0 | 0% |
| Au | GTS17 | 1 | 0 | 0% |
Table 11.4: Standard sample results outside 3 standard deviations, DDH sampling
| Element | Standard ID | Total | No. outside 3 Std. Dev. | Percentage outside 3Std. Dev. |
| Ag | GTS10 | 22 | 1 | 5% |
| Au | GTS10 | 22 | 1 | 5% |
| Ag | GTS11 | 17 | 3 | 18% |
| Au | GTS11 | 17 | 3 | 18% |
| Ag | GTS12 | 9 | 0 | 0% |
| Au | GTS12 | 9 | 2 | 22% |
| Ag | GTS13 | 49 | 2 | 4% |
| Au | GTS13 | 49 | 0 | 0% |
| Ag | GTS14 | 9 | 1 | 11% |
| Au | GTS14 | 9 | 0 | 0% |
| Ag | GTS15 | 30 | 4 | 13% |
| Au | GTS15 | 30 | 0 | 0% |
| Ag | GTS16 | 37 | 5 | 14% |
| Au | GTS16 | 37 | 6 | 16% |
| Ag | GTS17 | 22 | 0 | 0% |
| Au | GTS17 | 22 | 2 | 9% |
| Sampling Methodology & Procedures | 68 | Page |
NI 43-101 Technical Report | December 22, 2020 |
Figure 11.5: Ag assays of Standard “GTS10”, U/G sampling
Figure 11.6: Au assays of Standard “GTS10”, U/G sampling
Figure 11.7: Ag assays of Standard “GTS11”, U/G sampling
Figure 11.8: Au assays of Standard “GTS11”, U/G sampling
| Sampling Methodology & Procedures | 69 | Page |
NI 43-101 Technical Report | December 22, 2020 |
Figure 11.9: Ag assays of Standard “GTS12”, U/G sampling
Figure 11.10: Au assays of Standard “GTS12”, U/G sampling
Figure 11.11: Ag assays of Standard “GTS13”, U/G sampling
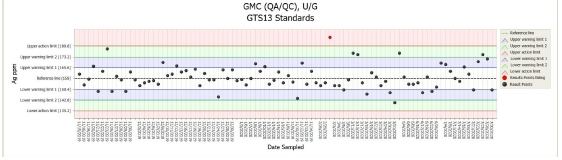
Figure 11.12: Au assays of Standard “GTS13”, U/G sampling
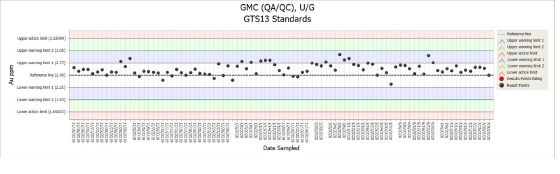
| Sampling Methodology & Procedures | 70 | Page |
NI 43-101 Technical Report | December 22, 2020 |
Figure 11.13: Ag assays of Standard "GTS14", U/G sampling
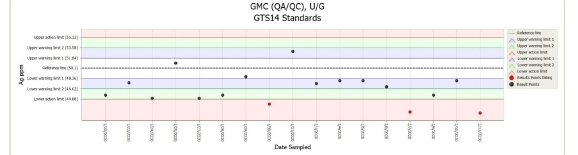
Figure 11.14: Au assays of Standard "GTS14", U/G sampling
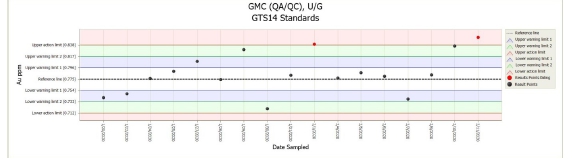
Figure 11.15: Ag assays of Standard "GTS15", U/G sampling
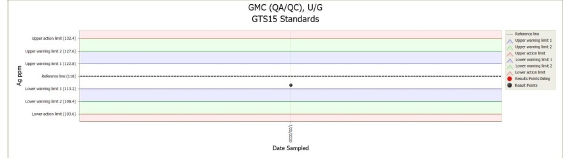
Figure 11.16: Au assays of Standard "GTS15", U/G sampling
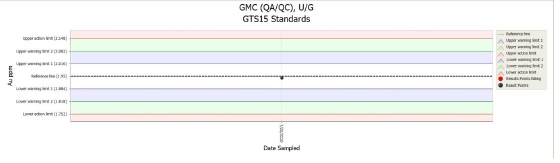
| Sampling Methodology & Procedures | 71 | Page |
NI 43-101 Technical Report | December 22, 2020 |
Figure 11.17: Ag assays of Standard “GTS17”, U/G sampling
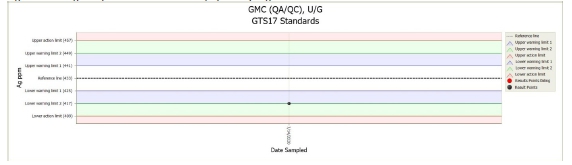
Figure 11.18: Au assays of Standard “GTS17”, U/G sampling
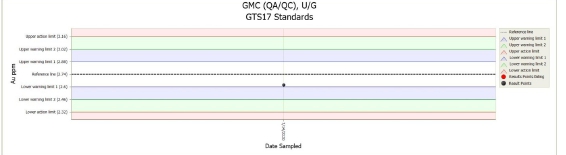
Figure 11.19: Ag assays of Standard “GTS10”, DDH sampling
Figure 11.20: Au assays of Standard “GTS10”, DDH sampling
| Sampling Methodology & Procedures | 72 | Page |
NI 43-101 Technical Report | December 22, 2020 |
Figure 11.21: Ag assays of Standard “GTS11”, DDH sampling
Figure 11.22: Au assays of Standard “GTS11”, DDH sampling
Figure 11.23: Ag assays of Standard “GTS12”, DDH sampling
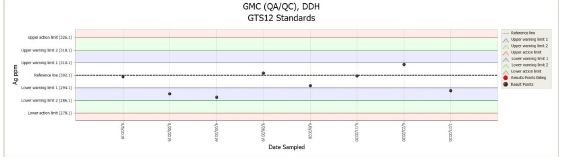
Figure 11.24: Au assays of Standard “GTS12”, DDH sampling
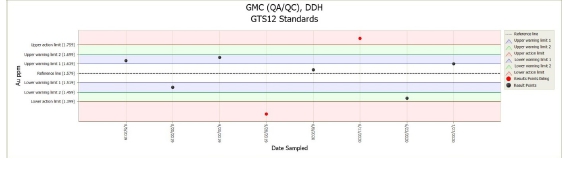
| Sampling Methodology & Procedures | 73 | Page |
NI 43-101 Technical Report | December 22, 2020 |
Figure 11.25: Ag assays of Standard “GTS13”, DDH sampling
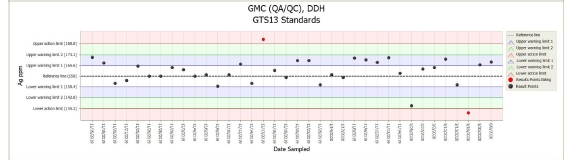
Figure 11.26: Au assays of Standard “GTS13”, DDH sampling
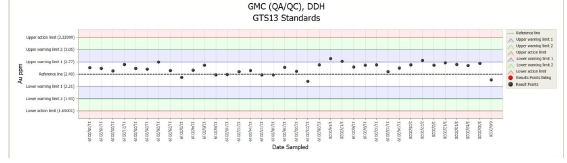
Figure 11.27: Ag assays of Standard “GTS14”, DDH sampling
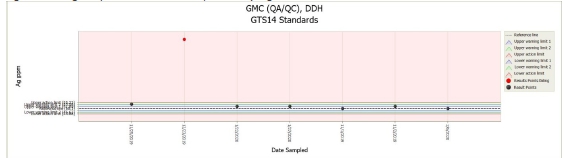
Figure 11.28: Au assays of Standard “GTS14”, DDH sampling
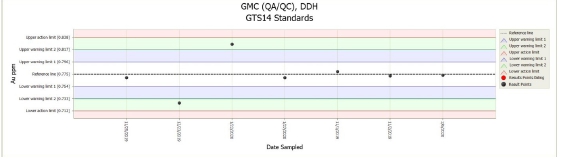
| Sampling Methodology & Procedures | 74 | Page |
NI 43-101 Technical Report | December 22, 2020 |
Figure 11.29: Ag assays of Standard “GTS15”, DDH sampling
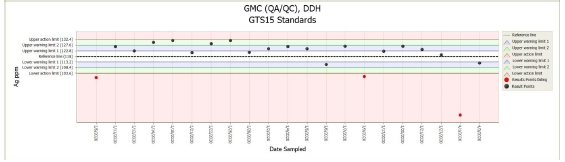
Figure 11.30: Au assays of Standard “GTS15”, DDH sampling
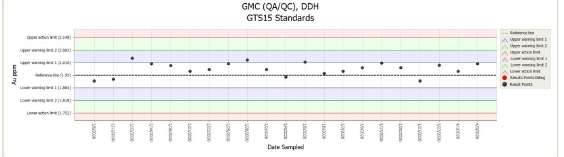
Figure 11.31: Ag assays of Standard “GTS16”, DDH sampling
Figure 11.32: Au assays of Standard "GTS16", DDH sampling
| Sampling Methodology & Procedures | 75 | Page |
NI 43-101 Technical Report | December 22, 2020 |
Figure 11.33: Ag assays of Standard "GTS17", DDH sampling
Figure 11.34: Au assays of Standard "GTS17", DDH sampling
11.5.3 Duplicates
Duplicates are routinely taken for channel samples and drill samples and are sent to the laboratory to be assayed via the same method as the respective originals. An analysis of the results of all duplicate-original pairs assayed during the period considered revealed the following R2 coefficient determinations for Ag and Au, under-ground sampling returned 99% and 99%, respectively, and diamond drill sampling returned 83% and 72%, respectively. These results are considered reasonable due to the nugget effect associated with the various mineralized zones at Guanajuato and San Ignacio operations.
Figure 11.35 through Figure 11.38 illustrate the assay results for duplicate samples.
Figure 11.35: Ag analysis of duplicate-original pair results in U/G sample batches
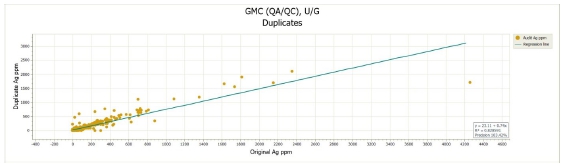
| Sampling Methodology & Procedures | 76 | Page |
NI 43-101 Technical Report | December 22, 2020 |
Figure 11.36: Au analysis of duplicate-original pair results in U/G sample batches
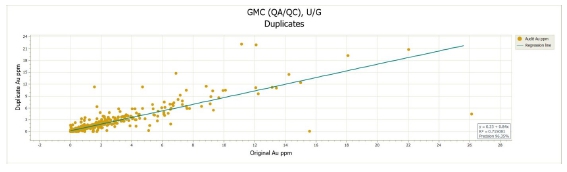
Figure 11.37: Ag analysis of duplicate-original pair results in DDH sample batches
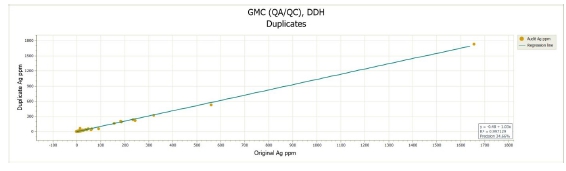
Figure 11.38: Au analysis of duplicate-original pair results in DDH sample batches
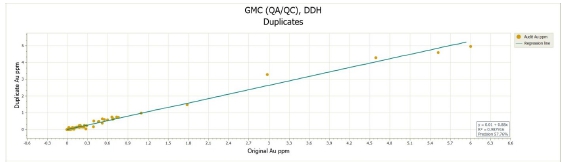
11.5.4 Umpire Checks
A program of umpire assaying was initiated in 2019 as an additional QA/QC measure. QA/QC monitoring of the GMC laboratory includes shipping all exploration drill-hole pulps to SGS-DGO for re-analysis and statistical comparison of assay values using correlation coefficients. All original assay-umpire assay pairs have been considered for the effective period. Figure 11.39 and Figure 11.40 represent the plots of the coefficient of correlation for silver (0.992) and gold (0.995) between the sample pairs. A high correlation exists between the Cata lab (MVS-GTO) and SGS-DGO.
Overall correlation between original and umpire lab assays is considered reasonable and acceptable.
| Sampling Methodology & Procedures | 77 | Page |
NI 43-101 Technical Report | December 22, 2020 |
Figure 11.39: Ag lab result sample correlation, DDH sampling
Figure 11.40: Au lab result sample correlation, DDH sampling
| 11.6 | Qualified Persons Statement on Sampling, Analysis, & Quality Control |
It is the authors’ opinion that appropriate chain of custody and industry standard for sample selection, sample preparation, analysis and QA/QC procedures were followed during the sample preparation and analytical process for the period covered by this TR. The quality control insertion program is adequate, but it needs improvement. Further, it is the authors’ opinion that the results are of sufficient quality for use in Mineral Resource estimation. It is recommended that the QA/QC program be monitored on monthly basis. There were some incidents where some standards and blanks were swapped which were duly sorted.
| Sampling Methodology & Procedures | 78 | Page |
NI 43-101 Technical Report | December 22, 2020 |
| 12.0 | Data Verification |
| 12.1 | Data Verification Procedures |
The GMC database review (both Guanajuato and San Ignacio drill and channel samples) included drill-hole location, down-hole survey, lithology, mineralogy, alteration, density, structural features, recovery and RQD, and sample assays, including the results from quality control samples.
The data from the supplied database was checked for missing intervals, out of sequence intervals, non-numerical values, negative values, and any other obvious errors.
Any data found to have such issues were either individually investigated and resolved or excluded from the final database used in modelling.
The validity of the channel sample and drill hole samples assays were audited. For the drill hole data audit, nine dispatches of holes drilled between August 1, 2019 and July 31, 2020, selected, and compared with assays stored in the database. All results taken from certificates concurred completely with results stored in the database for both Au and Ag (a total of 395 results were checked).
The logging and sampling procedures were reviewed on site and the authors are satisfied that they meet industry standard practices. Geological logs were reviewed against selected intersections of half core from three drill holes. Core box intervals were checked and compared measurements of core recovery and RQD against values recorded in the database. Geology and mineralization were observed as described in the logs. No significant discrepancies were observed.
The validity of the channel sample assays was audited in the same way as described above for the drill samples. Eight dispatches were selected within the period August 1, 2020 to July 31, 2020. All channel samples within the dispatches were compared by element as provided on the assay certificates with the results stored in the database (a total of 290 results checked). All results taken from certificates concurred completely with results stored in the database for both Au and Ag.
The onsite assay laboratory was inspected and found to be secure, orderly, and appropriately configured for the analytical work required. The assay protocols are conventional methods, commonly used in the industry.
| 12.2 | Limitations of Data Verification |
The authors thoroughly reviewed and audited the data and found no significant issues or inconsistencies.
| 12.3 | Qualified Persons Statement on Data Verification |
It is authors’ opinion that the data and observations from the drill holes and channel samples were collected with industry standard practices, and that the accompanying assay results are reasonable. The drilling and sampling data have been appropriately verified for the purpose of completing a geological model, estimating Mineral Resources, and preparing an NI 43-101 Mineral Resource estimate.
| Data Verification | 79 | Page |
NI 43-101 Technical Report | December 22, 2020 |
| 13.0 | Mineral Processing and Metallurgical Testing |
Ore from the Great Panther’s Guanajuato and San Ignacio operations are being treated at the Guanajuato site plant. Great Panther have operated the metallurgical plant since 2006. The processing plant uses conventional crushing, grinding, milling, flotation, and concentrate dewatering circuits to generate sulphide concentrates containing silver and gold, which are sent offsite for smelting and refining. The plant operated at a rate of 779 tonnes per operating day for the effective period of this TR from September 1, 2019 to July 31, 2020. This included 162,758 tonnes milled from the Guanajuato Mining Complex, at a head grade of 130g/t Ag and 1.96g/t Au, and specifically 23,175 tonnes from Guanajuato, at a head grade of 212g/t Ag and 1.24g/t Au, and 139,583 tonnes from San Ignacio, at a head grade of 116g/t Ag and 2.08g/t Au.
Silver and gold are recovered as components of a sulphide concentrate containing pyrite, electrum, and silver sulphide minerals. As of July 2016, the practice of separately “batching” Guanajuato and San Ignacio ores was ended and the ores from both mines are blended before crushing and milled concurrently. The recoveries for the effective period of this report (August 1, 2019 to July 31, 2020) were 85.3% for silver and 83.9% for gold. The Guanajuato operation was placed on C&M December 31, 2018 and then re-started production, in a limited manner, in July 2019. Blending of the Guanajuato and San Ignacio material began in July 2016 and the processing (milling) of the blended ore continued to December 2018 and then on limited basis.
In addition to the operation of the plant, Great Panther has undertaken some metallurgical test-work aimed at improving the operation of the plant. During 2011 this has included the addition of a new flotation section with the installation of five new fully automated Outotec cells which replaced the old sections of rougher cells. In 2012 a small regrind mill was installed with improvements in metallurgical recoveries. In 2012 and 2013 the primary crushing units were upgraded with a new Metso HP300 crusher and new vibrating twin screens. Lastly, in 2013, a new state of the art filter press was installed to reduce water content in the concentrate.
For additional metallurgical testing refer to Item 17.0 of this Technical Report. The metallurgical testing samples were collected throughout the active arts of the mine and are representative of the mineralization present at Guanajuato and San Ignacio. There are no deleterious elements or processing factors that significantly effect the extraction of silver and gold into the concentrate.
| Mineral Processing and Metallurgical Testing | 80 | Page |
NI 43-101 Technical Report | December 22, 2020 |
| 14.0 | Mineral Resource Estimates |
The Mineral Resource estimates included in this TR are forward-looking statements. There are material factors that could cause actual results to differ materially from the conclusions, forecasts, or projections set out in this TR. Some of the material factors include differences from the assumptions made in the TR regarding grades, metals prices, currency exchange rates, metals production rates, schedule of development, labour, consumables and other material costs, markets and market prices, and other circumstances such that the project proceeds, as described in the TR. See Section 24.0 for a discussion about the forward-looking statements included in this TR and the key assumptions upon which they are based and risks and uncertainties associated with such forward-looking statements. Mineral Resources that are not Mineral Reserves have no demonstrated economic viability.
| 14.1 | Introduction |
This report includes updated Mineral Resource estimates for the GMC Guanajuato and San Ignacio operations with an effective date of July 31, 2020. This update supersedes the previous mineral resource estimates for the Guanajuato and San Ignacio by Brown and Nourpour (2020), and Brown and Nourpour (2020), and Wunder (2018), with effective dates of October 31, 2019, July 31, 2019, and August 31, 2017, respectively.
There are no known environmental, legal, title, taxation, socio-economic, marketing, political or other factors that are expected to materially affect the Mineral Resource estimates detailed in this report. The Company has been experiencing delays in obtaining approvals to expand the GMC tailings storage facility which if not resolved may affect the GMC operations. For a discussion of these permitting matters, refer to Section 20.2.3 of this report.
Geological modelling and subsequent Mineral Resource estimation were performed by Great Panther under the supervision of the Qualified Persons in accordance with the CIM Estimation of Mineral Resources and Mineral Reserves Best Practice Guidelines (November 2019). The geological data compilation, interpretation, geological modelling and Mineral Resource estimation methods and procedures are described in the following Items.
14.1.1 Definition of Mineral Resource Estimates
For estimating the Mineral Resources for the Great Panther GMC mines, the Qualified Person has applied the definitions of “Mineral Resource” as set forth in the CIM Definitions Standards, adopted May 10, 2014 (CIMDS).
Under CIMDS, a Mineral Resource is defined as:
“…a concentration or occurrence of solid material of economic interest in or on the Earth’s crust in such form, grade or quality and quantity that there are reasonable prospects for eventual economic extraction. The location, quantity, grade or quality, continuity and other geological characteristics of a Mineral Resource are known, estimated or interpreted from specific geological evidence and knowledge, including sampling.”
Mineral Resources are subdivided into classes of Measured, Indicated, and Inferred, with the level of confidence reducing with each class, respectively. Mineral Resources are reported as in-situ tonnage and are not adjusted for mining losses or mining recovery. There are no Mineral Reserves disclosed in this report.
During the effective period of this TR (August 1, 2019 to July 31, 2020 for San Ignacio and November 1, 2019 to July 31, 2020 for Guanajuato) at total of 19,252 tonnes grading 196g/t silver and 1.22g/t gold has been milled from Guanajuato, and a total of 139,583 tonnes grading 116g/t silver and 2.08g/t gold has been milled from San Ignacio.
The resources were estimated from seven area-specific block models at Guanajuato, and sixteen block models at San Ignacio. A set of 50 wireframes representing the mineralized zones served to constrain the block models and data subsequently used in Inverse Distance Cubed (ID3) Au and Ag grade interpolation. The effective date of the estimate is July 31, 2020.
| Mineral Resource Estimates | 81 | Page |
NI 43-101 Technical Report | December 22, 2020 |
The geological interpretation was provided by the Company. Wireframe modelling was completed using MICROMINE and Leapfrog 3D geological modelling software and grade estimation and geological modelling completed using by MICROMINE software.
| 14.2 | Geological Database |
All underground channel and drill hole sample data collected under the supervision of the Guanajuato Geology Department are entered and stored within a Microsoft SQL database.
Sample intervals with assay values lower than the detection limit for silver and gold were imported at the detection limit. The MICROMINE database records the sample as being less than detection. For analysis in external software (e.g. MS Excel), the values were converted to half the detection limit.
14.2.1 Guanajuato
A validated dataset (see Item 12 of this TR for Database Validation) extracted from the Guanajuato SQL database and subsequently used in modelling consisted of 1,471 drill holes and 170,289 underground channel samples. This dataset contained data current up to and including July 31, 2020.
Most holes in the dataset are angled towards the northeast at moderate to steep angles in fans collared from development headings located in the hanging wall of the mineralized vein structures. Holes range in length from 3 meters to 430 meters. Channel samples with an average width of 0.77 meters consist primarily of individual samples with corresponding mid-point co-ordinates; all have azimuth and dip information to allow display of “pseudo drill holes”.
Drilling is spread out over an approximate area of 3,650 meters (northwest-southeast) by 1,000 meters (northeast-southwest). The average drill sample length is 1.10 meters.
14.2.2 San Ignacio
A validated dataset (see Item 12 of this TR for Database Validation) extracted from the Guanajuato SQL database and subsequently used in modelling consisted of 499 drill holes and 67,398 underground channel samples. This dataset contained data current up to and including July 31, 2020.
Most holes in the dataset are angled towards the west-southwest at moderate to steep angles in fans collared from development headings located in the hanging wall of the mineralized vein structures. Holes range in length from 9 meters to 600 meters and the average drill sample length is 0.94 meters. Channel samples with an average width of 0.68 meters consist primarily of individual samples with corresponding mid-point co-ordinates; all have azimuth and dip information to allow display of “pseudo drill holes”.
For this report, drill holes and underground samples between sections 1,200S and 1,225N, were utilized in the Mineral Resource estimate.
| 14.3 | Geological Interpretation |
14.3.1 Topography & Underground Workings
All wireframes for underground workings were generated by Great Panther personnel using a combination of digitized historic level plans and drill-hole logs. These wireframes were subsequently cut from the mineralization wireframes to generate total mined solids.
14.3.2 Geological Modelling Domains
Domain modelling is generally considered the first step in estimating resources for a mineral deposit. It consists of separating the mineralized material into different domains with distinct geological characteristics, grade distributions, and spatial continuity of geology and grade. In practice, each domain takes the form of a 3D envelope often interpreted on sections or levels by a geologist.
| Mineral Resource Estimates | 82 | Page |
NI 43-101 Technical Report | December 22, 2020 |
| 14.3.2.1 | Guanajuato |
There are 34 wireframes representing each of the mineralized zones contained within the seven areas created by Great Panther personnel and provided for use in resource modelling. Each wireframes’ name was assigned to the block model and assay intervals associated with each zone. Every assay located at >50% within one or more of the 34 wireframes received a corresponding code. Details on area and zone names and zone orientation are presented in Table 14.1.
Table 14.1: Vein and vein orientation, Guanajuato
| Area | Zone/Vein | Dip (Deg) | Dip Direction (Deg) |
| Cata | Cata Contacto | -46 | 236 |
| Cata Alto1 | -41 | 227 | |
| Cata Alto2 | -34 | 207 | |
| Cata Alto3 | -35 | 193 | |
| Cata Alto4 | -19 | 233 | |
| Cata Alto4a | -6 | 215 | |
| Cata Alto 5 | -30 | 192 | |
| Los Pozos | Pozos SE FW | -40 | 235 |
| Pozos SE | -41 | 236 | |
| Pozos AO1 | -40 | 225 | |
| Pozos AO2 | -40 | 231 | |
| Pozos AO3 | -40 | 227 | |
| Guanajuatito | GTTO HW | -45 | 228 |
| GTTO FW | -46 | 237 | |
| GTTO NW | -46 | 245 | |
| GTTO SE | -47 | 237 | |
| GTTO INT | -35 | 145 | |
| GTTO BO | -52 | 234 | |
| Santa Margarita | SM HW | -48 | 231 |
| SM BO | -27 | 237 | |
| SM AA | -35 | 232 | |
| Valenciana | VAL 3 | -42 | 234 |
| VAL 4 | -46 | 235 | |
| VA VM | -46 | 236 | |
| VA VM 245 | -49 | 235 | |
| VA VM BO1 | -47 | 236 | |
| VA VM BO2 | -41 | 236 | |
| VA VM COBO | -53 | 236 | |
| San Cayetano | SC | -44 | 236 |
| SC AO | -26 | 237 | |
| Promontorio | Prom A1 | -36 | 235 |
| Prom B1 | -39 | 235 | |
| Prom B2 | -39 | 235 | |
| Prom Alto2 | -52 | 237 |
| 14.3.2.2 | San Ignacio |
The domains (Table 14.2) were modelled to include vein, vein breccia, and stockwork material that were interpreted by Great Panther to form continuous veins. Not all material that was logged as vein, vein breccia, or stockwork was included in the sixteen-modelled domains, as some of this material could not be correlated between drill holes, and not all the intersections used to model the veins were mineralized. Details on zone names and zone orientation are presented Table 14.2.
| Mineral Resource Estimates | 83 | Page |
NI 43-101 Technical Report | December 22, 2020 |
Table 14.2: Vein and vein orientation, San Ignacio
| Zone/Vein | Dip (Deg) | Dip Direction (Deg) |
| Melladito | -64 | 65 |
| Melladito BO | -60 | 65 |
| Melladito South | -62 | 65 |
| Purisima | -45 | 235 |
| Purisima Bo | -75 | 210 |
| Purisima Int | -70 | 228 |
| Purisima HW | -55 | 223 |
| Intermediate | -87 | 245 |
| Intermediate 2 | -70 | 65 |
| Nombre De Dios | -49 | 245 |
| Nombre De Dios 1.5 | -59 | 245 |
| Nombre De Dios 2S | -65 | 245 |
| Nombre De Dios 2N | -45 | 245 |
| Nombre De Dios 3 | -45 | 245 |
| Santo Nino | -47 | 244 |
| 700 | -62 | 245 |
14.3.3 Assay Composites & Descriptive Statistics
Assay intervals were tagged for each area and zone, as described previously. Any assay contained at >50% within a wireframe received a domain name. Only samples with a domain name were used in the relevant grade interpolation.
Common industry practice is to composite samples to a standard specified length as a method of mitigating grade bias that may potentially result from variable primary sample lengths.
| 14.3.3.1 | Guanajuato |
All drill samples were composited to a length of 1.5 meters (maximum allowable drill assay interval length as documented in core processing protocols) prior to use in grade interpolation. The 1-meter composite length was selected as the minimum possible length which would allow for the closest reasonable parity with average channel sample length. Underground samples were stored as intervals and composited to a length of 1 meter prior to use in grade interpolation. A minimum width of 0.5 meter was applied during vein modelling.
The validated assay database contains 80,575 sample intervals from drill holes and 170,289 individual channel sample intervals from underground development and mining areas. Assay results reported to be below laboratory detection limits were replaced with a value of half the detection limit.
A total of 2,726 drill intervals and 59,303 underground samples were used for resource modelling process. For a sample be included in a resource model, at least 50 percent of the sample length need to lie within the wireframe. Table 14.3 and Table 14.4 provide summary statistics for these intervals.
Table 14.5 and Table 14.6 summarize the statistics of composited silver and gold grades respectively for Guanajuato.
Figure 14.1 and Figure 14.2 are histogram plots for sample lengths of underground channel samples and drill core samples respectively for Guanajuato.
Table 14.3: DDH sample statistics by area, Guanajuato
| Vein/Zone | Count | Min | Max | Mean | Std. Dev. | Variance |
| Au | ||||||
| Cata | 414 | 0.001 | 73.50 | 2.12 | 7.39 | 54.68 |
| Los Pozos | 769 | 0.001 | 16.85 | 1.09 | 2.08 | 4.31 |
| Santa Margarita | 383 | 0.001 | 97.70 | 4.10 | 11.23 | 126.07 |
| Guanajuatito | 419 | 0.001 | 53.70 | 0.67 | 3.05 | 9.31 |
| San Cayetano | 280 | 0.001 | 71.60 | 1.39 | 7.47 | 55.80 |
| Valenciana | 392 | 0.001 | 89.07 | 1.19 | 4.82 | 23.28 |
| Promontorio | 251 | 0.001 | 46.98 | 2.30 | 4.52 | 20.44 |
| Ag | ||||||
| Cata | 414 | 0.1 | 16,400 | 603 | 1,939 | 3,761,067 |
| Los Pozos | 769 | 0.1 | 5,465 | 219 | 497 | 246,862 |
| Santa Margarita | 383 | 0.1 | 2,440 | 74 | 225 | 50,483 |
| Guanajuatito | 419 | 0.1 | 5,830 | 104 | 375 | 140,708 |
| San Cayetano | 280 | 0.1 | 607 | 28 | 61 | 3,715 |
| Valenciana | 392 | 0.1 | 2,350 | 109 | 234 | 54,584 |
| Promontorio | 251 | 0.1 | 2,139 | 153 | 277 | 76,712 |
| Mineral Resource Estimates | 84 | Page |
NI 43-101 Technical Report | December 22, 2020 |
Table 14.4: U/G sample statistics by area, Guanajuato
| Vein/Zone | Count | Min | Max | Mean | Std. Dev. | Variance |
| Au | ||||||
| Cata | 6,899 | 0.001 | 119.00 | 1.02 | 4.79 | 22.92 |
| Los Pozos | 25,353 | 0.001 | 1,149 | 1.14 | 8.16 | 66.51 |
| Santa Margarita | 9,551 | 0.001 | 1,540.00 | 4.84 | 28.95 | 838.3 |
| Guanajuatito | 12,434 | 0.001 | 92.30 | 0.83 | 2.68 | 7.19 |
| San Cayetano | 6,620 | 0.001 | 173.76 | 2.27 | 8.88 | 78.89 |
| Valenciana | 4,215 | 0.001 | 222.11 | 1.60 | 7.26 | 52.70 |
| Promontorio | 1,941 | 0.001 | 150.57 | 1.26 | 4.56 | 20.79 |
| Ag | ||||||
| Cata | 6,899 | 0.1 | 33,300 | 296 | 1,253 | 1,570,192 |
| Los Pozos | 25,353 | 0.1 | 17,515 | 191 | 553 | 306,142 |
| Santa Margarita | 9,552 | 0.1 | 18,732 | 71 | 451 | 202,983 |
| Guanajuatito | 12,434 | 0.1 | 9,670 | 169 | 461 | 215,555 |
| San Cayetano | 6,620 | 0.1 | 13,391 | 148 | 656 | 429,699 |
| Valenciana | 4,215 | 0.1 | 17,297 | 153 | 641 | 410,761 |
| Promontorio | 4,404 | 0.1 | 9,330 | 102 | 343 | 117,510 |
| Mineral Resource Estimates | 85 | Page |
NI 43-101 Technical Report | December 22, 2020 |
Table 14.5: Descriptive statistics of composited silver grade by domain, Guanajuato
| Vein/Zone | Type | Count | Mean | Minimum | Maximum | Median | Variance | Std. Dev. | CV | 5th Percentile | 75th Percentile | 95th Percentile |
| Alto4 | DH | 43 | 143 | 0.1 | 900 | 6 | 67,752 | 260 | 1.82 | 0.1 | 118 | 834 |
| UG | 869 | 143 | 0.1 | 1300 | 14 | 88,019 | 297 | 2.07 | 0.1 | 94 | 927 | |
| Alto5 | DH | 91 | 21 | 0.1 | 244 | 4 | 1,952 | 44 | 2.08 | 0.1 | 14 | 162 |
| UG | 1,235 | 122 | 0.1 | 1500 | 9 | 81,867 | 286 | 2.34 | 0.1 | 64 | 779 | |
| Contacto | DH | 61 | 600 | 0.1 | 4,353 | 324 | 711,117 | 1.41 | 1.41 | 0.1 | 677 | 2,180 |
| UG | 1,753 | 403 | 0.1 | 15,952 | 14 | 1,905,385 | 1,380 | 3.43 | 0.1 | 131 | 1,942 | |
| GTTO FW | DH | 78 | 214 | 0.1 | 5,830 | 21 | 534,804 | 731 | 3.41 | 0.1 | 109 | 877 |
| UG | 7,908 | 213 | 0.1 | 29,459 | 67 | 375,521 | 613 | 2.87 | 0.1 | 194 | 856 | |
| GTTO BO | DH | 7 | 118 | 19 | 357 | 65 | 16,729 | 129 | 1.09 | 20 | 156 | 322 |
| UG | 1,214 | 230 | 0.1 | 5,323 | 93 | 181,766 | 426 | 1.85 | 9 | 239 | 868 | |
| Pozos SE | DH | 126 | 272 | 1 | 3,320 | 59 | 294,158 | 542 | 1.99 | 2.0 | 279 | 1,460 |
| UG | 3,956 | 254 | 1 | 11,694 | 47 | 217,574 | 466 | 2.66 | 1.00 | 167 | 717 | |
| Pozos SE FW | DH | 195 | 201 | 1 | 3,329 | 42 | 194,281 | 441 | 2.19 | 1 | 207 | 919 |
| UG | 10,227 | 182 | 1 | 13,003 | 55 | 176,929 | 421 | 2.317 | 1 | 181 | 740 | |
| Pozos AO1 | DH | 206 | 177 | 1 | 3,719 | 42 | 136,646 | 370 | 2.09 | 1.3 | 208 | 761 |
| UG | 5,848 | 186 | 1 | 10,329 | 40 | 290,432 | 539 | 2.90 | 1.0 | 150 | 768 | |
| Pozos AO2 | DH | 94 | 319 | 1 | 2,572 | 184 | 196,482 | 443 | 1.39 | 2 | 361 | 1147 |
| UG | 2,136 | 176 | 1 | 9,662 | 43 | 228,067 | 478 | 2.72 | 1 | 142 | 750 | |
| Pozos AO3 | DH | 19 | 61 | 1 | 440 | 25 | 10,098 | 100 | 1.64 | 1.90 | 66 | 165 |
| UG | 421 | 184 | 1 | 5,272 | 70 | 151,645 | 389 | 2.11 | 1 | 186 | 661 | |
| SM BO | DH | 5 | 253 | 129.2 | 371 | 298 | 8,726 | 94 | 0.37 | 134.90 | 310 | 359 |
| UG | 258 | 188 | 0.1 | 1300 | 51 | 94,799 | 308 | 1.63 | 0.10 | 164 | 936 | |
| SC | DH | 168 | 24 | 0.1 | 254 | 7 | 1,901 | 44 | 1.82 | 1.00 | 21 | 114 |
| UG | 3,368 | 48 | 0.1 | 300 | 19 | 4,553 | 67 | 1.40 | 0.10 | 58 | 209 | |
| SC AO | DH | |||||||||||
| UG | 577 | 88 | 0.1 | 300 | 41 | 9,252 | 96 | 1.09 | 0.10 | 158 | 300 | |
| VA VM | DH | 26 | 316 | 0.1 | 1,111 | 211 | 99,409 | 315 | 0.99 | 2.30 | 573 | 764 |
| UG | ||||||||||||
| VM 245 | DH | 21 | 213 | 3 | 1,025 | 175 | 70,286 | 265 | 1.25 | 3.00 | 333 | 590 |
| UG | ||||||||||||
| VM BO1 | DH | 85 | 90 | 0.1 | 752 | 20 | 26,282 | 162 | 1.79 | 0.10 | 97 | 424 |
| UG | 1,792 | 144 | 0.1 | 8,440 | 33 | 163,885 | 405 | 2.81 | 0.10 | 108 | 642 | |
| VM BO2 | DH | 33 | 129 | 3 | 982 | 70 | 39,612 | 199 | 1.54 | 4.00 | 146 | 488 |
| UG | 1,367 | 276 | 0.1 | 14,333 | 34 | 839,375 | 916 | 3.32 | 0.10 | 133 | 1,323 | |
| VM COBO | DH | 45 | 104 | 0.1 | 549 | 51 | 19,888 | 141 | 1.35 | 1.52 | 120 | 439 |
| UG | 2,860 | 134 | 0.1 | 9,937 | 28 | 173,487 | 417 | 3.11 | 0.10 | 98 | 540 | |
| Prom A1 | DH | 79 | 106 | 1 | 1210 | 60 | 34,133 | 185 | 1.74 | 6.90 | 103 | 284 |
| UG | 1,508 | 39 | 1 | 4,258 | 7 | 30,870 | 176 | 4.51 | 1.00 | 20 | 157 | |
| Prom B1 | DH | 90 | 181 | 1 | 1,611 | 99 | 73,0096 | 270 | 1.49 | 3.45 | 216 | 562 |
| UG | 1,102 | 138 | 1 | 2,778 | 42 | 75,408 | 275 | 1.99 | 1 | 132 | 615 | |
| Prom B2 | DH | 79 | 123 | 1 | 1,531 | 62 | 39,329 | 198 | 1.61 | 2.90 | 170 | 389 |
| UG | 911 | 95 | 1 | 2,767 | 21 | 57,874 | 241 | 2.53 | 1 | 74.5 | 407 | |
| Prom Alto2 | DH | 19 | 54 | 0.1 | 757 | 7 | 29,920 | 173 | 3.19 | 0.10 | 15 | 198 |
| UG | 530 | 184 | 0.1 | 9,330 | 23 | 345,759 | 588 | 3.20 | 0.05 | 114 | 885 |
| Mineral Resource Estimates | 86 | Page |
NI 43-101 Technical Report | December 22, 2020 |
Table 14.6: Descriptive statistics of composited gold grade by domain, Guanajuato
| Vein/Zone | Type | Count | Mean | Minimum | Maximum | Median | Variance | Std. Dev. | CV | 5th Percentile | 75th Percentile | 95th Percentile |
| Alto4 | DH | 43 | 0.715 | 0.001 | 7.000 | 0.020 | 2.464 | 1.570 | 2.197 | 0.001 | 0.290 | 4.560 |
| UG | 869 | 0.574 | 0.100 | 8.000 | 0.050 | 2.015 | 1.419 | 2.474 | 0.001 | 0.278 | 3.710 | |
| Alto5 | DH | 91 | 0.206 | 0.001 | 2.570 | 0.018 | 0.191 | 4.372 | 2.122 | 0.001 | 0.210 | 0.925 |
| UG | 1,235 | 0.555 | 0.001 | 9.000 | 0.051 | 1.873 | 1.368 | 2.465 | 0.001 | 0.327 | 3.506 | |
| Contacto | DH | 61 | 1.757 | 0.001 | 8.430 | 0.850 | 5.303 | 2.303 | 1.311 | 0.010 | 2.500 | 7.810 |
| UG | 1,753 | 1.228 | 0.001 | 69.000 | 0.061 | 21.531 | 4.640 | 3.778 | 0.001 | 0.363 | 6.011 | |
| GTTO FW | DH | 78 | 1.642 | 0.001 | 53.700 | 0.208 | 43.895 | 6.626 | 4.036 | 0.009 | 0.627 | 4.009 |
| UG | 7,908 | 1.013 | 0.001 | 107.484 | 0.279 | 11.499 | 3.391 | 3.348 | 0.022 | 0.795 | 3.873 | |
| GTTO BO | DH | 7 | 0.493 | 0.061 | 1.230 | 0.322 | 0.236 | 0.486 | 0.986 | 0.072 | 0.736 | 1.205 |
| UG | 1,214 | 1.075 | 0.001 | 34.160 | 0.406 | 5.583 | 2.363 | 2.197 | 0.042 | 1.030 | 3.705 | |
| Pozos SE | DH | 126 | 1.006 | 0.001 | 12.705 | 0.314 | 4.027 | 2.001 | 1.994 | 0.010 | 1.007 | 4.276 |
| UG | 3,956 | 1.060 | 0.001 | 46.530 | 0.320 | 6.668 | 2.585 | 2.433 | 0.020 | 1.030 | 4.180 | |
| Pozos SE FW | DH | 195 | 0.925 | 0.001 | 15.412 | 0.413 | 2.962 | 1.721 | 1.861 | 0.007 | 1.091 | 3.504 |
| UG | 10,227 | 0.96 | 0.001 | 253.930 | 0.32 | 13.2928 | 3.6459 | 3.811 | 0.001 | 0.960 | 3.590 | |
| Pozos AO1 | DH | 206 | 1.097 | 0.001 | 12.535 | 0.368 | 3.685 | 1.919 | 1.750 | 0.001 | 1.178 | 5.333 |
| UG | 5,848 | 1.25 | 0.001 | 464.89 | 0.260 | 48.533 | 6.967 | 5.569 | 0.010 | 0.920 | 4.570 | |
| Pozos AO2 | DH | 94 | 1.590 | 0.001 | 8.852 | 0.939 | 3.404 | 1.845 | 1.160 | 0.011 | 2.273 | 5.123 |
| UG | 2,136 | 1.000 | 0.001 | 45.450 | 0.260 | 5.965 | 2.442 | 2.444 | 0.010 | 0.840 | 4.340 | |
| Pozos AO3 | DH | 19 | 0.319 | 0.013 | 2.110 | 0.113 | 0.238 | 0.488 | 1.529 | 0.014 | 0.381 | 0.893 |
| UG | 421 | 1.020 | 0.001 | 38.33 | 0.400 | 6.347 | 2.519 | 2.472 | 0.030 | 1.010 | 3.54 | |
| SM BO | DH | 5 | 2.433 | 0.410 | 6.214 | 1.475 | 4.646 | 2.155 | 0.886 | 0.466 | 3.377 | 5.646 |
| UG | 258 | 1.178 | 0.001 | 10.000 | 0.315 | 3.884 | 1.971 | 1.672 | 0.031 | 1.024 | 5.603 | |
| SC | DH | 168 | 0.627 | 0.001 | 10.000 | 0.039 | 2.533 | 1.592 | 2.539 | 0.003 | 0.970 | 3.029 |
| UG | 3,368 | 1.265 | 0.001 | 10.000 | 0.216 | 5.362 | 2.316 | 1.831 | 0.010 | 1.150 | 7.398 | |
| SC AO | DH | |||||||||||
| UG | 577 | 1.243 | 0.001 | 10.000 | 0.343 | 4.311 | 2.076 | 1.670 | 0.018 | 1.240 | 6.490 | |
| VA VM | DH | 26 | 5.569 | 0.018 | 89.070 | 1.830 | 280.767 | 16.756 | 3.009 | 0.026 | 3.750 | 7.153 |
| UG | ||||||||||||
| VM 245 | DH | 21 | 1.563 | 0.014 | 9.060 | 0.738 | 5.869 | 2.423 | 1.550 | 0.016 | 2.070 | 6.600 |
| UG | ||||||||||||
| VM BO1 | DH | 85 | 0.836 | 0.001 | 9.000 | 0.214 | 2.016 | 1.419 | 1.699 | 0.003 | 0.970 | 3.750 |
| UG | 1,792 | 1.562 | 0.001 | 109.280 | 0.302 | 25.276 | 5.028 | 3.218 | 0.016 | 1.090 | 6.299 |
| Mineral Resource Estimates | 87 | Page |
NI 43-101 Technical Report | December 22, 2020 |
| Vein/Zone | Type | Count | Mean | Minimum | Maximum | Median | Variance | Std. Dev. | CV | 5th Percentile | 75th Percentile | 95th Percentile |
| VM BO2 | DH | 33 | 1.236 | 0.020 | 9.587 | 0.557 | 4.094 | 2.023 | 1.637 | 4.000 | 146.000 | 4.855 |
| UG | 1,367 | 2.581 | 0.001 | 149.790 | 0.289 | 81.080 | 9.004 | 3.489 | 0.011 | 1.144 | 12.815 | |
| VM COBO | DH | 45 | 1.096 | 0.004 | 7.903 | 0.546 | 2.399 | 1.549 | 1.414 | 0.008 | 1.220 | 3.666 |
| UG | 2,860 | 1.438 | 0.001 | 135.126 | 0.246 | 28.031 | 5.294 | 3.681 | 0.022 | 0.907 | 5.495 | |
| Prom A1 | DH | 79 | 2.507 | 0.010 | 23.005 | 1.010 | 15.989 | 3.999 | 1.595 | 0.052 | 2.966 | 9.206 |
| UG | 1,508 | 0.657 | 0.001 | 28.840 | 0.131 | 3.301 | 1.817 | 2.806 | 0.001 | 0.543 | 2.641 | |
| Prom B1 | DH | 90 | 1.393 | 0.010 | 10.892 | 0.946 | 3.445 | 1.856 | 1.33 | 0.010 | 1.640 | 4.308 |
| UG | 1,101 | 0.918 | 0.001 | 30.680 | 0.308 | 3.976 | 1.994 | 2.172 | 0.022 | 0.897 | 3.495 | |
| Prom B2 | DH | 79 | 1.528 | 0.020 | 6.883 | 1.010 | 2.608 | 1.615 | 1.057 | 0.044 | 1.907 | 5.828 |
| UG | 911 | 1.106 | 0.001 | 38.390 | 0.442 | 5.450 | 2.335 | 2.111 | 0.035 | 1.189 | 4.223 | |
| Prom Alto2 | DH | 19 | 4.277 | 0.001 | 19.764 | 2.163 | 32.294 | 5.683 | 1.329 | 0.001 | 4.155 | 15.062 |
| UG | 530 | 3.462 | 0.001 | 150.570 | 1.136 | 81.812 | 9.045 | 2.613 | 0.048 | 3.369 | 13.271 |
| Mineral Resource Estimates | 88 | Page |
NI 43-101 Technical Report | December 22, 2020 |
| Figure 14.1: Histogram of channel sample length, Guanajuato | Figure 14.2: Histogram of drill hole sample length, Guanajuato San Ignacio |
 |  |
| 14.3.3.2 | San Ignacio |
Using MICROMINE, all the veins were remodelled based on the Company geologist’s interpretation of drill-hole and underground chip samples. A minimum width of 0.5 meter was applied during vein modelling. Additional waste material was included during the domaining of very narrow intersections to meet minimum width criteria if necessary. Descriptive statistics of silver and gold grades in each domain are presented in Table 14.7 and Table 14.8.
All drill samples were composited to a length of 1.5 meter prior to use in grade interpolation. The capped drill-hole samples were composited to the length 1.5 meter. The composites are considered diluted as the domains were modelled to a minimum width. The drill-hole composites were used for interpolation of block grade.
The underground chip sample locations were treated as individual drill holes drilled parallel to the face i.e. perpendicular to the strike of the vein and were composited to the length 1.0 meters with a minimum composited length of 0.5 meters prior to interpolation.
The underground grades were then compared using a Q-Q plot to a subset of the drill-hole grades in all domains. The results show that the underground sample data are on higher in silver and gold as compared to the drill-hole samples. This bias is thought to reflect the larger sample size of the underground samples as well as reflecting the natural variability of the mineralization. Figure 14.3 and Figure 14.4 are histogram plots for sample lengths of underground channel samples and drill core samples respectively for San Ignacio.
Table 14.7: Descriptive statistics of Ag grade grouped by domain, San Ignacio
| Vein | Type | Count | Mean | Minimum | Maximum | Median | Variance |
| Melladito | DH | 657 | 127 | 1 | 11,951 | 50 | 242,673 |
| UG | 27,347 | 129 | 1 | 11,288 | 71 | 44,013 | |
| Melladito Bo | DH | 102 | 52 | 1 | 318 | 29 | 3,804 |
| UG | 5,961 | 73 | 1 | 2,377 | 41 | 9,414 | |
| Melladito South | DH | 755 | 110 | 1 | 755 | 60 | 20,277 |
| UG | 180 | 33 | 1 | 476 | 19 | 2,317 | |
| Purisima | DH | 125 | 178 | 1 | 2,334 | 83 | 83,910 |
| UG | - | - | - | - | - | - | |
| Purisima Bo | DH | 91 | 137 | 1 | 973 | 54 | 40,845 |
| UG | 257 | 105 | 1 | 1,864 | 44 | 34,687 | |
| Purisima HW | DH | 25 | 298 | 4 | 2,119 | 228 | 171,682 |
| UG | - | - | - | - | - | - | |
| Purisima Int | DH | 26 | 251 | 4 | 1,619 | 81 | 137,336 |
| UG | - | - | - | - | - | - | |
| 700 | DH | 7 | 186 | 26 | 461 | 119 | 26,516 |
| UG | 18 | 47 | 5 | 137 | 30 | 1,726 | |
| Santo Nino | DH | 44 | 56 | 1 | 436 | 7.5 | 9,737 |
| UG | - | - | - | - | - | - | |
| Intermediate | DH | 162 | 150 | 1 | 1,040 | 89 | 34,606 |
| UG | 4,931 | 196 | 1 | 8,751 | 141 | 53,620 | |
| Intermediate 2 | DH | 133 | 169 | 1 | 1,100 | 101 | 40,513 |
| UG | 4,531 | 278 | 1 | 4,531 | 226 | 70,124 | |
| Nombre De Dios | DH | 161 | 114 | 1 | 2,662 | 48 | 58,497 |
| UG | 5,029 | 144 | 1 | 6,009 | 84 | 40,927 | |
| Nombre De Dios 1.5 | DH | 152 | 98 | 1 | 680 | 34 | 19,610 |
| UG | 1,333 | 136 | 1 | 1,435 | 81 | 26,647 | |
| Nombre De Dios 2N | DH | 98 | 138 | 1 | 816 | 75 | 23,565 |
| UG | 2,896 | 168 | 1 | 8,884 | 86 | 115,111 | |
| Nombre De Dios 2S | DH | 90 | 118 | 1 | 648 | 60 | 17,709 |
| UG | 4,607 | 243 | 1 | 6,007 | 172 | 75,924 | |
| Nombre De Dios 3 | DH | 22 | 193 | 1 | 1,100 | 73 | 84,465 |
| UG | 218 | 334 | 1 | 3,704 | 200 | 244,739 |
| Mineral Resource Estimates | 89 | Page |
NI 43-101 Technical Report | December 22, 2020 |
Table 14.8: Descriptive statistics of Au grade grouped by domain, San Ignacio
| Vein | Type | Count | Mean | Minimum | Maximum | Median | Variance |
| Melladito | DH | 657 | 2.95 | 0.001 | 48.240 | 1.58 | 18.17 |
| UG | 27,347 | 3.23 | 0.001 | 87.37 | 2.10 | 15.10 | |
| Melladito Bo | DH | 102 | 2.89 | 0.006 | 26.85 | 1.33 | 16.71 |
| UG | 5,961 | 2.95 | 0.001 | 204.00 | 2.03 | 20.15 | |
| Melladito South | DH | 175 | 3.19 | 0.010 | 34.43 | 1.86 | 17.76 |
| UG | 180 | 1.23 | 0.001 | 7.12 | 0.73 | 1.79 | |
| Purisima | DH | 125 | 1.45 | 0.001 | 26.03 | 0.64 | 7.62 |
| UG | - | - | - | - | - | - | |
| Purisima Bo | DH | 91 | 3.92 | 0.001 | 28.52 | 1.45 | 31.23 |
| UG | 257 | 2.90 | 0.001 | 21.29 | 1.89 | 10.40 | |
| Purisima HW | DH | 25 | 3.06 | 0.020 | 25.14 | 1.34 | 29.27 |
| UG | - | - | - | - | - | - | |
| Purisima Int | DH | 26 | 5.32 | 0.080 | 58.75 | 1.34 | 147.78 |
| UG | - | - | - | - | - | - | |
| 700 | DH | 7 | 6.99 | 0.340 | 22.04 | 3.41 | 67.61 |
| UG | 18 | 1.26 | 0.001 | 5.69 | 0.56 | 2.22 | |
| Santo Nino | DH | 44 | 6.72 | 0.001 | 172.78 | 0.14 | 795.47 |
| UG | - | - | - | - | - | - | |
| Intermediate | DH | 162 | 2.51 | 0.001 | 13.70 | 1.31 | 8.18 |
| UG | 4,931 | 3.33 | 0.001 | 57.10 | 2.33 | 13.14 | |
| Intermediate 2 | DH | 133 | 2.72 | 0.006 | 28.68 | 1.39 | 14.35 |
| UG | 4, | 4.56 | 0.001 | 135.98 | 3.38 | 25.96 | |
| Nombre De Dios | DH | 161 | 2.49 | 0.001 | 81.81 | 0.58 | 49.33 |
| UG | 5,029 | 2.53 | 0.001 | 133.04 | 1.10 | 20.12 | |
| Nombre De Dios 1.5 | DH | 152 | 1.25 | 0.001 | 24.67 | 0.56 | 5.60 |
| UG | 1,333 | 2.29 | 0.001 | 91.75 | 1.40 | 16.87 | |
| Nombre De Dios 2N | DH | 98 | 2.28 | 0.001 | 20.53 | 0.92 | 11.34 |
| UG | 2,896 | 3.30 | 0.001 | 455.94 | 1.25 | 210.82 | |
| Nombre De Dios 2S | DH | 90 | 2.55 | 0.005 | 16.06 | 1.00 | 9.95 |
| UG | 4,607 | 3.56 | 0.001 | 58.37 | 2.34 | 17.58 | |
| Nombre De Dios 3 | DH | 22 | 1.21 | 0.160 | 4.80 | 1.21 | 2.12 |
| UG | 218 | 1.70 | 0.001 | 10.10 | 1.21 | 2.84 |
| Mineral Resource Estimates | 90 | Page |
NI 43-101 Technical Report | December 22, 2020 |
| Figure 14.3: Histogram of channel sample length, San Ignacio | Figure 14.4: Histogram of drill hole sample length, San Ignacio |
 | 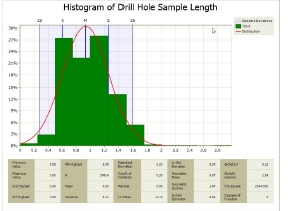 |
14.3.4 Outliers (High Grade Capping of Assay Composite)
When estimating resources, high-grade outliers can contribute excessively to the total metal content of the estimate. In a geologic context, outliers can represent a separate grade population characterized by its own continuity; generally, there is less physical continuity of high grades than in the more prevalent lower grades. Thus, overestimation of both tonnage and average grade above a cut-off grade can result if a general model, normally dominated by the lower, more continuous grades, is applied to very high-grade values. The problem is further exaggerated when the high-grade samples are isolated in a field of lower grade samples (Sinclair & Blackwell, 2002). Several techniques were used to determine individual grade caps for all combinations of mineralized zone and sample type (drill vs. channel). For all samples, caps were applied, interpolation performed and resulting model grades reconciled with reported production grades. This process was repeated with various caps until an acceptable correlation between model and production grades was achieved. In conjunction, probability plots were examined for 'breaks' and histogram to identify erratic tail which are considered to indicate appropriate capping levels. Both techniques were performed for all data and the most appropriate cap based on all results was selected.
| 14.3.4.1 | Guanajuato |
The net impact of the capping on drilling was to reduce the average Au and Ag assay grades by 40% and 49%, respectively. For underground sampling, the average reductions related to capping were 40% and 42% respectively. Table 14.9 provides a summary of caps and assay statistics applied to drill core samples and Table 14.10 provides the caps and assay statistics for the underground channel sample data.
Table 14.9: Drill hole assay capping, Guanajuato
| Vein/Zone | Au g/t | Ag g/t | ||||
| Cap | Before | After | Cap | Before | After | |
| Cata Contacto | 6 | 1.87 | 1.68 | 1200 | 597 | 444 |
| Cata Alto1 | 6 | 3.92 | 1.34 | 900 | 1065 | 276 |
| Cata Alto2 | 6 | 3.92 | 1.16 | 900 | 889 | 202 |
| Cata Alto3 | 7 | 3.87 | 1.9 | 900 | 1316 | 342 |
| Cata Alto4 | 7 | 1.09 | 1 | 900 | 404 | 197 |
| Cata Alto4a | 6 | 0.68 | 0.68 | 900 | 241 | 105 |
| Cata Alto 5 | 9 | 0.21 | 0.21 | 900 | 25 | 25 |
| Pozos SEFW | 6 | 0.96 | 0.83 | 900 | 209 | 148 |
| Pozos SE | 6 | 0.90 | 0.75 | 1000 | 223 | 165 |
| Pozos AO1 | 6 | 1.18 | 1.03 | 700 | 188 | 140 |
| Pozos AO2 | 6 | 1.66 | 1.51 | 900 | 328 | 255 |
| Pozos AO3 | 6 | 0.40 | 0.40 | 900 | 101 | 101 |
| GTTO HW | 3 | 0.61 | 0.47 | 700 | 92 | 76 |
| GTTO FW | 5 | 1.41 | 0.58 | 800 | 188 | 102 |
| GTTO NW | 3 | 0.45 | 0.36 | 600 | 95 | 77 |
| GTTO SE | 3 | 0.53 | 0.42 | 600 | 141 | 91 |
| GTTO INT | NA | NA | ||||
| GTTO BO | NA | NA | ||||
| SM HW | 25 | 4.29 | 3.19 | 400 | 57 | 36.6 |
| SM BO | 8 | 2.29 | 2.29 | 400 | 268 | 237 |
| SM AA | 40 | 1.19 | 1.19 | 500 | 262 | 166 |
| VAL 3 | 5 | 6.35 | 0.74 | 200 | 100 | 39 |
| VAL 4 | 5 | 2.04 | 2.04 | 200 | 228 | 105 |
| VA VM | 5 | 5.29 | 2.11 | 400 | 335 | 224 |
| VM 245 | 5 | 1.62 | 1.33 | 400 | 234 | 192 |
| VM BO1 | 5 | 0.89 | 0.80 | 400 | 93 | 75 |
| VM BO2 | 5 | 1.44 | 1.11 | 400 | 148 | 104 |
| VM COBO | 5 | 0.99 | 0.87 | 500 | 88 | 84 |
| SC | 10 | 1.49 | 0.69 | 300 | 29 | 28 |
| SC AO | NA | NA | ||||
| Prom A1 | 5 | 3.31 | 2.10 | 500 | 126 | 104 |
| Prom B1 | 5 | 1.50 | 1.22 | 500 | 199 | 160 |
| Prom B2 | 5 | 1.65 | 1.52 | 500 | 138 | 120 |
| Prom Alto2 | 6 | 5.25 | 2.54 | 700 | 106 | 44 |
| Mineral Resource Estimates | 91 | Page |
NI 43-101 Technical Report | December 22, 2020 |
Table 14.10: U/G sample assay capping, Guanajuato
| Vein/Zone | Au g/t | Ag g/t | ||||
| Cap | Before | After | Cap | Before | After | |
| Cata Contacto | 8 | 1.12 | 0.72 | 1300 | 378 | 178 |
| Cata Alto1 | 8 | 1.62 | 0.72 | 1300 | 358 | 165 |
| Cata Alto2 | 8 | 2.65 | 1.27 | 1300 | 594 | 257 |
| Cata Alto3 | 8 | 1.47 | 0.99 | 1300 | 411 | 215 |
| Cata Alto4 | 8 | 0.75 | 0.52 | 1300 | 218 | 133 |
| Cata Alto4a | 8 | 2.03 | 0.75 | 1300 | 440 | 152 |
| Cata Alto 5 | 9 | 0.88 | 0.57 | 1500 | 247 | 125 |
| Pozos SEFW | 6 | 0.98 | 0.81 | 1300 | 193 | 165 |
| Pozos SE | 7 | 1.21 | 0.91 | 1300 | 181 | 153 |
| Pozos AO1 | 7 | 1.46 | 0.91 | 1300 | 197 | 148 |
| Pozos AO2 | 6 | 1.02 | 0.79 | 1300 | 179 | 143 |
| Pozos AO3 | 6 | 0.98 | 0.83 | 1100 | 179 | 156 |
| GTTO HW | 5 | 0.63 | 0.49 | 2000 | 109 | 102 |
| GTTO FW | 5 | 0.97 | 0.71 | 1500 | 208 | 176 |
| GTTO NW | 5 | 0.85 | 0.70 | 2000 | 167 | 134 |
| GTTO SE | 3 | 0.13 | 0.13 | 600 | 33 | 31 |
| GTTO INT | 4 | 1.27 | 0.7 | 1800 | 225 | 132 |
| GTTO BO | 5 | 0.74 | 0.64 | 1500 | 168 | 155 |
| SM HW | 25 | 5.22 | 2.79 | 600 | 56 | 31 |
| SM BO | 10 | 1.54 | 1.26 | 1300 | 305 | 202 |
| SM AA | 40 | 4.99 | 2.99 | 1300 | 289 | 76 |
| VAL 3 | NA | NA | ||||
| VAL 4 | NA | NA | ||||
| VA VM | NA | NA | ||||
| VM 245 | NA | NA | ||||
| VM BO1 | 6 | 1.73 | 0.99 | 500 | 158 | 95 |
| VM BO2 | 6 | 2.75 | 1.07 | 500 | 295 | 106 |
| VM COBO | 5 | 1.39 | 0.76 | 500 | 130 | 79 |
| SC | 10 | 2.43 | 1.22 | 300 | 97 | 50 |
| SC AO | 10 | 1.82 | 1.21 | 300 | 397 | 185 |
| Prom A1 | 5 | 0.59 | 0.50 | 500 | 35 | 28 |
| Prom B1 | 5 | 0.93 | 0.75 | 500 | 144 | 101 |
| Prom B2 | 5 | 1.12 | 0.93 | 500 | 96 | 69 |
| Prom Alto2 | 6 | 3.43 | 1.91 | 700 | 174 | 109 |
| Mineral Resource Estimates | 92 | Page |
NI 43-101 Technical Report | December 22, 2020 |
| 14.3.4.2 | San Ignacio |
The net impact of the capping on drilling was to reduce the average Au and Ag assay grades by 27% and 16%, respectively. For underground sampling, the average reductions related to capping were 19% and 14% respectively.
Table 14.11 provides a summary of caps and assay statistics applied to both drill core samples and the underground channel sample data.
Descriptive statistics of composited silver and gold grades by domain are also presented below in Table 14.12 and Table 14.13.
Table 14.11: Capping levels for Ag and Au grouped by domain, San Ignacio
| Vein | Type | Au (g/t) | Before | After | Ag (g/t) | Before | After |
| Melladito | DH | 8 | 2.95 | 2.48 | 400 | 127 | 96 |
| UG | 8 | 3.23 | 2.84 | 400 | 129 | 111 | |
| Melladito Bo | DH | 8 | 2.89 | 2.45 | 360 | 52 | 52 |
| UG | 8 | 2.95 | 2.66 | 400 | 73 | 71 | |
| Melladito South | DH | 7 | 3.19 | 2.66 | 350 | 110 | 99 |
| UG | 7 | 1.23 | 1.22 | 400 | 33 | 33 | |
| Purisima | DH | 6 | 1.45 | 1.25 | 500 | 178 | 145 |
| UG | - | - | - | - | - | - | |
| Purisima Bo | DH | 6 | 4.14 | 2.50 | 400 | 142 | 112 |
| UG | 7 | 2.90 | 2.55 | 400 | 105 | 88 | |
| Purisima HW | DH | 5 | 3.06 | 1.75 | 500 | 298 | 228 |
| UG | - | - | - | - | - | - | |
| Purisima Int | DH | 6 | 5.32 | 2.23 | 450 | 251 | 169 |
| UG | - | - | - | - | - | - | |
| 700 | DH | 7 | 6.99 | 3.83 | 350 | 186 | 167 |
| UG | 7 | 1.26 | 1.26 | 350 | 47 | 47 | |
| Santo Nino | DH | 5 | 1.09 | 0.66 | 350 | 51 | 49 |
| UG | - | - | - | - | - | - | |
| Intermediate | DH | 8 | 2.51 | 2.40 | 450 | 150 | 133 |
| UG | 8 | 3.33 | 2.98 | 450 | 196 | 175 | |
| Intermediate 2 | DH | 8 | 2.72 | 2.36 | 500 | 169 | 154 |
| UG | 10 | 5.13 | 4.51 | 500 | 306 | 268 | |
| Nombre De Dios | DH | - | 2.49 | 2.49 | 400 | 114 | 93 |
| UG | 7 | 2.54 | 2.04 | 500 | 148 | 137 | |
| Nombre De Dios 1.5 | DH | 4 | 1.25 | 1.06 | 400 | 98 | 91 |
| UG | 6 | 2.29 | 1.90 | 450 | 136 | 125 | |
| Nombre De Dios 2N | DH | 6 | 2.28 | 1.81 | 350 | 138 | 123 |
| UG | 8 | 5.54 | 2.55 | 700 | 205 | 165 | |
| Nombre De Dios 2S | DH | 6 | 2.55 | 2.13 | 550 | 118 | 117 |
| UG | 6 | 3.64 | 2.83 | 550 | 256 | 221 | |
| Nombre De Dios 3 | DH | 6 | 1.73 | 1.73 | 600 | 193 | 161 |
| UG | 7 | 1.70 | 1.68 | 600 | 334 | 252 |
| Mineral Resource Estimates | 93 | Page |
NI 43-101 Technical Report | December 22, 2020 |
Table 14.12: Descriptive statistics of composited Ag grade by domain, San Ignacio
| Vein | Type | Count | Mean | Min. | Max. | Median | Variance | Std. Dev. | CV | 95th Percentile |
| Melladito | DH | 398 | 85 | 1 | 398 | 55 | 8,151 | 90 | 1.07 | 292 |
| UG | 23,247 | 112 | 1 | 400 | 78 | 9,789 | 99 | 0.88 | 335 | |
| Melladito Bo | DH | 71 | 55 | 1 | 257 | 35 | 2,958 | 54 | 0.99 | 163 |
| UG | 5,308 | 71 | 1 | 400 | 44 | 5,505 | 74 | 1.05 | 229 | |
| Melladito South | DH | 119 | 101 | 1 | 350 | 66 | 10,987 | 105 | 10.4 | 350 |
| UG | 141 | 33 | 1 | 243 | 24 | 1,339 | 37 | 1.09 | 90 | |
| Purisima | DH | 98 | 145 | 1 | 500 | 102 | 19,584 | 140 | 0.97 | 419 |
| UG | - | - | - | - | - | - | - | - | - | |
| Purisima Bo | DH | 65 | 101 | 1 | 400 | 60 | 11,899 | 109 | 1.08 | 344 |
| UG | 205 | 88 | 1 | 400 | 54 | 8,510 | 92 | 1.05 | 280 | |
| Purisima HW | DH | 19 | 235 | 4 | 500 | 159 | 25,433 | 159 | 0.68 | 500 |
| UG | - | - | - | - | - | - | - | - | - | |
| Purisima Int | DH | 19 | 183 | 4 | 450 | 130 | 26,594 | 163 | 0.89 | 450 |
| UG | - | - | - | - | - | - | - | - | - | |
| 700 | DH | 7 | 189 | 41 | 350 | 119 | 16,470 | 128 | 0.68 | 350 |
| UG | 14 | 43 | 5 | 137 | 33 | 1,491 | 39 | 0.89 | 123 | |
| Santo Nino | DH | 30 | 57 | 1 | 350 | 8 | 8,528 | 92 | 1.61 | 263 |
| UG | - | |||||||||
| Intermediate | DH | 103 | 129 | 1 | 450 | 107 | 14,929 | 122 | 0.94 | 403 |
| UG | 4,566 | 172 | 1 | 450 | 145 | 13,807 | 118 | 0.68 | 434 | |
| Intermediate 2 | DH | 99 | 155 | 1 | 500 | 127 | 20,087 | 142 | 0.91 | 443 |
| UG | 3,831 | 244 | 1 | 500 | 232 | 24,394 | 156 | 0.64 | 500 | |
| Nombre De Dios | DH | 115 | 88 | 1 | 379 | 54 | 8,173 | 90 | 1.03 | 270 |
| UG | 4,254 | 131 | 1 | 500 | 91 | 15,203 | 123 | 0.94 | 407 | |
| Nombre De Dios 1.5 | DH | 106 | 101 | 1 | 400 | 54 | 12,543 | 112 | 1.11 | 388 |
| UG | 1,139 | 118 | 1 | 450 | 84 | 12,016 | 110 | 0.93 | 363 | |
| Nombre De Dios 2N | DH | 72 | 124 | 2 | 350 | 91 | 10,532 | 103 | 0.83 | 327 |
| UG | 2,341 | 144 | 1 | 700 | 97 | 21,210 | 146 | 1.01 | 467 | |
| Nombre De Dios 2S | DH | 70 | 114 | 2 | 410 | 86 | 11,386 | 107 | 0.94 | 312 |
| UG | 4,060 | 216 | 1 | 550 | 183 | 23,657 | 154 | 0.71 | 550 | |
| Nombre De Dios 3 | DH | 19 | 139 | 3 | 600 | 54 | 36,733 | 192 | 1.38 | 556 |
| UG | 181 | 254 | 1 | 600 | 213 | 37,351 | 193 | 0.76 | 600 |
Table 14.13: Descriptive statistics of composited Au grade by domain, San Ignacio
| Vein | Type | Count | Mean | Min. | Max. | Median | Variance | Std. Dev. | CV | 95th Percentile |
| Melladito | DH | 424 | 2.25 | 0.001 | 8.00 | 1.55 | 4.07 | 2.02 | 0.89 | 6.33 |
| UG | 23,247 | 2.88 | 0.001 | 8.00 | 2.29 | 4.70 | 2.17 | 0.75 | 7.65 | |
| Melladito Bo | DH | 71 | 2.47 | 0.007 | 7.88 | 1.79 | 4.37 | 2.09 | 0.85 | 6.18 |
| UG | 5,308 | 2.66 | 0.001 | 8.00 | 2.15 | 4.27 | 2.07 | 0.78 | 7.06 | |
| Melladito South | DH | 119 | 2.54 | 0.010 | 7.00 | 2.13 | 4.26 | 2.06 | 0.81 | 6.48 |
| UG | 141 | 1.18- | 0.010 | 7.00 | 0.84 | 1.31 | 1.15 | 0.97 | 3.29 | |
| Purisima | DH | 98 | 1.10 | 0.001 | 6.00 | 0.73 | 1.24 | 1.11 | 1.02 | 3.08 |
| UG | - | - | - | - | - | - | - | - | - | |
| Purisima Bo | DH | 65 | 2.44 | 1.000 | 6 | 2.27 | 4.28 | 2.07 | 0.85 | 5.74 |
| UG | 205 | 2.59 | 0.001 | 7.00 | 2.06 | 4.06 | 2.02 | 0.78 | 6.79 | |
| Purisima HW | DH | 19 | 1.70 | 0.020 | 5.00 | 1.36 | 2.34 | 1.53 | 0.90 | 5.00 |
| UG | - | - | - | - | - | - | - | - | - | |
| Purisima Int | DH | 19 | 1.87 | 0.08 | 6.00 | 1.35 | 3.72 | 1.93 | 0.89 | 6.00 |
| UG | - | - | - | - | - | - | - | - | - | |
| 700 | DH | 7 | 4.62 | 0.921 | 7.00 | 5.96 | 7.82 | 2.80 | 0.61 | 7.00 |
| UG | 14 | 1.21 | 0.001 | 2.69 | 0.74 | 2.15 | 1.47 | 1.21 | 3.60 | |
| Santo Nino | DH | 30 | 0.71 | 0.008 | 5.00 | 0.14 | 2.01 | 1.42 | 1.99 | 4.66 |
| UG | - | - | - | - | - | - | - | - | - | |
| Intermediate | DH | 103 | 2.19 | 0.020 | 7.26 | 1.37 | 4.83 | 2.19 | 1.00 | 6.39 |
| UG | 4,566 | 2.97 | 0.001 | 8.00 | 2.44 | 4.98 | 2.23 | 0.75 | 8.00 | |
| Intermediate 2 | DH | 99 | 2.49 | 0.009 | 8.00 | 1.86 | 5.31 | 2.31 | 0.92 | 7.35 |
| UG | 3,831 | 4.13 | 0.001 | 10.00 | 3.54 | 9.35 | 3.06 | 0.74 | 10.00 | |
| Nombre De Dios | DH | 115 | 2.12 | 0.001 | 30.62 | 0.76 | 13.88 | 3.73 | 1.75 | 7.59 |
| UG | 4,254 | 2.03 | 0.001 | 7.00 | 1.22 | 4.14 | 2.03 | 1.00 | 7.00 | |
| Nombre De Dios 1.5 | DH | 106 | 1.13 | 0.021 | 4.50 | 0.806 | 1.06 | 1.03 | 0.91 | 3.07 |
| UG | 1,139 | 1.85 | 0.001 | 6.00 | 1.46 | 2.31 | 1.52 | 0.82 | 5.42 | |
| Nombre De Dios 2N | DH | 72 | 1.72 | 0.001 | 6.00 | 0.93 | 3.24 | 1.80 | 1.05 | 6.00 |
| UG | 2,341 | 2.13 | 0.001 | 8.00 | 1.45 | 3.96 | 1.99 | 0.94 | 6.85 | |
| Nombre De Dios 2S | DH | 70 | 2.00 | 0.030 | 6.00 | 1.02 | 4.11 | 2.03 | 1.01 | 6.00 |
| UG | 4,060 | 3.14 | 0.001 | 8.00 | 2.65 | 5.51 | 2.35 | 0.75 | 8.00 | |
| Nombre De Dios 3 | DH | 19 | 1.63 | 0.160 | 4.71 | 1.29 | 1.63 | 1.27 | 0.78 | 4.31 |
| UG | 181 | 1.66 | 0.001 | 7.00 | 1.24 | 2.21 | 1.49 | 0.90 | 4.84 |
| Mineral Resource Estimates | 94 | Page |
NI 43-101 Technical Report | December 22, 2020 |
| 14.4 | Mineral Resource Estimation |
The Mineral Resource estimation methodology and grade interpolation methodology applied to the current GMC Mineral Resource Estimates for Guanajuato & San Ignacio are consistent with methodologies applied in the previous Mineral Resource estimates (Brown & Nourpour, 2020a; Brown & Nourpour, 2020b).
14.4.1 Block Model Parameters
The block dimensions for all models are 2.5m x 2.5m x 2.5m. Details on block model dimensions and extent are presented in Table 14.14 and Table 14.15 for Guanajuato and San Ignacio respectively.
Each block located at least partly within a wireframe has been assigned a domain name, the percent of the wireframe occupying the block, the average distance of and number of holes/composites used in the estimate of grade for the block, the distance to the nearest hole, and the grade of the closest composite. Grades were estimated only to those blocks coincident with one of the zones.
Table 14.14: Size and extent of block models, Guanajuato
| Coordinate | Minimum | Maximum | Size(m) | Coordinate | Minimum | Maximum | Size(m) |
| Cata | Guanajuatito | ||||||
| Easting | 697 | 982 | 2.5 | Easting | -399 | 111 | 2.5 |
| Northing | -2,985 | -2,710 | 2.5 | Northing | -1,130 | -669 | 2.5 |
| Elevation | 1,541 | 1,708 | 2.5 | Elevation | 1,637 | 2,060 | 2.5 |
| Los Pozos | Valenciana | ||||||
| Easting | 903 | 1,782 | 2.5 | Easting | -150 | 367 | 2.5 |
| Northing | -3,239 | -2,406 | 2.5 | Northing | -2,105 | -1,346 | 2.5 |
| Elevation | 1,673 | 2,075 | 2.5 | Elevation | 1,484 | 2,002 | 2.5 |
| Santa Margarita / San Cayetano | Promontorio | ||||||
| Easting | 1,325 | 1,749 | 2.5 | Easting | 1,643 | 2,310 | 2.5 |
| Northing | -3,735 | -3,188 | 2.5 | Northing | -3,614 | -2,952 | 2.5 |
| Elevation | 1,478 | 1,807 | 2.5 | Elevation | 1,729 | 2,134 | 2.5 |
Table 14.15: Size and extent of block models, San Ignacio
| Coordinate | Minimum | Maximum | Size(m) | Coordinate | Minimum | Maximum | Size(m) |
| Intermediate | Intermediate 2 | ||||||
| Easting | -6777 | -6677 | 2.5 | Easting | -6665 | -6568 | 2.5 |
| Northing | -1275 | -888 | 2.5 | Northing | -1448 | -1160 | 2.5 |
| Elevation | 2143 | 2380 | 2.5 | Elevation | 2108 | 2373 | 2.5 |
| Melladito | Melladito BO | ||||||
| Easting | -6938 | -6513 | 2.5 | Easting | -6739 | -6570 | 2.5 |
| Northing | -1645 | -610 | 2.5 | Northing | -1495 | -1202 | 2.5 |
| Elevation | 2123 | 2385 | 2.5 | Elevation | 2126 | 2344 | 2.5 |
| Melladito South | Purisima | ||||||
| Easting | -6565 | -6043 | 2.5 | Easting | -6963 | -5848 | 2.5 |
| Northing | -2313 | -1605 | 2.5 | Northing | -2710 | -1600 | 2.5 |
| Elevation | 2035 | 2315 | 2.5 | Elevation | 2018 | 2293 | 2.5 |
| Purisima BO | Purisima HW | ||||||
| Easting | -6428 | -6093 | 2.5 | Easting | -6630 | -6240 | 2.5 |
| Northing | -2325 | -2030 | 2.5 | Northing | -2243 | -1968 | 2.5 |
| Elevation | 2070 | 2295 | 2.5 | Elevation | 2090 | 2278 | 2.5 |
| Purisima Int | 700 | ||||||
| Easting | -6380 | -6233 | 2.5 | Easting | -6113 | -6060 | 2.5 |
| Northing | -2223 | -2085 | 2.5 | Northing | -2305 | -2245 | 2.5 |
| Elevation | 2098 | 2225 | 2.5 | Elevation | 2165 | 2245 | 2.5 |
| Nombre de Dios | Nombre de Dios 1.5 | ||||||
| Easting | -6778 | -6518 | 2.5 | Easting | -6618 | -6429 | 2.5 |
| Northing | -1245 | -790 | 2.5 | Northing | -1509 | -1181 | 2.5 |
| Elevation | 2165 | 2372 | 2.5 | Elevation | 2133 | 2321 | 2.5 |
| Nombre de Dios 2S | Nombre de Dios 2N | ||||||
| Easting | -6683 | -6390 | 2.5 | Easting | -6830 | -6578 | 2.5 |
| Northing | -1465 | -1023 | 2.5 | Northing | -908 | -405 | 2.5 |
| Elevation | 2133 | 2353 | 2.5 | Elevation | 2145 | 2365 | 2.5 |
| Nombre de Dios 3 | Santo Nino | ||||||
| Easting | -6725 | -6685 | 2.5 | Easting | -7465 | -7015 | 2.5 |
| Northing | -1045 | -908 | 2.5 | Northing | -1480 | -958 | 2.5 |
| Elevation | 2153 | 2243 | 2.5 | Elevation | 1990 | 2230 | 2.5 |
| Mineral Resource Estimates | 95 | Page |
NI 43-101 Technical Report | December 22, 2020 |
14.4.2 Grade Variography
Variogram analysis was undertaken for both Au and Ag to characterize the spatial variance of each.
| 14.4.2.1 | Guanajuato |
Single-structure ranges were developed in the average plane of all zones for each area. Long ranges were found to be between 4-20 meters for Ag and 3-20 meters for Au, while the nugget (C0) values ranged from 14 - 60% and 21 - 65% of total sill (C0+C1) for Ag and Au, respectively. These results indicated that while there is a demonstrable spatial correlation between samples within each zone, local estimates of grade are not expected to be particularly accurate given the high nugget values reported above.
| 14.4.2.2 | San Ignacio |
Variogram analysis was undertaken for both Au and Ag to characterize the spatial variance of each vein. The results indicated Ag ranges are between 2-35 meters and the nugget ranged from 22 to 69% of total sill, while Au ranges between 2-34 meters and the nugget ranged from 24 to 62% of total sill. There is a demonstratable spatial correlation between samples within each zone, but local estimates of grade are not expected to be particularly accurate given the high nugget values.
14.4.3 Estimation Methodology (Grade Interpolation)
Grade interpolation for both Au and Ag was executed as a series of three passes, each of which were performed via the ID3 method. Given the short major axis ranges and high nugget values determined during the variogram analysis, the ID method was deemed to be the most appropriate method of grade interpolation. A power of three was selected for this reason also, as greater influence is given to grades more proximal to the block than they would otherwise be given if a power of two had been used. Kriging was not used as the primary method of interpolation due to concerns regarding potential over-smoothing of grades.
| Mineral Resource Estimates | 96 | Page |
NI 43-101 Technical Report | December 22, 2020 |
Block grades were interpolated from drill-hole and underground samples. A minimum of two and a maximum of six composites were allowed for interpolation to each block. In estimating block grades, it was required that the block zone code be the same as the composite zone code for interpolation to occur.
| 14.4.3.1 | Guanajuato |
The interpolation strategy involved three successive passes, whereby greater search envelopes were employed in each consecutive pass, overwriting blocks estimated in the previous pass. The first pass was performed at half of the variogram range. For second pass, total range was used and for the third pass, four times the range was applied for each vein.
| 14.4.3.2 | San Ignacio |
The interpolation involved three successive passes, whereby greater search envelopes were employed in each consecutive pass, overwriting blocks estimated in the previous pass. The first pass was performed at half of the variogram range. For second pass, the full range was used and for the third pass four times the range was applied for each vein.
14.4.4 Core Recovery and RQD
| 14.4.4.1 | Guanajuato |
Core recovery characteristics and RQD analysed for all drill core samples obtained from within each of the mineralized zones for Guanajuato is presented in Table 14.16. For drill core, a total of 63,450 recovery and RQD measurements were returned from the Microsoft SQL database. Of these, only 1,008 were found to be within the mineralized zones, as such only these have been presented in Table 14.16, with a 64% RQD and 95% recovery. In the authors’ opinion, the overall drill core recovery is excellent and has no negative bearing on the Mineral Resource estimates.
Table 14.16: Recovery and RQD by area, Guanajuato
| Vein/Zone | No. of Measurements | Avg RQD % | Avg Rec. % |
| Cata | 177 | 56 | 93 |
| Los Pozos | 237 | 66 | 94 |
| Santa Margarita | 147 | 75 | 99 |
| Guanajuatito | 138 | 56 | 94 |
| San Cayetano | 94 | 66 | 94 |
| Valenciana | 148 | 66 | 95 |
| Promontorio | 67 | 60 | 91 |
| Total | 1,008 | 64 | 95 |
| 14.4.4.2 | San Ignacio |
Core recovery characteristics and RQD analysed for all drill core samples obtained from within each of the mineralized zones for San Ignacio is presented in Table 14.17. From 35,767 recovery and RQD measurements, 694 samples were located within San Ignacio mineralized zones showing a 51% RQD and 92% recovery.
| Mineral Resource Estimates | 97 | Page |
NI 43-101 Technical Report | December 22, 2020 |
Table 14.17: Recovery and RQD by area, San Ignacio
| Vein | No. of Measurements | Avg. RQD % | Avg. Rec. % |
| Melladito | 182 | 66 | 96 |
| Melladito BO | 33 | 68 | 98 |
| Melladito South | 63 | 42 | 85 |
| Purisima | 61 | 18 | 75 |
| Purisima Bo | 44 | 45 | 91 |
| Purisima HW | 21 | 17 | 79 |
| Purisima Int | 7 | 48 | 96 |
| 700 | |||
| Santo Nino | 13 | 56 | 89 |
| Intermediate | 61 | 66 | 97 |
| Intermediate 2 | 48 | 63 | 97 |
| Nombre De Dios | 46 | 69 | 97 |
| Nombre De Dios 1.5 | 53 | 56 | 91 |
| Nombre De Dios 2N | 26 | 54 | 96 |
| Nombre De Dios 2S | 33 | 50 | 94 |
| Nombre De Dios 3 | 3 | 49 | 96 |
| Total | 694 | 51 | 92 |
14.4.5 Density
SG determinations for drill core are carried out on site on whole NQ or HQ core using the water submersion method. Samples with a minimum weight of 500g are selected at a minimum frequency of three per mineralized zone plus additional hanging wall and footwall samples. Samples are then air dried and subsequently weighed in air with the measurement recorded on a standard form. The samples are then suspended in a basket which is submersed in water and the suspended mass in water is recorded. The raw information is entered into an Excel spreadsheet and the SG calculated via the formula,
SG = Mass in Air (Dry) / (Mass in Air (Dry) – Mass Suspended (in Water))
| 14.4.5.1 | Guanajuato |
The number of SG determinations available in the SQL database totalled 11,582, with 570 of these SG samples contained within the mineralization wireframes. Following exclusion of outliers, an average SG determination of 2.68t/m³ was calculated and was used across all seven areas (34 zones) for resource estimation purposes.
It is the authors’ opinion that the SG determination method used at Guanajuato is industry-standard, and that the results are representative of the material in the mine. Table 14.18 summarizes the bulk density sample results grouped by area within Guanajuato.
Table 14.18: Bulk density grouped by area, Guanajauato
| Domain | SG Reading |
| Cata | 2.66 |
| Los Pozos | 2.66 |
| Santa Margarita | 2.62 |
| Guanajuatito | 2.75 |
| San Cayetano | 2.75 |
| Valenciana | 2.67 |
| Promontorio | 2.71 |
| Average SG | 2.68 |
| Mineral Resource Estimates | 98 | Page |
NI 43-101 Technical Report | December 22, 2020 |
| 14.4.5.2 | San Ignacio |
A total of 11,614 samples were collected for bulk density determination from 394 diamond drill holes. The overall mean value of the 919 samples within the domains representing the veins was 2.64 g/cm³, and this global mean value was assigned to the block model for calculation of tonnage above a grade cut-off. Table 14.19 summarizes the bulk density sample results for each domain of San Ignacio.
Table 14.19: Bulk density grouped by vein, San Ignacio
| Vein | SG Reading |
| Melladito | 2.63 |
| Melladito BO | 2.66 |
| Melladito South | 2.63 |
| Purisima | 2.62 |
| Purisima Bo | 2.66 |
| Purisima HW | 2.64 |
| Purisima Int | 2.63 |
| 700 | 2.6 |
| Santo Nino | 2.61 |
| Intermediate | 2.65 |
| Intermediate 2 | 2.66 |
| Nombre De Dios | 2.63 |
| Nombre De Dios 1.5 | 2.64 |
| Nombre De Dios 2N | 2.66 |
| Nombre De Dios 2S | 2.63 |
| Nombre De Dios 3 | 2.67 |
| Average SG | 2.64 |
| 14.5 | Mineral Resource Classification |
The Mineral Resource estimates were classified as Measured, Indicated, and Inferred in accordance with the CIMDS.
The approach to classification was to consider the distance of any block to development or stoping. Measured blocks were required to be situated adjacent to and within 15 meters of underground workings. To be classified as Indicated, blocks were required to be within 15 to 30 meters from underground workings. All other blocks not classified as either Measured or Indicated and residing at least partially within a wireframe, or within a wireframe with exclusively drill hole intersections, were classified as Inferred. Additionally, areas where geological confidence was lower than that reflected in the empirically derived classification received a reduced classification. If Mineral Resources are developed in areas with historical mine workings, such as in the Purisima / Melladito South area of San Ignacio, or the Los Pozos / Promontorio area of Guanajuato they are classified only as Inferred, until such work can be done to establish the full extent of historical mining.
| 14.6 | Block Model Validation |
Validation of the interpolation techniques and resulting block model were completed via the visual inspection of the block grades in comparison to surrounding data values and comparison of blocks and sample means.
14.6.1 Visual Inspection
The block grades were validated by visual inspection of the block grades on long section and comparison with the composited assays for all domains. The block grades were observed to honour the composited grades reasonably well.
| Mineral Resource Estimates | 99 | Page |
NI 43-101 Technical Report | December 22, 2020 |
14.6.2 Comparison to Means
| 14.6.2.1 | Guanajuato |
Block grade estimates for all resources were compared with drill-hole and underground channel capped sample assay grades. On a global basis, the block grade estimates should be smaller since search parameters have smoothed areas with several very high-grade samples which were clustered.
Comparing block model grades to sample grades indicates both positive and negative variability as shown on Table 14.20 and Table 14.21.
Table 14.20: Comparison of block and all DDH samples, Guanajuato
| Vein/Zone | Ag g/t | Au g/t | ||||
| Blocks | DDH | Diff | Blocks | DDH | Diff | |
| Cata | 134 | 214 | 37% | 0.58 | 1.06 | 45% |
| Los Pozos | 86 | 163 | 47% | 0.55 | 0.96 | 43% |
| Santa Margarita | 37 | 48 | 23% | 1.76 | 3.11 | 43% |
| Guanajuatito | 76 | 81 | 6% | 0.40 | 0.46 | 13% |
| San Cayetano | 36 | 27 | -33% | 0.57 | 0.66 | 14% |
| Valenciana | 70 | 80 | 13% | 0.78 | 0.87 | 10% |
| Promontorio | 46 | 132 | 65% | 0.72 | 1.56 | 54% |
| Total | 69 | 106 | 35% | 0.77 | 1.24 | 38% |
Table 14.21: Comparison of block and all U/G samples, Guanajuato
| Vein/Zone | Ag g/t | Au g/t | ||||
| Blocks | UG | Diff | Blocks | UG | Diff | |
| Cata | 134 | 151 | 11% | 0.58 | 0.64 | 9% |
| Los Pozos | 86 | 156 | 43% | 0.55 | 0.85 | 35% |
| Santa Margarita | 37 | 33 | -12% | 1.76 | 2.71 | 35% |
| Guanajuatito | 76 | 153 | 50% | 0.40 | 0.64 | 38% |
| San Cayetano | 36 | 57 | 37% | 0.57 | 1.21 | 53% |
| Valenciana | 70 | 82 | 15% | 0.78 | 0.82 | 5% |
| Promontorio | 46 | 64 | 28% | 0.72 | 0.70 | -3% |
| Total | 69 | 99 | 30% | 0.77 | 1.08 | 29% |
| 14.6.2.2 | San Ignacio |
Block grade estimates for all resources were compared with drill-hole and underground channel sample grades. Generally, it is considered more appropriate to compare drill and not channel samples with model grades given that drill-holes are generally far more evenly distributed across the zones. As such, the effects of extreme spatial clustering (as seen with channel sampling) are less likely to affect the relevance of the comparison. Table 14.22 and Table 14.23 summarize the comparison of the estimated grade (produced by the block model) vs the sample grade for drill hole and underground samples, respectively.
Table 14.22: Comparing block grade vs DDH samples, San Ignacio
| Vein | Ag g/t | Au g/t | ||||
| Blocks | DDH | Diff | Blocks | DDH | Diff | |
| Melladito | 74 | 95 | 22% | 2.06 | 2.48 | 17% |
| Melladito BO | 75 | 55 | -36% | 2.66 | 2.47 | -8% |
| Melladito South | 73 | 99 | 26% | 2.05 | 2.66 | 23% |
| Purisima | 123 | 149 | 17% | 0.86 | 1.25 | 31% |
| Purisima BO | 74 | 112 | 34% | 1.95 | 2.49 | 22% |
| Purisima HW | 264 | 228 | -16% | 1.65 | 1.75 | 6% |
| Purisima Int | 180 | 169 | -7% | 2.06 | 2.23 | 8% |
| 700 | 161 | 167 | 4% | 3.39 | 3.83 | 11% |
| Santo Nino | 52 | 49 | -6% | 0.43 | 0.66 | 35% |
| Intermediate | 123 | 129 | 5% | 2.21 | 2.19 | -1% |
| Intermediate2 | 167 | 154 | -8% | 2.62 | 2.36 | -11% |
| Nombre De Dios | 89 | 93 | 4% | 1.26 | 2.49 | 49% |
| Nombre De Dios 1.5 | 88 | 101 | 13% | 1.17 | 1.13 | -4% |
| Nombre De Dios 2N | 101 | 123 | 18% | 1.22 | 1.81 | 33% |
| Nombre De Dios 2S | 141 | 117 | -21% | 1.86 | 2.13 | 13% |
| Nombre De Dios 3 | 141 | 161 | 12% | 1.29 | 1.73 | 25% |
| Total | 120 | 125 | 4% | 1.80 | 2.10 | 15% |
| Mineral Resource Estimates | 100 | Page |
NI 43-101 Technical Report | December 22, 2020 |
Table 14.23: Comparing block grade vs U/G samples, San Ignacio
| Vein | Ag g/t | Au g/t | ||||
| Blocks | UG | Diff | Blocks | UG | Diff | |
| Melladito | 74 | 111 | 33% | 2.06 | 2.84 | 27% |
| Melladito BO | 75 | 71 | -6% | 2.66 | 2.66 | 0% |
| Melladito South | 73 | 33 | -121% | 2.05 | 1.22 | -68% |
| Purisima | 123 | - | - | 0.86 | - | - |
| Purisima BO | 74 | 88 | 16% | 1.95 | 2.55 | 24% |
| Purisima HW | 264 | - | - | 1.65 | - | - |
| Purisima Int | 180 | - | - | 2.06 | - | - |
| 700 | 161 | 47 | -243% | 3.39 | 1.26 | -169% |
| Santo Nino | 52 | - | - | 0.43 | - | - |
| Intermediate | 123 | 172 | 28% | 2.21 | 2.97 | 26% |
| Intermediate2 | 167 | 243 | 31% | 2.62 | 4.08 | 36% |
| Nombre De Dios | 89 | 131 | 32% | 1.26 | 2.02 | 38% |
| Nombre De Dios 1.5 | 88 | 118 | 25% | 1.17 | 1.85 | 37% |
| Nombre De Dios 2N | 101 | 146 | 31% | 1.22 | 2.13 | 43% |
| Nombre De Dios 2S | 141 | 213 | 34% | 1.86 | 3.08 | 40% |
| Nombre De Dios 3 | 141 | 252 | 44% | 1.29 | 1.68 | 23% |
| Total | 120 | 135 | 11% | 1.80 | 2.36 | 24% |
| 14.7 | Cut-Off Grade |
The full operational cost cut-off value as calculated by the mine operating staff ranges from US$89 to US$125/tonne for different areas based on mine operating costs (mining, milling, G&A). Block model silver and gold grades have been converted to an US$ NSR value using an NSR “calculator” which takes into effect metal prices (long term projected to be US$17.64/oz silver and US$1,694/oz gold), mill metal recoveries (85.5% for silver and 83.9% for gold), concentrate shipping charges, and proprietary smelter terms. Blocks with an NSR value equal to or greater than the operations full cut-off costs were tabulated into the Mineral Resource Estimate for each zone.
The cut-off value was applied to each block estimated in the resource block model. If the weighted average grade of all the mineral blocks in a mining volume is above cut-off, it will be considered for mining. This TR provides a Mineral Resource estimate for reporting purposes only and it is up to the mine planning department staff to consider and determine what can be mined.
Table 14.24 below lists the full operational (mining, milling, and administration) cost cut-off value applied to each mining area for the current Mineral Resource estimate.
Table 14.24: GMC Full operating cost cut-off by area
| 2020 | Cata | Santa Margarita | Los Pozos | Guanajuatito | Valenciana | Promontorio | San Ignacio |
| Mine Cost | $84 | $84 | $58 | $69 | $71 | $94 | $69 |
| Plant cost | $14 | $14 | $14 | $14 | $14 | $14 | $14 |
| Admin cost | $17 | $17 | $17 | $17 | $17 | $17 | $17 |
| Total US$ | $115 | $115 | $89 | $100 | $102 | $125 | $100 |
| Mineral Resource Estimates | 101 | Page |
NI 43-101 Technical Report | December 22, 2020 |
| 14.8 | Statement of Mineral Resources |
GMC contains estimated Measured and Indicated Mineral Resources of 821,851 tonnes above varying US$ NSR full operational cost cut-offs, at an average grade of 199g/t silver and 2.07g/t gold, for a total of 10,171,912 Ag eq oz or 113,021 Au eq oz. This includes Measured Mineral Resources of 600,941 tonnes at an average grade of 195g/t silver and 2.16g/t gold, for a total of 7,520,049 Ag eq oz or 83,556 Au eq oz and Indicated Mineral Resources of 220,910 tonnes at an average grade of 209g/t silver and 1.83g/t gold, for a total of 2,651,863 Ag eq oz or 29,465 Au eq oz. In addition, estimated Inferred Mineral Resources are 1,453,008 tonnes at an average grade of 185g/t silver and 2.25g/t gold, for 18,109,823 Ag eq oz or 201,220 Au eq oz.
The GMC updated mineral resource estimate, constituted by the San Ignacio and Guanajuato operations, updates former mineral resource estimates with effective dates of July 31, 2019, and October 31, 2019, respectively. This Mineral Resource Estimate for GMC has an effective date of July 31, 2020 and updates the previous resource estimate for reasons of depletion because of mining and resource definition resulting from successful exploration activities. Highlights of the GMC mineral resource estimate are given in Table 14.25.
Table 14.25: GMC Mineral Resource Estimate, Highlights
| Classification | Tonnes | Ag (g/t) | Ag (oz) | Au (g/t) | Au (oz) | Ag eq (g/t) | Ag eq (oz) | Au eq (g/t) | Au eq (oz) |
| Total Measured | 600,941 | 195 | 3,763,303 | 2.16 | 41,741 | 389 | 7,520,049 | 4.32 | 83,556 |
| Total Indicated | 220,910 | 209 | 1,483,209 | 1.83 | 12,951 | 373 | 2,651,863 | 4.15 | 29,465 |
| Total M&I | 821,851 | 199 | 5,246,512 | 2.07 | 54,693 | 385 | 10,171,912 | 4.28 | 113,021 |
| Total Inferred | 1,453,008 | 185 | 8,664,244 | 2.25 | 105,219 | 388 | 18,109,823 | 4.31 | 201,220 |
Note: See details in Notes section for Guanajuato and San Ignacio in Table 14.27 and Table 14.29.
14.8.1 Guanajuato
Guanajuato contains estimated Measured and Indicated Mineral Resources of 433,953 tonnes above varying US$ NSR full operational cost cut-offs, at an average grade of 249g/t silver and 1.64g/t gold, for a total of 5,529,111 Ag eq oz or 61,435 Au eq oz. This includes Measured Mineral Resources of 286,139 tonnes at an average grade of 253g/t silver and 1.63g/t gold, for a total of 3,677,663 Ag eq oz or 40,863 Au eq oz and Indicated Mineral Resources of 147,814 tonnes at an average grade of 241g/t silver and 1.65g/t gold, for a total of 1,851,448 Ag eq oz or 20,572 Au eq oz. In addition, estimated Inferred Mineral Resources are 460,174 tonnes at an average grade of 220g/t silver and 2.07g/t gold, for 6,020,031 Ag eq oz or 66,889 Au eq oz.
The Mineral Resources detailed at Guanajuato cover the Guanajuatito, Valenciana, Cata, Los Pozos, Santa Margarita, San Cayetano, and Promontorio areas. This Mineral Resource Estimate for Guanajuato has an effective date of July 31, 2020 and updates the previous Mineral Resource estimate for reasons of depletion because of mining and resource definition resulting from successful exploration activities.
Table 14.26 provides a highlights summary, and Table 14.27provides a detailed summary, of the Mineral Resource estimates as of July 31, 2020. Measured, Indicated, and Inferred Mineral Resources are reported at the full-cost operational mining cut-off value which varies between mining areas in US$ per tonne.
It is the opinion of the Qualified Persons of this report that all data used in the generation of the Mineral Resource models and the processes by which these data were collected and stored are acceptable and of industry standard.
| Mineral Resource Estimates | 102 | Page |
NI 43-101 Technical Report | December 22, 2020 |
Table 14.26: Mineral Resources Estimate as of July 31, 2020, Guanajuato (Highlights)
| Classification | Tonnes | Ag (g/t) | Ag (oz) | Au (g/t) | Au (oz) | Ag eq (g/t) | Ag eq (oz) | Au eq (g/t) | Au eq (oz) |
| Totals Measured | 286,139 | 253 | 2,328,051 | 1.63 | 14,995 | 400 | 3,677,663 | 4.44 | 40,863 |
| Totals Indicated | 147,814 | 241 | 1,144,963 | 1.65 | 7,816 | 390 | 1,851,448 | 4.33 | 20,572 |
| Total M&I | 433,953 | 249 | 3,473,014 | 1.64 | 22,811 | 396 | 5,529,111 | 4.40 | 61,435 |
| Totals Inferred | 460,174 | 220 | 3,258,101 | 2.07 | 30,689 | 407 | 6,020,031 | 4.52 | 66,889 |
Note: See details in Notes section for Guanajuato in Table 14.27.
Table 14.27: Mineral Resources Estimate as of July 31, 2020, Guanajuato
| Vein | Tonnes | Ag (g/t) | Ag (oz) | Au (g/t) | Au (oz) | Ag eq (g/t) | Ag eq (oz) |
| Measured | |||||||
| Cata | 27,997 | 400 | 359,932 | 1.88 | 1,691 | 569 | 512,120 |
| Pozos | 170,726 | 245 | 1,345,405 | 1.44 | 7,929 | 375 | 2,058,994 |
| Guanajuatito | 36,499 | 288 | 338,122 | 1.32 | 1,543 | 406 | 477,017 |
| Santa Margarita | 5,746 | 186 | 34,274 | 3.08 | 569 | 463 | 85,445 |
| Valenciana | 18,704 | 177 | 106,674 | 2.03 | 1,222 | 360 | 216,637 |
| San Cayetano | 10,094 | 121 | 39,360 | 2.79 | 907 | 373 | 120,965 |
| Promontorio | 16,372 | 198 | 104,285 | 2.16 | 1,136 | 392 | 206,485 |
| Total Measured | 286,139 | 253 | 2,328,051 | 1.63 | 14,995 | 400 | 3,677,663 |
| Indicated | |||||||
| Cata | 1,307 | 311 | 13,065 | 1.18 | 49 | 417 | 17,513 |
| Pozos | 97,995 | 247 | 777,219 | 1.57 | 4,940 | 388 | 1,221,817 |
| Guanajuatito | 12,064 | 236 | 91,540 | 1.22 | 474 | 346 | 134,187 |
| Santa Margarita | 1,844 | 245 | 14,534 | 2.02 | 86 | 427 | 25,327 |
| Valenciana | 11,587 | 198 | 73,763 | 1.80 | 669 | 360 | 133,995 |
| San Cayetano | 2,310 | 90 | 6,653 | 2.36 | 175 | 302 | 22,447 |
| Promontorio | 20,707 | 253 | 168,189 | 2.14 | 1,422 | 445 | 296,162 |
| Total Indicated | 147,814 | 241 | 1,144,963 | 1.65 | 7,816 | 390 | 1,851,448 |
| Measure & Indicated | |||||||
| Cata | 29,304 | 396 | 372,997 | 1.85 | 1,740 | 562 | 529,634 |
| Pozos | 268,721 | 246 | 2,122,624 | 1.49 | 12,869 | 380 | 3,280,811 |
| Guanajuatito | 48,563 | 275 | 429,662 | 1.29 | 2,017 | 391 | 611,204 |
| Santa Margarita | 7,590 | 200 | 48,808 | 2.82 | 655 | 454 | 110,772 |
| Valenciana | 30,292 | 185 | 180,437 | 1.94 | 1,891 | 360 | 350,632 |
| San Cayetano | 12,404 | 115 | 46,013 | 2.71 | 1,082 | 360 | 143,412 |
| Promontorio | 37,079 | 229 | 272,474 | 2.15 | 2,557 | 422 | 502,647 |
| Total M&I | 433,953 | 249 | 3,473,014 | 1.64 | 22,811 | 396 | 5,529,111 |
| Inferred | |||||||
| Cata | - | - | - | - | - | - | - |
| Pozos | 194,226 | 270 | 1,687,025 | 1.58 | 9,845 | 412 | 2,573,101 |
| Guanajuatito | 9,666 | 215 | 66,840 | 0.98 | 305 | 303 | 94,306 |
| Santa Margarita | 9,891 | 368 | 116,989 | 1.81 | 575 | 531 | 168,730 |
| Valenciana | 186,121 | 185 | 1,108,704 | 2.48 | 14,841 | 408 | 2,444,315 |
| San Cayetano | 3,802 | 58 | 7,046 | 3.79 | 463 | 398 | 48,682 |
| Promontorio | 56,468 | 150 | 271,497 | 2.57 | 4,660 | 381 | 690,898 |
| Total Inferred | 460,174 | 220 | 3,258,101 | 2.07 | 30,689 | 407 | 6,020,031 |
Notes:
| 1. | Mineral Resources are estimated using cut-offs based on the full operating costs per mining area being US$115/tonne for Cata, US$115/tonne for Santa Margarita / San Cayetano, US$89/tonne for Los Pozos, US$100/tonne for Guanajuatito, US$125/tonne for Promontorio, and US$102/tonne for Valenciana. |
| Mineral Resource Estimates | 103 | Page |
NI 43-101 Technical Report | December 22, 2020 |
| 2. | Block model grades converted to US$ value using plant recoveries of 85.5% Ag, 83.9% Au, and net smelter terms negotiated for concentrates. |
| 3. | A vein bulk density for all veins of 2.64t/m³ was used in the estimates. |
| 4. | Totals may not agree due to rounding. |
| 5. | Grades have been estimated in metric units and contained silver and gold estimated in troy ounces. |
| 6. | Ag eq oz were calculated using 90:1 Ag:Au ratio. The ratios are reflective of average metal prices for 2020. |
| 7. | A minimum true width of 0.5m was used in the estimates. |
| 8. | Estimates use metal prices of US$17.64/oz silver, and US$1,694/oz gold (CIBC 2021 forecast). |
| 9. | Estimates have an effective date of July 31, 2020. |
| 10. | Inferred Mineral Resources have a great amount of uncertainty as to their existence and as to whether they can be mined legally or economically. It cannot be assumed that all or part of the Inferred Mineral Resources will ever be upgraded to a higher category. |
| 11. | Mineral Resources that are not Mineral Reserves have no demonstrated economic viability. |
14.8.2 San Ignacio
San Ignacio contains estimated Measured and Indicated Mineral Resources of 387,898 tonnes above a US$100/tonne NSR cut-off, at an average grade of 142g/t silver and 2.56/t gold, for a total of 4,642,801 Ag eq oz. This includes Measured Mineral Resources of 314,802 tonnes at an average grade of 142g/t silver and 2.64g/t gold, for a total of 3,842,38 Ag eq oz and Indicated Mineral Resources of 387,898 tonnes at an average grade of 144g/t silver and 2.19g/t gold, for a total of 800,416 Ag eq oz. In addition, estimated Inferred Mineral Resources are 992,835 tonnes at an average grade of 169g/t silver and 2.33g/t gold, for 12,089,792 Ag eq oz. The Mineral Resource Estimates highlights is presented as Table 14.28, while grouped by domain is presented in Table 14.29.
It is the opinion of the Qualified Persons of this report that all data used in the generation of the Mineral Resource models and the processes by which these data were collected and stored are acceptable and of industry standard.
Table 14.28: Mineral Resource Estimate 2020, San Ignacio (Highlights)
| Classification | Tonnes | Ag (g/t) | Ag (oz) | Au (g/t) | Au (oz) | Ag eq (g/t) | Ag eq (oz) | Au eq (g/t) | Au eq (oz) |
| Total Measured | 314,802 | 142 | 1,435,252 | 2.64 | 26,746 | 384 | 3,842,386 | 4.27 | 42,693 |
| Total Indicated | 73,096 | 144 | 338,246 | 2.19 | 5,135 | 349 | 800,416 | 3.87 | 8,894 |
| Total M&I | 387,898 | 142 | 1,773,498 | 2.56 | 31,881 | 377 | 4,642,801 | 4.19 | 51,587 |
| Total Inferred | 992,835 | 169 | 5,406,142 | 2.33 | 74,530 | 384 | 12,089,792 | 4.27 | 134,331 |
Notes: See details in Notes section for San Ignacio in Table 14.29.
Table 14.29: Mineral Resource Estimate 2020, San Ignacio
| Domain | Tonnes | Ag (g/t) | Ag (oz) | Au (g/t) | Au (oz) | Ag eq (g/t) | Ag eq (oz) |
| MEASURED | |||||||
| Melladito South | - | - | - | - | - | - | - |
| Purisima BO | - | - | - | - | - | - | - |
| Purisima | - | - | - | - | - | - | - |
| Purisima HW | - | - | - | - | - | - | - |
| Purisima Int | - | - | - | - | - | - | - |
| 700 | - | - | - | - | - | - | - |
| Santo Nino | - | - | - | - | - | - | - |
| ND2N | 42,347 | 159 | 217,012 | 2.06 | 2,809 | 345 | 469,837 |
| ND1.5 | 21,723 | 170 | 118,946 | 1.98 | 1,383 | 349 | 243,397 |
| ND2S | 35,192 | 197 | 222,435 | 2.66 | 3,004 | 436 | 492,807 |
| ND | 33,721 | 148 | 159,988 | 2.51 | 2,719 | 373 | 404,726 |
| ND3 | 5,157 | 249 | 41,229 | 1.76 | 292 | 407 | 67,498 |
| Melladito | 57,597 | 86 | 159,167 | 2.76 | 5,115 | 335 | 619,534 |
| Melladito BO | 40,480 | 99 | 128,470 | 3.39 | 4,418 | 404 | 526,111 |
| Intermediate | 58,800 | 144 | 272,748 | 2.84 | 5,370 | 400 | 756,089 |
| Intermediate 2 | 19,787 | 181 | 115,257 | 2.57 | 1,635 | 412 | 262,387 |
| Mineral Resource Estimates | 104 | Page |
NI 43-101 Technical Report | December 22, 2020 |
| Domain | Tonnes | Ag (g/t) | Ag (oz) | Au (g/t) | Au (oz) | Ag eq (g/t) | Ag eq (oz) |
| Total Measured | 314,802 | 142 | 1,435,252 | 2.64 | 26,746 | 384 | 3,842,386 |
| INDICATED | |||||||
| Melladito South | - | - | - | - | - | - | - |
| Purisima BO | - | - | - | - | - | - | - |
| Purisima | - | - | - | - | - | - | - |
| Purisima HW | - | - | - | - | - | - | - |
| Purisima Int | - | - | - | - | - | - | - |
| 700 | - | - | - | - | - | - | - |
| Santo Nino | - | - | - | - | - | - | - |
| ND2N | 14,093 | 154 | 69,677 | 1.52 | 689 | 291 | 131,718 |
| ND1.5 | 2,369 | 163 | 12,392 | 1.55 | 118 | 302 | 23,004 |
| ND2S | 10,022 | 177 | 56,975 | 2.02 | 650 | 358 | 115,483 |
| ND | 6,077 | 120 | 23,421 | 2.07 | 405 | 306 | 59,833 |
| ND3 | 3,612 | 247 | 28,636 | 1.85 | 215 | 413 | 48,012 |
| Melladito | 10,831 | 61 | 21,132 | 2.76 | 960 | 309 | 107,502 |
| Melladito BO | 3,164 | 97 | 9,917 | 3.32 | 338 | 396 | 40,331 |
| Intermediate | 14,792 | 137 | 65,152 | 2.29 | 1,087 | 343 | 163,008 |
| Intermediate 2 | 8,136 | 195 | 50,944 | 2.57 | 673 | 426 | 111,524 |
| Total Indicated | 73,096 | 144 | 338,246 | 2.19 | 5,135 | 349 | 800,416 |
| MEASURED & INDICATED | |||||||
| Melladito South | - | - | - | - | - | - | - |
| Purisima BO | - | - | - | - | - | - | - |
| Purisima | - | - | - | - | - | - | - |
| Purisima HW | - | - | - | - | - | - | - |
| Purisima Int | - | - | - | - | - | - | - |
| 700 | - | - | - | - | - | - | - |
| Santo Nino | - | - | - | - | - | - | - |
| ND2N | 56,440 | 159 | 286,689 | 2.06 | 3,499 | 345 | 601,555 |
| ND1.5 | 24,092 | 170 | 131,338 | 1.98 | 1,501 | 349 | 266,401 |
| ND2S | 45,214 | 197 | 279,411 | 2.66 | 3,654 | 436 | 608,290 |
| ND | 39,797 | 148 | 183,409 | 2.51 | 3,124 | 373 | 464,559 |
| ND3 | 8,769 | 249 | 69,864 | 1.76 | 507 | 407 | 115,510 |
| Melladito | 68,428 | 86 | 180,300 | 2.76 | 6,075 | 335 | 727,036 |
| Melladito BO | 43,644 | 99 | 138,387 | 3.39 | 4,756 | 404 | 566,442 |
| Intermediate | 73,591 | 144 | 337,899 | 2.84 | 6,458 | 400 | 919,097 |
| Intermediate 2 | 27,923 | 181 | 166,201 | 2.57 | 2,308 | 412 | 373,911 |
| Total Measured | 387,899 | 429 | 1,773,498 | 7.74 | 31,881 | 1,140 | 4,642,801 |
| INFERRED | |||||||
| Melladito South | 245,249 | 104 | 823,253 | 3.01 | 23,751 | 373 | 2,938,020 |
| Purisima BO | 129,196 | 142 | 588,308 | 3.40 | 14,142 | 448 | 1,861,097 |
| Purisima | 268,408 | 201 | 1,732,735 | 1.50 | 12,904 | 335 | 2,894,050 |
| Purisima HW | 153,262 | 271 | 1,337,261 | 1.88 | 9,257 | 440 | 2,170,408 |
| Purisima Int | 30,688 | 184 | 181,493 | 2.35 | 2,316 | 395 | 389,889 |
| 700 | 4,463 | 193 | 27,709 | 3.90 | 560 | 544 | 78,074 |
| Santo Nino | 36,495 | 127 | 148,577 | 1.56 | 1,831 | 266 | 312,109 |
| ND2N | 37,152 | 194 | 232,038 | 2.31 | 2,765 | 403 | 480,901 |
| ND1.5 | 7,280 | 107 | 25,088 | 2.12 | 497 | 298 | 69,813 |
| ND2S | 16,980 | 163 | 88,729 | 2.56 | 1,395 | 393 | 214,308 |
| ND | 12,206 | 129 | 50,672 | 3.00 | 1,176 | 399 | 156,512 |
| ND3 | 3,359 | 118 | 12,752 | 2.11 | 228 | 308 | 33,273 |
| Melladito | 18,437 | 64 | 37,770 | 2.43 | 1,443 | 283 | 167,597 |
| Melladito BO | 1,155 | 122 | 4,548 | 4.13 | 154 | 494 | 18,363 |
| Intermediate | 8,369 | 135 | 36,351 | 2.43 | 655 | 354 | 95,283 |
| Intermediate 2 | 20,136 | 122 | 78,858 | 2.25 | 1,458 | 325 | 210,096 |
| Total Inferred | 992,835 | 169 | 5,406,142 | 2.33 | 74,530 | 384 | 12,089,792 |
Notes:
| 1. | A vein bulk density of 2.68 tonnes / m³ was used in the estimates. |
| 2. | Measured, Indicated, and Inferred Mineral Resources are reported at a full cost cut-off Net Smelter Return (NSR) of US$100/tonne. |
| 3. | Totals may not agree due to rounding. |
| 4. | Grades have been estimated in metric units; and contained silver and gold estimated in troy ounces. |
| 5. | A minimum mining width of 0.50 meters was used. |
| 6. | Mineral Resources are estimated using metal prices of US$17.64/oz Ag and US$1,694/oz Au (CIBC 2021 forecast); and metallurgical recoveries of 85.3% for Ag, 83.9% for Au. |
| 7. | 2019 Mineral Resource Ag eq oz were calculated using 90:1 Ag:Au ratio. The ratios are reflective of average metal prices for 2020. |
| 8. | Inferred Mineral Resources have a great amount of uncertainty as to their existence and as to whether they can be mined legally or economically. It cannot be assumed that all or part of the Inferred Mineral Resources will ever be upgraded to a higher category. |
| 9. | Mineral Resources that are not Mineral Reserves have no demonstrated economic viability. |
| Mineral Resource Estimates | 105 | Page |
NI 43-101 Technical Report | December 22, 2020 |
| 14.9 | Comparison with Previous Mineral Resource Estimates |
14.9.1 Guanajuato
The previous Mineral Resource estimate which has an effective date of October 31, 2019 is compared to the current Mineral Resource estimate in Table 14.30 below. The Measured Resource classification in the current resource update provides a 6% increase in contained gold and 37% increase in contained silver and a 30% increase in contained silver equivalent ounces in relation to the previous estimate. For Indicated Resource classification, there is a 72% increase in contained gold and 104% increase in contained silver and 18% increase in contained silver equivalent ounces over the previous estimate. For Inferred Resource classification, an increase of 97% in contained gold and increase of 188% in contained silver, and 154% increase in contained Ag eq oz over the previous report. Overall Measured and Indicated Resource tonnes increased 26% with a coincident increase of Ag eq oz of 47% or ~1.78M Ag eq oz.
These changes reflect the use of higher metal prices, minor mine depletion, significant changes (up and down) in total operating costs in several mining areas, and expansion of zones at Los Pozos due to successful exploration drilling.
Table 14.30: Comparison of 2019 to 2020 Mineral Resources, Guanajuato
| Category | Tonnes | Ag (g/t) | Ag (oz) | Au (g/t) | Au (oz) | Ag eq (g/t) | Ag eq (oz) |
| Total Measured 2020 | 286,139 | 253 | 2,328,051 | 1.63 | 14,995 | 400 | 3,677,663 |
| Total Measured 2019 | 256,260 | 206 | 1,693,799 | 1.72 | 14,131 | 343 | 2,824,256 |
| Measured Difference | 12% | 23% | 37% | -5% | 6% | 17% | 30% |
| Total Indicated 2020 | 147,814 | 241 | 1,144,963 | 1.65 | 7,816 | 390 | 1,851,448 |
| Total Indicated 2019 | 87,476 | 199 | 560,673 | 1.62 | 4,553 | 329 | 924,903 |
| Indicated Difference | 69% | 21% | 104% | 2% | 72% | 18% | 100% |
| Total M&I 2020 | 433,953 | 249 | 3,473,014 | 1.64 | 22,811 | 396 | 5,529,111 |
| Total M&I 2019 | 343,736 | 204 | 2,254,472 | 1.69 | 18,684 | 339 | 3,749,160 |
| M&I Difference | 26% | 22% | 54% | -3% | 22% | 17% | 47% |
| Total Inferred 2020 | 460,174 | 220 | 3,258,101 | 2.07 | 30,689 | 407 | 6,020,031 |
| Total Inferred 2019 | 208,609 | 168 | 1,129,416 | 2.32 | 15,561 | 354 | 2,374,341 |
| Inferred Difference | 121% | 31% | 188% | -11% | 97% | 15% | 154% |
| Mineral Resource Estimates | 106 | Page |
NI 43-101 Technical Report | December 22, 2020 |
14.9.2 San Ignacio
The previous Mineral Resource estimate which has an effective date of July 31, 2019 is compared to the current Mineral Resource estimate in Table 14.31 below. The Measured Resource classification in the current Mineral Resource update provides a 14% decrease in contained gold and 9% decrease in contained silver and a 5% decrease in contained silver equivalent ounces in relation to the previous estimate. For Indicated Resource classification, there is a 22% decrease in contained gold and 15% decrease in contained silver and 14% decrease in contained silver equivalent ounces over the previous estimate. For Inferred Resource classification, an increase of 125% in contained silver and increase of 72% in contained gold, and 106% increase in contained silver equivalent ounces over the previous report. These changes reflect the use of higher metal prices, mine depletion, and expansion and addition of zones in the Purisima vein area due to successful exploration drilling.
Table 14.31: Comparison of 2019 to 2020 Mineral Resources, San Ignacio
| Category | Tonnes | Ag (g/t) | Ag (oz) | Au (g/t) | Au (oz) | Ag eq (g/t) | Ag eq (oz) |
| Total Measured 2020 | 314,802 | 142 | 1,435,252 | 2.64 | 26,746 | 384 | 3,842,386 |
| Total Measured 2019 | 314,863 | 156 | 1,574,848 | 3.06 | 30,984 | 405 | 4,053,537 |
| Measured Difference | 0% | -9% | -9% | -14% | -14% | -5% | -5% |
| Total Indicated 2020 | 73,096 | 144 | 338,246 | 2.19 | 5,135 | 349 | 800,416 |
| Total Indicated 2019 | 71,554 | 173 | 398,172 | 2.87 | 6,613 | 419 | 927,201 |
| Indicated Difference | 2% | -17% | -15% | -24% | -22% | -17% | -14% |
| Total M&I 2020 | 387,898 | 142 | 1,773,498 | 2.56 | 31,881 | 377 | 4,642,801 |
| Total M&I 2019 | 386,417 | 159 | 1,973,021 | 3.03 | 37,596 | 408 | 4,980,737 |
| M&I Difference | 0% | -10% | -10% | -16% | -15% | -7% | -7% |
| Total Inferred 2020 | 992,835 | 169 | 5,406,142 | 2.33 | 74,530 | 384 | 12,089,792 |
| Total Inferred 2019 | 501,870 | 149 | 2,405,484 | 2.69 | 43,398 | 369 | 5,877,391 |
| Inferred Difference | 98% | 14% | 125% | -13% | 72% | 4% | 106% |
| 14.10 | Reconciliation |
14.10.1 Guanajuato
No reconciliation was done in this TR as mining was very limited and impractical for comparison.
14.10.2 San Ignacio
A high-level reconciliation review was completed to test the assumptions made in the Mineral Resource estimation against production records. The reconciliation review was completed for the period between the last San Ignacio NI 43-101 report (July 31, 2019) and the effective date of this report (July 31, 2020). Stope outlines from July 31, 2019 were subtracted from corresponding stope outlines of July 31, 2020 and the remaining outlines were “cookie-cuttered” from this report’s block models to derive a total of 160,688 tonnes and corresponding grades of 120g/t Ag and 2.15g/t Au mined. From this total, blocks with less than 250g/t Ag eq value were subtracted, as low-grade material would have been used as stope back-fill and not shipped to the mill. These remaining tonnes and associated grades were diluted 30% and compared to the Company production record for the same time (Table 14.32). From a high-level perspective the block model (diluted and >250g/t Ag eq value) versus milled ore has lower tonnes (115,934t versus 139,583t), and similar silver grade (117g/t versus 116g/t) and gold grade (2.11g/t versus 2.08g/t), respectively.
The authors consider the reconciliation effort and results produced reasonable.
| Mineral Resource Estimates | 107 | Page |
NI 43-101 Technical Report | December 22, 2020 |
Table 14.32: Reconciliation of block model to production, San Ignacio
| Domain | Tonnes | Ag (g/t) | Ag (oz) | Au (g/t) | Au (oz) | Ag eq (g/t) | Ag eq (oz) |
| Melladito South | 1,196 | 42 | 1,605 | 1.14 | 44 | 144 | 5,553 |
| Purisima BO | 5,397 | 89 | 15,375 | 2.24 | 388 | 290 | 50,293 |
| ND2N | 58,548 | 129 | 243,257 | 1.96 | 3,683 | 305 | 574,716 |
| ND2S | 21,180 | 188 | 127,874 | 2.96 | 2,017 | 454 | 309,362 |
| ND | 17,968 | 109 | 62,833 | 1.87 | 1,078 | 277 | 159,846 |
| Melladito | 39,163 | 55 | 69,874 | 2.17 | 2,737 | 251 | 316,195 |
| Intermediate 2 | 17,235 | 178 | 98,424 | 2.13 | 1,179 | 369 | 204,557 |
| Total Mined | 160,688 | 120 | 619,241 | 2.15 | 11,125 | 336 | 1,620,523 |
| Melladito South | 175 | 109 | 615 | 3.52 | 20 | 426 | 2,399 |
| Purisima BO | 2,927 | 120 | 11,305 | 3.08 | 290 | 398 | 37,405 |
| ND2N | 33,676 | 169 | 183,415 | 2.72 | 2,950 | 415 | 448,890 |
| ND2S | 17,499 | 212 | 119,530 | 3.33 | 1,872 | 512 | 288,035 |
| ND | 8,313 | 156 | 41,640 | 2.96 | 790 | 422 | 112,746 |
| Melladito | 14,782 | 71 | 33,664 | 3.62 | 1,720 | 397 | 188,447 |
| Intermediate 2 | 11,810 | 231 | 87,697 | 2.66 | 1,012 | 471 | 178,741 |
| Total >250g/t Ag eq | 89,180 | 167 | 477,866 | 3.02 | 8,653 | 448 | 1,256,662 |
| Adding 30% Dilution | 115,934 | 117 | 2.11 | ||||
| Production | 139,583 | 116 | 2.08 |
| Mineral Resource Estimates | 108 | Page |
NI 43-101 Technical Report | December 22, 2020 |
| 15.0 | Mineral Reserve Estimates |
No Mineral Reserve estimates were completed in this report. Mineral reserves were estimated for Guanajuato (Rennie and Bergen, 2011) in the Cata, Los Pozos, and Santa Margarita zones but they have been depleted. No Mineral Reserves have ever been estimated for San Ignacio. The Company has not established reserves at the Guanajuato Mine Complex due to the following reasons:
| ¢ | Establishment of Measured and Indicated resource estimates only with associated development, sampling, and mining in the mineralized zones |
| ¢ | Geological nature of the deposit type and mineralized zones |
| ¢ | Associated costs of 3rd party Mineral Reserve estimation when the Company is already in production from these zones |
The Company planned to enter production at Guanajuato in 2006, and San Ignacio in 2013. The Company did not base this production decision on any feasibility study of Mineral Reserves demonstrating economic and technical viability of the mine. As a result, there may be increased uncertainty and risks of achieving any particular level of recovery of minerals from the GMC or the costs of such recovery. As the GMC does not have established Mineral Reserves, the Company faces higher risks that anticipated rates of production and production costs will be achieved, each of which risks could have a material adverse impact on the Company’s ability to continue to generate anticipated revenues and cash flows to fund operations from the GMC and ultimately the profitability of the operation.
| Mineral Reserve Estimates | 109 | Page |
NI 43-101 Technical Report | December 22, 2020 |
| 16.0 | Mining Methods |
Production from GMC mines since beginning operations in Mexico is summarized in Table 16.1. The Company initially focused on increasing production throughput however in 2008 the Company focused on increasing grade resulting in a reduction in tonnage produced. San Ignacio production began at the end of November 2013. The increase in production shown in the years 2014 to 2017 in Table 16.1 reflects the increase in production from the San Ignacio. In 2018, production wanes at Guanajuato and is increasingly dominated by San Ignacio, while in 2019 and 2020 production is near solely San Ignacio with Guanajuato placed on a C&M basis (January to July 2019) and since then with limited production.
Table 16.1: GMC production as of July 31, 2020
| Year | Tonnes Mill/Mine GTO | Tonnes Mill/Mine San Ignacio | Tonnes (milled) | Ag (oz) | Au (oz) |
| 2006 | 86,111 | - | 86,111 | 105,480 | 988 |
| 2007 | 203,968 | - | 203,968 | 521,225 | 3,794 |
| 2008 | 155,079 | - | 155,079 | 848,083 | 5,488 |
| 2009 | 138,517 | - | 138,517 | 1,019,751 | 6,748 |
| 2010 | 144,112 | - | 144,112 | 1,019,856 | 6,619 |
| 2011 | 169,213 | - | 169,213 | 959,490 | 7,515 |
| 2012 | 174,022 | - | 174,022 | 1,004,331 | 10,350 |
| 20131 | 220,463 | 1,082 | 221,545 | 1,079,980 | 15,063 |
| 20141 | 213,658 | 54,154 | 267,812 | 1,239,009 | 15,906 |
| 20151 | 180,691 | 129,253 | 309,944 | 1,708,061 | 21,126 |
| 20161 | 136,349 | 183,694 | 320,043 | 1,473,229 | 21,626 |
| 20171 | 131,335 | 185,475 | 316,810 | 1,386,964 | 21,501 |
| 20181 | 88,364 | 212,650 | 301,014 | 1,096,757 | 19,073 |
| 20191 | 7,610 | 179,886 | 187,610 | 590,781 | 11,588 |
| 20201,2, 3 | 15,563 | 65,851 | 82,639 | 291,105 | 3,977 |
| Totals | 994,033 | 1,012,045 | 3,078,439 | 14,344,102 | 171,362 |
Source: Great Panther Annual reports for 2006 to 2020 inclusive
| 1. | 2006-2015 reported figures reflect tonnes milled, 2016-2020 reported figures reflect tonnes mined which has a small discrepancy to tonnes milled. |
| 2. | 2020 details from production records to July 31, 2020 |
| 3. | The operations at the GMC were suspended from April 2, 2020 through June 3, 2020 on account of the directive of the Mexican Federal Government to mitigate the spread of COVID-19. |
From August 1, 2019 to July 31, 2020) the production for Guanajuato was sourced from Los Pozos, and Promontorio areas. The production was achieved with a work force that operated 6 days per week to obtain a total production of 23,175 tonnes, producing on average 111 tonnes per operating day. San Ignacio had a production of 139,583 tonnes in the same period, producing on average 668 tonnes per operating day. The overall total production for the GMC averaged 779 tonnes per operating day (209 operating days) during the period from September 1, 2019 to July 31, 2020.
There are no current estimates of Mineral Reserves for any of the GMC. The Company made decisions to enter production at Guanajuato and San Ignacio without having completed final feasibility studies. Accordingly, the Company did not base its production decisions on any feasibility studies of Mineral Reserves demonstrating economic and technical viability of the GMC. As a result, there may be increased uncertainty and risks of achieving any particular level of recovery of minerals from the GMC or the costs of such recovery. As the GMC does not have established Mineral Reserves, the Company faces higher risks that anticipated rates of production and production costs, such as those provided in this TR, will not be achieved. These risks could have a material adverse impact on the Company’s ability to continue to generate anticipated revenues and cash flows to fund operations from and ultimately achieve or maintain profitable operations at the GMC.
��
| 16.1 | Cut and Fill Mining Method |
Typically, all zones at the GMC are extracted by the Cut & Fill mining method. A brief description of the Cut & Fill mining method is as follows:
| Mining Methods | 110 | Page |
NI 43-101 Technical Report | December 22, 2020 |
An access ramp approximately 3.5 meters (width) by 3.5 metres (height) is located at the bottom of the vein, from which development drifts are advanced along the zone to open headings at the mine blocks. Sub-levels off the access ramp are between 20 and 35 meters apart with attack drifts to the zone averaging from 20 to 40 meters in length.
The mining sequence begins with the development of a crosscut off the access ramp into the mineralized level. A heading is developed up to the economic limit of the predefined block, where exploration definition drilling is completed to define the limits of the block. Subsequently, the zone is excavated along its length (using jack-leg drills) through two headings (180 degrees apart). Depending on the width of the vein, the cut width may be 2.4 meters or 1.8 meters to minimize dilution. Depending on the width of the vein, ground support may be necessary which can include rock bolts and mesh. The back of each cut along the length the zone is composite sampled to provide additional assay confirmation prior to mining the next lift. The cut is then back-filled with waste material utilizing a Scoop-Tram. When the filling is finished, a new cut into the stope block is initiated above the previous cut (breasting), restarting the cycle.
Overall development in ore is completed with either jack-leg drills or a 16ft Jumbo. 3.5 yard and 4.0-yard Scoop-Trams are used for ore handling with either 10-ton or 18-ton trucks used to transport the ore.
The stability of the rock was evaluated in 2010 by Roland Tosney (Consulting Geotechnical Engineer) and who made the following recommendations. Cement resin bolts are required for excavations up to 5 meters in height. For excavation heights greater than 5 metres but less than 9 metres, cable anchor bolts are installed for additional support. Four-meter cable bolts are installed where holes are drilled by the Jumbo. In areas requiring openings greater than 9 metres vertical, permanent columns of rock are left.
16.1.1 Guanajuato
| 16.1.1.1 | Guanajuatito Zone |
Guanajuatito has been producing ore since 2006. Production came predominantly from the 1730, 1700, 1605, and 1540masl elevations (430, 400, 305, and 260 levels) with hanging-wall ramp completed to the 1730 masl elevation (430 level). The ore zones of Guanajuatito are exploited by the Cut and Fill mining method with a ramp to the bottom of the vein being extended at depth. A cross section of the Guanajuatito deposit is shown in Figure 16.1 and a level plan of the block model and wireframe is shown in Figure 16.2.
| 16.1.1.2 | Valenciana Zone |
Exploration development has commenced in the Valenciana zones on the 245, 360 and 460 levels; production restarted in the last two months of 2016. Exploitation is within several footwall zones to the Veta Madre.
Refer to Figure 16.3 and Figure 16.4 below for a cross section and plan map for the Valenciana zone.
| 16.1.1.3 | Cata Zone |
The Cata zone is composed of five separate mineral zones that vary in widths from 2 to less than 1 meter. These zones are extracted by the Cut and Fill mining method. Sub-levels off the access ramp are between 20 and 30 meters apart.
Mining of the Cata Clavo has reached the 550 level where development and stoping are being carried out on the Veta Madre vein. Cata Clavo is a relatively steeply dipping structure that has been identified for mining from the 1550masl elevation (550 level) to the 1665 masl elevation (435 level). The mining area was up to 100 meters long and up to 10 meters wide. The Veta Madre FW, Contact, Veta Madre HW, Alto 1 to Alto 4 zones are located on the hanging wall side of the Veta Madre and the multiple zones are close to each another. In some areas, the combined Veta Madre to Alto 4 generates an overall width exceeding 30 metres. Mining stopped in the Cata zones in late 2018.
A cross section of the Cata Clavo is shown in Figure 16.5 and a level plan of the block model and wireframe is shown in Figure 16.6.
| Mining Methods | 111 | Page |
NI 43-101 Technical Report | December 22, 2020 |
| 16.1.1.4 | Los Pozos Zone |
At the Los Pozos SE zone mining is underway above the 310 level, both on remnant mineralization as well as recovery of old pillars. Mineralization is related to both the Veta Madre and Santa Margarita (hanging wall) structures as well as transverse structures.
The Los Pozos deposits are relatively steeply dipping structures that have been identified for mining from the 2025 masl elevation (75 / 83 levels), 1980 masl (120 level), 1940 masl (160 level), to the 1790 masl elevation (310 level). A cross section of the Los Pozos deposit is shown in Figure 16.7 and a level plan of the block model and wireframe is shown in Figure 16.8.
| 16.1.1.5 | Santa Margarita Zone |
The Santa Margarita gold rich vein has been explored by ramp development from the 390 level to the 500 level. The ramp has been driven from the 1710 masl elevation (390 level) and extended down to the 1560 masl elevation (540 level). Extractions are by cut and fill mining methods. Santa Margarita was in production from March 2009 to late 2018. A cross section of the Santa Margarita deposit is shown in Figure 16.9 and a level plan of the block model and wireframe is shown in Figure 16.10
| 16.1.1.6 | San Cayetano Zone |
Development has commenced on the San Cayetano zone, consisting of drifting along the mineralization on the 475 level, minor raising to ascertain grade continuity, and cross cutting in the hanging-wall to build out several drill stations. Mining from the 520 and 475 levels has been by Cut and Fill. Exploration development and drilling continued along the western extension of the San Cayetano in 2016 and 2017. Exploitation of the San Cayetano structures is completed.
Refer to Figure 16.9 and Figure 16.10 below for a cross section, and a level plan of the block model and wireframe for the San Cayetano zone.
| 16.1.1.7 | Promontorio Zone |
Production restarted from Promontorio in March of 2017 and exploration development continues to define this zone. It is a quartz stockwork system within the hanging-wall conglomerates, immediately above the Veta Madre. Minor production came from the 110 level before C&M commenced at the end of 2018. Presently there is production from the 160 and 275 levels.
Refer to Figure 16.11 and Figure 16.12 below for a cross section, and a level plan of the block model and wireframe for the Promontorio zone.
16.1.2 San Ignacio
The mining at San Ignacio began in the third quarter of 2013. As of July 31, 2020, a total of 1,012,044 tonnes of ore have been produced. The bulk of the mining is on the Nombre de Dios zones, with lesser production from Melladito and Intermediate zones, and initial development in the Melladito South zone.
Workers operate on three 8-hour shifts from Monday to Saturday. Four separate contractors operate the development and production of the mine. The contractors provide supervisors, and the company provides supervisors and a superintendent to over seen the operation. In addition, there is a services team and a security team.
Cut and Fill mining is used to extract material defined by mining blocks. The main ramp (4.5 metres wide by 4.5 metres high) has a slope of 12%. It was developed using a single-arm electric Jumbo, a 6-yard Scoop Tram, and a combination of conventional 20-tonne trucks and an underground truck.
| Mining Methods | 112 | Page |
NI 43-101 Technical Report | December 22, 2020 |
Electricity is supplied to the mine through the Mexican national power grid. The mine utilizes forced air ventilation supported by electric fans, two electric air compressors with 1,000cfm and 100psi and 50 - 60 gallon per minute pumps for extracting mine water.
The mineralized rock is transported by truck to the Cata plant using conventional 20-tonne trucks.
The 450N section (Figure 16.13) shows the distribution of the various veins and the associated development along Veta Melladito, Intermediate, Nombre de Dios and Intermediate 2 veins.
Sections 450N (Figure 16.13), 1000N (Figure 16.14), and 450S (Figure 16.15), and plan views at 2,275 masl (Figure 16.16) and 2,175 masl (Figure 16.17) elevations show the distribution of the various veins and associated development along Melladito, Intermediate, Nombre de Dios, and Purisima veins.
| Mining Methods | 113 | Page |
NI 43-101 Technical Report | December 22, 2020 |
Figure 16.1: Development and Mineral Resource in the Guanajuatito zone, section view 2925N
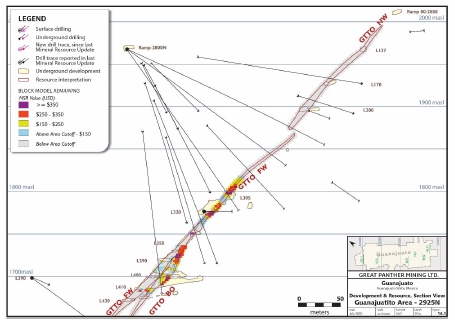
Figure 16.2: Development and Mineral Resource in the Guanajuatito zone, plan view

| Mining Methods | 114 | Page |
NI 43-101 Technical Report | December 22, 2020 |
Figure 16.3: Development and Mineral Resource in the Valenciana zone, section view 2150N
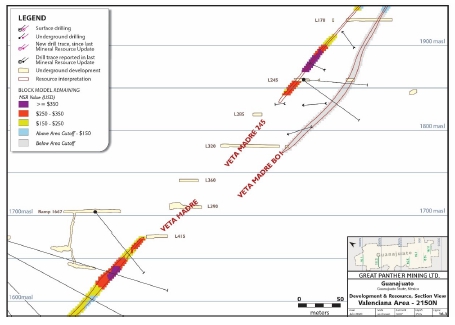
Figure 16.4: Development and Mineral Resource in the Valenciana zone, plan view
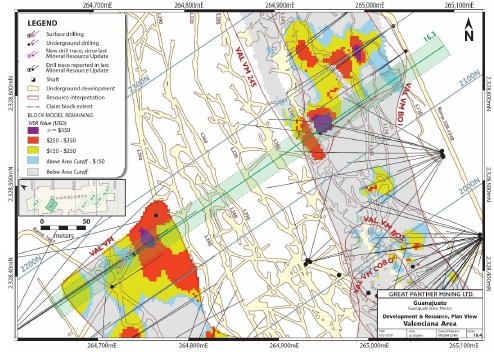
| Mining Methods | 115 | Page |
NI 43-101 Technical Report | December 22, 2020 |
Figure 16.5: Development and Mineral Resource in the Cata zone, section view 600N
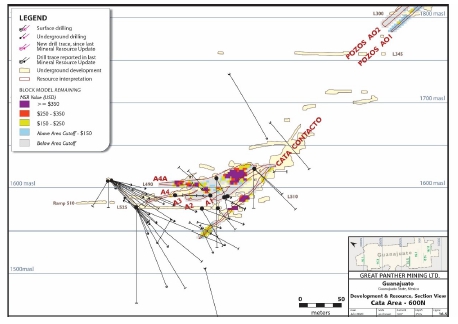
Figure 16.6: Development and Mineral Resource in the Cata zone, plan view
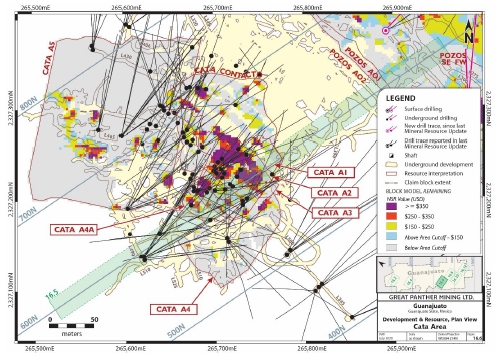
| Mining Methods | 116 | Page |
NI 43-101 Technical Report | December 22, 2020 |
Figure 16.7: Development and Mineral Resource in the Los Pozos zone, section view 175N

Figure 16.8: Development and Mineral Resource in the Los Pozos zone, plan view
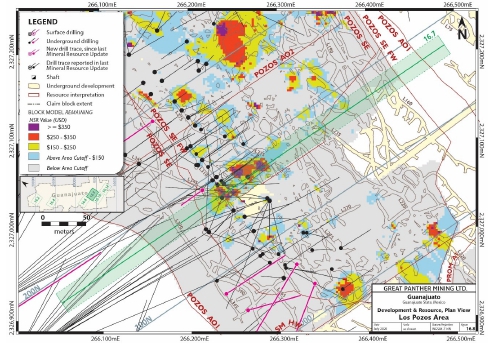
| Mining Methods | 117 | Page |
NI 43-101 Technical Report | December 22, 2020 |
Figure 16.9: Development and Mineral Resource in the Santa Margarita and San Cayetano zones, section view 75S
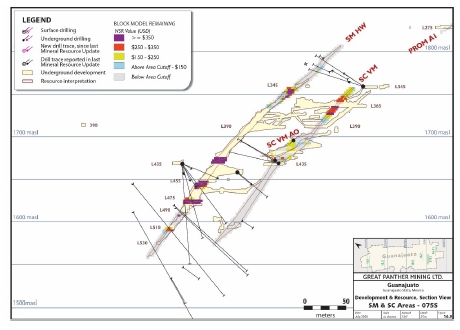
Figure 16.10: Development and Mineral Resource in the Santa Margarita and San Cayetano zones, plan view
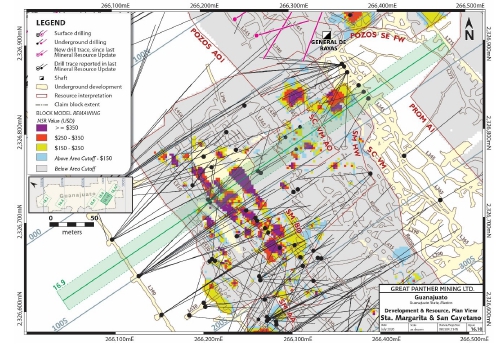
| Mining Methods | 118 | Page |
NI 43-101 Technical Report | December 22, 2020 |
Figure 16.11: Development and Mineral Resource in the Promontorio zone, section view 450S
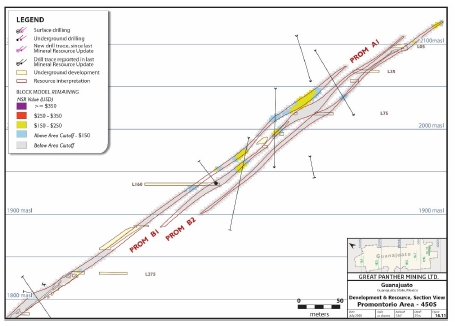
Figure 16.12: Development and Mineral Resource in the Promontorio, plan view
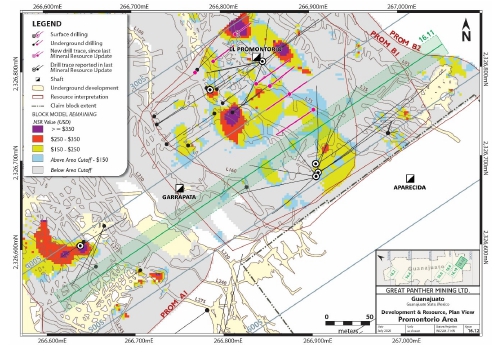
| Mining Methods | 119 | Page |
NI 43-101 Technical Report | December 22, 2020 |
Figure 16.13: Mine development along Melladito, Intermediate & Nombre de Dios structures, cross section 450N
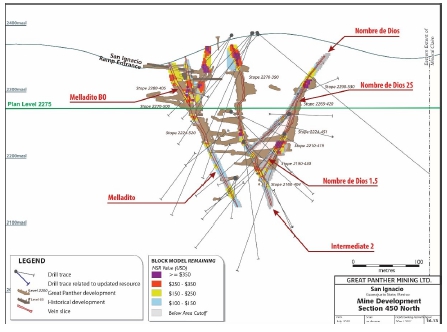
Figure 16.14: Mine development along Nombre de Dios 2N structure, cross section 1000N
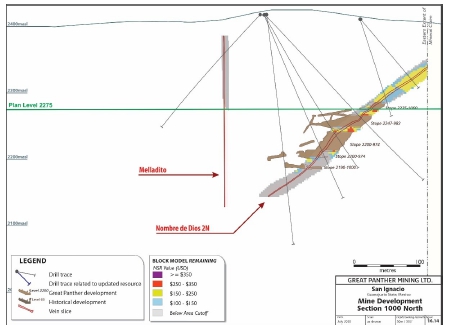
| Mining Methods | 120 | Page |
NI 43-101 Technical Report | December 22, 2020 |
Figure 16.15: Mine development along Purisima & Melladito South structures, cross section 450S
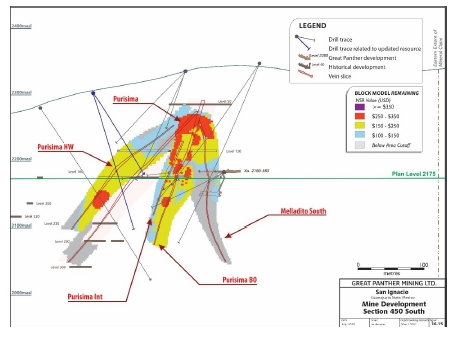
| Mining Methods | 121 | Page |
NI 43-101 Technical Report | December 22, 2020 |
Figure 16.16: Mine development and veins along 2275masl, northern plan view
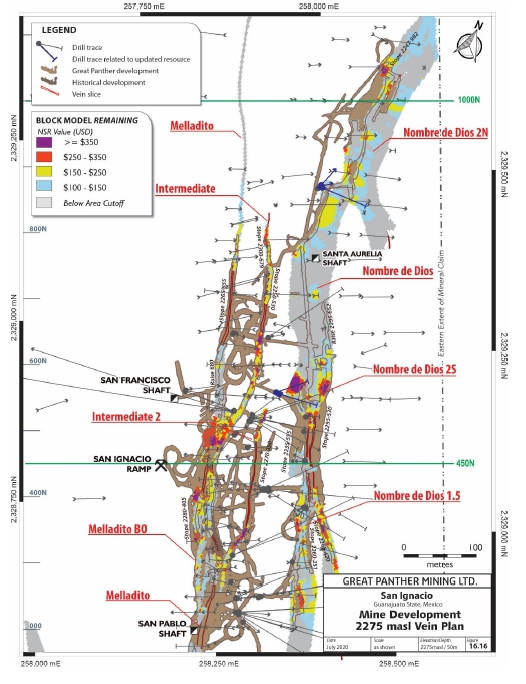
| Mining Methods | 122 | Page |
NI 43-101 Technical Report | December 22, 2020 |
Figure 16.17: Mine development and veins along 2175masl, southern plan view
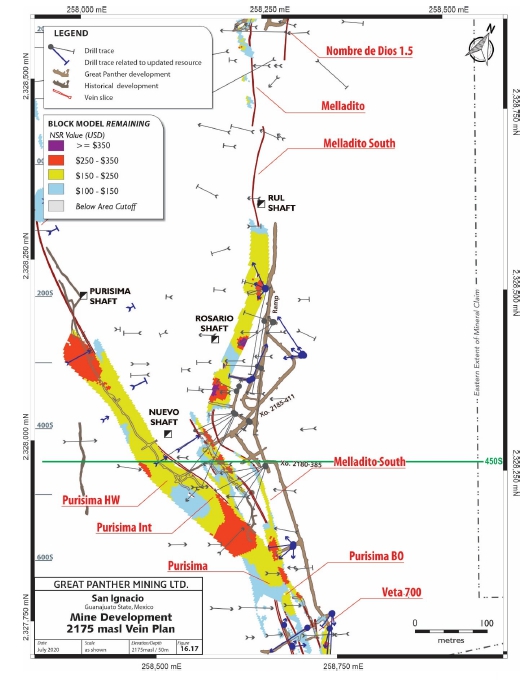
| Mining Methods | 123 | Page |
NI 43-101 Technical Report | December 22, 2020 |
| 17.0 | Recovery Methods |
| 17.1 | Ore Processing Description |
The GMC mineral processing plant processes approximately 779 tonnes per operating day (August 1, 2019 - July 31, 2020) or 447 tonnes per calendar day. The processing plant utilized five stages as follows: crushing, milling, flotation, thickening and filtering and produces a concentrate of iron sulphide (pyrite) with high values of gold and silver which are marketed and sold as the final product (Figure 17.1). Electricity for the processing plant comes from the Guanajuato state electrical grid, water from underground storage facilities at the lowest levels in the Guanajuato operation, and process material from multiple international and Mexican mine equipment and supplies suppliers.
The ore is delivered by truck from GMC’s mines to the ore processing yard at Cata which has a storage capacity of 1,500 tonnes. The material is fed onto a gravity fed grizzly with 12-inch steel grid openings where it falls into a hopper with a capacity of 1,000 tonnes where ore processing begins.
Figure 17.1: Process flow sheet, GMC metallurgical plant
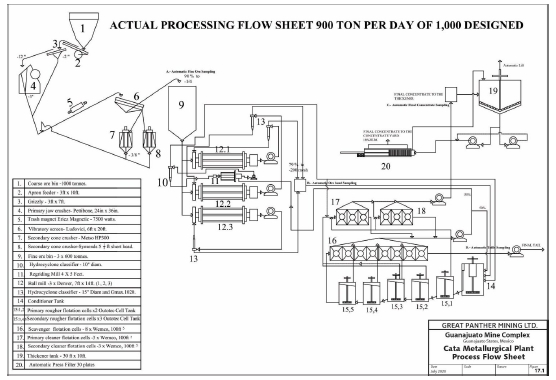
17.1.1 Crushing & Grinding Circuits
The ore from the 1,000-tonne capacity hopper is transferred along a 48-inch-wide belt to a 24 inch by 36-inch PettiBone jaw crusher where the 12-inch feed is reduced to less than 3-inch diameter. The feed from the jaw crusher exits along a 36-inch-wide belt and feeds a 6 ft wide by 20 ft long double bed vibrating Ludowici screen. The Ludowici screen separates the feed by size with the upper bed separating material greater than 1 inch and the lower bed separating material less than ¼ inch. This ¼ inch “fine” material is then fed along a 24-inch belt to a hopper prior to grinding (currently feed on average of 88% less than ¼ to the mill). The over size from the Ludowici screen is fed to a Metso (300HP) secondary cone crusher for further size reduction which is then fed back to the Ludowici screen along a 24-inch belt to ensure the material is the appropriate size for the mill. The crushing circuit has a backup Simmons 5½ short head cone crusher that is utilized as needed.
| Recovery Methods | 124 | Page |
NI 43-101 Technical Report | December 22, 2020 |
17.1.2 Milling
Immediately after the crushing, the ore is stored in a series of "fines hoppers" which has a capacity of 1,800 tonnes. This material passes through chutes at the bottom of the hopper to feed three 24-inch-wide belts where the material is weighed (continuous weighing scale) and fed into three twin Denver of 7 ft by 14 ft ball-mills which are coated inside by a chromium-molybdenum alloy shield on the surface of the cylinder and natural rubber on the "heads". The grinding material used in these mills are 2.5-inch diameter high chrome alloy cast balls. The ¼ inch crushed material enters the ball mill where the movement, impacts and attrition from the balls promotes the wet pulverization of the mineral which is discharged by the mill as a "thick mineral pulp" where approximately 70% of the material by weight is solid and the remaining 30% is water. This thick mineral pulp is then diluted by adding water and feeds into 4 by 3-inch Krebs pumps where the material then feeds a series of Gmax G10 hydro-cyclone classifiers (two cyclones per mill) which carry out the classification of fines before entering the flotation circuit (75% of the material passing minus 200 meshes with automatic sampling). The average content of this material is 28% solid by weight and 72% water. The oversize material is returned to the mill for re-grinded in the closed circuit which has a "circulating load" of 350% thus ensuring the best release of the particles of interest. At this stage of grinding, reagents are added as the ore enters the mills. This includes the addition of two specific reagents which promote the recovery of gold and silver (promoter MaxGold 900 and promoter 7310, both Cyteg brand products).
17.1.3 Flotation Circuits
After grinding and conditioning by the initial reagents the material enters a 20 cubic meter capacity tank where additional reagents are added (promoter, collector and surfactant, Promoter 7310, Aerophine 3416 both Cyteg and cc-1065 SF surfactant brand PQM) and agitation incorporates these reagents into the mineral pulp. This material then enters the primary rougher flotation cells consisting of two stirred cell tanks that are 5 cubic metres each (made by Outotec) where a primary concentrate is obtained (paddled and spills over the edge of both cells where it is collected). Two stages of clean-up are required for this material prior to feeding the next stage of thickening which occurs in the in the primary and secondary cleaner flotation cells consisting of two banks of Wemco-type cells (6 cubic metres each and three cells per bank). Cell discharge continues as the material cascades toward the secondary rougher flotation cells consisting of 3 Outotec No. 5 cells which are each 5 cubic metres capacity. The spills from these cells are fed to a medium grained material tank that will partially return to flotation after a regrind stage.
The discharge from the Outotec No.5 cells feed a bank 8 Wemco type scavenger cells with a total capacity of 20 cubic metres. At this stage the spills of the bank of 8 cells join the spills from the previous 3 Outotec No. 5 cells and it is sent to a 4 ft by 5 ft regrind mill and passes to a hydro-cyclone classifier with the spill then entering the 20-meter conditioning tank along with the grinding product. The discharge enters the closed circuit to the 4 ft x 5 ft mill.
The material then enters an automatic filter press with 30 plates. The final concentrate has an average water content of 8% by weight.
It is worth mentioning that the rest of the reagent necessary for the flotation process are introduced at the beginning of the bank of scavenger cells and the current "modular" system of cells allows the Company to change flows to make the process more efficient, depending on the head grades feeding the mill. The discharge of the scavenger bank, containing on average 28% solid, is sent through a series of pumps to the tailings dam (after automatic sampling) 984 meters away. The pumps used for this discharge are 2 - 6 inch by 4-inch Warman 100 hp pumps.
17.1.4 Thickening & Filtration
The product from the secondary cleaner flotation cells is sent via 15 hp Gallagher pump through an automatic sampler before entering a 230 cubic meter settling tank. Thickening results in material containing 50% to 70% solids by weight which is then sent to the filtering stage. During this stage water is recovered, recirculated, and utilized at the beginning of the milling stage.
| Recovery Methods | 125 | Page |
NI 43-101 Technical Report | December 22, 2020 |
For the filtration stage, a Clever filter press with 30 plates is utilized (63 x 63 cm each plate). Material from the thickener is fed into the filter pack through an Abel piston pump where the maximum possible amount of water is removed by means of compressive pressure. The resulting filtered concentrate contains on average 12% humidity. The concentrate is then sampled, weighed, and stored in the concentrate yard prior to sale and shipment.
17.1.5 Production History
Table 17.1 summarizes the production at GMC. The tonnes and ounces of silver and gold include the San Ignacio mine since 2013. The information is current to July 31, 2020.
Table 17.1: GMC production as of July 31, 2020
| Year | Tonnes Mill/Mine GTO | Tonnes Mill/Mine San Ignacio | Tonnes (milled) | Ag (oz) | Au (oz) |
| 2006 | 86,111 | - | 86,111 | 105,480 | 988 |
| 2007 | 203,968 | - | 203,968 | 521,225 | 3,794 |
| 2008 | 155,079 | - | 155,079 | 848,083 | 5,488 |
| 2009 | 138,517 | - | 138,517 | 1,019,751 | 6,748 |
| 2010 | 144,112 | - | 144,112 | 1,019,856 | 6,619 |
| 2011 | 169,213 | - | 169,213 | 959,490 | 7,515 |
| 2012 | 174,022 | - | 174,022 | 1,004,331 | 10,350 |
| 20131 | 220,463 | 1,082 | 221,545 | 1,079,980 | 15,063 |
| 20141 | 213,658 | 54,154 | 267,812 | 1,239,009 | 15,906 |
| 20151 | 180,691 | 129,253 | 309,944 | 1,708,061 | 21,126 |
| 20161 | 136,349 | 183,694 | 320,043 | 1,473,229 | 21,626 |
| 20171 | 131,335 | 185,475 | 316,810 | 1,386,964 | 21,501 |
| 20181 | 88,364 | 212,650 | 301,014 | 1,096,757 | 19,073 |
| 20191 | 7,610 | 179,886 | 187,610 | 590,781 | 11,588 |
| 20201,2,3 | 15,563 | 65,851 | 82,639 | 291,105 | 3,977 |
| Totals | 994,033 | 1,012,045 | 3,078,439 | 14,344,102 | 171,362 |
Notes:
| 1. | Mid-2016 to 2020 San Ignacio and Guanajuato ores blended, so use mined tonnes for Guanajuato and San Ignacio |
| 2. | Information to July 31, 2020 |
| 3. | The operations at the GMC were suspended from April 2, 2020 through June 3, 2020 on account of the directive of the Mexican Federal Government to mitigate the spread of COVID-19. |
| 17.2 | Metallurgical Tests Summary |
Metallurgical tests are completed to optimize the consumption of reagents and overall milling process to obtain the maximum recovery and to comply with the concentration of grades required. All metallurgical tests are completed internally. A summary of the results for the November and December 2015 metallurgical tests are as follows in Table 17.2.
Table 17.2: 2015 metallurgical test summary
| Metallurgical Balance 70%-30% | ||||||||||
| Description | weight gr. | % weight | Grade | Contained | Recoveries | Head Grade | ||||
| Au gr/ton | Ag gr/ton | Au | Ag | Au | Ag | Au | Ag | |||
| concentrate | 34 | 3.40 | 56.96 | 5,351 | 1.94 | 181.93 | 71.23 | 71.38 | 2.32 | 251.00 |
| scavenger | 42 | 4.20 | 7.73 | 857 | 0.32 | 35.99 | 11.94 | 14.12 | REC. Au | REC. Ag |
| Tails | 924 | 92.40 | 0.50 | 40 | 0.46 | 36.96 | 16.82 | 14.50 | 83.18 | 85.50 |
| Totals | 1000 | 100.00 | 2.72 | 255 | 100.00 | 100.00 | ||||
| Metallurgical Balance 60%-40% | ||||||||||
| Description | weight gr. | % weight | Grade | Contained | Recoveries | Head Grade | ||||
| Au gr/ton | Ag gr/ton | Au | Ag | Au | Ag | Au | Ag | |||
| concentrate | 41 | 4.10 | 44.66 | 3,861 | 1.83 | 158.30 | 65.53 | 71.74 | 4.57 | 278.00 |
| scavenger | 28 | 2.80 | 19.43 | 930 | 0.54 | 26.04 | 19.47 | 11.80 | REC. Au | REC. Ag |
| Tails | 931 | 93.10 | 0.45 | 39 | 0.42 | 36.31 | 14.99 | 16.46 | 85.01 | 83.54 |
| Totals | 1000 | 100.00 | 2.79 | 221 | 100.00 | 100.00 | ||||
| Metallurgical Balance 50%-50% | ||||||||||
| Recovery Methods | 126 | Page |
NI 43-101 Technical Report | December 22, 2020 |
| Metallurgical Balance 70%-30% | ||||||||||
| Description | weight gr. | % weight | Grade | Contained | Recoveries | Head Grade | ||||
| Au gr/ton | Au gr/ton | Au | Au | Au | Ag | Au | Ag | |||
| concentrate | 40 | 4.00 | 56.97 | 4,163 | 2.28 | 166.52 | 69.25 | 69.91 | 2.79 | 214.00 |
| scavenger | 25 | 2.50 | 18.11 | 1,071 | 0.45 | 26.78 | 13.76 | 11.24 | REC. Au | REC. Ag |
| Tails | 935 | 93.50 | 0.60 | 48 | 0.56 | 44.88 | 16.99 | 18.84 | 83.01 | 81.16 |
| Totals | 1000 | 100.00 | 3.29 | 238 | 100.00 | 100.00 | ||||
| Metallurgical Balance 50%-50% | ||||||||||
| Description | weight gr. | % weight | Grade | Contained | Recoveries | Head Grade | ||||
| Au gr/ton | Ag gr/ton | Au | Ag | Au | Ag | Au | Ag | |||
| CONC. 1 L | 107 | 2.14 | 141.86 | 5,827 | 3.04 | 124.72 | 81.09 | 74.22 | 3.22 | 171.00 |
| scavenger | 115 | 2.29 | 3.99 | 142 | 0.09 | 3.26 | 2.44 | 1.94 | REC. Au | REC. Ag |
| Tails 1 L | 101 | 2.02 | 8.75 | 362 | 0.18 | 7.32 | 4.73 | 4.36 | 88.26 | 80.52 |
| Tails | 4677 | 93.54 | 0.47 | 35 | 0.44 | 32.74 | 11.74 | 19.48 | ||
| Totals | 5000 | 100.00 | 3.74 | 168 | 100.00 | 100.00 | ||||
| Metallurgical Balance Test Xantato Isopropilico | ||||||||||
| Description | weight gr. | % weight | Grade | Contained | Recoveries | Head Grade | ||||
| Au gr/ton | Ag gr/ton | Au | Ag | Au | Ag | Au | Ag | |||
| Conc. 2 L. | 6 | 0.30 | 1341.93 | 37,912 | 4.03 | 113.74 | 74.69 | 61.59 | 4.44 | 146 |
| scavenger | 37 | 1.85 | 17.05 | 703 | 0.32 | 13.01 | 5.85 | 7.04 | REC. Au | REC. Ag |
| Tails 1 L. | 28 | 1.40 | 11.97 | 721 | 0.17 | 10.09 | 3.11 | 5.47 | 86.40 | 78.14 |
| Tails 2 L | 7 | 0.35 | 42.19 | 2,134 | 0.15 | 7.47 | 2.74 | 4.04 | ||
| Tails finales | 1922 | 96.10 | 0.76 | 42 | 0.73 | 40.36 | 13.60 | 21.86 | ||
| Totals | 2000 | 100.00 | 5.39 | 185 | 100.00 | 100.00 | ||||
| Metallurgical Balance San Ignacio Low Grade | ||||||||||
| Description | weight gr. | % weight | Grade | Contained | Recoveries | Head Grade | ||||
| Au gr/ton | Ag gr/ton | Au | Ag | Au | Ag | Au | Ag | |||
| concentrate | 41 | 4.10 | 55.41 | 1,737 | 2.27 | 71.22 | 74.51 | 60.04 | 2.84 | 127 |
| scavenger | 44 | 4.40 | 2.88 | 287 | 0.13 | 12.63 | 4.16 | 10.65 | REC. Au | REC. Ag |
| Tails | 915 | 91.50 | 0.71 | 38 | 0.65 | 34.77 | 21.34 | 29.31 | 70.69 | 78.66 |
| Totals | 1000 | 100.00 | 3.05 | 119 | 100.00 | 100.00 | ||||
| Metallurgical Balance Test Xantato Amilico | ||||||||||
| Description | weight gr. | % weight | Grade | Contained | Recoveries | Head Grade | ||||
| Au gr/ton | Ag gr/ton | Au | Ag | Au | Ag | Au | Ag | |||
| concentrate | 29 | 2.90 | 89.44 | 2,881 | 2.59 | 83.55 | 72.33 | 67.38 | 3.05 | 126 |
| scavenger | 25 | 2.50 | 15.70 | 445 | 0.39 | 11.13 | 10.95 | 8.97 | REC. Au | REC. Ag |
| Tails | 946 | 94.60 | 0.63 | 31 | 0.60 | 29.33 | 16.73 | 23.65 | 76.35 | 83.27 |
| Totals | 1000 | 100.00 | 3.59 | 124 | 100.00 | 100.00 | ||||
| Metallurgical Balance Test San Ignacio 100% 75% a -200 | ||||||||||
| Description | weight gr. | % weight | Grade | Contained | Recoveries | Head Grade | ||||
| Au gr/ton | Ag gr/ton | Au | Ag | Au | Ag | Au | Ag | |||
| concentrate | 40 | 4.00 | 57.16 | 1,903 | 2.29 | 76.12 | 68.53 | 60.46 | 3.1 | 132 |
| scavenger | 34 | 3.40 | 13.92 | 429 | 0.47 | 14.59 | 14.18 | 11.59 | REC. Au | REC. Ag |
| Tails | 926 | 92.60 | 0.62 | 38 | 0.58 | 35.19 | 17.29 | 27.95 | 72.05 | 82.71 |
| Totals | 1000 | 100.00 | 3.34 | 126 | 100.00 | 100.00 | ||||
| Metallurgical Balance Test San Ignacio 100% 82 %-200 | ||||||||||
| Description | weight gr. | % weight | Grade | Contained | Recoveries | Head Grade | ||||
| Au gr/ton | Ag gr/ton | Au | Ag | Au | Ag | Au | Ag | |||
| concentrate | 41 | 4.10 | 72.01 | 2,301 | 2.95 | 94.34 | 80.04 | 73.76 | 3.21 | 135 |
| scavenger | 49 | 4.90 | 4.77 | 165 | 0.23 | 8.09 | 6.34 | 6.32 | REC. Au | REC. Ag |
| Tails | 910 | 91.00 | 0.55 | 28 | 0.50 | 25.48 | 13.62 | 19.92 | 80.08 | 86.38 |
| Totals | 1000 | 100.00 | 3.69 | 128 | 100.00 | 100.00 | ||||
| Metallurgical Balance Test San Ignacio 70% | ||||||||||
| Description | weight gr. | % weight | Grade | Contained | Recoveries | Head Grade | ||||
| Au gr/ton | Ag gr/ton | Au | Ag | Au | Ag | Au | Ag | |||
| concentrate | 60 | 6.00 | 45.39 | 1,495 | 2.72 | 89.70 | 76.37 | 71.27 | 2.9 | 124 |
| scavenger | 52 | 5.20 | 7.67 | 200 | 0.40 | 10.40 | 11.18 | 8.26 | REC. Au | REC. Ag |
| Tails | 888 | 88.80 | 0.50 | 29 | 0.44 | 25.75 | 12.45 | 20.46 | 79.54 | 87.55 |
| Totals | 1000 | 100.00 | 3.57 | 126 | 100.00 | 100.00 | ||||
| Metallurgical Balance Test San Ignacio 75% | ||||||||||
| Recovery Methods | 127 | Page |
NI 43-101 Technical Report | December 22, 2020 |
| Metallurgical Balance 70%-30% | ||||||||||
| Description | weight gr. | % weight | Grade | Contained | Recoveries | Head Grade | ||||
| Au gr/ton | Ag gr/ton | Au | Ag | Au | Ag | Au | Ag | |||
| concentrate | 30 | 3.00 | 102.75 | 3,017 | 3.08 | 90.51 | 78.03 | 68.96 | 3.67 | 141 |
| scavenger | 31 | 3.10 | 14.25 | 345 | 0.44 | 10.70 | 11.18 | 8.15 | REC. Au | REC. Ag |
| Tails | 939 | 93.90 | 0.45 | 32 | 0.43 | 30.05 | 10.79 | 22.89 | 77.11 | 89.21 |
| Totals | 1000 | 100.00 | 3.95 | 131 | 100.00 | 100.00 | ||||
| Metallurgical Balance Test San Ignacio 75% | ||||||||||
| Description | weight gr. | % weight | Grade | Contained | Recoveries | Head Grade | ||||
| Au gr/ton | Ag gr/ton | Au | Ag | Au | Ag | Au | Ag | |||
| concentrate | 63 | 6.30 | 34.09 | 1,004 | 2.15 | 63.25 | 78.37 | 65.91 | 3 | 130 |
| scavenger | 51 | 5.10 | 2.99 | 155 | 0.15 | 7.91 | 5.56 | 8.24 | REC. Au | REC. Ag |
| Tails | 886 | 88.60 | 0.50 | 28 | 0.44 | 24.81 | 16.07 | 25.85 | 74.15 | 83.93 |
| Totals | 1000 | 100.00 | 2.74 | 96 | 100.00 | 100.00 | ||||
| Metallurgical Balance Test Santa Margarita | ||||||||||
| Description | weight gr. | % weight | Grade | Contained | Recoveries | Head Grade | ||||
| Au gr/ton | Ag gr/ton | Au | Ag | Au | Ag | Au | Ag | |||
| Conc. Prim. | 50 | 5.00 | 68.03 | 2,171 | 3.40 | 108.55 | 78.99 | 71.71 | 3.80 | 145.00 |
| Conc. scav. | 28 | 2.80 | 12.58 | 443 | 0.35 | 12.40 | 8.18 | 8.19 | REC. Au | REC. Ag |
| Tails | 922 | 92.20 | 0.60 | 33 | 0.55 | 30.43 | 12.83 | 20.10 | 87.17 | 79.90 |
| Total | 1000 | 100.00 | 4.31 | 151 | 100.00 | 100.00 | ||||
| Recovery Methods | 128 | Page |
NI 43-101 Technical Report | December 22, 2020 |
| 18.0 | Project Infrastructure |
| 18.1 | Guanajuato |
The Guanajuato mine is located 380 km northwest of Mexico City and is situated along the northeast side of the City of Guanajuato. The general infrastructure covers the area of the mining concessions and are described in the following items.
The surface and underground infrastructure at Guanajuato includes the following:
| ¢ | Extensive underground workings from surface to approximately 600 metres below surface including multiple shafts and adits from surface as well as internal shafts and ramps |
| ¢ | Two main shafts: the Rayas, for men and materials, and the Cata shaft, for rock hoisting |
| ¢ | Mine, geology, processing, and administrative offices in several locations. |
| ¢ | A shaft and ramp from surface as well as internal ramps and drives linking to adjacent mines |
| ¢ | A nominal 1,000tpd flotation concentrator with surface bins, crushing facilities, grinding mills, flotation cells, and concentrate dewatering circuit |
| ¢ | Access roads to the mines |
| ¢ | Historical tailings storage facility |
| ¢ | Assay laboratory |
| ¢ | A tailings storage facility |
| ¢ | Connection to the national grid for the supply of electric power |
| ¢ | Conventional and mechanized underground mining equipment |
| ¢ | Water and compressed air reticulation systems |
| ¢ | Utility water is available for the mine and plant |
| ¢ | Communications systems (internet based) |
| 18.2 | San Ignacio |
San Ignacio is located 380 km northwest of Mexico City and is situated 10km west of the city of Guanajuato. The general infrastructure covers the area of the mining concessions and are described in the following items.
The surface and underground infrastructure at San Ignacio includes the following:
| ¢ | Underground workings from surface to approximately 100 metres below surface including ramps and several levels |
| ¢ | Connection to the national grid for the supply of electric power and sub-station facility |
| ¢ | Conventional and mechanized underground mining equipment |
| ¢ | Mine maintenance shop and associated office and stores, and diesel storage facility |
| ¢ | Access road and mine waste dumps |
| Project Infrastructure | 129 | Page |
NI 43-101 Technical Report | December 22, 2020 |
| 19.0 | Market Studies & Contracts |
| 19.1 | Market Studies |
The principal commodities at the GMC Guanajuato and San Ignacio are iron sulphide (pyrite) concentrates containing gold and silver. Penalty elements are negligible. These products are freely traded, at prices that are widely known, so that prospects for sale of any production are virtually assured. There are smelters in Mexico that can accept these concentrates, as well as other smelters around the world along with traders who purchase such concentrates. The Company contracts for the sale of its concentrate from the GMC annually. The concentrate sales agreements are considered to be within industry norms.
| 19.2 | Contracts |
The mine maintenance contract is a cost per man-day.
Mining contracts include unit costs for development, stoping, and haulage plus daily costs for ancillary personnel. Several of the mining contracts include rates for the use of Company equipment (Scoop Tram, trucks, jumbos, etc.).
Security personnel are contracted based upon a daily rate per man.
19.2.1 Guanajuato
Guanajuato is an operating mine using contract employees and contracted services under the direction of Company employed management. There are several contracts in place for:
| ¢ | Diamond drilling in the mine (one contractor) |
| ¢ | Seven contracts for the supply of labour and services in the mines |
| ¢ | Alfred Knight for representation at Manzanillo, and Inspectorate in Veracruz, for concentrate shipments |
| ¢ | Sales of concentrates to traders and smelters |
| ¢ | Security services on surface and underground |
19.2.2 San Ignacio
San Ignacio is an operating satellite mine of the GMC using employees and contracted services under the direction of Company employed management. There are several contracts in place for:
| ¢ | Seven contracts for the supply of labour and services in the mines |
| ¢ | Surface haulage of ores from San Ignacio to GMC processing plant |
| ¢ | Security services on surface |
| Market Studies & Contracts | 130 | Page |
NI 43-101 Technical Report | December 22, 2020 |
| 20.0 | Environmental Studies, Permitting, & Social or Community Impact |
| 20.1 | Environmental Regulatory Framework in Mexico |
The Mexican Constitution establishes in Article 27 that natural resources are part of the nation's heritage and that it is therefore the Federal Government that regulates resource management. Although the Mining Legislation for Mexico emanates from Article 27, there are many secondary laws that complement the regulatory framework.
The mining legislation provides that the owners of mining concessions and assignments, regardless of the date of their attribution, are obliged to comply with the provisions applicable to the mining-metallurgical industry in terms of ecological balance and protection of the environment, in accordance with the legislation and applicable regulations in the different areas (environmental impact, use of land and water, generation of waste, emissions to the atmosphere, etc.). The regulations of the Mining Law establish, for its part, that the granting of concessions and mining assignments does not exempt its holders from the obligation to comply with the provisions on environmental, labour, social assistance and use and handling of explosives, as contained in the applicable legislation. Emphasizing that for the extraction of minerals, concessionaires must comply with the different federal and state laws that apply to the type of operation in question.
At the federal level, the unit authorized to generate, apply, supervise, and monitor compliance with environmental regulations is the Ministry of Environment and Natural Resources (Secretaria de Medio Ambiente y Recursos Naturales SEMARNAT). Among its most important organizations linked to mining activity are the National Water Commission (Comision Nacional del Agua CONAGUA), the National Commission of Natural Protected Areas (Comision Nacional de Areas Protegidas CONANP) and the Federal Office of Environmental Protection (Procuraduria Federal de Proteccion al Ambiente PROFEPA).
There are also regulations and procedures at the state and municipal level. In the first case, the unit responsible for monitoring compliance in environmental matters is the Institute of Ecology (Instituto de Ecologia) for the State of Guanajuato and at the municipal level, it is the General Directorate of Ecology and Environment (Dirección General de Ecología y Medio Ambiente).
The laws and regulations in force for mining activity in Mexico and related to the care of the environment, are:
| ¢ | Constitución Política de los Estados Unidos Mexicanos |
| ¢ | (Political Constitution of the United Mexican States) |
| ¢ | Ley Minera (Mining Law) and regulations thereunder |
| ¢ | Ley General del Equilibrio Ecológico y la Protección al Ambiente (General Law of Ecological Balance and Protection of the Environment) and regulations thereunder |
| ¢ | Ley General de Desarrollo Forestal Sustentable (General Law on Sustainable Forest Development) and regulations thereunder |
| ¢ | Ley General para la Prevención y Gestión Integral de los Residuos (General Law for the Prevention and Integral Management of Waste) and regulations thereunder |
| ¢ | Ley General de Vida Silvestre (General Law of Wildlife) |
| ¢ | Ley Federal de Responsabilidad Ambiental (Federal Law of Environmental Responsibility) |
| ¢ | Ley de Aguas Nacionales (Law on National Waters) and regulations thereunder |
| ¢ | Ley Federal de Derechos (en materia de agua) (Federal Law of Rights (on water)) |
| Environmental Studies, Permitting, & Social or Community Impact | 131 | Page |
NI 43-101 Technical Report | December 22, 2020 |
As a complement to this legislation, there are the Official Mexican Standards for the environmental sector that establish the characteristics and specifications, criteria and procedures that allow protecting and promoting the improvement of the environment and ecosystems, as well as the preservation of natural resources.
The Norms for the mining operation are the following:
| ¢ | NOM-001-SEMARNAT-1996, Wastewater discharge into national waters and national lands. |
| ¢ | NOM-002-SEMARNAT-1996, Wastewater discharge into the sewer system |
| ¢ | NOM-003-CONAGUA-1996, Water extraction wells construction |
| ¢ | NOM-052-SEMARNAT-2005, Identification, classification and lists of hazardous waste |
| ¢ | NOM-120-SEMARNAT-2011, |
| ¢ | NOM-141-SEMARNAT-2003, Project, construction, operation, and post-operation of tailings dam |
| ¢ | NOM-157-SEMARNAT-2009, Mine waste management plans |
| ¢ | NOM-161-SEMARNAT-2011, Special handling waste and their management plans |
| ¢ | Norma Técnica Ambiental NTA-IEG-003/2001, Non-hazardous industrial waste management |
Note: There are other Mexican Official Standards that are used in a complementary manner.
| 20.2 | Environmental Studies & Permits |
According to the stages of the process, the main environmental studies and permits required are described in the following Items of this TR.
20.2.1 Exploration
To start the exploration work, a company may be required to complete necessary studies in accordance with the Secretary of Environment and Natural Resources (SEMARNAT) such as an Environmental Impact Assessment and sometimes a Change in the use of land authorization.
| ¢ | Environmental Impact Evaluation. This can be carried out in two ways, depending on the conditions of the project. |
| ¢ | Environmental Impact Assessment (Manifestacion de Impacto Ambiental MIA). This document outlines real and potential environmental impact any work or activity could generate and outlines the mitigation strategy for such impact. This is a complete report based in a series of extensive studies and surveys. |
| ¢ | Preventive Report (Informe Preventivo IP). This document is required if a project operates under the assumptions outlined in Norm NOM-120-SEMARNAT-2011 Standard, that establishes environmental protection specifications for direct mining exploration activities in agricultural, livestock or inactive agricultural areas and in areas with dry and temperate climates where vegetation of xerophilous scrub, deciduous forest, coniferous or oak forests. |
| ¢ | Change in the use of land in forest lands: When the total or partial removal of vegetation from forest lands is intended to be used for non-forestry activities and its volume exceeds the parameters established in NOM 120-SEMARNAT-2011 Standard, a Technical Justification Study (Estudio Tecnico Justificativo ETJ) must be presented for the change of land use official modification. |
| Environmental Studies, Permitting, & Social or Community Impact | 132 | Page |
NI 43-101 Technical Report | December 22, 2020 |
20.2.2 Mining & Mineral Processing
Due to the complexity related to this stage of the process and the diversity of possible environmental impacts, there are several licenses and permits required as follows:
| ¢ | Environmental Impact Evaluation: As for the exploration stage, both the mining and processing of minerals (including underground development and complementary facilities) require regulatory instruments that regulate the environmental impacts of the project described on the MIA and, where appropriate, the need of modifying lands with forest vocation to convert them for industrial use based on the ETJ). |
| ¢ | Generation of mining-metallurgical waste: The adequate management of this waste will be determined by the NOM-157-SEMARNAT-2009 Standard, which establishes the elements and procedures for implementing mine waste management plans. In addition to the above, particularly in relation to tailings, the provisions of Standard NOM-141-SEMARNAT-2003, which establishes the procedure to characterize tailings, as well as the specifications and criteria for the characterization and preparation of tailings ponds sites, construction, operation, and post-operation of tailings dams. |
| ¢ | Emissions to the atmosphere: To regulate these emissions, a company must have an Environmental License Licencia Ambiental Unica (LAU), authorization based on the regulation for the operation and the operation of fixed sources under federal jurisdiction. The Ministry of Environment and Natural Resources (SEMARNAT) establishes the mechanisms and procedures to obtain such a license, as well as an update of information on polluting emissions through an Annual Operation Certificate (Cedula de Operacion Anual COA). |
| ¢ | Use or use of water: For the use of waters other than those from mining, a Concession Certificate must be processed before the CONAGUA. The discharge of the wastewater will be done in compliance with Standard NOM-001-SEMARNAT-1996 if it is discharged into national waters and / or, according to Standard NOM-001-SEMARNAT-1996 when it is discharged into the municipal sewer system municipal. |
The main permits currently in place for the GMC are listed in Table 20.1.
Complementary to some of the permits listed above a series of monitoring activities have been established for the GMC to monitor and control possible environmental impacts related to GMC activities. These monitoring activities are list in Table 20.2.
Table 20.1: Summary of permits in place for the GMC
| AUTHORITY | PERMIT | FILE NUMBER / AUTHORIZATION NUMBER |
| SEMARNAT | IP MINING EXPLORATION IN SAN IGNACIO PHASE IX | GTO.131.1.1/0675/2017 |
| IP MINING EXPLORATION IN SAN IGNACIO PHASE X | GTO.131.1.1/0883/2017 | |
| MIA OF THE TAILINGS DAM No.9 | GTO.131.1.2/0079/2013 | |
| ETJ OF THE TAILINGS DAM No. 9 | GTO.131.1.1/0658/2015 | |
| MIA OF THE TAILINGS DAM No.9 (SECOND EXTENSION) | SUBMITTED TO SEMARNAT | |
| ETJ OF THE TAILINGS DAM No. 9 (SECOND EXTENSION) | SUBMITTED TO SEMARNAT | |
| MIA OFSAN IGNACIO MINE | GTO.131.1.1/0566/2013. | |
| ETJ OF SAN IGNACIO MINE | GTO.131.1.2/317/2013. | |
| MIA OF EL HORCON PROJECT | SGPARN.014.02.01.01.1031/15 | |
| NOTIFICATION OF TEMPORARY SUSPENSION OF EL HORCON PROJECT | MMR/AMB001/2016 | |
| ETJ OF EL HORCON PROJECT | SGPARN.014.02.01.01.1015/17 | |
| REGISTRATION AS A GENERATOR OF HAZARDOUS WASTE | MMRSP1101511 | |
| HAZARDOUS WASTE MANAGEMENT PLAN | 11-PMM-1-0042-2010 | |
| MINIG WASTE MANAGEMENT PLAN | IN PROCESS | |
| ENVIRONMENTAL LICENSE | LAU-11-47/01501/06 | |
| ANNUAL OPERATION CERTIFICATE COA 2016 | 11/COW/0236/06/17 | |
| PERMISSION FOR OPEN AIR COMBUSTION | GTO 13.1.1/0055/2017 | |
| IEEG | REGISTRATION AS A GENERATOR OF SPECIAL HANDLING WASTE | GUA-GRME-221/2011 |
| SPECIAL HANDLING WASTE MANAGEMENT PLAN | PM-000200/2017 | |
| CONAGUA | CHANGE OF OWNERSHIP (MINERA MEXICANA EL ROSARIO) | 08GUA107052/12FMDL11 |
| PERMIT FOR OCCUPATION OF FEDERAL ZONE AND HYDRAULIC INFRASTRUCTURE INTALATION - TAILINGS DAM No.9 | SUBMITTED TO CONAGUA | |
| WASTEWATER DISCHARGES IN SAN IGNACIO MINE | SUBMITTED TO CONAGUA | |
| PROFEPA | REJOINING TO THE VOLUNTARY ENVIRONMENTAL AUDIT | 8380 |
| MUNICIPALITY | ORE PROCESSING PLANT (HACIENDA DE BUSTOS) LAND USE LICENSE | DPUPA/2763/2017 |
| TAILINGS DAM LAND USE LICENSE | DPUPA/3155/2016 | |
| SAN IGNACIO´S MINE LAND USE LICENSE | DPUPA/3154/2016 | |
| RAYAS´S MINE LAND USE LICENSE | DPUPA/3401/2016 | |
| SAN VICENTE´S MINE LAND USE LICENSE | DPUPA/3402/2016 | |
| CATA´S MINE LAND USE LICENSE | DPUPA/2892/2017 | |
| ENCARNACION´S MINE LAND USE LICENSE | DPUPA/2896/2017; DPUPA/2996/2017 | |
| VALENCIANA MINE´S LAND USE LICENSE | DPUPA/1441/2016 |
| Environmental Studies, Permitting, & Social or Community Impact | 133 | Page |
NI 43-101 Technical Report | December 22, 2020 |
Table 20.2: Monitoring activities in place at the GMC
| Category | Monitoring | Legal requirement | Frequency |
| Waste | Tailings monitoring | NOM-141-SEMARNAT-2003 NOM-147-SEMARNAT/SSA1-2004 | Annual |
| Waste rock monitoring | NOM-157-SEMARNAT-2009 | Annual | |
| PCB´S monitoring | NOM-133-SEMARNAT-2015 | Annual | |
Air (atmospheric emissions) | Perimeter Powder PM 10 and PM 2.5 | NOM-025-SSA1-2014 | Biannual |
| Perimeter Powder (total suspended particles) | NOM-035-SEMARNAT-1993 | Biannual | |
| Isokinetic sampling (lead and total suspended particles) | NOM-043-SEMARNAT-1993 | Biannual | |
| Isokinetic sampling (lead, carbon monoxide, nitric acid and hydrochloric acid) | NOM-043-SEMARNAT-1994 NOM-085-SEMARNAT-2011 | Biannual | |
| Noise | Perimeter Noise | NOM-081-SEMARNAT-1994 | Annual |
| Water | Water quality analysis | NOM-001-SEMARNAT-1996 | Biannual |
| Water quality analysis | NOM-001-SEMARNAT-1996 | Quarterly | |
| Groundwater quality analysis | NOM-001-SEMARNAT-1996 | Annual |
20.2.3 Mine Tails Disposal
Great Panther has been working with permitting authorities to expand the capacity of its existing GMC tailings storage facilities (“TSF”). Approval from the environmental permitting authority Secretaría del Medio Ambiente y Recursos Naturales (“SEMARNAT”) for expansion of the GMC TSF (lifts 18 and 19) has been received, subject to also receiving approval by the national water authority, Comisión Nacional del Agua (“CONAGUA”) which is pending.
In parallel, the Company has completed a review to identify alternatives to extend its tailings storage utilizing existing permits. It has been determined that the Company will be able to extend its tailings capacity at the GMC by cycloning and constructing interior berms from existing embankment 17. This technical alternative is expected to provide tailings capacity until June 30, 2021 and allow more time for receipt of the pending CONAGUA expansion approval. If the CONAGUA approval of expansion of the TSF has not been received prior to June 30, 2021, the Company may need to cease milling operations at the GMC until receipt of the CONAGUA expansion approval.
| Environmental Studies, Permitting, & Social or Community Impact | 134 | Page |
NI 43-101 Technical Report | December 22, 2020 |
20.2.4 Mine Closure
Although the closure of the mine is one of the last stages of the mining cycle, from the beginning of the operation it is required that a Site Restoration and Abandonment Program (Programa de Restauración y Abandono del Sitio) is prepared in compliance with the provisions of the Environmental Impact Assessment (MIA), and a Technical Justification Study (ETJ) and / or in Standard NOM-141-SEMARNAT-2003, as the case may be.
| 20.3 | Social & Community Factors |
Great Panther’s community relations team at the GMC implements extensive stakeholder engagement and social investment programs focused in three main areas: socio-economic development, public health and safety, and natural and cultural heritage. The Company owns the surface rights on the Property that provide sufficient access to the mining operations, waste storage areas, and other facilities.
Great Panther, through its Sustainability Policy, has committed to conduct its business activities responsibly and to continually improve standards of social performance striving to make positive impacts in the communities surrounding its operations.
| Environmental Studies, Permitting, & Social or Community Impact | 135 | Page |
NI 43-101 Technical Report | December 22, 2020 |
| 21.0 | Capital and Operating Costs |
Capital and operating budgets are prepared each year for the Guanajuato Mine Complex by the mine staff. These budgets are continuously reviewed against production. For the purposes of the current Mineral Resource Estimates, individual zone cut-offs were applied based on the planned full operational cost per tonne as provided by the mine operations (variable & fixed costs including mine costs, plant costs and administration costs). Planned full cost estimates per tonne used in the Mineral Resource Estimation are presented in Table 21.1.
Table 21.1: Planned variable and fixed costs per tonne milled (US$)
| 2020 | Cata | Santa Margarita | Los Pozos | Guanajuatito | Valenciana | Promontorio | San Ignacio |
| Mine Cost | $ 84 | $ 84 | $ 58 | $ 69 | $ 71 | $ 94 | $ 69 |
| Plant cost | $ 14 | $ 14 | $ 14 | $ 14 | $ 14 | $ 14 | $ 14 |
| Admin cost | $ 17 | $ 17 | $ 17 | $ 17 | $ 17 | $ 17 | $ 17 |
| Total US$ | $ 115 | $ 115 | $ 89 | $ 100 | $ 102 | $ 125 | $ 100 |
The GMC is operated with contractors under the supervision of Great Panther management personnel. At the end of July 2020, there were 118 administrative and management personnel and 509 contractors at the site. GMC contractors carry out all mine maintenance, mining, and security and is shared between the Guanajuato and San Ignacio sites.
The planned full cost estimates per tonne described above are forward-looking statements. There are material factors that could cause actual results to differ materially from the conclusions, forecasts, or projections set out in this TR. Some of the material factors include differences from the assumptions made in the TR regarding grades, currency exchange rates, metals production rates, mining methods and widths, schedule of development, transportation costs, equipment costs, labour, consumables and other material costs, markets and market prices, as described in the TR. See Section 24.0 for a discussion about the forward-looking statements included in this TR and the key assumptions upon which they are based and risks and uncertainties associated with such forward-looking statements.
There are no current estimates of Mineral Reserves for any of the GMC. The Company made decisions to enter production at Guanajuato and San Ignacio without having completed final feasibility studies. Accordingly, the Company did not base its production decisions on any feasibility studies of Mineral Reserves demonstrating economic and technical viability of the GMC. As a result, there may be increased uncertainty and risks of achieving any level of recovery of minerals from the GMC or the costs of such recovery. As the GMC does not have established Mineral Reserves, the Company faces higher risks that anticipated rates of production and production costs, such as those provided in this TR, will not be achieved. These risks could have a material adverse impact on the Company’s ability to continue to generate anticipated revenues and cash flows to fund operations from and ultimately achieve or maintain profitable operations at the GMC.
| Capital and Operating Costs | 136 | Page |
NI 43-101 Technical Report | December 22, 2020 |
| 22.0 | Economic Analysis |
This section has been excluded, as per securities regulations since the GMC is in operation and Great Panther Mining Limited is considered producing issuer.
| Economic Analysis | 137 | Page |
NI 43-101 Technical Report | December 22, 2020 |
| 23.0 | Adjacent Properties |
Mining in the Guanajuato district has been ongoing, but somewhat dis-continuously, for over four centuries. The most prolific producing vein structure within the district is the Veta Madre and Great Panther holdings encompass some of the more historically significant sections of that system. There are other important past and present producers on the Veta Madre, and surrounding vein structures (Figure 4.2).
The Torres Mine Property, formerly operated by Peñoles, borders Great Panther ground to the south. Endeavour Silver Corp. (Endeavour) operates the Cebada, Bolañitos, Golondrinas, and Asuncion mines, as well as a 1,600 tonne per day concentrator at Bolañitos. Cebada is located along the Veta Madre immediately northwest of the Guanajuatito mine, while the other mines are located on the Veta La Luz system, approximately five km to the west-northwest. Endeavour operates the Bolañitos Mine concentrator, approximately 3km north of the San Ignacio shaft, which had 2019 through-put of 868tpd. Part of Endeavour’s mining at the Bolañitos Mine is also development and mining from the Lucero Adit located approximately 200m east of the north-east corner of the San Ignacio property, which consists of numerous veins parallel to the structures on the San Ignacio property (Endeavour Silver Corp. news release, January 10, 2020). Production from the Bolañitos operation in 2019 is reported on Endeavour’s website to have been at 316,708 tonnes throughput producing 624,942 ounces of Ag, and 14,779 ounces of Au.
In 2012, Endeavour Silver Corp. purchased the El Cubo Mine located on the Veta de la Sierra some five kilometers southeast of Rayas. Production from this operation in 2019 is reported on Endeavour’s website to have been at 245,418 tonnes throughput producing 1.087 million ounces of Ag and 10,464 ounces of Au (Endeavour, 2020). On November 21, 2019 Endeavour Silver announced the closure of the El Cubo Mine due to lack of mineral reserves.
The Qualified Person is unable to verify the information on adjacent properties to the GMC included in this section of the TR. Readers are cautioned not to assume that information on adjacent properties is indicative of the mineralization at the GMC that is the subject of this TR.
| Adjacent Properties | 138 | Page |
NI 43-101 Technical Report | December 22, 2020 |
| 24.0 | Other Relevant Data and Information |
Except as described below, no additional information or explanation is necessary to make this Technical Report understandable and not misleading.
| 24.1 | Cautionary Statement on Forward-Looking Statements |
This TR includes statements and information that constitute “forward-looking statements” within the meaning of the United States "Private Securities Litigation Reform Act" of 1995 and “forward-looking information” within Canadian securities laws (collectively, “forward-looking statements”). All statements, other than statements of historical fact, addressing activities, events or developments that the Company expects or anticipates will or may occur in the future are forward-looking statements. Forward-looking statements are often, but not always, identified by the words “anticipates”, “believes”, “expects”, “may”, “likely”, “plans”, “intends”, “expects”, “may”, “forecast”, “project”, “estimates”, “budgets”, “guidance”, “targets”, “potential”, and “outlook”, or similar words, or statements that certain events or conditions “may”, “might”, “could”, “can”, “would”, or “will” occur. Forward-looking statements reflect current expectations and assumptions and are subject to a number of known and unknown risks, uncertainties and other factors, which may cause the Company’s actual results, performance or achievements to be materially different from any anticipated future results, performance or achievements expressed or implied by the forward-looking statements.
Examples of specific information in this TR, that may constitute forward-looking statements are:
| ¢ | Mineral Resource estimates for the GMC and the assumptions underlying the Mineral Resource estimates presented in Section 14 of the TR, including the assumptions about grade, metal prices, currency exchange rates, costs, metals production rates, schedule of development, labour, consumables and other material costs, markets and market prices; |
| ¢ | plans to complete and results of further exploration at the GMC and expectations about the opportunities to identify additional Mineral Resources at the GMC; |
| ¢ | planned full cost estimates per tonne for the GMC including the assumptions underlying such estimates presented in Section 21 of the TR; |
| ¢ | expectations around the Company’s ability to receive the permits and regulatory approvals necessary for an expansion of the existing GMC tailings storage facility (lifts 18 and 19) in a timely manner in order to prevent an interruption to milling operations at the GMC; |
| ¢ | expectations around the use of an alternative technical solution to extend the tailings capacity until June 30, 2021 until CONAGUA expansion approval can be obtained; |
| ¢ | expectations that the Company’s operations will not be impacted materially by government or industry measures to control the spread of COVID-19, including the impact of future orders of federal governments to curtail or cease mining operations in Mexico as a result of the COVID-19 pandemic; |
| ¢ | expectations that metallurgical, environmental, legal, title, taxation, socio-economic, political, social, marketing or other issues will not materially affect the Company’s estimates of Mineral Resources or its future mining plans; |
| ¢ | expectations regarding access to additional capital to fund additional expansion or development plans and general working capital needs; and |
| ¢ | expectations in respect of permitting and development activities. |
| Other Relevant Data and Information | 139 | Page |
NI 43-101 Technical Report | December 22, 2020 |
These forward-looking statements and information reflect the current views with respect to future events and are necessarily based upon a number of assumptions that, while considered reasonable by the Company, are inherently subject to significant operational, business, economic and regulatory uncertainties and contingencies. These assumptions include:
| ¢ | continued operations at the GMC without significant interruption due to COVID-19 or any other reason; |
| ¢ | the accuracy of the GMC Mineral Resource estimates and the assumptions upon which they are based; |
| ¢ | ore grades and recoveries; prices for silver and gold remaining as estimated; |
| ¢ | currency exchange rates remaining as estimated; |
| ¢ | capital, decommissioning and reclamation remaining as estimated; |
| ¢ | prices for energy inputs, labour, materials, supplies and services (including transportation) remaining as estimated; |
| ¢ | all necessary permits, licenses and regulatory approvals for the GMC operations are received in a timely manner without conditions, including the approvals for the expansion of the existing GMC TSF (lifts 18 and 19) are received in a timely manner without condition; |
| ¢ | the Company’s plan to extend the tailings capacity of the GMC TSF utilizing existing permits will be successful in extending the GMC tailings capacity until June 30, 2021 and that such extension will be sufficient to bridge the tailings capacity until CONAGUA approval can be obtained in order to prevent an interruption to milling operations at the GMC; |
| ¢ | the Company is able to procure equipment and supplies and complete construction for the extension of the GMC tailings storage facility without any technical or other difficulties; |
| ¢ | the Company’s ability to comply with environmental, health and safety laws; |
| ¢ | the ability to attract and retain skilled staff; |
| ¢ | the ability to procure equipment and operating supplies and that there are no unanticipated material variations in the cost of energy or supplies; |
| ¢ | the ability to secure contracts for the sale of GMC’s concentrates; |
| ¢ | the execution and outcome of current or future exploration activities; |
| ¢ | the ability to obtain adequate financing for planned activities and to complete further exploration programs; |
| ¢ | the ability of contractors to perform their contractual obligations; |
| ¢ | metallurgical, environmental, legal, title, taxation, socio-economic, political, marketing or other issues will not materially affect the estimates of Mineral Resources or its future mining plans; and |
| ¢ | operations not being disrupted by issues such as workforce shortages, mechanical failures, labour or social disturbances, illegal occupations or mining, seismic events, and adverse weather conditions. |
These forward-looking statements involve known and unknown risks, uncertainties and other factors that may cause the actual results, performance or achievements expressed or implied by such forward-looking statements to be materially different. Such factors include, among others, risks and uncertainties relating to:
| Other Relevant Data and Information | 140 | Page |
NI 43-101 Technical Report | December 22, 2020 |
| ¢ | the Company may experience an increase in COVID-19 infection amongst its employees and contractors even with the adoption of enhanced safety protocols and safeguards; |
| ¢ | the Company cannot provide assurance that there will not be interruptions to its operations in the future as a result of COVID-19 including: (i) the impact restrictions that governments may impose or the Company voluntarily imposes to address COVID-19 which if sustained or resulted in a significant curtailment could have a material adverse impact on the Company’s production, revenue and financial condition and may materially impact the Company’s ability to meet its production guidance included herein and complete near-mine and regional exploration plans at Tucano; (ii) shortages of employees; (iii) unavailability of contractors and subcontractors; (iv) interruption of supplies and the provision of services from third parties upon which the Company relies; (v) restrictions that governments impose to address the COVID-19 outbreak; (vi) disruptions in transportation services that could impact the Company’s ability to deliver concentrates to refineries; (vii) restrictions that the Company and its contractors and subcontractors impose to ensure the safety of employees and others; and (viii) restrictions on operations imposed by governmental authorities; |
| ¢ | the Company’s ability to appropriately capitalize and finance its operations, including the risk that the Company is unable to access sources of capital which could require the Company to curtail capital and exploration program, and other discretionary expenditures; |
| ¢ | planned exploration activities may not result in the discovery of new Mineral Resources; |
| ¢ | the inherent risk that estimates of Mineral Resources may not be accurate and accordingly that mine production and recovery will not be as estimated or predicted; |
| ¢ | gold and silver prices may decline or may be less than forecasted or may experience unpredictable fluctuations; |
| ¢ | fluctuations in currency exchange rates (including the USD to MXN exchange rate) may increase costs of operations; |
| ¢ | risk in variation in production and costs as the GMC does not have established Mineral Reserves and Mineral Resources that are not Mineral Reserves have non demonstrated economic viability; |
| ¢ | challenging operational viability of Mexican operations; |
| ¢ | the Company’s ability to obtain all necessary permits, licenses and regulatory approvals for its operations in a timely manner, including the uncertainty regarding the timing and approval of the expansion of the existing GMC tailings storage facility (lifts 18 and 19), which if not granted, delayed or conditioned could result in an interruption to milling operations at the GMC which could adversely impact the Company’s revenues and financial condition; |
| ¢ | the alternative technical solution utilizing existing permits is not successful in extending the potential tailings capacity until CONAGUA expansion approval is obtained which could also result in an interruption to milling operations at the GMC; |
| ¢ | operational and physical risks inherent in mining operations (including pit wall collapses, tailings storage facility failures, environmental accidents and hazards, industrial accidents, equipment breakdown, unusual or unexpected geological or structural formations, cave-ins, flooding and severe weather) may result in unforeseen costs, shutdowns, delays in production and exposure to liability; |
| ¢ | potential political and social risks involving Great Panther’s operations in a foreign jurisdiction; |
| Other Relevant Data and Information | 141 | Page |
NI 43-101 Technical Report | December 22, 2020 |
| ¢ | the potential for unexpected and excessive costs and expenses and the possibility of project delays; |
| ¢ | employee and contractors relations; |
| ¢ | relationships with, and claims by, local communities; |
| ¢ | the Company’s ability to obtain and maintain all necessary permits, licenses and regulatory approvals in a timely manner, including the granting of permits for the GMC TSF in time which if not granted or conditioned could result in an interruption of operations and the ability to maintain those permits, licenses and regulatory approvals and the conditions required thereunder; |
| ¢ | changes in laws, regulations and government practices in the jurisdictions in which the Company operates; legal restrictions related to mining; |
| ¢ | diminishing quantities or grades of mineralization as properties are mined; |
| ¢ | operating or technical difficulties in mineral exploration and changes in project parameters as plans continue to be refined; |
| ¢ | acts of foreign governments; |
| ¢ | political risk; |
| ¢ | labour or social unrest; |
| ¢ | illegal mining, including the potential for safety and security risks related thereto; |
| ¢ | unanticipated operational difficulties due to adverse weather conditions, failure of plant or mine equipment and unanticipated events related to health, safety, and environmental matters; |
| ¢ | uncertainty of revenue, cash flows and profitability, the potential to achieve any particular level of recovery, the costs of such recovery, the rates of production and costs of production, where production decisions are not based on any feasibility studies of Mineral Reserves demonstrating economic and technical viability; |
| ¢ | cash flows may vary and the Company’s business may not generate sufficient cash flow from operations to enable it to satisfy its debt and other obligations; |
| ¢ | an unfavourable decision by the MEM with respect to the proposed modification to the Coricancha closure plan; |
| ¢ | reclamation costs exceed the amounts estimated; |
| ¢ | litigation risk; |
| ¢ | deterioration of general economic conditions, including increased volatility and global financial conditions; and |
| ¢ | the Company’s ability to operate as anticipated, |
and other risks and uncertainties, including those described in respect of Great Panther in its Annual Information Form (“AIF”) for the year ended December 31, 2019, and material change reports filed with the Canadian Securities Administrators available at www.sedar.com and reports on Form 40-F and Form 6-K filed with the SEC and available at www.sec.gov.
This list is not exhaustive of the factors that may affect any of the Company’s forward-looking statements or information. Forward-looking statements or information are statements about the future and are inherently uncertain, and actual achievements of the Company or other future events or conditions may differ materially from those reflected in the forward-looking statements or information.
| Other Relevant Data and Information | 142 | Page |
NI 43-101 Technical Report | December 22, 2020 |
Forward-looking statements are based on the assumptions, beliefs, expectations and opinions as of the date of this TR. The Company will update forward-looking statements and information if and when, and to the extent required by applicable securities laws. Readers should not place undue reliance on forward-looking statements. The forward-looking statements contained herein are expressly qualified by this cautionary statement.
| 24.2 | Cautionary Note to United States Investors Concerning Estimates of Measured, Indicated and Inferred Resources |
As a British Columbia corporation and a “reporting issuer” under Canadian securities laws, the Company is required to provide disclosure regarding its mineral properties in accordance with NI 43-101. NI 43-101 is a rule developed by the Canadian Securities Administrators that establishes standards for all public disclosure an issuer makes of scientific and technical information concerning mineral projects. In accordance with NI 43-101, the Company uses the terms Mineral Reserves and Resources as they are defined in accordance with the CIM Definition Standards on Mineral Reserves and Resources (the “CIM Definition Standards”) adopted by CIM.
The SEC has adopted amendments to its disclosure rules to modernize the mineral property disclosure requirements for issuers whose securities are registered with the SEC under the United States Securities Exchange Act of 1934 (the “U.S. Exchange Act”). These amendments became effective February 25, 2019 (the “SEC Modernization Rules”). The SEC Modernization Rules have replaced the historical property disclosure requirements for mining registrants that were included in SEC Industry Guide 7 (“Guide 7”) following a transition period. The Company is not required to provide disclosure on its mineral properties under the SEC Modernization Rules as the Company is presently a “foreign issuer” under the U.S. Exchange Act and entitled to file continuous disclosure reports with the SEC under the multijurisdictional disclosure system (“MJDS”) adopted by Canada and the United States.
The SEC Modernization Rules include the adoption of terms describing Mineral Reserves and Mineral Resources that are substantially similar to the corresponding terms under the CIM Definition Standards. As a result of the adoption of the SEC Modernization Rules, SEC will now recognize estimates of Measured Mineral Resources, Indicated Mineral Resources and Inferred Mineral Resources. In addition, the SEC has amended its definitions of Proven Mineral Reserves and Probable Mineral Reserves to be substantially similar to the corresponding CIM Definitions.
United States investors are cautioned that while the terms used in the SEC Modernization Rules are “substantially similar” to CIM Definition Standards, there are differences in the definitions under the SEC Modernization Rules and the CIM Definition Standards. Accordingly, there is no assurance any Mineral Resources that the Company may report as “measured mineral resources”, “indicated mineral resources” and “inferred mineral resources” under NI 43-101 would be the same had the Company prepared the resource estimates under the standards adopted under the SEC Modernization Rules. United States investors are also cautioned that while the SEC will now recognize “measured mineral resources”, “indicated mineral resources” and “inferred mineral resources”, investors should not to assume that any part or all of the mineral deposits in these categories would ever be converted into a higher category of Mineral Resources or into Mineral Reserves. Mineralization described by these terms has a great amount of uncertainty as to their existence, and great uncertainty as to their economic and legal feasibility. Accordingly, investors are cautioned not to assume that any “measured mineral resources”, “indicated mineral resources”, or “inferred mineral resources” that the Company reports are or will be economically or legally mineable.
Further, “inferred resources” have a great amount of uncertainty as to their existence and as to whether they can be mined legally or economically. Therefore, United States investors are also cautioned not to assume that all or any part of the inferred resources exist. In accordance with Canadian securities laws, estimates of “inferred mineral resources” cannot form the basis of feasibility or other economic studies, except in limited circumstances where permitted under NI 43-101.
| Other Relevant Data and Information | 143 | Page |
NI 43-101 Technical Report | December 22, 2020 |
In addition, disclosure of “contained ounces” is permitted disclosure under Canadian regulations; however, the SEC has historically only permitted issuers to report mineralization as in place tonnage and grade without reference to unit measures
| Other Relevant Data and Information | 144 | Page |
NI 43-101 Technical Report | December 22, 2020 |
| 25.0 | Interpretation and Conclusions |
| ¢ | The drill sampling and logging employed by Great Panther are appropriate for the deposit type and mineralization style. Reasonable and practical steps are taken to ensure security of the samples. |
| ¢ | The channel samples are lower in quality than the drill samples owing to the method used to collect them. |
| ¢ | The assaying is being conducted in an acceptable manner, using common industry-standard methods. The performance of the Guanajuato site laboratory, operated by SGS to the end of 2018 and by the Company there-after, is monitored by both internal and external Quality Assurance/Quality Control (QA/QC) programs. |
| ¢ | The QA/QC monitoring is required monthly. Care must be taken in the labelling and insertion of blanks and standards so there are no mix-ups. |
| ¢ | The database was reasonably free of errors, and appropriate for use in estimation of Mineral Resources. Appropriate safeguards are in place to ensure that the database is secure. |
| ¢ | Presently, the GMC processing plant at Guanajuato processes mined mineralization from San Ignacio and limited ore from Guanajuato. Guanajuato was on C&M since January 1, 2019 until July 2019, and presently operates with limited stoping of remnants and mining of ore drives. |
| ¢ | The plant has been operating at a reduced rate of approximately 20 days per month (4-5 day batches) since the beginning of 2019, with an overall average production rate of approximately 779 tonnes per operating day (combined feed from Guanajuato and San Ignacio). Overall blended recoveries for the reporting period (August 1, 2019 - July 31, 2020) have been 85.2% for silver and 84.3% for gold. Concentrates are shipped to ports in Mexico. |
| 25.1 | Guanajuato |
| ¢ | The geology includes the juxtaposition of Oligocene age sedimentary and volcanic rocks onto Mesozoic age sedimentary and intrusive rocks along the “Veta Madre”, a 25 km long, northwest trending, 45-degree south west dipping normal fault with associate intrusive dykes. |
| ¢ | Mineralization occurs in structurally complex multi-generational vein quartz dominated stockwork and breccia zones along the Veta Madre. Structural geology mapping indicates that up to eight cross-cutting breccia events occur with associated precious metal mineralization. Fluid inclusion studies reflect the complex structural history with boiling (indicative event associated with precious metal deposition) occurring from the 2100 to 1500masl elevations (surface to the deepest levels drilled) in Guanajuato. As such, the potential to find further mineralization both laterally and in parallel breccia structures to know precious metal mineralization zones is considered excellent by the author. |
| ¢ | Seven mineralized areas (34 block models) comprising the resource models are defined as Cata, Los Pozos, Santa Margarita, San Cayetano, Promontorio, Valenciana, and Guanajuatito. |
| ¢ | Guanajuato contains estimated Measured and Indicated Mineral Resources of 433,953 tonnes above varying US$ NSR full operational cost cut-offs, at an average grade of 249g/t silver and 1.64g/t gold, for a total of 5,529,111 Ag eq oz or 61,435 Au eq oz. This includes Measured Mineral Resources of 286,139 tonnes at an average grade of 253g/t silver and 1.63g/t gold, for a total of 3,677,663 Ag eq oz or 40,863 Au eq oz and Indicated Mineral Resources of 147,814 tonnes at an average grade of 241g/t silver and 1.65g/t gold, for a total of 1,851,448 Ag eq oz or 20,572 Au eq oz. In addition, estimated Inferred Mineral Resources are 460,174 tonnes at an average grade of 220g/t silver and 2.07g/t gold, for 6,020,031 Ag eq oz or 66,889 Au eq oz. |
| Interpretation and Conclusions | 145 | Page |
NI 43-101 Technical Report | December 22, 2020 |
| ¢ | Overall Measured and Indicated Resource tonnes increased 26% or ~90,200 tonnes with a coincident increase of Ag eq oz of 47% or ~1,780,000 Ag eq oz. This increase in both Measured and Indicated Resources, as well as Inferred Resources reflect a successful core drilling campaign in the Promontorio, Los Pozos, and Valenciana areas in 2019 and 2020; minor mine depletion (19,252 tonnes grading 196g/t Ag and 1.22g/t Au for a gross 0.19M Ag eq oz); variably changing area cut-offs in 2020; and higher metal prices. |
| ¢ | If Mineral Resources are developed in areas with historical mine workings, such as in the Los Pozos / Promontorio area of Guanajuato they are classified only as Inferred, until such work is done to establish the extent of historical mining. |
| ¢ | There is potential for further additions to the Mineral Resource estimates both in the zones estimated in this report and through diligent exploration. The exploration is presently better defining the Los Pozos, Promontorio, and Valenciana zones, as well as locating new areas of mineralization between the Guanajuatito and Valenciana areas. |
| ¢ | Mining operations were underway on the Guanajuatito, Valenciana, Promontorio, and Los Pozos deposits using mechanized equipment in the stopes and truck haulage along the 345 level to move ore to the Cata shaft for hoisting to surface. At Guanajuatito the ore is hauled to surface by rubber-tired trucks. The equipment and mining methods are appropriate for the deposits. |
| 25.2 | San Ignacio |
| ¢ | The area in which the San Ignacio mine is located has a long history of mining dating back to 1548. There are numerous historical workings on the property and as such, there is a likelihood that Great Panther could successfully explore for additional Mineral Resources. |
| ¢ | The San Ignacio property is underlain by a monotonous package of basalt and andesite volcanic rocks belonging to the lower Cretaceous La Luz andesite (Randall R. et al., 1994; Stewart, 2006; Baker, 2011). The basalt generally has subtle to well-developed pillow structures that are locally flattened. In a few localities, inter-pillow hyaloclastite is present and is characterized by a fine breccia composed of devitrified glass shards in a fine groundmass. Primary layering and tops-up indicators are generally difficult to determine from the small outcrops typical of the property, but according to Stewart (2006), the San Ignacio property stratigraphy is not overturned. |
| ¢ | Some of the La Luz zone structures cross the San Ignacio property and consists of numerous mineralized fractures in a north-westerly-trending orientation, which extend for a known strike of approximately 8 km. Historically productive veins on the property include Veta Melladito, and Veta Purisima. Veins identified in the recent Great Panther drilling are the Melladito, Melladito BO, Intermediate, Intermediate 2, Nombre de Dios, Nombre de Dios 1.5, Nombre de Dios 2, Nombre de Dios 2S, Nombre de Dios 3, Melladito South, 700, Purisima, Purisima Bo, Purisima Int., Santo Nino, and the Purisima HW. Mineralization is contained within tabular veins, vein stockwork, and breccias. The sixteen veins have geological continuity inferred from surface mapping and diamond drilling from surface, and now with extensive underground development, have been defined up to 2,200 meters along strike and 150 meters down dip. |
| ¢ | The drilling of 491 diamond drill holes on the San Ignacio property delineated sixteen mineralized epithermal veins with the primary commodities of economic importance being silver and gold. The mineralization is open along the Purisima vein system, most notably in parallel structures. |
| Interpretation and Conclusions | 146 | Page |
NI 43-101 Technical Report | December 22, 2020 |
| ¢ | Presently the Company is exploiting the Intermediate, Nombre de Dios, and Melladito zones, where from inception in 2013, a total of 1,012,045 tonnes has been mined (to end of July 2020) grading 118g/t silver and 2.83g/t gold. |
| ¢ | San Ignacio contains estimated Measured and Indicated Mineral Resources of 387,898 tonnes above a US$100/tonne NSR cut-off, at an average grade of 142g/t silver and 2.56/t gold, for a total of 4,642,801 Ag eq oz. This includes Measured Mineral Resources of 314,802 tonnes at an average grade of 142g/t silver and 2.64g/t gold, for a total of 3,842,38 Ag eq oz and Indicated Mineral Resources of 387,898 tonnes at an average grade of 144g/t silver and 2.19g/t gold, for a total of 800,416 Ag eq oz. In addition, estimated Inferred Mineral Resources are 992,835 tonnes at an average grade of 169g/t silver and 2.33g/t gold, for 12,089,792 Ag eq oz. |
| ¢ | For Measured and Indicated Resources, there is a 7% decrease in contained Ag eq oz over the previous year's estimate. For Inferred, there is a 106% increase in contained Ag eq oz from the previous year's estimate. This decrease in Measured and Indicated Resources is due to mine depletion, offset by higher metal prices. Extensive infill and expansion drilling allowed for the increase in Inferred Resources with the addition of five veins, along with high metal prices. |
| ¢ | If Mineral Resources are developed in areas with historical mine workings, such as in the Purisima / Melladito South area of San Ignacio, they are classified only as Inferred, until such work is done to establish the extent of historical mining. |
| Interpretation and Conclusions | 147 | Page |
NI 43-101 Technical Report | December 22, 2020 |
| 26.0 | Recommendations |
The 2020-2021 (August 2020 to December 2021) exploration budget recommended for Guanajuato Mine Complex is estimated at US$4,055,000 and includes 36,500 meters of core drilling (see Table 26.1).
Recommendations are that Great Panther continues present levels of exploration at Guanajuato in current and other prospective areas to define further Mineral resources to increase production. Mineral Resources that are not Mineral Reserves have no demonstrated economic viability.
The exploration includes core drilling, detailed rehabilitation of old levels, historical data re-evaluation, geological mapping and interpretation, and re-sampling in old-mined areas, and along and down dip of past mining. During 2020 an ongoing drill program detailed the Los Pozos, Promontorio, and Valenciana areas along the Veta Madre and parallel structures, and as such an underground drill program of 22,000 meters is recommended. For 2020-2021 the exploration program should continue with in-fill drilling in the Pozos and Promontorio areas, and evaluations starting in the upper Cata, Cata to Valenciana and Valenciana to Guanajuatito areas. The budget for this program is summarized in Table 26.1, and includes 22,000 of drilling and compilation, sampling and geological work for upper mine areas that can be safely re-opened, totalling US$2,351,000.
Recommendations are that Great Panther continues mining operations at San Ignacio. For 2020-2021 recommendations also include a concerted effort focused on detail in-fill drilling the Melladito South, Purisima, and Nombre de Dios veins is essential and as such an underground drill program of 3,500 metres is recommended. Surface drilling for 2020-2021 is budgeted at 11,000 metres and will focus on detailing areas south of present mining along the Melladito and Purisima vein structures in the San Pedro and Mexiamora areas, and on targeting exploration targets along the Purisima vein system and parallel structures. At $120 cost per month/meter, the estimated budget for this program is US$1,704,000 (Table 26.1).
Table 26.1: 2020-2021 Budget for Proposed Exploration, GMC (San Ignacio and Guanajuato)
| Project | Type | Months / Meters | Cost per month and /or meter US$ | Cost US$ |
| 2020 - 2021 Guanajuato | Compilation, Sampling, Geology | 5 | $11,000 | $55,000 |
| Compilation, Sampling, Geology | 12 | $4,000 | $48,000 | |
| Drilling, BQ & NQ (core all-in costs) | 22,000 | $100 | $2,200,000 | |
| Guanajuato total | 22,000m | $2,351,000 | ||
| 2020 - 2021 San Ignacio | Compilation, Sundry, Planning | 17 | $2,000 | $34,000 |
| Underground Drilling | 3,500 | $100.00 | $350,000 | |
| Surface Drilling | 11,000 | $120 | $1,320,000 | |
| San Ignacio Total | 14,500m | $1,704,000 | ||
| Grand Total | 36,500m | $4,055,000 |
| Recommendations | 148 | Page |
NI 43-101 Technical Report | December 22, 2020 |
| 27.0 | References |
Baker D., 2011, Geology and Structure Report on the San Ignacio project Guanajuato Mexico. Prepared for Great Panther Silver Limited by Equity Exploration Consultants Ltd.
Barclay, W.A., 2007, continued Structural Geology at Mina San Vicente, Level 100 NTE; Guanajuato, GTO, Mexico; Independent report for Minera Mexicana el Rosario and for Great Panther Resources, dated January 9, 2007: 7pp + figures.
Brown, R.F., and Nourpour, M., 2020, NI 43-101 Mineral Resource Update Technical Report on the Guanajuato Mine Complex, San Ignacio Mine, Guanajuato State, Mexico, prepared for Great Panther Mining Limited, dated March 17, 2020: 90pp + figures.
Brown, R.F., and Nourpour, M., 2020, NI 43-101 Mineral Resource Update Technical Report on the Guanajuato Mine Complex, Guanajuato Mine, Guanajuato State, Mexico, prepared for Great Panther Mining Limited, dated March 27, 2020: 101pp + figures.
Brown, R.F., 2017, NI43-101 Technical Report on the Guanajuato Mine Complex claims and Mineral Resource Estimations for the Guanajuato Mine, San Ignacio Mine, and El Horcon and Santa Rosa Projects, as of August 31, 2016, dated February 20, 2017: 221pp + figures.
Brown, R.F., 2016, NI43-101 Technical Report on the Guanajuato Mine Complex claims and Mineral Resource Estimations for the Guanajuato Mine, San Ignacio Mine, and El Horcon Project, as of July 31, 2015, dated February 25, 2016 and Amended October 27, 2016: 217pp + figures.
Brown, R.F., 2015, NI43-101 Technical Report on the Guanajuato Mine Complex claims and Mineral Resource Estimations for the Guanajuato Mine, San Ignacio Mine, and El Horcon Project, as of July 31, 2014, dated February 25, 2015: 207pp + figures.
Brown, R.F., 2014, NI43-101 Technical Report on the Guanajuato Mine Complex claims and Mineral Resource Estimations for the Guanajuato Mine, San Ignacio Mine, and El Horcon Project, as of July 31, 2014, dated August 16, 2014: 213pp + figures.
Brown, R.F., 2012, NI43-101 Report on the Guanajuatito Mine Complex Mineral Resource Estimate for the Guanajuatito, Cata, Los Pozos, and Santa Margarita Zones, as of January 31st, 2012, (June 26, 2012). Un-published internal Great Panther report.
Brown, R.F., and Sprigg, L., 2013, NI43-101 Report on the Guanajuato Mine Complex Resource Estimation for the Guanajuatito, Valenciana, Cata, Los Pozos, Santa Margarita, San Cayetano, and Promontorio zones as of July 31st, 2013: 122pp + figures.
CIBC Forecast 2020. CIBC Global Mining Group, Analyst Consensus Commodities Price Forecast, June 30, 2020
CIM 2019. CIM Estimation of Mineral Resources and Mineral Reserves Best Practice Guidelines. 75 p.
CIM. 2014. CIM Definition Standards - for Mineral Resources and Mineral Reserves. CIM Standing Committee on Reserve Definitions. 10 p.
| References | 149 | Page |
NI 43-101 Technical Report | December 22, 2020 |
CIM. 2000. Exploration Best Practices Guidelines. 3 p.
Endeavour Silver Corp. (2020). Endeavour Silver Produces 4,018,735 Oz Silver And 38,907Oz Gold (7.1 Million Oz Silver Equivalents) In 2019. Retrieved from https://edrsilver.com/English/news (January 10, 2020).
Endeavour Silver Corp. (2017). Endeavour Silver Produces 5.4 Million oz Silver and 57,375 oz Gold in 2016. Retrieved from http://edrsilver.com/news/2017/index.php?content_id=576 (January 10, 2017).
Great Panther Mining Limited. (2020). Great Panther Reports Second Quarter Production of 38,540 Gold Equivalent Ounces, Including Record Monthly Gold Production at Tucano in June, and Updates 2020 Guidance Retrieved from http://www.greatpanther.com; July 9, 2020.
Great Panther Mining Limited Annual Reports for 2006 to 2019, inclusive; and Great Panther Corporate Presentation October2020 [PowerPoint slides]. Retrieved from http://www.greatpanther.com/ July 31, 2020.
Great Panther Silver Limited. (2010). Guanajuato Mine Complex item: Exploration Program & Resource Estimate. Retrieved from http://www.greatpanther.com; November 22, 2010.
Great Panther Silver Limited. (2017). Great Panther Silver Completes Acquisition of Coricancha Polymetallic Mine in Peru. Retrieved from http://www.greatpanther.com; July 3, 2017.
Guanajuato Municipality Population, (2015). Retrieved from http://citypopulation.info/php/mexico-admin.php?adm2id=11015 (January 5, 2018).
Historical climate data for Guanajuato City, (2018). Retrieved from http://www.weatherbase.com/weather/weather.php3?s=765770&cityname=Guanajuato-Guanajuato-Mexico (January 5, 2018).
Johnson, W.M., PhD, FCIC, 2013, Quality Analysis Consultants, Report of January 7th to 11th, 2013 Visit, 17pp
Moncada, D., Mutchler, S., Nieto, A., Reynolds, T.J., Rimstidt, J.D., Bodnar, R.J., 2011, Mineral textures and fluid inclusion petrography of the epithermal Ag–Au deposits at Guanajuato, Mexico: Application to exploration; Journal of Geochemical Exploration 114 (2012) 20–35.
Randall, R.J.A., Saldana, E., Clark, K.F., 1994. Exploration in a Volcano-Plutonic centre at Guanajuato, Mexico. Econ. Geol. 89, 1722-1751.
Rennie, D.W., Bergen, R.D., 2011, Technical Report on The Guanajuato Mine, Guanajuato State, Mexico, Scott Wilson Roscoe Postle Associates Inc. Prepared for Great Panther Resources Limited, dated January 2011, 135pp+appendices.
Ross, K., 2013, Petrographic Report on samples from the Veta Madre and San Ignacio vein systems, Guanajuato District. Prepared for Great Panther Silver Limited by Panterra Geoservices Inc., 126 pp.
Rhys, D., 2013, Structural Settings and Style of Vein Systems in the Central Guanajuato District. Internal report for Great Panther Resources Limited, dated May 2013: 100pp+appendices.
| References | 150 | Page |
NI 43-101 Technical Report | December 22, 2020 |
Servicio Geologico Mexicano, 1999. Carta Geologico-Minera, Guanajuato F14-C42, 1: 50,000 regional geology map.
Servicio Geologico Mexicano, 1998. Carta Geologico-Minera, Guanajuato F14-C43, 1: 50,000 regional geology map.
Sinclair, A.J., Blackwell, G.H., Cambridge, 2002, Applied Mineral Inventory Estimation, 381pp.
Stewart, M., 2006, 2006 report on surface mapping – lithostratigraphy, geology and structure of the Guanajuato area: results of mapping and analysis. Internal report for Great Panther Resources Limited, dated March 2006: 26pp+appendices.
Waldegger, M.F., and Brown, R.F., 2014, Technical Report on the San Ignacio Project Mineral Resource, Guanajuato State, Mexico, dated August 6, 2014. Prepared for Great Panther Silver Limited by MFW Geoscience Inc. and Brown, R., of Great Panther Silver Limited. 63pp + figures.
Wardrop Engineering., 2009, Technical Report on the Cato Clavo Zone, Guanajuato Mine Property, Mexico, prepared for Great Panther Resources (October 14, 2009).
Wunder, M.C., 2018, NI 43-101 Mineral Resource Update Technical Report on the Guanajuato Mine Complex, Guanajuato Mine, Guanajuato State, Mexico, dated February 28, 2018: 191pp + figures.
| References | 151 | Page |
NI 43-101 Technical Report | December 22, 2020 |
| 28.0 | Other Relevant Documents |
Barclay, W.A., 2006, Preliminary structural geology at the Mina San Vicente and part of the contiguous surface area, Guanajuato, GTO, Mexico. Independent report for Minera Mexicana el Rosario and for Great Panther Resources, dated July 17, 2006: 24pp + figures.
Cavey, G., and Gunning, D., 2005, Technical Report on the Santa Fe Project Guanajuato, Mexico for Great Panther Resources Limited, October 14, 2005, internal report to Great Panther Resources Limited, 50 pp.
Glen R. Clark & Associates Limited, 2009, Review of Resources and Reserves El Cubo Gold-Silver Mine, Guanajuato, Mexico, prepared for Gammon Gold Inc. (October 15, 2009), 90 pp.
Guanajuato Mine Site Monthly production reports to July 2014.
Ferrari, L., Pasquarè, G., Venegas-Salgado, S., Romero-Rios, F., 1999, Geology of the western Mexican Volcanic Belt and adjacent Sierra Madre Occidental and Jalisco block, Geological Society of America Special Paper 334, 19 pp.
JRT Geoengineering, October 2008, Site Inspection report and Review of Mining Geotechnics.
Lewis W.J., Murahwi C.Z., and Leader R.J., 2011, NI 43-101 Technical Report Audit of the Resources and Reserve Estimates for the Guanajuato Mines Project, Guanajuato State, Mexico. Prepared for Endeavour Silver by Mincon International Limited
Moncada, D., and Bodnar, R.J., 2012, Gangue mineral textures and fluid inclusion characteristics of the Santa Margarita Vein in the Guanajuato Mining District, Mexico; in Central European Journal of Geosciences, DOI: 10.2478/s13533-011-0057-8, 12pp.
Micon International Limited, 2010, NI43-101 Technical Report Audit of the Resource and Reserve Estimates for the Guanajuato Mines Project, Guanajuato State, Mexico.
Servicio Geologico Mexicano, 1997. Carta Geologico-Minera, Guanajuato F14-7, 1: 250,000 regional geology map.
Smith J., 2011, Technical Report on the San Ignacio Project Mineral Resource Guanajuato, Mexico. Prepared for Great Panther Silver Limited by Janelle Smith AIG.
Tosney, R, 2010, Technical Review of the Guanajuato Mine Rock Stability
Velazquez P., 1973. A Study of the Possibility that the Luz Mineral Camp of Guanajuato can be a Resurgent Producer of Silver and Gold. Submitted as part of a Thesis requirement at the University of Guanajuato School of Mining and Metallurgy.
Waldegger M.F., 2012, Technical Report on the San Ignacio Project Mineral Resource Guanajuato State, Mexico. Prepared for Great Panther Silver Limited by MFW Geoscience Inc.
| Other Relevant Documents | 152 | Page |