UNITED STATES
SECURITIES AND EXCHANGE COMMISSION
Washington, DC 20549
FORM N-CSR
CERTIFIED SHAREHOLDER REPORT OF REGISTERED
MANAGEMENT INVESTMENT COMPANIES
Investment Company Act file number: 811-21622
Thrivent Financial Securities Lending Trust
(Exact name of registrant as specified in charter)
625 Fourth Avenue South
Minneapolis, Minnesota 55415
(Address of principal executive offices) (Zip code)
John L. Sullivan, Assistant Secretary
625 Fourth Avenue South
Minneapolis, Minnesota 55415
(Name and address of agent for service)
Registrant’s telephone number, including area code: (612) 844-5704
Date of fiscal year end: October 31
Date of reporting period: April 29, 2011
| Item 1. | Report to Stockholders |
Semiannual Report
APRIL 29, 2011
Thrivent Financial
Securities Lending Trust
Table of Contents
THRIVENT FINANCIAL SECURITIES LENDING TRUST
William D. Stouten, Portfolio Manager
Thrivent Financial Securities Lending Trust seeks to maximize current income to the extent consistent with the preservation of capital and liquidity and to maintain a stable $1.00 per share net asset value by investing in dollar-denominated securities with a remaining maturity of 397 days or less.
The primary challenge in managing the Trust is the low-yield environment. Decreased demand for borrowing securities combined with the low-yield environment has kept balances in the Trust relatively low. The combination of low yields and less demand to borrow securities has also resulted in compressed spreads and lower profitability throughout the securities-lending industry. The changes in the Federal Deposit Insurance Corporation’s fee calculation that took effect on April 1, 2011, contributed, in our belief, to downward pressure on yields. This FDIC change lowered bank repurchase agreement (repo) volumes, which resulted in lower repo rates across the industry. To enhance yield and reduce transaction costs, the Trust continued to rely on a heavy concentration of floating-rate and variable-rate notes.
Liquidity and credit quality for the Trust remained strong. During the period, the Trust was conservatively invested with at least 60% of its net assets directly in U.S. government obligations or U.S. government-supported securities by the end of the period. We also kept the Trust’s weighted average maturity (WAM) shorter, averaging approximately 20 days during the six-month period. The combination of mostly government securities and a short WAM provided significant liquidity that would be available in times of volatility. As in any interest rate environment, we intend to maintain a defensive portfolio stance for the Trust that seeks to maximize safety and liquidity. An investment in the Trust is not insured or guaranteed by the FDIC or any other government agency. Although the Trust seeks to preserve the value of your investment at $1.00 per share, it is possible to lose money by investing in the Trust.
Thrivent Financial Securities Lending Trust
As of April 29, 2011*
| | | | |
7-Day Yield | | | 0.14 | % |
7-Day Yield Gross of Waivers | | | 0.75 | % |
7-Day Effective Yield | | | 0.14 | % |
7-Day Effective Yield Gross of Waivers | | | 0.75 | % |
Average Annual Total Returns**
| | | | | | | | | | | | |
For the Period Ended April 29, 2011 | | 1-Year | | | 5-Year | | | Since Inception,
9/16/2004 | |
Total Return | | | 0.22 | % | | | 2.50 | % | | | 2.70 | % |
| * | Seven-day yields of the Thrivent Financial Securities Lending Trust refer to the income generated by an investment in the Trust over a specified seven-day period. Effective yields reflect the reinvestment of income. A yield gross of waivers represents what the yield would have been if the investment adviser were not waiving or reimbursing certain expenses. Yields are subject to daily fluctuation and should not be considered an indication of future results. |
| ** | Average annual total returns represent past performance and reflect changes in share prices, the reinvestment of all dividends and capital gains, and the effects of compounding. The returns shown do not reflect taxes a shareholder would pay on distributions or redemptions. |
Past performance is not an indication of future results. Current performance may be lower or higher than the performance data quoted. Total investment return and principal value of your investment will fluctuate, and your shares, when redeemed, may be worth more or less than their original cost. The prospectus contains more complete information on the investment objectives, risks, charges and expenses of the Trust, which investors should read and consider carefully before investing.
1
Shareholder Expense Example
(Unaudited)
As a shareholder of the Trust, you incur ongoing costs, including management fees and other Trust expenses. This Example is intended to help you understand your ongoing costs (in dollars) of investing in the Trust and to compare these costs with the ongoing costs of investing in other mutual funds. The Example is based on an investment of $1,000 invested at the beginning of the period and held for the entire period from November 1, 2010 through April 29, 2011.
Actual Expenses
In the table below, the first line provides information about actual account values and actual expenses. You may use the information in this line, together with the amount you invested, to estimate the expenses that you paid over the period. Simply divide your account value by $1,000 (for example, an $8,600 account value divided by $1,000 = 8.6), then multiply the result by the number in the first line under the heading entitled “Expenses Paid during Period” to estimate the expenses you paid on your account during the period.
Hypothetical Example for Comparison Purposes
In the table below, the second line provides information about hypothetical account values and hypothetical expenses based on the Trust’s actual expense ratio and an assumed rate of return of 5% per year before expenses, which is not the Trust’s actual return. The hypothetical account values and expenses may not be used to estimate the actual ending account balance or expenses you paid for the period. You may use this information to compare the ongoing costs of investing in the Trust and other funds. To do so, compare this 5% hypothetical example with the 5% hypothetical example that appears in the shareholder reports of the other funds.
| | | | | | | | | | | | | | | | |
| | | Beginning Account
Value 11/1/2010 | | | Ending Account Value
4/29/2011 | | | Expenses Paid During
Period 11/1/2010 -
4/29/2011* | | | Annualized Expense
Ratio | |
Thrivent Financial Securities Lending Trust | | | | | | | | | | | | | |
Actual | | $ | 1,000 | | | $ | 1,001 | | | $ | 0.25 | | | | 0.05 | % |
Hypothetical** | | $ | 1,000 | | | $ | 1,024 | | | $ | 0.25 | | | | 0.05 | % |
| * | Expenses are equal to the Fund’s annualized expense ratio, multiplied by the average account value over the period, multiplied by 180/365 to reflect the one-half year period. |
| ** | Assuming 5% annualized total return before expenses. |
2
Thrivent Financial Securities Lending Trust
Schedule of Investments as of April 29, 2011
(unaudited)
| | | | | | | | |
Principal
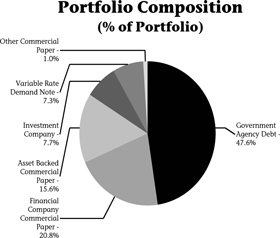
Amount | | | Asset Backed Commercial Paper (15.7%)a | | Value | |
| | | | Bryant Park Funding, LLC | | | | |
| $ | 4,111,000 | | | 0.120%, 5/2/2011b | | $ | 4,110,973 | |
| | | | Dealers Capital Access | | | | |
| | 22,000,000 | | | 0.300%, 5/2/2011b | | | 21,999,633 | |
| | | | Golden Funding Corporation | | | | |
| | 5,001,000 | | | 0.220%, 5/4/2011b | | | 5,000,878 | |
| | | | Old Line Funding Corporation | | | | |
| | 33,370,000 | | | 0.100%, 5/2/2011b | | | 33,369,815 | |
| | | | Straight-A Funding, LLC | | | | |
| | 10,000,000 | | | 0.100%, 5/2/2011b | | | 9,999,945 | |
| | 5,000,000 | | | 0.100%, 5/3/2011b | | | 4,999,958 | |
| | 8,000,000 | | | 0.250%, 5/5/2011b | | | 7,999,723 | |
| | 10,000,000 | | | 0.250%, 5/10/2011b | | | 9,999,305 | |
| | 10,000,000 | | | 0.250%, 6/6/2011b | | | 9,997,430 | |
| | 10,000,000 | | | 0.200%, 6/20/2011b | | | 9,997,167 | |
| | 15,000,000 | | | 0.190%, 6/22/2011b | | | 14,995,804 | |
| | 13,000,000 | | | 0.200%, 7/7/2011b | | | 12,995,089 | |
| | | | | | | | |
| | | | Total Asset Backed Commercial Paper | | | 145,465,720 | |
| | | | | | | | |
| | |
Principal
Amount | | | Financial Company Commercial Paper (21.2%)a | | Value | |
| | | | Alliancebernstein | | | | |
| | 35,000,000 | | | 0.110%, 5/2/2011 | | | 34,999,786 | |
| | 10,000,000 | | | 0.140%, 5/3/2011 | | | 9,999,883 | |
| | | | BNP Paribas | | | | |
| | 36,370,000 | | | 0.080%, 5/2/2011 | | | 36,370,000 | |
| | | | Citigroup Funding, Inc. | | | | |
| | 10,238,000 | | | 1.375%, 5/5/2011b | | | 10,239,669 | |
| | | | Citigroup, Inc. | | | | |
| | 15,000,000 | | | 1.031%, 12/9/2011b,c,d | | | 15,077,850 | |
| | | | Rabobank Nederland NV/NY | | | | |
| | 8,300,000 | | | 0.320%, 12/6/2011b,d | | | 8,300,000 | |
| | | | Societe Generale North America, Inc. | | | | |
| | 40,000,000 | | | 0.090%, 5/2/2011 | | | 40,000,000 | |
| | 8,000,000 | | | 0.130%, 5/2/2011b | | | 7,999,942 | |
| | 25,000,000 | | | 0.130%, 5/5/2011b | | | 24,999,549 | |
| | | | Toronto Dominion Holdings USA, Inc. | | | | |
| | 7,000,000 | | | 0.230%, 5/16/2011b | | | 6,999,284 | |
| | | | | | | | |
| | | | Total Financial Company Commercial Paper | | | 194,985,963 | |
| | | | | | | | |
| | |
Principal
Amount | | | Government Agency Debt (48.5%)a | | Value | |
| | | | Federal Agricultural Mortgage Corporation Discount Notes | | | | |
| | 14,000,000 | | | 0.140%, 5/12/2011b | | | 13,999,347 | |
| | | | Federal Farm Credit Bank | | | | |
| | 5,000,000 | | | 0.184%, 12/8/2011b,d | | | 4,999,696 | |
| | 4,000,000 | | | 0.524%, 1/13/2012b,d | | | 4,010,836 | |
| | 1,500,000 | | | 0.133%, 1/25/2012b,d | | | 1,499,911 | |
| | 15,000,000 | | | 0.173%, 7/20/2012b,d | | | 14,995,362 | |
| | 5,000,000 | | | 0.190%, 8/8/2012b,d | | | 4,999,239 | |
| | 10,000,000 | | | 0.234%, 11/13/2012b,d | | | 10,003,136 | |
| | | | Federal Home Loan Bank Discount Notes | | | | |
| | 8,000,000 | | | 0.162%, 5/11/2011b | | | 7,999,604 | |
| | | | Federal Home Loan Banks | | | | |
| | 30,000,000 | | | 0.184%, 5/2/2011b,d | | | 29,999,836 | |
| | 10,000,000 | | | 0.170%, 5/27/2011b,d | | | 10,000,000 | |
| | 10,000,000 | | | 0.131%, 7/11/2011b,d | | | 9,999,006 | |
| | 5,500,000 | | | 0.118%, 7/20/2011b,d | | | 5,499,710 | |
| | | | | | | | |
Principal
Amount | | | Government Agency Debt (48.5%)a | | Value | |
| $ | 5,000,000 | | | 0.133%, 8/26/2011b,d | | $ | 4,999,174 | |
| | 25,000,000 | | | 0.169%, 9/15/2011b,d | | | 24,998,566 | |
| | 9,000,000 | | | 0.170%, 9/20/2011b,d | | | 9,000,000 | |
| | 5,985,000 | | | 0.183%, 9/26/2011b,d | | | 5,985,240 | |
| | 10,000,000 | | | 0.237%, 10/6/2011b,d | | | 10,000,404 | |
| | 10,000,000 | | | 0.244%, 10/13/2011b,d | | | 10,002,783 | |
| | 10,000,000 | | | 0.190%, 2/2/2012b,d | | | 10,000,000 | |
| | 10,000,000 | | | 0.220%, 3/20/2012b,d | | | 9,999,097 | |
| | | | Federal Home Loan Mortgage Corporation | | | | |
| | 6,272,000 | | | 0.150%, 6/21/2011b | | | 6,270,641 | |
| | 10,780,000 | | | 0.174%, 9/19/2011b,d | | | 10,777,822 | |
| | 5,995,000 | | | 0.183%, 9/26/2011b,d | | | 5,995,241 | |
| | 2,625,000 | | | 0.203%, 10/21/2011b,d | | | 2,625,854 | |
| | 3,640,000 | | | 0.213%, 10/26/2011b,d | | | 3,641,413 | |
| | 8,000,000 | | | 0.230%, 11/7/2011b,d | | | 7,998,942 | |
| | 7,000,000 | | | 0.163%, 12/21/2011b,d | | | 6,997,694 | |
| | 5,200,000 | | | 0.161%, 12/29/2011b,d | | | 5,200,788 | |
| | 20,000,000 | | | 0.151%, 1/11/2012b,d | | | 19,993,744 | |
| | 22,000,000 | | | 0.090%, 1/13/2012b,d | | | 21,990,144 | |
| | 22,500,000 | | | 0.090%, 1/25/2012b,d | | | 22,481,934 | |
| | 5,500,000 | | | 0.191%, 2/10/2012b,d | | | 5,500,090 | |
| | 5,000,000 | | | 0.230%, 10/12/2012b,d | | | 4,999,264 | |
| | | | Federal National Mortgage Association | | | | |
| | 5,020,000 | | | 0.125%, 5/2/2011b | | | 5,019,965 | |
| | 10,600,000 | | | 0.174%, 9/19/2011b,d | | | 10,599,311 | |
| | 10,140,000 | | | 0.233%, 8/23/2012b,d | | | 10,151,001 | |
| | 8,000,000 | | | 0.320%, 9/13/2012b,d | | | 8,002,209 | |
| | 8,000,000 | | | 0.246%, 9/17/2012b,d | | | 8,000,000 | |
| | 5,000,000 | | | 0.246%, 10/18/2012b,d | | | 4,998,506 | |
| | 5,000,000 | | | 0.233%, 11/23/2012b,d | | | 4,997,611 | |
| | 8,000,000 | | | 0.290%, 11/23/2012b,d | | | 7,997,528 | |
| | | | Federal National Mortgage Association Discount Notes | | | | |
| | 12,726,000 | | | 0.170%, 5/4/2011b | | | 12,725,759 | |
| | 15,000,000 | | | 0.165%, 5/16/2011b | | | 14,998,900 | |
| | 30,703,000 | | | 0.167%, 6/20/2011b | | | 30,695,717 | |
| | | | | | | | |
| | | | Total Government Agency Debt | | | 445,651,025 | |
| | | | | | | | |
| | |
Shares | | | Investment Company (7.8%) | | Value | |
| | | | AIM Investments Institutional Government and Agency Portfolio | | | | |
| | 130,000 | | | 0.020% | | | 130,000 | |
| | | | BlackRock Cash Funds | | | | |
| | 30,002,000 | | | 0.180% | | | 30,002,000 | |
| | | | Dreyfus Institutional Cash Advantage Fund | | | | |
| | 17,220,000 | | | 0.130% | | | 17,220,000 | |
| | | | DWS Money Market Series | | | | |
| | 15,591,000 | | | 0.110% | | | 15,591,000 | |
|
| The accompanying Notes to the Financial Statements are an integral part of this schedule. |
Thrivent Financial Securities Lending Trust
Schedule of Investments as of April 29, 2011
(unaudited)
| | | | | | | | |
Shares | | | Investment Company (7.8%) | | Value | |
| | | | Morgan Stanley Institutional Liquidity Funds | | | | |
| $ | 9,296,000 | | | 0.120% | | $ | 9,296,000 | |
| | | | | | | | |
| | | | Total Investment Company | | | 72,239,000 | |
| | | | | | | | |
| | |
Principal
Amount | | | Other Commercial Paper (1.0%)a | | Value | |
| | | | World Bank Discount Notes | | | | |
| | 9,000,000 | | | 0.210%, 6/10/2011 | | | 8,997,847 | |
| | | | | | | | |
| | | | Total Other Commercial Paper | | | 8,997,847 | |
| | | | | | | | |
| | |
Principal
Amount | | | Variable Rate Demand Note (7.4%)a | | Value | |
| | | | Denver, Colorado Airport System Revenue Bonds | | | | |
| | 8,000,000 | | | 0.240%, 5/6/2011b,d | | | 8,000,000 | |
| | | | Illinois Finance Authority Multifamily Housing Revenue Bonds (Villagebrook Apartments) | | | | |
| | 5,410,000 | | | 0.300%, 5/6/2011b,d | | | 5,410,000 | |
| | | | Lancaster County Nebraska Hospital Authority No. 1 | | | | |
| | 8,670,000 | | | 0.280%, 5/2/2011b,d | | | 8,670,000 | |
| | | | Overseas Private Investment Corporation | | | | |
| | 4,137,930 | | | 0.250%, 5/4/2011b,d | | | 4,137,930 | |
| | 9,122,807 | | | 0.250%, 5/4/2011b,d | | | 9,122,807 | |
| | 3,121,375 | | | 0.250%, 5/4/2011b,d | | | 3,121,375 | |
| | | | St. Cloud, Minnesota Health Care Refunding Revenue Bonds (CentraCare Health System) | | | | |
| | 5,935,000 | | | 0.240%, 5/6/2011b,d | | | 5,935,000 | |
| | | | Tarrant County Cultural Education Facilities Finance | | | | |
| | 15,000,000 | | | 0.280%, 5/2/2011b,d | | | 15,000,000 | |
| | 9,000,000 | | | 0.190%, 5/6/2011b,d | | | 9,000,000 | |
| | | | | | | | |
| | | | Total Variable Rate Demand Note | | | 68,397,112 | |
| | | | | | | | |
| | | | Total Investments (at amortized cost) 101.6% | | $ | 935,736,667 | |
| | | | | | | | |
| | | | Other Assets and Liabilities, Net (1.6)% | | | (15,060,612 | ) |
| | | | | | | | |
| | | | Total Net Assets 100.0% | | $ | 920,676,055 | |
| | | | | | | | |
| a | The interest rate shown reflects the yield, coupon rate or the discount rate at the date of purchase. |
| b | Denotes investments that benefit from credit enhancement or liquidity support provided by a third party bank, institution or government. |
| c | Denotes investments purchased on a when-issued or delayed delivery basis. |
| d | Denotes variable rate securities. Variable rate securities are securities whose yields vary with a designated market index or market rate. The rate shown is as of April 29, 2011. |
Cost for federal income tax purposes $ 935,736,667
|
| The accompanying Notes to Financial Statements are an integral part of this schedule. |
Thrivent Financial Securities Lending Trust
Schedule of Investments as of April 29, 2011
(unaudited)
Fair Valuation Measurements
The following table is a summary of the inputs used, as of April 29, 2011, in valuing Securities Lending Trust’s assets carried at fair value or amortized cost, which approximates fair value.
| | | | | | | | | | | | | | | | |
Investments in Securities | | Total | | | Level 1 | | | Level 2 | | | Level 3 | |
Asset Backed Commercial Paper | | | 145,465,720 | | | | – | | | | 145,465,720 | | | | – | |
Financial Company Commercial Paper | | | 194,985,963 | | | | – | | | | 194,985,963 | | | | – | |
Government Agency Debt | | | 445,651,025 | | | | – | | | | 445,651,025 | | | | – | |
Investment Company | | | 72,239,000 | | | | 72,239,000 | | | | – | | | | – | |
Other Commercial Paper | | | 8,997,847 | | | | – | | | | 8,997,847 | | | | – | |
Variable Rate Demand Note | | | 68,397,112 | | | | – | | | | 68,397,112 | | | | – | |
| | | | | | | | | | | | | | | | |
Total | | $ | 935,736,667 | | | $ | 72,239,000 | | | $ | 863,497,667 | | | $ | – | |
| | | | | | | | | | | | | | | | |
The accompanying Notes to the Financial Statements are an integral part of this schedule.
5
Thrivent Financial Securities Lending Trust
Statement of Assets and Liabilities
| | | | |
As of April 29, 2011 (unaudited) | | Securities
Lending Trust | |
| |
Assets | | | | |
Investments at cost | | $ | 935,736,667 | |
Investments in securities at value | | | 935,736,667 | |
Investments at Value | | | 935,736,667 | |
Cash | | | 3,692 | |
Dividends and interest receivable | | | 152,689 | |
Prepaid expenses | | | 7,483 | |
Total Assets | | | 935,900,531 | |
| |
Liabilities | | | | |
Distributions payable | | | 95,659 | |
Accrued expenses | | | 19,801 | |
Payable for investments purchased | | | 15,088,164 | |
Payable to affiliate | | | 20,852 | |
Total Liabilities | | | 15,224,476 | |
| |
Net Assets | | | | |
Capital stock (beneficial interest) | | | 920,671,286 | |
Accumulated undistributed net realized gain/(loss) | | | 4,769 | |
Total Net Assets | | $ | 920,676,055 | |
Shares of beneficial interest outstanding | | | 920,671,286 | |
Net asset value per share | | $ | 1.00 | |
The accompanying Notes to the Financial Statements are an integral part of this schedule.
6
Thrivent Financial Securities Lending Trust
Statement of Operations
| | | | |
For the six months ended April 29, 2011 (unaudited) | | Securities
Lending Trust | |
Investment Income | | | | |
Dividends | | $ | 45,339 | |
Interest | | | 850,636 | |
Total Investment Income | | | 895,975 | |
| |
Expenses | | | | |
Adviser fees | | | 174,039 | |
Administrative service fees | | | 45,000 | |
Audit and legal fees | | | 12,693 | |
Custody fees | | | 21,467 | |
Insurance expenses | | | 3,523 | |
Printing and postage expenses | | | 3,270 | |
Transfer agent fees | | | 20,804 | |
Trustees’ fees | | | 1,988 | |
Other expenses | | | 6,386 | |
Total Expenses Before Reimbursement | | | 289,170 | |
| |
Less: | | | | |
Reimbursement from adviser | | | (96,335 | ) |
Custody earnings credit | | | (24 | ) |
Total Net Expenses | | | 192,811 | |
Net Investment Income/(Loss) | | | 703,164 | |
Realized and Unrealized Gains/(Losses) | | | | |
Net realized gains/(losses) on: | | | 4,769 | |
Investments | | | | |
Net Realized and Unrealized Gains/(Losses) | | | 4,769 | |
| |
Net Increase/(Decrease) in Net Assets Resulting From Operations | | $ | 707,933 | |
The accompanying Notes to the Financial Statements are an integral part of this schedule.
7
Thrivent Financial Securities Lending Trust
Statement of Changes in Net Assets
| | | | | | | | |
| | | Securities Lending Trust | |
For the periods ended | | 4/29/2011
(unaudited) | | | 10/31/2010 | |
Operations | | | | | | | | |
Net investment income/(loss) | | $ | 703,164 | | | $ | 1,632,972 | |
Net realized gains/(losses) | | | 4,769 | | | | 5,215 | |
Net Change in Net Assets Resulting From Operations | | | 707,933 | | | | 1,638,187 | |
Distributions to Shareholders | | | | | | | | |
From net investment income | | | (703,164 | ) | | | (1,632,972 | ) |
From net realized gains | | | (5,215 | ) | | | (50,410 | ) |
Total Distributions to Shareholders | | | (708,379 | ) | | | (1,683,382 | ) |
| | |
Capital Stock Transactions | | | | | | | | |
Sold | | | 3,646,724,407 | | | | 7,406,733,557 | |
Redeemed | | | (3,505,448,669 | ) | | | (7,373,984,449 | ) |
Capital Stock Transactions | | | 141,275,738 | | | | 32,749,108 | |
| | |
Net Increase/(Decrease) in Net Assets | | | 141,275,292 | | | | 32,703,913 | |
Net Assets, Beginning of Period | | | 779,400,763 | | | | 746,696,850 | |
Net Assets, End of Period | | $ | 920,676,055 | | | $ | 779,400,763 | |
Accumulated Undistributed Net Investment Income/(Loss) | | $ | – | | | $ | – | |
| | |
Capital Stock Share Transactions | | | | | | | | |
Sold | | | 3,646,724,407 | | | | 7,406,733,557 | |
Redeemed | | | (3,505,448,669 | ) | | | (7,373,984,449 | ) |
| | | | | | | | |
Total Capital Stock Share Transactions | | | 141,275,738 | | | | 32,749,108 | |
| | | | | | | | |
The accompanying Notes to the Financial Statements are an integral part of this schedule.
8
Thrivent Financial Securities Lending Trust
Notes to Financial Statements
As of April 29, 2011
(unaudited)
(1) ORGANIZATION
Thrivent Financial Securities Lending Trust (the “Trust”) was organized as a Massachusetts Business Trust on August 4, 2004 and is registered as an open-end management investment company under the Investment Company Act of 1940. The Trust commenced operations on September 16, 2004. All investments in the Trust are by affiliates of the Trust. The Trust serves as an investment vehicle for cash collateral posted in exchange for loaned securities of mutual funds sponsored by Thrivent Financial for Lutherans, the Trust’s investment adviser (“Thrivent Financial” or the “Adviser”), and its affiliates. Deutsche Bank AG serves as the lending agent to this securities lending program.
Under the Trust’s organizational documents, its officers and trustees are indemnified against certain liabilities arising out of the performance of their duties to the Trust. In addition, in the normal course of business, the Trust enters into contracts with vendors and others that provide general damage clauses. The Trust’s maximum exposure under these contracts is unknown, as this would involve future claims that may be made against the Trust. However, based on experience, the Trust expects the risk of loss to be remote.
(2) SIGNIFICANT ACCOUNTING POLICIES
(A) Valuation of Investments – Securities are valued on the basis of amortized cost (which approximates market value), whereby a portfolio security is valued at its cost initially, and thereafter valued to reflect a constant amortization to maturity of any discount or premium. Investments in open-ended mutual funds are valued at their net asset value at the close of each business day. The Adviser follows procedures designed to maintain a constant net asset value of $1.00 per share.
Financial Accounting Standards Board (FASB) guidelines require increased fair value disclosure intended to improve the consistency and comparability of fair value measurements used in financial reporting. The guidelines define fair value, establish a framework for measuring fair value in U.S. Generally Accepted Accounting Principles (“GAAP”) and expand disclosures about fair value requirements. Various inputs are summarized in three broad levels: Level 1 includes quoted prices in active markets for identical securities, typically categorized in this level are U.S. equity securities, futures and options; Level 2 includes other significant observable inputs such as quoted prices for similar securities, interest rates, prepayment speeds and credit risk, typically categorized in this level are fixed income securities, international securities, swaps and forward contracts; and Level 3 includes significant unobservable inputs such as the Fund’s own assumptions and broker evaluations in determining the fair value of investments.
(B) Federal Income Taxes – The Trust intends to comply with the requirements of the Internal Revenue Code which are applicable to regulated investment companies and to
distribute substantially all of its taxable income to its shareholders. The Trust, accordingly, anticipates paying no Federal income taxes and no Federal income tax provision was recorded.
GAAP requires management of the Trust to make additional tax disclosures with respect to the tax effects of certain income tax positions, whether those positions were taken on previously filed tax returns or are expected to be taken on future returns. These positions must meet a “more likely than not” standard that, based on the technical merits of the position, would have a greater than 50 percent likelihood of being sustained upon examination. In evaluating whether a tax position has met the more-likely-than-not recognition threshold, management of the Trust must presume that the position will be examined by the appropriate taxing authority that has full knowledge of all relevant information.
Management of the Trust analyzed all open tax years, as defined by the statute of limitations, for all major jurisdictions. Open tax years are those that are open for examination by taxing authorities. Major jurisdictions for the Trust include U.S. Federal, Minnesota, Wisconsin, and Massachusetts as well as certain foreign countries. As of April 29, 2011, open U.S. Federal, Minnesota, Wisconsin, and Massachusetts tax years include the tax years ended October 31, 2007, through 2010. Additionally, as of April 29, 2011, the tax year ended October 31, 2006, is open for Wisconsin. The Trust has no examinations in progress and none are expected at this time.
As of April 29, 2011, management of the Trust has reviewed all open tax years and major jurisdictions and concluded that there is no effect to the Trust’s tax liability, financial position or results of operations. There is no tax liability resulting from unrecognized tax benefits related to uncertain income tax positions taken or expected to be taken in future tax returns. The Trust is also not aware of any tax positions for which it is reasonably possible that the total amounts of unrecognized tax benefits will significantly change in the next 12 months.
(C) Custody Earnings Credit – The Trust has a deposit arrangement with the custodian whereby interest earned on uninvested cash balances is used to pay a portion of custodian fees. This deposit arrangement is an alternative to overnight investments.
(D) Distributions to Shareholders – Net investment income is distributed to each shareholder as a dividend. Dividends from the Trust are declared daily and distributed monthly. Net realized gains from securities transactions, if any, are distributed at least annually after the close of the fiscal year.
(E) Repurchase Agreements – The Trust may engage in repurchase agreement transactions in pursuit of its investment objective. A repurchase agreement consists of a purchase and a simultaneous agreement to resell an
9
Thrivent Financial Securities Lending Trust
Notes to Financial Statements
As of April 29, 2011
(unaudited)
investment for later delivery at an agreed upon price and rate of interest. The Trust must take possession of collateral either directly or through a third-party custodian. If the original seller of a security subject to a repurchase agreement fails to repurchase the security at the agreed upon time, the Trust could incur a loss due to a drop in the value of the security during the time it takes the Trust to either sell the security or take action to enforce the original seller’s agreement to repurchase the security. Also, if a defaulting original seller filed for bankruptcy or became insolvent, disposition of such security might be delayed by pending legal action. The Trust may only enter into repurchase agreements with banks and other recognized financial institutions such as broker/dealers that are found by the Adviser to be creditworthy. During the six months ended April 29, 2011, the Trust engaged in this type of investment.
(F) Accounting Estimates – The preparation of financial statements in conformity with GAAP requires management to make estimates and assumptions that affect the reported amounts of assets and liabilities and disclosure of contingent assets and liabilities at the date of the financial statements and the reported amounts of income and expenses during the reporting period. Actual results could differ from these estimates.
(G) Other – For financial statement purposes, investment security transactions are accounted for on the trade date. Interest income is recognized on an accrual basis. Discount and premium are amortized over the life of the respective securities on the interest method. Realized gains or losses on sales are determined on a specific cost identification basis. GAAP requires permanent financial reporting and tax differences to be reclassified to trust capital. No reclassifications were necessary at April 29, 2011.
(3) FEES AND COMPENSATION PAID TO AFFILIATES
(A) Investment Advisory Fees – The Trust pays Thrivent Financial a fee for its advisory services. The annual rate of fees under the Investment Advisory Agreement is calculated at 0.045% of the average daily net assets of the Trust.
The Adviser has agreed to voluntarily reimburse the Trust for all expenses in excess of 0.05% of average daily net assets. This voluntary expense reimbursement may be discontinued by the Adviser at any time.
(B) Other Fees – The Trust has entered into an administration and accounting services agreement with Thrivent Financial pursuant to which Thrivent Financial provides certain administrative and accounting personnel and services. For the six months ended April 29, 2011, Thrivent Financial received aggregate fees for administrative and accounting personnel and services of $45,000 from the Trust.
Each Trustee who is not affiliated with the Adviser receives an annual fee from the Trust for services as a Trustee and is eligible to participate in a deferred compensation plan with respect to these fees. Each participant’s deferred compensation account will increase or decrease as if it were invested in shares of a particular series of Thrivent Mutual Funds.
Trustees not participating in the above plan received $9,193 in fees from the Trust for the six months ended April 29, 2011. In addition, the Trust reimbursed unaffiliated Trustees for reasonable expenses incurred in relation to attendance at the meetings.
Certain officers and non-independent trustees of the Trust are employed at Thrivent Financial for Lutherans and receive no compensation from the Trust.
(C) Indirect Expenses – The Trust may invest in other mutual funds. Fees and expenses of those underlying funds are not included in the Trust’s expense ratio. The Trust indirectly bears its proportionate share of the annualized weighted average expense ratio for the underlying funds in which it invests.
(4) FEDERAL INCOME TAX INFORMATION
Distributions are based on amounts calculated in accordance with the applicable federal income tax regulations, which may differ from GAAP. To the extent that these differences are permanent in nature, such amounts are reclassified within the capital accounts based on their federal tax-basis treatment; temporary differences do not require reclassifications. At fiscal year-end, the character and amount of distributions, on a tax basis and components of distributable earnings, are finalized. Therefore, as of April 29, 2011, the tax-basis balance has not yet been determined.
Capital losses generated during the next fiscal year will be subject to the provisions of the Regulated Investment Company Modernization Act of 2010. If the losses are not reduced by gains during the next fiscal year, the losses will be carried forward with no expiration and with the short-term or long-term character of the loss retained.
(5) SUBSEQUENT EVENTS
Management of the Trust has evaluated the impact of subsequent events, and, except as already included in the Notes to Financial Statements, has determined that no additional items require disclosure.
10
[THIS PAGE INTENTIONALLY LEFT BLANK]
11
Thrivent Financial Securities Lending Trust
Financial Highlights
FOR A SHARE OUSTANDING THROUGHOUT EACH PERIOD*
| | | | | | | | | | | | | | | | | | | | | | | | |
| | | | | | Income from Investment Operations | | | Less Distributions
From | |
| | | Net Asset
Value,
Beginning of
Period | | | Net
Investment
Income
/(Loss) | | | Net Realized
and Unrealized
Gain/(Loss) on
Investments(a) | | | Total from
Investment
Operations | | | Net
Investment
Income | | | Net Realized
Gain on
Investments | |
SECURITIES LENDING TRUST | | | | | | | | | | | | | | | | | | | | | | | | |
Period Ended 4/29/2011 (unaudited) | | $ | 1.00 | | | $ | – | | | $ | – | | | $ | – | | | $ | – | | | $ | – | |
Year Ended 10/31/2010 | | | 1.00 | | | | – | | | | – | | | | – | | | | – | | | | – | |
Year Ended 10/31/2009 | | | 1.00 | | | | 0.01 | | | | – | | | | 0.01 | | | | (0.01 | ) | | | – | |
Year Ended 10/31/2008 | | | 1.00 | | | | 0.03 | | | | – | | | | 0.03 | | | | (0.03 | ) | | | – | |
Year Ended 10/31/2007 | | | 1.00 | | | | 0.05 | | | | – | | | | 0.05 | | | | (0.05 | ) | | | – | |
Year Ended 10/31/2006 | | | 1.00 | | | | 0.05 | | | | – | | | | 0.05 | | | | (0.05 | ) | | | – | |
| (a) | The amount shown may not correlate with the change in aggregate gains and losses of portfolio securities due to the timing of sales and redemptions of fund shares. |
| * | All per share amounts have been rounded to the nearest cent. |
The accompanying Notes to the Financial Statements are an integral part of this schedule.
12
Thrivent Financial Securities Lending Trust
Financial Highlights—continued
RATIOS / SUPPLEMENTAL DATA
| | | | | | | | | | | | | | | | | | | | | | | | | | | | | | | | | | |
| | | | | | | | | | | | | Ratio to Average Net
Assets** | | | Ratios to Average Net Assets
Before Expenses Waived,
Credited or Paid Indirectly** | | | | |
Total Distributions | | | Net Asset
Value, End
of Period | | | Total
Return(b) | | | Net Assets,
End of Period
(in millions) | | | Expenses | | | Net Investment
Income/(Loss) | | | Expenses | | | Net Investment
Income/(Loss) | | | Portfolio
Turnover
Rate | |
| $ | – | | | $ | 1.00 | | | | 0.09 | % | | $ | 920.7 | | | | 0.05 | % | | | 0.18 | % | | | 0.07 | % | | | 0.16 | % | | | N/A | |
| | – | | | | 1.00 | | | | 0.22 | % | | | 779.4 | | | | 0.05 | % | | | 0.21 | % | | | 0.08 | % | | | 0.19 | % | | | N/A | |
| | (0.01 | ) | | | 1.00 | | | | 0.76 | % | | | 746.7 | | | | 0.05 | % | | | 0.92 | % | | | 0.06 | % | | | 0.91 | % | | | N/A | |
| | (0.03 | ) | | | 1.00 | | | | 3.38 | % | | | 2,461.9 | | | | 0.05 | % | | | 3.36 | % | | | 0.05 | % | | | 3.36 | % | | | N/A | |
| | (0.05 | ) | | | 1.00 | | | | 5.46 | % | | | 5,051.1 | | | | 0.05 | % | | | 5.33 | % | | | 0.05 | % | | | 5.33 | % | | | N/A | |
| | (0.05 | ) | | | 1.00 | | | | 4.93 | % | | | 4,121.0 | | | | 0.05 | % | | | 4.82 | % | | | 0.05 | % | | | 4.82 | % | | | N/A | |
| (b) | Total investment return assumes dividend reinvestment and does not reflect any deduction for sales charges. Not annualized for periods less than one year. |
| ** | Computed on an annualized basis for periods less than one year. |
The accompanying Notes to the Financial Statements are an integral part of this schedule.
13
Additional Information
(unaudited)
PROXY VOTING
The policies and procedures that the Trust uses to determine how to vote proxies relating to portfolio securities are attached to the Trust’s Statement of Additional Information. You may request a free copy of the Statement of Additional Information or the report of how the Trust voted proxies relating to portfolio securities during the most recent 12-month period ended June 30 by calling 1-800-847-4836. You also may review the Statement of Additional Information or the report of how the Trust voted proxies relating to portfolio securities during the most recent 12-month period ended June 30 at www.sec.gov.
QUARTERLY SCHEDULE OF PORTFOLIO HOLDINGS
The Trust files its Schedule of Portfolio Holdings on Form N-Q with the SEC for the first and third quarters of each fiscal year. You may request a free copy of the Trust’s Forms N-Q by calling 1-800-847-4836. The Trust’s Forms N-Q also are available at www.sec.gov. You also may review and copy the Forms N-Q for the Trust at the SEC’s Public Reference Room in Washington, DC. You may get information about the operation of the Public Reference Room by calling 1-800-SEC-0330.
BOARD APPROVAL OF INVESTMENT ADVISORY AGREEMENT
Both the Investment Company Act of 1940 (the “Investment Company Act”) and the terms of the investment advisory agreement of the Thrivent Financial Securities Lending Trust (the “Trust”) require that this agreement be approved annually by a majority of the Board of Trustees, including a majority of the Trustees who are not “interested persons” of the Trust, as defined in the Investment Company Act (the “Independent Trustees”).
At its meeting on November 17, 2010, the Board of Trustees of the Trust voted unanimously to renew the existing investment advisory agreement between the Trust and Thrivent Financial for Lutherans (the “Adviser”). In connection with its evaluation of the investment advisory agreement with the Adviser, the Board reviewed a broad range of information requested for this purpose and considered a variety of factors, including the following:
| | 1. | The nature, extent and quality of the services provided by the Adviser; |
| | 2. | The cost of services provided and profit realized by the Adviser; and |
| | 3. | The extent to which economies of scale may be realized as the Trust grows and whether fee levels reflect economies of scale for the benefit of shareholders. |
In connection with the renewal process, the Contracts Committee of the Board (consisting of each of the Independent Trustees of the Trust) met on July 22, August 24, October 20 and November 16, 2010 to consider information relevant to the renewal process. The Independent Trustees also retained the services of Management Practice, Inc. (“MPI”) as an independent consultant to assist them in the compilation, organization and evaluation of relevant information. This information included statistical comparisons of the advisory fees and total operating expenses of the Trust in comparison to a peer group of comparable investment companies; information prepared by management with respect to the cost of services provided to the Trust and fees charged by the Adviser; profit realized by the Adviser and its affiliates that provide services to the Trust; and information regarding the types of services furnished to the Trust, the personnel providing the services, changes in staff, systems improvements, and plans for further hiring. The Board also received reports from the Adviser’s investment management staff with respect to securities lending balances of the Trust. In addition to its review of the information presented to the Board during the contract renewal process and throughout the year, the Board also considered knowledge gained from discussions with management.
The Independent Trustees were represented by independent counsel throughout the review process and during executive sessions without management present to consider reapproval of the agreement. The Independent Trustees relied on their own business judgment in determining the weight to be given to each factor considered in evaluating the materials that were presented to them. The Contract Committee’s and Board’s review and conclusions were based on a comprehensive consideration of all information presented to them and not the result of any single controlling factor. The key factors considered and the conclusions reached are described below.
Nature, Extent and Quality of Services
At each of the Board’s regular quarterly meetings, management presented information describing the services furnished to the Trust by the Adviser. During these meetings, management reported on the investment management, securities lending activity, profits realized by the Adviser, and compliance services provided to the Trust under the investment advisory agreement. During the renewal process, the Board considered the specific services provided under the investment advisory
14
Additional Information
(unaudited)
agreement and the securities lending agreement. The Board also considered information relating to the investment experience and qualifications of the Adviser’s portfolio manager overseeing the Trust.
The Board received reports at each of its quarterly meetings from the Adviser’s Director of Fixed Income Investments, as supplemented by the Adviser’s Chief Investment Officer, who was also present at the meetings. At each quarterly meeting, the Director of Fixed Income Investments presented information about the Trust. The Board also met on occasion with other representatives of the Adviser, which gave the Board an opportunity to evaluate the Adviser’s abilities and the quality of services it provides to the Trust. Information was also presented to the Board describing the portfolio compliance functions performed by the Adviser for the Trust. The Independent Trustees also received quarterly reports from the Trust’s Chief Compliance Officer.
The Board considered, in light of the impact of the economic downturn in recent years on the investment advisory industry generally, the adequacy of the Adviser’ resources used to provide services to the Trust pursuant to the investment advisory agreement. The Adviser reviewed with the Board the Adviser’s ongoing program to enhance portfolio management capabilities, including recruitment and retention of research analysts and other personnel, and investment in technology systems and applications to improve investment research, trading, portfolio compliance, and investment reporting functions. The Board viewed these actions as a positive factor in reapproving the existing investment advisory agreement as they demonstrated the Adviser’s commitment to provide the Trust with quality service. The Board concluded that, within the context of its full deliberations, the nature, extent and quality of the investment advisory services provided to the Trust by the Adviser supported renewal of the investment advisory agreement.
Performance of the Trust
At each quarterly Board meeting, the Director of Fixed Income Investments reviewed with the Board the economic and market environment, risk management, and style consistency in connection with management of the Trust. The Board noted that, as a money market fund, the Trust’s performance was impacted by various factors, including the diminishing-yield environment and increased regulatory requirements generally experienced by money market funds.
Advisory Fees and Trust Expenses
The Board reviewed information prepared by MPI comparing the Trust’s advisory fee with the advisory fee of its peer group of funds. The Board noted that the Trust’s advisory fee as compared to the Trust’s peer group was below the median. On the basis of its review, the Board concluded that the advisory fee rate charged to the Trust for investment management services was reasonable.
The Board also reviewed information prepared by MPI comparing the Trust’s overall expense ratio with the expense ratio of its peer group of funds. The Board noted that the Trust’s net operating expenses were below the median of its peer group.
Economies of Scale
The Board considered information regarding the extent to which economies of scale may be realized as the Trust’s assets increase and whether the fee levels reflect these economies of scale for the benefit of shareholders. The Adviser explained its general goal with respect to the employment of fee waivers, expense reimbursements and breakpoints. The Board also considered management’s view that it is difficult to generalize as to whether, or to what extent, economies in the advisory function may be realized as the Trust’s assets increase. The Board noted that expected economies of scale, where they exist, may be shared through the use of fee breakpoints, fee waivers by the Adviser, and/or a lower overall fee rate. The Board considered the advisory fee rate charged to the Trust and determined that the fee rate was acceptable even though the Adviser did not offer breakpoints or contractual waivers.
Other Benefits to the Adviser and its Affiliates
The Board considered information regarding potential “fall-out” or ancillary benefits that the Adviser and its affiliates may receive as a result of their relationship with the Trust, both tangible and intangible, such as their ability to leverage investment professionals who manage other funds, reputational benefits in the investment advisory community and the engagement of affiliates as service providers to the Funds. The Board noted that such benefits were difficult to quantify but were consistent with benefits received by other mutual fund advisers.
Based on the factors discussed above, the Contracts Committee unanimously recommended approval of the investment advisory agreement, and the Board, including all of the Independent Trustees voting separately, approved the agreement.
15
This report is submitted for the information of shareholders of
Thrivent Financial Securities Lending Trust. It is not authorized
for distribution to prospective investors unless preceded or
accompanied by the current prospectus for Thrivent Financial
Securities Lending Trust, which contains more complete
information about the Trust, including investment objectives,
risks, charges and expenses.

Not applicable to semiannual report
| Item 3. | Audit Committee Financial Expert |
Not applicable to semiannual report
| Item 4. | Principal Accountant Fees and Services |
Not applicable to semiannual report
| Item 5. | Audit Committee of Listed Registrants |
Not applicable.
(a) Registrant’s Schedule of Investments is included in the report to shareholders filed under Item 1.
(b) Not applicable to this filing.
| Item 7. | Disclosure of Proxy Voting Policies and Procedures for Closed-End Management Investment Companies |
Not applicable.
| Item 8. | Portfolio Managers of Closed-End Management Investment Companies |
Not applicable.
| Item 9. | Purchases of Equity Securities by Closed-End Management Investment Company and Affiliated Purchasers. |
Not applicable.
| Item 10. | Submission of Matters to a Vote of Security Holders |
There have been no material changes to the procedures by which shareholders may recommend nominees to registrant’s board of trustees.
| Item 11. | Controls and Procedures |
(a)(i) Registrant’s President and Treasurer have concluded that registrant’s disclosure controls and procedures (as defined in Rule 30a-3(c) under the Investment Company Act of 1940) are effective, based on their evaluation of these controls and procedures as of a date within 90 days of the filing date of this report.
(a)(ii) Registrant’s President and Treasurer are aware of no change in registrant’s internal control over financial reporting (as defined in Rule 30a-3(d) under the Investment Company Act of 1940) that occurred during registrant’s most recent fiscal quarter that has materially affected, or is reasonably likely to materially affect, registrant’s internal control over financial reporting.
Certifications pursuant to Rules 30a-2(a) and 30a-2(b) under the Investment Company Act of 1940 are attached hereto.
SIGNATURES
Pursuant to the requirements of the Securities Exchange Act of 1934 and the Investment Company Act of 1940, the registrant has duly caused this report to be signed on its behalf by the undersigned, thereunto duly authorized.
| | | | | | | | |
| | Date: June 28, 2011 | | | | THRIVENT FINANCIAL SECURITIES LENDING TRUST |
| | | | |
| | | | | | By: | | /s/ Russell W. Swansen |
| | | | | | | | Russell W. Swansen President |
Pursuant to the requirements of the Securities Exchange Act of 1934 and the Investment Company Act of 1940, this report has been signed below by the following persons on behalf of the registrant and in the capacities and on the dates indicated.
| | | | | | | | |
| | Date: June 28, 2011 | | | | By: | | /s/ Russell W. Swansen |
| | | | | | Russell W. Swansen President |
| | | | |
| | Date: June 28, 2011 | | | | By: | | /s/ Gerard V. Vaillancourt |
| | | | | | Gerard V. Vaillancourt Treasurer |