UNITED STATES
SECURITIES AND EXCHANGE COMMISSION
Washington, D.C. 20549
FORM 6-K
REPORT OF FOREIGN PRIVATE ISSUER PURSUANT TO RULE 13A-16 OR 15D-16 UNDER THE
SECURITIES EXCHANGE ACT OF 1934
For the month of November, 2019
Commission File Number 32297
CPFL Energy Incorporated
(Translation of Registrant's name into English)
Rua Jorge de Figueiredo Correa, nº 1632, parte
CEP 13087-397 - Jardim Professora Tarcilla, Campinas – SP
Federative Republic of Brazil (Address of principal executive office)
Indicate by check mark whether the registrant files or will file annual reports under cover Form 20-F or Form 40-F. Form 20-F ___X___ Form 40-F _______
Indicate by check mark if the registrant is submitting the Form 6-K in paper as permitted by Regulation S-T Rule 101(b)(1): [ ]
Indicate by check mark if the registrant is submitting the Form 6-K in paper as permitted by Regulation S-T Rule 101(b)(7): [ ]
Indicate by check mark whether the registrant by furnishing the information contained in this Form is also thereby furnishing the information to the Commission pursuant to Rule 12g3-2(b) under the Securities Exchange Act of 1934.
Yes _______ No ___X____
If "Yes" is marked, indicate below the file number assigned to the registrant in connection with Rule 12g3-2(b): 82-_________________
.


MESSAGE FROM THE CEO
CPFL Energia even more renewable
The third quarter of 2019 was especially marked by the conclusion of the process to integrate the administrative activities of CPFL Renováveis with the organizational model of the CPFL Energia Group, further reinforcing the Management's commitment to growth and creating value for its shareholders by strengthening potential synergies between the companies. Also, with the conclusion of the acquisition, CPFL Energia now holds 99.94% of CPFL Renováveis.
In operational terms, energy sales during the quarter in our concession areas, as in the Brazilian market, did not show significant results, still affected by the industrial slowdown.
However, I wish to highlight the economic and financial performance, where we have once again achieved significant results. EBITDA reached R$ 1,618 million and Net Income was R$ 748 million in 3Q19, respectively 4.5% and 19.4% higher than in the same period in 2018. The distribution segment registered significant performance, with EBITDA of R$ 846 million in 3Q19 (+17.8%), mainly reflecting the results of tariff adjustments at distributors: CPFL Piratininga (October 2018), CPFL Paulista (April 2019) and RGE (June 2019).
With the focus on optimizing the capital structure, consolidated leverage of CPFL Energia remains at adequate levels. The Company’s net debt to EBITDA ratio stood at 2.68x at the end of the quarter, as measured by our financial covenants, already considering the 99.94% interest in CPFL Renováveis.
We invested R$ 616 million in 3Q19 (+17.4%) and a total of R$ 1,582 million in 9M19. Accordingly, we continue to focus on value-creation initiatives and on our investment plan (around R$11.9 billion over the next five years, of which R$ 2.2 billion in 2019), accompanied by financial discipline, and the engagement and commitment of our teams.
In orderto adopt the best practices in the sector, we continue to implement cutting-edge automation technologies in our businesses and digitalize support activities in order to better manage our costs.
In the social and sustainability sphere, we highlight the recognition in 2019 Exame Sustainability Guide as the most sustainable company in the utilitiessector, highlighting CPFL at Hospitals program. This program comprises an investment of R$ 150 million for an initiative that will help public institutions and charities to reduce their electricity bills through energy efficiency actions. During the next three years, up to 25 MWp in photovoltaic panels will be installed in charity hospitals, which will help reduce approximately 6,000 tons of CO2 per year, equivalent to the planting of around 900 trees.
1
Finally, on behalf of CPFL management, I would like to praise the engagement and commitment of our over 12,000 employees and reiterate the commitment and trust that our shareholders, clients, partners, society and other stakeholders have in us. We remain optimistic about the advances in the electricity sector and confident about our business platform, which is increasingly prepared and well positioned to face the challenges and opportunities in Brazil.
Gustavo Estrella
CEO of CPFL Energia
KEY INDICATORS
Indicators (R$ Million) | 3Q19 | 3Q18 | Var. | 9M19 | 9M18 | Var. |
Load in the Concession Area - GWh | 16,420 | 16,462 | -0.3% | 51,030 | 50,611 | 0.8% |
Sales within the Concession Area - GWh | 15,963 | 16,249 | -1.8% | 50,320 | 50,187 | 0.3% |
Captive Market | 10,522 | 10,808 | -2.6% | 33,951 | 34,076 | -0.4% |
Free Client | 5,441 | 5,441 | 0.0% | 16,369 | 16,111 | 1.6% |
Gross Operating Revenue | 11,665 | 12,174 | -4.2% | 33,257 | 32,313 | 2.9% |
Net Operating Revenue | 7,746 | 8,130 | -4.7% | 21,910 | 21,450 | 2.1% |
EBITDA(1) | 1,618 | 1,548 | 4.5% | 4,654 | 4,284 | 8.6% |
Distribution | 846 | 718 | 17.8% | 2,699 | 2,278 | 18.5% |
Conventional generation | 338 | 336 | 0.5% | 975 | 960 | 1.6% |
Renewable generation | 384 | 427 | -10.0% | 827 | 910 | -9.1% |
Commercialization, Services & Others | 50 | 67 | -24.8% | 152 | 135 | 12.6% |
Net Income | 748 | 626 | 19.4% | 1,892 | 1,496 | 26.5% |
Net Debt(2) | 16,901 | 15,503 | 9.0% | 16,901 | 15,503 | 9.0% |
Net Debt / EBITDA(2) | 2,68x | 2,92x | -8.1% | 2,68x | 2,92x | -8.1% |
Investments(3) | 616 | 525 | 17.4% | 1,582 | 1,370 | 15.5% |
Notes:
(1) EBITDA is calculated from the sum of net income, taxes, financial result, depreciation/amortization, as CVM Instruction no. 527/12. See the calculation in item 3.2 of this report;
(2) In covenants criteria, which considers CPFL Energia stake in each project;
(3) Does not include special obligations.
2
CONTENTS
1) COMPANY PROFILE AND CORPORATE STRUCTURE | 4 |
| |
2) OPERATIONAL PERFORMANCE | 6 |
2.1) Distribution | 6 |
2.1.1) Load net of losses in the concession area | 6 |
2.1.2) Sales within the Distributors’ Concession Area | 6 |
2.1.3) Losses | 8 |
2.1.4) SAIDI and SAIFI | 9 |
2.1.5) Delinquency | 9 |
2.2) Conventional and Renewable Generation | 10 |
2.2.1) Installed Capacity | 10 |
2.2.2) Operational and under construction Projects | 11 |
2.3) Commercialization | 12 |
2.4) Transmission | 12 |
| |
3) CPFL ENERGIA ECONOMIC-FINANCIAL PERFORMANCE | 13 |
3.1) Criteria of financial statements consolidation | 13 |
3.2) Economic-Financial Performance | 14 |
3.3) Indebtedness | 21 |
3.3.1) Debt (IFRS) | 21 |
3.3.2) Debt in Financial Covenants Criteria | 25 |
3.4) Investments | 26 |
3.4.1) Actual Investments | 26 |
3.4.2) Investments Forecasts | 26 |
| |
4) STOCK MARKETS | 28 |
4.1) Stock Performance | 28 |
4.2) Daily Average Volume | 28 |
| |
5) PERFORMANCE OF BUSINESS SEGMENTS | 29 |
5.1) Distribution Segment | 29 |
5.1.1) Economic-Financial Perfomance. | 29 |
5.1.2) Tariff Events | 36 |
5.2) Commercialization and Services Segments | 38 |
5.3) Conventional Generation Segment | 39 |
5.4) CPFL Renováveis | 45 |
| | |
6) ATTACHMENTS | 49 |
6.1) Balance Sheet - Assets – CPFL Energia | 49 |
6.2) Balance Sheet - Liabilities – CPFL Energia | 50 |
6.3) Income Statement – CPFL Energia | 51 |
6.4) Cash Flow – CPFL Energia | 52 |
6.5) Income Statement – Conventional Generation Segment | 53 |
6.6) Income Statement – CPFL Renováveis | 54 |
6.7) Income Statement – Distribution Segment | 55 |
6.8) Economic-Financial performance by Distributor | 56 |
6.9) Sales within the Concession Area by Distributor | 57 |
6.10) Sales to the Captive Market by Distributor | 58 |
6.11) Information on Interest in Companies | 59 |
6.12) Reconciliation of Net Debt/EBITDA Pro Forma ratio of CPFL Energia for purposes of financial covenants calculation | 62 |
3
1) COMPANY PROFILE AND CORPORATE STRUCTURE
Company Operation
CPFL Energia operates in the Generation, Transmission, Distribution, Commercialization and Services segments, with presence in 11 states in all regions of the country.
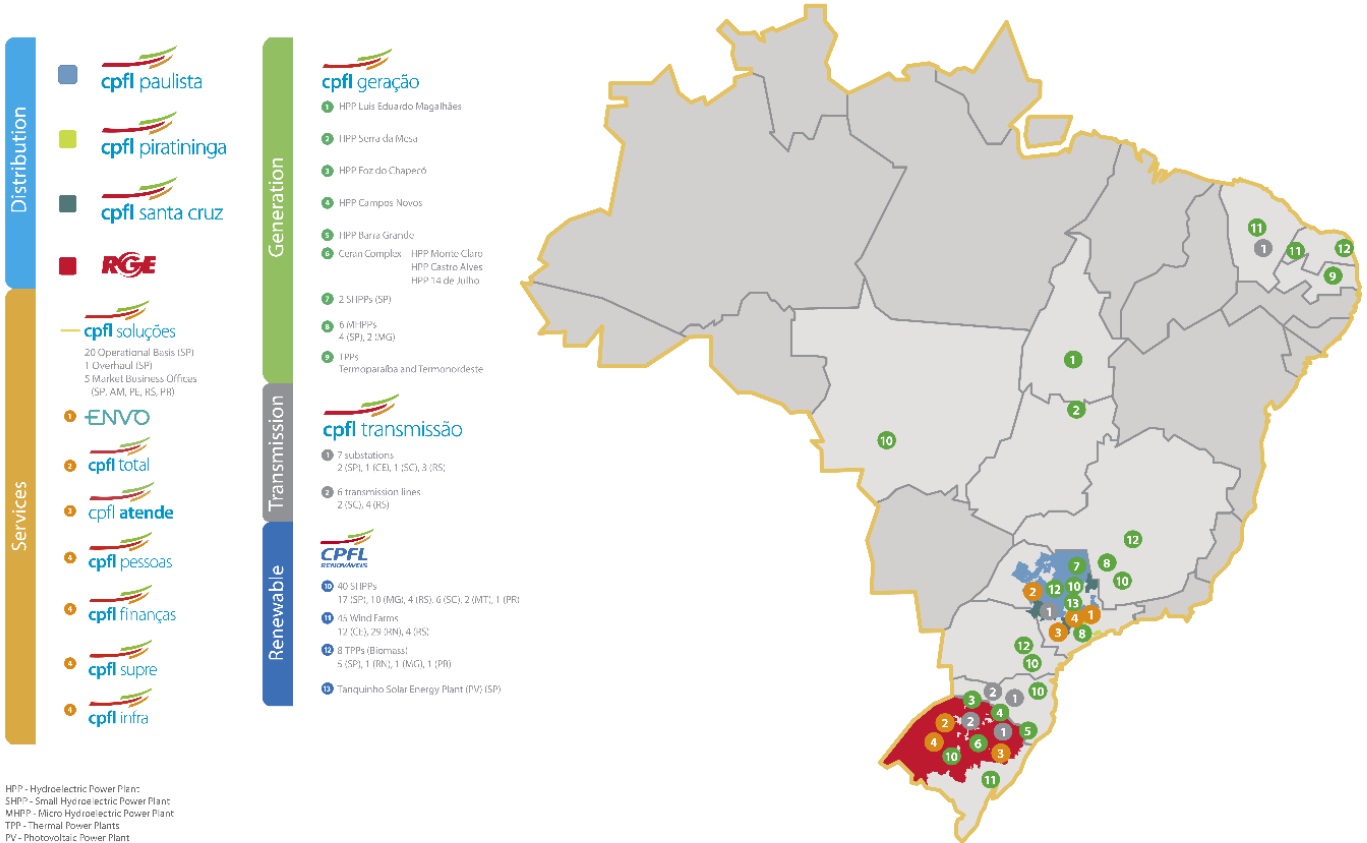
CPFL is the second largest distributor in volume of energy sales, with 14% of the national market, serving approximately 9.7 million customers in 687 municipalities. With 4,304 MW of installed capacity, it is the third largest private generator in the country, being the leader in renewable generation, operating in hydroelectric, solar, wind and biomass sources. It also has investments in Transmission, with the acquisition of three new projects in 2018, and a national performance of CPFL Soluções, providing integrated solutions in energy management and commercialization, energy efficiency, distributed generation, energy infrastructure and consulting services.
Shareholders Structure
CPFL Energia is a holding company that owns stake in other companies. State Grid Corporation of China (SGCC) controls CPFL Energia through its subsidiaries State Grid International Development Co., Ltd, State Grid International Development Limited (SGID), International Grid Holdings Limited, State Grid Brazil Power Participações S.A. (SGBP) and ESC Energia S.A.:
4
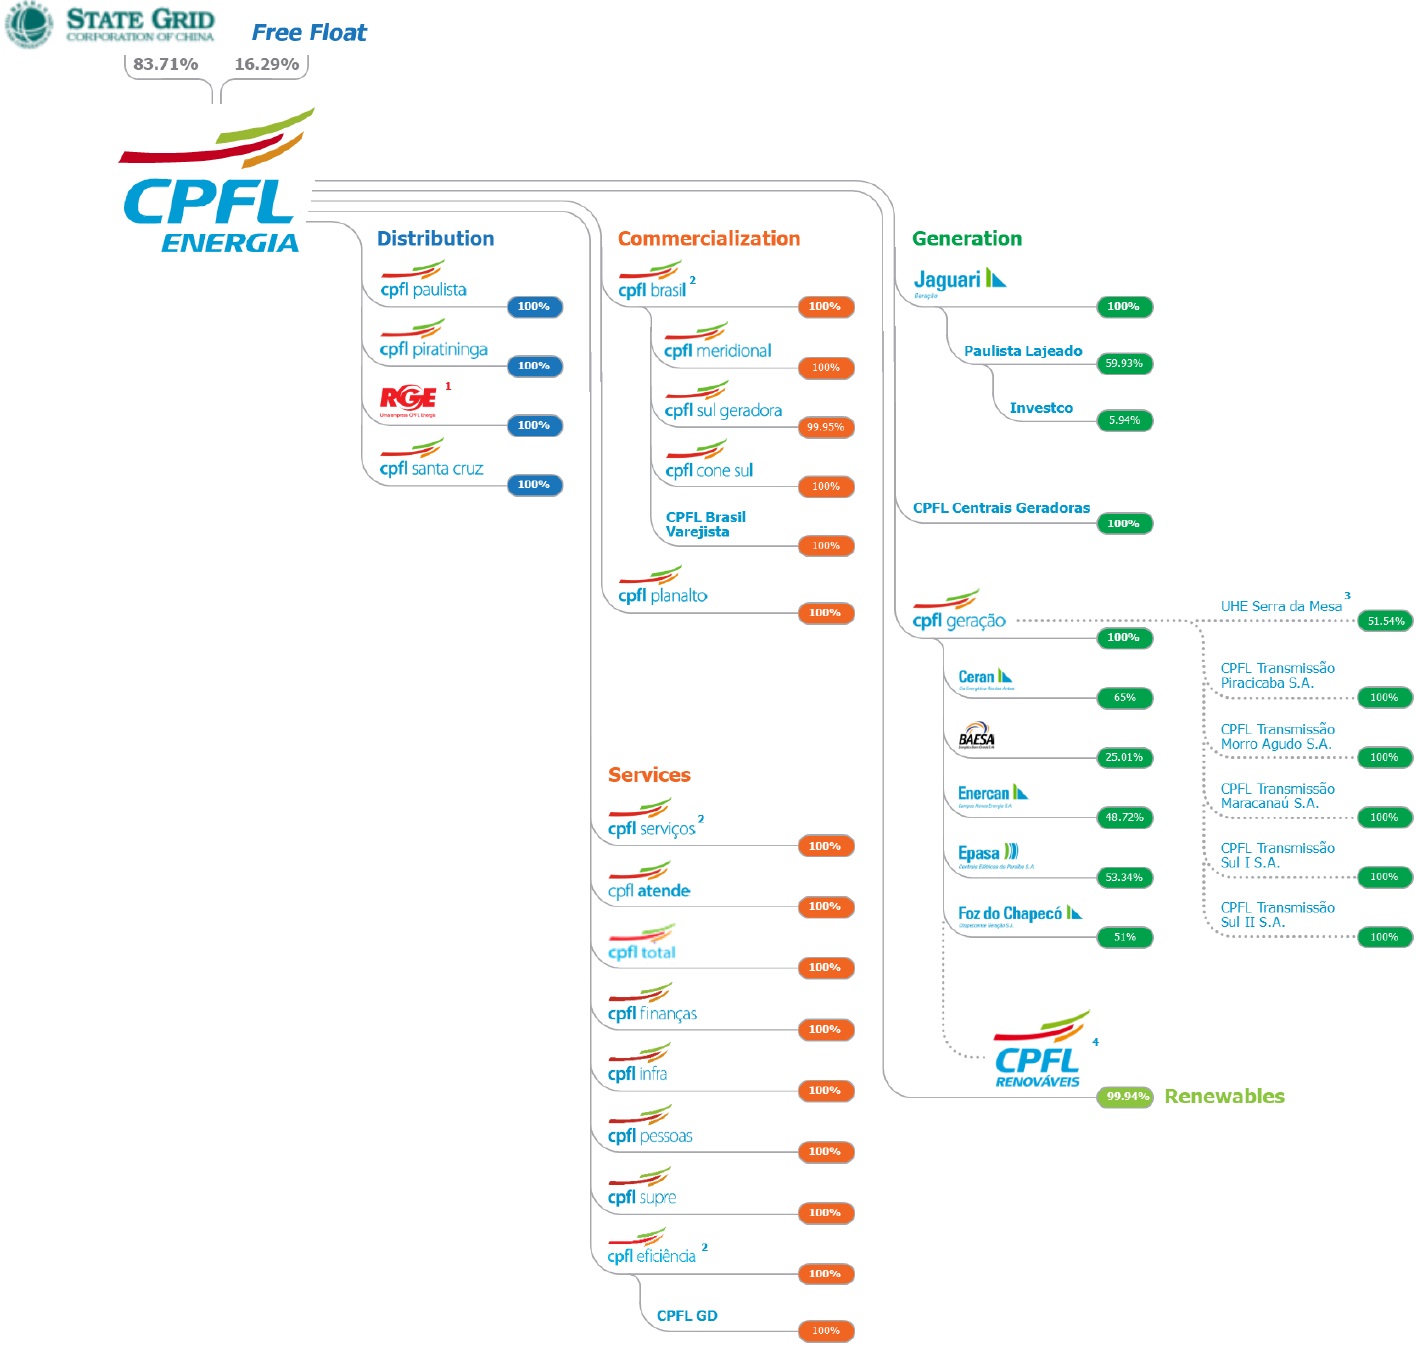
Reference date: 09/30/2019
Notes:
(1) RGE is held by CPFL Energia (89.0107%) and CPFL Brasil (10.9893%).
(2) CPFL Soluções = CPFL Brasil + CPFL Serviços + CPFL Eficiência;
(3) 51.54% stake of the availability of power and energy of Serra da Mesa HPP, regarding the Power Purchase Agreement between CPFL Geração and Furnas
(4) CPFL Renováveis is controlled by CPFL Energia (46.7609%) and CPFL Geração (53.1831%)
Corporate Governance
The corporate governance model adopted by CPFL Energia and its subsidiaries is based on the principles of transparency, equity, accountability and corporate responsibility.
CPFL’s Management is composed of the Board of Directors, its decision-making authority, and the Board of Executive Officers, its executive body. CPFL also has five advisory committees, which support the Board in its decisions and monitor relevant and strategic themes, and a permanent Fiscal Council, composed of three members, that also exercises the duties of Audit Committee, in line with Sarbanes-Oxley Law (SOX), applicable to foreign companies listed on U.S. stock exchanges.
The guidelines and documents on corporate governance are available at the Investor Relations website http://www.cpfl.com.br/ir.
5
Dividend Policy
On May 21, 2019, CPFL Energia announced to its shareholders and to the market that its Board of Directors approved, at the meeting held on that date, the adoption of a dividend distribution policy, which determines that the Company should distribute annually, as dividends, at least 50% of the adjusted net income, in accordance with the Brazilian Corporate Law. Furthermore, the Dividend Policy sets out the factors that will influence the amount of the distributions, as well as other issues considered relevant by the Board of Directors and the shareholders. The Dividend Policy also highlights that certain obligations contained in the Company’s financial contracts may limit the amount of dividends and/or interest on own capital that may be distributed.
The approved Dividend Policy is merely indicative, with the purpose of signaling to the market the treatment that the Company intends to give to the distribution of dividends to its shareholders, having, therefore, a programmatic character, not binding upon the Company or its governing bodies.
The Dividend Policy is available at the Investor Relations website http://www.cpfl.com.br/ir.
2) OPERATIONAL PERFORMANCE
2.1) Distribution
2.1.1) Load net of losses in the concession area
Load in the Concession Area - GWh |
| 3Q19 | 3Q18 | Var. | 9M19 | 9M18 | Var. |
Captive Market | 10,708 | 10,801 | -0.9% | 33,956 | 33,866 | 0.3% |
Free Client | 5,712 | 5,661 | 0.9% | 17,074 | 16,745 | 2.0% |
Total | 16,420 | 16,462 | -0.3% | 51,030 | 50,611 | 0.8% |
Note: If excluding the consumption of large consumers that migrate to the National Grid, the load within the concession area would have the following variations: +0.7% in the quarter and +1.6% accumulated.
2.1.2) Sales within the Distributors’ Concession Area
Sales within the Concession Area - GWh |
| 3Q19 | 3Q18 | Var. | 9M19 | 9M18 | Var. |
Captive Market | 10,522 | 10,808 | -2.6% | 33,951 | 34,076 | -0.4% |
Free Client | 5,441 | 5,441 | 0.0% | 16,369 | 16,111 | 1.6% |
Total | 15,963 | 16,249 | -1.8% | 50,320 | 50,187 | 0.3% |
In 3Q19, sales within the concession area, achieved by the distribution segment, totaled 15,963 GWh, a decrease of 1.8%. Sales to the captive market totaled 10,522 GWh in 3Q19, a decrease of 2.6%. The quantity of energy, in GWh, which corresponds to the consumption of free clients in the concession area of group’s distributors, billed through the Tariff for the Usage of the Distribution System (TUSD), reached 5,441 GWh in 3Q19, staying on the same level of 2018.
In 9M19, sales within the concession area reached 50,320 GWh, an increase of 0.3%. Salesto the captive market totaled 33,951 GWh, a decrease of 0.4% and the quantity of energy, which corresponds to the consumption of free clients totaled 16,369 GWh, an increase of 1.6%.
6
Sales within the Concession Area - GWh |
| 3Q19 | 3Q18 | Var. | Part. | 9M19 | 9M18 | Var. | Part. |
Residential | 4,632 | 4,627 | 0.1% | 29.0% | 15,037 | 14,647 | 2.7% | 29.9% |
Industrial | 6,114 | 6,368 | -4.0% | 38.3% | 18,292 | 18,653 | -1.9% | 36.4% |
Commercial | 2,505 | 2,482 | 0.9% | 15.7% | 8,391 | 8,207 | 2.2% | 16.7% |
Others | 2,712 | 2,772 | -2.1% | 17.0% | 8,600 | 8,680 | -0.9% | 17.1% |
Total | 15,963 | 16,249 | -1.8% | 100.0% | 50,320 | 50,187 | 0.3% | 100.0% |
Note: The tables with sales within the concession area by distributor are attached to this report in item 6.9.
Concession area in 3Q19:
· Residential and Commercial classes (29.0% and 15.7% of total sales, respectively): increase of 0.1% and 0.9% respectively, impacted by fewer days on the billing calendar, the growth of Distributed Generation in the concession area and the macroeconomic scenario. Still, higher temperatures favored the consumption for these classes.
· Industrial class (38.3% of total sales): reduction of 4.0%, reflecting the weak economic activity and the migration of two large consumer located in the CPFL Piratininga concession area to the basic network. Excluding this effect, the variation of the Industrial class would be -2.7%.
Concession area in 9M19:
· Residential and Commercial classes (29.9% and 16.7% of total sales, respectively): increase of 2.7% and 2.2%, respectively, favored by the high temperature in the first months of the year, which favored the increase in consumption, especially in the state of São Paulo, partially offset by a higher temperature in the South region in the second quarter, which reduced the consumption for heating, the growth of Distributed Generation in the concession area and the macroeconomic scenario.
· Industrial class (36.4% of total sales): reduction of 1.9%, reflecting the weak economic performance and the migration of consumers to the basic network.
Sales to the Captive Market - GWh |
| 3Q19 | 3Q18 | Var. | 9M19 | 9M18 | Var. |
Residential | 4,632 | 4,627 | 0.1% | 15,037 | 14,647 | 2.7% |
Industrial | 1,388 | 1,557 | -10.9% | 4,214 | 4,590 | -8.2% |
Commercial | 1,901 | 1,931 | -1.5% | 6,406 | 6,413 | -0.1% |
Others | 2,601 | 2,693 | -3.4% | 8,294 | 8,426 | -1.6% |
Total | 10,522 | 10,808 | -2.6% | 33,951 | 34,076 | -0.4% |
Note: The tables with captive market sales by distributor are attached to this report in item 6.10.
7
Free Client - GWh |
| 3Q19 | 3Q18 | Var. | 9M19 | 9M18 | Var. |
Industrial | 4,726 | 4,811 | -1.8% | 14,078 | 14,063 | 0.1% |
Commercial | 604 | 551 | 9.5% | 1,985 | 1,794 | 10.6% |
Others | 111 | 79 | 41.1% | 307 | 254 | 20.9% |
Total | 5,441 | 5,441 | 0.0% | 16,369 | 16,111 | 1.6% |
| | | | | | |
Free Client by Distributor - GWh |
| 3Q19 | 3Q18 | Var. | 9M19 | 9M18 | Var. |
CPFL Paulista | 2,512 | 2,493 | 0.8% | 7,626 | 7,434 | 2.6% |
CPFL Piratininga | 1,479 | 1,577 | -6.2% | 4,507 | 4,707 | -4.3% |
RGE | 1,272 | 1,217 | 4.5% | 3,704 | 3,519 | 5.3% |
CPFL Santa Cruz | 178 | 155 | 14.9% | 532 | 451 | 18.0% |
Total | 5,441 | 5,441 | 0.0% | 16,369 | 16,111 | 1.6% |
2.1.3) Losses
The consolidated losses index of CPFL Energia was of 9.31% in the 12 months to September/19, compared to 9.01% in June/19, an increase of 0.30 pp. The increase in losses is associated with an unfavorable revenue schedule in the quarter, compared to September/18 and June/19.
12M Accumulated Losses1 | |
Sept-18 | Dec-18 | Mar-19 | Jun-19 | Sept-19 | ANEEL |
CPFL Energia | 8.86% | 9.03% | 8.84% | 9.01% | 9.31% | 8.27% |
CPFL Paulista | 8.87% | 9.13% | 8.86% | 9.13% | 9.63% | 8.37% |
CPFL Piratininga | 7.79% | 7.94% | 7.69% | 7.88% | 7.99% | 6.92% |
RGE | 9.71% | 9.70% | 9.78% | 9.74% | 9.86% | 9.14% |
CPFL Santa Cruz | 8.09% | 8.56% | 7.82% | 8.10% | 8.34% | 7.58% |
Notes:
1) The figures above were adequate to a better comparison with the regulatory losses trajectory defined by the Regulatory Agency (ANEEL). In CPFL Piratininga, RGE and RGE Sul, high-voltage customers were disregarded.
The CPFL group has intensified the actions against non-technical losses in recent years, where the main achievements of the semester were:
(i) Conducting 432,000 inspections at consumer units;
(ii) Cut out of 83,000 inactivated consumer units;
(iii) Regularization of 1,100 clandestine consumers;
(iv) Replacing obsolete / defective meters with new electronics;
(v) Implementation of armored measuring boxes for 4 thousand customers in São Paulo;
(vi) Recovery of 460 GWh of energy, of which 334 GWh related to revenue growth and 126 GWh of retroactive energy;
(vii) Driving to the police station of 95 people, between arrests and indictment for power theft;
(viii) Communication of CPFL Energia's actions to combat losses in physical and digital media, showing that energy theft is a crime and is subject to penalties.
8
2.1.4) SAIDI and SAIFI
Below we are presenting the results achieved by the distribution companies with regard to the main indicators that measure the quality and reliability of their supply of electric energy. The SAIDI (System Average Interruption Duration Index) measures the average duration, in hours, of interruption per consumer per year. The SAIFI (System Average Interruption Frequency Index) measures the average number of interruptions per consumer per year.
SAIDI Indicators |
Distributor | SAIDI (hours) |
2016 | 2017 | 2018 | 3Q18 | 1Q19 | 2Q19 | 3Q19 | ANEEL1 |
CPFL Paulista | 7.62 | 7.14 | 6.17 | 6.25 | 6.46 | 6.71 | 6.84 | 7.38 |
CPFL Piratininga | 8.44² | 6.97 | 5.92 | 6.01 | 6.40 | 6.55 | 6.55 | 6.41 |
RGE | 16.82 | 14.83 | 14.44 | 14.49 | 14.95 | 14.83 | 14.33 | 11.08 |
CPFL Santa Cruz | 8.47 | 6.22 | 6.01 | 5.61 | 6.21 | 6.22 | 6.36 | 8.46 |
| | | | | | | | |
SAIFI Indicators |
Distributor | SAIFI (interruptions) |
2016 | 2017 | 2018 | 3Q18 | 1Q19 | 2Q19 | 3Q19 | ANEEL1 |
CPFL Paulista | 5.00 | 4.94 | 4.03 | 4.13 | 4.16 | 4.29 | 4.42 | 6.32 |
CPFL Piratininga | 3.97² | 4.45 | 3.87 | 3.71 | 4.31 | 4.34 | 4.35 | 5.68 |
RGE | 8.44 | 7.68 | 6.10 | 6.31 | 6.27 | 6.40 | 6.48 | 8.35 |
RGE Sul | 9.41 | 7.62 | 5.89 | 0.00 | | 0.00 | 0.00 | 8.30 |
CPFL Santa Cruz | 6.25 | 5.13 | 5.09 | 4.90 | 4.84 | 4.82 | 4.79 | 7.64 |
Notes:
1)ANEEL limit;
2)In previous disclosures, we reported a SAIDI of 6.97 and a SAIFI of 3.80 for CPFL Piratininga in 2016. This figure excluded the effect of a CTEEP transmission failure during a storm. However, an ANEEL decision determined that this effect be included in the SIDI and SAIFI statistics, thus correcting the values shown in the table
This result carries the impact of the 1st quarter storms added to the atypical storms in the state of São Paulo in this quarter, which mainly affected CPFL Paulista (July, August and September), CPFL Piratininga (July and September) and CPFL Santa Cruz ( August and September).
Comparing with the 3Q18 indices, it is worth mentioning the reduction in RGE SAIDI (-1.1%) and CPFL Santa Cruz SAIFI (-2.2%).
Since 2019, the RGE and RGE Sul concessions have been unified, becoming a single distributor for the purpose of calculating technical indicators.
2.1.5) Delinquency

9
ADA increased by R$ 13 million (28.0%) in 3Q19 compared to 3Q18. However, compared to 2Q19, there was a reduction of 4.0%.
In 2019 several actions were implemented:
ü Increase of power cuts in 3Q19 (589 thousand power cuts in 3Q19versus 536 thousand in 2Q19) and expectation to maintain the same level until the end of the year (meter and circuit breaker);
ü Intensification of other collection actions ( monthly average volume):
· 550 thousand emails
· 375 thousand SMS
· 485 thousand Telephone Charges
· 610,000 Negativities
· 530 thousand cuts
· 70,000 Billing Letters
· 54,000 Protests
ü Intensified negotiations with customers with judicial and inactive debts (Group A);
ü Implementation of new payment options (debit and credit card) for overdue accounts.
2.2) Conventional and Renewable Generation
2.2.1) Installed Capacity
In3Q19, the Generation installed capacity of CPFL Energia group, considering the proportional stake in each project, is of 4,304 MW.
Since the IPO in 2004, CPFL Energia has been expanding its portfolio and today has a 404% higher capacity.

10

Note: Take into account CPFL Energia’s 99.94% stake in CPFL Renováveis.Graphic does not consider 1 MW of Solar Generation of Tanquinho Plant
2.2.2) Operational and under construction Projects
CPFL Geração's project portfolio (considering CPFL Energia's participation in each project) totals 2,173 MW of installed capacity in operation. The plants in operation comprise 8 HPPs (1,966 MW), 2 TPPs (182 MW), e 9 SHPPs (24 MW).
CPFL Geração - Portfolio |
Em MW | HPP | TPP | SHPP | Total |
In Operation | 1,966 | 182 | 24 | 2,173 |
CPFL Renováveis's project portfolio (100% Stake) totals 2,133 MW of installed capacity in operation and 110 MW of capacity under construction. The plants in operation comprise 40 SHPPs (453 MW), 45 wind farms (1,309 MW), 8 biomass thermoelectric plants (370 MW) e 1 solar plant (1 MW). Still in construction 1 SHPP (28 MW) and 4 wind farms (82 MW).
Additionally, CPFL Renováveis has wind, solar and SHPP projects under development totaling 2,903 MW.
The table below illustrates the overall portfolio of assets (100% stake) in operation, construction and development, and their installed capacity:
CPFL Renováveis - Portfolio |
In MW | SHPP | Biomass | Wind | Solar | Total |
Operating | 453 | 370 | 1,309 | 1 | 2,133 |
Under construction | 28 | - | 82 | - | 110 |
Under development | 149 | - | 2,415 | 340 | 2,903 |
Total | 630 | 370 | 3,805 | 341 | 5,146 |
SHPP Lucia Cherobim
SHPP Lucia Cherobim, a project located in the state of Paraná, is scheduled to start operating in 2024. Installed capacity is 28.0 MW and physical guarantee is 16.6 average MW. The energy was sold under a long-term contract at the 2018 new energy auction (A-6). (Price: R $ 189.95 / MWh - June 2019).
11
Gameleira Complex Wind Farms
The Gameleira Complex Wind Farms (Costa das Dunas, Figueira Branca, Farol de Touros and Gameleira), located in the state of Rio Grande do Norte, is scheduled to start operating in 2024. The installed capacity is 81.7 MW and the physical guarantee is 39.4 average MW. There was an increase in installed capacity from 61.3 MW to 81.7 MW, due to the optimization of the wind turbine power. Part of the energy (12.0 average MW) was sold under a long-term contract at the 2018 new energy auction (A-6). (Price: R $ 89.89 / MWh - June 2019).
2.3) Commercialization
Number of Commercialization Consumer Units
In September 2019, CPFL Brasil's Consumer Units reached a total of 1,913, a 42.2% increase.

2.4) Transmission
Operational Portfolio |
Project | Location | RAP
(R$ MM) | Capex
(R$ MM) | Operation Start | Substation # | Network (Km) |
Piracicaba | SP | 8.9 | 100 | apr/16 | 1 | 0 |
Morro Agudo | SP | 10.8 | 100 | Jun-17 | 1 | 1 |
| | | | | | |
| | | | | | |
In Construction Portolio |
Project | Location | RAP
(R$ MM) | Estimated Capex by Aneel
(R$ MM) | Operation Start | Substation # | Network (Km) |
Maracanaú | CE | 7.9 | 102 | Mar-22 | 1 | 2 |
Sul I | SC | 26.4 | 366 | Mar-24 | 1 | 320 |
Sul II | RS | 33.9 | 349 | Mar-24 | 3 | 85 |
Notes: Base Date - Piracicaba (12/19/12) – Morro Agudo (06/01/14) – Maracanaú (06/28/18) – Sul I e II (12/20/18).RAP stands for Allowed Annual Revenue.
12
3) CPFL ENERGIA ECONOMIC-FINANCIAL PERFORMANCE
3.1) Criteria of financial statements consolidation
The interests directly or indirectly held by CPFL Energia in its subsidiaries and jointly-owned entities are described on attachment 6.11. Except for: (i) the jointly-owned entities ENERCAN, BAESA, Foz do Chapecó and EPASA, that, as from January 1, 2013 are no longer proportionally consolidated in the Company’s financial statements, being their assets, liabilities and results accounted for using the equity method of accounting, and (ii) the investment in Investco S.A. recorded at cost by the subsidiary Paulista Lajeado, the other units are fully consolidated.
As of September 30, 2019 and 2019, the participation of non-controlling interests stated in the consolidated statements refers to the third-party interests in the subsidiaries CERAN, Paulista Lajeado and CPFL Renováveis.
Consolidation of CPFL Renováveis Financial Statements
On September 30, 2019, CPFL Energia indirectly held 99.94% of CPFL Renováveis, through its subsidiary CPFL Geração. CPFL Renováveis has been fully consolidated (100%, line by line), in CPFL Energia’s financial statements since August 1, 2011, and the interest held by the non-controlling shareholders has been mentioned bellow the net income line (in the Financial Statements), as “Non-Controlling Shareholders’ Interest”, and in the Shareholders Equity (in the Balance Sheet) in the line with the same name.
Consolidation of RGE Sul Financial Statements
On September 30, 2019, CPFL Energia held the following stake in the capital stock of RGE Sul: 89.0107%, directly, and 10.9893%, indirectly, through CPFL Brasil. RGE Sul has been fully consolidated (100%, line by line), in CPFL Energia’s financial statements since November 1st, 2016.
Economic-Financial Performance Presentation
In accordance with U.S. SEC (Securities and Exchange Commission) guidelines and pursuant to items 100(a) and (b) of Regulation G, with the disclosure of 4Q16/2016 results, in order to avoid the disclosure of non-GAAP measures, we no longer disclose the economic-financial performance considering the proportional consolidation of the generation projects and the adjustment of the numbers for non-recurring items, focusing the disclosure in the IFRS criterion. Only in chapter 3.3, of Indebtedness, we continue presenting the information in the financial covenants criterion, considering that the proper reconciliation with the numbers in the IFRS criterion are presented in item 6.12 of this report.
Consolidation of Transmission Companies
As of 4Q17, the subsidiaries CPFL Transmissão Piracicaba and CPFL Transmissão Morro Agudo are consolidated in the financial statements of the segment "Conventional Generation".
13
3.2) Economic-Financial Performance
Consolidated Income Statement - CPFL ENERGIA (R$ Million) |
| 3T19 | 3T18 | Var. | 9M19 | 9M18 | Var. |
Gross Operating Revenue | 11,665 | 12,174 | -4.2% | 33,257 | 32,313 | 2.9% |
Net Operating Revenue | 7,746 | 8,130 | -4.7% | 21,910 | 21,450 | 2.1% |
Revenue from building the infrastructure | 562 | 463 | 21.4% | 1,488 | 1,203 | 23.7% |
Net Operating Revenue (ex-rev. from infrastructure) | 7,185 | 7,667 | -6.3% | 20,422 | 20,247 | 0.9% |
Cost of Electric Power | (4,779) | (5,401) | -11.5% | (13,532) | (13,953) | -3.0% |
Contribution Margin | 2,405 | 2,266 | 6.1% | 6,890 | 6,294 | 9.5% |
PMSO | (841) | (783) | 7.5% | (2,410) | (2,184) | 10.3% |
Other Operating Costs & Expenses | (1,008) | (873) | 15.4% | (2,803) | (2,462) | 13.8% |
Equity Income | 82 | 87 | -5.7% | 257 | 241 | 6.8% |
EBITDA1 | 1,618 | 1,548 | 4.5% | 4,654 | 4,284 | 8.6% |
Financial Income (Expense) | (132) | (279) | -52.6% | (564) | (832) | -32.3% |
Income Before Taxes | 1,068 | 881 | 21.2% | 2,859 | 2,259 | 26.5% |
Net Income | 748 | 626 | 19.4% | 1,892 | 1,496 | 26.5% |
Note: (1) EBITDA is calculated from the sum of net income, taxes, financial result and depreciation/amortization, according to CVM Instruction no. 527/12.
Breakdown of economic-financial performance by business segment
Income Statement by business segment - CPFL Energia (R$ million) |
| | Distribution | | Conventional Generation | | Renewable Generation | | Commerciali-zation | | Services | | Others | | Eliminations | | Total |
3Q19 |
Net operating revenue | | 6,134 | | 324 | | 599 | | 969 | | 147 | | 2 | | (429) | | 7,746 |
Operating costs and expenses | | (5,289) | | (68) | | (215) | | (945) | | (115) | | (9) | | 429 | | (6,211) |
Depreciation e amortization | | (204) | | (30) | | (162) | | (0) | | (6) | | (16) | | - | | (418) |
Income from electric energy service | | 642 | | 226 | | 222 | | 24 | | 26 | | (22) | | 0 | | 1,118 |
Equity accounting | | - | | 82 | | - | | - | | - | | - | | - | | 82 |
EBITDA | | 846 | | 338 | | 384 | | 25 | | 32 | | (7) | | (0) | | 1,618 |
Financial result | | (43) | | (43) | | (93) | | (8) | | 0 | | 54 | | - | | (132) |
Income (loss) before taxes | | 599 | | 265 | | 130 | | 17 | | 26 | | 32 | | (0) | | 1,068 |
Income tax and social contribution | | (224) | | (33) | | (6) | | (5) | | (9) | | (44) | | - | | (320) |
Net income (loss) | | 375 | | 232 | | 124 | | 12 | | 17 | | (12) | | (0) | | 748 |
| | | | | | | | | | | | | | | | | |
3Q18 |
Net operating revenue | | 6,465 | | 307 | | 622 | | 981 | | 140 | | 0 | | (385) | | 8,130 |
Operating costs and expenses | | (5,747) | | (58) | | (195) | | (937) | | (109) | | (8) | | 385 | | (6,670) |
Depreciation e amortization | | (183) | | (27) | | (156) | | (1) | | (6) | | (16) | | - | | (388) |
Income from electric energy service | | 535 | | 222 | | 271 | | 43 | | 26 | | (24) | | - | | 1,073 |
Equity accounting | | - | | 87 | | - | | - | | - | | - | | - | | 87 |
EBITDA | | 718 | | 336 | | 427 | | 43 | | 32 | | (8) | | - | | 1,548 |
Financial result | | (98) | | (62) | | (126) | | (1) | | 0 | | 8 | | - | | (279) |
Income (loss) before taxes | | 438 | | 247 | | 145 | | 42 | | 26 | | (16) | | - | | 881 |
Income tax and social contribution | | (161) | | (48) | | (24) | | (14) | | (6) | | (1) | | - | | (255) |
Net income (loss) | | 277 | | 198 | | 121 | | 27 | | 20 | | (17) | | - | | 626 |
| | | | | | | | | | | | | | | | | |
Variation |
Net operating revenue | | -5.1% | | 5.3% | | -3.6% | | -1.2% | | 4.5% | | - | | 11.4% | | -4.7% |
Operating costs and expenses | | -8.0% | | 16.4% | | 10.3% | | 0.8% | | 5.4% | | 7.6% | | 11.4% | | -6.9% |
Depreciation e amortization | | 11.8% | | 8.5% | | 3.9% | | -20.0% | | 8.3% | | 0.0% | | - | | 7.8% |
Income from electric energy service | | 19.8% | | 2.0% | | -17.9% | | -43.3% | | 0.0% | | -6.8% | | - | | 4.2% |
Equity accounting | | - | | -5.7% | | - | | - | | - | | - | | - | | -5.7% |
EBITDA | | 17.8% | | 0.5% | | -10.0% | | -43.0% | | 1.5% | | -19.7% | | - | | 4.5% |
Financial result | | -56.1% | | -30.0% | | -26.8% | | 559.5% | | - | | 542.3% | | - | | -52.6% |
Income (loss) before taxes | | 36.8% | | 7.3% | | -10.2% | | -60.2% | | 0.5% | | -304.5% | | - | | 21.2% |
Income tax and social contribution | | 39.2% | | -32.7% | | -74.8% | | -65.8% | | 40.7% | | - | | - | | 25.6% |
Net income (loss) | | 35.4% | | 17.1% | | 2.3% | | -57.3% | | -12.7% | | -29.3% | | - | | 19.4% |
14
Income Statement by business segment - CPFL Energia (R$ million) |
| | Distribution | | Conventional Generation | | Renewable Generation | | Commerciali-zation | | Services | | Others | | Eliminations | | Total |
9M19 |
Net operating revenue | | 17,837 | | 891 | | 1,345 | | 2,542 | | 451 | | 2 | | (1,157) | | 21,910 |
Operating costs and expenses | | (15,138) | | (173) | | (517) | | (2,465) | | (344) | | (34) | | 1,157 | | (17,514) |
Depreciation e amortization | | (590) | | (89) | | (484) | | (1) | | (18) | | (47) | | - | | (1,231) |
Income from electric energy service | | 2,108 | | 629 | | 343 | | 76 | | 88 | | (79) | | (0) | | 3,165 |
Equity accounting | | - | | 257 | | - | | - | | - | | - | | - | | 257 |
EBITDA | | 2,699 | | 975 | | 827 | | 77 | | 107 | | (32) | | 0 | | 4,654 |
Financial result | | (174) | | (126) | | (316) | | (17) | | 1 | | 68 | | - | | (564) |
Income (loss) before taxes | | 1,934 | | 760 | | 28 | | 59 | | 89 | | (11) | | 0 | | 2,859 |
Income tax and social contribution | | (707) | | (135) | | (35) | | (19) | | (26) | | (44) | | - | | (967) |
Net income (loss) | | 1,227 | | 624 | | (8) | | 40 | | 63 | | (55) | | 0 | | 1,892 |
| | | | | | | | | | | | | | | | | |
| | | | | | | | | | | | | | | | | |
9M18 |
Net operating revenue | | 17,307 | | 859 | | 1,420 | | 2,534 | | 380 | | 0 | | (1,050) | | 21,450 |
Operating costs and expenses | | (15,029) | | (141) | | (510) | | (2,452) | | (301) | | (26) | | 1,050 | | (17,408) |
Depreciation e amortization | | (570) | | (88) | | (468) | | (2) | | (17) | | (47) | | - | | (1,192) |
Income from electric energy service | | 1,708 | | 631 | | 442 | | 80 | | 62 | | (73) | | - | | 2,850 |
Equity accounting | | - | | 241 | | - | | - | | - | | - | | - | | 241 |
EBITDA | | 2,278 | | 960 | | 910 | | 82 | | 79 | | (26) | | - | | 4,284 |
Financial result | | (249) | | (205) | | (375) | | (13) | | (1) | | 10 | | - | | (832) |
Income (loss) before taxes | | 1,459 | | 667 | | 68 | | 67 | | 62 | | (63) | | - | | 2,259 |
Income tax and social contribution | | (537) | | (132) | | (56) | | (24) | | (15) | | 1 | | - | | (764) |
Net income (loss) | | 921 | | 535 | | 12 | | 43 | | 46 | | (62) | | - | | 1,496 |
| | | | | | | | | | | | | | | | | |
Variation |
Net operating revenue | | 3.1% | | 3.6% | | -5.3% | | 0.3% | | 18.7% | | - | | 10.2% | | 2.1% |
Operating costs and expenses | | 0.7% | | 22.9% | | 1.5% | | 0.5% | | 14.4% | | 29.7% | | 10.2% | | 0.6% |
Depreciation e amortization | | 3.5% | | 1.8% | | 3.4% | | -17.9% | | 8.5% | | 0.0% | | - | | 3.3% |
Income from electric energy service | | 23.5% | | -0.4% | | -22.4% | | -5.8% | | 41.9% | | 7.7% | | - | | 11.0% |
Equity accounting | | - | | 6.8% | | - | | - | | - | | - | | - | | 6.8% |
EBITDA | | 18.5% | | 1.6% | | -9.1% | | -6.0% | | 34.8% | | 21.6% | | - | | 8.6% |
Financial result | | -30.1% | | -38.3% | | -15.8% | | 25.9% | | - | | 546.8% | | - | | -32.3% |
Income (loss) before taxes | | 32.6% | | 13.9% | | -59.1% | | -12.0% | | 45.0% | | -82.6% | | - | | 26.5% |
Income tax and social contribution | | 31.6% | | 2.6% | | -36.6% | | -19.5% | | 69.7% | | - | | - | | 26.7% |
Net income (loss) | | 33.2% | | 16.6% | | -163.7% | | -7.8% | | 36.7% | | -11.4% | | - | | 26.5% |
Note: an analysis of the economic-financial performance by business segment is presented in chapter 6.
Operating Revenue
In 3Q19, gross operating revenue reached R$ 11,665 million, representing a decrease of 4.2% (R$ 509 million). Deductions from the gross operating revenue was of R$ 3,918 million in 3Q19, representing a decrease of 3.1% (R$ 126 million). Net operating revenue reached R$ 7,746 million in 3Q19, registering a decrease of 4.7% (R$ 384 million).
The main factors that affected the net operating revenue were:
· Decrease of revenues in the Distribution segment, in the amount of R$ 331 million (for more details, see item 5.1.1);
· Decrease of revenues in the Renewable Generation segment, in the amount of R$ 23 million;
· Decrease of revenues in the Commercialization segment, in the amount of R$ 12 million;
· Variation of R$ 44 million in the eliminations, due to the sales among the group’s segments;
Partially offset by:
· Increase of revenues in the Conventional Generation segment, in the amount of R$ 16 million;
· Increase of revenues in the Services segment, in the amount of R$ 6 million.
In 9M19, gross operating revenue reached R$ 33,257 million, representing an increase of 2.9% (R$ 944 million). Deductions from the gross operating revenue was of R$ 11,346 million in 9M19, representing an increase of 4.5% (R$ 484 million). Net operating revenue reached R$ 21,910 million in 9M19, registering an increase of 2.1% (R$ 460 million).
15
The main factors that affected the net operating revenue were:
· Increase of revenues in the Distribution segment, in the amount of R$ 530 million (for more details, see item 5.1.1);
· Increase of revenues in the Services segment, in the amount of R$ 71 million;
· Increase of revenues in the Conventional Generation segment, in the amount of R$ 31 million;
· Increase of revenues in the Commercialization segment, in the amount of R$ 8 million;
Partially offset by:
· Variation of R$ 107 million in the eliminations, due to the sales among the group’s segments;
· Decrease of revenues in the Renewable Generation segment, in the amount of R$ 76 million.
Cost of Electric Energy
Cost of Electric Energy (R$ Million) |
| 3Q19 | 3Q18 | Var. | 9M19 | 9M18 | Var. |
Cost of Electric Power Purchased for Resale | | | | | | |
Energy from Itaipu Binacional | 752 | 751 | 0.1% | 2,102 | 2,025 | 3.8% |
PROINFA | 99 | 82 | 20.9% | 303 | 250 | 21.1% |
Energy Purchased through Auction in the Regulated Environment, Bilateral Contracts and Energy Purchased in the Spot Market | 3,711 | 4,660 | -20.4% | 10,387 | 11,077 | -6.2% |
PIS and COFINS Tax Credit | (412) | (490) | -15.9% | (1,083) | (1,186) | -8.7% |
Total | 4,150 | 5,003 | -17.0% | 11,709 | 12,167 | -3.8% |
| | | | | | | |
Charges for the Use of the Transmission and Distribution System | | | | | | |
Basic Network Charges | 544 | 487 | 11.6% | 1,530 | 1,630 | -6.1% |
Itaipu Transmission Charges | 74 | 71 | 4.7% | 211 | 198 | 6.2% |
Connection Charges | 40 | 46 | -11.9% | 134 | 116 | 15.0% |
Charges for the Use of the Distribution System | 11 | 13 | -13.2% | 36 | 35 | 3.9% |
ESS / EER | 22 | (179) | - | 94 | (4) | - |
PIS and COFINS Tax Credit | (63) | (40) | 58.1% | (182) | (189) | -3.9% |
Total | 629 | 399 | 57.8% | 1,822 | 1,786 | 2.0% |
| | | | | | | |
Cost of Electric Energy | 4,779 | 5,401 | -11.5% | 13,532 | 13,953 | -3.0% |
In 3Q19, the cost of electric energy, comprising the purchase of electricity for resale and charges for the use of the distribution and transmission system, amounted to R$ 4,779 million, registering a reduction of 11.5% (R$ 622 million).
The factors that explain these variations follow below:
· The cost of electric power purchased for resale reached R$ 4,150 million in 3Q19, a reduction of 17.0% (R$ 853 million), due to the following factors:
(i) Reduction of 20.4% (R$ 949 million) in thecost of energy purchased through auction in the regulated environment, bilateral contracts and energy purchased in the spot market, due to the reduction of 28.9% in the average purchase price (R$ 221.62/MWh in 3Q19 vs. R$ 311.58/MWh in 3Q18), partially offset by the increase of 12.0% (1,790 GWh) in the volume of purchased energy;
Partially offset by:
(ii) Reduction of 15.9% (R$ 78 million) inPIS/Cofins tax credits (cost reducer), generated from the energy purchase;
16
(iii) Increase of 20.9% (R$ 17 million) in the amount ofProinfa cost, due to the increases of 19.8% in the average purchase price (R$ 348.39/MWh in 3Q19 vs. R$ 290.78/MWh in 3Q18) and of 0.9% (2 GWh) in the volume of purchased energy;
(iv) Increase of 0.1% (R$ 1 million) in thecost of energy from Itaipu, due to the increase of 1.2% in the average purchase price (R$ 270.76/MWh in 3Q19 vs. R$ 267,46/MWh in 3Q18), partially offset by the decrease of 1.1% (30 GWh) in the volume of purchased energy.
· Charges for the use of the transmission and distribution system reached R$ 629 million in 3Q19, an increase of 57.8% (R$ 231 million), due to the following factors:
(i) Variation of R$ 201 million insector charges (System Service Usage Charges – ESS / Reserve Energy Charges – EER), due to CONER resources that drastically reduced this expense in 3Q18;
(ii) Increase of 8.5% (R$ 53 million) in theconnection and transmission charges (basic network, Itaipu transmission, connection and usage of the distribution system);
Partially offset by:
(iii) Increase of 58.1% (R$ 23 million) inPIS/Cofins tax credits (cost reducer), generated from the charges.
In 9M19, the cost of electric energy, comprising the purchase of electricity for resale and charges for the use of the distribution and transmission system, amounted to R$ 13,532 million, registering a decrease of 3.0% (R$ 421 million).
The factors that explain these variations follow below:
· The cost of electric power purchased for resale reached R$ 11,709 million in 9M19, a decrease of 5.5% (R$ 395 million), due to the following factors:
(i) Decrease of 6.2% (R$ 690 million) in thecost of energy purchased through auction in the regulated environment, bilateral contracts and energy purchased in the spot market, due to the decrease of 13.4% in the average purchase price (R$ 210.57/MWh in 9M19 vs. R$ 243.23/MWh in 9M18), partially offset by the increase of 8.3%(3,785 GWh) in the volume of purchased energy;
Partially offset by:
(ii) Reduction of 8.7% (R$ 103 million) inPIS/Cofins tax credits (cost reducer), generated from the energy purchase;
(iii) Increase of 3.8% (R$ 76 million) in thecost of energy from Itaipu, due to the increase of 4.6% in the average purchase price (R$ 225.03/MWh in 9M19 vs. R$ 243.71/MWh in 9M18), partially offset by the reduction of 0.8% (69 GWh) in the volume of purchased energy;
(iv) Increase of 21.1% (R$ 53 million) in the amount ofProinfa cost, due to the increase of 21.0% in the average purchase price (R$ 375.31/MWh in 9M19 vs. R$ 310.16/MWh in 9M18) and the increase of 0.1% (1 GWh) in the volume of purchased energy.
· Charges for the use of the transmission and distribution system reached R$ 1,822 million in 9M19, an increase of 2.0% (R$ 36 million), due to the following factors:
17
(i) Variation of R$ 97 million insector charges (ESS/EER);
(ii) Reduction of 3.9% (R$ 7 million) inPIS/Cofins tax credits (cost reducer), generated from the charges.
Partially offset by:
(i) Reduction of 3.5% (R$ 69 million) in theconnection and transmission charges (basic network, Itaipu transmission, connection and usage of the distribution system).
Contribution margin
In 3Q19,contribution margin reached R$ 2,405 million, compared to R$ 2,266 in 3Q18, an increase of 6.1% (R$ 139 million). In 9M19,contribution margin reached R$ 6,890 million, compared to R$ 6,294 million in 9M18, an increase of 9.5% (R$ 596 million). Quarter and year-to-date results mainly reflect the good performance of the Distribution segment.
Operating Costs and Expenses
Operating costs and expenses reached R$ 1,849 million in 3Q19, compared to R$ 1,656 million in 3Q18, an increase of 11.7% (R$ 193 million). In 9M19, operating costs and expenses reached R$ 5,213 million, compared to R$ 5,213 million in 9M18, compared to R$ 4,647 million in 9M18, an increase of 12.2% (R$ 567 million).
The factors that explain these variations follow below:
PMSO
Reported PMSO (R$ million) |
| 3Q19 | 3Q18 | Variation | 9M19 | 9M18 | Variação |
| R$ MM | % | R$ MM | % |
Personnel | (364) | (344) | (20) | 5.7% | (1,077) | (1,034) | (43) | 4.2% |
Material | (71) | (62) | (9) | 14.4% | (204) | (188) | (16) | 8.5% |
Outsourced Services | (172) | (162) | (10) | 6.2% | (515) | (499) | (17) | 3.4% |
Other Operating Costs/Expenses | (235) | (215) | (20) | 9.2% | (613) | (463) | (150) | 32.3% |
Allowance for doubtful accounts | (61) | (45) | (16) | 34.1% | (195) | (114) | (81) | 71.3% |
Legal and judicial expenses | (55) | (69) | 14 | -19.9% | (126) | (113) | (14) | 12.0% |
Others | (118) | (100) | (18) | 17.9% | (292) | (237) | (55) | 23.2% |
Total Reported PMSO | (841) | (783) | (58) | 7.5% | (2,410) | (2,184) | (226) | 10.3% |
The PMSO item reached R$ 841 million in 3Q19, compared to R$ 783 million in 3Q18, an increase of 7.5% (R$ 58 million), due to the following factors:
(i) Personnel - increase of 5.7% (R$ 20 million), mainly due to the collective bargaining agreement and the expenses with CPFL Renováveis integration process;
(ii) Material - increase of 14.4% (R$ 9 million), due to the increases in grid and fleet maintenance;
(iii) Outsourced services - increase of 6.2% (R$ 10 million), mainly due to machinery and equipment maintenance;
18
(iv) Other operational costs/expenses-increase of 9.2% (R$ 20 million), mainly due to:
ü Increase of 54.9% (R$ 17 million) in assets write-off, mainly in CPFL Renováveis and the distribution companies;
ü Increase of 34.1% (R$ 16 million) in allowance for doubtful account;
Partially offset by:
ü Decrease of 19.9% (R$ 14 million) in legal and judicial expenses.
In 9M19, the PMSO item reached R$ 2,410 million, compared to R$ 2,184 million in 9M18, an increase of 10.3% (R$ 226 million), due to the following factors:
(i) Personnel - increase of 4.2% (R$ 43 million), mainly due to the collective bargaining agreement and the expenses with CPFL Renováveis integration process;
(ii) Material - increase of 8.5% (R$ 16 million), mainly due to the increase in fleet maintenance and uniform and equipment;
(iii) Outsourced services - increase of 3.4% (R$ 17 million), mainly due to the increase in machinery and equipment maintenance;
(iv) Other operational costs/expenses - increase of 32.3% (R$ 150 million), mainly due to:
ü Increase of 71.3% (R$ 81 million) in allowance for doubtful account;
ü Increase of 36.2% (R$ 27 million) in assets write-off;
ü Increase of 12.0% (R$ 14 million) in legal and judicial expenses;
ü Increase of 18.9% (R$ 12 million) in collection fee;
ü Other effects (R$ 16 million).
Other operating costs and expenses
Other operating costs and expenses reached R$ 1,008 million in 3Q19, compared to R$ 873 million in 3Q18, registering an increase of 15.4% (R$ 135 million), due to the following factors:
· Increase of 21.2% (R$ 98 million) inCosts of Building the Infrastructure item;
· Increase of 29.1% (R$ 7 million) inPrivate Pension Fund item, due to the registration of the impacts of the 2019 actuarial report;
· Increase of 7.8% (R$ 30 million) inDepreciation and Amortization item.
In 9M19, other operating costs and expenses reached R$ 2,803 million, compared to R$ 2,462 million in 9M18, registering an increase of 13.8% (R$ 341 million), due to the following factors:
· Increase of 23.6% (R$ 284 million) inCosts of Building the Infrastructure item;
· Increase of 26.5% (R$ 18 million) inPrivate Pension Fund item, due to the registration of the impacts of the 2019 actuarial report;
· Increase of 3.3% (R$ 39 million) inDepreciation and Amortization item.
19
EBITDA
In 3Q19,EBITDA reached R$ 1,618 million, compared to R$ 1,548 million in 3Q18, registering an increase of 4.5% (R$ 70 million), mainly reflecting the good performance of the Distribution segment, partially offset by lower EBITDA in the Conventional and Renewable Generation segments.
In 9M19,EBITDA reached R$ 4,654 million, compared to R$ 4,284 million in 9M18, registering an increase of 8.6% (R$ 370 million), mainly reflecting the performance of the Distribution segment.
EBITDA is calculated according to CVM Instruction no. 527/12 and showed in the table below:
EBITDA and Net Income conciliation (R$ million) |
| 3Q19 | 3Q18 | Var. | 9M19 | 9M18 | Var. |
Net Income | 748 | 626 | 19.4% | 1,892 | 1,496 | 26.5% |
Depreciation and Amortization | 418 | 388 | | 1,231 | 1,192 | |
Financial Result | 132 | 279 | | 564 | 832 | |
Income Tax / Social Contribution | 320 | 255 | | 967 | 764 | |
EBITDA | 1,618 | 1,548 | 4.5% | 4,653 | 4,283 | 8.6% |
Financial Result
Financial Result (R$ Million) |
| 3Q19 | 3Q18 | Var. | 9M19 | 9M18 | Var. |
Revenues | 280 | 213 | 31.8% | 718 | 579 | 24.1% |
Expenses | (412) | (492) | -16.1% | (1,282) | (1,411) | -9.2% |
Financial Result | (132) | (279) | -52.6% | (564) | (832) | -32.3% |
In 3Q19,net financial expense was of R$ 132 million, a reduction of 52.6% (R$ 147 million) compared to the net financial expense of R$ 279 million reported in 3Q18. The items explaining this variation are as follows:
(i) Reduction of 32.9% (R$ 109 million) in theexpenses with the net debt (debt charges net of income from financial investments), reflecting the maintenance of a higher cash balance throughout the process of completing the transfer of CPFL Renováveis shares from State Grid to CPFL Energia (R$ 56 million), as well as a reduction in indebtedness (for more details, see item 4.3.1 – Debt IFRS) and interest (CDI interest rate);
(ii) Reduction of 89.8% (R$ 32 million) in themark-to-market(non-cash effect);
(iii) Reduction of 43.6% (R$ 14 million) in theother financial revenues and expenses;
Partially offset by:
(iv) Reduction of 8.6% (R$ 8 million) inadditions and late payment fines.
20
In 9M19,net financial expense was of R$ 564 million, a reduction of 32.3% (R$ 268 million) compared to the net financial expense of R$ 832 million reported in 9M18. The items explaining this variation are as follows:
(i) Reduction of 16.4% (R$ 165 million) in theexpenses with the net debt (debt charges net of income from financial investments), due to a higher cash balance in 3Q19 and the reduction in the indebtedness;
(ii) Reduction of 99,3% (R$ 44 million) in themark-to-market (non-cash effect);
(iii) Increase of 62.9% (R$ 28 million) insectoral financial assets and liabilities updates;
(iv) Decrease of 18.1% (R$ 16 million) in theother financial revenues and expenses;
(v) Increase of 5.7% (R$ 15 million) inadditions and late payment fines.
Net Income
Net incomewas of R$ 748 million in 3Q19, registering an increase of 19.4% (R$ 122 million) if compared to the net income of R$ 626 million observed in 3Q18. In addition to a good EBITDA performance, the increase in financial income contributed to this result.
In 9M19,net incomewas of R$ 1,892 million, registering an increase of 26.5% (R$ 396 million) if compared to the net income of R$ 1.496 million observed in 9M18.
3.3) Indebtedness
3.3.1) Debt (IFRS)
On September 30, 2019, the financial debt of the CPFL Group was R$ 20.7 billion, a variation of -4% compared to the last quarter, the total financial debt was of R$ 19.5 billion.
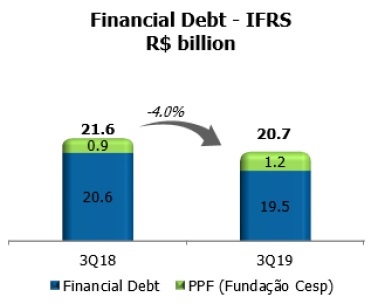
Note: includes the mark-to-market (MTM) effect and borrowing costs.
21
Debt Profile – R$ billion IFRS

The CPFL Group constantly seek to mitigate any possibility of markets fluctuations risks and, because of these, a share of its debts portfolio, around R$ 4.8 billion, have hedge operations. Considering, for instance, foreign loans, which represents almost 25% of the total debts (IFRS criteria), it was contracted swap operations, aiming foreign exchange protection as well as the rate linked to the contract.
Indexation After Hedge
3Q18 vs. 3Q19

Note: Considering the foreign loan debts (24.66% in the 3Q19), it is contracted swap operations, seeking exchange risks and the duties settled by contract.
22
Net Debt in IFRS criteria
IFRS | R$ Million | 3Q19 | 3Q18 | Var. % |
Financial Debt (including hedge) | (19,502) | (20,650) | -5.6% |
(+) Available Funds | 3,232 | 3,579 | -9.7% |
(=) Net Debt | (16,270) | (17,071) | -4.7% |
Debt by segment (R$ Million – IFRS)

Notes:
1) The Generation segment considers CPFL Geração, Ceran and CPFL Transmissão Piracicaba; Service segment considers CPFL Serviços and CPFL Eficiência Energética.
2) Includes the mark-to-market (MTM) effect and borrowing costs.
Debt Amortization Schedule in IFRS (Sep-19)
The Group CPFL constantly evaluates market opportunities to close deals that goes along with the company’s strategies and policies. Thus, in view of the large market access that CPFL has at its disposal to liquidity sources, through diversified funding alternatives, through either local market financing lines or international market, the debt portfolio of CPFL Energia presents different funding instruments.
The cash position at the end of 3Q19 had a coverage ratio of0.93x the amortizations of the next 12 months, which allows the CPFL Group to honor all amortization commitments until the beginning of the second semester of 2020. The average amortization term, calculated from this schedule is of3.24 years.
The debt amortization schedule of the financial debt bellow considers only the notional of the debts and derivatives.
23

Note:
1) Considers only the notional and hedge of the debt in total of R$ 19,664 million. In order to reach the value of debt in IFRS, of R$ 19,502 million, should be included charges and the mark-to-market (MTM) effect and cost with funding;
Gross Debt Cost¹ in IFRS criteria

Note: (1) the calculation considers the average cost in the end of the period, since it better reflects the interest rate variations.
Ratings
The following table shows the corporate ratings of CPFL Energia.Ratings of CPFL Energia - Corporate Credit |
Agency | Scale | Rating | Perspective |
Standard & Poor's | Brazilian | brAAA | Stable |
|
Fitch Ratings | Brazilian | AAA(bra) | Stable |
|
Moody's | Brazilian | Aaa.br | Stable |
Global | Ba1 |
24
3.3.2) Debt in Financial Covenants Criteria
Indexation and Debt Cost in Financial Covenants Criteria
Indexation¹ after Hedge² in Financial Covenants criteria
3Q18 vs. 3Q19

1) The total amount considers a proportional consolidation of CPFL Renováveis, CERAN, ENERCAN, Foz do Chapecó and EPASA;
2) For debts contracted in foreign currency (23.85% of total), swap operations were contracted, aiming the protection of the foreign exchange and the rate fluctuations linked to the contract.
Net Debt in Financial Covenants Criteria and Leverage
In the end of the 3Q19, theProforma Net Debt totaledR$ 16.849 million, an increase of8.7% compared to net debt position at the end of 3Q18, forR$ 15,503 million.
Covenant Criteria (*) - R$ Million | 3Q19 | 3Q18 | Var. |
Financial Debt (including hedge)1 | (20,174) | (18,589) | 8.5% |
(+) Available Funds | 3,325 | 3,086 | 7.8% |
(=) Net Debt | (16,849) | (15,503) | 8.7% |
EBITDA Proforma2 | 6,296 | 5,306 | 18.7% |
Net Debt / EBITDA | 2.68 | 2.92 | -8.4% |
1) The total amount considers a proportional consolidation of CPFL Renováveis, CERAN, ENERCAN, Foz do Chapecó and EPASA;
2)Proforma EBITDA in the financial covenants criteria: adjusted according to the equivalent participation of CPFL Energia in each of its subsidiaries, with the inclusion of regulatory assets and liabilities and also the historical EBITDA of newly acquired projects.
In line with the criteria for calculation of financial covenants of loan agreements with financial institutions, net debt and the EBITDA are adjusted according to the equivalent stake of CPFL Energia in each of its subsidiaries.
Considering that, theProforma Net Debt totaledR$ 16,849 million andProforma EBITDA in the last 12 months reachedR$ 6,296 million, the ratioProforma Net Debt / EBITDA at the end of 3Q19 reached2.68x.
25
Leverage in Financial covenants criteria - R$ billion

Note: In the 2Q19, if not consider Re-IPO impact, Financial Covenant was 2.57x (Net Debt w/o Re-IPO impact was R$ 14.6 billion).
In the end of the 3Q19, to calculate the leverage, it was considered the EBITDA of the last 12 months, adjusted by a proportional consolidation and including hedge. Besides, it was deduced the total amount of hedges from the debt. The consolidation of CPFL Renováveis in covenants criteria, which was 53.6% in the 2Q19 and in the end of the 3Q19 was 99.94%, affected directly the increase of the Net Debt and EBITDA in the 3Q19, and, consequently, the leverage as well.
3.4) Investments
3.4.1) Actual Investments
Investments (R$ Million) |
Segment | 3Q19 | 3Q18 | Var. | 1H19 | 1H18 | Var. |
Distribution | 550 | 440 | 25.1% | 1,436 | 1,152 | 24.6% |
Generation - Conventional | 2 | 2 | -27.2% | 7 | 2.83 | 141.3% |
Generation - Renewable | 45 | 70 | -35.0% | 95 | 174 | -45.6% |
Commercialization | 1 | 1 | -14.6% | 2 | 2 | -13.2% |
Services and Others2 | 10 | 10 | 3.5% | 32 | 35 | -9.3% |
Transmission1 | 8 | 3 | 230.6% | 11 | 3 | 279.6% |
Total | 616 | 525 | 17.4% | 1,582 | 1,370 | 16% |
Note: 1) Others – basically refer to assets and transactions that are not related to the listed segments.
In 3Q19, the investments were R$ 616 million, an increase of 17.4%, compared to R$ 525 million registered in 3Q18. We also highlight investments made by CPFL Energia in the Distribution segment:
a. Expansion and strengthening of the electric system;
b. Electricity system maintenance and improvements;
c. Operational infrastructure;
d. Upgrade of management and operational support systems;
e. Customer help services;
f. Research and development programs.
3.4.2) Investments Forecasts
On November 30, 2018, CPFL Energia’s Board of Directors approved Board of Executive Officers’ proposal for 2019 Annual Budget and 2020/2023 Multiannual Plan for the Company, which was previously discussed by the Budget and Corporate Finance Commission.
26
Investments Forecasts (R$ million)1

Notes:
1) Constant currency;
2) Investment Plan released in 4Q18/2018 Earnings Release, from March 2019;
3) Disregard investments in Special Obligations (among other items financed by consumers);
4) Conventional + Renewable.
27
4) STOCK MARKETS
4.1) Stock Performance
CPFL Energia is listed on both the B3 (Novo Mercado) and the New York Stock Exchange (NYSE) (ADR Level III), segments with the highest levels of corporate governance.
B3 | NYSE |
Date | CPFE3 (R$) | IEE | IBOV | Date | CPL (US$) | DJBr20 | Dow Jones |
09/30/2019 | R$ 32.89 | 68,122 | 104,745 | 09/30/2019 | $ 15.77 | 22,562 | 26,917 |
06/30/2019 | R$ 30.43 | 63,831 | 100,967 | 06/30/2019 | $ 15.62 | 24,736 | 26,600 |
09/30/2018 | R$ 23.87 | 39,351 | 79,342 | 09/30/2018 | $ 11.82 | 19,406 | 26,458 |
QoQ | 8.1% | 6.7% | 3.7% | QoQ | 1.0% | -8.8% | 1.2% |
YoY | 37.8% | 73.1% | 32.0% | YoY | 33.4% | 16.3% | 1.7% |
On June 30, 2019, CPFL Energia’s shares closed at R$ 32.89 per share on the B3 and US$ 15.77 per ADR on the NYSE, an appreciation of 8.1% and 1.0% in the quarter, respectively. Considering the variation in the last 12 months, the shares and ADRs presented an appreciation of 37.8% on the B3 and of 33.4% on the NYSE.
4.2) Daily Average Volume
The daily trading volume in 3Q19 averaged R$ 102.6 million, of which R$ 100.6 million on the B3 and R$ 2.0 million on the NYSE, representing an increase of 932.1% in relation to 3Q18, while daily trading volume of the IBOVESPA and IEE had an increase of 170% and 231%, respectively. This increase in the volume of CPFL Energia shares is mainly due to the increase in the Company's free float from 5.25% to 16.29% after the Public Offering of Shares concluded on June 12, 2019.
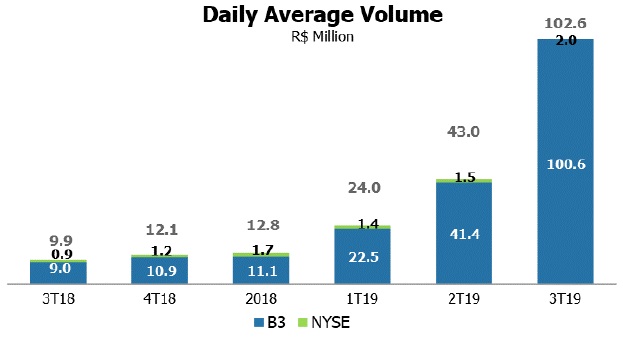
Note: Considers the sum of the average daily volume on the B3 and NYSE.
28
5) PERFORMANCE OF BUSINESS SEGMENTS
5.1) Distribution Segment
5.1.1) Economic-Financial Perfomance
Consolidated Income Statement - Distribution (R$ Million) |
| 3Q19 | 3Q18 | Var. | 9M19 | 9M18 | Var. |
Gross Operating Revenue | 9,870 | 10,317 | -4.3% | 28,693 | 27,698 | 3.6% |
Net Operating Revenue | 6,134 | 6,465 | -5.1% | 17,837 | 17,307 | 3.1% |
Cost of Electric Power | (4,009) | (4,594) | -12.7% | (11,552) | (11,918) | -3.1% |
Operating Costs & Expenses | (1,483) | (1,336) | 11.0% | (4,176) | (3,681) | 13.4% |
EBIT | 642 | 535 | 19.8% | 2,108 | 1,708 | 23.5% |
EBITDA(1) | 846 | 718 | 17.8% | 2,699 | 2,278 | 18.5% |
Financial Income (Expense) | (43) | (98) | -56.1% | (174) | (249) | -30.1% |
Income Before Taxes | 599 | 438 | 36.8% | 1,934 | 1,459 | 32.6% |
Net Income | 375 | 277 | 35.4% | 1,227 | 921 | 33.2% |
Note:
(1) EBITDA (IFRS) is calculated from the sum of net income, taxes, financial result and depreciation/amortization, as CVM Instruction no. 527/12.
Sectoral Financial Assets and Liabilities
On September 30, 2019, the balance of sectoral financial assets and liabilities was positive in R$ 1,516 million. If compared to December 31, 2018, there was a reduction of R$ 8 million, as demonstrated in the chart below.
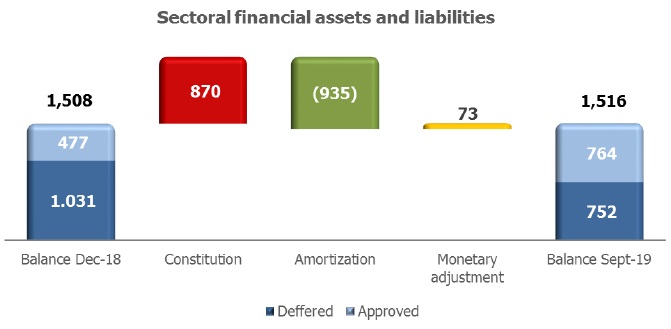
The variation in this balance was due to the constitution of an asset of R$ 870 million, mainly due to higher costs with Itaipu energy (differences between real exchange rate and tariff coverage and GSF). On the other hand, there was an amortization of R$ 935 million, mainly favored by the tariff readjustments that took place in this period, allowing to pass-through the costs to the consumers. The monetary adjustment of assets and liabilities totaled R$ 73 million.
29
Operating Revenue
Operating Revenue (R$ Million) |
| 3Q19 | 3Q18 | Var. | 9M19 | 9M18 | Var. |
Gross Operating Revenue | | | | | | |
Revenue with Energy Sales (Captive + TUSD) | 8,138 | 7,790 | 4.5% | 24,919 | 21,958 | 13.5% |
Short-term Electric Energy | 441 | 393 | 12.1% | 799 | 768 | 4.0% |
Revenue from Building the Infrastructure of the Concession | 551 | 462 | 19.4% | 1,477 | 1,202 | 22.9% |
Sectoral Financial Assets and Liabilities | 238 | 1,089 | -78.1% | (65) | 1,943 | -103.3% |
CDE Resources - Low-income and Other Tariff Subsidies | 352 | 407 | -13.5% | 1,119 | 1,162 | -3.7% |
Adjustments to the Concession's Financial Asset | 63 | 99 | -36.2% | 236 | 302 | -22.0% |
Other Revenues and Income | 104 | 88 | 18.3% | 274 | 403 | -32.1% |
| | (17) | (10) | 66.3% | (66) | (40) | 64.6% |
Total | 9,870 | 10,317 | -4.3% | 28,693 | 27,698 | 3.6% |
| | | | | | | |
Deductions from the Gross Operating Revenue | | | | | | |
ICMS Tax | (1,606) | (1,565) | 2.6% | (4,960) | (4,443) | 11.6% |
PIS and COFINS Taxes | (847) | (902) | -6.0% | (2,453) | (2,436) | 0.7% |
CDE Sector Charge | (947) | (1,010) | -6.3% | (2,991) | (2,829) | 5.7% |
R&D and Energy Efficiency Program | (55) | (59) | -6.2% | (162) | (158) | 2.8% |
PROINFA | (44) | (38) | 14.5% | (127) | (112) | 13.4% |
Tariff Flags and Others | (229) | (271) | -15.5% | (142) | (395) | -64.1% |
Others | (7) | (6) | 14.6% | (21) | (18) | 18.0% |
Total | (3,736) | (3,852) | -3.0% | (10,856) | (10,391) | 4.5% |
| | | | | | |
Net Operating Revenue | 6,134 | 6,465 | -5.1% | 17,837 | 17,307 | 3.1% |
In 3Q19, gross operating revenue amounted to R$ 9,870 million, an increase of 4.3% (R$ 447 million), due to the following factors:
· Increase of 4.5% (R$ 348 million) in the revenue with energy sales (captive + free clients), due to: (i) the positive average tariff adjustment in the distribution companies for the period between 3Q18 and 3Q19 (average increase of 19.25% in CPFL Piratininga in October-18, of 13.31% in CPFL Santa Cruz in March-19, of 8.66% in CPFL Paulista in April-19, of 8.63% in RGE and 1.72% in RGE Sul in June-19); and (ii) the increase of 0.7% in the load in the concession area1;
· Increase of 19.4% (R$ 89 million) in revenue from building the infrastructure of the concession, which has its counterpart in the same amount in operational costs;
· Increase of 12.1% (R$ 47 million) in Short-term Electric Energy;
· Increase of 11.9% (R$ 9 million) in other items;
Partially offset by:
· Decrease of 78.1% (R$ 850 million) in the accounting of Sectoral Financial Assets/Liabilities;
· Decrease of 13.5 % (R$ 55 million) in insubsidy of lower-income;
· Decrease of 36.2% (R$ 36 million) in the adjustments to the Concession´s Financial Asset, despite the higher IPCA (0.31% in 3Q19 versus 1.50% in 3Q18), despite accounting of tariff revision processes in CPFL Piratininga in 3Q19 (extraordinary effect in the amount of R$ 42 million, due to the RAB appraisal report);
Deductions from the gross operating revenue were R$ 3,736 million in 3Q19, representing a decrease of 3.0% (R$ 116 million), due to the following factors:
· Decrease of 6.3% (R$ 63 million) in the CDE sector charge;
1 ) If Excluding the effect of consumer migration that didn’t impact the Company's results.
30
· Decrease of 15.5% (R$ 42 million) in tariff flags approved by CCEE;
· Decrease of 0.6% (R$ 14 million) in taxes (ICMS and PIS/Cofins);
Partially offset by the following factors:
· Increase of 14.5% (R$ 6 million) in the Proinfa;
· Increase of 14.6% (R$ 1 million) in the others items.
Net operating revenue reached R$ 6.134 million in 3Q19, representing a decrease of 5.1% (R$ 331 million).
In 9M19, gross operating revenue amounted to R$ 28,693 million, an increase of 3.6% (R$ 995 million), due to the following factors:
· Increase of 13.5% (R$ 2,961 million) in the revenue with energy sales (captive + free clients), due to: (i) the positive average tariff adjustment in the distribution companies for the period between September 2018 and September 2019; and (ii) the increase of 1.6% in the load within the concession area1;
· Increase of 22.9% (R$ 275 million) in revenue from building the infrastructure of the concession;
· Increase of 4.0% (R$ 31 million) in Short-term Electric Energy;
Partially offset by:
· Variation of R$ 2,007 million in the Sectoral Financial Assets/Liabilities, from a sectoral financial asset of R$ 1,943 million in 9M18 to a liability of R$ 65 million in 9M19;
· Decrease of 32.1% (R$ 129 million) in other revenues and income, due to a refund (extraordinary effect, in the amount of R$ 133 million), in the 20182;
· Decrease of 22.0% (R$ 66 million) in the adjustments to the Concession´s Financial Asset;
· Decrease of 3.7% (R$ 43 million) in the CDE sector charge;
· Increase of 64.6% (R$ 26 million) in compensatory fines (DIC / FIC) mainly due to rainstorms observed in the Southern region in early 2019.
Deductions from the gross operating revenue were R$ 10,856 million in 9M19, representing an increase of 4.5% (R$ 465 million), due to the following factors:
· Increase of 7.8% (R$ 534 million) in taxes (ICMS and PIS and COFINS);
· Increase of 5.7% (R$ 161 million) in the CDE sector charge;
· Increase of 7.9% (R$ 23 million) in the others items.
Partially offset by:
· Decrease of 64.1% (R$ 253 million) in tariff flags approved by CCEE;
Net operating revenue reached R$ 17,837 million in 9M19, representing an increase of 3.1% (R$ 530 million).
2 Law n. 12.111/2009 determined an additional 0.3% collection over Net Operating Revenue between January 2010 and December 2012, aiming to refund states and municipalities by an eventual lack of ICMS tax collection over fossil fuel used in the electric energy generation, in the 24 months following the integration of isolated systems to the NIPS. Since the collected amounts were not fully used, Law no. 13.587/2018 determined the refund of resources to the consumers in 2018 tariff events. The distribution companies received the amount from the Federal Government and, in the same date, sectoral financial liabilities were constituted in the same amount, therefore without affecting the results.
31
Cost of Electric Energy
Cost of Electric Energy (R$ Million) |
| 3Q19 | 3Q18 | Var. | 9M19 | 9M18 | Var. |
Cost of Electric Power Purchased for Resale | | | | | | |
Energy from Itaipu Binacional | 752 | 751 | 0.1% | 2,102 | 2,025 | 3.8% |
PROINFA | 99 | 82 | 20.9% | 303 | 250 | 21.1% |
Energy Purchased through Auction in the Regulated Environment, Bilateral Contracts and Energy Purchased in the Spot Market | 2,897 | 3,800 | -23.8% | 8,297 | 8,918 | -7.0% |
PIS and COFINS Tax Credit | (342) | (414) | -17.4% | (898) | (997) | -10.0% |
Total | 3,406 | 4,219 | -19.3% | 9,804 | 10,196 | -3.8% |
| | | | | | | |
Charges for the Use of the Transmission and Distribution System | | | | | | |
Basic Network Charges | 523 | 468 | 11.9% | 1,471 | 1,573 | -6.5% |
Itaipu Transmission Charges | 74 | 71 | 4.7% | 211 | 198 | 6.2% |
Connection Charges | 39 | 44 | -13.2% | 128 | 110 | 16.8% |
Charges for the Use of the Distribution System | 7 | 9 | -21.7% | 22 | 21 | 5.2% |
ESS / EER | 22 | (178) | | 93 | (3) | |
PIS and COFINS Tax Credit | (61) | (38) | 60.4% | (178) | (177) | 0.6% |
Total | 603 | 375 | 60.9% | 1,748 | 1,722 | 1.5% |
| | | | | | |
Cost of Electric Energy | 4,009 | 4,594 | -12.7% | 11,552 | 11,918 | -3.1% |
In 3Q19, the cost of electric energy, comprising the purchase of electricity for resale and charges for the use of the distribution and transmission system, amounted to R$ 4,009 million, representing a decrease of 12.7% (R$ 584 million):
· Thecost of electric power purchased for resale was R$ 3,406 million in 3Q19, representing a decrease of 19.3% (R$ 813 million), due to the following factors:
(i) Reduction of 23.8% (R$ 903 million) in thecost of energy purchased in the regulated environment, bilateral contracts and short term, due to the reduction of 31.1% in the average purchase price (from R$ 250.99/MWh in 3Q18 to R$ 173.01/MWh in 3Q19), partially offset by the increase of 10.6% (1,605 GWh) in the volume of purchased energy;
Partially offset by:
(ii) Decrease of 17.4% (R$ 72 million) inPIS and Cofins tax credit (cost reducer), generated from the energy purchase;
(iii) Increase of 20.9% (R$ 17 million) in thecost with Proinfa, due to an increase of 19.8% in the average purchase price (R$ 348.39/MWh in 3Q19 vs. R$ 290.78/MWh in 3Q18), partially offset by the reduction of 0.9% (2 GWh) in the volume of purchased energy;
(iv) Increase of 0.1% (R$ 1 million) in thecost of energy fromItaipu, due to the increase of 1.2% in the average purchase price (from R$ 267.46/MWh in 3Q18 to R$ 270.76/MWh in 3Q19) and the reduction of 1.1% (30 GWh) in the volume of purchased energy;
· Charges for the use of the transmission and distribution system reached R$ 603 million in 3Q19, representing an increase of 60.9% (R$ 228 million), due to the following factors:
(i) Variation of R$ 201 million insector charges (ESS – System Service Usage Charges /EER – Reserve Energy Charges)
(ii) Increase of 8.6% (R$ 51 million) inconnection and transmission charges (Basic Network, Itaipu transmission, connection and usage of the distributionsystem);
32
Partially offset by:
(iii) Increase of 60.4% (R$ 23 million) inPIS and Cofins tax credit (cost reducer), generated from the charges.
In 9M19, the cost of electric energy, comprising the purchase of electricity for resale and charges for the use of the distribution and transmission system, amounted to R$ 11,552 million, representing a decrease of 3.1% (R$ 365 million):
· Thecost of electric power purchased for resale was R$ 9,804 million in 9M19, representing a decrease of 3.8% (R$ 392 million), due to the following factors:
(i) Decrease of 7.0% (R$ 620 million) in thecost of energy purchased in the regulated environment, bilateral contracts and short term, due to an increase of 13.2% (4,130 GWh) in the volume of purchased energy, partially offset by a reduction of 17.8% in the average purchase price (from R$ 285.21/MWh in 9M18 to R$ 234.40/MWh in 9M19);
Partially offset by:
(ii) Decrease of 10.0% (R$ 100 million) in PIS and Cofins tax credit (cost reducer), generated from the energy purchase.
(iii) Increase of 3.8% (R$ 76 million) in thecost of energy from Itaipu, due to the increase of 4.6% in the average purchase price (from R$ 243.71/MWh in 9M18 to R$ 255.03/MWh in 9M19), partially offset by the reduction of 0.8% (69 GWh) in the volume of purchased energy;
(iv) Increase of 21.1% (R$ 53 million) in thecost with Proinfa,due to the increase of 21.0% in the average purchase price (R$ 310.16/MWh in 9M18 vs. R$ 375.31/MWh in 9M19), partially offset by the increase of 0.1% (1 GWh) in the volume of purchased energy;
· Charges for the use of the transmission and distribution system reached R$ 1,748 million in 9M19, representing a decrease of 1.5% (R$ 26 million), due to the following factors:
(i) Increase of R$ 97 million insector charges(ESS/EER)
Partially offset by:
(ii) Decrease of 3.7% (R$ 70 million) inconnection and transmission charges;
(iii) Increase of 0.6% (R$ 1 million) inPIS and Cofins tax credit (cost reducer), generated from the charges.
Operating Costs and Expenses
Operating costs and expenses reached R$ 1,483 million in 3Q19, an increase of 11.0% (R$ 147 million). In 9M19, operating costs and expenses reached R$ 4,176 million, an increase of 13.4% (R$ 495 million).
The factors that explain these variations follow below:
33
PMSO
Reported PMSO (R$ million) |
| 3Q19 | 3Q18 | Variation | 9M19 | 9M18 | Variação |
| R$ MM | % | R$ MM | % |
Personnel | (235) | (226) | (10) | 4.3% | (704) | (680) | (24) | 3.5% |
Material | (46) | (42) | (4) | 9.4% | (137) | (124) | (12) | 10.0% |
Outsourced Services | (212) | (211) | (1) | 0.5% | (638) | (627) | (11) | 1.8% |
Other Operating Costs/Expenses | (206) | (191) | (15) | 7.9% | (546) | (411) | (135) | 32.7% |
Allowance for doubtful accounts | (61) | (48) | (13) | 28.0% | (194) | (116) | (78) | 67.1% |
Legal and judicial expenses | (53) | (72) | 18 | -25.4% | (122) | (112) | (10) | 8.8% |
Others | (91) | (72) | (20) | 27.8% | (230) | (183) | (47) | 25.6% |
Total Reported PMSO | (699) | (669) | (30) | 4.5% | (2,025) | (1,843) | (182) | 9.9% |
In 3Q19,PMSO reached R$ 699 million, an increase of 4.5% (R$ 30 million).
Personnel– increase of 4.3% (R$ 10 million),mainly due to the collective bargaining agreement – wages and benefits;
Material– increase of 9.4% (R$ 4 million), mainly replacement of materials to grid maintenance (R$ 4 million);
Third party services – increase of 0.5% (R$ 1 million), mainly due to the increase in the following items: tree pruning (R$ 8 million), electric system maintenance (R$ 3 million), partially offset by outsourced services (R$ 9 million).
Other operating costs/expenses – increase of 7.9% (R$ 15 million), due to the increase in allowance for doubtful accounts (R$ 13 million), assets write-off (R$ 9 million), other costs/expenses (R$ 8 million) and bank´s collection fee (R$ 3 million), partially offset by the reductions in legal and judicial expenses (R$ 18 million).
In 9M19,PMSO reached R$ 2,025 million, an increase of 9.9% (R$ 182 million).
Personnel– increase of 3.5% (R$ 24 million);
Material– increase of 10.0% (R$ 12 million), mainly replacement of materials to grid maintenance (R$ 11 million);
Third party services – increase of 1.8% (R$ 11 million), mainly due to the increases in the following items: tree pruning (R$ 12 million), meter reading and delivery of bills (R$ 4 million) collection actions, re notification, cut and reconnection (R$ 4 million) and electric system maintenance (R$ 3 million) partially offset by outsourced services (R$ 8 million) and audit and consulting (R$ 8 million);
Other operating costs/expenses – increase of 32.7% (R$ 135 million), due to the increase in the following items: allowance for doubtful accounts (R$ 78 million), legal and judicial expenses (R$ 28 million), assets write-off (R$ 9 million), other costs/expenses (R$ 9 million), bank´s collection fee (R$ 8 million) and recovery of expenses in 2018 (R$ 2 million).
34
Other operating costs and expenses
In 3Q19, other operating costs and expenses reached R$ 784 million, registering an increase of 17.6% (R$ 117 million), with the variations below:
(i) Increase of 19.4% (R$ 89 million) incost of building the concession´s infrastructure (this item does not affect results, since it has its counterpart in “operating revenue”);
(ii) Increase of 29.2% (R$ 6 million) inPrivate Pension Fund item, due to the registration of the impacts of the actuarial report;
(iii) Increase of 11.8% (R$ 21 million) inDepreciation and Amortization.
In 9M19, other operating costs and expenses reached R$ 2,151 million, registering an increase of 17.0% (R$ 312 million), with the variations below:
(i) Increase of 22,9% (R$ 275 million) incost of building the concession´s infrastructure;
(ii) Increase of 26.6% (R$ 18 million) inPrivate Pension Fund;
Partially offset by:
(iii) Decrease of 3.5% (R$ 20 million) inDepreciation and Amortization.
EBITDA
EBITDAtotaled R$ 846 million in 3Q19, an increase of 17.8% (R$ 128 million), mainly favored by the positive effects of tariff adjustments between 2018 and 2019 and the RAB appraisal report due to tariff revisions of CPFL Piratininga, leading to an extraordinary gain in 3Q19, counterpart there was a lower adjustments to the Concession´s Financial Asset and higher PMSO.
In 9M19,EBITDAtotaled R$ 2,699 million, an increase of 18.5% (R$ 421 million), basically influenced by effects of tariff adjustments occurred in 2018.
Conciliation of Net Income and EBITDA (R$ million) |
| 3Q19 | 3Q18 | Var. | 9M19 | 9M18 | Var. |
Net income | 375 | 277 | 35.4% | 1,227 | 921 | 33.2% |
Depreciation and Amortization | 204 | 183 | | 590 | 570 | |
Financial Results | 43 | 98 | | 174 | 249 | |
Income Tax /Social Contribution | 224 | 161 | | 707 | 537 | |
EBITDA | 846 | 718 | 17.8% | 2,699 | 2,278 | 18.5% |
Financial Result
Financial Result (R$ Million) |
| 3Q19 | 3Q18 | Var. | 9M19 | 9M18 | Var. |
Revenues | 168 | 155 | 8.8% | 462 | 414 | 11.6% |
Expenses | (211) | (253) | -16.3% | (636) | (663) | -4.1% |
Financial Result | (43) | (98) | -56.1% | (174) | (249) | -30.1% |
35
In 3Q19, the net financial result recorded a net financial expense of R$ 43 million, a decrease of 56.1% (R$ 55 million). The items explaining these changes are as follows:
(i) Reduction of R$ 31 million inmark-to-market accounting (non-cash effect);
(ii) Decrease of 76.1% (R$ 22 million) incontingency updating;
(iii) Decrease of 3.9% (R$ 6 million) in theexpenses with net debt;
(iv) Variation of R$ 4 million inother financial revenues and expenses.
Partially offset by:
(v) Decrease of 8.4% (R$ 8 million) inlate payment interest and fines;
(vi) Decrease of 0.3% (R$ 0.1 million) insectoral financial assets and liabilities update;
In 9M19, the net financial result recorded a net financial expense of R$ 174 million, a reduction of 30.1% (R$ 75 million). The items explaining these changes are as follows:
(i) Increase of 62.9% (R$ 28 million) insectoral financial assets and liabilities update;
(ii) Decrease of 30.9% (R$ 16 million) incontingency updating;
(iii) Increase of 5.9% (R$ 15 million) inlate payment interest and fines;
(iv) Reduction of R$ 12 million inother financial revenues and expenses;
(v) Variation of R$ 10 million inmark-to-market accounting (non-cash effect).
Partially offset by:
(vi) Increase of 1.6% (R$ 8 million) in theexpenses with net debt;
Net Income
Net Incometotaled R$ 375 million in 3Q19, an increase of 35.4% (R$ 98 million). In 9M19,Net Incometotaled R$ 1,227 million, an increase of 33.2% (R$ 305 million).
5.1.2) Tariff Events
Reference dates
Tariff Process Dates |
Distributor | Date |
CPFL Santa Cruz | March 22nd |
CPFL Paulista | April 8th |
RGE | June 19th |
CPFL Piratininga | October 23rd |
36
Tariff Revision |
Distributor | Periodicity | Next Revision | Cycle |
CPFL Piratininga | Every 4 years | October 2023 | 6th PTRC |
CPFL Santa Cruz | Every 5 years | March 2021 | 5th PTRC |
CPFL Paulista | Every 5 years | April 2023 | 5th PTRC |
RGE | Every 5 years | June 2023 | 5th PTRC |
Annual tariff adjustments March 2019, April and June 2019
| CPFL Santa Cruz | CPFL Paulista | RGE | RGE Sul |
Ratifying Resolution | 2,522 | 2,526 | 2,557 |
Adjustment | 13.70% | 12.02% | 10.05% |
Parcel A | 1.12% | 0.78% | -2.16% |
Parcel B | 0.90% | 2.17% | 2.21% |
Financial Components | 11.68% | 9.07% | 10.00% |
Effect on consumer billings | 13.31% | 8.66% | 8.63% | 1.72% |
Date of entry into force | 03/22/2019 | 8/4/2019 | 06/19/2019 |
Periodic tariff reviews occurred in 2019
| CPFL Piratininga |
Ratifying Resolution | 2,627 |
Adjustment | -5.40% |
Parcel A | -8.32% |
Parcel B | 6.17% |
Financial Components | -2.40% |
Effect on consumer billings | -7.80% |
Date of entry into force | 10/23/2019 |
37
5th Periodic Tariff Review Cycle | R$ MM |
Gross Regulatory Asset Base (A) | 3,837 |
Depreciation Rate (B) | 3.70% |
Depreciation Quota (C = A x B) | 142 |
Net Regulatory Asset Base (D) | 2,487 |
Pre-tax WACC (E) | 12.26% |
Cost of Capital (F = D x E) | 305 |
Special Obligations (G) | 13 |
Regulatory EBITDA (H = C + F + G) | 460 |
OPEX = CAOM + CAIMI (I) | 542 |
Parcel B (J = H + I) | 1,002 |
Productivity Index Parcel B ( K ) | 0.88% |
Quality Incentive Mechanism ( L) | -0.54% |
Parcel B with adjusts (M = J * (K - L) | 999 |
Other Revenues and UD/ ER (N) | 78 |
Adjusted Parcel B (O = M - N) | 921 |
Parcel A (P) | 3,144 |
Required Revenue (Q = O + P) | 4,064 |
· Increase of 6.17% in Parcel B
(i) Increase in RAB
(ii) Higher regulatory depreciation rate
· Decrease of 8.32% in Parcel A
(i) Decrease of R$299 million in CDE mainly due to the end of CCEE loans
5.2) Commercialization and Services Segments
Consolidated Income Statement - Commercialization (R$ Million) |
| 3Q19 | 3Q18 | Var. | 9M19 | 9M18 | Var. |
Net Operating Revenue | 969 | 981 | -1.2% | 2,542 | 2,534 | 0.3% |
EBITDA(1) | 25 | 43 | -43.0% | 77 | 82 | -6.0% |
Net Income | 35 | 27 | 29.4% | 63 | 43 | 47.0% |
| | | | | | | |
Consolidated Income Statement - Services (R$ Million) |
| 3Q19 | 3Q18 | Var. | 9M19 | 9M18 | Var. |
Net Operating Revenue | 147 | 140 | 4.5% | 451 | 380 | 18.7% |
EBITDA(1) | 32 | 32 | 1.5% | 107 | 79 | 34.8% |
Net Income | 17 | 20 | -12.7% | 63 | 46 | 36.7% |
Note:
(1) EBITDA is calculated from the sum of net income, taxes, financial result and depreciation/amortization.
38
5.3) Conventional Generation Segment
Economic-Financial Performance
Consolidated Income Statement - Conventional Generation (R$ million) |
| 3Q19 | 3Q18 | Var. | 9M19 | 9M18 | Var. |
Gross Operating Revenue | 358 | 355 | 0.8% | 991 | 960 | 3.2% |
Deductions from operating revenues | (34) | (48) | -28.2% | (100) | (101) | -1.0% |
Net Operating Revenue | 324 | 307 | 5.3% | 891 | 859 | 3.6% |
Cost of Electric Power | (33) | (32) | 1.0% | (91) | (68) | 33.9% |
Operating Costs & Expenses | (65) | (53) | 21.6% | (171) | (161) | 6.7% |
EBIT | 226 | 222 | 2.0% | 629 | 631 | -0.4% |
EBITDA(1) | 338 | 336 | 0.5% | 976 | 960 | 1.6% |
Financial Income (Expense) | (43) | (62) | -30.0% | (126) | (205) | -38.3% |
Income Before Taxes | 265 | 247 | 7.3% | 760 | 667 | 13.9% |
Net Income | 232 | 198 | 17.1% | 624 | 535 | 16.6% |
Note:
(2) EBITDA is calculated from the sum of net income, taxes, financial result and depreciation/amortization.
Operating Revenue
In 3Q19,Gross Operating Revenuereached R$ 358 million, an increase of 0.8% (R$ 3 million).Net Operating Revenue was of R$ 324 million,registering an increase of 5.3% (R$ 16 million).
The main factors that affected the net operating revenue are:
- Increase of R$ 16 million in the revenue with the power supply in CPFL Geração, explained mainly by the readjustment of contracts.
- Increase of R$ 10 million in revenue from building the infrastructure of the concession, referent to the initial services provided for the construction of transmission and substation lines. This revenue has its counterpart in the same amount in operational costs.
- Reduction of R$ 14 million in deductions from operating revenues compared to 3Q18 due to an extraordinary effect of R$ 12 million in Ceran, related with a retroactive accounting of PIS and COFINS (new taxation rules).
These effects were partially offset by:
· Decrease in CERAN's power supply revenue (R$ 13 million), mainly explained by the lower amount of energy sold.
- Reduction of R$ 6 million in the revenue with the power supply from Jaguari Geração, mainly due to the variation in CCEE revenue-related figures, as there was an average PLD reduction of 43% over 3Q18.
- Decrease of R$ 5 million in other operating revenues, mainly due to the increase of GSF agreement.
In 9M19,Gross Operating Revenuereached R$ 991 million,an increase of 3.2% (R$ 30 million) over 9M18.Net Operating Revenue was of R$ 891 million,registering an increase of 3.6% (R$ 31 million).
The main factors contributing to the increase in net operating revenue were:
39
· Increase in energy supply revenue, combined with the readjustment of the contracts in CPFL Geração (R$ 36 million).
· Increase of R$ 10 million in Revenue from construction of concession infrastructure.
This effects were partially offset by:
- Reduction of R$ 11 million in short-term market revenue at Jaguari Geração, explained by the lower PLD.
· Decrease of R$ 2 million in CERAN's due to the lower amount of energy sold.
Cost of Electric Power
In 3Q19, the cost of electricity reached R $ 33 million, a 1% change (R$ 0.3 million), compared to 3Q18 due to the readjustment of sector charges.
In 9M19, the cost of electricity reached R$ 91 million, an increase of 33.9% (R$ 23 million), mainly explained by the increase in cost of energy purchased over 9M18, due to the GSF reimbursement agreement.
Operating Costs and Expenses
Operating costs and expenses reached R$ 65 million in 3Q19, compared to R$ 53 million in 3Q18, a variation of 21.6%. In 9M19, operating costs and expenses reached R$ 171 million in 3Q19, compared to R$ 161 million in 3Q18, a variation of 6.7%.
The factors that explain these variations follow below:
PMSO
PMSO (R$ million) |
| 3Q19 | 3Q18 | Variation | 9M19 | 9M18 | Variation |
| R$ MM | % | R$ MM | % |
PMSO | | | | | | | | |
Personnel | 10 | 9 | 2 | 17.9% | 27 | 26 | 1 | 3.3% |
Material | 1 | 1 | 0 | 22.9% | 3 | 2 | 1 | 27.5% |
Outsourced Services | 6 | 4 | 3 | 67.7% | 19 | 14 | 4 | 30.8% |
Other Operating Costs/Expenses | 8 | 12 | (4) | -32.3% | 23 | 28 | (6) | -20.3% |
GSF Risk Premium | 2 | 2 | 1 | 100.0% | 7 | 5 | 2 | 100.0% |
Others | 5 | 10 | (4) | -44.3% | 15 | 23 | (7) | -32.6% |
Total PMSO | 25 | 25 | 1 | 2.1% | 71 | 71 | 0 | 0.1% |
PMSO item reached R$ 25 million in 3Q19, registering an increase of 2.1%, compared to 3Q18 (R$ 1 million).
In 9M19, PMSO reached R$ 71 million, maintaining the same level as 9M18.
The factors that explain these variations follow below:
Personnel: increase of 17.9% (R$ 2 million), mainly due to the increase in headcount andthe effects of the collective bargaining agreement;
40
Third party services: 67.7% variation (R$ 3 million), due to the retroactive accounting of PIS and COFINS credits in 3Q18, due to new taxation rules (extraordinary effect);
Other Operating Costs/Expenses:reclassification of expenses related to the Financial Compensation on Water Resources (CFURH) to the Deductions from Operating Revenue, according to Aneel's guidance.
Other operating costs and expenses
Disregarding the cost of infrastructure construction (R$ 10 million referring to initial services for the construction of transmission and substation lines), other operating costs and revenues totaled R$ 30 million, compared to R$ 28 million in 3T18, an increase of 8.7% (R$ 2 million). This change is explained by the lower Depreciation and Amortization costs at Ceran (R$ 3 million) in 3Q18, due to the benefit of the retroactive PIS and COFINS.
Disregarding the cost of infrastructure construction, in 9M19, other operating costs and expenses reached R$ 91 million, compared to R$ 89 million in 9M18, recording an increase of 2.0% (R $ 2 million), also explained by Depreciation and Amortization variance at Ceran.
Equity Income
Equity Income (R$ Million) |
| 3Q19 | 3Q18 | Var. R$ | Var. % | 9M19 | 9M18 | Var. R$ | Var. % |
Projects | | | | | | | | |
Barra Grande HPP | (4) | (7) | 3 | -42.9% | (3) | (4) | 0 | -9.9% |
Campos Novos HPP | 26 | 22 | 4 | 16.2% | 93 | 71 | 22 | 31.5% |
Foz do Chapecó HPP | 39 | 36 | 4 | 11.0% | 101 | 95 | 6 | 6.1% |
Epasa TPP | 20 | 36 | (15) | -42.9% | 67 | 79 | (12) | -15.3% |
Total | 82 | 87 | (5) | -5.7% | 258 | 241 | 16 | 6.8% |
Note: Disclosure of interest in subsidiaries is made in accordance with IFRS 12 and CPC 45.
In 3Q19, Equity Income result reached R$ 82 million, compared to R$ 87 million in 3Q18, a decrease of 5.7% (R$ 5 million).
Equity Income (R$ Million) |
BAESA | 3Q19 | 3Q18 | Var. R$ | Var. % | 9M19 | 9M18 | Var. R$ | Var. % |
| | | | | | | | | |
Net Revenue | 21 | 26 | (5) | -18.3% | 49 | 56 | (7) | -12.4% |
Operating Costs / Expenses | (19) | (26) | 8 | -28.6% | (37) | (41) | 4 | -10.1% |
Deprec. / Amortization | (3) | (3) | (0) | 0.2% | (10) | (9) | (0) | 0.1% |
Net Financial Result | (3) | (3) | 1 | -19.8% | (6) | (9) | 3 | -31.7% |
Income Tax | (0) | 1 | (1) | - | (0) | (0) | 0 | -28.7% |
Net Income | (4) | (7) | 3 | -42.9% | (3) | (4) | 0 | -9.9% |
41
Equity Income (R$ Million) |
ENERCAN | 3Q19 | 3Q18 | Var. R$ | Var. % | 9M19 | 9M18 | Var. R$ | Var. % |
| | | | | | | | | |
Net Revenue | 80 | 76 | 3 | 4.5% | 236 | 210 | 26 | 12.3% |
Operating Costs / Expenses | (31) | (31) | 0 | -1.0% | (66) | (69) | 3 | -4.5% |
Deprec. / Amortization | (6) | (6) | 0 | 0.0% | (18) | (18) | 1 | -2.8% |
Net Financial Result | (4) | (5) | 2 | -33.5% | (11) | (16) | 4 | -28.2% |
Income Tax | (13) | (11) | (2) | 16.0% | (48) | (36) | (12) | 32.5% |
Net Income | 26 | 22 | 4 | 16.2% | 93 | 71 | 22 | 31.5% |
| | | | | | | | |
Equity Income (R$ Million) |
FOZ DO CHAPECO | 3Q19 | 3Q18 | Var. R$ | Var. % | 9M19 | 9M18 | Var. R$ | Var. % |
| | | | | | | | | |
Net Revenue | 114 | 116 | (2) | -1.7% | 333 | 330 | 3 | 0.8% |
Operating Costs / Expenses | (23) | (23) | 1 | -2.7% | (75) | (72) | (3) | 3.7% |
Deprec. / Amortization | (16) | (16) | (0) | 1.6% | (48) | (47) | (0) | 0.2% |
Net Financial Result | (18) | (24) | 7 | -26.9% | (58) | (68) | 10 | -15.1% |
Income Tax | (20) | (16) | (4) | 23.2% | (51) | (47) | (4) | 8.9% |
Net Income | 39 | 36 | 4 | 11.0% | 101 | 95 | 6 | 6.1% |
| | | | | | | | | |
Equity Income (R$ Million) |
EPASA | 3Q19 | 3Q18 | Var. R$ | Var. % | 9M19 | 9M18 | Var. R$ | Var. % |
| | | | | | | | �� | |
Net Revenue | 39 | 181 | (142) | -78.6% | 254 | 327 | (73) | -22.3% |
Operating Costs / Expenses | (8) | (134) | 127 | -94.3% | (153) | (217) | 64 | -29.6% |
Deprec. / Amortization | (5) | (5) | 0 | -1.9% | (14) | (14) | 0 | -1.1% |
Net Financial Result | (1) | (2) | 1 | -39.5% | (4) | (5) | 1 | -14.8% |
Income Tax | (5) | (8) | 3 | -33.9% | (16) | (15) | (1) | 7.0% |
Net Income | 20 | 36 | (15) | -42.9% | 67 | 79 | (12) | -15.3% |
The main items that explain these variations are:
Baesa: reduction in revenues due to the GSF and PLD scenario (R$ 4 million). This effect was partially offset by the reduction in the amount of Eletricity Purchased for Resale (R$ 6 million), with a net effect of R$ 3 million on profit.
Enercan: positive effect of R$ 4 million, mainly due to the price adjustment of electricity sales, combined with the volume increase in 3Q19.
Foz do Chapecó: positive effect of R$ 4 million, basically explained by the reduction in financial expenses with updating of Use of Public Asset account.
Epasa: Net Income reduction of R$ 15 million, mainly due to tax benefits in 3Q18.
EBITDA
In 3Q19,EBITDAwas of R$ 338 million, compared to R$ 336 million in 3Q18, an increase of 0.5% (R$ 2 million). The main factors that contributed to this variation in 3Q19 were the inflation effect over the contracts, partially compensated by the lower hydro and thermal generation and by the retroactive tax credit at Epasa, related do 3T18.
In 9M19,EBITDAwas of R$ 976 million, compared to R$ 960 million in 9M18, an increase of 1.6% (R$ 16 million), basically influenced by the inflation effect over the contracts and the changes in the electric energy generation.
42
Conciliation of Net Income and EBITDA (R$ million) |
| 3Q19 | 3Q18 | Var. | 9M19 | 9M18 | Var. |
Net Income | 232 | 198 | 17.1% | 624 | 535 | 16.6% |
Depreciation and Amortization | 30 | 27 | | 90 | 88 | |
Financial Result | 43 | 62 | | 126 | 205 | |
Income Tax /Social Contribution | 33 | 48 | | 135 | 132 | |
EBITDA | 338 | 336 | 0.5% | 976 | 960 | 1.6% |
Financial Result
Financial Result (IFRS - R$ Million) |
| 3Q19 | 3Q18 | Var. | 9M19 | 9M18 | Var. |
Financial Revenues | 13 | 18 | -30.6% | 36 | 55 | -34.6% |
Financial Expenses | (56) | (80) | -30.1% | (162) | (260) | -37.5% |
Financial Result | (43) | (62) | -30.0% | (126) | (205) | -38.3% |
In 3Q19, the financial result was anet financial expense of R$ 43 million, representing a reduction of 30.0% (R$ 19 million) compared to the net financial expense of R$ 62 million in 3Q18.
The main items that explain this variation are:
(i) Decrease of 25.0% (R$ 15 million) indebt charges, mainly due to the reduction in total debt volume, also due to the CDI variation (4.67% in 3Q19 compared to 4.81% in 3Q18).
(ii) Reduction of R$ 6 million in expenses withmonetary and foreign exchange updates: positive effect on derivative expenses (R$ 4 million); (ii) mark-to-market effect of linked derivatives (R$ 1 million) in CPFL Geração and (iii) reduction of debentures charges at Ceran (R$ 2 million).
(iii) Decrease of R$ 2 million in the financial expenses with theUse of Public Asset(UBP) at Ceran;
Partially offset by:
(iv) Reduction of 86.2% (R$ 4 million) in other financial income (receivables update decrease at CPFL Geração).
In 9M19, the financial result was anet financial expense of R$ 126 million, a decrease of 38.3% (R$ 79 million) compared to the net financial expense of R$ 205 million in 9M18.
The main items that explain this variation are:
(i) Decrease of 27.4% (R$ 52 million) indebt charges, mainly due to the reduction in total debt volume, also due to the CDI variation.
(ii) Reduction of 75.3% (R$ 39 million) inmonetary and foreign exchange updates: positive effect of R$ 21 million referring to thezero-cost collar derivative3 and R$ 18million referring to other monetary and exchange rate updates;
3 In 2015, subsidiary CPFL Geração contracted US$ denominated put and call options, involving the same financial institution as counterpart, and which on a combined basis are characterized as an operation usually known as zero-cost collar. The contracting of this operation does not involve any kind of speculation, inasmuch as it is aimed at minimizing any negative impacts on future revenues of the joint venture ENERCAN, which has electric energy sale agreements with annual restatement of part of the tariff based on the variation in the US$. In addition, according to Management’s view, the scenario was favorable for contracting this type of financial instrument, considering the high volatility implicit in dollar options and the fact that there was no initial cost for same.
43
(iii)Increase of R$ 8 million in 9M19 related toInterest on loan agreements, compared to 9M18.
Partially offset by:
(iv)Reduction of 56.6% (R$ 20 million) inincome from financial investments.
Net Income
In 3Q19,net incomewas of R$ 232 million, compared to a net income of R$ 198 million in 3Q18, an increase of 17.1% (R$ 34 million).
In 9M19,net incomewas of R$ 624 million, compared to a net income of R$ 535 million in 9M18, an increase of 16.6% (R$ 89 million).
44
5.4) CPFL Renováveis
Economic-Financial Performance
Consolidated Income Statement - CPFL RENOVÁVEIS (R$ Million) |
| 3Q19 | 3Q18 | Var. | 9M19 | 9M18 | Var. |
Gross Operating Revenue | 634 | 656 | -3.4% | 1,422 | 1,499 | -5.2% |
Net Operating Revenue | 599 | 622 | -3.6% | 1,345 | 1,420 | -5.3% |
Cost of Electric Power | (106) | (109) | -2.7% | (226) | (262) | -13.7% |
Operating Costs & Expenses | (270) | (241) | 12.0% | (775) | (716) | 8.3% |
EBIT | 222 | 271 | -17.9% | 343 | 442 | -22.4% |
EBITDA1 | 384 | 427 | -10.0% | 827 | 910 | -9.1% |
Financial Income (Expense) | (93) | (126) | -26.8% | (316) | (375) | -15.8% |
Income Before Taxes | 130 | 145 | -10.2% | 28 | 68 | -59.1% |
Net Income | 124 | 121 | 2.3% | (8) | 12 | - |
Note:
(1) EBITDA is calculated from the sum of net income, taxes, financial result and depreciation/amortization.
Operating Revenue
In 3Q19,Gross Operating Revenue reached R$ 634 million, representing a reduction of 3.4% (R$ 22 million).Net Operating Revenue reached R$ 599 million, representing a reduction of 3.6% (R$ 23 million). These variations are mainly explained by the following factors:
Wind Source:
· Reduction of R$ 61 million in revenue from wind farms, mainly due to: (i) lower generation of wind complexes (R$ 28 million); (ii) the difference in the price of energy sold in the new energy auction through the Surplus and Deficit Offset Mechanism (MCSD), since the energy no longer contracted in 3Q18 was sold in the free market at a price higher than the contract price in the regulated market in 3Q19 (R$ 32 million).
SHPPs Source:
· Increase of R$ 35 million in revenue from SHPPs, chiefly due to the different strategy of seasonal adjustment of physical guarantee in the agreements between the periods and the adjustments in agreements.
Biomass Source:
· Increase of R$ 4 million in biomass revenue due to the higher generation at some plants (R$ 6 million), partially offset by the strategy of contract seasonalization - lower in 3Q19 (R$ 2 million).
45
Holding Company:
· Holding Company’s revenue remained practically stable between the periods.
In 9M19,Gross Operating Revenue reached R$ 1,422 million, representing a reduction of 5.2% (R$ 77 million).Net Operating Revenue reached R$ 1,345 million, representing a reduction of 5.3% (R$ 76 million). These variations are mainly due to the factors that affected the quarter and the intercompany hedge and swap transactions settled to PLD in 2Q19 at Holding, partially offset by the adjustment in the prices of agreements.
Cost of Electric Power
Cost of Electric Energy (R$ Million) |
| 3Q19 | 3Q18 | Var. | 9M19 | 9M18 | Var. |
Cost of Electric Power Purchased for Resale | (81) | (85) | -5.0% | (152) | (197) | -23.1% |
Charges for the Use of the Transmission and Distribution System | (26) | (24) | 5.2% | (74) | (64) | 15.2% |
Financial Result | (106) | (109) | -2.7% | (226) | (262) | -13.7% |
In 3Q19,Cost of Electric Energy totaled R$ 106 million, representing a reduction of 2.7% (R$ 3 million). In 9M19,Cost of Electric Energy totaled R$ 226 million, a reduction of 13.7% (R$ 36 million).
Energy purchase cost totaled R$ 81 million in 3Q19, a reduction of 5.0% (R$ 4 million). In 9M19, energy purchase cost totaled R$ 152 million, a reduction of 23.1% (R$ 46 million). These variations are mainly due to:
(iv) lower energy volume purchased for hedge operations and energy deficits at wind farms that participated in the MCSD due to flat seasonality in 2018;
(v) lower GSF in the periods.
Cost of charges for the use of the system totaled R$ 26 million in 3Q19, an increase of 5.2% (R$ 1 million), mainly due to the price adjustments in connection charges, as well as the distribution and transmission system use and connection tariffs. In 9M19, cost of charges for the use of the system totaled R$ 74 million, an increase of 15.2% (R$ 10 million), mainly due to: (i) price adjustment in connection charges, as well as the distribution and transmission system use and connection tariffs; and (ii) the positive effect of the recovery of PIS and Cofins credits in 2Q18.
Operating Costs and Expenses
Operating Costs and Expenses reached R$ 270 million in 3Q19, compared to R$ 241 million in 3Q18, representing an increase of 12.0% (R$ 29 million). In 9M19,Operating Costs and Expenses reached R$ 775 million, compared to R$ 716 million in 9M18, representing an increase of 8.3% (R$ 59 million). The factors that explain these variations follow:
46
PMSO
Reported PMSO (R$ million) |
| 3Q19 | 3Q18 | Variation | 9M19 | 9M18 | Variação |
| R$ MM | % | R$ MM | % |
Reported PMSO | | | | | | | | |
Personnel | (31) | (25) | (6) | 26.1% | (85) | (76) | (9) | 11.5% |
Material | (5) | (4) | (2) | 40.8% | (13) | (21) | 7 | -35.5% |
Outsourced Services | (52) | (44) | (7) | 16.5% | (148) | (121) | (27) | 22.5% |
Other Operating Costs/Expenses | (20) | (13) | (8) | 59.3% | (45) | (31) | (15) | 47.9% |
Total Reported PMSO | (109) | (86) | (23) | 26.8% | (292) | (248) | (43) | 17.4% |
The PMSO item reached R$ 109 million in 3Q19, compared to R$ 86 million in 3Q18, an increase of 26.8% (R$ 23 million), mainly due to:
(i) the write-off of fixed assets of wind farms which were operated by Suzlon, in the amount of R$ 9.1 million;
(ii) price adjustment on agreements with O&M suppliers of wind turbines at Campo dos Ventos and São Benedito wind complexes, after the end of the partial grace period in the initial years of operation, in the amount of R$ 6 million;
(iii) the increase of expenses in the process of integration with CPFL Energia, in the amount of R$ 4 million.
In 9M19, the PMSO item reached R$ 292 million, compared to R$ 248 million in 9M18, an increase of 17.4% (R$ 43 million). This variation is mainly due to the factors that affected the quarter and:
(i) the reversal of provision for impairment in 1Q18, which did not repeat in 1Q19;
(ii) the positive effect of the recovery of PIS and Cofins credits in 2Q18.
Other operating costs and expenses
Other operating costs and expenses, represented by Depreciation and Amortization accounts, reached R$ 162 million in 3Q19, increase of 3.9% (R$ 6 million). In 9M19, other operating costs and expenses reached R$ 484 million, an increase of 3.4% (R$ 16 million). These increases are mainly explained by the operational startup of Boa Vista II SHPP, in November 2018.
EBITDA
In 3Q19, EBITDA was of R$ 384 million, compared to R$ 427 million in 3Q18, a reduction of 10.0% (R$ 43 million). This result is mainly due to: (i) the lower generation from the wind farms (R$ 34 million), (ii) the price difference of energy sold at new energy auction versus the MCSD, in 3Q18 (R$ 32 million); (iii) the write-off of fixed assets of wind farms which were operated by Suzlon (R$ 9 million); and (iv) the price adjustment on agreements with O&M suppliers of wind turbines at Campo dos Ventos and São Benedito wind complexes (R$ 6 million), after the end of the partial grace period in the initial years of operation. Theseitems were partially offset by the different strategy of seasonal adjustment of physical guarantee in the agreements between the periods.
47
In 9M19, EBITDA was of R$ 827 million, compared to R$ 910 million in 9M18, a reduction of 9.1% (R$ 83 million). This result is mainly due to: (i) the lower net revenue (R$ 76 million); and (ii) the write-off of fixed assets of wind farms which were operated by Suzlon (R$ 9 million).
EBITDA and Net Income conciliation (R$ million) |
| 3Q19 | 3Q18 | Var. | 9M19 | 9M18 | Var. |
Net Income | 124 | 121 | 2.3% | (8) | 12 | - |
De preciation and Amortization | 162 | 156 | | 484 | 468 | |
Financial Result | 93 | 126 | | 316 | 375 | |
Income Tax / Social Contribution | 6 | 24 | | 35 | 56 | |
EBITDA | 384 | 427 | -10.0% | 827 | 910 | -9.1% |
Financial Result
Financial Result (R$ Million) |
| 3Q19 | 3Q18 | Var. | 9M19 | 9M18 | Var. |
Revenues | 43 | 35 | 23.1% | 141 | 95 | 49.4% |
Expenses | (135) | (161) | -16.1% | (457) | (469) | -2.7% |
Financial Result | (93) | (126) | -26.8% | (316) | (375) | -15.8% |
In 3Q19, net financial result registered a net financial expense of R$ 93 million, a reduction of 26.8% (R$ 34 million). Financial revenues totaled R$ 43 million in 3Q19, up 23.1% from 3Q18 (R$ 8 million), mainly due to revenue with inflation adjustment on financial settlements at CCEE, partially offset by the lower average CDI interest rate. Financial expenses totaled R$ 135 million in 3Q19, down 16.1% from 3Q18 (R$ 26 million), mainly due to: (i) the lower interest and inflation adjustment on loans and debentures due to the decline in the average CDI rate and the TJLP rate, and (ii) the reduction in debt expenses, especially the exchange of more expensive debts for a cheaper cost debenture. These effects were partially offset by the expenses with inflation adjustment on financial settlements at CCEE (GSF provision).
In 9M19, net financial result registered a net financial expense of R$ 316 million, a reduction of 15.8% (R$ 59 million). Financial revenues totaled R$ 141 million in 9M19, up 49.4% from 9M18 (R$ 47 million). Financial expenses totaled R$ 457 million, down 2.7% from 9M18 (R$ 12 million). These variations are mainly due to the factors that affected the quarter.
Net Income
In 3Q19, net income was of R$ 124 million, compared to the net income of R$ 121 million in 3Q18, an increase of 2.3% (R$ 3 million). This performance reflects the improvement in the financial result and in the income tax and social contribution item.
48
In 9M19, it was registered a net loss of R$ 8 million, compared to a net income of R$ 12 million in 9M18. This performance reflects the lower EBITDA, partially offset by the improvement in the financial result.
6) ATTACHMENTS
6.1) Balance Sheet - Assets – CPFL Energia
(R$ thousands)

| | Consolidated |
ASSETS | 09/30/2019 | 12/31/2018 | 09/30/2018 |
| | | | |
CURRENT | | | |
Cash and Cash Equivalents | 3,231,733 | 1,891,457 | 3,578,838 |
Consumers, Concessionaries and Licensees | 5,046,010 | 4,547,951 | 5,186,078 |
Dividend and Interest on Equity | 98,318 | 100,182 | 100,157 |
Recoverable Taxes | 419,722 | 411,256 | 480,447 |
Derivatives | 318,385 | 309,484 | 446,815 |
Sectoral Financial Assets | 1,328,954 | 1,330,981 | 1,515,712 |
Concession Financial Assets | - | - | 23,056 |
Contractual Assets | 34,262 | 23,535 | - |
Other Credits | 590,766 | 787,470 | 860,614 |
TOTAL CURRENT | 11,068,152 | 9,402,316 | 12,191,717 |
| | | | |
NON-CURRENT | | | |
Consumers, Concessionaries and Licensees | 662,605 | 752,795 | 227,387 |
Judicial Deposits | 876,539 | 854,374 | 863,438 |
Recoverable Taxes | 430,881 | 253,691 | 240,430 |
Sectoral Financial Assets | 325,012 | 223,880 | 764,847 |
Derivatives | 536,754 | 347,507 | 484,402 |
Deferred Taxes | 760,934 | 956,380 | 767,696 |
Concession Financial Assets | 8,398,420 | 7,430,149 | 7,339,936 |
Investments at Cost | 116,654 | 116,654 | 116,654 |
Other Credits | 706,587 | 927,440 | 709,754 |
Investments | 973,882 | 980,362 | 959,216 |
Property, Plant and Equipment | 9,106,888 | 9,456,614 | 9,536,347 |
Contractual Assets | 1,396,228 | 1,046,433 | - |
Intangible | 9,264,793 | 9,462,935 | 10,509,451 |
TOTAL NON-CURRENT | 33,556,177 | 32,809,214 | 32,519,557 |
| | | | |
TOTAL ASSETS | 44,624,329 | 42,211,530 | 44,711,274 |
49
6.2) Balance Sheet - Liabilities – CPFL Energia
(R$ thousands)
| Consolidated |
LIABILITIES AND SHAREHOLDERS' EQUITY | 09/30/2019 | 12/31/2018 | 09/30/2018 |
| | | | |
CURRENT | | | |
Suppliers | 3,211,553 | 2,398,085 | 3,841,430 |
Loans and Financing | 3,394,489 | 2,446,113 | 2,751,778 |
Debentures | 584,682 | 917,352 | 1,646,527 |
Employee Pension Plans | 123,486 | 86,623 | 76,619 |
Regulatory Charges | 247,053 | 150,656 | 514,915 |
Taxes, Fees and Contributions | 731,835 | 765,438 | 829,795 |
Dividend and Interest on Equity | 512,257 | 532,608 | 38,440 |
Accrued Liabilities | 174,024 | 119,252 | 167,982 |
Derivatives | 1,377 | 8,139 | 32,648 |
Sectoral Financial Liabilities | - | - | - |
Public Utilities | 6,189 | 11,570 | 11,431 |
Other Accounts Payable | 1,123,247 | 979,296 | 1,135,614 |
TOTAL CURRENT | 10,110,192 | 8,415,132 | 11,047,179 |
| | | | |
NON-CURRENT | | | |
Suppliers | 334,949 | 333,036 | 139,096 |
Loans and Financing | 8,256,512 | 8,989,846 | 8,556,530 |
Debentures | 8,115,705 | 8,023,493 | 8,586,345 |
Employee Pension Plans | 1,101,463 | 1,156,639 | 862,772 |
Taxes, Fees and Contributions | 1,588 | 9,691 | 12,268 |
Deferred Taxes | 1,087,252 | 1,136,227 | 1,288,800 |
Reserve for Tax, Civil and Labor Risks | 821,032 | 979,360 | 997,547 |
Derivatives | 4,092 | 23,659 | 7,350 |
Sectoral Financial Liabilities | 137,539 | 46,703 | 73,434 |
Public Utilities | 96,442 | 89,965 | 88,771 |
Other Accounts Payable | 620,933 | 475,396 | 465,124 |
TOTAL NON-CURRENT | 20,577,509 | 21,264,015 | 21,078,038 |
| | | | |
SHAREHOLDERS' EQUITY | | | |
Capital | 9,388,978 | 5,741,284 | 5,741,284 |
Capital Reserve | (1,640,962) | 469,257 | 468,018 |
Legal Reserve | 900,992 | 900,992 | 798,090 |
Statutory Reserve - Concession Financial Assets | - | - | - |
Statutory Reserve - Strengthening of Working Capital | 3,527,510 | 3,527,510 | 1,292,046 |
Other Comprehensive Income | (406,889) | (376,294) | (143,010) |
Retained Earnings | 1,879,755 | - | 2,216,629 |
| | 13,649,386 | 10,262,749 | 10,373,057 |
Non-Controlling Shareholders' Interest | 287,242 | 2,269,634 | 2,213,000 |
TOTAL SHAREHOLDERS' EQUITY | 13,936,627 | 12,532,383 | 12,586,057 |
| | | | |
TOTAL LIABILITIES AND SHAREHOLDERS' EQUITY | 44,624,329 | 42,211,530 | 44,711,274 |
50
6.3) Income Statement – CPFL Energia
(R$ thousands)
Consolidated |
| | 3Q19 | 3Q18 | Variation | | 9M19 | 9M18 | Variation |
OPERATING REVENUES | | | | | | | | |
Electricity Sales to Final Customers | | 7,675,780 | 7,471,689 | 2.7% | | 23,213,292 | 21,128,905 | 9.9% |
Electricity Sales to Distributors | | 1,787,762 | 1,827,963 | -2.2% | | 4,456,730 | 4,143,917 | 7.5% |
Revenue from building the infrastructure | | 561,861 | 462,838 | 21.4% | | 1,488,441 | 1,203,453 | 23.7% |
Update of concession's financial asset | | 63,213 | 99,089 | -36.2% | | 236,000 | 302,498 | -22.0% |
Sectorial financial assets and liabilities | | 238,278 | 1,088,508 | -78.1% | | (64,548) | 1,942,754 | - |
Other Operating Revenues | | 1,337,955 | 1,224,217 | 9.3% | | 3,926,718 | 3,591,190 | 9.3% |
| | 11,664,848 | 12,174,303 | -4.2% | | 33,256,634 | 32,312,716 | 2.9% |
| | | | | | | | |
DEDUCTIONS FROM OPERATING REVENUES | | (3,918,367) | (4,044,018) | -3.1% | | (11,346,400) | (10,862,411) | 4.5% |
NET OPERATING REVENUES | | 7,746,482 | 8,130,285 | -4.7% | | 21,910,234 | 21,450,306 | 2.1% |
| | | | | | | | |
COST OF ELECTRIC ENERGY SERVICES | | | | | | | | |
Electricity Purchased for Resale | | (4,150,261) | (5,002,833) | -17.0% | | (11,709,289) | (12,166,742) | -3.8% |
Electricity Network Usage Charges | | (629,141) | (398,629) | 57.8% | | (1,822,487) | (1,786,478) | 2.0% |
| | (4,779,402) | (5,401,462) | -11.5% | | (13,531,776) | (13,953,219) | -3.0% |
OPERATING COSTS AND EXPENSES | | | | | | | | |
Personnel | | (363,683) | (344,089) | 5.7% | | (1,077,469) | (1,034,222) | 4.2% |
Material | | (71,008) | (62,056) | 14.4% | | (204,005) | (188,036) | 8.5% |
Outsourced Services | | (171,957) | (161,910) | 6.2% | | (515,415) | (498,564) | 3.4% |
Other Operating Costs/Expenses | | (234,559) | (214,744) | 9.2% | | (612,981) | (463,284) | 32.3% |
Allowance for Doubtful Accounts | | (61,016) | (45,495) | 34.1% | | (194,866) | (113,737) | 71.3% |
Legal and judicial expenses | | (55,180) | (68,852) | -19.9% | | (126,155) | (112,603) | 12.0% |
Others | | (118,364) | (100,397) | 17.9% | | (291,960) | (236,944) | 23.2% |
Cost of building the infrastructure | | (560,882) | (462,799) | 21.2% | | (1,487,416) | (1,203,405) | 23.6% |
Employee Pension Plans | | (29,020) | (22,477) | 29.1% | | (85,322) | (67,432) | 26.5% |
Depreciation and Amortization | | (361,480) | (316,362) | 14.3% | | (1,029,881) | (977,531) | 5.4% |
Amortization of Concession's Intangible | | (56,431) | (71,327) | -20.9% | | (200,650) | (214,122) | -6.3% |
| | (1,849,021) | (1,655,765) | 11.7% | | (5,213,140) | (4,646,595) | 12.2% |
| | | | | | | | |
EBITDA1 | | 1,618,024 | 1,547,772 | 4.5% | | 4,653,623 | 4,283,561 | 8.6% |
| | | | | | | | |
INCOME FROM ELECTRIC ENERGY SERVICE | | 1,118,058 | 1,073,058 | 4.2% | | 3,165,318 | 2,850,491 | 11.0% |
| | | | | | | | |
FINANCIAL REVENUES (EXPENSES) | | | | | | | | |
Financial Revenues | | 280,129 | 212,587 | 31.8% | | 718,061 | 578,817 | 24.1% |
Financial Expenses | | (412,487) | (491,560) | -16.1% | | (1,281,783) | (1,410,983) | -9.2% |
| | (132,358) | (278,973) | -52.6% | | (563,722) | (832,166) | -32.3% |
| | | | | | | | |
EQUITY ACCOUNTING | | | | | | | | |
Equity Accounting | | 82,055 | 87,025 | -5.7% | | 257,774 | 241,416 | 6.8% |
Assets Surplus Value Amortization | | (145) | (145) | 0.0% | | (435) | (435) | 0.0% |
| | 81,910 | 86,880 | -5.7% | | 257,339 | 240,982 | 6.8% |
| | | | | | | | |
INCOME BEFORE TAXES ON INCOME | | 1,067,610 | 880,966 | 21.2% | | 2,858,936 | 2,259,307 | 26.5% |
| | | | | | | | |
Social Contribution | | (86,711) | (70,757) | 22.5% | | (260,789) | (207,469) | 25.7% |
Income Tax | | (233,160) | (183,986) | 26.7% | | (706,377) | (556,033) | 27.0% |
| | | | | | | | |
NET INCOME | | 747,739 | 626,223 | 19.4% | | 1,891,770 | 1,495,804 | 26.5% |
Controlling Shareholders' Interest | | 676,956 | 553,728 | 22.3% | | 1,861,036 | 1,453,225 | 28.1% |
Non-Controlling Shareholders' Interest | | 70,783 | 72,495 | -2.4% | | 30,734 | 42,579 | -27.8% |
Note:
(1) EBITDA is calculated from the sum of net income, taxes, financial result and depreciation/amortization, according to CVM Instruction no. 527/12.
51
6.4) Cash Flow – CPFL Energia
(R$ thousands)
Consolidated |
| | | | | |
| | | 3Q19 | | Last 12M |
| | | | | |
Beginning Balance | | 6,981,505 | | 3,578,838 |
| | | | | |
Net Income Before Taxes | | 1,067,610 | | 3,539,606 |
| | | | | |
Depreciation and Amortization | | 417,910 | | 1,632,942 |
Interest on Debts and Monetary and Foreign Exchange Restatements | | 228,694 | | 935,711 |
Consumers, Concessionaries and Licensees | | (480,652) | | (545,208) |
Sectoral Financial Assets | | (241,190) | | 851,881 |
Accounts Receivable - Resources Provided by the CDE/CCEE | | 10,543 | | 58,501 |
Suppliers | | 490,216 | | (588,717) |
Sectoral Financial Liabilities | | 2,913 | | (31,933) |
Accounts Payable - CDE | | (11,219) | | 47,717 |
Interest on Debts and Debentures Paid | | (211,675) | | (1,095,015) |
Income Tax and Social Contribution Paid | | (235,645) | | (1,083,283) |
Others | | 15,038 | | 65,270 |
| | | (15,067) | | 247,866 |
| | | | | |
Total Operating Activities | | 1,052,542 | | 3,787,471 |
| | | | | |
Investment Activities | | | | |
Purchases of Contract Asset, Property, Plant and Equipment and Intangible Assets | | (616,103) | | (2,274,820) |
Others | | (4,067,928) | | (3,954,666) |
Total Investment Activities | | (4,684,031) | | (6,229,486) |
| | | | | |
Financing Activities | | | | |
Capital Increase of Noncontrolling Shareholder | | (679) | | 3,631,974 |
Loans and Debentures | | 825,263 | | 6,585,378 |
Principal Amortization of Loans and Debentures, Net of Derivatives | | (923,244) | | (8,077,823) |
Dividend and Interest on Equity Paid | | (19,624) | | (44,631) |
Others | | - | | 12 |
Total Financing Activities | | (118,284) | | 2,094,910 |
| | | | | |
| | | | | |
Cash Flow Generation | | (3,749,773) | | (347,106) |
| | | | | |
Ending Balance - 09/30/2019 | | 3,231,732 | | 3,231,732 |
52
6.5) Income Statement – Conventional Generation Segment
(R$ thousands)

Conventional Generation |
| 3Q19 | 3Q18 | Var. | 9M19 | 9M18 | Var. |
OPERATING REVENUE | | | | | | |
Eletricity Sales to Final Consumers | - | - | - | - | - | - |
Eletricity Sales to Distributors | 320,484 | 322,851 | -0.7% | 920,152 | 898,295 | 2.4% |
Revenue from construction of concession infrastructure | 10,593 | 1,061 | 898.2% | 11,230 | 1,317 | 752.8% |
Other Operating Revenues | 26,939 | 31,414 | -14.2% | 59,385 | 60,786 | -2.3% |
| 358,017 | 355,327 | 0.8% | 990,767 | 960,398 | 3.2% |
| | | | | | |
DEDUCTIONS FROM OPERATING REVENUE | (34,369) | (47,885) | -28.2% | (100,004) | (100,987) | -1.0% |
NET OPERATING REVENUE | 323,647 | 307,442 | 5.3% | 890,763 | 859,410 | 3.6% |
| | | | | | |
COST OF ELETRIC ENERGY SERVICES | | | | | | |
Eletricity Purchased for Resale | (25,358) | (25,582) | -0.9% | (69,690) | (47,286) | 47.4% |
Eletricity Network Usage Charges | (7,165) | (6,609) | 8.4% | (20,827) | (20,338) | 2.4% |
| (32,523) | (32,191) | 1.0% | (90,517) | (67,625) | 33.9% |
OPERATING COSTS AND EXPENSES | | | | | | |
Personnel | (10,046) | (8,523) | 17.9% | (26,761) | (25,899) | 3.3% |
Material | (1,032) | (839) | 22.9% | (2,720) | (2,133) | 27.5% |
Outsourced Services | (6,252) | (3,728) | 67.7% | (18,587) | (14,209) | 30.8% |
Other Operating Costs/Expenses | (7,796) | (11,520) | -32.3% | (22,625) | (28,378) | -20.3% |
Costs of infrastructure construction | (9,615) | (1,023) | 840.3% | (10,205) | (1,269) | 704.3% |
Employee Pension Plans | (473) | (388) | 21.8% | (1,419) | (1,165) | 21.8% |
Depreciation and Amortization | (27,192) | (24,857) | 9.4% | (81,681) | (80,143) | 1.9% |
Amortization of Concession's Intangible | (2,492) | (2,492) | 0.0% | (7,475) | (7,475) | 0.0% |
| (64,897) | (53,369) | 21.6% | (171,474) | (160,671) | 6.7% |
| | | | | | |
EBITDA | 337,966 | 336,256 | 0.5% | 975,701 | 960,149 | 1.6% |
| | | | | | |
EBIT | 226,228 | 221,883 | 2.0% | 628,772 | 631,115 | -0.4% |
| | | | | | |
FINANCIAL INCOME (EXPENSE) | | | | | | |
Financial Income | 12,697 | 18,290 | -30.6% | 35,926 | 54,899 | -34.6% |
Financial Expenses | (56,163) | (80,386) | -30.1% | (162,314) | (259,824) | -37.5% |
Interest on Equity | - | - | - | - | - | - |
| (43,467) | (62,096) | -30.0% | (126,388) | (204,925) | -38.3% |
| | | | | | |
EQUITY ACCOUNTING | | | | | | |
Equity Accounting | 82,055 | 87,025 | -5.7% | 257,774 | 241,416 | 6.8% |
Assets Surplus Value Amortization | (145) | (145) | 0.0% | (435) | (435) | 0.0% |
| 81,910 | 86,880 | -5.7% | 257,339 | 240,982 | 6.8% |
| | | | | | |
INCOME BEFORE TAXES ON INCOME | 264,671 | 246,667 | 7.3% | 759,723 | 667,171 | 13.9% |
| | | | | | |
Social Contribution | (8,803) | (13,000) | -32.3% | (36,099) | (35,170) | 2.6% |
Income Tax | (23,705) | (35,323) | -32.9% | (99,132) | (96,607) | 2.6% |
| | | | | | | |
NET INCOME (LOSS) | 232,163 | 198,344 | 17.1% | 624,492 | 535,395 | 16.6% |
Note:
(1) EBITDA is calculated from the sum of net income, taxes, financial result and depreciation/amortization, according to CVM Instruction no. 527/12.
53
6.6) Income Statement – CPFL Renováveis
(R$ thousands)

Consolidated |
| | 3Q19 | 3Q18 | Variation | | 9M19 | 9M18 | Variation |
OPERATING REVENUES | | | | | | | | |
Electricity Sales to Final Customers | | 5,169 | 4,935 | 4.7% | | 16,588 | 16,242 | 2.1% |
Electricity Sales to Distributors | | 628,524 | 648,431 | -3.1% | | 1,401,803 | 1,478,311 | -5.2% |
Other Operating Revenues | | 397 | 3,020 | -86.9% | | 3,599 | 4,791 | -24.9% |
| | | 634,089 | 656,386 | -3.4% | | 1,421,989 | 1,499,344 | -5.2% |
| | | | | | | | | |
DEDUCTIONS FROM OPERATING REVENUES | | (35,033) | (34,735) | 0.9% | | (77,448) | (79,109) | -2.1% |
NET OPERATING REVENUES | | 599,056 | 621,651 | -3.6% | | 1,344,542 | 1,420,235 | -5.3% |
| | | | | | | | | |
COST OF ELECTRIC ENERGY SERVICES | | | | | | | | |
Electricity Purchased for Resale | | (80,733) | (84,948) | -5.0% | | (151,752) | (197,336) | -23.1% |
Electricity Network Usage Charges | | (25,553) | (24,290) | 5.2% | | (74,143) | (64,346) | 15.2% |
| | | (106,285) | (109,238) | -2.7% | | (225,895) | (261,682) | -13.7% |
OPERATING COSTS AND EXPENSES | | | | | | | | |
Personnel | | (31,144) | (24,690) | 26.1% | | (84,663) | (75,928) | 11.5% |
Material | | (5,423) | (3,852) | 40.8% | | (13,315) | (20,636) | -35.5% |
Outsourced Services | | (51,533) | (44,232) | 16.5% | | (148,208) | (120,995) | 22.5% |
Other Operating Costs/Expenses | | (20,470) | (12,846) | 59.3% | | (45,336) | (30,657) | 47.9% |
Depreciation and Amortization | | (121,954) | (116,673) | 4.5% | | (364,532) | (350,656) | 4.0% |
Amortization of Concession's Intangible | | (39,807) | (39,024) | 2.0% | | (119,421) | (117,214) | 1.9% |
| | | (270,331) | (241,317) | 12.0% | | (775,475) | (716,086) | 8.3% |
| | | | | | | | | |
EBITDA1 | | 384,200 | 426,793 | -10.0% | | 827,124 | 910,337 | -9.1% |
| | | | | | | | | |
INCOME FROM ELECTRIC ENERGY SERVICE | | 222,439 | 271,095 | -17.9% | | 343,171 | 442,466 | -22.4% |
| | | | | | | | | |
FINANCIAL REVENUES (EXPENSES) | | | | | | | | |
Financial Revenues | | 42,584 | 34,598 | 23.1% | | 141,371 | 94,610 | 49.4% |
Financial Expenses | | (135,205) | (161,064) | -16.1% | | (456,871) | (469,410) | -2.7% |
| | | (92,620) | (126,466) | -26.8% | | (315,500) | (374,799) | -15.8% |
| | | | | | | | | |
INCOME BEFORE TAXES ON INCOME | | 129,819 | 144,629 | -10.2% | | 27,671 | 67,667 | -59.1% |
| | | | | | | | | |
Social Contribution | | (2,970) | (9,167) | -67.6% | | (12,721) | (20,047) | -36.5% |
Income Tax | | (2,962) | (14,416) | -79.5% | | (22,584) | (35,635) | -36.6% |
| | | | | | | | |
NET INCOME | | 123,887 | 121,047 | 2.3% | | (7,634) | 11,985 | - |
Note:
(1) EBITDA is calculated from the sum of net income, taxes, financial result and depreciation/amortization, according to CVM Instruction no. 527/12.
54
6.7) Income Statement – Distribution Segment
(R$ thousand)

Consolidated |
| | 3Q19 | 3Q18 | Variation | | 9M19 | 9M18 | Variation |
OPERATING REVENUE | | | | | | | | |
Electricity Sales to Final Customers | | 7,118,937 | 6,989,874 | 1.8% | | 21,615,399 | 19,701,037 | 9.7% |
Electricity Sales to Distributors | | 618,941 | 513,749 | 20.5% | | 1,658,946 | 1,088,572 | 52.4% |
Revenue from building the infrastructure | | 551,267 | 461,777 | 19.4% | | 1,477,211 | 1,202,136 | 22.9% |
Adjustments to the concession´s financial asset | | 63,213 | 99,089 | -36.2% | | 236,000 | 302,498 | -22.0% |
Sectoral financial assets and liabilities | | 238,278 | 1,088,508 | -78.1% | | (64,548) | 1,942,754 | - |
Other Operating Revenues | | 1,279,689 | 1,164,232 | 9.9% | | 3,769,872 | 3,460,778 | 8.9% |
| | 9,870,324 | 10,317,227 | -4.3% | | 28,692,880 | 27,697,776 | 3.6% |
| | | | | | | | |
DEDUCTIONS FROM OPERATING REVENUE | | (3,736,085) | (3,852,262) | -3.0% | | (10,856,016) | (10,390,872) | 4.5% |
NET OPERATING REVENUE | | 6,134,239 | 6,464,965 | -5.1% | | 17,836,864 | 17,306,904 | 3.1% |
| | | | | | | | |
COST OF ELECTRIC ENERGY SERVICES | | | | | | | | |
Electricity Purchased for Resale | | (3,406,107) | (4,218,803) | -19.3% | | (9,804,238) | (10,195,773) | -3.8% |
Electricity Network Usage Charges | | (603,272) | (374,849) | 60.9% | | (1,748,187) | (1,722,134) | 1.5% |
| | (4,009,379) | (4,593,652) | -12.7% | | (11,552,425) | (11,917,907) | -3.1% |
OPERATING COSTS AND EXPENSES | | | | | | | | |
Personnel | | (235,284) | (225,503) | 4.3% | | (703,957) | (680,260) | 3.5% |
Material | | (46,471) | (42,464) | 9.4% | | (136,672) | (124,238) | 10.0% |
Outsourced Services | | (211,696) | (210,581) | 0.5% | | (638,209) | (626,909) | 1.8% |
Other Operating Costs/Expenses | | (205,908) | (190,890) | 7.9% | | (545,844) | (411,285) | 32.7% |
Allowance for Doubtful Accounts | | (61,105) | (47,746) | 28.0% | | (193,538) | (115,790) | 67.1% |
Legal and Judicial Expenses | | (53,444) | (71,633) | -25.4% | | (121,873) | (112,017) | 8.8% |
Others | | (91,359) | (71,511) | 27.8% | | (230,433) | (183,479) | 25.6% |
Cost of building the infrastructure | | (551,267) | (461,777) | 19.4% | | (1,477,211) | (1,202,136) | 22.9% |
Employee Pension Plans | | (28,547) | (22,089) | 29.2% | | (83,903) | (66,267) | 26.6% |
Depreciation and Amortization | | (189,965) | (168,495) | 12.7% | | (548,100) | (527,963) | 3.8% |
Amortization of Concession's Intangible | | (14,133) | (14,133) | 0.0% | | (42,399) | (42,399) | 0.0% |
| | | (1,483,270) | (1,335,931) | 11.0% | | (4,176,295) | (3,681,457) | 13.4% |
| | | | | | | | | |
EBITDA1 | | 845,687 | 718,009 | 17.8% | | 2,698,642 | 2,277,902 | 18.5% |
| | | | | | | | | |
EBIT | | 641,590 | 535,382 | 19.8% | | 2,108,144 | 1,707,540 | 23.5% |
| | | | | | | | | |
FINANCIAL INCOME (EXPENSE) | | | | | | | | |
Financial Income | | 168,428 | 154,871 | 8.8% | | 461,587 | 413,535 | 11.6% |
Financial Expenses | | (211,289) | (252,585) | -16.3% | | (635,609) | (662,568) | -4.1% |
Interest on Equity | | | | | | | | |
| | | (42,861) | (97,714) | -56.1% | | (174,022) | (249,033) | -30.1% |
| | | | | | | | | |
INCOME BEFORE TAXES ON INCOME | | 598,729 | 437,668 | 36.8% | | 1,934,122 | 1,458,507 | 32.6% |
| | | | | | | | | |
Social Contribution | | (60,036) | (43,109) | 39.3% | | (189,737) | (143,348) | 32.4% |
Income Tax | | (163,822) | (117,665) | 39.2% | | (517,394) | (394,034) | 31.3% |
| | | | | | | | |
NET INCOME | | 374,871 | 276,894 | 35.4% | | 1,226,991 | 921,126 | 33.2% |
Note:
(1) EBITDA (IFRS) is calculated from the sum of net income, taxes, financial result and depreciation/amortization, as CVM Instruction no. 527/12.
55
r
6.8) Economic-Financial performance by Distributor
(R$ thousand)
CPFL PAULISTA |
| 3Q19 | 3Q18 | Var. | 9M19 | 9M18 | Var. |
Gross Operating Revenue | 4,349,461 | 4,574,682 | -4.9% | 12,443,979 | 12,051,451 | 3.3% |
Net Operating Revenue | 2,749,311 | 2,914,610 | -5.7% | 7,836,471 | 7,612,682 | 2.9% |
Cost of Electric Power | (1,864,038) | (2,114,248) | -11.8% | (5,242,398) | (5,344,757) | -1.9% |
Operating Costs & Expenses | (602,689) | (551,549) | 9.3% | (1,685,718) | (1,506,793) | 11.9% |
EBIT | 282,584 | 248,814 | 13.6% | 908,354 | 761,133 | 19.3% |
EBITDA(1) | 351,712 | 310,594 | 13.2% | 1,106,080 | 957,090 | 15.6% |
Financial Income (Expense) | (7,742) | (29,004) | -73.3% | (47,350) | (63,925) | -25.9% |
Income Before Taxes | 274,842 | 219,809 | 25.0% | 861,004 | 697,208 | 23.5% |
Net Income | 176,837 | 140,604 | 25.8% | 553,156 | 443,747 | 24.7% |
| | | | | | | |
CPFL PIRATININGA |
| 3Q19 | 3Q18 | Var. | 9M19 | 9M18 | Var. |
Gross Operating Revenue | 1,801,238 | 1,791,030 | 0.6% | 5,295,775 | 4,930,446 | 7.4% |
Net Operating Revenue | 1,108,673 | 1,108,488 | 0.0% | 3,223,653 | 3,009,169 | 7.1% |
Cost of Electric Power | (777,433) | (831,646) | -6.5% | (2,234,650) | (2,175,406) | 2.7% |
Operating Costs & Expenses | (202,396) | (216,334) | -6.4% | (650,621) | (582,273) | 11.7% |
EBIT | 128,843 | 60,509 | 112.9% | 338,381 | 251,490 | 34.6% |
EBITDA(1) | 157,257 | 85,270 | 84.4% | 420,786 | 326,071 | 29.0% |
Financial Income (Expense) | (5,077) | (15,571) | -67.4% | (27,674) | (40,079) | -31.0% |
Income Before Taxes | 123,766 | 44,938 | 175.4% | 310,708 | 211,412 | 47.0% |
Net Income | 76,781 | 27,816 | 176.0% | 195,620 | 132,104 | 48.1% |
| | | | | | | |
RGE |
| 3Q19 | 3Q18 | Var. | 9M19 | 9M18 | Var. |
Gross Operating Revenue | 3,262,130 | 3,476,585 | -6.2% | 9,640,653 | 9,433,842 | 2.2% |
Net Operating Revenue | 1,970,728 | 2,130,869 | -7.5% | 5,872,192 | 5,840,009 | 0.6% |
Cost of Electric Power | (1,184,068) | (1,446,770) | -18.2% | (3,559,954) | (3,873,747) | -8.1% |
Operating Costs & Expenses | (583,895) | (493,697) | 18.3% | (1,582,770) | (1,372,607) | 15.3% |
EBIT | 202,765 | 190,403 | 6.5% | 729,468 | 593,656 | 22.9% |
EBITDA(1) | 296,895 | 274,953 | 8.0% | 1,003,153 | 859,795 | 16.7% |
Financial Income (Expense) | (28,040) | (46,699) | -40.0% | (89,979) | (132,476) | -32.1% |
Income Before Taxes | 174,726 | 143,704 | 21.6% | 639,490 | 461,180 | 38.7% |
Net Income | 105,913 | 88,667 | 19.5% | 400,153 | 287,618 | 39.1% |
| | | | | | | |
CPFL SANTA CRUZ |
| 3Q19 | 3Q18 | Var. | 9M19 | 9M18 | Var. |
Gross Operating Revenue | 457,495 | 474,930 | -3.7% | 1,312,472 | 1,282,036 | 2.4% |
Net Operating Revenue | 305,527 | 310,997 | -1.8% | 904,548 | 845,044 | 7.0% |
Cost of Electric Power | (183,840) | (200,989) | -8.5% | (515,422) | (523,998) | -1.6% |
Operating Costs & Expenses | (94,289) | (74,351) | 26.8% | (257,186) | (219,784) | 17.0% |
EBIT | 27,398 | 35,656 | -23.2% | 131,940 | 101,261 | 30.3% |
EBITDA(1) | 39,823 | 47,193 | -15.6% | 168,623 | 134,946 | 25.0% |
Financial Income (Expense) | (2,002) | (6,440) | -68.9% | (9,020) | (12,554) | -28.2% |
Income Before Taxes | 25,395 | 29,217 | -13.1% | 122,920 | 88,707 | 38.6% |
Net Income | 15,339 | 19,807 | -22.6% | 78,062 | 57,657 | 35.4% |
Note:
(1) EBITDA (IFRS) is calculated from the sum of net income, taxes, financial result and depreciation/amortization, as CVM Instruction no. 527/12.
56
6.9) Sales within the Concession Area by Distributor
(In GWh)
CPFL Paulista |
| 3Q19 | 3Q18 | Var. | 9M19 | 9M18 | Var. |
Residential | 2,205 | 2,180 | 1.2% | 7,208 | 6,968 | 3.5% |
Industrial | 2,714 | 2,776 | -2.2% | 8,131 | 8,190 | -0.7% |
Commercial | 1,274 | 1,257 | 1.3% | 4,254 | 4,123 | 3.2% |
Others | 1,148 | 1,182 | -2.9% | 3,342 | 3,349 | -0.2% |
Total | 7,340 | 7,394 | -0.7% | 22,935 | 22,630 | 1.3% |
| | | | | | | |
CPFL Piratininga |
| 3Q19 | 3Q18 | Var. | 9M19 | 9M18 | Var. |
Residential | 914 | 915 | -0.1% | 3,016 | 2,932 | 2.9% |
Industrial | 1,502 | 1,663 | -9.7% | 4,574 | 4,926 | -7.1% |
Commercial | 570 | 559 | 2.0% | 1,904 | 1,836 | 3.7% |
Others | 311 | 307 | 1.4% | 969 | 902 | 7.4% |
Total | 3,298 | 3,444 | -4.2% | 10,462 | 10,596 | -1.3% |
| | | | | | | |
RGE |
| 3Q19 | 3Q18 | Var. | 9M19 | 9M18 | Var. |
Residential | 1,315 | 1,339 | -1.8% | 4,195 | 4,153 | 1.0% |
Industrial | 1,634 | 1,679 | -2.7% | 4,790 | 4,802 | -0.2% |
Commercial | 577 | 587 | -1.6% | 1,959 | 1,988 | -1.5% |
Others | 1,063 | 1,099 | -3.3% | 3,733 | 3,888 | -4.0% |
Total | 4,590 | 4,703 | -2.4% | 14,676 | 14,831 | -1.0% |
| | | | | | | |
CPFL Santa Cruz |
| 3Q19 | 3Q18 | Var. | 9M19 | 9M18 | Var. |
Residential | 198 | 193 | 2.2% | 618 | 595 | 3.8% |
Industrial | 264 | 251 | 5.2% | 797 | 735 | 8.5% |
Commercial | 84 | 80 | 4.8% | 275 | 260 | 5.8% |
Others | 190 | 184 | 3.2% | 556 | 540 | 2.9% |
Total | 736 | 708 | 3.8% | 2,247 | 2,131 | 5.4% |
57
6.10) Sales to the Captive Market by Distributor
(in GWh)
CPFL Paulista |
| 3Q19 | 3Q18 | Var. | 9M19 | 9M18 | Var. |
Residential | 2,205 | 2,180 | 1.2% | 7,208 | 6,968 | 3.5% |
Industrial | 587 | 626 | -6.2% | 1,768 | 1,886 | -6.2% |
Commercial | 937 | 941 | -0.5% | 3,130 | 3,096 | 1.1% |
Others | 1,099 | 1,154 | -4.8% | 3,203 | 3,247 | -1.4% |
Total | 4,828 | 4,901 | -1.5% | 15,309 | 15,196 | 0.7% |
| | | | | | | |
CPFL Piratininga |
| 3Q19 | 3Q18 | Var. | 9M19 | 9M18 | Var. |
Residential | 914 | 915 | -0.1% | 3,016 | 2,932 | 2.9% |
Industrial | 249 | 291 | -14.6% | 763 | 861 | -11.5% |
Commercial | 399 | 397 | 0.3% | 1,351 | 1,321 | 2.3% |
Others | 257 | 263 | -2.5% | 826 | 775 | 6.6% |
Total | 1,818 | 1,867 | -2.6% | 5,955 | 5,889 | 1.1% |
| | | | | | | |
RGE |
| 3Q19 | 3Q18 | Var. | 9M19 | 9M18 | Var. |
Residential | 1,315 | 1,339 | -1.8% | 4,195 | 4,153 | 1.0% |
Industrial | 458 | 539 | -15.0% | 1,397 | 1,543 | -9.5% |
Commercial | 488 | 517 | -5.6% | 1,671 | 1,752 | -4.6% |
Others | 1,056 | 1,091 | -3.2% | 3,710 | 3,864 | -4.0% |
Total | 3,318 | 3,486 | -4.8% | 10,972 | 11,311 | -3.0% |
| | | | | | | |
CPFL Santa Cruz |
| 3Q19 | 3Q18 | Var. | 9M19 | 9M18 | Var. |
Residential | 198 | 193 | 2.2% | 618 | 595 | 3.8% |
Industrial | 93 | 101 | -7.6% | 287 | 300 | -4.4% |
Commercial | 77 | 75 | 2.7% | 255 | 244 | 4.3% |
Others | 190 | 184 | 3.0% | 555 | 540 | 2.7% |
Total | 558 | 554 | 0.7% | 1,714 | 1,680 | 2.1% |
58
6.11) Information on Interest in Companies
Energy distribution | Company Type | Equity Interest | Location (State) | Number of municipalities | Approximate number of consumers
(in thousands) | Concession term | End of the concession |
Companhia Paulista de Força e Luz ("CPFL Paulista") | Publicly-quoted corporation | Direct
100% | Countryside of São Paulo | 234 | 4,558 | 30 years | November 2027 |
Companhia Piratininga de Força e Luz ("CPFL Piratininga") | Publicly-quoted corporation | Direct
100% | Countryside and seaside of São Paulo | 27 | 1,782 | 30 years | October 2028 |
RGE Sul Distribuidora de Energia S.A. ("RGE") (a) | Publicly-quoted corporation | Direct and Indirect
100% | Countryside of Rio Grande do Sul | 381 | 2,913 | 30 years | November 2027 |
Companhia Jaguari de Energia ("CPFL Santa Cruz") | Private corporation | Direct
100% | Countryside of São Paulo, Paraná and Minas Gerais | 45 | 464 | 30 years | July 2045 |
Note:
(a) On December 31, 2018, was approved the grouping of the concessions of the distribution companies RGE Sul Distribuidora de Energia S.A. (“RGE Sul”) and Rio Grande Energia S.A. (“RGE”), considering RGE Sul as the Merging Company and RGE as the Merged Company;
Energy generation (conventional and renewable sources) | Company Type | Equity Interest | Location (State) | Number of plants / type of energy | Installed capacity |
Total | CPFL participation |
CPFL Geração de Energia S.A. ("CPFL Geração") | Publicly-quoted corporation | Direct
100% | São Paulo and Goiás | 3 Hydroelectric (b) | 1,295 | 678 |
CERAN - Companhia Energética Rio das Antas ("CERAN") | Private corporation | Indirect
65% | Rio Grande do Sul | 3 Hydroelectric | 360 | 234 |
Foz do Chapecó Energia S.A. ("Foz do Chapecó") | Private corporation | Indirect
51% (c) | Santa Catarina and
Rio Grande do Sul | 1 Hydroelectric | 855 | 436 |
Campos Novos Energia S.A. ("ENERCAN") | Private corporation | Indirect
48.72% | Santa Catarina | 1 Hydroelectric | 880 | 429 |
BAESA - Energética Barra Grande S.A. ("BAESA") | Private corporation | Indirect
25.01% | Santa Catarina and
Rio Grande do Sul | 1 Hydroelectric | 690 | 173 |
Centrais Elétricas da Paraíba S.A. ("EPASA") | Private corporation | Indirect
53.34% | Paraíba | 2 Thermoelectric | 342 | 182 |
Paulista Lajeado Energia S.A. ("Paulista Lajeado") | Private corporation | Indirect
59.93% (d) | Tocantins | 1 Hydroelectric | 903 | 38 |
CPFL Energias Renováveis S.A. ("CPFL Renováveis") | Publicly-quoted corporation | Direct and Indirect
99.94% | See chapter 2.2.2 | See chapter 2.2.2 | See chapter 2.2.2 | See chapter 2.2.2 |
CPFL Centrais Geradoras Ltda. ("CPFL Centrais Geradoras") | Limited company | Direct
100% | São Paulo and Minas Gerais | 6 MHPPs | 4 | 4 |
Transmission | Company Type | Core activity | Equity Interest |
CPFL Transmissão Piracicaba S.A. ("CPFL Piracicaba") | Private corporation | Electric energy transmission services | Indirect 100% |
CPFL Transmissão Morro Agudo S.A. ("CPFL Morro Agudo") | Private corporation | Electric energy transmission services | Indirect 100% |
CPFL Transmissão Maracanaú S.A. ("CPFL Maracanaú") | Private corporation | Electric energy transmission services | Indirect 100% |
CPFL Transmissão Sul I S.A. ("CPFL Sul I") | Private corporation | Electric energy transmission services | Indirect 100% |
CPFL Transmissão Sul II S.A. ("CPFL Sul II") | Private corporation | Electric energy transmission services | Indirect 100% |
Notes:
(b) CPFL Geração holds 51.54% of the assured power and power of the Serra da Mesa HPP, whose concession belongs to Furnas. The Cariobinha HPP and the Carioba TPP projects are deactivated pending the position of the Ministry of Mines and Energy on the anticipated closure of its concession and are not included in the table;
(c) The joint venture Chapecoense fully consolidates the interim financial statements of its direct subsidiary, Foz de Chapecó;
(d) Paulista Lajeado has a 7% participation in the installed power of Investco S.A. (5.94% share of its capital).
59
Energy commercialization | Company Type | Core activity | Equity Interest |
CPFL Comercialização Brasil S.A. ("CPFL Brasil") | Private corporation | Energy commercialization | Direct
100% |
Clion Assessoria e Comercialização de Energia Elétrica Ltda. ("CPFL Meridional") | Limited company | Commercialization and provision of energy services | Indirect
100% |
CPFL Comercialização Cone Sul S.A. ("CPFL Cone Sul") | Private corporation | Energy commercialization | Indirect
100% |
CPFL Planalto Ltda. ("CPFL Planalto") | Limited company | Energy commercialization | Direct
100% |
CPFL Brasil Varejista S.A. ("CPFL Brasil Varejista") | Private corporation | Energy commercialization | Indirect
100% |
Services | Company Type | Core activity | Equity Interest |
CPFL Serviços, Equipamentos, Industria e Comércio S.A. ("CPFL Serviços") | Private corporation | Manufacturing, commercialization, rental and maintenance of electro-mechanical equipment and service provision | Direct
100% |
Nect Serviços Administrativos de Infraestrutura Ltda ("CPFL Infra") (g) | Limited company | Infrastructure and Fleet Services | Direct
100% |
Nect Servicos Administrativos de Recursos Humanos Ltda ("CPFL Pessoas") (g) | Limited company | Human Resources Services | Direct
100% |
Nect Servicos Administrativos Financeiros Ltda ("CPFL Finanças") (g) | Limited company | Financial services | Direct
100% |
Nect Servicos Adm de Suprimentos e Logistica Ltda ("CPFL Supre") (g) | Limited company | Supply & Logistics Services | Direct
100% |
CPFL Atende Centro de Contatos e Atendimento Ltda. ("CPFL Atende") | Limited company | Provision of telephone answering services | Direct
100% |
CPFL Total Serviços Administrativos Ltda. ("CPFL Total") | Limited company | Billing and collection services | Direct
100% |
CPFL Eficiência Energética S.A. ("CPFL Eficiência") | Private corporation | Management in Energy Efficiency | Direct
100% |
TI Nect Serviços de Informática Ltda. ("Authi") | Limited company | IT services | Direct
100% |
CPFL GD S.A. ("CPFL GD") | Private corporation | Electric energy generation services | Indirect
100% |
60
Others | Company Type | Core activity | Equity Interest |
CPFL Jaguari de Geração de Energia Ltda. ("Jaguari Geração") | Limited company | Venture capital company | Direct
100% |
Chapecoense Geração S.A. ("Chapecoense") | Private corporation | Venture capital company | Indirect
51% |
Sul Geradora Participações S.A. ("Sul Geradora") | Private corporation | Venture capital company | Indirect
99.95% |
CPFL Telecom S.A. ("CPFL Telecom") | Private corporation | Telecommunication services | Direct
100% |
61
6.12) Reconciliation of Net Debt/EBITDA Pro Forma ratio of CPFL Energia for purposes of financial covenants calculation
(R$ million)
Net Debt Pro Forma Reconciliation (3Q19) | | | | | | | |
| | | | | | | | | | | |
Net debt - Generation projects | | | | | | | | | | |
Sep-19 | Majority-controlled subsidiaries (fully consolidated) | Investees accounted for under the equity method | Total |
CERAN | CPFL Renováveis | Paulista Lajeado | Subtotal | ENERCAN | BAESA | Chapecoense | EPASA | Subtotal |
Borrowings and Debentures | 430 | 5,171 | - | 5,601 | 384 | - | 1,086 | 160 | 1,630 | 7,232 |
(-) Cash and Cash Equivalents | (114) | (905) | (5) | (1,024) | (63) | (23) | (133) | (60) | (279) | (1,303) |
Net Debt | 316 | 4,266 | -5.343 | 4,577 | 322 | -23 | 953 | 100 | 1,352 | 5,929 |
CPFL Stake (%) | 65.00% | 99.94% | 59.93% | - | 48.72% | 25.01% | 51.00% | 53.34% | - | - |
Net Debt in Generation Projects | 205 | 4,264 | -3 | 4,466 | 157 | -6 | 486 | 53 | 690 | 5,156 |
| | | | | | | | | | | |
Reconciliation | | | | | | | | | | |
CPFL Energia | | | | | | | | |
Gross Debt | | 19,502 | | | | | | | | |
(-) Cash and Cash Equivalents | | (3,232) | | | | | | | | |
Net Debt (IFRS) | 16,270 | | | | | | | | |
(-) Fully Consolidated Projects | | (4,577) | | | | | | | | |
(+) Proportional Consolidation | | 5,156 | | | | | | | | |
Net Debt (Pro Forma) | 16,849 | | | | | | | | |
| | | | | | | | | | | |
| | | | | | | | | | | |
EBITDA Pro Forma Reconciliation (3Q19 - LTM) | | | | | | | |
| | | | | | | | | | | |
EBITDA - Generation Projects | | | | | | | | | | |
3Q19LTM | Majority-controlled subsidiaries (fully consolidated) | Investees accounted for under the equity method | Total |
CERAN | CPFL Renováveis | Paulista Lajeado | Subtotal | ENERCAN | BAESA | Chapecoense | EPASA | Subtotal |
Net operating revenue | 335 | 1,861 | 41 | 2,237 | 645 | 293 | 869 | 703 | 2,510 | 4,747 |
Operating cost and expense | (94) | (735) | (25) | (854) | (182) | (198) | (197) | (442) | (1,019) | (1,873) |
EBITDA | 242 | 1,126 | 15.454 | 1,383 | 462 | 95 | 672 | 261 | 1,491 | 2,874 |
CPFL stake (%) | 65.00% | 99.94% | 59.93% | - | 48.72% | 25.01% | 51.00% | 53.34% | - | - |
Proportional EBITDA | 157 | 1,125 | 9 | 1,291 | 225 | 24 | 343 | 139 | 731 | 2,023 |
| | | | | | | | | | | |
Reconciliation | | | | | | | | | | |
CPFL Energia - 3Q19 LTM | | | | | | | | |
Net income | 2,562 | | | | | | | | |
Amortization | 1,633 | | | | | | | | |
Financial Results | 834 | | | | | | | | |
Income Tax /Social Contribution | 978 | | | | | | | | |
EBITDA | 6,007 | | | | | | | | |
(-) Equity income | (351) | | | | | | | | |
(-) EBITDA - Fully consolidated projects | (1,383) | | | | | | | | |
(+) Proportional EBITDA | 2,023 | | | | | | | | |
EBITDA Pro Forma | 6,296 | | | | | | | | |
| | | | | | | | | | | |
Net Debt / EBITDA Pro Forma | 2.68x | | | | | | | | |
Note: in accordance with financial covenants calculation in cases of assets acquired by the Company.
62
Pursuant to the requirements of the Securities Exchange Act of 1934, the registrant has duly caused this report to be signed on its behalf by the undersigned, thereunto duly authorized.
Date: November 12, 2019
| CPFL ENERGIA S.A. |
|
| | By: | /S/ YueHui Pan
|
| | Name:
Title: | YueHui Pan
Chief Financial Officer and Head of Investor Relations |
FORWARD-LOOKING STATEMENTS
This press release may contain forward-looking statements. These statements are statements that are not historical facts, and are based on management's current view and estimates of future economic circumstances, industry conditions, company performance and financial results. The words "anticipates", "believes", "estimates", "expects", "plans" and similar expressions, as they relate to the company, are intended to identify forward-looking statements. Statements regarding the declaration or payment of dividends, the implementation of principal operating and financing strategies and capital expenditure plans, the direction of future operations and the factors or trends affecting financial condition, liquidity or results of operations are examples of forward-looking statements. Such statements reflect the current views of management and are subject to a number of risks and uncertainties. There is no guarantee that the expected events, trends or results will actually occur. The statements are based on many assumptions and factors, including general economic and market conditions, industry conditions, and operating factors. Any changes in such assumptions or factors could cause actual results to differ materially from current expectations.