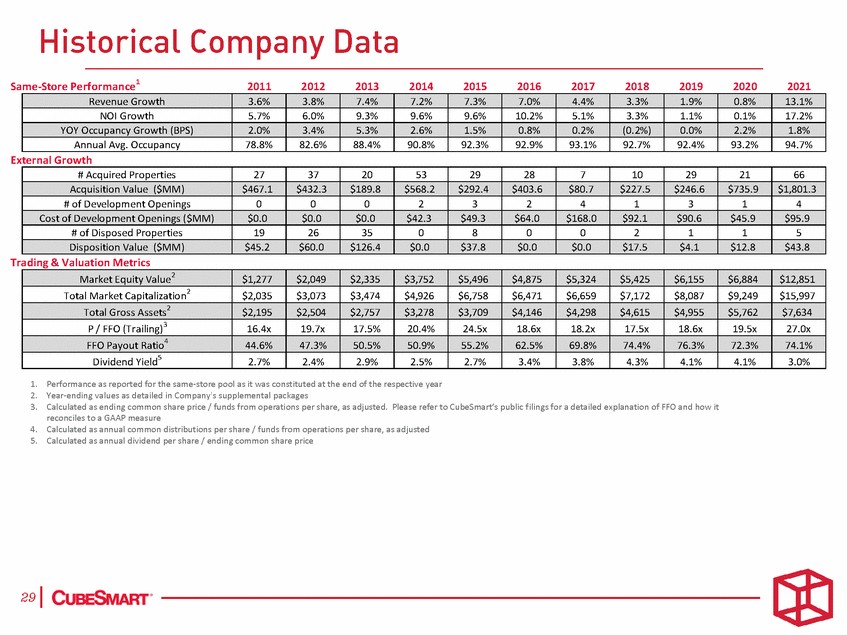
| Same-Store Performance1 2011 2012 2013 2014 2015 2016 2017 2018 2019 2020 2021 External Growth Trading & Valuation Metrics 1. 2. 3. Performance as reported for the same-store pool as it was constituted at the end of the respective year Year-ending values as detailed in Company's supplemental packages Calculated as ending common share price / funds from operations per share, as adjusted. Please refer to CubeSmart’s public filings for a detailed explanation of FFO and how it reconciles to a GAAP measure Calculated as annual common distributions per share / funds from operations per share, as adjusted Calculated as annual dividend per share / ending common share price 4. 5. Market Equity Value2 $1,277 $2,049 $2,335 $3,752 $5,496 $4,875 $5,324 $5,425 $6,155 $6,884 $12,851 Total Market Capitalization2 $2,035 $3,073 $3,474 $4,926 $6,758 $6,471 $6,659 $7,172 $8,087 $9,249 $15,997 Total Gross Assets2 $2,195 $2,504 $2,757 $3,278 $3,709 $4,146 $4,298 $4,615 $4,955 $5,762 $7,634 P / FFO (Trailing)3 16.4x 19.7x 17.5% 20.4% 24.5x 18.6x 18.2x 17.5x 18.6x 19.5x 27.0x FFO Payout Ratio4 44.6% 47.3% 50.5% 50.9% 55.2% 62.5% 69.8% 74.4% 76.3% 72.3% 74.1% Dividend Yield5 2.7% 2.4% 2.9% 2.5% 2.7% 3.4% 3.8% 4.3% 4.1% 4.1% 3.0% # Acquired Properties 27 37 20 53 29 28 7 10 29 21 66 Acquisition Value ($MM) $467.1 $432.3 $189.8 $568.2 $292.4 $403.6 $80.7 $227.5 $246.6 $735.9 $1,801.3 # of Development Openings 0 0 0 2 3 2 4 1 3 1 4 Cost of Development Openings ($MM) $0.0 $0.0 $0.0 $42.3 $49.3 $64.0 $168.0 $92.1 $90.6 $45.9 $95.9 # of Disposed Properties 19 26 35 0 8 0 0 2 1 1 5 Disposition Value ($MM) $45.2 $60.0 $126.4 $0.0 $37.8 $0.0 $0.0 $17.5 $4.1 $12.8 $43.8 Revenue Growth 3.6% 3.8% 7.4% 7.2% 7.3% 7.0% 4.4% 3.3% 1.9% 0.8% 13.1% NOI Growth 5.7% 6.0% 9.3% 9.6% 9.6% 10.2% 5.1% 3.3% 1.1% 0.1% 17.2% YOY Occupancy Growth (BPS) 2.0% 3.4% 5.3% 2.6% 1.5% 0.8% 0.2% (0.2%) 0.0% 2.2% 1.8% Annual Avg. Occupancy 78.8% 82.6% 88.4% 90.8% 92.3% 92.9% 93.1% 92.7% 92.4% 93.2% 94.7% |