Exhibit 99.1

Contents
Sands China Ltd.
Overview
Introduction
Sands China operates the largest collection of integrated resorts in Macao and is the market share leader in adjusted EBITDAR. With over 3,400 hotel rooms, 68 restaurants, 1.2 million square feet of retail, 1.2 million square feet of meeting space, 2 permanent theaters, a 15,000-seat arena and the world’s largest casino, Sands China is uniquely positioned to be a major driver of Macao’s economic diversification for years to come.
Financial Highlights
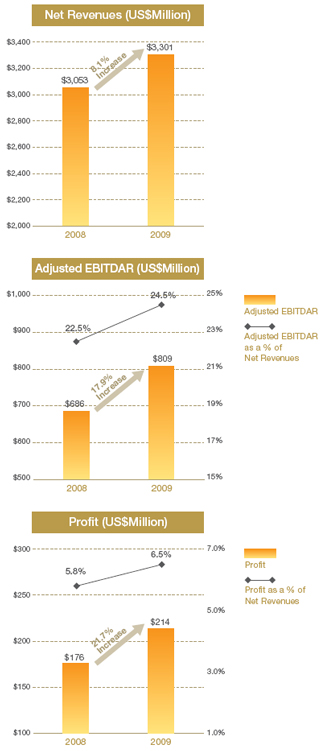
| | • | | Net revenues were US$3,301.1 million for the year ended December 31, 2009, an increase of US$247.8 million, or 8.1%, compared to US$3,053.3 million for the year ended December 31, 2008. |
| | • | | Operating expenses were US$2,931.1 million for the year ended December 31, 2009, an increase of US$171.8 million, or 6.2%, compared to US$2,759.3 million for the year ended December 31, 2008. |
| | • | | Adjusted EBITDAR for the year ended December 31, 2009 was US$809.0 million, an increase of US$123.0 million, or 17.9%, compared to US$686.0 million for the year ended December 31, 2008. Adjusted EBITDAR as a percentage of net revenues was 24.5% for the year ended December 31, 2009, an increase of 2.0 percentage points, compared to 22.5% for the year ended December 31, 2008. |
| | • | | Profit for the year ended December 31, 2009 was US$213.8 million, an increase of US$38.1 million, or 21.7%, compared to US$175.7 million for the year ended December 31, 2008. Profit as a percentage of net revenues was 6.5% for the year ended December 31, 2009, an increase of 0.7 percentage points, compared to 5.8% for the year ended December 31, |
2008.
2
Annual Report 2009
Overview
Highlights of 2009
Business
As the new Chief Executive Officer and President of Sands China Ltd., Steven Craig Jacobs acted swiftly to put a new management team in place, establish a new organizational structure, and drive new business strategies across the organization. Under his leadership, we:
| | • | | Launched a variety of new products and services in 2009 including: |
| | • | | The Paiza Mansions at The Plaza Macao |
| | • | | A Poker Room at The Venetian Macao |
| | • | | A high limit slot machine area at The Venetian Macao and Sands Macao |
| | • | | Successfully obtained new ferry routes and operating licenses to Tsim Sha Tsui, Kowloon and the Hong Kong International Airport in order to expand the reach of our transportation infrastructure and draw more visitors to Macao. |
| | • | | Successfully restructured our property operations and repositioned the Company’s brands. We removed more than US$300 million in operating expenses from our business and aligned our brands with their key customer segments. |
| | • | | Introduced a rolling credit program and were one of the first gaming concessionaires to implement a cap on junket commissions, an initiative endorsed by the Macao Government. |
| | • | | Successfully strengthened our balance sheet, setting the stage for growth both now and in the future. We achieved this by: |
| | • | | Negotiating new favorable loan terms with our existing lenders |
| | • | | Raising US$600 million through the sale of pre-IPO convertible bonds |
| | • | | Raising an additional US$2.5 billion through the listing of the Company’s shares on the Stock Exchange |
| | • | | Repaying and fully settling all inter-company loans, which improved our debt to EBITDAR ratio to below 3:1 |
| | • | | Obtaining commitments from a group of banks and financial institutions for US$1.75 billion in debt financing for the construction of Parcels 5 and 6 (the first phase of which is expected to consist of two hotel towers with over 3,700 Sheraton, Shangri-La and Traders branded hotel rooms). |
| | • | | Meeting with the Macao Government, which reassured us that it would support all efforts to restart our development on Parcels 5 and 6, including ensuring that we would have sufficient gaming tables and slot machines to successfully open the development project. |
Attendance

Sands China’s properties are among the most visited destinations in Macao attracting families, business visitors and entertainment seekers from around the world. More than 30% of our hotel guests are families with children and business travelers attending corporate meetings, conventions, and exhibitions.
In 2009, all three of our properties, The Venetian Macao, the Sands Macao and The Plaza Macao, attracted a combined total of 35.2 million visitors or close to 100,000 visitors per day.
We achieved the highest attendance on record for a single day at The Venetian Macao, an astonishing 116,168 visitors on January 31, 2009.
During the October Golden Week (October 1–8, 2009), The Venetian Macao attracted 625,437 visitors.
3
Sands China Ltd.
Overview
Entertainment
Entertainment is at the heart of our business. In addition to our live entertainment, bar and restaurant venues, The Venetian Macao is home to ZAIA™, Cirque du Soleil’s only permanent show in Asia. The 15,000-seat CotaiArena™, also at The Venetian Macao, attracted more than 180,000 spectators in 2009 to witness some of the world’s leading acts live on stage in Macao. The CotaiArena™ hosted 34 public events during the year.
CotaiArena™hosted many of Asia’s hottest stars throughout 2009 including:
| | |
| A-Mei | | Rain |
| |
| Charlene Choi | | Sam Hui |
| |
| Eason Chan | | Sandy Lam |
| |
| Joey Yung | | S.H.E |
| |
| Kay Tse | | Wang Lee Hom |

The Venetian Macao also attracted international icons including Linkin Park, Lady Gaga, John Legend and Journey to Macao in 2009.
India’s world famous film awards were held at The Venetian Macao in June. The Indian International Film Academy (IIFA) chose The Venetian Macao as its host venue for the high-profile 2009 ‘Bollywood’ awards. IIFA attracted 42,000 Bollywood fans to The Venetian Macao and 600 million television viewers around the world.
Tennis legends Andre Agassi and Pete Sampras held court at CotaiArena™, attracting more than 10,000 people in October.
CotaiArena™was ranked as one of the top 100 arenas in the world by the live music industry publicationPollstar.

4
Annual Report 2009
Overview
Meetings, Incentives, Conventions & Exhibitions (MICE)
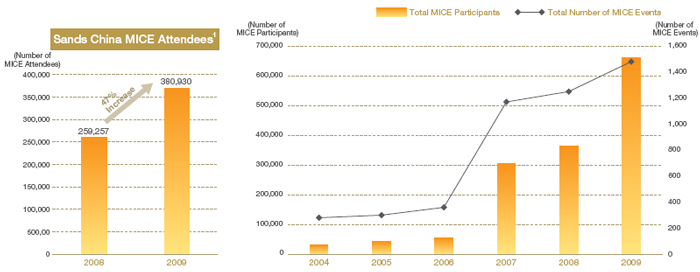
Sands China’s properties boast over 1.2 million square feet of MICE space specifically designed to meet the needs of meeting planners, corporate event and tradeshow organizers from around the world. The CotaiExpoTM is one of the largest exhibition centers in Asia and has hosted some of the region’s biggest tradeshows. Our experience and expertise in this industry continues to drive business and leisure tourism to Macao. The Venetian Macao attracted 380,930 participants and exhibitors to Macao for MICE events throughout the year.
Major events held throughout 2009 include:
| | • | | Macau International Jewelry & Watch Fair, January 10–13 |
| | • | | 11th Asia Pacific Life Insurance Council Congress, April 15–16 |
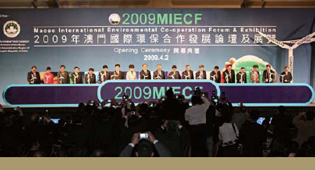
| | • | | Macau International Environmental Co-operation Forum & Exhibition (MIECF), April 2–4 |
| | • | | Macao International Trade & Investment Fair (MIF), October 22–25 |
MIECF 2009
MIECF, organized by the Macao SAR Government, the Macao Trade and Investment Promotion Institute (IPIM) and the Environment Council, attracted 6,000 delegates from around the world to The Venetian Macao.
MIF 2009
MIF, organized by IPIM, attracted 60,000 attendees to the CotaiExpo™at The Venetian Macao.
Awards
| | |
| Sands China’s properties, and in particular The Venetian Macao, continue to set the standard in customer service, MICE, business, and leisure travel. For two consecutive years — since the opening of The Venetian Macao in 2007 — we have received prestigious awards for being Asia’s leading integrated resort for business and leisure tourism. | |  |
Best MICE Hotel in Asia
CEI Asia 2009 Industry Award (Conference, Exhibition & Incentive Asia Magazine)
2008 Best Business Hotels
Travel & Leisure Magazine (awarded in 2009)
Best Meeting and Conventions Hotel in Macao
TTG China Travel Awards 2009 (Travel Trade Gazette China Magazine)
Best Hotel in Macao — Business Travel Poll Awards 2008
FinanceAsia (awarded in 2009)
Best Integrated Resort Award
20th TTG Travel Awards 2009 (Travel Trade Gazette Asia Magazine)
Best Business Hotel in Macao
2009 Business Traveller China Travel Awards
Top 5 Most Popular Hotels in Asia
HotelClub Awards Asia
IPO Award
International Financial Law Review Deal of the Year for 2009 for the Sands China IPO
Macao Green Hotel Award
The Macao SAR Environment Council
5
Sands China Ltd.
Chairman’s Statement

Sands China’s profit for the year ended December 31, 2009 was US$213.8 million, up from US$175.7 million in 2008, a dramatic increase of 21.7%.
Dear Shareholders,
On behalf of the Board of Directors (“the Board”) of Sands China, I am pleased to present to you our first Annual Report as a company listed on the Main Board of The Stock Exchange of Hong Kong Limited.
Business Review
Sands China’s profit attributable to shareholders for the year ended December 31, 2009 was US$213.8 million, up from US$175.7 million in 2008, an increase of 21.7%. Earnings per share for the year ended December 31, 2009 was US$3.32 cents (HK$25.77 cents), up from US$2.80 cents (HK$21.69 cents) in 2008, an increase of 18.6%.
Adjusted EBITDAR for the year ended December 31, 2009 was US$809.0 million, an increase of US$123.0 million or 17.9% compared to US$686.0 million for the year ended December 31, 2008.
6
Annual Report 2009
Chairman’s Statement
In 2009, Sands China benefited from a number of key strengths that helped to differentiate our business from that of our competitors, including the following:
| | • | | We provided the highest quality integrated resort offerings, which include a diversified set of products and services, including substantial non-gaming amenities. That unique product offering enables us to target and attract a broad range of customers; |
| | • | | The diversification of amenities provided us with a substantially higher adjusted EBITDAR to sales percentage compared to casino-only operators, particularly at the high end of the market. This diversification enabled us to lead the market, by far, in adjusted EBITDAR generation; |
| | • | | We generated substantial cash flow and earnings from our existing operations; |
| | • | | We maintained an industry-leading development pipeline, including additional integrated resorts currently under development on Cotai; |
| | • | | We utilized established brands with broad regional and international appeal to market to potential customers; |
| | • | | We operated very efficiently to control our overall cost structure; |
| | • | | We maintained an experienced management team with a proven track record in both operations and development; and |
| | • | | We derived significant benefits from our on-going relationship with Las Vegas Sands Corp. |
These business strategies resulted in strong financial and operating performance for our Group in 2009. The Venetian Macao welcomed 23.8 million visitors during 2009 and generated US$554.8 million (HK$4,302.3 million) in adjusted EBITDAR, an increase of 11.6% compared to the US$497.2 million (HK$3,853.5 million) in 2008. The Sands Macao welcomed 6.9 million visitors and generated US$243.4 million (HK$1,887.5 million) in adjusted EBITDAR in 2009, an increase of 13.5% compared to the US$214.4 million (HK$1,661.7 million) generated in 2008. In its first full calendar year of operation, the Four Seasons Hotel and Plaza Casino welcomed 4.5 million visitors and generated US$40.3 million (HK$312.5 million) in adjusted EBITDAR. The introduction during the year of our Paiza Mansions, luxurious accommodations of 3,500–17,000 square feet, contributed to a significant increase in adjusted EBITDAR at this property in the latter half of the year.
Prospects
Our cost savings and efficiency programs remained an important component of our operating strategy throughout 2009, and I am pleased to report that we were successful in implementing all of our identified cost savings initiatives by December 31, 2009. I believe that these initiatives will allow us to expand our adjusted EBITDAR margins in the future and will provide enhanced operating leverage in the months and years ahead.
7
Sands China Ltd.
Chairman’s Statement
We hosted 15 trade shows in 2009, which attracted more than 320,000 visitors to Macao and Cotai. In addition, we hosted 388 corporate groups, which brought an additional 60,000 delegates to Macao. Given current trade show and group booking trends, we are confident of strong growth in MICE visitation in 2010.
We substantially completed the construction of our Four Seasons-branded Apart-Hotel Tower in the fourth quarter of 2009. We feel that market conditions in Macao are favorable for the execution of our strategy and expect to begin to monetize this important asset in 2010.
In November 2009, the Macao Government awarded a concession by lease for Parcels 5 and 6. We are now waiting for publication of the land concession in the official gazette.
After receiving commitments of US$1.75 billion of project financing in November 2009 (which we expect to close in April 2010), we were able to mobilize to recommence the construction of Parcels 5 and 6 of our Cotai Strip developments. We also expect to get into high levels of actual construction starting in April. We expect that it will take approximately 16 months to complete construction of Phase I, which will include 3,700 rooms from the Shangri-La, Traders and Sheraton hotel brands, and an additional six months to complete the adjacent 2,300 room Sheraton Tower hotel in Phase II.
The Macao Government granted us an extension of the development deadline under the land concession for Parcel 3 on Cotai on September 29, 2009. Under the terms of the land concession, we must now complete development of Parcel 3 by April 17, 2013.
Our CotaiJetTM ferry operation was issued a new 10-year license on January 14, 2010. The new license not only permits us to continue operating ferries between Macao and Hong Kong, but also permits us to offer additional routes to Macao from Hong Kong, including from the China Ferry Terminal in Kowloon and the Hong Kong International Airport. Opening these new routes and increasing capacity from Hong Kong to Macao will facilitate the growth of our MICE business by seamlessly linking Hong Kong to Cotai.
The process of becoming a listed company in Hong Kong was completed during the year, and provides the opportunity for Asian investors to participate in our future success through the ownership of shares in Sands China. Our business strategy is to continue to successfully execute our Cotai Strip developments and to leverage our integrated resort business model to create Asia’s premier gaming, leisure and convention destination. Our business strategies and development plans allow us to achieve strong growth and financial performance in the future. We look forward to reporting to shareholders at the Annual General Meeting and in the next interim and annual reports on the effective management of our company’s business and assets, and upon the continued delivery of value to you and other stakeholders.
|
| Sheldon G. Adelson |
| Chairman of the Board |
| Hong Kong, April 14, 2010 |
8
Annual Report 2009
Directors and Senior Management
Directors
Our Board of Directors consists of eight Directors, three of whom are independent Non-Executive Directors. The following table sets forth certain information concerning our Directors:
| | | | |
Name | | Age | | Title |
| Sheldon Gary Adelson | | 76 | | Chairman and Non-Executive Director |
| Steven Craig Jacobs | | 47 | | Chief Executive Officer, President and Executive Director |
| Stephen John Weaver | | 49 | | Chief Development Officer and Executive Director |
| Jeffrey Howard Schwartz | | 50 | | Non-Executive Director |
| Irwin Abe Siegel | | 69 | | Non-Executive Director |
| Iain Ferguson Bruce | | 69 | | Independent Non-Executive Director |
| Chiang Yun | | 42 | | Independent Non-Executive Director |
| David Muir Turnbull | | 55 | | Independent Non-Executive Director |
| | |
| | Chairman and Non-Executive Director |
| |
 | | Sheldon Gary Adelson, 76, is the Chairman of our Board of Directors and Non-Executive Director. Mr. Adelson has been the Chairman of the Board of LVS, Chief Executive Officer and a Director of LVS since August 2004. Mr. Adelson has been Chairman of the Board, Chief Executive Officer and a Director of Las Vegas Sands, LLC (or its predecessor) since April 1988, when Las Vegas Sands, LLC was formed to own and operate the former Sands Hotel and Casino. Mr. Adelson has extensive experience in the convention, trade show and tour and travel businesses. Mr. Adelson also has investments in other business enterprises. Mr. Adelson created and developed the COMDEX Trade Shows, including the COMDEX/Fall Trade Show, which was the world’s largest computer show in the 1990s. COMDEX was sold to Softbank Corporation in April 1995. Mr. Adelson also created and developed the Sands Expo Center, which he grew into one of the largest privately owned convention and trade show destinations in the United States, before transferring it to LVS in July 2004. He has been President and Chairman of the Board of Interface Group Holding Company, Inc. since the mid-1970s and Chairman of the Board of LVS’s affiliate Interface-Group Massachusetts, LLC and its predecessors since 1990. Mr. Adelson was appointed Chairman and Non-Executive Director on August 18, 2009. |
| | |
| | Executive Directors |
| |
 | | Steven Craig Jacobs, 47, is our Chief Executive Officer, President, Executive Director and Chairman of the LVSC Announcements Committee. Mr. Jacobs was President-Macao of LVS from May 2009 and has worked with LVS since March 2009. From 1994 through 2008, Mr. Jacobs served as the President and CEO of the Vagus Group Inc (“VGI”), an international management services company specializing in travel and hospitality. Through VGI, Mr. Jacobs assumed a variety of senior executive roles in companies including Louvre Hotels, U.S. Franchise Systems, Hyatt and Best Western International. Mr. Jacobs holds a Bachelor of Arts degree from Harvard University. Mr. Jacobs was appointed Executive Director on August 18, 2009. |
9
Sands China Ltd.
Directors and Senior Management
| | |
 | | Stephen John Weaver, 49, is our Chief Development Officer and Executive Director. Mr. Weaver joined our Group in August 2005 and has served as the President of Asian Region since October 2006. He is responsible for overseeing all development and government relations activities in Macao, including real estate development transactions, retail mall leasing and other business development-related activities. He has broad experience in all elements of property development and business management, initially gained through 12 years of private practice as a property lawyer and subsequently in senior management positions with Savills and Jones Lang LaSalle. Mr. Weaver holds a Bachelor of Laws degree from Queensland University of Technology and a Master of Business Administration from the University of Southern Queensland, having completed the relevant correspondence courses of both universities. Mr. Weaver is a Solicitor of the Supreme Court of Queensland and the High Court of Australia. Mr. Weaver was appointed Executive Director on August 18, 2009. |
| | |
| | Non-Executive Directors |

| | Jeffrey Howard Schwartz, 50, is one of our Non-Executive Directors and a member of the Remuneration Committee. Mr. Schwartz has been Director of LVS since March 2009. He is the Chairman of the Board and co-founder of Global Logistic Properties, which controls the largest platform of logistics facilities in Asia. Mr. Schwartz was the Chief Executive Officer of ProLogis, listed on the NYSE, from January 2005 through November 2008, and served as the Chairman of the Board and Director of ProLogis from May 2007 through November 2008. Mr. Schwartz also served as a Director of ProLogis European Properties, a company listed on both the EuroNext and Luxembourg exchanges. Mr. Schwartz was President of international operations at ProLogis from March 2003 to December 2004, and was Asia President and Chief Operating Officer from March 2002 to December 2004. He had been associated with ProLogis in varying capacities since 1994. Mr. Schwartz was appointed Non-Executive Director on October 14, 2009. |
| | |
| |
 | | Irwin Abe Siegel, 69, is one of our Non-Executive Directors and a member of the Audit Committee. Mr. Siegel has been a Director of LVS since February 2005. He was a Director of Las Vegas Sands, Inc. from February 2005 until July 2005. Mr. Siegel is a certified public accountant and was a partner (specializing in the hospitality industry) in the international accounting and consulting firm of Deloitte & Touche LLP from 1973 to 2003, when he retired. From 1996 through 1999, Mr. Siegel served as the Chief Executive Officer of Deloitte & Touche LLP’s operations in the former Soviet Union. Mr. Siegel has been working as a business consultant since 2003. Mr. Siegel has served on the boards of Directors of many charitable and civic organizations and is the immediate past President of the Weinstein Hospice in Atlanta, Georgia, U.S.A. Mr. Siegel was appointed Non-Executive Director on October 14, 2009. |
10
Annual Report 2009
Directors and Senior Management
| | |
| | Independent Non-Executive Directors |
| |
 | | Iain Ferguson Bruce, 69, is one of our independent Non-Executive Directors, Chairman of the Audit Committee and a member of both the Remuneration Committee and LVSC Announcements Committee. Mr. Bruce joined KPMG in Hong Kong in 1964 and was elected to its partnership in 1971. He was the senior partner of KPMG from 1991 until his retirement in 1996, and served as Chairman of KPMG Asia Pacific from 1993 to 1997. He has been a member of the Institute of Chartered Accountants of Scotland since 1964 and is a fellow of the Hong Kong Institute of Certified Public Accountants. He is also a fellow of The Hong Kong Institute of Directors and a member of The Hong Kong Securities Institute. Mr. Bruce is currently an independent Non-Executive Director of Paul Y. Engineering Group Limited, Tencent Holdings Limited, Vitasoy International Holdings Limited and Wing On Company International Limited, all listed on the Stock Exchange. Mr. Bruce is also a Non-Executive Director of Noble Group Limited, listed on the Singapore Exchange Limited; of China Medical Technologies, Inc., listed on NASDAQ; and of Yingli Green Energy Holding Company Limited, listed on the New York Stock Exchange. Mr. Bruce is a steward of The Hong Kong Jockey Club, an independent Non-Executive Director of Citibank (Hong Kong) Limited, and is Chairman of KCS Limited. Mr. Bruce was appointed independent Non-Executive Director on October 14, 2009. Mr. Bruce has over 44 years of experience in the accounting profession and possesses the accounting and related financial management expertise required under rule 3.10(2) of the Listing Rules. |
| | |
 | | Chiang Yun, 42, is one of our independent Non-Executive Directors and a member of the Audit Committee. With over 15 years of private equity investment experience, Ms. Chiang is one of the four founding managing partners of Pacific Alliance Equity Partners, the private equity division of Pacific Alliance Group. Prior to the founding of Pacific Alliance Equity Partners, Ms. Chiang was a Vice President of AIG Global Investment. In addition to currently sitting on the boards of five separate portfolio companies, Ms. Chiang was also a Board member of two listed companies in Hong Kong and Thailand, namely China-Hongkong Photo Products Holdings Limited and C.P. Seven Eleven Public Company Limited. Ms. Chiang obtained her Executive Master of Business Administration degree from The Kellogg Graduate School of Management of Northwestern University and Hong Kong University of Science and Technology, and her Bachelor of Science degree, cum laude, from Virginia Polytechnic Institute and State University, or Virginia Tech. Ms. Chiang was appointed independent Non-Executive Director on October 14, 2009. |
11
Sands China Ltd.
Directors and Senior Management
| | |
 | | David Muir Turnbull, 55, is one of our independent Non-Executive Directors, Chairman of the Remuneration Committee and a member of the LVSC Announcements Committee. Mr. Turnbull graduated from Cambridge University in 1976 with a Bachelor of Arts degree with honors in Economics, and subsequently obtained a Master of Arts degree. He joined the Swire Group upon graduation and held a variety of senior management positions during his 30 years with the group, including Chief Executive Officer of Cathay Pacific from December 1996 to December 2004. Mr. Turnbull also held a number of positions in companies listed on the Stock Exchange, including Chairman of Swire Pacific Ltd. and Cathay Pacific Airways Ltd. from January 2005 until January 2006; Chairman of Hong Kong Aircraft Engineering Company Ltd. from March 1995 until August 2006; Non-Executive Director of the Hongkong and Shanghai Banking Corporation from January 2005 until December 2005; Non-Executive Director of Air China Ltd. from May 2005 until December 2005; and Non-Executive Director of Hysan Development Co. Ltd. from May 2005 until January 2006. In July 2008, Mr. Turnbull was appointed Executive Chairman of Pacific Basin Shipping Company, listed on the Stock Exchange, and has served as an independent Non-Executive Director since May 2006. In July 2006, he was appointed independent Non-Executive Director of Green Dragon Gas Limited, a company listed on the Alternative Investment Market, a sub-market of the London Stock Exchange. In November 2008, he was appointed as the Chairman of Seabury Aviation and Aerospace Asia (Hong Kong) Ltd, a subsidiary of Seabury Group LLC. Mr. Turnbull was appointed independent Non-Executive Director of the Company on October 14, 2009. |
| | |
| | Special Adviser to the Board |
| |
 | | Michael Alan Leven, 72, is Special Adviser to our Board. Mr. Leven is the President and Chief Operating Officer of LVS and its wholly-owned subsidiary, Las Vegas Sands, LLC, having been appointed April 1, 2009. Mr. Leven has been a member of LVS’s Board of Directors since August 2004. Mr. Leven has served as the Chief Executive Officer of the Georgia Aquarium since September 2008. From January 2006 through September 2008, Mr. Leven was the Vice Chairman of the Marcus Foundation, Inc., a non-profit foundation. Until December 2006, Mr. Leven was the Chairman, Chief Executive Officer and President of U.S. Franchise Systems, Inc., the company he founded in 1995 that developed and franchised the Microtel Inns & Suites and Hawthorn Suites hotel brands. He was previously the President and Chief Operating Officer of Holiday Inn Worldwide, President of Days Inn of America, and President of Americana Hotels. On account of his extensive prior experience in the gaming and hospitality industries, we appointed Mr. Leven to be Special Adviser to the Board on October 14, 2009. Mr. Leven will attend and participate in meetings of the Board, and be provided notice of meetings of the Board together with materials to be considered by the Board. However, Mr. Leven’s role is only advisory and he does not have the right to vote at any such meetings or to direct any course of action to the Directors, and he will be required to observe the same duties of confidentiality and fidelity to our Company as a Director would be subject to. Mr. Leven will not receive any compensation from us (or LVS) in connection with his role as Special Adviser to the Board. |
12
Annual Report 2009
Directors and Senior Management
Senior Management
| | |
| | Steven Craig Jacobs, 47, is our Chief Executive Officer, President and Executive Director. |
| | |
| | Stephen John Weaver, 49, is our Chief Development Officer and Executive Director. |
| | |
 | | Toh Hup Hock, 44, is our Chief Financial Officer. He is currently a Director of some of our PRC, Cayman, Macao and Hong Kong subsidiaries. Mr. Toh joined our Group in April 2007 after a 15-year career with General Electric Company (“GE”). During his tenure at GE, Mr. Toh held a number of Chief Financial Officer and similar positions in Asia, including for GE Lighting Asia, GE Consumer Products Asia, GE Consumer & Industrial Asia and GE Plastics Greater China. Mr. Toh holds a Bachelor of Science in Accounting from Murdoch University and a Masters in Business Administration from the University of Queensland. Mr. Toh is a full member of CPA Australia. |
| | |
 | | Luis Nuno Mesquita de Melo, 46, is our General Counsel and Joint Company Secretary. Mr. Melo holds a law degree from the University of Lisbon’s Faculty of Law. Mr. Melo originally joined VML as an Associate General Counsel in September 2005, and became Senior Vice-President and General Counsel of VML in September 2008. In October 2008, Mr. Melo became a Director of VML and all of its Macao subsidiaries. Prior to joining our Group, he was a lecturer at the University of Lisbon Law School from 1985 to 1990. Mr. Melo joined the Macao Government in 1990 as a lawyer for the Legislative Modernization Commission, working extensively in revising and modernizing the Macao legal system and legislation in preparation for the Administration handover from Portugal to the PRC. He also held various advisory roles to the Legislative Assembly of Macao, including legal adviser to the President, from 1992 to 1997, and the office of Assistant (legal affairs) to the Minister of Economy of Portugal in 1997. In addition, he was also in private practice and was a partner of the law firm J.A. Pinto Ribeiro & Associados from December 1997 to 2005, and was a founding partner of Augusto Mateus & Associados, Sociedade de Consultores Lda., a company engaged in economic and consultancy studies and entrepreneurial development and restructuring strategies. |
| | |
| | Ho Siu Pik, 46, is the Joint Company Secretary of the Company. Ms. Ho is a Director of the Corporate Services Division of Tricor Services Limited and an Associate Member of both the Institute of Chartered Secretaries and Administrators and the Hong Kong Institute of Chartered Secretaries. Ms. Ho has over 20 years of experience in the company secretarial area. She is currently the Joint Company Secretary of China Molybdenum Co., Ltd., a company listed on the Stock Exchange. |
13
Sands China Ltd.
Industry Overview
Overview of Macao

The Macao Special Administrative Region was established on December 20, 1999 following more than 400 years of administration by Portugal. Macao is located on the southeast coast of mainland China to the west of Guangdong Province. Macao consists of the Macao peninsula and the islands of Taipa and Coloane and the reclaimed area of Cotai. Three bridges link the Macao peninsula to Taipa, while the two islands are connected by the land reclamation area known as Cotai.
Macao is the only region in China to offer legalized casino gaming and its casinos have historically offered little in the way of non-gaming facilities. Macao’s gaming industry was previously controlled pursuant to a monopoly, which formally ended in 2002 when the Macao Government launched an international tender process and granted three concessions to Galaxy, SJM and Wynn Macau. The Macao Government subsequently and successively authorized three subconcessions. In December 2002, Galaxy, the Macao Government and VML, our subsidiary, entered into the Subconcession Contract, which allows us to develop and operate gaming facility projects in Macao independently from Galaxy. The two other Subconcessionaires are Melco Crown and MGM Grand Paradise. The awarding of these six concessions ushered in a new era and saw the introduction to Macao of integrated resorts with significant non-gaming facilities.
Following the liberalization of its gaming laws, Macao has become the largest gaming market in the world based on casino gaming revenue, surpassing Las Vegas in 2006 and growing by over 110% between 2006 and 2009, based on information published by the DICJ and the Nevada Gaming Control Board. The growth in the gaming market in Macao has contributed to the strong growth of Macao’s GDP.
Tourism and gaming account for the majority of Macao’s GDP. For the year ended December 31, 2009, tourism GDP totaled US$18.5 billion, representing 87.3% of Total GDP. Of the tourism GDP, gaming GDP accounted for US$14.7 billion, or 79.4%, of such expenditures. The following table illustrates Macao’s total GDP, tourism GDP and gaming GDP from 2004 to 2009:
| | | | | | | | | | | | | | | | | | |
| | | For the year ended December 31, | |
| | | 2004 | | | 2005 | | | 2006 | | | 2007 | | | 2008 | | | 2009 | |
| | | (US$ in millions, except percentages) | |
| | | | | | |
Total GDP | | 10,279 | | | 11,524 | | | 14,214 | | | 18,682 | | | 21,483 | | | 21,168 | |
Year-on-year Change, nominal | | — | | | 12.1 | % | | 23.3 | % | | 31.4 | % | | 15.0 | % | | (1.5 | )% |
| | | | | | |
Tourism GDP(1) | | 7,881 | | | 8,409 | | | 10,162 | | | 13,946 | | | 17,422 | | | 18,478 | |
Tourism GDP as a % of Total GDP | | 76.7 | % | | 73.0 | % | | 71.5 | % | | 74.7 | % | | 81.1 | % | | 87.3 | % |
| | | | | | |
Gaming GDP(2) | | 5,375 | | | 5,788 | | | 7,023 | | | 10,225 | | | 13,383 | | | 14,673 | |
Gaming GDP as a % of Tourism GDP | | 68.2 | % | | 68.8 | % | | 69.1 | % | | 73.3 | % | | 76.8 | % | | 79.4 | % |
14
Annual Report 2009
Industry Overview
Macao Total GDP, Tourism GDP and Gaming GDP
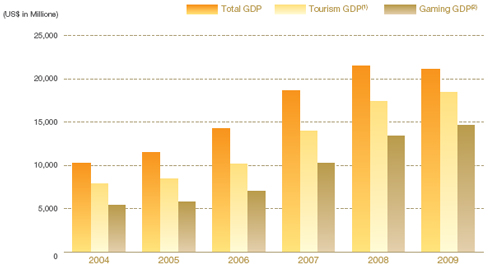
Source: DSEC. Converted from MOP at the Exchange Rate.
| (1) | Defined as tourism expenditures of non-residents of Macao. |
| (2) | Defined as gaming expenditures of non-residents of Macao. |
Proximity to Significant Population Mass
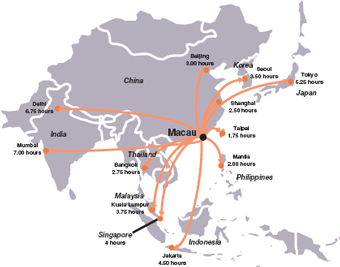
Macao is centrally located in the Asian region, which is home to more than three billion people.
The map below shows the approximate travel times to Macao from key gateway cities in Asia.
15
Sands China Ltd.
Industry Overview
Visitors traveling to Macao generally come from mainland China, Hong Kong and Taiwan. According to the DSEC statistics, 81.4% of visitors to Macao during 2009 came from mainland China and Hong Kong. Since July 2003, residents from mainland China have been allowed to apply for a visa to visit Macao and Hong Kong on an individual basis under the facilitated individual travel (“FIT”) scheme. Following implementation of the FIT scheme, the number of mainland Chinese tourists has increased significantly and mainland China has become one of Macao’s most important markets for tourism. According to the Macao Yearbook 2008, by the end of 2007, the FIT scheme had been extended to residents of all of Guangdong Province, Beijing, Shanghai and other major cities that may be approved from time to time. Although total visitation in Macao declined in 2009 as a result of the visa restrictions imposed in 2008, recent disruptions in the global financial markets and the outbreak of swine flu, we expect that visitation from mainland China, Hong Kong and Taiwan will continue to be strong because of a growing middle class with a strong desire for entertainment.
We believe that the increasing appeal of Macao, led primarily by the development of world-class integrated resorts, investments in non-gaming facilities, economic growth throughout Asia, and expanding infrastructure development, will enable Macao to attract visitors from an increasingly wider radius. The following table presents information on visitor arrivals to Macao by place of residence from 2004 to 2009:
| | | | | | | | | | | | | | | | | | | | | | | | | | | | | | |
| | | For the year ended December 31, | |
| | | 2004 | | | 2005 | | | 2006 | | | 2007 | | | 2008(1) | | | 2009 | |
| | | Visitors | | % | | | Visitors | | % | | | Visitors | | % | | | Visitors | | % | | | Visitors | | % | | | Visitors | | % | |
| | | (in millions) | |
| | | | | | | | | | | | |
Mainland China | | 9.5 | | 57.2 | % | | 10.5 | | 55.9 | % | | 12.0 | | 54.5 | % | | 14.9 | | 55.1 | % | | 11.6 | | 50.6 | % | | 11.0 | | 50.5 | % |
Hong Kong | | 5.1 | | 30.3 | % | | 5.6 | | 30.0 | % | | 6.9 | | 31.6 | % | | 8.2 | | 30.3 | % | | 7.0 | | 30.6 | % | | 6.7 | | 30.9 | % |
Taiwan | | 1.3 | | 7.7 | % | | 1.5 | | 7.9 | % | | 1.4 | | 6.5 | % | | 1.4 | | 5.3 | % | | 1.3 | | 5.7 | % | | 1.3 | | 5.9 | % |
Southeast Asia(2) | | 0.3 | | 1.6 | % | | 0.4 | | 2.1 | % | | 0.7 | | 3.2 | % | | 1.2 | | 4.4 | % | | 1.5 | | 6.4 | % | | 1.3 | | 6.2 | % |
Other Asia(3) | | 0.2 | | 1.3 | % | | 0.3 | | 1.7 | % | | 0.4 | | 1.9 | % | | 0.6 | | 2.2 | % | | 0.7 | | 3.3 | % | | 0.7 | | 3.3 | % |
Others(4) | | 0.3 | | 2.0 | % | | 0.4 | | 2.3 | % | | 0.5 | | 2.3 | % | | 0.7 | | 2.7 | % | | 0.8 | | 3.4 | % | | 0.7 | | 3.2 | % |
| | | | | | | | | | | | | | | | | | | | | | | | | | | | | | |
| | | | | | | | | | | | |
Total | | 16.7 | | 100.0 | % | | 18.7 | | 100.0 | % | | 22.0 | | 100.0 | % | | 27.0 | | 100.0 | % | | 22.9 | | 100.0 | % | | 21.8 | | 100.0 | % |
| | | | | | | | | | | | | | | | | | | | | | | | | | | | | | |
16
Annual Report 2009
Industry Overview
Visitor Arrivals to Macao by Place of Residence
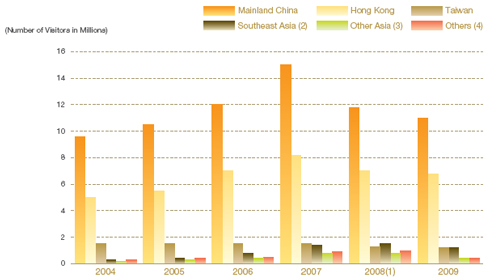
Source: DSEC Visitor Arrivals by Place of Residence.
| (1) | On February 24, 2009, the DSEC amended its methodology for the computation of visitor arrivals by excluding visitors such as imported workers and foreign students. Therefore, the number of visitor arrivals in 2008 was revised from 30.2 million to 22.9 million. The DSEC did not revise the figures published for previous years, which affects the year-on-year comparability of the data above. To allow a direct comparison of year-on-year visitor arrivals prior to 2007, the number of arrivals in 2008 would total 30.2 million. |
| (2) | Includes Philippines, Indonesia, Malaysia, Singapore, Thailand and other Southeast Asian countries. |
| (3) | Includes India, Japan, South Korea and other East and South Asian countries not already listed separately. |
| (4) | Includes the Americas, Europe, Oceania, Africa and the Middle East. |
Regional Economic Growth
In 2009, China’s GDP (in current prices) totaled US$4.9 trillion (RMB33.5 trillion) compared to US$2.3 trillion (RMB15.7 trillion) in 2004, representing a CAGR of 16.0%. In addition, regional Chinese economies surrounding Macao, such as Guangdong Province, have also exhibited substantial growth.
We believe that the continuing strong economic performance of the economies of mainland China, particularly Guangdong Province, and Hong Kong, will help support future development of tourism and gaming projects in Macao. The following table illustrates the annual growth rate of GDP for mainland China, including Guangdong Province, and Hong Kong from 2004 to 2009:
17
Sands China Ltd.
Industry Overview
| | | | | | | | | | | | | | | | | |
| | | For the year ended December 31, | |
| | | 2004 | | 2005 | | | 2006 | | | 2007 | | | 2008 | | | 2009 | |
| | | (US$ in billions, except percentages) | |
| | | | | | |
Total China GDP | | 2,337 | | 2,679 | | | 3,098 | | | 3,762 | | | 4,396 | | | 4,903 | |
Year-on-year Change, nominal | | — | | 14.6 | % | | 15.7 | % | | 21.4 | % | | 16.9 | % | | 11.5 | % |
Total Hong Kong GDP | | 167 | | 178 | | | 190 | | | 208 | | | 216 | | | 211 | |
Year-on-year Change, nominal | | — | | 7.0 | % | | 6.7 | % | | 9.5 | % | | 3.8 | % | | (2.3 | )% |
Total Guangdong Province GDP | | 276 | | 317 | | | 383 | | | 454 | | | 522 | | | 571 | |
Year-on-year Change, nominal | | — | | 15.0 | % | | 20.8 | % | | 18.6 | % | | 14.8 | % | | 9.4 | % |
China, Hong Kong and Guangdong Province GDP
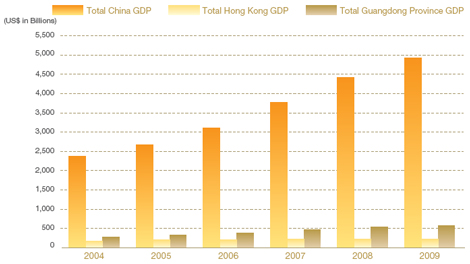
Sources: National Bureau of Statistics of China, Statistics Bureau of Guangdong Province and Hong Kong Census and Statistics Department. Converted from Hong Kong dollars and RMB at the Exchange Rate.
18
Annual Report 2009
Industry Overview
Accessibility of Macao
Visitors from southeastern China, Hong Kong, Taiwan and other locations in Asia can reach Macao relatively quickly using a variety of methods. One of the major means of transportation to Macao from Hong Kong is the ferry service, including our CotaiJetTM ferry service, which commenced operation in late 2007. Ferry service between Hong Kong and Macao operates 24 hours a day and takes approximately one hour, with departures occurring at 15- to 30-minute intervals during peak times. Visitors from more distant locations in Asia can take advantage of short travel times by air to Macao, Zhuhai, Shenzhen, Guangzhou or to Hong Kong (followed by a car, ferry or helicopter trip to Macao). Several airline carriers currently fly directly to Macau International Airport from many major cities in Asia. In 2009, several airlines announced plans for new direct routes to Macao from countries such as South Korea and Japan.
We believe that improved transportation to and within Macao will also contribute to growth in visitation and mass market gaming. According to the National Development and Reform Commission, the PRC Government has expressed support for a more open, modern and integrated transportation system within the region, as indicated in its Outline of the Plan for the Reform and Development of the Pearl River Delta (2008–2020). The PRC Government’s plan lists as transportation priorities the Hong Kong-Zhuhai- Macao Bridge, the eastern passage between Shenzhen and Hong Kong, the loop expressway of the Pearl River Delta, the Zhongshan-Shenzhen passage across the estuary of the Pearl River and a number of railways. Below is a summary of certain announced infrastructure improvement projects:
| | • | | The new Taipa Ferry Terminal, which is expected to be completed by 2012, will be the second permanent ferry terminal in Macao, together with the existing terminal on the Macao peninsula. It is expected to have sixteen 400-passenger berths, three 1,200-passenger berths and a heliport; |
| | • | | The proposed Hong Kong-Zhuhai-Macao bridge, which is expected to be completed in 2015 or 2016, will link Hong Kong’s Lantau Island to Zhuhai via Macao, and would reduce travel time by car from central Hong Kong to Macao from 4.5 hours to only 40 minutes; |
| | • | | The proposed Guangzhou-Zhuhai High Speed Railway, which is expected to be completed by 2015, will result in travel time between Guangzhou and Macao of 40 to 50 minutes; |
| | • | | The proposed Macao Light Rapid Transit, which is expected to commence construction in June 2010 and be completed in 2014, will link the ferry terminals to key locations via 12 stops on the Macao peninsula and 11 stops on Cotai and Taipa; and |
| | • | | The addition of new routes and air service between key feeder markets and the Macau International Airport, and the Zhuhai Airport. |
Macao’s Casino Gaming Industry
According to the DICJ, as of December 31, 2009, the Macao gaming market had 33 gaming facilities, 23 of which are located on the Macao peninsula. The Macao peninsula is connected to mainland China and was historically the only gaming destination in Macao. The 33 gaming facilities vary greatly in terms of size of operations and amenities offered. The majority of casinos on the Macao peninsula were constructed prior to the implementation of the concession system in 2002 and are characterized by casinos spread across multiple floors with very few non-gaming amenities. Following the opening of the Sands Macao in 2004, more facilities on the Macao peninsula have begun to introduce more modern casinos and non-gaming amenities, in an attempt to broaden the appeal of Macao to a wider audience. Cotai is an area of new gaming development in Macao and features large-scale, integrated resorts. These facilities tend to have more significant non-gaming and leisure areas than many of those on the Macao peninsula.
19
Sands China Ltd.
Industry Overview
The table below shows the year-on-year change in the number of casinos, gaming tables and slot machines in Macao for the periods indicated:
| | | | | | | | | | | | | | | | | |
| | | As of December 31, | |
| | | 2004 | | 2005 | | | 2006 | | | 2007 | | | 2008 | | | 2009 | |
| | | | | | |
Casinos | | 15 | | 17 | | | 24 | | | 28 | | | 31 | | | 33 | |
Year-on-year Change | | — | | 13.3 | % | | 41.2 | % | | 16.7 | % | | 10.7 | % | | 6.5 | % |
Gaming Tables | | 1,092 | | 1,388 | | | 2,762 | | | 4,375 | | | 4,017 | | | 4,770 | |
Year-on-year Change | | — | | 27.1 | % | | 99.0 | % | | 58.4 | % | | (8.2 | )% | | 18.7 | % |
Slot Machines | | 2,254 | | 3,421 | | | 6,546 | | | 13,267 | | | 11,856 | | | 14,363 | |
Year-on-year Change | | — | | 51.8 | % | | 91.3 | % | | 102.7 | % | | (10.6 | )% | | 21.1 | % |
Number of Casinos, Gaming Tables and Slot Machines in Macao
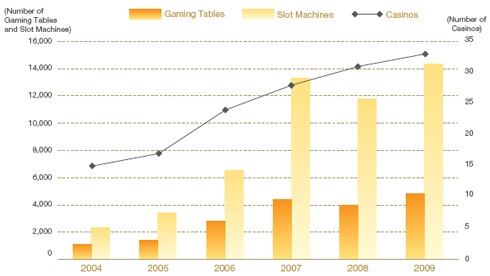
Source: DICJ.
20
Annual Report 2009
Industry Overview
Following the liberalization of Macao’s gaming industry, total gaming revenue in Macao increased from approximately US$5.4 billion in 2004 to approximately US$15.0 billion in 2009, a CAGR of 22.6%. These revenues are generated primarily by casino gaming, consisting of table games and slot machines, and to a lesser extent, by non-casino gaming activities, including greyhound racing, horse racing, sports lotteries and instant lotteries. The following table sets forth gaming revenues in Macao for 2004–2009:
| | | | | | | | | | | | | | | | | |
| | | For the year ended December 31, | |
| | | 2004 | | 2005 | | | 2006 | | | 2007 | | | 2008 | | | 2009 | |
| | | (US$ in millions, except percentages) | |
| | | | | | |
Casino Gaming Revenue | | 5,172 | | 5,756 | | | 7,078 | | | 10,378 | | | 13,597 | | | 14,921 | |
Year-on-year Change | | — | | 11.3 | % | | 23.0 | % | | 46.6 | % | | 31.0 | % | | 9.7 | % |
Non-casino Gaming Revenue | | 267 | | 136 | | | 112 | | | 103 | | | 132 | | | 127 | |
Year-on-year Change | | — | | (49.0 | )% | | (17.4 | )% | | (8.1 | )% | | 27.8 | % | | (3.8 | )% |
Total Gaming Revenue | | 5,439 | | 5,892 | | | 7,190 | | | 10,481 | | | 13,728 | | | 15,048 | |
Year-on-year Change | | — | | 8.3 | % | | 22.0 | % | | 45.8 | % | | 31.0 | % | | 9.6 | % |
Source: DICJ. Converted from MOP at the Exchange Rate.
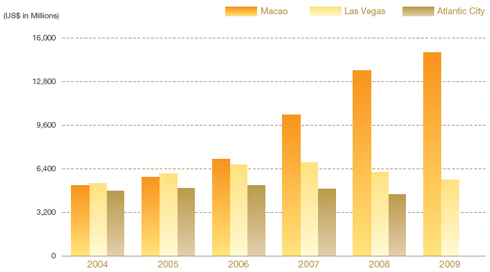
In 2006, casino gaming revenue in Macao surpassed that of Las Vegas, making Macao the largest gaming market in the world as measured by casino gaming revenue. In 2009, Macao’s casino gaming revenue was more than twice as large as that of Las Vegas. The following table shows the casino revenue of Macao compared to that of Las Vegas and Atlantic City from 2004 to 2009:
| | | | | | | | | | | | | | | |
| | | For the year ended December 31, | |
| | | 2004 | | 2005 | | 2006 | | 2007 | | 2008 | | 2009 | | CAGR
2004–2009 | |
| | | (US$ in millions, except percentages) | |
| | | | | | | |
Macao | | 5,172 | | 5,756 | | 7,078 | | 10,378 | | 13,597 | | 14,921 | | 23.6 | % |
Las Vegas | | 5,334 | | 6,034 | | 6,688 | | 6,828 | | 6,126 | | 5,550 | | 0.8 | % |
Atlantic City | | 4,738 | | 4,957 | | 5,167 | | 4,889 | | 4,500 | | N/ANote | | — | |
Sources: DICJ, Nevada Gaming Control Board and New Jersey Casino Control Commission. Macao gaming revenue converted from MOP at the Exchange Rate.
Note: 2009 figures for Atlantic City only available for the nine months ended September 30, 2009: US$3,026 million.
21
Sands China Ltd.
Industry Overview
Casino Revenues
Mass Market, Premium Players and VIP
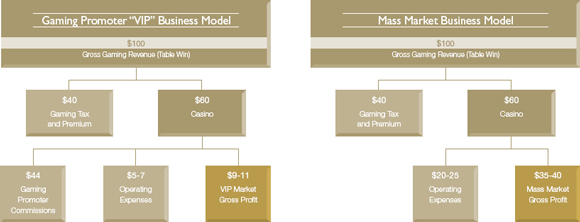
The Macao gaming market consists of three segments: mass market, VIP and premium players. Historically, gaming operators in Macao focused on VIP players; however, gaming operations have now begun to focus on the fast-growing and more profitable mass market and premium segment:
| | • | | Mass Market Players.The mass market segment consists of both table games and slot machines played on public mass gaming floors for lower stakes. The mass market segment is generally viewed as a higher-margin component of the overall gaming market compared with the VIP segment due to the commission costs of operating the VIP segment. Mass market gaming revenues have grown significantly since the introduction in 2004 of casino properties that cater to the mass market. According to the DICJ, from 2004 to December 31, 2009, mass market table and slot operations have grown at a CAGR of 24.7% and 59.0%, respectively. Mass market table and slot operations accounted for approximately 27.7% and 5.4%, respectively, of total casino gaming revenue in Macao for the year ended December 31, 2009. |
| | • | | Premium Players.Premium players are players brought in through the direct marketing efforts of the gaming operators. They select VIP rooms based on their relationship with or preference for a particular gaming operator. As such, premium players have potentially higher margins compared to VIP players. Like VIP players, premium players typically receive various forms of complimentary services from gaming operators. |
22
Annual Report 2009
Industry Overview
| | • | | VIP Players.VIP players in Macao are typically wealthy individuals who play mostly in dedicated VIP rooms or designated gaming areas. VIP players are sourced by Gaming Promoters. Many VIP players in Macao rely on Gaming Promoters to make travel and other arrangements for them to play at a particular casino or gaming area, provide concierge services and arrange their purchases of chips. Gaming Promoters also often extend credit to VIP players that they source and bring to the casinos or gaming areas. In accordance with general industry practice, Gaming Promoters typically commit to certain casino-specified minimum rolling chip purchases per VIP room per month. In return for their services, the gaming operator typically pays a commission to the Gaming Promoter based on either gaming wins or losses or the rolling chip volume of the VIP players they direct to the casinos or gaming areas. The obligation to pay commissions to Gaming Promoters means that although this segment accounts for a large proportion of total gaming revenues, margins are lower than those of the mass market segment. VIP players typically receive various forms of complimentary services, including transportation, accommodation and food and beverage services from the Gaming Promoters or casinos. These complimentary services also affect the margins associated with the rolling chip segment of the business. |
The following table shows Macao casino gaming revenue from 2004 to 2009:
| | | | | | | | | | | | | | | | | |
| | | For the year ended December 31, | |
| | | 2004 | | 2005 | | | 2006 | | | 2007 | | | 2008 | | | 2009 | |
| | | (US$ in millions, except percentages) | |
| | | | | | |
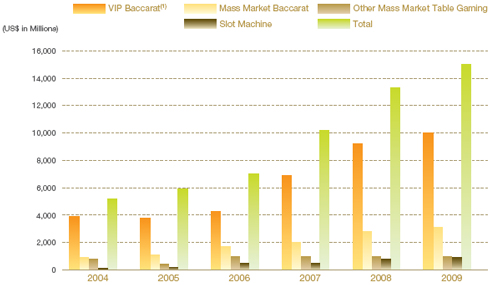
VIP Baccarat(1) | | 3,723 | | 3,608 | | | 4,598 | | | 6,970 | | | 9,222 | | | 9,979 | |
Year-on-year Change | | — | | (3.1 | )% | | 27.4 | % | | 51.6 | % | | 32.3 | % | | 8.2 | % |
Mass Market Baccarat | | 748 | | 1,306 | | | 1,489 | | | 2,064 | | | 2,658 | | | 3,187 | |
Year-on-year Change | | — | | 74.7 | % | | 14.0 | % | | 38.7 | % | | 28.8 | % | | 19.9 | % |
Other Mass Market Table Gaming | | 622 | | 686 | | | 735 | | | 894 | | | 1,010 | | | 942 | |
Year-on-year Change | | — | | 10.3 | % | | 7.1 | % | | 21.7 | % | | 13.0 | % | | (6.7 | )% |
Slot Machine | | 80 | | 156 | | | 257 | | | 449 | | | 707 | | | 813 | |
Year-on-year Change | | — | | 95.3 | % | | 64.2 | % | | 75.1 | % | | 57.3 | % | | 15.0 | % |
| | | | | | | | | | | | | | | | | |
| | | | | | |
Total | | 5,172 | | 5,756 | | | 7,078 | | | 10,378 | | | 13,597 | | | 14,921 | |
| | | | | | | | | | | | | | | | | |
| | | | | | |
Year-on-year Change | | — | | 11.3 | % | | 23.0 | % | | 46.6 | % | | 31.0 | % | | 9.7 | % |
Source: DICJ. Macao gaming revenue converted from MOP at the Exchange Rate.
| (1) | Includes revenue from both VIP and premium players. |
23
Sands China Ltd.
Industry Overview
Macao Casino Gaming Revenue by Segment
Macao’s Hotel, Convention and Retail Industries
Prior to the liberalization of the Macao gaming industry, many of the casino properties were gaming-centric facilities that contained a relatively limited offering of non-gaming amenities. Conversely, recent developments have consisted of larger properties that offer a variety of non-gaming services such as high quality hotel room options, retail and dining areas, MICE space and entertainment amenities in addition to traditional gaming areas. According to statistics reported by the DSEC, visitor spending on non-gaming services accounted for 23.8% and 20.6% of total visitor spending on services in Macao for 2008 and 2009, respectively. We expect that, over time, non-gaming services will represent a larger percentage of total visitor spending in Macao, similar to the trend in Las Vegas.
The Macao Hotel and Convention Market
According to the Macao Statistics and Census Service, there were 59 hotels, containing approximately 18,647 rooms, in operation in Macao as of December 31, 2009. This represented an increase from 39 hotels, containing approximately 8,608 rooms in operation as of December 31, 2004. We believe that the introduction of additional high quality hotels, in combination with MICE space, will continue to enhance Macao’s reputation as a world-class tourist and business destination, contribute to an increase in the average length of stay and further broaden the customer base.
24
Annual Report 2009
Industry Overview
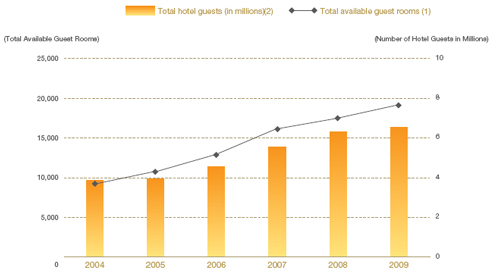
Following the opening of The Venetian Macao, Macao’s first integrated resort, and other new developments, overnight hotel visitation increased from 23.7% of total visitation in 2004 to 30.9% at the end of 2009, with an average length of stay of 1.5 nights in 2009. The following table shows total available guest rooms, total hotel guests, average length of stay, occupancy and Average Daily Rate statistics for the Macao hotel market from 2004 to 2009:
| | | | | | | | | | | | | | | | | | |
| | | For the year ended December 31, | |
| | | 2004 | | | 2005 | | | 2006 | | | 2007 | | | 2008 | | | 2009 | |
| | | | | | |
Total available guest rooms(1) | | 9,168 | | | 10,872 | | | 12,978 | | | 16,148 | | | 17,490 | | | 19,216 | |
Total hotel guests (in millions)(2) | | 4.0 | | | 4.1 | | | 4.7 | | | 5.7 | | | 6.5 | | | 6.7 | |
Average length of stay (nights) | | 1.2 | | | 1.2 | | | 1.2 | | | 1.3 | | | 1.4 | | | 1.5 | |
Occupancy (%) | | 75.6 | % | | 70.9 | % | | 72.3 | % | | 77.2 | % | | 74.5 | % | | 71.6 | % |
ADR (US$)(3) | | — | | | 78 | | | 85 | | | 98 | | | 104 | | | 122 | |
Macao Hotel Market Statistics
Source: DSEC and Macao Government Tourist Office. Converted from MOP at the Exchange Rate.
| (1) | Total available rooms as of year end. Includes both hotel rooms and guest houses. |
| (2) | Includes guests that stay in hotel rooms and guest houses. |
| (3) | Based on three-, four- and five-star hotels in Macao. |
25
Sands China Ltd.
Industry Overview
We believe the average length of stay in Macao will continue to rise and Macao will ultimately develop into a hotel market similar to Las Vegas. According to the “2009 Las Vegas Visitor Profiles Study” published by the Las Vegas Convention and Visitors Authority, visitors in 2009 stayed on average 3.6 nights in Las Vegas. Convention facilities in Macao are still limited in size as compared to the regional convention markets. The largest convention facility in Macao is located at The Venetian Macao, which opened in August 2007 and contains 1.2 million square feet of meeting, convention and exhibition space. According to the Macao Government Tourist Office, meeting and convention attendance in Macao has grown at a CAGR of 81.6% from 2004 to 2009.
Despite a global downturn in MICE business, Macao experienced growth in this sector in 2009. According to the DSEC, a total of 1,485 MICE events were held at various venues in Macao in 2009, comprising 1,405 meetings/conferences and 80 exhibitions. These events were attended by 660,881 participants, and the average length of stay by visitors attending these events was 2.0 days. Other venues in Macao often host a larger number of public and non-trade events. Sands China, meanwhile, is the preferred host for commercial groups. The following table shows the number of MICE events and participants in Macao from 2004 to 2009:
| | | | | | | | | | | | | | | | | |
| | | For the year ended December 31, | |
| | | 2004 | | 2005 | | | 2006 | | | 2007 | | | 2008 | | | 2009 | |
| | | | | | |
Total Number of MICE Events | | 278 | | 305 | | | 360 | | | 1,177 | | | 1,240 | | | 1,485 | |
Year-on-year Change | | — | | 9.7 | % | | 18.0 | % | | 227.0 | % | | 5.4 | % | | 19.8 | % |
Total MICE Participants | | 33,501 | | 43,531 | | | 57,089 | | | 301,979 | | | 364,320 | | | 660,881 | |
Year-on-year Change | | — | | 29.9 | % | | 31.1 | % | | 429.0 | % | | 20.6 | % | | 81.4 | % |
Macao MICE Events and Participants
Source: DSEC.
26
Annual Report 2009
Industry Overview
According to the National Development and Reform Commission’s Outline of the Plan for the Reform and Development of the Pearl River Delta, the region will seek to grow its convention and exhibition industries through the creation and global marketing of specialized conventions and exhibitions, and through increased cooperation between Macao, Hong Kong and the Pearl River Delta. We expect future developments to create a critical mass of high quality accommodations and other amenities, which we believe will enable Macao to develop into a leading MICE destination.
Retail Market
The retail market in Macao is growing and becoming an increasingly important part of the Macao economy. Retailers benefit from Macao’s luxury goods tax-exemption (like Hong Kong but unlike mainland China), making Macao a relatively attractive and inexpensive place to shop for mainland Chinese visitors. Existing large-scale retail areas total approximately 2,043,000 gross square feet and include:
| | | | | | | |
Opened | | Retail Area | | Property | | Square Footage(1) | |
| | | |
| 2007 | | The Grand Canal Shoppes | | The Venetian Macao | | 1,000,000 | |
| 2008 | | The Shoppes at Four Seasons | | The Plaza Macao | | 211,000 | |
| 2009 | | The Boulevard | | City of Dreams | | 175,000 | (2) |
| 2009 | | New Yaohan | | New Yaohan | | 257,000 | |
| 2009 | | One Central | | One Central, Macao | | 400,000 | |
Macao Large Scale Retail Areas
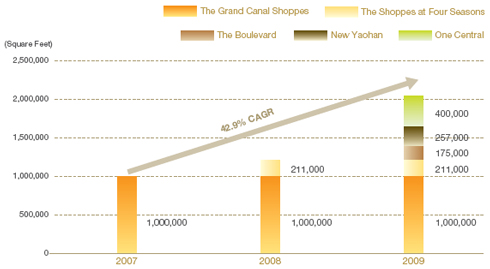
| (1) | Square footage for The Grand Canal Shoppes and The Shoppes at Four Seasons represent net square footage. Square footage for The Boulevard, One Central, and New Yaohan represent gross square footage. |
| (2) | Includes both phases. Currently, only Phase I (85,000 square feet) is open. Phase II (90,000 square feet) is expected to open in the future. |
27
Sands China Ltd.
Industry Overview
Based on our management’s experience, we believe that the build-out of integrated resorts on Cotai will drive retail spending in a manner similar to that experienced in Las Vegas following the opening of integrated resorts and related retail facilities such as The Grand Canal Shoppes at The Venetian in Las Vegas. The following table illustrates the growth in total shopping spending by visitors to Macao from 2004 to 2009:
| | | | | | | | | | | | |
| | | For the year ended December 31, |
| | | 2004 | | 2005 | | 2006 | | 2007 | | 2008 | | 2009 |
| | | (US$ in millions, except percentages) |
| | | | | | |
Total shopping spending(1) | | 1,409 | | 1,457 | | 1,906 | | 2,224 | | 2,638 | | 1,760 |
Source: DSEC Visitor Expenditure Survey. Converted from MOP at the Exchange Rate.
| (1) | Shopping spending as calculated by the DSEC consists of spending for clothing, jewelry, local food products, cosmetics, electrical equipment, shoes, handbags, wallets and others. |
Competition
The gaming operators in Macao currently consist of the six Concessionaires or Subconcessionaires. As of December 31, 2009:
| | • | | VML, our subsidiary, operated three gaming facilities: The Venetian Macao, the Sands Macao and the Plaza Casino at The Plaza Macao; |
| | • | | Galaxy operated five gaming facilities in Macao, including StarWorld Hotel, and is developing the Galaxy Mega Resort, which is adjacent to The Venetian Macao; |
| | • | | Melco Crown operated three gaming facilities, including the Altira and City of Dreams, a property located opposite to The Venetian Macao; |
| | • | | MGM Grand Paradise Limited operated one gaming facility, the MGM Grand Macau; |
| | • | | SJM operated 20 gaming facilities in Macao, including the Lisboa and the Grand Lisboa; and |
| | • | | Wynn Macau operated one gaming facility, the Wynn Macau. |
28
Annual Report 2009
Industry Overview
In addition, some of these gaming operators have planned or are currently developing projects that will increase future casino supply and intensify competition. The Macao market also faces competition from casinos located in other areas of Asia and from other major gaming centers worldwide. The relative scale of our properties and gaming operations and those of the other operators is shown in the table below:
| | | | | | | | | | | | | | | | | | |
| | | Number of Casinos
As of December 31, | | Gaming Tables(1)
As of December 31, | | Slot Machines(2)
As of December 31, |
Operator | | 2007 | | 2008 | | 2009 | | 2007 | | 2008 | | 2009 | | 2007 | | 2008 | | 2009 |
| | | | | | | | | |
VML | | 2 | | 3 | | 3 | | 1,450 | | 1,202 | | 1,128 | | 5,134 | | 4,260 | | 4,251 |
Other | | 26 | | 28 | | 30 | | 2,925 | | 2,815 | | 3,642 | | 8,133 | | 7,596 | | 10,112 |
| | | | | | | | | | | | | | | | | | |
| | | | | | | | | |
Total | | 28 | | 31 | | 33 | | 4,375 | | 4,017 | | 4,770 | | 13,267 | | 11,856 | | 14,363 |
| | | | | | | | | | | | | | | | | | |
Source: DICJ.
| (1) | Includes VIP rooms and mass market gaming tables. |
| (2) | As of December 31, 2007, 2008 and 2009, VML had 4,237, 3,445 and 3,491 slot machines, respectively, which were active on the floor. |
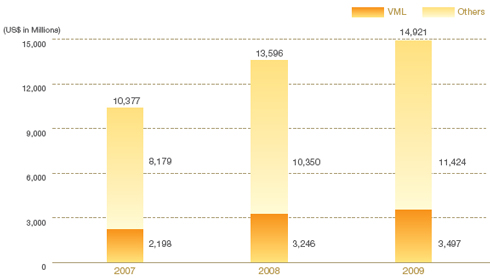
Based on publicly available data shown in the following table, we estimate that our three existing Macao properties enjoyed approximately 23.9% and 23.4% of the share of Macao gaming revenue for the years ended December 31, 2008 and 2009, respectively. This market share exceeded that of several of our competitors in Macao.
| | | | | | | | | | | | | | | |
| | | For the year ended December 31, | |
| | | 2007 | | | 2008 | | | 2009 | |
Company | | Gaming
Revenue | | % | | | Gaming
Revenue | | % | | | Gaming
Revenue | | % | |
| | | (US$ in millions, except percentages) | |
| | | | | | |
VML | | 2,198 | | 21.2 | % | | 3,246 | | 23.9 | % | | 3,497 | | 23.4 | % |
Others | | 8,179 | | 78.8 | % | | 10,350 | | 76.1 | % | | 11,424 | | 76.6 | % |
| | | | | | | | | | | | | | | |
| | | | | | |
Total | | 10,377 | | 100.0 | % | | 13,596 | | 100.0 | % | | 14,921 | | 100.0 | % |
| | | | | | | | | | | | | | | |
29
Sands China Ltd.
Industry Overview
Macao Gaming Revenues
Source: DICJ.
This industry overview is for your general information and is included in this annual report solely to update certain related information disclosed in our Prospectus. We may determine not to update general information relating to our industry in future years.
30
Annual Report 2009
Business Overview
We are the leading developer, owner and operator of integrated resorts and casinos in Macao as measured by adjusted EBITDAR for the years ended December 31, 2008 and 2009. We are the largest operator of integrated resorts in Macao, which contain not only gaming areas but also meeting space, convention and exhibition halls, retail and dining areas and entertainment venues. We believe that our integrated resorts are unique to Macao and differentiate us from our competitors. VML, our subsidiary, holds one of six concessions or subconcessions permitted by the Macao Government to operate casinos or gaming areas in Macao. Macao is the largest gaming market in the world as measured by casino gaming revenue and is the only location in China offering legalized casino gaming.
We own The Venetian Macao, the Sands Macao and The Plaza Macao. We also own CotaiExpo, one of the largest convention and exhibition halls in Asia; Macao’s largest entertainment venue, the CotaiArena; and one of three major high speed ferry companies operating between Hong Kong and Macao. Our luxury and mid-market retail malls feature over 380 shops with well-known retail brands such as Calvin Klein, Cartier, Chanel, Esprit, Gucci, Hermès, Louis Vuitton, Nike and Prada, as well as the MALO CLINIC Spa, one of Asia’s largest medical and beauty spas. As of December 31, 2009, our properties featured 3,554 suites and hotel rooms, 19 Paiza Mansions, 1,128 table games, 3,491 slot machines, over 60 different restaurants and food outlets, as well as other integrated resort amenities.
Our business strategy is to develop Cotai and to leverage our integrated resort business model to create Asia’s premier gaming, leisure and convention destination. Our ultimate plans for Cotai include five interconnected integrated resorts, which leverage a wide range of branded hotel and resort offerings to attract different segments of the market. When completed, we expect our Cotai Strip development to contain over 20,000 hotel rooms, over 1.6 million square feet of MICE space, and over 2.0 million square feet of retail malls, theaters and other amenities. We believe our business strategy and development plan will allow us to achieve more consistent demand, longer average length of stay in our hotels and higher margins than more gaming-centric facilities.
In May 2004, we opened the Sands Macao to target the mass market segment. The Sands Macao was the first Las Vegas-style casino in Macao, and currently contains a mix of gaming areas for mass market, VIP and premium players, and entertainment and dining facilities. In August 2007 we opened Macao’s largest integrated resort, The Venetian Macao, and in August 2008 we opened The Plaza Macao, a boutique luxury integrated resort featuring a Four Seasons Hotel, The Shoppes at Four Seasons and the Plaza Casino. In July 2009, we completed and introduced our ultra-exclusive Paiza Mansions at The Plaza Macao. These Mansions are individually designed and are made available by invitation only.
Key Strengths
We believe that we have a number of key strengths that differentiate our business from that of our competitors, including:
| | • | | Diversified, high quality integrated resort offerings with substantial non-gaming amenities; |
| | • | | Substantial cash flow from existing operations and a significant development pipeline; |
| | • | | Established brands with broad regional and international market awareness and appeal; |
| | • | | An experienced management team with a proven track record; and |
| | • | | Significant benefits from our on-going relationship with LVS. |
31
Sands China Ltd.
Business Overview
Business Strategies
Building on our key strengths, we seek to enhance our position as the leading developer and operator of integrated resorts and casinos in Macao by continuing to implement the following business strategies:
| | • | | Developing and diversifying our integrated resort offerings in Cotai to include a full complement of products and services to cater to different market segments.Our ultimate plans for Cotai include five integrated resorts, MICE space, additional retail, dining and entertainment facilities and a range of hotel offerings to cater to different segments of the market. We plan to diversify our existing base of five-star hotel rooms on Cotai with four- and three-star hotel rooms. After completion of our remaining integrated resorts in Cotai, we expect to have, among others, Sheraton, Shangri-La and Traders branded hotel rooms. We intend to leverage the recognition and the sales, marketing and reservation capabilities of these premier hotel brands to attract a new segment of customers to our properties. We believe our partnership with renowned hotel management partners, our diverse integrated resort offerings and the convenience and accessibility of our properties will further increase the appeal of our properties to both the business and leisure customer segments. |
| | • | | Leverage our scale of operations to create and maintain an absolute cost advantage.Management expects to benefit from lower unit costs due to the economies of scale inherent in its operations. Opportunities for lower unit costs include, but are not limited to lower utility costs; more efficient staffing of hotel and gaming operations; and centralized laundry, transportation, marketing and sales, and procurement. In addition, our scale allows us to consolidate certain back office functions and, where appropriate, to relocate these functions to Zhuhai, China. Zhuhai labor rates are approximately one third of those in Macao. |
| | • | | Focus on the high-margin mass market gamingsegment, while continuing to provide luxury amenities and high service levels to our VIP and premium players.Our properties cater not only to VIP and premium players but also to mass market customers, which comprise our most profitable gaming segment. We believe that the mass market segment will continue to be a fast-growing segment as a result of the introduction of more high-quality gaming facilities and non-gaming amenities into the market. As of December 31, 2009, our properties contained approximately 849,000 square feet of gaming space, consisting of 3,491 slot machines and 1,128 table games, 761 tables of which were dedicated to mass market play. Our management estimates that our mass market table revenues typically generate a gross margin that is approximately four times higher than that of our typical VIP player table revenues. Additionally, because mass market players do not receive extensive complimentary services, including provision of hotel rooms, meals or other products or services, they contribute significantly to our non-gaming revenues. At the same time, we are focused on growing our share of the premium players segment via direct marketing efforts and by leveraging our Paiza brand and luxury amenities that enable us to differentiate our properties from those of our competitors, who typically rely more on Gaming Promoters for their VIP players. To attract premium players, we offer them accommodations in our exclusive Paiza suites and Paiza Mansions, complete with private gaming and concierge services. Our management estimates that our premium player table revenues generate a gross margin that is approximately 1.0 to 1.5 times higher than our typical VIP player table revenues. |
32
Annual Report 2009
Business Overview
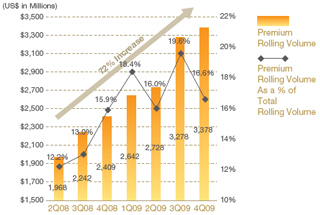
Strategy to Grow Premium (Direct) Rolling Volume
| | | | |
Increasing Premium Direct Rolling Volume | | | | Luxury Paiza Facilities Catering to VIPs |
| | • | | 64 Paiza suites and 19 Paiza Mansions offered exclusively to VIP and premium players |
| | • | | Private gaming and concierge services complete the ultra-exclusive luxury experience |
| | | | 
|
Our higher margin premium rolling play has grown 72% over the last 6 quarters
Comparison of VIP to Mass Market
Mass Market Gross Margin approximately 4x Higher than VIP
33
Sands China Ltd.
Business Overview
| | • | | Monetize our non-core assets to reduce netinvestment through the sale of retail malls and the sale or co-operativization of luxury apart-hotels.Our integrated resorts include retail facilities and apart-hotels. These assets can be sold to increase our financial flexibility and improve our returns on invested capital. The sale of these assets does not diminish the ability of the retail facilities and apart-hotels to attract traffic to our properties. Below is a description of our retail malls and the apart-hotel tower as well as the potential methodologies to monetize the apart-hotel: |
Retail Malls:
We have existing retail malls at The Venetian Macao (The Grand Canal Shoppes) and The Plaza Macao (The Shoppes at Four Seasons) and additional malls planned at our other Cotai Strip projects. We plan to sell these retail malls when we believe market conditions support appropriate and optimized valuations. In connection with any future negotiation with respect to the sale of the retail malls, we will endeavor to maintain operational influence in the form of product positioning and certain consent and approval rights through binding agreements that would be entered into with any purchaser of the retail malls, which could include approval of the classes and types of stores permitted in the retail mall. In addition, as part of our negotiations with the potential buyers, we will endeavor to require the buyer to commit to operating the retail malls in accordance with the “Venetian” theme or another applicable up-scale or high-end theme, and at a level of quality and service which would continue to complement our adjoining properties.
Apart-Hotel:
We have substantially completed the construction of an apart-hotel tower, which is anticipated to be branded and serviced by Four Seasons, and we expect to complete the fit-out by the fourth quarter of 2010. We plan to monetize this apart-hotel tower through the sale of exclusive rights to use individual apart-hotel units under a cooperative scheme subject to fulfilling all legal requirements. However, we will continue to consider and review all options available to monetize this asset.
Other Operations
As part of our goal of driving visitation to Cotai and improving the customer experience in Macao, we have made targeted investments to help develop Macao’s transportation infrastructure. Our transportation operations consist of our high-speed CotaiJet ferry service between Hong Kong and Macao, airplane service available for VIP and premium players, CotaiShuttle bus service, CotaiLimo™ service and a travel agency.
CotaiJet Ferry Services
In November 2007, we launched our high-speed CotaiJet ferry service between Macau Ferry Terminal in Hong Kong and Taipa Temporary Ferry Terminal near our Cotai Strip development. In 2009, our CotaiJet ferry services provided an average of approximately 40 daily round trip sailings. With our 14 ferries, we have the ability to run ferries on 15-minute intervals as needed to meet demand. We transferred approximately 9,700 passengers per day for the year ended December 31, 2008 and approximately 13,400 passengers per day for the year ended December 31, 2009, a year-on-year increase of 38%.
The CotaiJet service is fully managed and operated on our behalf by Cotai Chu Kong Shipping Management Services Co., Ltd. of Hong Kong, using catamarans owned by our wholly-owned indirect subsidiaries. Each custom-built catamaran has the capacity to carry more than 400 passengers and operates at top speeds of approximately 42 knots.
We operate our passenger ferry service pursuant to a 10-year license granted to us by the Macao Government on January 14, 2010, replacing the Ferry Agreement in place between the Macao Government and Cotai Ferry Company Limited (“CFCL”) prior to that date.
34
Annual Report 2009
Business Overview
Airplanes
Through a Shared Services Agreement with LVS, we have access to a fleet of 14 corporate configured airplanes, three of which are currently stationed full-time in Asia. All airplanes are owned by various entities controlled by our Controlling Shareholder and are operated by Sands Aviation LLC, an affiliate of our Company. We can deploy these airplanes to bring VIP and premium players from around the globe to our properties in Macao.
CotaiShuttle Bus Service
We operate a fleet of 102 (79 owned, 23 rented) complimentary shuttle buses that transport passengers between our properties and from the New Macau Maritime Ferry Terminal, the Taipa Temporary Ferry Terminal (“TTFT”) and the Macau International Airport to our properties every five to ten minutes during peak periods. These shuttle buses are also supported by an additional 30 coaches to serve increased demand. The CotaiShuttle also runs to and from two border checkpoints with mainland China, the Gongbei Border Gate and the Lotus Bridge, transporting visitors directly to and between our properties every five to eight minutes during peak periods. Certain bus service routes, such as those from the New Macau Maritime Ferry Terminal and TTFT, and between our properties, run 24 hours per day and help us direct visitors to our properties. Based on our operational data, our management estimates that over 10.0 million passengers arrived at The Venetian Macao, the Sands Macao and The Plaza Macao on our complimentary shuttle bus service in the year ended December 31, 2009. In addition, a free shuttle bus service operates between our Cotai properties and the City of Dreams to enhance the overall Cotai experience. All of these routes maintain a regular schedule, although exact operating hours are dependent on the specific route. Most routes operate for at least 16 hours every day.
CotaiLimo
Our CotaiLimo service fleet consists of 79 limousines. It operates 24 hours per day and includes three signature vehicles, a Maybach 62, a Bentley Arnage and a Rolls Royce Phantom EWB, which are provided on an exclusive basis to our VIP and premium players. Fleet deployment is managed through a centralized dispatch office for all pre-booked services, while additional vehicles are on standby at various locations to provide “on demand” services.
CotaiTicketing
Our CotaiTicketing operations were established in 2007 and provide all ticketing requirements for events and services at The Venetian Macao and the Sands Macao. CotaiTicketing currently sells tickets for the CotaiArena™, ‘ZAIA’ byCirque du Soleil, Sands Theater events, Venetian Ballroom events, Venetian pool parties, Gondola rides and the CotaiJet ferry. Our CotaiTicketing operations consist of eight box office locations across The Venetian Macao, one box office at the Sands Macao, and a call center based in Macao with three language options and both a Macao and Hong Kong direct phone number. We also sell tickets online 24 hours per day at our website, www.CotaiTicketing.com, which is available in numerous language options.
Travel Agencies
We have our own travel agency, CotaiTravel. We have also developed partnerships with a large number of tour and travel companies throughout Asia. These agencies assist with reservations and booking for travel to Macao and for various shows and other activities and entertainment amenities at our properties in Cotai.
35
Sands China Ltd.
Our Properties
Our operations consist of The Venetian Macao, the Sands Macao, The Plaza Macao and the other operations that support these properties, including our high-speed CotaiJet ferry service operating between Hong Kong and Macao. The following table sets forth data on our existing operations as of December 31, 2009:
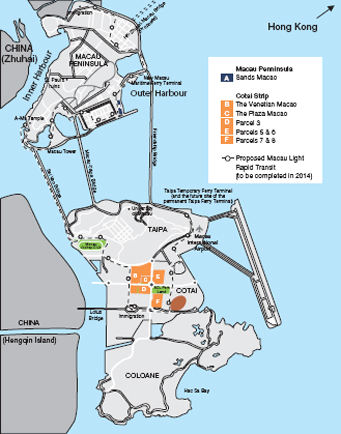
| | | | | | | | |
| | | The Venetian Macao | | Sands Macao | | The Plaza Macao | | Total |
| | | | |
Opening date | | August 2007 | | May 2004 | | August 2008 | | — |
Hotel rooms | | 2,841 | | 289 | | 360 | | 3,490 |
Paiza suites | | 64 | | — | | — | | 64 |
Paiza Mansions | | — | | — | | 19 | | 19 |
MICE (square feet) | | 1,200,000 | | — | | 25,000 | | 1,225,000 |
Theater/arena | | 1,800-seat theater | | 650-seat theater | | — | | — |
| | 15,000-seat arena | | — | | — | | — |
Total retail (square feet) | | 1,000,000 | | — | | 211,000 | | 1,211,000 |
Number of shops | | 309 | | — | | 84 | | 393 |
Number of restaurants and food outlets | | 59 | | 6 | | 3 | | 68 |
Total gaming facility (square feet) | | 550,000 | | 229,000 | | 70,000 | | 849,000 |
Gaming units: | | | | | | | | |
Tables | | 599 | | 413 | | 116 | | 1,128 |
Slots | | 2,153 | | 1,172 | | 166 | | 3,491 |
36
Annual Report 2009
Our Properties
The Venetian Macao
In August 2007, we opened The Venetian Macao, the anchor property of our Cotai Strip development, located approximately three kilometers from the TTFT on Macao’s Taipa Island. As of December 31, 2009, The Venetian Macao included approximately 550,000 square feet of casino and gaming areas spread across exclusive VIP rooms and an expansive mass market gaming floor. As of December 31, 2009, The Venetian Macao featured 599 table games and 2,153 slot machines. The mass market gaming floor is divided into four uniquely designed areas: Red Dragon, Golden Fish, Phoenix and Imperial House. The Venetian Macao, with a theme similar to that of The Venetian Las Vegas, features replicas of many famous sites in Venice, Italy, including St. Mark’s Square, the Campanile Tower and Doge’s Palace. During the year ended December 31, 2009, The Venetian Macao had a total of approximately 23.8 million visits.
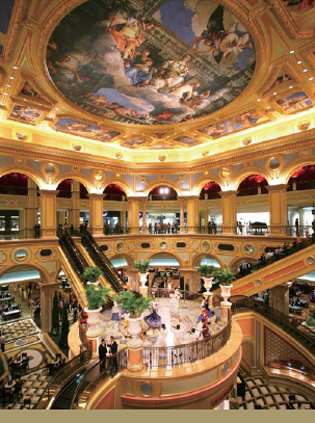
In addition to gaming facilities, The Venetian Macao features a 39-floor five-star hotel tower with over 2,900 suites. Standard suites consist of a raised sleeping area and bathroom as well as a sunken living/working area. We believe that these designs are responsive to the needs of regional leisure and business travelers as well as players, and help attract more multi-night leisure or business visitors to Macao, as typically seen in Las Vegas. The Venetian Macao also offers 64 Paiza suites that range from 2,300 to 8,000 square feet. Each Paiza suite in The Venetian Macao offers a living room, a dining room, at least two bedrooms and private concierge service. Some larger suites include private massage room, gym, pool, and media/karaoke room.
The Venetian Macao also provides a broad selection of entertainment options and amenities, which cater to mass market customers, including families, and also targets VIP and premium players with special products and services, such as the Paiza Club. The Venetian Macao has approximately 1.0 million square feet of retail and dining areas at The Grand Canal Shoppes, consisting of 309 stores and over 50 world-class restaurants, including a food court. Visitors and guests can access The Grand Canal Shoppes at The Venetian Macao from several different locations, including the main road through Cotai, The Venetian Macao Hotel and The Venetian Macao gaming floor. Offerings include a wide variety of shops, ranging from well-known international brands such as Agnès b, Calvin Klein, Coach, Diesel, and Emporio, to mid-level retail offerings such as Esprit, Mango, Nike, United Colors of Benetton and Zara. The mall has an extensive selection of high-end jewelry and watch retailers such as Charriol, Franck Muller, Mikimoto, Piaget and Tiffany & Co. The mall also features The Manchester United Experience store, Manchester United Football Club’s first licensed merchandising outlet in Asia, selling team footballs, clothing, accessories and other memorabilia. The second floor of the store includes interactive sporting displays with 360-degree, high-definition screens installed, allowing customers to experience football skills training and virtual tours of the Manchester United Football Club, including Old Trafford Stadium. The restaurants and stores are set along streetscapes reminiscent of historical streetscapes in Venice.
37
Sands China Ltd.
Our Properties
The common areas within the retail space include St. Mark’s Square and three indoor canals with gondola rides, similar to The Grand Canal Shoppes at The Venetian Las Vegas. The Venetian Macao also contains Asia’s first MALO CLINIC Spa, an 85,000-square foot facility owned and managed by the Lisbon-based MALO CLINIC Health Group, which opened in July 2009 and offers spa treatments and is expected to offer comprehensive medical treatments.
In addition, The Venetian Macao features a convention center and meeting room complex of approximately 1.2 million square feet. These MICE facilities provide a flexible and expansive space that can be configured to provide small, mid-size or large meeting rooms and/or accommodate large-scale multi-media events or trade shows. MICE events typically take place on weekdays, thereby drawing traffic during the portion of the week when hotels and casinos in Macao normally experience lower demand relative to weekends and holidays, when occupancy and room rates are typically at their peak due to leisure travel. In 2009, we hosted 15 trade shows attracting more than 320,000 visitors and 388 corporate groups with approximately 60,000 delegates in 2009. In 2008, we hosted over 25 trade shows and 875 corporate groups, representing over 250,000 visitors. The Venetian Macao also has a 15,000-seat arena, The CotaiArena™, which has hosted a wide range of entertainment and sporting events, and a 1,800-seat theater that currently features ‘ZAIA’, an original production and the first resident show in Asia fromCirque du Soleil, an entertainment company based in Montreal, Canada.
Sands Macao
We opened the Sands Macao in May 2004. The Sands Macao was the first Las Vegas-style casino in Macao, and currently contains a mix of gaming areas for mass market, VIP and premium players, and entertainment and dining facilities. The Sands Macao is situated on the Macao peninsula near the New Macau Maritime Ferry Terminal, on a waterfront parcel centrally located between the Gongbei border gate and the central business district in Macao. This location provides the Sands Macao access to a large customer base, particularly the approximately 8.7 million visitors who arrived in Macao in 2009 by sea at either the TTFT, the inner harbor or the New Macau Maritime Ferry Terminal according to DSEC statistics. During the year ended December 31, 2009, the Sands Macao had a total of approximately 6.9 million visits.
As of December 31, 2009, the Sands Macao contained 289 suites, which are furnished with modern and luxurious amenities and decorated with stylish dark wood paneling and high-end furniture. These rooms are made available primarily to our VIP or premium players, typically on a complimentary basis. As of December 31, 2009, the Sands Macao also included approximately 229,000 square feet of gaming space and had 413 table games and 1,172 slot machines.
In addition to gaming facilities and hotel accommodations, the Sands Macao also includes restaurants, spa facilities, entertainment areas and other amenities. The dining venues feature popular regional cuisine and include a Cantonese restaurant, a Macanese/Portuguese restaurant and an upscale western-style steakhouse.
The Plaza Macao
In August 2008, we opened The Plaza Macao, which is located adjacent to The Venetian Macao. The Plaza Macao includes the Four Seasons Hotels (360 rooms and suites managed by Four Seasons Hotels Inc.) and the Plaza Casino, which we own and operate and which features approximately 70,000 square feet of gaming space with 116 table games and 166 slot machines or similar electronic gaming devices; 19 Paiza Mansions; several food and beverage offerings; conference and banquet facilities; and The Shoppes at Four Seasons which comprise retail space of approximately 211,000 square feet and is connected
38
Annual Report 2009
Our Properties
to the mall at The Venetian Macao. The ultra-exclusive Paiza Mansions at The Plaza Macao were completed and introduced to the VIP market in July 2009.
The Plaza Macao will also feature an apart-hotel tower consisting of approximately 1.0 million square feet of luxury apart-hotel units and common areas, and is expected to be branded and serviced by Four Seasons. We completed structural work on the tower in 2009, and expect to monetize the units within the apart-hotel tower in 2010. As of December 31, 2009, we had capitalized construction costs of US$1.05 billion for this project (including US$28.0 million of outstanding construction payables). We expect to spend approximately US$165 million, primarily on costs to complete the apart-hotel tower, including furniture, fixtures and equipment pre-opening costs and additional land premiums, and to pay for outstanding construction payables, as noted above.
Our Development Projects
We have submitted plans to the Macao Government for three integrated resort developments on an area of approximately 320,000 square meters (which we refer to as Parcels 3, 5, 6, 7 and 8). The above map indicates the location of our existing and planned Cotai Strip properties:
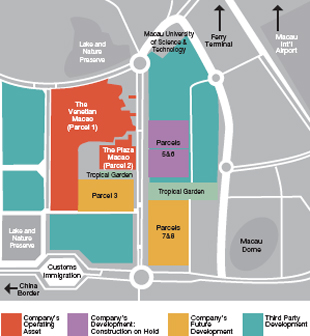
We expect these integrated resorts on Parcels 3, 5, 6, 7 and 8 to include hotels, MICE facilities, casinos or gaming areas, showrooms, theaters, shopping malls and other amenities. We commenced construction or pre-construction on these developments, and plan to own and operate the related gaming areas under our Macao gaming subconcession.
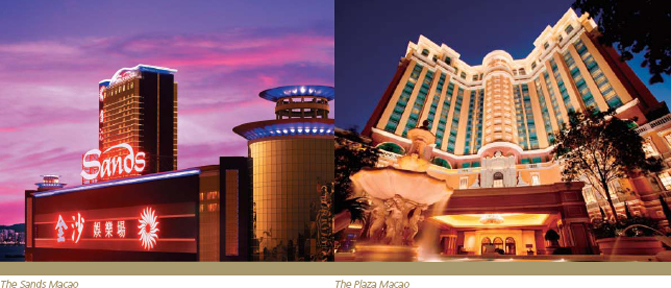
39
Sands China Ltd.
Our Properties
Given the challenging conditions in the capital markets and global economy, we suspended these development projects in late 2008. However, due to our successful listing and having received commitments of US$1.75 billion of project financing, we were able to mobilize to recommence the construction of Parcels 5 and 6 in 2010.
We currently intend to develop our other Cotai Strip properties as follows:
| | • | | Parcels 5 and 6.Parcels 5 and 6 will together comprise an integrated resort located across the street from The Venetian Macao and The Plaza Macao. Upon completion of Phases I and II of the project, the integrated resort will feature approximately 6,000 luxury and mid-scale hotel rooms, approximately 300,000 square feet of gaming space, approximately 1.2 million square feet of retail, entertainment and dining facilities, exhibition and conference facilities and a multipurpose theater. |
Phase I of the project is expected to include two hotel towers with approximately 3,700 Sheraton, Shangri-La and Traders branded hotel rooms, as well as completion of the structural work for an adjacent 2,300-room Sheraton hotel tower. Phase I will also include gaming space, a theater and a partial opening of the retail and exhibition and conference facilities. The total cost to complete Phase I is expected to be approximately US$2.0 billion.
Phase II of the project includes completion of the Sheraton hotel tower as well as the remaining retail facilities. The total cost to complete Phase II is expected to be approximately US$235 million.
Phase III of the project is expected to include a luxury St. Regis branded hotel and mixed-use tower. The total cost to complete Phase III is expected to be approximately US$450 million.
In connection with receiving commitments of US$1.75 billion of project financing (which we expect to close in April 2010), and together with a portion of the proceeds from the Global Offering, we were able to mobilize to recommence construction of Phases I and II. Once we close the project financing and recommence construction, we expect that it will take approximately 16 months to complete construction of Phase I, an additional six months thereafter to complete the adjacent Sheraton tower in Phase II, and an additional 24 months thereafter to complete the remaining retail facilities in Phase II. We intend to commence construction of Phase III of the project as demand and market conditions warrant. As of December 31, 2009, we had capitalized construction costs of US$1.73 billion for the entire project (including US$138.0 million in outstanding construction payables). We are currently negotiating new opening timelines with Starwood and Shangri- La, which we expect to finalize by the second quarter of 2010.
| | • | | Parcel 3.The integrated resort on parcel 3 will be connected to The Venetian Macao and The Plaza Macao. The multi-hotel complex is intended to include a gaming area, a shopping mall and serviced luxury apart-hotel units. We had commenced pre-construction and have capitalized construction costs of US$35.7 million as of December 31, 2009. We intend to commence construction after necessary government approvals are obtained, future demand justifies it and additional financing is obtained. |
| | • | | Parcels 7 and 8.The integrated resort on parcels 7 and 8 is expected to be similar in size and scope to the integrated resort on parcels 5 and 6. We had commenced pre-construction and have capitalized construction costs of US$116.2 million as of December 31, 2009. We intend to commence construction after necessary government approvals are obtained, future demand justifies it and additional financing is obtained. |
40
Annual Report 2009
Our Properties
We have received a land concession from the Macao Government to build the Sands Macao and Parcels 1, 2 and 3, including the sites on which The Venetian Macao (Parcel 1) and The Plaza Macao (Parcel 2) are located. We do not own these land sites in Macao; however, the land concession, which has an initial term of 25 years and is renewable at our option in accordance with Macao law, grants us exclusive use of the land. As specified in the land concession, we are required to pay premiums for each parcel, which are either payable in a single lump sum upon acceptance of the land concession or in seven semi-annual installments (provided that the outstanding balance is due upon the completion of the corresponding integrated resort), as well as annual rent for the term of the land concession. In October 2008, the Macao Government amended our land concession to allow us to subdivide Parcel 2 into four separate units under Macao’s horizontal property regime, consisting of retail, hotel (including gaming areas), apart-hotel tower and parking areas.
Under our land concession for Parcel 3, we were initially required to complete the corresponding development by August 2011. In 2009, the Macao Government agreed to provide us with an extension to complete the development of Parcel 3 by April 2013.

In November 2009, we received the final draft of the land concession agreement from the Macao Government pursuant to which we were awarded a concession by lease for Parcels 5 and 6. We have accepted the terms and conditions of the draft land concession and have made an initial premium payment of approximately US$87.5 million (MOP700.0 million). The land concession will not become effective until it is published in Macao’s Official Gazette. Once the land concession is in effect, we will be required to make additional land premium and annual rent payments in the amounts and at the times specified in the land concession. The land concession requires us to complete development of the integrated resort on Parcels 5 and 6 within 48 months of the date it is published in Macao’s Official Gazette.
41
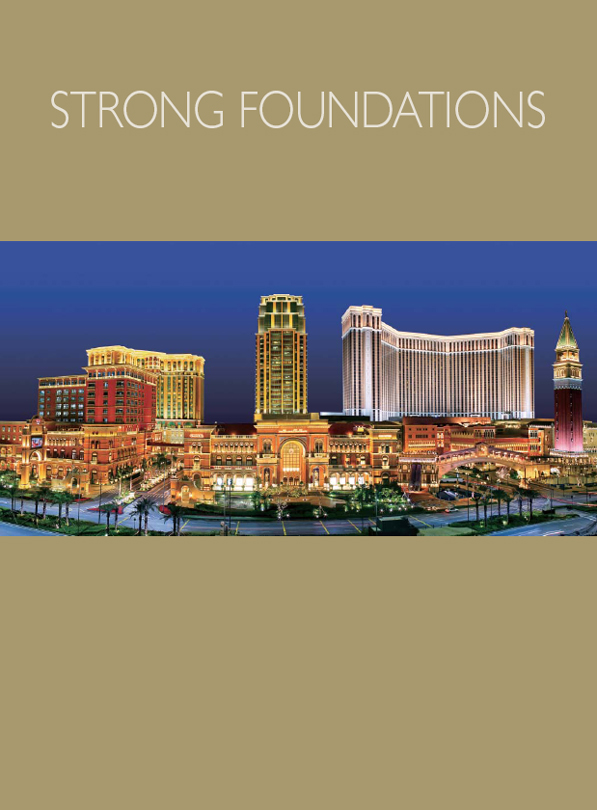
Sands China Ltd.
Management Discussion and Analysis
Results of Operations
Year Ended December 31, 2009 Compared to the Year Ended December 31, 2008

Net Revenues
Our net revenues consisted of the following:
| | | | | | | |
| | | Year ended December 31, | |
| | | 2009 | | 2008 | | Percent Change | |
| | | (US$ in millions, except percentages) | |
Casino | | 2,888.5 | | 2,669.7 | | 8.2 | % |
Rooms | | 123.4 | | 140.0 | | (11.9 | )% |
Food and beverage | | 62.0 | | 54.3 | | 14.2 | % |
Mall | | 137.3 | | 123.0 | | 11.6 | % |
Convention, ferry, retail and other | | 89.9 | | 66.3 | | 35.6 | % |
| | | | | | | |
Total net revenues | | 3,301.1 | | 3,053.3 | | 8.1 | % |
| | | | | | | |
Net revenues were US$3,301.1 million for the year ended December 31, 2009, an increase of US$247.8 million, or 8.1%, compared to US$3,053.3 million for the year ended December 31, 2008. Net revenues increased primarily due to an increase in net casino revenues, primarily driven by Asian economies recovering from the global economic downturn and the effects of the outbreak of swine flu; as well as a loosening of visa restrictions for residents of mainland China. In addition, net revenues also increased due to the full year of operation of The Shoppes at Four Seasons, as well as the expansion of our ferry services.
Net casino revenues for the year ended December 31, 2009 were US$2,888.5 million, an increase of US$218.8 million, or 8.2%, compared to US$2,669.7 million for the year ended December 31, 2008. Net casino revenues of The Venetian Macao and The Plaza Macao increased by US$75.4 million and US$159.9 million, respectively, due to the factors mentioned above, as well as the full year of operation of The Plaza Macao, which opened in August 2008. These increases were partially offset by a decrease in net casino revenue of US$16.5 million at the Sands Macao.

44
Annual Report 2009
Management Discussion and Analysis
The following table summarizes the results of our casino activity:
| | | | | | | | | |
| | | For the year ended December 31, | |
| | | 2009 | | | 2008 | | | Percent Change | |
| | | (US$ in millions, except percentages and points) | |
| | | |
Sands Macao | | | | | | | | | |
Total net casino revenues | | 996.6 | | | 1,013.1 | | | (1.6 | )% |
Non-rolling chip table games drop | | 2,413.4 | | | 2,626.9 | | | (8.1 | )% |
Non-rolling chip table games win percentage | | 19.5 | % | | 18.9 | % | | 0.6 | pts |
Rolling chip volume | | 21,920.2 | | | 25,182.2 | | | (13.0 | )% |
Rolling chip win percentage | | 3.0 | % | | 2.6 | % | | 0.4 | pts |
Slot handle | | 1,256.9 | | | 1,039.4 | | | 20.9 | % |
Slot hold percentage | | 6.6 | % | | 7.8 | % | | (1.2 | ) pts |
| | | |
The Venetian Macao | | | | | | | | | |
Total net casino revenues | | 1,685.9 | | | 1,610.5 | | | 4.7 | % |
Non-rolling chip table games drop | | 3,362.8 | | | 3,530.1 | | | (4.7 | )% |
Non-rolling chip table games win percentage | | 23.6 | % | | 19.9 | % | | 3.7 | pts |
Rolling chip volume | | 37,701.0 | | | 36,893.8 | | | 2.2 | % |
Rolling chip win percentage | | 2.8 | % | | 3.0 | % | | (0.2 | ) pts |
Slot handle | | 2,362.7 | | | 1,941.9 | | | 21.7 | % |
Slot hold percentage | | 7.4 | % | | 8.0 | % | | (0.6 | ) pts |
| | | |
The Plaza Macao | | | | | | | | | |
Total net casino revenues | | 206.0 | | | 46.1 | | | 346.9 | % |
Non-rolling chip table games drop | | 335.7 | | | 99.8 | | | 236.4 | % |
Non-rolling chip table games win percentage | | 23.7 | % | | 21.1 | % | | 2.6 | pts |
Rolling chip volume | | 7,059.4 | | | 630.1 | | | 1,020.4 | % |
Rolling chip win percentage | | 2.3 | % | | 4.5 | % | | (2.2 | ) pts |
Slot handle | | 240.4 | | | 38.2 | | | 529.3 | % |
Slot hold percentage | | 5.9 | % | | 5.6 | % | | 0.3 | pts |
45
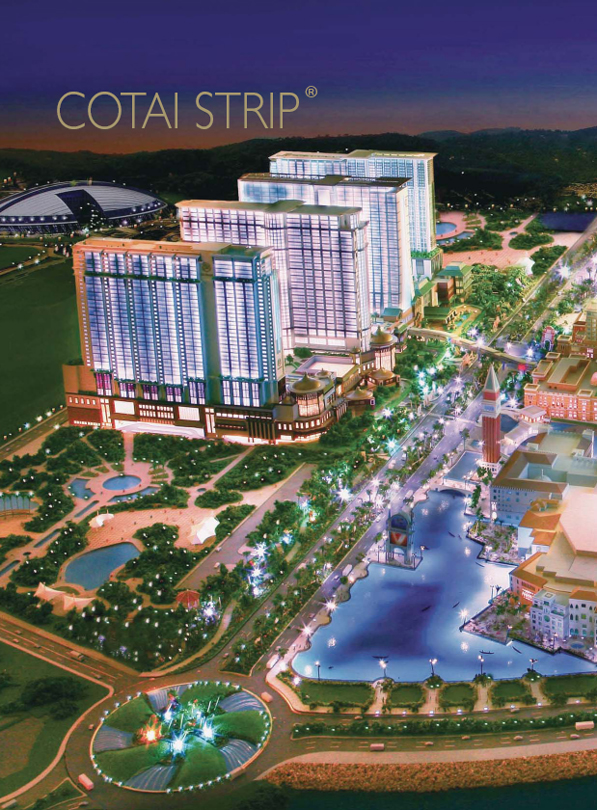
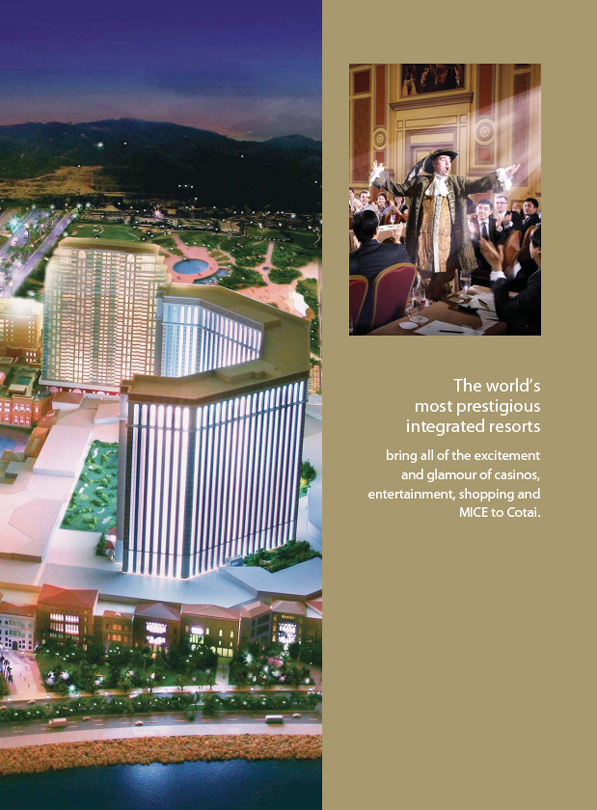
Sands China Ltd.
Management Discussion and Analysis
Net room revenues for the year ended December 31, 2009 were US$123.4 million, a decrease of US$16.6 million, or 11.9%, compared to US$140.0 million for the year ended December 31, 2008. This decrease resulted primarily from our introduction of lower room rates at The Venetian Macao, to raise occupancy in order to offset the negative impact of the global economic downturn and the outbreak of swine flu in the region during the latter half of 2008 and the first half of 2009. The decrease in net room revenues at The Venetian Macao was partially offset by the full year operation of The Plaza Macao, which opened in August 2008.
The following table summarizes our room activity. The suites at the Sands Macao are primarily provided to gaming patrons on a complimentary basis and therefore related statistics have not been included.
| | | | | | | | | |
| | | Year ended December 31, | |
| | | 2009 | | | 2008 | | | Percent Change | |
| | | (US$, except percentages and points) | |
| | | |
The Venetian Macao | | | | | | | | | |
Gross room revenues (in millions) | | 173.7 | | | 200.6 | | | (13.6 | )% |
Average daily rate | | 205 | | | 226 | | | (9.3 | )% |
Occupancy rate | | 83.6 | % | | 85.3 | % | | (1.7 | ) pts |
Revenue per available room | | 171 | | | 193 | | | (11.4 | )% |
| | | |
The Plaza Macao | | | | | | | | | |
Gross room revenues (in millions) | | 20.3 | | | 3.7 | | | 448.6 | % |
Average daily rate | | 295 | | | 344 | | | (14.2 | )% |
Occupancy rate | | 52.3 | % | | 32.0 | % | | 20.3 | pts |
Revenue per available room | | 154 | | | 110 | | | 40.0 | % |
Notes: Information in this table takes into account rooms provided to customers on a complimentary basis that are recorded at discounted rates. The Plaza Macao opened on August 28, 2008
Net food and beverage revenues for the year ended December 31, 2009 were US$62.0 million, an increase of US$7.7 million, or 14.2%, compared to US$54.3 million for the year ended December 31, 2008. The increase was primarily attributable to the full year operation of The Plaza Macao, which generated revenues of US$9.8 million.
Mall revenues for the year ended December 31, 2009 were US$137.3 million, an increase of US$14.3 million, or 11.6%, compared to US$123.0 million for the year ended December 31, 2008. The increase was primarily attributable to the full year of operation of The Shoppes at Four Seasons, which generated revenues of US$36.6 million.
Net convention, ferry, retail and other revenue for the year ended December 31, 2009 was US$89.9 million, an increase of US$23.6 million, or 35.6%, compared to US$66.3 million for the year ended December 31, 2008. The increase was primarily attributable to an increase in ferry revenues resulting from an increase in the number of sailings as we added new vessels.
48
Annual Report 2009
Management Discussion and Analysis
Operating Expenses
Our operating expenses consist of the following:
| | | | | | | | |
| | | Year ended December 31, | |
| | | 2009 | | 2008 | | | Percent Change | |
| | | (US$ in millions, except percentages) | |
| | | |
Casino | | 1,947.0 | | 1,875.4 | | | 3.8 | % |
Rooms | | 26.9 | | 32.2 | | | (16.5 | )% |
Food and beverage | | 49.4 | | 47.0 | | | 5.1 | % |
Mall | | 33.9 | | 31.5 | | | 7.6 | % |
Convention, ferry, retail and other | | 127.5 | | 109.4 | | | 16.5 | % |
Provision for doubtful accounts | | 54.1 | | 15.0 | | | 260.7 | % |
General and administrative expense | | 256.1 | | 269.0 | | | (4.8 | )% |
Corporate expense | | 11.5 | | 14.7 | | | (21.8 | )% |
Land lease expense | | 12.9 | | 11.9 | | | 8.4 | % |
Pre-opening expense | | 83.0 | | 112.3 | | | (26.1 | )% |
Depreciation and amortization | | 320.4 | | 268.2 | | | 19.5 | % |
Loss on disposal of property and equipment | | 6.0 | | 1.6 | | | 275.0 | % |
Fair value losses on financial assets at fair value through profit or loss | | 1.2 | | 0.0 | | | — | |
Net foreign exchange losses/(gains) | | 1.2 | | (29.2 | ) | | (104.1 | )% |
| | | | | | | | |
| | | |
Total operating expenses | | 2,931.1 | | 2,759.3 | | | 6.2 | % |
| | | | | | | | |
49

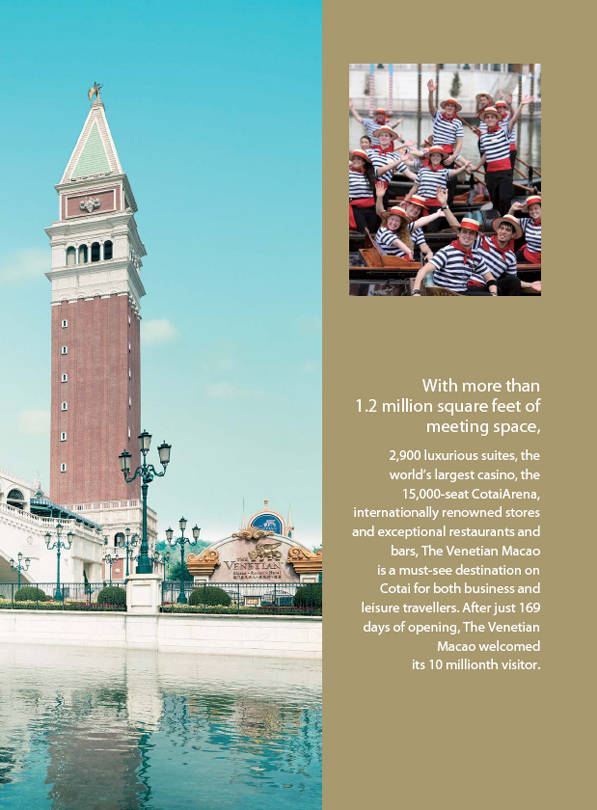
Sands China Ltd.
Management Discussion and Analysis
Operating expenses were US$2,931.1 million for the year ended December 31, 2009, an increase of US$171.8 million, or 6.2%, compared to US$2,759.3 million for the year ended December 31, 2008. The increase in operating expenses was primarily attributable to the full year operation of The Plaza Macao, and the expansion of our ferry service operations, as well as provision for doubtful accounts and depreciation and amortization.
Casino expenses for the year ended December 31, 2009 were US$1,947.0 million, an increase of US$71.6 million, or 3.8%, compared to US$1,875.4 million for the year ended December 31, 2008. The increase was primarily due to the increase in total gaming tax and gaming premium of US$95.3 million as a result of higher casino revenues, and the full year operation impact of The Plaza Macao of US$33.9 million (excluding gaming tax and gaming premium). These increases were partially offset by a decrease in payroll expenses of US$35.1 million at the Sands Macao and The Venetian Macao, and other casino expenses fell by US$22.3 million, mainly resulting from our cost savings initiatives.
Room expenses for the year ended December 31, 2009 were US$26.9 million, a decrease of US$5.3 million, or 16.5%, compared to US$32.2 million for the year ended December 31, 2008. Payroll expenses, hotel supplies and other expenses decreased by US$8.7 million due to lower occupancy and our cost savings initiatives at the Sands Macao and The Venetian Macao, partially offset by a US$3.3 million increase in expenses attributable to the full year operation of The Plaza Macao.
Food and beverage expenses for the year ended December 31, 2009 were US$49.4 million, an increase of US$2.4 million, or 5.1%, compared to US$47.0 million for the year ended December 31, 2008. Expenses relating to the full year operation impact of The Plaza Macao were US$7.9 million. The increase was partially offset by a US$5.7 million decrease in the cost of sales as a result of lower demand for food and beverage services, as well as a reduction in payroll expenses at the Sands Macao and The Venetian Macao, resulting from our cost savings initiatives and reduced expenses in other Macao properties.
Mall expenses for the year ended December 31, 2009 were US$33.9 million, an increase of US$2.4 million, or 7.6%, compared to US$31.5 million for the year ended December 31, 2008 primarily attributable to the full year operation of The Plaza Macao.
Convention, ferry, retail and other expenses for the year ended December 31, 2009 were US$127.5 million, an increase of US$18.1 million, or 16.5%, compared to US$109.4 million for the year ended December 31, 2008. The increase was primarily attributable to US$12.5 million related to theCirque du Soleilshow ‘ZAIA’ at The Venetian Macao and an increase in ferry expenses of US$15.5 million. These increases were partially offset by a reduction in convention and other operating expenses at the Sands Macao and The Venetian Macao, primarily resulting from our cost savings initiatives.
Provision for doubtful accounts was US$54.1 million for the year ended December 31, 2009, an increase of US$39.1 million, compared to US$15.0 million for the year ended December 31, 2008. Of the increase, US$23.4 million was related to our casino operations, as we granted more advances to our premium players in relation to the opening of new properties, as well as to one junket operator; and US$16.6 million related to mall operations, as our tenants experienced difficulties driven by reduced visitation and consumer spending at the properties as a result of the economic downturn.
General and administrative expenses were US$256.1 million for the year ended December 31, 2009, a decrease of US$12.9 million, or 4.8%, compared to US$269.0 million for the year ended December 31, 2008. The decrease was primarily driven by our cost savings initiatives, resulting in
52
Annual Report 2009
Management Discussion and Analysis
a decrease of US$35.1 million at the Sands Macao and The Venetian Macao. This decrease was primarily related to payroll expenses, utilities, transportation costs and bank charges. The decrease was partially offset by US$22.9 million attributable to the full year operation of The Plaza Macao.
Pre-opening expenses were US$83.0 million for the year ended December 31, 2009, a decrease of US$29.3 million, or 26.1%, compared to US$112.3 million for the year ended December 31, 2008. Pre-opening expenses for the year ended December 31, 2009 were primarily related to costs associated with the suspension of construction at Parcels 5 and 6 of our Cotai Strip development, and maintenance of these construction sites, as well as costs relating to the Paiza Mansions at The Plaza Macao. Pre-opening expenses for the year ended December 31, 2008 were primarily related to pre-opening activities at The Plaza Macao.
Depreciation and amortization expense was US$320.4 million for the year ended December 31, 2009, an increase of US$52.2 million, or 19.5%, compared to US$268.2 million for the year ended December 31, 2008. The increase was primarily the result of US$37.6 million attributable to a full year of depreciation expense related to The Plaza Macao, and an increase of US$11.8 million related to The Venetian Macao, as we began depreciating areas that were not placed in service during 2008.

53
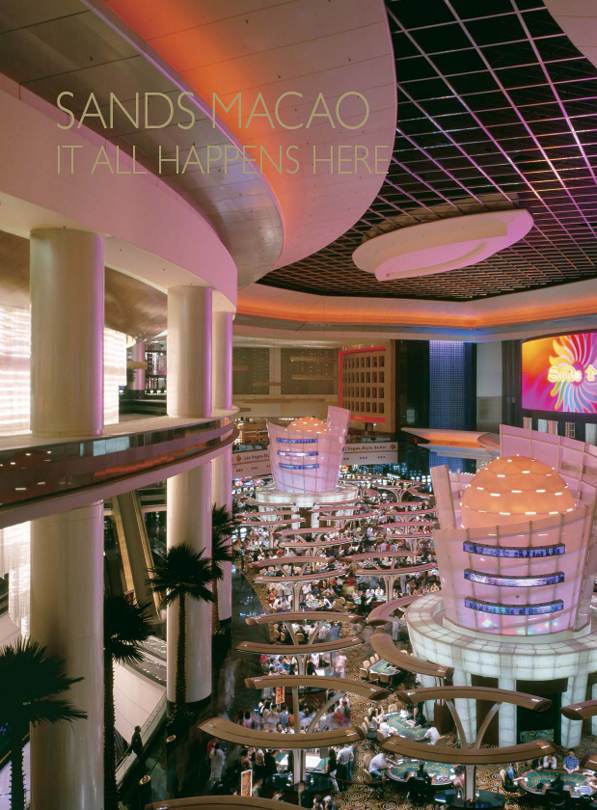
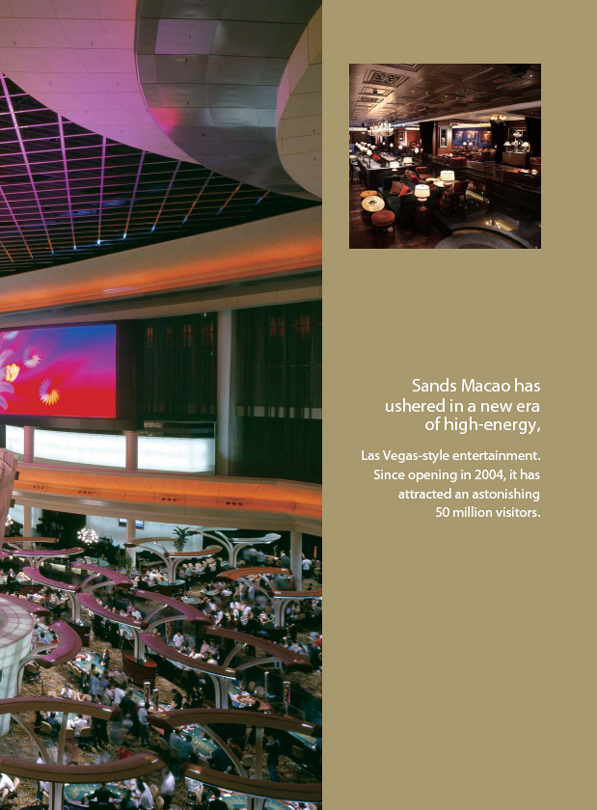
Sands China Ltd.
Management Discussion and Analysis
Adjusted EBITDAR was US$809.0 million in 2009 compared with US$686.0 million in the previous year, a strong increase of 17.9%, or US$123.0 million, for the whole year.

Adjusted EBITDAR
The following table summarizes information related to our operations:
| | | | | | | | | |
| | | Year ended December 31, | |
| | | 2009 | | | 2008 | | | Percent Change | |
| | | (US$ in millions, except percentages) | |
| | | |
Sands Macao | | 243.4 | | | 214.4 | | | 13.5 | % |
The Venetian Macao | | 554.8 | | | 497.2 | | | 11.6 | % |
The Plaza Macao | | 40.3 | | | 7.3 | | | 452.1 | % |
Ferry and other operations | | (29.4 | ) | | (32.9 | ) | | (10.6 | )% |
| | | | | | | | | |
| | | |
Total adjusted EBITDAR | | 809.0 | | | 686.0 | | | 17.9 | % |
| | | | | | | | | |
Adjusted EBITDAR for the year ended December 31, 2009 was US$809.0 million, an increase of US$123.0 million, or 17.9%, compared to US$686.0 million for the year ended December 31, 2008. This increase was primarily driven by economies in Asia recovering from the global economic downturn, as well as a loosening of visa restrictions for residents from mainland China. In addition, management continued to focus on achieving operational efficiencies throughout the various properties, which resulted in significant cost savings.
56
Annual Report 2009
Management Discussion and Analysis
Interest Expense
The following table summarizes information related to interest expense:
| | | | | | | | | |
| | | Year ended December 31, | |
| | | 2009 | | | 2008 | | | Percent Change | |
| | | (US$ in millions, except percentages) | |
| | | |
Interest and other finance cost | | 162.7 | | | 205.2 | | | (20.7 | )% |
Less — capitalized interest | | (12.4 | ) | | (82.3 | ) | | (84.9 | )% |
| | | | | | | | | |
| | | |
Interest expense, net | | 150.3 | | | 122.9 | | | 22.3 | % |
| | | | | | | | | |
Interest and other finance costs for the year ended December 31, 2009 was US$162.7 million, a decrease of US$42.5 million, or 20.7%, compared to US$205.2 million for the year ended December 31, 2008. The decrease was primarily a result of a reduction in average interest rates and repayment of our borrowings. The US$69.9 million decrease in capitalized interest was primarily due to the completion of The Plaza Macao and suspension of Parcels 5 and 6, as we have discontinued capitalizing interest on the suspended projects of our Cotai Strip development.
Profit for the Year
Profit for the year ended December 31, 2009 was US$213.8 million, an increase of US$38.1 million, or 21.7% compared to US$175.7 million for the year ended December 31, 2008.
Liquidity and Capital Resources
Historically, we have funded our operations through cash generated from our operations and our debt financings, as well as financial support from the LVS Group. Prior to the Global Offering, the LVS Group provided financial support for us in the form of equity contributions, payment of expenses through intercompany payables, shareholders’ loans and LVS’s confirmation that it would not demand our repayment of certain intercompany obligations owed to the LVS Group prior to the earlier of June 30, 2010 or upon completion of the Global Offering.
In September 2009, VVDI (II), our immediate Controlling Shareholder, completed a US$600.0 million exchangeable bond offering due in 2014 (the “Bonds”). In November 2009, concurrent with our Global Offering, the Bonds were mandatorily and automatically exchanged into 497,865,084 ordinary shares of Sands China.
On September 4, 2009, our Company borrowed US$582.0 million from VVDI (II), representing the net proceeds received in connection with VVDI (II)’s issuance of the Bonds. The proceeds of US$582.0 million received by our Company were lent by our Company to certain members of our Group by way of intercompany loans, in order to repay outstanding intercompany payables owed to certain members of the LVS Group, primarily related to the funding of construction for Parcels 5 and 6 and certain of its other ancillary operations.
On November 30, 2009, we completed our Global Offering, raising gross proceeds of approximately US$2.5 billion including approximately US$800 million offered by the Selling Shareholder. Our Company used approximately US$814.8 million of the net proceeds received in the Global Offering to repay an additional portion of the shareholders’ loans and intercompany payables owed to the LVS Group. In addition, concurrent with the completion of the Global Offering, our obligations under the shareholders’ loan from VVDI (II) were satisfied by our Company through issuance of shares directly to the holders of the bonds (the “Bondholders”) in connection with the mandatory and automatic exchange of the bonds for shares. Immediately upon the completion of the Global Offering, we did not have any shareholders’ loans or intercompany payables owed to the LVS Group, save in relation to certain intercompany trade payables to related companies. We use cash primarily for funding capital expenditures and operating costs. Our capital expenditures relate primarily
57
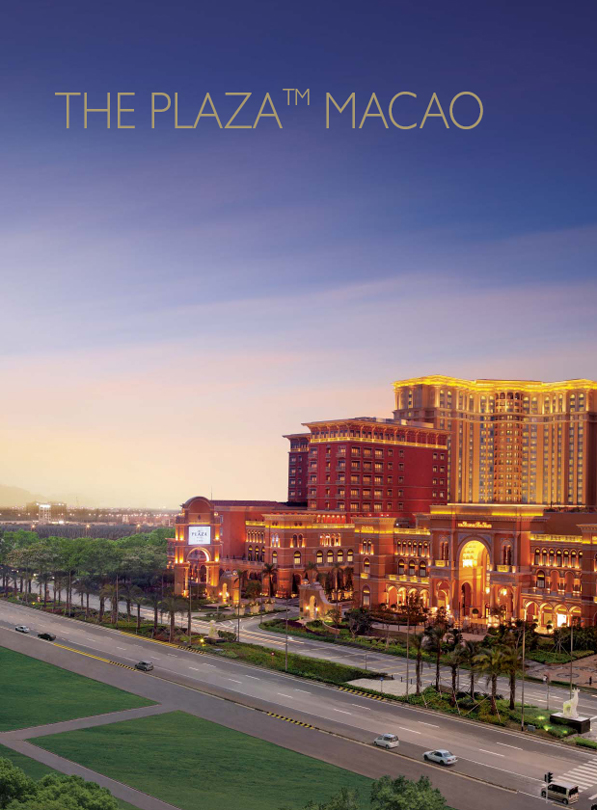
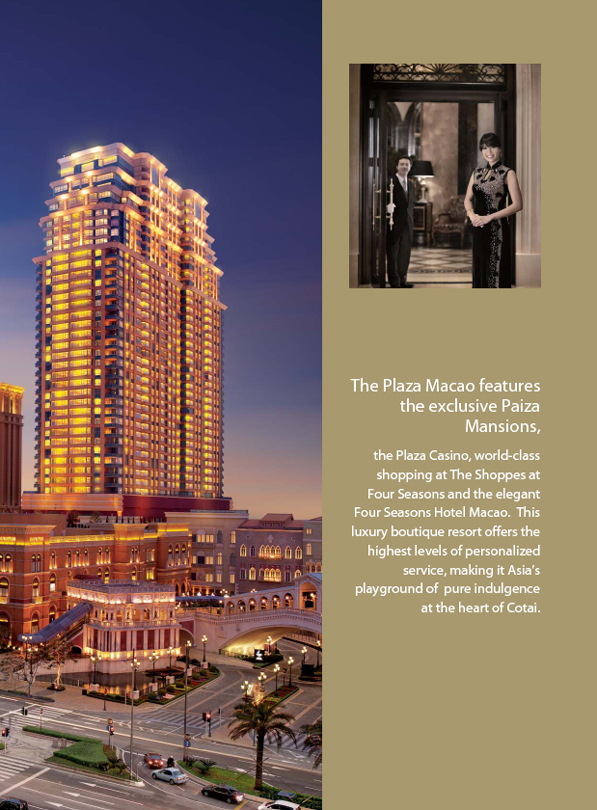
Sands China Ltd.
Management Discussion and Analysis
to our Cotai Strip developments consisting of hotels, malls, MICE, gaming and entertainment facilities, and apart-hotels. In the future, we expect to incur significant additional capital expenditures, which we intend to fund through a combination of debt and equity financings, including the proceeds of the Global Offering, and internal resources (subject to the requirements of our existing financing arrangements).
As of December 31, 2009, we had cash and cash equivalents of US$908.3 million and restricted cash of US$17.2 million. We utilized US$87.5 million (MOP700.0 million) of our restricted cash to pay the initial land premium payment under the land concession contract for Parcels 5 and 6 prior to the Listing Date. Except for our discussions to secure potential supplemental financing for our development of Parcels 5 and 6, we currently have no material external debt financing plans for the next 12 months.
Cash Flows — Summary
Our cash flows consisted of the following:
| | | | | | |
| | | Year ended December 31, | |
| | | 2009 | | | 2008 | |
| | | (US$ in millions) | |
| | |
Net cash generated from operating activities | | 703.9 | | | 256.2 | |
Net cash used in investing activities | | (272.2 | ) | | (1,918.0 | ) |
Net cash generated from financing activities | | 59.1 | | | 1,637.4 | |
| | | | | | |
| | |
Net increase/(decrease) in cash and cash equivalents | | 490.8 | | | (24.4 | ) |
| | | | | | |
| | |
Cash and cash equivalents at beginning of the year | | 417.8 | | | 439.4 | |
Effect of exchange rate on cash and cash equivalents | | (0.2 | ) | | 2.8 | |
| | | | | | |
| | |
Cash and cash equivalents at end of the year | | 908.3 | | | 417.8 | |
| | | | | | |
Cash Flow — Operating Activities
We derive most of our operating cash flow from our casino, room and mall operations.
Net cash generated from operating activities for the year ended December 31, 2009 was US$703.9 million, an increase of US$447.7 million, as compared to US$256.2 million for the year ended December 31, 2008. The increase in net cash generated from operating activities was primarily due to an increase in profit before tax and depreciation and amortization, as well as improved working capital.
Cash Flow — Investing Activities
Net cash used in investing activities for the year ended December 31, 2009 was US$272.2 million, which primarily consisted of capital expenditures offset by a decrease of US$106.9 million in restricted cash. Capital expenditures amounted to US$387.2 million, including US$247.8 million for construction and development activities related to unopened areas and an apart-hotel tower in The Plaza Macao, which is anticipated to be branded and serviced by Four Seasons, and US$90.3 million for Parcels 5 and 6 of our Cotai Strip development. Restricted cash decreased US$106.9 million in 2009.
Cash Flow — Financing Activities
For the year ended December 31, 2009, net cash flows used in financing activities were US$59.1 million, primarily attributable to US$1,636.8 million in net proceeds from issuance of ordinary shares, offset by US$733.0 million in net repayments of notes payables and advances from
60
Annual Report 2009
Management Discussion and Analysis
related companies, and US$670.4 million in net repayment of borrowings under our credit facilities, interest paid of US$145.7 million, and financing costs paid of US$25.6 million. The Group borrowed US$582.0 million from the LVS Group on September 4, 2009, and repaid outstanding intercompany payables owed by certain members of our Group to the LVS Group.
Capital Expenditures
Capital expenditures were used primarily for new projects and to renovate, upgrade and maintain existing properties. Set forth below is historical information on our capital expenditures, excluding capitalized interest and construction payables:
| | | | |
| | | Year ended December 31, |
| | | 2009 | | 2008 |
| | | (US$ in millions) |
| | |
The Venetian Macao | | 19.1 | | 193.7 |
Sands Macao | | 6.1 | | 38.8 |
The Plaza Macao | | 247.8 | | 503.2 |
Ferry operations | | 22.2 | | 198.3 |
Parcels 5 and 6 | | 90.3 | | 959.1 |
Other | | 1.7 | | 104.7 |
| | | | |
| | |
Total capital expenditures | | 387.2 | | 1,997.8 |
| | | | |
Our capital expenditure plans are significant. We plan to restart construction of Parcels 5 and 6 once we have sufficient funds necessary to complete Phases I and II. We intend to fully fund the development and construction costs related to Phases I and II with at least US$500.0 million of the proceeds from the Global Offering, together with project financing of up to US$1.75 billion that we are currently seeking to obtain from a group of lenders and, to the extent necessary, cash flow from existing and future operations. We have received aggregate commitments for project financing in the amount of US$1.75 billion from commercial banks and other financial institutions, including from affiliates of all the Joint Bookrunners. The project financing consists of (i) a US$750 million Term A loan, (ii) a US$750 million delayed draw term loan, and (iii) a US$250 million revolving credit facility. The Company will provide an unconditional, unsecured payment and performance guarantee to the lenders of the deal. Once we recommence construction, we estimate that it will take approximately 16 months to complete construction of Phase I and another six months thereafter to complete the internal fit-out of the additional Sheraton hotel tower in Phase II.
We will commence construction of Phase III at a future date as demand and market conditions warrant. As of December 31, 2009, we capitalized construction costs of US$1.73 billion on the development of Parcels 5 and 6 and, if supplemental financing is secured, we expect to spend an additional US$2.2 billion to complete Phases I and II. We intend to fund our capital expenditure plans through a combination of debt and equity financings and internal resources, including a portion of the proceeds of the Global Offering.
These investment plans are preliminary and subject to change based upon the execution of our business plan, the progress of our capital projects, market conditions and the outlook on future business conditions.
Final Dividend
The Board does not recommend the payment of a final dividend for the year ended December 31, 2009.
Pledge of Fixed Assets
We have pledged a substantial portion of our fixed assets to secure the loan facilities. We pledged buildings; building, land and leasehold improvements; furniture, fittings and equipment; construction in progress; ferries and vehicles with an aggregate net book value of approximately US$3.68 billion as of December 31, 2009 (2008: US$3.83 billion).
61

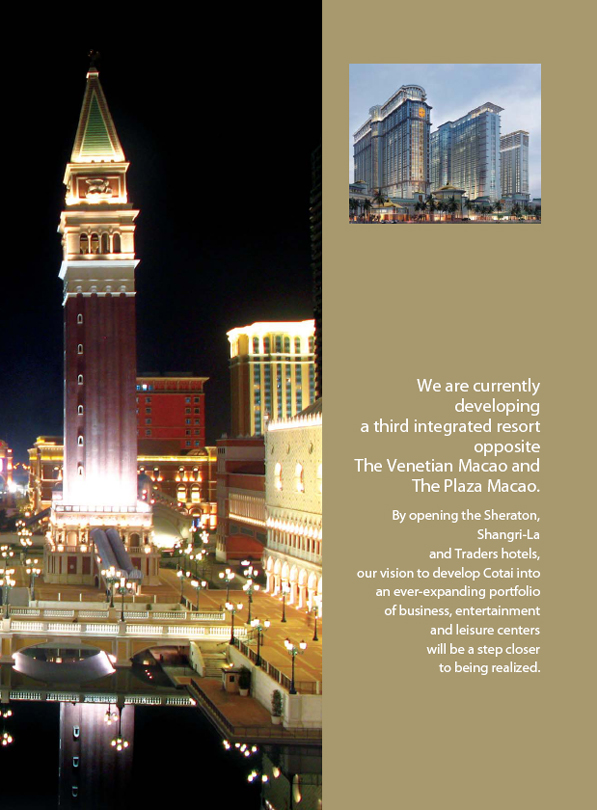
Sands China Ltd.
Management Discussion and Analysis
Capital Commitments
Property and equipment commitments not provided for are as follows:
| | | | |
| | | As of December 31, |
| | | 2009 | | 2008 |
| | | (US$’000) |
| | |
Contracted but not provided for | | 162,054 | | 1,422,130 |
Authorized but not contracted for | | 1,708,208 | | 6,296,869 |
| | | | |
| | |
| | 1,870,262 | | 7,718,999 |
| | | | |
Contingent Liabilities and Risk Factors
The Group has contingent liabilities arising in the ordinary course of business. Management has made certain estimates for potential litigation costs based upon consultation with legal counsel and believes that no significant loss will be incurred beyond the amounts provided for as of December 31, 2009. Actual results could differ from these estimates; however, in the opinion of management, it is not anticipated that any material liabilities will arise from the contingent liabilities.
In November 2009, we received the final draft of the land concession agreement from the Macao Government pursuant to which we were awarded a concession by lease for Parcels 5 and 6. We have accepted the terms and conditions of the draft land concession and have made an initial premium payment of approximately US$87.5 million (MOP700.0 million). The land concession will not become effective until the date it is published in Macao’s Official Gazette. Upon successfully obtaining the land concession for Parcels 5 and 6, we will subsequently negotiate the land concession for Parcels 7 and 8. Based on historical experience with the Macao Government with respect to the Group’s land concessions for the Sands Macao and Parcels 1, 2 and 3, management believes that the land concessions for Parcels 5, 6, 7 and 8 will be granted. However, if the Group does not obtain these land concessions, the Group could forfeit all or a substantial part of its US$1.8 billion construction costs as of December 31, 2009, incurred for the development of Parcels 5, 6, 7 and 8.
The Group had commenced pre-construction on Parcel 3, and had capitalized costs of approximately US$35.7 million as of December 31, 2009. Under the revised terms of the land concession approved by the Macao Government on August 20, 2009 that covers Parcel 3, the Group is required to complete development of Parcel 3 by April 17, 2013. Management believes that if the Group is unable to complete the development of Parcel 3 by the deadline, it will be able to obtain an extension from the Macao Government. However, no assurances can be given that an extension will be granted. If the Group is not able to meet the April 2013 deadline and that deadline is not extended, the Macao Government has the right to unilaterally terminate the land concession and the Group could lose its investment in, and right to operate, any properties developed under the land concession for Parcel 3 without compensation to the Group.
64
Annual Report 2009
Stakeholder Information
3.1 Our Shareholders
Shareholding Analysis and Our Shareholders
Share Capital (as of December 31, 2009)
| | |
| Authorized Share Capital | | 16,000,000,000 ordinary shares of US$0.01 each |
| |
| Issued Share Capital | | 8,047,865,084 ordinary shares of US$0.01 each |
Shareholding Distribution
| | | | | | | | | | |
| | | As of December 31, 2009 | |
| Size of Shareholding | | Number of
Shareholders | | % of
Shareholders | | | Number of
Shares Held | | % of the Issued
Share Capital | |
| | | | |
1–1,000 | | 1,450 | | 71.39 | % | | 680,400 | | 0.008 | % |
1,001–5,000 | | 472 | | 23.24 | % | | 1,052,400 | | 0.013 | % |
5,001–10,000 | | 66 | | 3.25 | % | | 515,200 | | 0.006 | % |
10,001–100,000 | | 38 | | 1.87 | % | | 934,800 | | 0.012 | % |
100,001–1,000,000 | | 2 | | 0.10 | % | | 1,006,400 | | 0.013 | % |
Over 1,000,000 | | 3 | | 0.15 | % | | 8,043,675,884 | | 99.948 | % |
| | | | | | | | | | |
| | | | |
Total | | 2,031 | | 100.00 | % | | 8,047,865,084 | | 100.000 | % |
| | | | | | | | | | |
Note: 46.93% of all our issued shares were held through the Central Clearing and Settlement System (“CCASS”) as of December 31, 2009
The actual number of investors in Sands China shares is likely to be much greater, due to ownership of shares being held through nominees, investment funds and the CCASS of Hong Kong.
Shareholding by Category
| | | |
Venetian Venture Development Intermediate II (“VVDI (II)”) | | 70.3 | % |
Institutional and Retail Investors | | 29.7 | % |
| | | |
Total | | 100.0 | % |
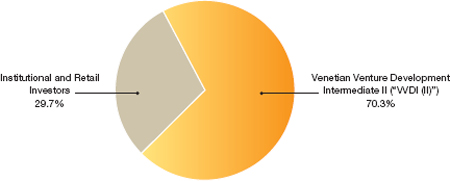
65
Sands China Ltd.
Stakeholder Information
From publicly available information and as far as our Directors are aware, Sands China has maintained a sufficient public float of its share capital in the Hong Kong stock market since its listing on November 30, 2009.
Creation of Shareholder Value
In 2009, Sands China benefited from a number of key strengths that helped to differentiate our business from that of our competitors, including the following:
| | • | | Providing the highest quality integrated resort offerings; |
| | • | | The diversification of amenities which provided us with a substantially higher adjusted EBITDAR to sales percentage; |
| | • | | Generating substantial cash flow and earnings from our existing operations; |
| | • | | Maintaining an industry-leading development pipeline; |
| | • | | Utilizing established brands; |
| | • | | Operating very efficiently; |
| | • | | Maintaining an experienced management team; and |
| | • | | Deriving significant benefits from our on-going relationship with Las Vegas Sands Corp. |
Sands China’s profit attributable to shareholders for the year ended December 31, 2009 was US$213.8 million versus US$175.7 million in 2008, an increase of 21.7%. Earnings per share for the year ended December 31, 2009 was US$3.32 cents (HK$25.77 cents) versus US$2.80 cents (HK$21.69 cents) in 2008, an increase of 18.6%.
Earnings Per Share (US$ Cents)
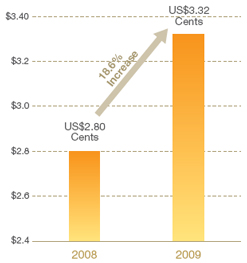
We believe our business strategy continues to be to successfully execute our Cotai Strip developments and to leverage our integrated resort business model to create Asia’s premier gaming, leisure and convention destination. Our business strategies and development plans allow us to achieve strong growth and financial performance in the future.
We are grateful to all shareholders who provide us with feedback and views. If any shareholder has comments or questions on what we are doing on his or her behalf, please contact us, the contact information can be found on page 193. We will provide an answer to your questions and post it on our website if we think it will be of wider interest to shareholders. We will take your comments into account and act upon them if we believe this will improve our performance and create shareholder value.
66
Annual Report 2009
Stakeholder Information
3.2 Our Lenders
We have incurred, and will continue to incur, significant capital expenditures associated with the expansion of new integrated resorts in our Cotai Strip development, as part of our strategy of building critical mass at our Cotai Strip development. We intend to fund our capital expenditure plans through a combination of debt and equity financings and internal resources.
To fund our existing projects and to finance our working capital requirements, we and our subsidiaries have entered into loan agreements with various financial institutions. We set forth below a summary of the material terms and conditions of these loans.
(a) Macao Credit Facility
On May 25, 2006, two subsidiaries of the Group, VML US Finance LLC (“VMLF”, the “Borrower”) and VML, as guarantor, entered into a credit agreement (the “Macao Credit Facility”). The Macao Credit Facility originally consisted of a US$1.2 billion funded term B loan (the “Macao Term B Facility”), a US$700.0 million delayed draw term B loan (the “Macao Term B Delayed Draw Facility”), a US$100.0 million funded local currency term loan (the “Macao Local Term Facility”) and a US$500.0 million revolving credit facility (the “Macao Revolving Facility”). In March 2007, the Macao Credit Facility was amended to expand the use of proceeds and remove certain restrictive covenants. In April 2007, the lenders of the Macao Credit Facility approved a reduction of the interest rate margin for all classes of loans by 50 basis points, and the Borrower exercised its rights under the Macao Credit Facility to access the US$800.0 million of incremental facilities under the accordion feature set forth therein, which increased the funded Macao Term B Facility by US$600.0 million, the Macao Revolving Facility by US$200.0 million, and the total Macao Credit Facility to US$3.3 billion.

On August 12, 2009, the Macao Credit Facility was amended to, among other things, allow for the Global Offering and modify certain financial covenants and definitions, including increasing the maximum leverage ratio for the quarterly periods through the end of 2010. As part of the amendment, the credit spread increased by 325 basis points, with borrowings bearing interest, at the Group’s option, at either an adjusted Eurodollar rate (or, in the case of the local term loan, adjusted HIBOR) or at an alternate base rate, plus a spread of 5.5% per annum or 4.5% per annum, respectively. In November 2009, in connection with the Global Offering, the Group was required to repay and permanently reduce US$500.0 million of borrowings, on a pro rata basis, under the Macao Credit Facility, and in conjunction with the US$500.0 million repayment, the credit spread was reduced by 100 basis points (set at 4.6% for the Macao Local Term Facility and 4.8% for the remainder of the Macao Credit Facility as of December 31, 2009). As a result of this repayment and the August amendment, the Group recorded a charge of US$6.1 million during the year ended December 31, 2009, for loss on modification or early retirement of debt. Borrowings under the Macao Local Term Facility and the Macao Revolving Facility are subject to downward adjustments if certain consolidated leverage ratios are achieved. As of December 31, 2009, the Group had US$120.4 million of available borrowing capacity under the Macao
67
Sands China Ltd.
Stakeholder Information
Revolving Facility, net of outstanding letters of credit and undrawn amounts committed to be funded by Lehman Brothers Commercial Paper Inc.
(b) Ferry Financing
In January 2008, in order to finance the purchase of ten ferries, which were respectively owned by ten ferry-owning companies that are subsidiaries within the Group, Cotai Ferry Company Limited, a subsidiary within the Group, entered into a HK$1.2 billion (approximately US$156.0 million at exchange rates in effect on December 31, 2009) secured credit facility, which was available for borrowing for up to 18 months after closing. The proceeds from the secured credit facility were used to reimburse the Group for cash spent to date on the construction of the ferries and to finance the completion of the remaining ferries. The facility is collateralized by the ferries and is guaranteed by VML.
In July 2008, the Group exercised the accordion option on the secured credit facility agreement that financed the Group’s original ten ferries and executed a supplement to the secured credit facility agreement. The supplement increased the secured credit facility by an additional HK$561.6 million (approximately US$72.4 million at exchange rates in effect on December 31, 2009), which the Group has fully drawn as of December 31, 2009. The proceeds from this supplemental facility were used to reimburse the Group for cash spent to date on construction of four additional ferries and to finance the remaining progress payments on those ferries. The supplemental facility is collateralized by the additional ferries and is guaranteed by VML. Net book values of the 14 ferries were US$233.8 million as of December 31, 2009 (2008: US$164.0 million).
On August 20, 2009, the ferry financing facility was amended to, among other things, allow for the Global Offering and remove the requirement to comply with all financial covenants. The facility, as amended, now matures in December 2015 and is subject to 26 quarterly payments of HK$68.1 million (approximately US$8.8 million at exchange rates as of December 31, 2009), which commenced in October 2009.
(c) Motor Vehicle Facility
In March 2008, VML entered into a loan agreement (the “Motor Vehicle Facility”) to borrow MOP200.9 million (approximately US$25.1 million at exchange rates in effect on December 31, 2009) for the purposes of financing the purchase of certain motor vehicles. The Motor Vehicle Facility is available for drawdown until December 31, 2010, and any amount undrawn at the expiry of this period will be cancelled. Loans under the Motor Vehicle Facility bear interest at three-month HIBOR plus 2.25% (set at 2.4% per annum as of December 31, 2009 (2008: 3.2%)) with interest payments made quarterly, which began in June 2008. The weighted average interest rate for the facility was 2.9% per annum for the year ended December 31, 2009 (2008: 4.5%). The Motor Vehicle Facility matures in December 2011, with the principal due in four equal installments in 2011.
The Motor Vehicle Facility is collateralized by all the motor vehicles purchased with this loan. Net book values of these vehicles was MOP51.5 million (approximately US$6.5 million at exchange rates as of December 31, 2009) as of December 31, 2009 (2008: US$8.4 million). As of December 31, 2009, the aggregate outstanding principal amount drawn under the Motor Vehicle Facility was MOP88.0 million (approximately US$11.0 million at exchange rates in effect on December 31, 2009).
VOL Credit Facility
In November 2009, Venetian Orient Limited, a wholly- owned indirect subsidiary of the Company, received commitments of US$1.75 billion from a group of commercial banks and financial institutions for the construction Phases I and II of Parcels 5 and 6. We anticipate closing this project financing in April 2010.
68
Annual Report 2009
Stakeholder Information
3.3 Our Customers
Introduction:
Our business strategy is to develop Cotai and to leverage our integrated resort business model to create Asia’s premier gaming, leisure, convention and meetings destination. Our ultimate plans for Cotai include five interconnected resorts that leverage a wide range of branded hotel and resort offerings to attract different segments of the market.
We believe our business strategy and development plan will allow us to achieve more consistent demand, longer average length of stay in our hotels and higher margins than more gaming-centric facilities.
Our Customers:
Our properties are designed to cater to a broad range of customers who include the following:
Leisure customers who visit resort destinations for quality accommodation, retail, dining, entertainment, spas and sightseeing, and those who may opt to game as part of that experience;
Conference and exhibition organizers who seek an environment that attracts more buyers and exhibitors to trade shows and exhibitions because of the size, flexibility, quality and ambiance of the venue, business-friendly accommodation, dining and other resort facilities;
Corporate meeting and incentive group organizers who value the extensive meeting facilities enabling even the largest of meetings to be held under one roof with a wide array of entertainment, dining and retail facilities;
Mass market players who represent the highest profit margin gaming segment, and are characterized by non- rolling chip and slot machine play; and
VIP and premium players, who enjoy our private Paiza Club gaming floors, luxury accommodation and amenities, and are characterized by rolling chip play.
Our customers come predominantly from within Asia, with our major markets being mainland China, Hong Kong, Taiwan, India, Japan, Korea, Thailand, Malaysia, Indonesia and Singapore. Through the implementation of targeted marketing campaigns, we expect to grow many of these markets in the coming year.
We have a strong relationship with travel agents, corporate and exhibition organizers throughout the region for distribution of our leisure products and promotion of our MICE offerings. In addition, we participate in trade shows in source markets to build brand awareness and promote our services and facilities.

69
Sands China Ltd.
Stakeholder Information
Our Products:
Customers enjoy our properties because of the key strengths that differentiate our business from those of our competitors. Our properties are designed in anticipation of the growing acceptance of Las Vegas-style integrated resorts, where visitors seek both a gaming experience and a multi-night resort destination.
Hotels:
We have an array of high-quality room products, managed and operated by either Sands China or the Four Seasons. We offer Paiza Suites and Paiza Mansions to selected VIP and premium players, while simultaneously accommodating the hotel needs of business and leisure travelers with our suites and other room product offerings. We believe that offering a diversified range of products increases the attractiveness of our properties and extends the average length of stay.
Gaming:
The Venetian Macao casino is the world’s largest casino, spanning 550,000 square feet with 599 gaming tables and 2,153 slots. The Plaza Macao, our luxury boutique resort next door, offers 116 table games and 166 slot machines with 70,000 square feet of gaming space. On the Macao peninsula, next to the Macau Ferry Terminal, the Sands Macao casino has 413 gaming tables and 1,172 slots. The total gaming floor area at the Sands Macao is 229,000 square feet.
MICE:
CEI Asia has awarded The Venetian Macao “Best MICE Hotel in Asia” two years in a row since we opened in August 2007. Our 1.2 million square feet of MICE facilities are capable of hosting large trade shows, convention, exhibitions and corporate meetings. Convention and group meeting visitors generate mid-week demand with longer hotel stays, and are a significant source of repeat visitation and non-gaming spending.
Malls:
The Grand Canal Shoppes at The Venetian Macao, together with The Shoppes at Four Seasons, consist of approximately 1.2 million square feet of retail space, which feature a variety of high-end designers such as Cartier, Chanel, Gucci,
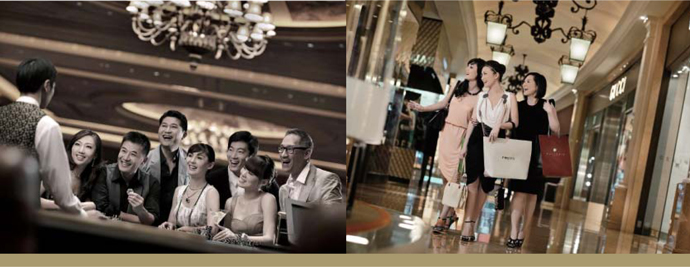
70
Annual Report 2009
Stakeholder Information
Hermes, Louis Vuitton and Prada, and mass appeal retailers such as Calvin Klein, Coach, Diesel, Esprit, Mango and Nike. The malls also have a 1,000-seat food court and more than 60 restaurants and food outlets, including a diverse range of cuisines from around the world. The scope of our retail and dining areas is key to increasing our mass market visitation to Macao and attracting an increased share of this segment to our properties.
Entertainment:
The 15,000-seat CotaiArena™ inside The Venetian Macao hosts world-class sporting events and concerts. Some of the major live events in 2009 included Asia’s most popular singers — S.H.E, Joey Yung and A-Mei; two legendary tennis players — Agassi and Sampras; and major international acts — Lady Gaga and Linkin Park. The Venetian Macao also houses a state-of-the-art 1,800-seat theater for ZAIA™, a show staged by the world-renownedCirque du Soleil®. At the Sands Macao, the Sands Theater hosts its own shows which appeal to gamers and excitement-seekers. For family entertainment, The Venetian Macao features the Qube, a 9,000-square-foot indoor interactive play zone with drop slides and computer games, and also The Manchester United Experience, a two-storey shrine to the Red Devils with fun interactive play zones.
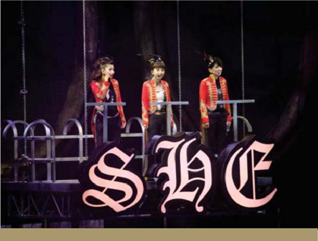
3.4 Our Employees
HR Initiatives
New Opportunities for Local Talent
In an effort to attract local talent, we hold regular recruitment fairs in Macao. In July, a four-day job fair was held at the Sands Recruitment Center and at The Venetian Macao to recruit local residents. Throughout the second half of 2009, more than 17 job fairs were held at The Venetian Macao and the Sands Macao, attracting over 5,000 people.
We also took part in an important job fair organized by the Macao New Chinese Youth Association and Associacao de Estudantes Chong Wa de Macau on August 2, 2009.
As a responsible corporate citizen, we participate in the “On-the-Job Training and Employment Scheme” to actively recruit more than 1,000 local workers. By participating in this program, Sands China provides training to candidates from the Labor Affairs Bureau.
In addition to building our local recruitment force and being a responsible corporate citizen that gives back to the Macao community, we also offer job opportunities to locals who are mentally-challenged. We offer them part-time work in the Human Resources, Conventions and Exhibitions and Food & Beverage departments.
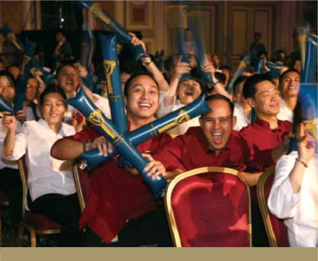
71
Sands China Ltd.
Stakeholder Information
Employee Engagement Programs and Retention Initiatives
The Human Resources team put together a series of employee engagement activities in 2009 to boost confidence and inject fun into the workplace.
Spotlight Asia
In 2009, we publishedSpotlight Asia, a quarterly publication designed to inform our team members about key milestones and activities at our properties in Macao, Singapore and Las Vegas. Printed copies are disseminated throughout The Venetian Macao and the Sands Macao. Digital copies are also made readily available for team members.
Concert Ticket Giveaways
In February 2009, we launched the popular ‘Concert Ticket Giveaway Quiz’ on our back-of-house televisions. Between February and December 2009, more than 5,700 team members have participated in this quiz to win tickets to over 30 concerts.
e-Enquiries
We encourage communication at Sands China so that employees can openly share their views. That’s why in September 2009, our Communications Team launched an e-Enquiry Form for team members to offer their suggestions for improvements, or to ask questions at anytime.
Thanksgiving Day
With the support of the Entertainment and Floral teams, we hosted our first “Thanksgiving Day” to express our thanks for all of the work our team members do for us. Streetmosphere artistes presented roses to team members at back-of-the-house areas at all three of our Macao properties throughout the last week of November.
Career Development and Succession Planning Opportunities
In 2009, the Training and Development team provided training services for team members at The Venetian Macao, the Sands Macao and The Plaza Macao. Training at Sands China offers team members a wide range of opportunities to broaden their knowledge. Various programs include: Orientation, Key To Excellence, Guest Services Programs, Management Training, Language Training and Professional Training. In 2009, a total of 9,876 team members received training, and 227 classes were conducted.
Six Key Programs:
1. Orientation for New Hires
A total of 1,127 team members from various departments attended the new hire orientation. 62 classes were conducted.
2. Key To Excellence Series (KTE) — Superior Guest Service Program
The KTE program is designed for The Venetian Macao, the Sands Macao and The Plaza Macao. There are a series of programs within KTE, including KTE- Train-the-Trainer, Understanding and Application of KTE, KTE promise, Handling Complaints, Selling and Up-Selling, and Service Leadership. KTE is being launched in 3 phases:
| | |
Phase 1 | | 1st Quarter 2009 |
The Venetian Macao | | |
Phase 2 | | 1st Quarter 2010 |
Sands Macao | | |
Phase 3 | | 2nd Quarter 2010 |
The Plaza Macao | | |
A total of 5,539 team members attended the KTE programs. 76 classes were conducted.
3. Guest Services Training
KTE replaced the Guest Services training program during the 2nd quarter of 2009.
A total of 348 team members attended the Guest Services Training. 27 classes were conducted.
4. Management Training
This is a career advancement program for Jr. Managers or first-time Supervisors. Topics include: Principles of Supervisory Management, Service Management, Motivation & Managing Positive Attitude, Communication (Interpersonal Relations), Giving Instructions and Constructive Feedback, Managing Performance, Problem Solving, HR Issues and Handling, Coaching for Performance, Conducting for Appraisal.
A total of 1,270 team members attended the Management Training courses. 17 classes were conducted.
72
Annual Report 2009
Stakeholder Information
5. Language Training
We organized language training sessions across all levels to help team members improve their English, Mandarin and Cantonese language skills. In 2009, a total of 280 team members attended these language courses and 20 classes were conducted.
6. Professional Training
These are special, tailor-made training courses. Topics included: Train-the-Trainer (3 days), Presentation with effective Power Point, Presentation Skills, 5S — Workplace Improvement, PMP Process Improvement and IIFA (Cultural training — Indian etiquette). A total of 1,312 team members attended these courses, and 25 classes were conducted.
7. Talent Development Programs — Building the Pipeline for our Future
Advanced Management and Foundation Management training programs have benefited as many as 71 team members thus far.
2009 Team Member Profile
Number of Full-time Team Members: 15,399
Average Age: 36
Average Years of Service: 3
Gender Ratio: Male 45% Female 55%
Number of Nationalities in the Management Team: 36
Total Number of Nationalities: 54
3.5 Our Commitment to the Community
Introduction
We recognize that we are dependant upon the goodwill, hard work and motivation of our team members, the overwhelming majority of whom have deep roots in the local community. This is an asset, that as employers, we seek to tap for the good of our daily operations but equally it is an energy that should — and does — flow outward to the benefit of the general population.
The Company and our subsidiaries have, to date, actively supported more than 120 entities from various sectors of society with cash donations in excess of MOP34 million; in addition, the Group has underwritten numerous social, sporting and cultural activities that have directly and positively affected the lives of diverse members of the community. While this is a corporate achievement to be proud of, the extra ingredient has been the heartfelt participation of all team members, who in many cases have given large amounts of their own time, as well as money, to serve so many worthy causes.
Sands China will continue to be judged by the responsible attitude of our employees, and we would not have it any other way.
Developing Talent
All formal training programs for inductees and ongoing refresher courses revolve around the company’s
73
Sands China Ltd.
Stakeholder Information
core principles — commitment to excellence, exceeding expectations, innovation, trust and respect, and one team working together. These personal qualities are diligently cultivated in our professionals and transfer naturally to Sands China team members’ activities within the community.
One way the company has achieved this is through the funding of the Adelson Advanced Education Center — a MOP100 million project over three years that aims to promote the advancement of training and education in non-gaming business disciplines for local talent. The 15,500-square-foot offsite campus for University of Macau students, located at The Venetian Macao, offers advanced management courses and a non-gaming curriculum in tourism-related areas such as MICE, Hospitality, Entertainment and Integrated Resort & Retail, which are all critical growth areas for Macao.
Sands China also recognizes that scholarships and fellowships are the seeds for growing not only prospective future business leaders but good citizens who benefit the entire community; consequently, the company has invested continuously in education initiatives since the 2006 academic year.
Beneficiaries of Sands China’s commitment to the development of local talent include the University of Macau, Macau University of Science and Technology, Macau Polytechnic Institute, and Institute for Tourism Studies. For the academic year 2009, the company contributed over MOP500,000 worth of scholarship funds to more than 85 students.
Donations to Charity
The most direct way to help those in need is to donate money and goods, and this represents a substantial part of Sands China’s community activities. The company is involved in a wide range of ‘direct aid’ programs — some of them on a ‘one-off’ basis such as disaster relief, and others on a continuing basis of ‘local partnership’. Direct donations to organizations supporting the elderly and infirm, the mentally disabled, those in various forms of rehabilitation, the abused and children’s charities are high on the list of the 56 organizations that received in total over MOP3 million in 2009 from Sands China and our subsidiaries.
In addition, the company utilizes the ‘lucky’ coins regularly dredged from The Venetian Macao canals to support the venerable Tung Sin Tong Charitable Society. Last year, more than MOP130,000 was contributed to this worthy cause.
Non-financial contributions by the company are numerous and diverse. Over 220 boxes of second-hand clothes, which were left behind by our hotel guests, were gratefully received by the Salvation Army, for the benefit of the needy in Macao and China in 2009, while a similar number of boxes of miscellaneous items have been donated over the same period by Sands Macao and The Venetian Macao to the Association for Rehabilitation of Drug Abusers of
74
Annual Report 2009
Stakeholder Information
Macao, the Macao Federation of Trade Unions, and Caritas Macao.
There are indeed many ways of contributing, and some are downright fun, both in the giving and receiving. An increasingly large part of our product mix is entertainment, with some of the biggest names in the Western and Chinese entertainment world gracing the CotaiArena™ stage. While many of these high profile shows, events and concerts are sell-out affairs, we are more than happy to give the underprivileged the chance of a lifetime to see some of the biggest stars. More than 2,000 local residents — both young and old — have enjoyed tennis games and great concerts throughout the year 2009.
Community Outreach — Sands China Care Ambassadors
The community outreach activities that the company engages in are numerous and varied, but they all share the common objective of touching lives that are often challenged. Children, the elderly and the vulnerable are regular participants in such activities and are often the ultimate beneficiaries. Sands China is proud to participate in many community outreach events — a Chinese New Year party for 99 elderly; a Mother’s Day celebration with 33 single parent families; the distribution of 2,000 gifts to community centers for Children’s Day and a Christmas dance party for 100 kids and more. The company also takes profound pleasure in its community character-building programs, such as children’s summer camps and days out at fun Venetian venues such as Qube and the Manchester United Experience; programs that benefit orphans and the mentally handicapped.
There would be no meaningful community outreach, of course, if it was not for the hundreds of Sands China team members who take it upon themselves to get involved, often on their own time. While the company strongly encourages this community spirit, it is the team members who roll up their sleeves for dozens of projects such as the ‘One Day Volunteer’, in which the Sands China Care Ambassadors — formalized as an active community force in 2009 — joined the Youth Volunteers Association of Macao to play and have fun with mentally handicapped children and their families, clean the houses of live-alone elderly and visited others in an Elders Center. In 2009, the Ambassadors, made up of more than 180 volunteers from The Venetian Macao, the Sands Macao and The Plaza Macao (both based in Macao and Hong Kong) performed more than 970 hours of community service.
A Creative Community
Everyone loves a fashion show, and as part of The Shoppes at Four Seasons opening event in August 2008, ten local designers were invited to create outfits themed around ‘The Magic of Luxury’, both to promote Sands China’s upscale entry into branded fashion stores and to encourage Macao designers to aspire to similar heights. The event, co-organized by the Macau Productivity and Technology Transfer Centre (CPTTM), proved a singular success and laid the groundwork for the Macao Fashion Showcase in 2009.
The Macao Fashion Showcase — co-organized by CPTTM, The Venetian Macao and The Shoppes at Four Seasons — was staged from September to October 2009 and showcased the works of 12 local fashion designers at the property. With much more interest in the creative industries in Macao now apparent, the timing of these shows was prescient and has undoubtedly set some young talent in the community on the road to stardom.
While Sands China is dedicated to the future growth of our businesses and our role in the new Macao, we recognize and respect the emotional pull of the past, and it was for this reason that we hosted the “Macao Forever” book launch and photo exhibition in December 2009 to commemorate the 10th Anniversary of the Establishment of the Macao SAR. The opening ceremony was officiated by Mr. Edmund Ho, MSAR Chief Executive, Mr. Li Zhengqiao, Vice Director-General of the Department of Culture and Education from the Liaison Office of the Central People’s Government in the MSAR, Mr. Song Yanbin, Deputy Commissioner of Ministry of Foreign Affairs of the People’s Republic of China in MSAR, and Mr. Manuel Cansado de Carvalho, Consul General of Portugal in HK & Macao. While the photo exhibition at The Venetian Macao traced the city’s dynamic changes over the last decade it also illustrated the rich history and culture of Macao.
75
Sands China Ltd.
Stakeholder Information
Walking for the Community
In addition to the many Chinese and Western events popular with tourists, local residents are recognizing the power of the community and its ability to make a difference. Thus, one of the most important community events in Macao is Walk for a Million, an event funded by the readers of the Macao Daily newspaper that has drawn the community together since 1984. All funds collected are primarily used to either help low income earners in the form of subsidies and scholarships or to provide aid to the general community in times of emergency. For the 26th Walk for a Million in December 2009, some 1,700 Sands China team members participated in the walk, and the Group donated MOP500,000 to the charity.
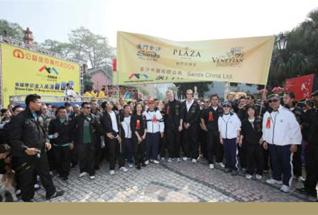
Disaster Relief
In May 2008, a catastrophic earthquake measuring 8 on the Richter scale struck Sichuan Province. Worldwide reaction was immediate and profound, especially by Chinese communities near and far; and for its part, Sands China team members raised a magnificent MOP1.3 million, while the company donated almost MOP7 million in direct relief donations through the Liaison Office of the Central People’s Government in the MSAR.
With schools hit disproportionately hard by the disaster, in 2009 the company funneled an additional MOP2.2 million into the Sichuan Earthquake Education Support Program, that directly supported the studies of 200 Chinese students.
Sands China also donated MOP100,000 to a fundraising music performance for victims of the Taiwan storm disaster of August 2009.
Responsible Gaming Program
Social consequences can arise from problem gambling, and in order to address this issue, our subsidiary, VML, launched a full Responsible Gaming Program on April 17, 2007, with a mandate to widely disseminate information on problem gambling, including assisting vulnerable guests to obtain professional help. The program — undertaken in an ongoing partnership with experts, scholars, doctors and counselling centers — seeks to effectively reduce the incidence of problem gambling by pre-empting such behavior in a proactive and participatory manner. Beyond distributing informative materials to patrons and team members, all new team members are required to attend Responsible Gaming Awareness training as part of their orientation. As a pioneer in combating this social issue in Macao, a “Self Exclusion Program” has also been put in place to assist problem gamblers who request to be denied access to casinos operated by Venetian Macau Limited.
In an effort to further tackle the issue of problem gambling in Macao, a Responsible Gaming Awareness Week was co-organized by the Macao SAR Gaming Inspection and Co-ordination Bureau, the Macao SAR Social Welfare Bureau and the Institute for Study of Commercial Gaming of the University of Macau in October 2009. Sands China participated in this event by distributing informative booklets to all employees, organizing activities and setting up promotional booths in back-of-house areas at our properties.
Sands China has also initiated programs to give away unclaimed jackpots and Lost & Found money to organizations that provide assistance to problem gamblers and their families. Contributions to non-government organizations such as the Macao Catholic Family Advisory Council, the Macau IEF Rehabilitation Centre for Problem Gamblers, the Sheng Kung Hui Macau Social Service Coordination Office, the Good Shepherd Centre and the Young Men’s Christian Association of Macau reached MOP500,000 in total in 2009.
76
Annual Report 2009
Stakeholder Information
3.6 Preserving Our Environment
The Venetian Macao has the distinction of being the largest single-structure hotel building in Asia and is the fourth largest building in the world in terms of floor area. Our energy demands are proportionately large — but so are the opportunities for saving, and Sands China has stepped up to the plate in assuming its responsibilities to conserve the environment by recycling waste generated by our three properties on a daily basis.
We are constantly searching for new ways to use our resources more efficiently, for example, by installing more energy-efficient lighting that in the last calendar year alone saw a 3.7% reduction in the electricity consumption of The Venetian Macao. The company also rigorously pursues a Green Procurement and Supply Chain Policy, which seeks to minimize the impact of its products on the environment while achieving environmental sustainability; in addition, it has ensured that its fleet of coaches, limousines and trucks meets or surpasses Euro 4 stipulations.
In addition to our commitment to sustainable development, the conditions under which our employees, suppliers and contractors work, and our strict compliance code, as enshrined in our Environment, Health and Safety Policy, Sands China is an active participant in community and government environment, health and safety initiatives, one of the foremost of which is the Macao Green Hotel Award program.
The award — organized by the MSAR Environment Council — was first launched in 2007 and seeks to leverage the importance of environmental management and honor hotel establishments that are demonstrably committed to the green cause.
The 2009 award ceremony was held on World Environment Day to recognize the continuous efforts made in energy saving and environmental protection through resource conservation made by The Venetian Macao. Only 12 hotels have been honored as Green Hotels since 2007, assessed against criteria such as Green Leadership and Innovation, Green Program Performance and Partner Synergy.
TheVenetian Macao Energy Savings achieved in 2009
US$ 2 Million
The Venetian Macao Energy Savings Initiatives in 2009
- Improvements in controlling air conditioning
- Improvements in the chillers operation
- Use of energy-savings
- Scheduling the operation of equipment to optimize efficiencies
- Energy Audit at The Venetian Macao
- Energy Audit Training provided to The Venetian Macao team members
77
Sands China Ltd.
Stakeholder Information
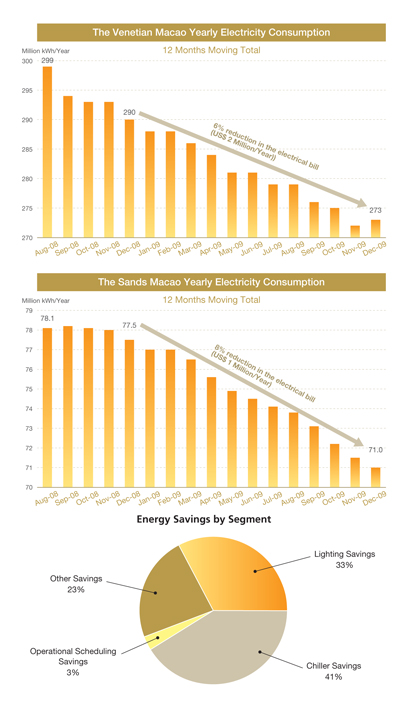
78
Annual Report 2009
Corporate Governance
4.1 Corporate Governance Report
The Board of the Company is pleased to present this Corporate Governance Report for the year ended December 31, 2009.
Corporate Governance Practices
The Group is committed to achieving high standards of corporate governance to safeguard the interests of shareholders and to enhance corporate value and accountability. The Group also acknowledges the vital importance of good corporate governance to the Group’s success and sustainability.
The Company has devised its own corporate governance guidelines, which incorporate most of the policies, principles and practices set out in the Code on Corporate Governance Practices (the “CG Code”) contained in Appendix 14 of the Rules Governing the Listing of Securities on the Stock Exchange (the “Listing Rules”).
The Board is of the view that throughout the period from the Listing Date to December 31, 2009, the Company has complied with the code provisions and certain recommended best practices set out in the CG Code, save for the deviations from code provisions A.1.1, A.1.7, C.2.1, C.2.2, D.1.2 and D.2.2, which deviations are explained in the relevant paragraphs of this Report.
The Company is committed to enhancing its corporate governance practices appropriate to the conduct and growth of its business, and to reviewing such practices from time to time to ensure that they comply with statutory and professional standards and align with the latest developments.
The Board
Responsibilities
The Board is responsible for leadership and control of the Company and oversees the Group’s businesses, strategic decisions and performance. The Board has delegated to the Chief Executive Officer, and through him, to the senior management, the authority and responsibility for the day-to-day management and operation of the Group. In addition, the Board has established Board committees and has delegated to these Board committees various responsibilities as set out in their respective terms of reference.
All Directors carry out their duties in good faith, in compliance with applicable laws and regulations, and in the interests of the Company and its shareholders at all times.
The Company adopted the recommended best practices under the CG Code to arrange for appropriate insurance cover for Directors’ and officers’ liabilities in respect of legal actions against the Directors and senior management arising out of corporate activities.
Board Composition
The Board currently comprises 8 members, consisting of two Executive Directors, three Non-Executive Directors and three Independent Non-Executive Directors. The following chart illustrates the structure and membership of the Board and the Board Committees:
Board of Directors
Executive Directors
| | |
| Mr. Steven Craig Jacobs | | Chief Executive Officer and President |
| |
| Mr. Stephen John Weaver | | Chief Development Officer |
| |
| Non-Executive Directors | | |
| |
| Mr. Sheldon Gary Adelson | | Chairman |
| |
| Mr. Jeffrey Howard Schwartz | | |
| |
| Mr. Irwin Abe Siegel | | |
Independent Non-Executive Directors
| | |
| Mr. Iain Ferguson Bruce | | |
| |
| Ms. Chiang Yun | | |
| |
| Mr. David Muir Turnbull | | |
79
Sands China Ltd.
Corporate Governance
Committees
Audit Committee
| | |
| Mr. Iain Ferguson Bruce | | Chairman |
| |
| Mr. Irwin Abe Siegel | | |
| |
| Ms. Chiang Yun | | |
Remuneration Committee
| | |
| Mr. David Muir Turnbull | | Chairman |
| |
| Mr. Iain Ferguson Bruce | | |
| |
| Mr. Jeffrey Howard Schwartz | | |
LVSC Announcements Committee
| | |
| Mr. Steven Craig Jacobs | | Chairman |
| |
| Mr. Iain Ferguson Bruce | | |
| |
| Mr. David Muir Turnbull | | |
The list of Directors (by category) is also disclosed in all corporate communications issued by the Company from time to time pursuant to the Listing Rules. The Independent Non-Executive Directors are expressly identified in all corporate communications pursuant to the Listing Rules.
None of the members of the Board are related to one another.
Our Company was incorporated on July 15, 2009. Three initial Directors were appointed on August 18, 2009, and five additional Directors, including three Independent Non-Executive Directors, were appointed on October 14, 2009. Since then and up to the date of this Report, the Board at all times met the requirements of the Listing Rules relating to the appointment of at least three Independent Non-Executive Directors, with at least one Independent Non-Executive Director possessing appropriate professional qualifications or accounting or related financial management expertise. The Company has also adopted the recommended best practice under the CG Code of having at least one-third of its Board members being Independent Non-Executive Directors.
All Directors, including Non-Executive Directors and Independent Non-Executive Directors, have brought a wide spectrum of valuable business experience, knowledge and professionalism to the Board for its efficient and effective functioning. Through active participation at Board meetings, taking the lead in managing issues involving potential conflicts of interest and serving on Board committees, all Non-Executive Directors contribute to the effective direction of the Company.
The Company has received written annual confirmation from each Independent Non-Executive Director of his/ her independence pursuant to the requirements of the Listing Rules. The Company considers all Independent Non- Executive Directors to be independent in accordance with the independence guidelines as set out in the Listing Rules.
Chairman and Chief Executive Officer
The roles and duties of the Chairman and the Chief Executive Officer of the Company are carried out by different individuals and have been clearly defined in writing.
The Chairman of the Board is Mr. Sheldon Gary Adelson, and the Chief Executive Officer is Mr. Steven Craig Jacobs. The positions of Chairman and Chief Executive Officer are held by separate persons in order to preserve independence and a balance of views and judgment. The Chairman provides leadership and is responsible for the effective functioning of the Board in accordance with good corporate governance practice. The Chief Executive Officer focuses on implementing objectives, policies and strategies approved and delegated by the Board.
Appointment and Re-election of Directors
Each of the Non-executive and Independent Non-Executive Directors of the Company is appointed for a specific term of three years and shall be subject to retirement by rotation at least once every three years.
80
Annual Report 2009
Corporate Governance
In accordance with the Company’s Articles of Association, all Directors of the Company are subject to retirement by rotation at least once every three years, and any new Director appointed to fill a casual vacancy or as an addition to the Board shall submit himself/herself for re- election by shareholders at the first general meeting after appointment.
The procedures and process of appointment, re-election and removal of Directors are laid down in the Company’s Articles of Association.
The Board as a whole is responsible for reviewing the Board composition, developing and formulating the relevant procedures for nomination and appointment of Directors, monitoring the appointment and succession planning of Directors and assessing the independence of Independent Non-Executive Directors. As the Company was only incorporated on July 15, 2009, prior to the listing of its shares on the Stock Exchange on November 30, 2009, nomination procedures and policies for selection of and recommendation for directorships have not yet been adopted. However, the Company is committed to formalizing such procedures and policies in due course.
The Company’s circular dated April 26, 2010 contains detailed information about the Directors retiring and offering for re-election.
Induction and Continuing Development of Directors
Each newly appointed Director receives formal, comprehensive and tailored induction on the first occasion of his/her appointment, to ensure appropriate understanding of the business and operations of the Company and full awareness of Director’s responsibilities and obligations under the Listing Rules and relevant statutory requirements. Such induction is normally supplemented by visits to the Company’s key business sites and meetings with senior management of the Company.
Directors are continually updated on the statutory and regulatory developments and changes in the business and the market, to facilitate the discharge of their responsibilities. Continuing briefing and professional development for Directors will be arranged where necessary.
Board Meetings
Board Practices and Conduct of Meetings
Annual meeting schedules and draft agendas for each meeting are normally made available to Directors in advance. Notice of regular Board meetings is served to all Directors at least 14 days before the meeting. For other Board and committee meetings, reasonable notice is normally given.
Board papers together with all appropriate, complete and reliable information are sent to all Directors at least three days before each Board meeting or committee meeting, to keep Directors apprised of the latest developments and financial position of the Company, and to enable them to make informed decisions. The Board and each Director also have separate and independent access to the senior management where necessary.
The senior management normally attend regular Board meetings and, where necessary, other Board and committee meetings, to advise on business developments, financial and accounting matters, statutory and regulatory compliance, corporate governance and other major aspects of the Company’s operations.
An assigned officer is responsible for taking and keeping minutes of all Board meetings and committee meetings. Draft minutes are normally circulated to Directors for comment within a reasonable time after each meeting, and final versions are open for Directors’ inspection.
81
Sands China Ltd.
Corporate Governance
The Company’s Articles of Association contain provisions requiring Directors to abstain from voting and not to be counted in the quorum at meetings for approving transactions in which such Directors or any of their associates have a material interest.
Directors’ Attendance Records
During the period from July 15, 2009 (date of incorporation) to December 31, 2009, two Board meetings were held. The attendance records of each Director at the Board meetings are set out below:
| | |
Name of Director | | Attendance/
Number of
Board
Meetings |
| |
Mr. Sheldon Gary Adelson | | 2/2 |
Mr. Steven Craig Jacobs | | 2/2 |
Mr. Stephen John Weaver | | 2/2 |
Mr. Jeffrey Howard Schwartz | | 2/2 |
Mr. Irwin Abe Siegel | | 2/2 |
Mr. Iain Ferguson Bruce | | 2/2 |
Ms. Chiang Yun | | 2/2 |
Mr. David Muir Turnbull | | 1/2 |
Following the listing of the Company, the Board will hold Board Meetings at least four times a year at approximately quarterly intervals and when necessary.
Model Code for Securities Transactions
The Company has devised its own securities trading code for securities transactions by the Directors and relevant employees who are likely to be in possession of unpublished price-sensitive information of the Company (the “Company Code”) on terms no less exacting than the Model Code for Securities Transactions by Directors of Listed Issuers (the “Model Code”) as set out in Appendix 10 to the Listing Rules. Specific enquiry has been made of all the Directors and relevant employees. The Directors have confirmed that they have complied with the Company Code and the Model Code throughout the period from the Listing Date to December 31, 2009.
Delegation by the Board
The Board will reserve for its decision all major matters of the Company, including approval and monitoring of all policy matters, overall strategies and budgets, internal control and risk management systems, material transactions (in particular those that may involve conflict of interests), financial information, appointment of Directors and other significant financial and operational matters. The day- to-day management, administration and operation of the Company will be delegated to the Chief Executive Officer and the senior management. The functions and responsibilities being delegated will be subject to periodic review. Due to the short period of time since listing, the Company has not yet formalized the functions reserved to the Board and those delegated to management, but arrangements will be made for the adoption of written terms on division of functions and delegation of authority between the Board and senior management.
82
Annual Report 2009
Corporate Governance
All Directors have full and timely access to all relevant information, as well as the advice and services of the Company Secretary, with a view to ensuring that Board procedures and all applicable laws and regulations are followed. Currently, the Board has not yet agreed on, nor resolved upon any procedure for Directors to seek independent professional advice in appropriate circumstances at the Company’s expense, but is committed to implementing the same shortly.
The Board has established three committees, namely, the Audit Committee, Remuneration Committee and LVSC Announcements Committee, for overseeing particular aspects of the Company’s affairs. All Board committees of the Company are established with defined written terms of reference. The terms of reference of the Audit Committee and Remuneration Committee are posted on the Company’s website, while the terms of reference of the LVSC Announcements Committee are available to shareholders upon request. To conform to the code provision under the CG Code, arrangements will be made to include the requirement to report back to the Board in the terms of reference of the LVSC Announcements Committee in due course.
Remuneration of Directors and Senior Management
The Company has established a formal and transparent procedure for formulating policies on remuneration of Directors and senior management of the Group. Details of the remuneration of each of the Directors of the Company for the year ended December 31, 2009 are set out in Note 7 to the Consolidated Financial Statements.
Remuneration Committee
The Remuneration Committee comprises two Independent Non-Executive Directors, namely Mr. David Muir Turnbull (Chairman) and Mr. Iain Ferguson Bruce and one Non- Executive Director, namely Jeffrey Howard Schwartz.
The roles and functions of the Remuneration Committee are set out in its terms of reference. Its primary objectives include making recommendations on and approving the remuneration policy and structure and remuneration packages of the Executive Directors and the senior management. The Remuneration Committee is also responsible for establishing transparent procedures for developing such remuneration policies and structures so as to ensure that no Director or any of his/her associates will participate in deciding his/her own remuneration, which remuneration will be determined by reference to the performance of the individual and the Company as well as market practice and conditions.
The Human Resources Department is responsible for collection and administration of the human resources data, and making recommendations to the Remuneration Committee for consideration. The Remuneration Committee consults with the Chairman of the Board/ the Chief Executive Officer of the Company about these recommendations on remuneration policy and structure and remuneration packages.
The Remuneration Committee has reviewed the remuneration policy and structure of the Company, and the remuneration packages as well as the annual bonuses of the Executive Directors and the senior management for the year ended December 31, 2009.
83
Sands China Ltd.
Corporate Governance
During the period from July 15, 2009 (date of incorporation) to December 31, 2009, no meeting of the Remuneration Committee was held. Going forward, the Remuneration Committee shall meet at least once a year to review remuneration policy and structure, and determine the annual remuneration packages of the Executive Directors and the senior management and other related matters.
Further details of the Remuneration Committee are set out in the Remuneration Committee Report on page 88.
Accountability and Audit
Directors’ Responsibilities for Financial Reporting in respect of Financial Statements
The Directors acknowledge their responsibility for preparing the financial statements of the Company for the year ended December 31, 2009.
The Board is responsible for presenting a balanced, clear and understandable assessment of annual and interim reports, price-sensitive announcements and other disclosures required under the Listing Rules and other statutory and regulatory requirements. The management has provided to the Board such explanation and information as are necessary to enable the Board to carry out an informed assessment of the Company’s financial statements, which are put to the Board for approval.
There are no material uncertainties relating to events or conditions that may cast significant doubt on the Company’s ability to continue as a going concern.
Quarterly Reporting
The Company has adopted the recommended best practices under the CG Code to announce and publish quarterly financial results within 45 days after the end of the relevant quarter. As disclosed in our Prospectus, our ultimate parent company, LVS, as a United States Securities Exchange Act 1934 reporting company, is required to file quarterly financial reports with the United States Securities and Exchange Commission. When LVS releases its press release relating to its quarterly financial information (which will contain financial information about the Macao operations of LVS, which Macao operations are owned by the Company) in the U.S., the Company will simultaneously make a Rule 13.09 announcement extracting key highlights of the press release pertaining to the Group. The financial information relating to the Group contained in such press release will be presented in U.S. GAAP and there will not be any reconciliation of such financial information with IFRS. When LVS files its quarterly financial report (which will contain financial information about the Macao operations of LVS, which Macao operations are owned by the Company) on Form 10-Q, approximately two weeks after the release of its quarterly financial information, the Company will make a Rule 13.09 announcement attaching a copy of such Form 10-Q, which will contain financial information relating to the Group presented in U.S. GAAP, and the Company will also simultaneously announce the Company’s quarterly financial information presented in IFRS.
Internal Controls
The Board is responsible for maintaining an adequate internal control system to safeguard shareholder investments and Company assets, and reviewing the effectiveness of such system on an annual basis. The Board is committed to conduct at least annually a review of the effectiveness of the internal control system of the Company, including the adequacy of resources, qualifications and experience of staff of the Company’s accounting and financial reporting function, and their training programs and budget.
84
Annual Report 2009
Corporate Governance
The internal control system of the Group is designed to facilitate effective and efficient operations; to ensure reliability of financial reporting and compliance with applicable laws and regulations; to identify and manage potential risks; and to safeguard assets of the Group.
Department heads are responsible for their daily operations and manage the operational and business risks. Standard Operating Procedures and Internal Control Systems are established at all levels and all functions of the organization to assist management to proactively manage and mitigate significant risks, and carry out Company directives.
The Company has a well-established Section 404 compliance program in response to the Sarbanes-Oxley Act of 2002, by means of which department heads maintain all internal control documentation. Internal Audit, in coordination with PwC, performs walk-through, designs and executes test plans to validate the control processes. Deficiencies, if any, are evaluated and rectified in a timely manner.
The Internal Audit Department provides reasonable assurance to the Company’s internal control with respect to the statutory compliance audits and risk-based operational audits, including but not limited to gaming operations, Cage & Count, IT audits as well as other gaming and non-gaming operational areas.
Internal Audit and senior management shall review and evaluate the control process, monitor any risk factors on a regular basis, and report to the Audit Committee on any findings and measures to address the variances and identified risks.
Updates on Anti-Money Laundering (“AML”) Controls
VML has had controls in place designed to detect and prevent money laundering in casino and gaming operations since May 2004. For detailed coverage of the AML policies, please refer to the Section on Internal Controls and Anti- Money Laundering in our Prospectus.
The Company’s AML policies are reviewed and updated on a regular basis, due to industry demands and regulatory requirements, to ensure continuous regulatory compliance and to help deliver the AML control message to the relevant employees.
Audit Committee
We established an Audit Committee on October 14, 2009, effective from the Listing Date, with written terms of reference in compliance with the Listing Rules. The primary duties of the Audit Committee are to review and supervise our financial reporting process and internal control systems, to nominate and monitor external auditors, and to perform other duties and responsibilities as assigned by the Board.
Details of the Audit Committee are set out in the Audit Committee Report on page 87.
85
Sands China Ltd.
Corporate Governance
External Auditors and Auditors’ Remuneration
The statement of the external auditors of the Company about their reporting responsibilities for the financial statements is set out in the “Independent Auditor’s Report” on page 104.
During the year ended December 31, 2009, the remuneration paid to the Company’s external auditors, PwC, is set out below:
| | |
Type of Services | | Amount of Fees
Payable/Paid
(US$’000) |
| |
Audit Services | | |
— initial public offering | | 2,748 |
— annual audit | | 1,238 |
| |
Non-audit Services | | |
— advisory services related to internal controls and anti-money laundering procedures | | 235 |
— Others | | 28 |
| | |
| |
Total | | 4,249 |
| | |
Communications with Shareholders and Investor Relations
The Company considers that effective communication with shareholders is essential for good investor relations and investor understanding of the Group’s business performance and strategies. The Company also recognizes the importance of transparency and timely disclosure of corporate information, which will enable shareholders and investors to make the best investment decisions.
The general meetings of the Company provide a forum for communication between the Board and the shareholders. The Chairman of the Board as well as Chairman and/or other members of the Audit Committee, Remuneration Committee and LVSC Announcements Committee will attend the annual general meetings and other shareholders’ meetings of the Company to answer questions raised at the meetings.
To promote effective communication, the Company maintains a website at www.sandschinaltd.com, where up-to-date information and updates on the Company’s financial information, corporate governance practices and other information are available for public access.
Shareholder Rights
To safeguard shareholder interests and rights, a separate resolution will be proposed for each substantially separate issue at shareholder meetings, including the election of Directors.
All resolutions put forward at shareholder meetings will be voted on by poll pursuant to the Listing Rules, and poll results will be posted on the websites of the Company and of the Stock Exchange after each shareholder meeting.
4.2 Risk Management Report
All Sands China’s activities involve, to varying degrees, the measurement, evaluation, acceptance and management of risks or combinations of risks. The most important categories of risk that the Company is exposed to are financial risk, credit risk, market risk and operational risks in various forms.
Sands China’s Enterprise Risk Management framework involves identifying events or circumstances relevant to our objectives, assessing them in terms of likelihood and magnitude of impact, determining the response strategy,
86
Annual Report 2009
Corporate Governance
and monitoring. By identifying and proactively addressing risks and opportunities, we protect and create value for our stakeholders, customers, employees, regulators, and society overall. Monitoring is performed by management as part of our internal control activities, including review of analytical reports and management committee meetings with relevant experts, to understand how the risk response strategy is working and whether the objectives are being achieved.
The risk management framework established by the Company fosters the continuous monitoring of the risk environment and an integrated evaluation of risks and their interactions. The Board is responsible for maintaining a sound and effective internal control system for the Company, to achieve its business objectives and manage business risks to safeguard the interest of the shareholders and its assets. Under authority delegated by the Board, the Company’s management formulates high-level Company risk management policies, exercises delegated authority, and oversees the implementation of risk management and controls. It monitors all categories of risk, receives reports on performance and emerging issues, determines action to be taken, and reviews the efficiency of Sands China’s risk management framework.
Our risk-based approach to managing the Company has integrated the concepts of strategic planning, operations management and internal control. Sands China’s Internal Audit function performs annual risk assessment in order to develop a plan for audit involvement. This involves review of the various risk assessments performed by the Company, including strategic plans and SOX top- down risk assessment, consideration of prior audits, and interviews with a variety of senior management. Periodic risk-based operating audits based on the Audit Plan are undertaken by Internal Audit to perform reviews on the effectiveness of the Company’s system of internal controls, including financial, operational and compliance controls and risk management functions of the Company’s business operations. Internal Audit has played an important role in evaluating the risk management processes of the Company and advocating their continued improvement.
4.3 Audit Committee Report
The Audit Committee comprises two Independent Non- Executive Directors, namely Mr. Iain Ferguson Bruce (Chairman) and Ms. Chiang Yun and one Non-Executive Director, namely Mr. Irwin Abe Siegel. Mr. Iain Ferguson Bruce, being the Chairman of the Audit Committee, possesses the appropriate professional qualifications or accounting or related financial management expertise. None of the members of the Audit Committee is a former partner of the Company’s existing external auditors.
The main duties of the Audit Committee include the following:
| | • | | To review the financial statements and reports and consider any significant or unusual items raised by the financial officers, internal auditor or external auditors before submission to the Board |
| | • | | To review the relationship with the external auditors with reference to the work performed by the auditors, their fees and terms of engagement, and make recommendations to the Board on the appointment, re-appointment and removal of external auditors |
| | • | | To review the adequacy and effectiveness of the Company’s financial reporting system, internal control system and risk management system and associated procedures. |
The Audit Committee oversees the internal control system of the Group, reports to the Board on any material issues, and makes recommendations to the Board.
Summary of Work Done
The Audit Committee has reviewed the Group’s annual results and annual report for the year ended December 31, 2009, the financial reporting and compliance procedures, the report of the Internal Auditor on the Company’s internal control and risk management systems and processes, and the re-appointment of the external auditors.
87
Sands China Ltd.
Corporate Governance
During the period from July 15, 2009 (date of incorporation) to December 31, 2009, one meeting of the Audit Committee was held at which all members of the Committee were in attendance. Going forward, the Audit Committee shall meet regularly to discharge its responsibilities.
External Auditors
PwC were reappointed independent auditors of the Company for 2009. PwC audits all companies in the Group that require statutory audit opinions. Having reviewed PwC’s performance during 2009 and satisfied itself of their continuing independence and objectivity within the context of applicable regulatory requirements, the Committee has recommended to the Board the reappointment of PwC as independent auditors at the forthcoming Annual General Meeting. A resolution to that effect has been included in the Notice of Annual General Meeting.
Iain Ferguson Bruce
Chairman, Audit Committee
Hong Kong, April 14, 2010
4.4 Remuneration Committee Report
The Remuneration Committee
We established a Remuneration Committee on October 14, 2009, effective from the Listing Date, with written terms of reference in compliance with Listing Rules. The primary duties of the Remuneration Committee are to evaluate and make recommendations to our Board regarding the remuneration of our Directors and senior management.
The Remuneration Committee comprises two Independent Non-Executive Directors, namely Mr. David Muir Turnbull (Chairman) and Mr. Iain Ferguson Bruce and one Non- Executive Director, namely Mr. Jeffrey Howard Schwartz.
During the period from July 15, 2009 (date of incorporation) to December 31, 2009, no meetings of the Remuneration Committee were held. Going forward, the Remuneration Committee shall meet regularly to discharge its responsibilities.
Total Director’s Remuneration in 2009
The total remuneration of the Directors in 2009 was:
| | | | |
| | | 2009
US$’000 | | 2008
US$’000 |
| | |
Fees | | 59 | | — |
Base compensation, bonuses, allowances and benefits in kind | | 2,756 | | 1,387 |
Share-based compensation benefits | | 2,961 | | 1,247 |
| | | | |
| | |
| | 5,776 | | 2,634 |
| | | | |
In 2009, the Non-Executive Directors received or will receive US$59 thousand fees in respect of their services to the Company during the year (2008: nil).
No emoluments were paid to any Directors as an inducement to join or upon joining the Group or as compensation for loss of office during the year (2008: nil).
88
Annual Report 2009
Corporate Governance
Executive Directors — Remuneration in 2009
The remuneration paid to the Executive Directors of the Company in 2009 was as follows:
| | | | | | | | | | | | |
Year ended December 31, 2009 | | Fees
US$’000 | | Salaries,
discretionary
bonuses,
allowance
and benefits
in kind
US$’000 | | Contribution
to defined
contribution
benefit plans
US$’000 | | Subtotal
US$’000 | | Share-based
compensation
benefits
US$’000 | | Total
US$’000 |
| | | | | | |
Executive Directors | | | | | | | | | | | | |
Steven Craig Jacobs | | — | | 1,389 | | — | | 1,389 | | 2,137 | | 3,526 |
Stephen John Weaver | | — | | 1,367 | | — | | 1,367 | | 824 | | 2,191 |
| | | | | | | | | | | | |
| | — | | 2,756 | | — | | 2,756 | | 2,961 | | 5,717 |
| | | | | | | | | | | | |
Share Option Scheme
There were no share options nor other share-based awards granted to Eligible Persons in 2009 under our Share Option Scheme. For information concerning our Share Option Scheme, please see page 100.
David Muir Turnbull
Chairman, Remuneration Committee
Hong Kong, April 14, 2010
4.5 Director’s Report
The Directors are pleased to present their report together with the audited Consolidated Financial Statements for the year ended December 31, 2009.
Principal Activities
The principal activity of the Company is investment holding and the principal activities of our subsidiaries are the development and operation of integrated resorts in Macao, which contain not only gaming areas but also meeting space, convention and exhibition halls, retail and dining areas and entertainment venues.
Consolidated Financial Statements
The Consolidated Financial Statements of the Group for the year ended December 31, 2009 are set out on pages 106 to 190 of this annual report.
The Board does not recommend the payment of a dividend for the year ended December 31, 2009.
Performance
Share Capital
Details of movements in the share capital of the Company during the year are set out in Note 25 to the Consolidated Financial Statements.
Purchase, Sale or Redemption of the Company’s Listed Shares
Save and except the sale of the Shares pursuant to the Global Offering and the Company’s corporate reorganization as described in the Company’s propectus dated November 16, 2009, neither the Company, nor any of its subsidiaries purchased, sold or redeemed any of the Shares during the year ended December 31, 2009.
89
Sands China Ltd.
Corporate Governance
Reserves
As of December 31, 2009, the Group had a total of approximately US$3,605 million in reserves. Movements in the reserves of the Group during the year are set out in the Consolidated Statement of Changes in Equity on page 113 of this Annual Report.
Fixed Assets
Details of movements in the fixed assets of the Group are shown under Note 15 to the Consolidated Financial Statements.
Bank Loans and Other Borrowings
The total borrowings of the Group as of December 31, 2009 amounted to US$2,819.3 million (2008: US$3,643.2 million).
Particulars of borrowings are set out in Note 28 to the Consolidated Financial Statements.
Finance Costs Capitalized
Finance costs amounting to US$12.4 million (2008: US$82.3 million) were capitalized by the Group during the year as set out in Note 9 to the Consolidated Financial Statements.
Donations
Donations by the Group for charitable and other purposes amounted to US$0.4 million (2008: US$1.6 million).
Financial Summary
A summary of the results for the year and of the assets and liabilities of the Group as of December 31, 2009 and for the previous three financial years are set out on page 191 of this Annual Report.
Directors
The Directors of the Company during the year and as of the date of this annual report are:
| | | | |
Executive Directors | | | | |
| | |
| Steven Craig Jacobs(3) | | Chief Executive Officer, President | | Appointed August 18, 2009 |
| | |
| Stephen John Weaver | | Chief Development Officer | | Appointed August 18, 2009 |
| | |
Non-Executive Directors | | | | |
| | |
| Sheldon Gary Adelson | | Chairman | | Appointed August 18, 2009 |
| | |
| Jeffrey Howard Schwartz(2) | | | | Appointed October 14, 2009 |
| | |
| Irwin Abe Siegel(1) | | | | Appointed October 14, 2009 |
| | |
Independent Non-Executive Directors | | | | |
| | |
| Iain Ferguson Bruce(1)(2)(3) | | | | Appointed October 14, 2009 |
| | |
| Chiang Yun(1) | | | | Appointed October 14, 2009 |
| | |
| David Muir Turnbull(2)(3) | | | | Appointed October 14, 2009 |
Notes:
| (1) | Audit Committee Members |
| (2) | Remuneration Committee Members |
| (3) | LVS Announcements Committee Members |
90
Annual Report 2009
Corporate Governance
Under the terms of the Company’s Articles of Association, one third of the Directors for the time being (or, if their number is not a multiple of three (3), the number nearest to but not less than one third) shall retire from office by rotation and every Director shall be subject to retirement at least once every three years. Mr. Steven Craig Jacobs, Mr. Stephen John Weaver and Mr. Sheldon Gary Adelson will retire from office by rotation at the forthcoming annual general meeting. Mr. Steven Craig Jacobs and Mr. Sheldon Gary Adelson, being eligible, will offer themselves for re- election at the forthcoming annual general meeting. Mr. Stephen John Weaver will not offer himself for re-election.
According to the independence guidelines under the Listing Rules, the Company has received annual confirmation of their independence from each Independent Non-Executive Director, and the Company continues to consider such Directors as independent.
Directors’ Service Contracts
Each of the Non-Executive and Independent Non-Executive Directors of the Company is appointed for a term of 3 years. The appointment may be terminated by either the Company or the Director on not less than one month’s written notice. The Directors shall retire by rotation and be eligible for re-election in accordance with the Articles of Association of the Company.
None of the Directors offering themselves for re-election at the forthcoming annual general meeting has a service contract with the Company which is not determinable by the Company within one year without payment of compensation (other than statutory compensation).
With the exception of the continuing connected transactions disclosed herein, no contracts of significance in relation to the Group’s business to which the Company or any of its fellow subsidiaries was a party and in which a Director of the Company had a material interest, whether directly or indirectly, subsisted during or at the end of the financial year ended December 31, 2009.
For the year ended December 31, 2009, details of remuneration of the Directors and Senior Management are set out in Note 7 to the Consolidated Financial Statements.
Management Contracts
No contracts, other than employment contracts, concerning the management and/or administration of the whole or any substantial part of the business of the Company were entered into or existed during the year.
Interests of Directors and Chief Executive
The interests/short positions of each of the Directors and Chief Executive in the shares, underlying shares and debentures of the Company and any of the Company’s associated corporations (within the meaning of the Securities and Futures Ordinance) as of December 31, 2009, as recorded in the register required to be kept under Section 352 of Part XV of the Securities and Futures Ordinance, are set out in the table and explanatory notes below:
1. Aggregate long position in the shares, underlying shares and debentures of the Company and its associated corporations
The interests of Directors and the Chief Executive in the shares, underlying shares and debentures of the Company and its associated corporations as of December 31, 2009 were as follows:
| | | | | | | | | | |
Name of Director | | Company | | Nature of interest | | Number of securities | | | Approximate
percentage
of
shareholding
interest | |
| | | | |
| Mr. Sheldon Gary Adelson | | Company | | Interest in a controlled corporation | | 5,657,814,885 | (L) | | 70.3 | % |
91
Sands China Ltd.
Corporate Governance
| | | | | | | | | | |
Name of Director | | Associated
Corporation | | Nature of interest | | Number of securities | | | Approximate
percentage
of
shareholding
interest | |
| | | | |
| Mr. Sheldon Gary Adelson | | LVS | | Beneficial owner | | 185,593,046 | (L)(1) | | 28.10 | % |
| | LVS | | Family interest | | 246,345,002 | (L)(2) | | 37.31 | % |
| | | | | | 5,250,000 | (L)(3) | | 56.21 | % |
| Mr. Jeffrey Howard Schwartz | | LVS | | Beneficial owner | | 87,912 | (L)(4) | | 0.01 | % |
| Mr. Irwin Abe Siegel | | LVS | | Beneficial owner | | 24,865 | (L)(5) | | 0.004 | % |
| Mr. Steven Craig Jacobs | | LVS | | Beneficial owner | | 825,000 | (L)(6) | | 0.12 | % |
| Mr. Stephen John Weaver | | LVS | | Beneficial owner | | 375,000 | (L)(7) | | 0.06 | % |
The letter “L” denotes the person’s long position in such securities.
| (1) | This amount includes (a) 100 shares of LVS’s common stock, (b) 5,948 unvested shares of restricted stock, (c) 91,832 vested and exercisable options to purchase 91,832 shares of LVS’s common stock, (d) 22,758,765 shares of LVS’s common stock held by the Sheldon G. Adelson 2005 Family Trust over which Mr. Adelson, as trustee, retains sole dispositive and voting control, (e) 582,280 shares of LVS’s common stock owned by the Dr. Miriam and Sheldon G. Adelson Charitable Trust over which Mr. Adelson, as trustee, retains sole voting and dispositive power, (f) 16,802,047 shares of LVS’s common stock owned by the Sheldon G. Adelson November 2008 Two Year LVS Annuity Trust over which Mr. Adelson, as trustee, retains sole dispositive control, (g) 48,764,841 shares of LVS’s common stock owned by the Sheldon G. Adelson December 2008 Three Year LVS Annuity Trust over which Mr. Adelson, as trustee, retains sole dispositive control, (h) 11,977,704 shares of LVS’s common stock owned by the Sheldon G. Adelson February 2009 Two Year LVS Annuity Trust over which Mr. Adelson, as trustee, retains sole dispositive control, (i) 23,955,408 shares of LVS’s common stock owned by the Sheldon G. Adelson February 2009 Three Year LVS Annuity Trust over which Mr. Adelson, as trustee, retains sole dispositive control, (j) 30,000,000 shares of LVS’s common stock owned by the Sheldon G. Adelson October 2009 Two Year LVS Annuity Trust over which Mr. Adelson, as trustee, retains sole dispositive control, (k) 30,000,000 shares of LVS’s common stock held by the Sheldon G. Adelson October 2009 Three Year LVS Annuity Trust over which Mr. Adelson, as trustee, retains sole dispositive control, and 654,121 unvested options to purchase 654,121 shares of LVS’s common stock. Mr. Adelson and his wife together are entitled to control the exercise of one-third or more of the voting power at stockholders’ meetings of LVS. LVS’s interests in our Company are set out below. |
| (2) | This amount includes (a) 86,363,636 shares of LVS’s common stock held by Dr. Miriam Adelson, (b) 13,692,516 shares of LVS’s common stock held by the ESBT S Trust over which Dr. Adelson, as trustee, retains sole voting control, (c) 13,692,516 shares of LVS’s common stock held by the ESBT Y Trust over which Dr. Adelson, as trustee, retains sole voting control, (d) 13,692,517 shares of LVS’s common stock held by the QSST A Trust over which Dr. Adelson, as trustee, retains sole voting control, (e) 13,692,517 shares of LVS’s common stock held by the QSST M Trust over which Dr. Adelson, as trustee, retains sole voting control, (f) 5,144,415 shares of LVS’s common stock held by the Sheldon G. Adelson 2004 Remainder Trust over which Dr. Adelson, as trustee, retains sole voting control, (g) 12,566,710 shares of LVS’s common stock owned by Adfam Investment Company LLC over which Dr. Adelson, as co-manager, shares voting and dispositive control with Mr. Adelson and (h) warrants to purchase 87,500,175 shares of LVS’s common stock that are exercisable. |
| (3) | Dr. Adelson holds 5,250,000 shares of preferred stock. |
| (4) | This amount includes (a) 5,268 unvested shares of restricted stock and (b) 82,644 unvested options to purchase 82,644 shares of LVS’s common stock. |
| (5) | This amount includes (a) 1,000 shares of LVS’s common stock, (b) 8,765 shares of restricted stock, of which 3,497 shares are vested and (c) 15,100 options to purchase 15,100 shares of LVS’s common stock, of which 8,080 options are vested and exercisable. |
| (6) | This amount includes (a) 250,000 shares of LVS’s common stock and (b) 575,000 unvested options to purchase 575,000 shares of LVS’s common stock. |
| (7) | This amount includes (a) 268,750 options to purchase 268,750 shares of LVS’s common stock, of which 26,250 options are vested and exercisable, and (b) 106,250 vested and exercisable options to purchase 106,250 shares of LVS’ common stock. |
92
Annual Report 2009
Corporate Governance
2. Aggregate short position in the shares, underlying shares and debentures of the Company and its associated corporations
None of the Directors or the Chief Executive had short positions in respect of shares, underlying shares and debentures of the Company and its associated corporations as of December 31, 2009.
As of December 31, 2009, none of the Directors nor the Chief Executive of the Company (including their spouses and children under 18 years of age) had any interest in, or had been granted, or exercised, any rights to subscribe for Shares (or warrants or debentures, if applicable) of the Company and its associated corporations within the meaning of the SFO.
Interests of Substantial Shareholders
The interests/short positions of substantial shareholders in the shares and underlying shares of the Company as of December 31, 2009, as recorded in the register required to be kept under Section 336 of Part XV of the Securities and Futures Ordinance, are set out in the table and explanatory notes below:
1. Aggregate long position in the shares and underlying shares of the Company
The Company had been notified of the following substantial shareholders’ interests in the shares as of December 31, 2009.
| | | | | |
Name of substantial shareholder | | Number of
shares interested | | % of issued
share capital | |
| | |
Sheldon Gary Adelson | | 5,657,814,885 | | 70.30 | (L) |
Las Vegas Sands Corp. | | 5,657,814,885 | | 70.30 | (L) |
Las Vegas Sands, LLC | | 5,657,814,885 | | 70.30 | (L) |
Venetian Casino Resort, LLC | | 5,657,814,885 | | 70.30 | (L) |
LVS (Nevada) International Holdings, Inc. | | 5,657,814,885 | | 70.30 | (L) |
LVS Dutch Finance CV | | 5,657,814,885 | | 70.30 | (L) |
LVS Dutch Holding BV | | 5,657,814,885 | | 70.30 | (L) |
LVS Dutch Intermediate Holding BV | | 5,657,814,885 | | 70.30 | (L) |
Venetian Venture Development Intermediate I | | 5,657,814,885 | | 70.30 | (L) |
Venetian Venture Development Intermediate II | | 5,657,814,885 | | 70.30 | (L) |
93
Sands China Ltd.
Corporate Governance
2. Aggregate short position in the shares and underlying shares of the Company
As of December 31, 2009, the Company had not been notified of any short positions being held by any substantial shareholder in the shares or underlying shares of the Company.
Interests of Any Other Persons
As of December 31, 2009, the Company had not been notified of any persons other than the substantial shareholders who had interests or short positions in the shares or underlying shares of the Company, which are required to be recorded in the register required to be kept under Section 336 of Part XV of the Securities and Futures Ordinance.
Senior Management
The biographical details of the Senior Management as of the date of this Report are set out on page 13 of this Annual Report.
Major Customers and Suppliers
We depend on our suppliers to provide primarily construction, engineering and consulting services. In the year ended December 31, 2009, our five largest suppliers accounted for approximately 28.45% of our total product and services purchases. In the year ended December 31, 2009, our single largest supplier accounted for approximately 8.11% of our total products and services purchases.
For the year ended December 31, 2009, our top five gaming customers accounted for approximately 23.09% of our gross revenues and our single largest gaming customer accounted for approximately 10.02% of our gross revenues.
Save as disclosed herein, no Director, their associates or shareholders (which to the knowledge of the Directors own more than 5% of our issued share capital) were interested at any time during the year, in our five largest suppliers or customers.
Use of Proceeds
We have and will continue to apply the net proceeds received from our Global Offering in accordance with the plan outlined on page 237 of our Prospectus. Immediately after the listing we repaid US$814.8 million in shareholder loans and intercompany payables outstanding prior to the Global Offering that were owed by us or our subsidiaries to LVS and certain of LVS’s U.S. subsidiaries. We also immediately repaid US$300 million of our Macao Credit Facility. US$500 million will be used in conjunction with supplemental financing to finance the completion of the construction of the integrated resort on Parcels 5 and 6 in our Cotai Strip development in Macao and the remaining US$22.0 million will be used for general corporate purposes. As of December 31, 2009 we had used US$111.9 million for the payment of the development costs of Parcels 5 and 6, primarily related to the initial land premium for Parcels 5 and 6.
Non-Competition Deed with LVS
We entered into a Non-Competition Deed with LVS on November 8, 2009 so as to maintain a clear delineation of the respective businesses of each party with effect from the Listing Date. Please see our Prospectus for additional information on the Non-Competition Deed. Since the Listing Date, there have been no Business Opportunities offered by LVS to us and LVS and its associates have not carried out any business activity nor proposed to carry out any business activity, whether directly or indirectly, which competes or may lead to competition with our Casino Gaming Business. LVS has provided its written declaration in respect of LVS and its subsidiaries’ (other than that which form part of our Group) compliance with the undertakings under the Non-Competition Deed during the year ended December 31, 2009. Our independent non-executive Directors consider that LVS has complied with the terms set out in the Non-Competition Deed during the year ended December 31, 2009.
94
Annual Report 2009
Corporate Governance
Related Party Transactions
Continuing Connected Transactions
The following are continuing connected transactions existing between our Group and the LVS Group in 2009.
I. Continuing Connected Transactions Exempt From Reporting, Announcement and Independent Shareholders’ Approval Requirements Under Listing Rule 14A.33
| 1. | Reciprocal global procurement consultancy services; |
| 2. | Reciprocal transportation and related logistic services; |
| 3. | Reciprocal administrative and logistics services; and |
| 4. | The trademark license agreement dated May 25, 2006 entered into between VML and VCL (as licensees) with LVS, Las Vegas Sands, LLC and Venetian Casino Resort, LLC (as licensors) (the “First Trademark License Agreement”). |
II. Continuing Connected Transactions Exempt From Independent Shareholders’ Approval Requirements but Subject to Reporting and Announcement Requirements Under Listing Rule 14A.34
The following transactions between our Group and the LVS Group are ongoing and are exempt from the independent shareholders’ approval requirements but are subject to the reporting and announcement requirements of Rule 14A.34 of the Listing Rules. At the time of application for listing of our Company’s shares on the Stock Exchange, waivers were granted to our Company from strict compliance with the reporting and announcement requirements.
| 1. | Reciprocal Design, Development and Construction Consultancy Services under the Share Services Agreement |
Our Company and LVS entered into the Shared Services Agreement on November 8, 2009 to regulate their relationship with respect of the provision of certain shared services, namely: reciprocal global procurement consultancy services; reciprocal transportation and related logistics services; reciprocal administrative and logistics services; reciprocal design, development and construction consultancy services; and joint international marketing and retail leasing, management and marketing services. LVS is a connected person of our Company as it is our controlling shareholder.
Pursuant to the Shared Services Agreement, the price of each of the products and services governed by the Agreement and provided by the LVS Group to any member of our Group orvice versashall not exceed (i) the actual costs incurred in providing the relevant products and services as allocated to the recipient of such products and services on a fair and equitable basis; (ii) the actual costs incurred in providing the relevant products and services allocated to the recipient of such products and services on a fair and equitable basis plus a fee equal to the statutory minimum mark-up required to be charged with respect to such costs; or (iii) the price of the relevant products and services in the market, which price shall not be higher than either (a) the demonstrated price charged or quoted by independent third parties for the provision of comparable types of products or services under comparable conditions, in the ordinary course of business, to customers that are unrelated to them; or (b) the price charged by members of the LVS Group or our Group, as applicable, to independent third parties or to other listed subsidiaries of the LVS Group for the provision of comparable types of products or services.
The fees for the provision of such services will be invoiced by the LVS Group or our Group, as applicable, no earlier than the date incurred and paid, in the absence of dispute, within 45 days of receipt of invoice.
95
Sands China Ltd.
Corporate Governance
The Shared Services Agreement is for a term commencing on the Listing Date and ending on December 31, 2011, being the third financial year end of our Company following the Listing Date, provided that (i) we may terminate the Shared Services Agreement at any time by giving at least three months’ prior written notice of termination to LVS or (ii) the Shared Services Agreement shall terminate, amongst other circumstances, (a) when LVS ceases to be our controlling shareholder; or (b) our Shares cease to be listed on the Stock Exchange. The Shared Services Agreement may be renewed by the parties before its expiration for a term not exceeding the third financial year of our Company following the date of commencement of the renewed term, subject to compliance with the Listing Rules.
The parties will enter into implementation agreements from time to time and the term of any implementation agreement shall not exceed the term of the Shared Services Agreement, as such term may be extended from time to time.
Pursuant to the Shared Services Agreement, the LVS Group has also agreed to provide to our Group, and our Group has agreed to provide to the LVS Group, certain design, development and construction consultancy services with respect to the design, development and construction of casino, casino hotel and integrated resort projects of the size and scope which we and the LVS Group currently operate and plan to develop in the future, including those on Parcels 5 and 6. The costs and expenses payable by our Group or the LVS Group, as applicable, under the Shared Services Agreement for such design, development and construction consultancy services will be calculated on a cost plus basis. Typically, the allocation is done on the basis of the estimated salary and benefits for the employees of the LVS Group or our Group, as applicable, and the hours worked by such employees providing such services. The aggregate total consideration expected to be paid for such design, development and construction consultancy services provided by the LVS Group to our Group for each of the years ending December 31, 2009, 2010 and 2011 on an annual basis will not exceed US$1.5 million, US$5.1 million and US$5.0 million, respectively. The aggregate total consideration expected to be paid for such design, development and construction consultancy services provided by our Group to the LVS Group for each of the years ending December 31, 2009, 2010 and 2011 on an annual basis will not exceed US$3.0 million, US$2.3 million and US$0.7 million, respectively.
| 2. | Joint International Marketing and Retail Leasing, Management and Marketing Services |
Pursuant to the Shared Services Agreement, the LVS Group has agreed to provide to our Group joint international marketing services targeting VIP players and premium players who wish to patronize our Group’s properties in addition to those of the LVS Group, and retail leasing, management and marketing services relating to the retail malls owned or operated by our Group. The aggregate total consideration expected to be paid for such services provided by the LVS Group to our Group for each of the years ending December 31, 2009, 2010 and 2011 on an annual basis will not exceed US$19.8 million, US$19.9 million and US$21.0 million, respectively.
96
Annual Report 2009
Corporate Governance
III. Continuing Connected Transactions Subject to Reporting, Announcement and Independent Shareholders’ Approval Requirements Under Listing Rule 14A.35
| 1. | The Second Trademark Sub-License Agreement |
Las Vegas Sands, LLC and LVS IP Holdings, LLC entered into a trademark sub-license agreement on November 8, 2009 (the “Second Trademark Sub- License Agreement”). Las Vegas Sands, LLC is a connected person as it is our controlling shareholder. LVS IP Holdings, LLC is our wholly-owned subsidiary.
Pursuant to the Second Trademark Sub-License Agreement, Las Vegas Sands, LLC (as licensor) granted to our Group a license to use cetain trademarks and the service marks (a) in mainland China, Macau, Hong Kong and Taiwan (and their respective territorial seas) (the “Restricted Zone”) for the development, operation and marketing of casinos, hotels, integrated resorts and associated facilities located in the Restricted Zone and (b) in the rest of the world, for the marketing of our business
in the Restricted Zone. Nothing in the Second Trademark Sub-Licence Agreement shall grant to the licensee or any permitted sublicensee the right to use any licensed marks for the purpose of carrying on any Internet gaming business, even when the portal or the primary users targeted are domiciled within the Restricted Zone. The Second Trademark Sub-License Agreement shall remain in effect for an initial term of slightly over 12 1/2 years commencing from the Listing Date and ending on December 31, 2022, so that its term is aligned with the initial term of VML’s Subconcession which expires on June 26, 2022. The Second Trademark Sub-License Agreement may be renewed upon the agreement of both parties on such terms as the parties may mutually agree, subject to compliance with the Listing Rules.
The parties are permitted to terminate the Second Trademark Sub-License Agreement prior to the expiration of its initial term by mutual agreement. The licensor is also entitled, upon the compulsion of any law of any of the jurisdictions within the Restricted Zone, to terminate the grant of a license. The Second Trademark Sub-License Agreement shall terminate automatically, without any notice to the licensee, in the event that LVS is no longer a controlling shareholder, or in the event of any sale of all or substantially all of the assets of the licensee, to any person or legal entity which is not a subsidiary or affiliate of LVS, our Company or the licensor.
Under the Second Trademark Sub-License Agreement: (a) for each of the full fiscal years under the initial term through the full fiscal year ending December 31, 2012, the licensee will pay the licensor an annual royalty at the rate of 1.5% of the total gross revenue of The Venetian Macao, 1.5% of the total gross non-gaming revenue and Paiza-related gaming revenue of the Sands Macao and 1.5% of the total gross gaming revenue of the Plaza Casino at the Plaza Macao (the “Relevant Royalty”), provided that the total royalty payable in respect of those three properties in each such fiscal year will be capped at US$20.0 million per full fiscal year, and (b) for each of the subsequent full fiscal years under the initial term, commencing with the full fiscal year ending December 31, 2013 and ending with the full fiscal year ending December 31, 2022, the licensee will pay the licensor an annual royalty being the lesser of the Relevant Royalty or the annual caps set out below, such annual caps reflecting an increase of 20.0% for each subsequent year (the “Incremental Rate Caps”):
| | | | | | | | | | | | | | | | | | | | | | | | | | | | | | | | | | | | | | |
Year | | 2013 | | | | 2014 | | | | 2015 | | | | 2016 | | | | 2017 | | | | 2018 | | | | 2019 | | | | 2020 | | | | 2021 | | | | 2022 |
| | | | | | | | | | | | | | | | | | | |
Cap (US$ in millions) | | 24.0 | | | | 28.8 | | | | 34.6 | | | | 41.5 | | | | 49.8 | | | | 59.7 | | | | 71.7 | | | | 86.0 | | | | 103.2 | | | | 123.8 |
97
Sands China Ltd.
Corporate Governance
Each subsequent Casino Gaming property that we operate which utilizes any of the licensed marks in connection with generating the relevant revenue, will pay (a) for each of the first three fiscal calendar years after commencement of operations of each subsequent property, a royalty fee of 1.5% of the respective gross revenues of the operations in connection with which such licensed marks are used (each, the “Subsequent Casino Gaming Property Royalty”), subject to a US$20.0 million cap per fiscal year, and (b) for the fiscal calendar years thereafter until expiration of the initial term, the licensee will pay the licensor an annual royalty being the lesser of the Subsequent Casino Gaming Property Royalty or the annual caps set out below, such annual caps reflecting an increase of 20.0% for each subsequent year:
| | | | | | | | | | | | | | | | | | | | | | | | | | | | | | | | | | | | | | | | | | |
Year | | 1 | | | | 2 | | | | 3 | | | | 4 | | | | 5 | | | | 6 | | | | 7 | | | | 8 | | | | 9 | | | | 10 | | | | 11 |
Cap (US$ in millions) | | 20.0 | | | | 20.0 | | | | 20.0 | | | | 24.0 | | | | 28.8 | | | | 34.6 | | | | 41.5 | | | | 49.8 | | | | 59.7 | | | | 71.7 | | | | 86.0 |
| Note: | This assumes, for illustrative purposes, that the Casino Gaming properties open on January 1, 2012 and have the right to use the licensed marks for 11 years under the initial term. |
The annual caps set out in (a) and (b) above shall apply separately to each of the future Casino Gaming properties which will be developed and operated on Parcels 5 and 6, Parcels 7 and 8, and Parcel 3 to the extent the operations of such Casino Gaming properties utilize any of the licensed marks. Further details of the Second Trademark Sub-License Agreement and the caps are set out in the Prospectus.
Additional information about these continuing connected transactions can be found in our Prospectus.
98
Annual Report 2009
Corporate Governance
The aggregate amount paid by the Group to the LVS Group and/or by the LVS Group to the Group during the year and the annual caps for the financial year ended December 31, 2009 and the annual caps for the years ending December 31, 2010 and 2011 of the respective continuing connected transactions are set out below:
| | | | | | | | |
| | | Aggregate amount
for the year ended
December 31, 2009
(US$ million) | | Annual Cap
for the year ended
December 31, 2009
(US$ million) | | Annual Cap
for the year ending
December 31, 2010
(US$ million) | | Annual Cap
for the year ending
December 31, 2011
(US$ million) |
Reciprocal Global Procurement & Consultancy Services | | 1.7 | | 2.5 | | 2.9 | | 2.9 |
Reciprocal Transportation and related Logistics Services | | 1.4 | | 1.7 | | 1.8 | | 2 |
Reciprocal Administrative and Logistics Services1 | | 8.3 | | NA | | NA | | NA |
The First Trademark License Agreement2 | | Nil | | NA | | NA | | NA |
Reciprocal Design, Development, Consultancy and Construction Services | | 3.7 | | 4.5 | | 7.4 | | 5.7 |
Joint International Marketing and Retail Leasing, Management and Marketing Services | | 15.1 | | 19.8 | | 19.9 | | 21 |
The Second Trademark Sub-License Agreement | | 1.8 | | 20 | | 20 | | 20 |
| 1. | Per Page 218 of our Prospectus, these transactions are exempt under Rule 14A.33(2) of the Listing Rules. |
| 2. | Per Page 220 of our Prospectus, the First Trademark License is a fully paid-up, royalty free license. |
Pursuant to Rule 14A.38 of the Listing Rules, the Company has engaged PwC to perform certain agreed upon procedures in respect of the continuing connected transactions of the Group. PwC has reported their factual findings on these procedures to the Board and confirmed that for the year 2009, the continuing connected transactions (i) have received the approval of the Board; (ii) have been entered into in accordance with the pricing policies of the Company if the transactions involve provision of goods or services; (iii) have been entered into in accordance with the terms of the relevant agreements governing the transactions; and (iv) have not exceeded the relevant cap amounts for the financial year ended December 31, 2009 as set out in the Prospectus.
The Directors, including the Independent Non-Executive Directors have reviewed the continuing connected party transactions and are of the opinion that they were entered into in the normal course of business of the Company on normal commercial terms that are fair and reasonable and in the interests of the Company’s shareholders.
Details of the significant related party transactions undertaken in the normal course of business are provided under Note 33 to the Consolidated Financial Statements. None constitutes a discloseable connected transaction as defined under the Listing Rules. The Company has complied with the disclosure requirements set out in Chapter 14A of the Exchange Listing Rules relating to related party transactions.
99
Sands China Ltd.
Corporate Governance
Share Option Scheme
On November 8, 2009, our Company adopted a share option scheme (the “Share Option Scheme”) for the purpose of attracting able persons to enter and remain in the employment of our Group. The Share Option Scheme also provides a means whereby employees, directors and consultants of our Group can acquire and maintain Share ownership, thereby strengthening their commitment to the welfare of our Group and promoting an identity of interest between Shareholders and these persons.
No option may be vested more than 10 years after the date of grant. Unless otherwise terminated by our Company in general meeting or by our Board, the Share Option Scheme will be valid and effective for a period of 10 years from November 30, 2009.
Persons who are eligible to participate in the Share Option Scheme (the “Eligible Persons”) are limited to those who have entered into an option agreement with us or who have received written notification from the committee established by our Board to administer the Share Option Scheme (the “Committee”), or from a person designated by the Committee, that they have been selected to participate in the Share Option Scheme:
| (i) | any individual regularly employed by us or any of our subsidiaries, provided, however, that no such employee covered by a collective bargaining agreement shall be an Eligible Person unless and to the extent that such eligibility is set forth in such collective bargaining agreement or in an agreement or instrument related thereto; |
| (ii) | director of our Company or any of our subsidiaries; or |
| (iii) | consultant or advisor to our Company or any of our subsidiaries, |
such individual as set out in (i) to (iii) above having an annual salary of at least HK$1,162,500 or its equivalent.
The minimum period for which an option must be held before it can be exercised will be specified in the relevant option agreement between our Company and the relevant Eligible Person.
The maximum number of Shares in respect of which options or other share-based awards may be granted (including Shares in respect of which options, whether exercised or still outstanding, have already been granted) under the Share Option Scheme and under any other plans of our Company must not in aggregate exceed 10% of the then issued share capital of our Company. Notwithstanding the foregoing, the Shares which may be issued upon exercise of all outstanding options and other share-based awards granted and yet to be exercised under the Share Option Scheme and any other plans of our Company at any time shall not exceed 30% of the Shares in issue from time to time. Based on the issued share capital of 8,047,865,084 Shares of our Company in issue on the date of this Annual Report, up to 804,786,508 Shares may be issued by our Company to Eligible Persons under the Share Option Scheme.
The total number of Shares issued and which may fall to be issued upon exercise of the options granted under the Share Option Scheme and any other share option schemes of our Company (including both exercised, outstanding options and Shares which were the subject of options which have been granted and accepted under the Share Option Scheme or any other scheme of our Company) to each Eligible Person in any 12-month period up to the date of grant shall not exceed 1% of the Shares in issue as of the date of grant.
100
Annual Report 2009
Corporate Governance
The exercise price (“Option Price”) per Share for each option shall be set by the Committee at the time of grant but shall not be less than the highest of:
| (i) | the official closing price of the Shares as stated in the daily quotation sheets of the Stock Exchange on the date of grant which must be a business day; |
| (ii) | the average of the official closing price of the Shares as stated in the daily quotation sheets of the Stock Exchange for the 5 business days immediately preceding the date of grant; and |
| (iii) | the nominal value of a Share, |
provided that for the purpose of determining the Option Price where the Shares have been listed on the Stock Exchange for less than 5 business days preceding the date of grant, the issue price of the Shares in connection with such listing shall be deemed to be the closing price of the Shares for each business day falling within the period before the listing of the Shares on the Stock Exchange.
The exercise of any option shall be subject to our Shareholders in general meeting approving any necessary increase in the authorized share capital of our Company.
As of December 31, 2009, no options had been granted under the Share Option Scheme.
Closure of Register of Members
The Register of Members of the Company will be closed from Tuesday, June 8, 2010 to Saturday, June 19, 2010, both dates inclusive, during which period no transfer of shares will be effected. In order to qualify for attending and voting at the 2010 annual general meeting, all transfer documents accompanied by the relevant share certificates must be lodged with the Company’s branch share registrar in Hong Kong, Computershare Hong Kong Investor Services Limited, at Shops 1712-1716, 17th Floor, Hopewell Centre, 183 Queen’s Road East, Wanchai, Hong Kong for registration not later than 4:30 p.m. on Monday, June 7, 2010.
Pre-emptive Rights
There are no provisions for per-emptive rights under the Company’s Articles of Association, or the laws of the Cayman Islands, which would oblige the Company to offer new shares on a pro-rata basis to existing shareholders.
Sufficiency of Public Float
Based on information publicly available to the Company and within the knowledge of the Directors at the date of this annual report, the Company has maintained the prescribed public float under the Listing Rules.
Corporate Governance
The Company’s corporate governance principles and practices are set out in the Corporate Governance Report on page 79 of this Annual Report.
Auditors
The Consolidated Financial Statements for the year have been audited by PricewaterhouseCoopers who retire and, being eligible, offer themselves for reappointment at the forthcoming annual general meeting of the Company.
By Order of the Board
Sheldon G. Adelson
Chairman
April 14, 2010
101

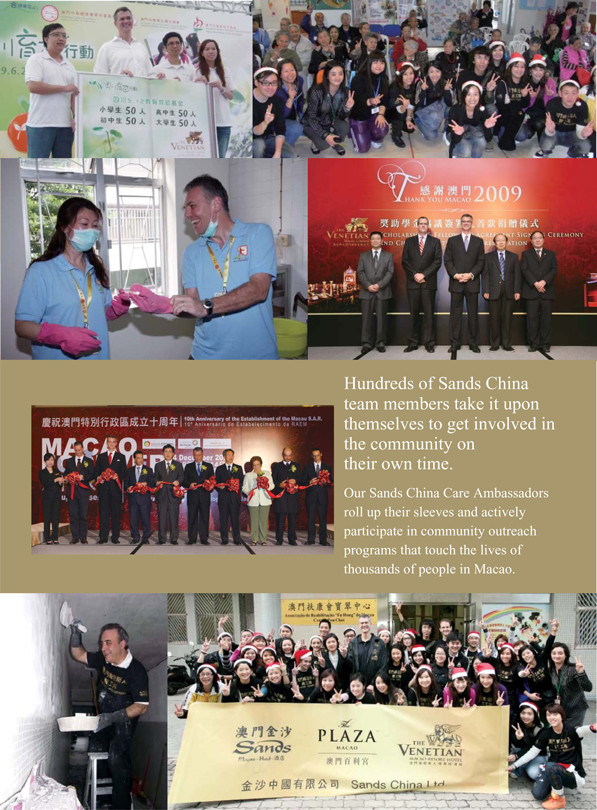
Sands China Ltd.
Independent Auditor’s Report
To the Shareholders of Sands China Ltd.
(incorporated in Cayman Islands with limited liability)
We have audited the consolidated financial statements of Sands China Ltd. (the “Company”) and its subsidiaries (together, the “Group”) set out on pages 106 to 190, which comprise the consolidated and company balance sheets as of December 31, 2009, and the consolidated income statement, the consolidated statement of comprehensive income, the consolidated statement of changes in equity and the consolidated cash flow statement for the year then ended, and a summary of significant accounting policies and other explanatory notes.
Directors’ responsibility for the consolidated financial statements
The Directors of the Company are responsible for the preparation and the true and fair presentation of these consolidated financial statements in accordance with International Financial Reporting Standards and the disclosure requirements of the Hong Kong Companies Ordinance. This responsibility includes designing, implementing and maintaining internal control relevant to the preparation and the true and fair presentation of consolidated financial statements that are free from material misstatement, whether due to fraud or error; selecting and applying appropriate accounting policies; and making accounting estimates that are reasonable in the circumstances.
Auditor’s responsibility
Our responsibility is to express an opinion on these consolidated financial statements based on our audit. We conducted our audit in accordance with International Standards on Auditing. Those standards require that we comply with ethical requirements and plan and perform the audit to obtain reasonable assurance as to whether the consolidated financial statements are free from material misstatement.
An audit involves performing procedures to obtain audit evidence about the amounts and disclosures in the consolidated financial statements. The procedures selected depend on the auditor’s judgment, including the assessment of the risks of material misstatement of the consolidated financial statements, whether due to fraud or error. In making those risk assessments, the auditor considers internal control relevant to the entity’s preparation and true and fair presentation of the consolidated financial statements in order to design audit procedures that are appropriate in the circumstances, but not for the purpose of expressing an opinion on the effectiveness of the entity’s internal control. An audit also includes evaluating the appropriateness of accounting policies used and the reasonableness of accounting estimates made by the Directors, as well as evaluating the overall presentation of the consolidated financial statements.
104
Annual Report 2009
Independent Auditor’s Report
We believe that the audit evidence we have obtained is sufficient and appropriate to provide a basis for our audit opinion.
Opinion
In our opinion, the consolidated financial statements give a true and fair view of the financial position of the Company and of the Group as of December 31, 2009, and of the Group’s financial performance and cash flows for the year then ended in accordance with International Financial Reporting Standards and have been properly prepared in accordance with the disclosure requirements of the Hong Kong Companies Ordinance.
Other matters
This report, including the opinion, has been prepared for and only for you, and for no other purpose. We do not assume responsibility towards or accept liability to any other person for the contents of this report.
PricewaterhouseCoopers
Certified Public Accountants
Hong Kong, April 14, 2010
105
Sands China Ltd.
Consolidated Income Statement
(All amounts in US$’000 except per share data)
| | | | | | | | |
| | | | | Year ended December 31, | |
| | | Note | | 2009 | | | 2008 | |
| | | |
Net revenues | | 5 | | 3,301,114 | | | 3,053,319 | |
Gaming tax | | | | (1,395,790 | ) | | (1,300,477 | ) |
Inventories consumed | | | | (40,115 | ) | | (42,241 | ) |
Employee benefit expenses | | 7 | | (462,895 | ) | | (517,910 | ) |
Depreciation and amortization | | | | (320,401 | ) | | (268,220 | ) |
Gaming promoter/agency commissions | | | | (186,659 | ) | | (162,051 | ) |
Other expenses | | 8 | | (525,273 | ) | | (468,446 | ) |
| | | | | | | | |
| | | |
Operating profit | | | | 369,981 | | | 293,974 | |
Interest income | | 5 | | 527 | | | 4,801 | |
Interest expense, net of amounts capitalized | | 9 | | (150,285 | ) | | (122,870 | ) |
Loss on modification or early retirement of debt | | | | (6,186 | ) | | — | |
| | | | | | | | |
| | | |
Profit before income tax | | | | 214,037 | | | 175,905 | |
Income tax expenses | | 10 | | (201 | ) | | (169 | ) |
| | | | | | | | |
| | | |
Profit for the year attributable to equity holders of the Company | | | | 213,836 | | | 175,736 | |
| | | | | | | | |
| | | |
Dividends | | 11 | | — | | | — | |
| | | | | | | | |
| | | |
Earnings per share for profit attributable to equity holders of the Company | | | | | | | | |
— Basic and diluted | | 12 | | 3.32 cents | | | 2.80 cents | |
| | | | | | | | |
The notes on pages 114 to 190 are an integral part of these consolidated financial statements.
106
Annual Report 2009
Consolidated Statement of Comprehensive Income
(All amounts in US$’000)
| | | | | |
| | | Year ended December 31, |
| | | 2009 | | | 2008 |
| | |
Profit for the year attributable to equity holders of the Company | | 213,836 | | | 175,736 |
| | |
Other comprehensive (loss)/income, net of tax: | | | | | |
Currency translation differences | | (1,893 | ) | | 8,410 |
| | | | | |
| | |
Total comprehensive income for the year attributable to equity holders of the Company | | 211,943 | | | 184,146 |
| | | | | |
The notes on pages 114 to 190 are an integral part of these consolidated financial statements.
107
Sands China Ltd.
Consolidated Balance Sheet
(All amounts in US$’000)
| | | | | | |
| | | | | As of December 31, |
| | | Note | | 2009 | | 2008 |
| | | |
ASSETS | | | | | | |
Non-current assets | | | | | | |
Investment properties, net | | 13 | | 676,512 | | 338,014 |
Leasehold interests in land, net | | 14 | | 378,918 | | 274,443 |
Property and equipment, net | | 15 | | 4,926,540 | | 5,235,823 |
Intangible assets, net | | 17 | | 41,005 | | 46,222 |
Deferred income tax assets | | 18 | | 113 | | 159 |
Financial assets at fair value through profit or loss | | 19 | | 1,529 | | — |
Other assets, net | | 20 | | 48,794 | | 60,770 |
Trade and other receivables and prepayments, net | | 21 | | 31,955 | | 91,457 |
| | | | | | |
| | | |
Total non-current assets | | | | 6,105,366 | | 6,046,888 |
| | | | | | |
| | | |
Current assets | | | | | | |
Inventories | | 22 | | 9,630 | | 10,915 |
Trade and other receivables and prepayments, net | | 21 | | 295,400 | | 287,947 |
Restricted cash | | 23 | | 17,172 | | 124,112 |
Cash and cash equivalents | | 24 | | 908,334 | | 417,769 |
| | | | | | |
| | | |
Total current assets | | | | 1,230,536 | | 840,743 |
| | | | | | |
| | | |
Total assets | | | | 7,335,902 | | 6,887,631 |
| | | | | | |
108
Annual Report 2009
Consolidated Balance Sheet
(All amounts in US$’000)
| | | | | | | |
| | | | | As of December 31, | |
| | | Note | | 2009 | | 2008 | |
| | | |
EQUITY | | | | | | | |
Capital and reserves attributable to equity holders of the Company | | | | | | | |
Share capital | | 25 | | 80,479 | | — | |
Reserves | | 26 | | 3,604,913 | | 1,249,534 | |
| | | | | | | |
| | | |
Total equity | | | | 3,685,392 | | 1,249,534 | |
| | | | | | | |
| | | |
LIABILITIES | | | | | | | |
Non-current liabilities | | | | | | | |
Trade and other payables | | 27 | | 12,570 | | 12,663 | |
Borrowings | | 28 | | 2,732,612 | | 3,598,862 | |
| | | | | | | |
| | | |
Total non-current liabilities | | | | 2,745,182 | | 3,611,525 | |
| | | | | | | |
| | | |
Current liabilities | | | | | | | |
Trade and other payables | | 27 | | 818,471 | | 1,982,042 | |
Current income tax liabilities | | | | 172 | | 232 | |
Borrowings | | 28 | | 86,685 | | 44,298 | |
| | | | | | | |
| | | |
Total current liabilities | | | | 905,328 | | 2,026,572 | |
| | | | | | | |
| | | |
Total liabilities | | | | 3,650,510 | | 5,638,097 | |
| | | | | | | |
| | | |
Total equity and liabilities | | | | 7,335,902 | | 6,887,631 | |
| | | | | | | |
| | | |
Net current assets/(liabilities) | | | | 325,208 | | (1,185,829 | ) |
| | | | | | | |
| | | |
Total assets less current liabilities | | | | 6,430,574 | | 4,861,059 | |
| | | | | | | |
Approved by the Board of Directors on April 14, 2010 and signed on behalf of the Board by
| | |
| Steven Craig Jacobs | | Stephen John Weaver |
| Director | | Director |
The notes on pages 114 to 190 are an integral part of these consolidated financial statements.
109
Sands China Ltd.
Balance Sheet
(All amounts in US$’000)
| | | | |
| | | Note | | As of
December 31,
2009 |
| | |
ASSETS | | | | |
Non-current assets | | | | |
Interests in subsidiaries | | 32 | | 1,311,857 |
Notes receivables from related companies | | 21 | | 176,200 |
Deposits and other assets | | 20 | | 1 |
| | | | |
| | |
Total non-current assets | | | | 1,488,058 |
| | | | |
| | |
Current assets | | | | |
Other receivables and prepayments | | 21 | | 307,851 |
Cash and cash equivalents | | 24 | | 510,584 |
| | | | |
| | |
Total current assets | | | | 818,435 |
| | | | |
| | |
Total assets | | | | 2,306,493 |
| | | | |
| | |
EQUITY | | | | |
Capital and reserves attributable to equity holders of the Company | | | | |
Share capital | | 25 | | 80,479 |
Reserves | | 26 | | 2,219,347 |
| | | | |
| | |
Total equity | | | | 2,299,826 |
| | | | |
| | |
LIABILITIES | | | | |
Current liabilities | | | | |
Trade and other payables | | 27 | | 6,667 |
| | | | |
| | |
Total current liabilities | | | | 6,667 |
| | | | |
| | |
Total equity and liabilities | | | | 2,306,493 |
| | | | |
| | |
Net current assets | | | | 811,768 |
| | | | |
| | |
Total assets less current liabilities | | | | 2,299,826 |
| | | | |
Approved by the Board of Directors on April 14, 2010 and signed on behalf of the Board by
| | |
| Steven Craig Jacobs | | Stephen John Weaver |
| Director | | Director |
The notes on pages 114 to 190 are an integral part of these consolidated financial statements.
110
Annual Report 2009
Consolidated Statement of Cash Flows
(All amounts in US$’000)
| | | | | | | | |
| | | | | Year ended December 31, | |
| | | Note | | 2009 | | | 2008 | |
| | | |
Cash flows from operating activities | | | | | | | | |
Cash generated from operations | | 30 | | 704,071 | | | 256,227 | |
Income tax paid | | | | (215 | ) | | (44 | ) |
| | | | | | | | |
| | | |
Net cash generated from operating activities | | | | 703,856 | | | 256,183 | |
| | | | | | | | |
| | | |
Cash flows from investing activities | | | | | | | | |
Decrease/(increase) in restricted cash | | | | 106,887 | | | (64,480 | ) |
Purchases of property and equipment and investment properties | | | | (385,520 | ) | | (1,973,658 | ) |
Purchases of intangible assets | | | | (1,679 | ) | | (24,195 | ) |
Proceeds from disposal of property and equipment | | | | 6,113 | | | 31 | |
Notes receivable/amounts due from related companies | | | | — | | | (5,514 | ) |
Settlement of notes receivable/amounts due from related companies | | | | 800 | | | 140,500 | |
Proceeds from disposal of group companies | | | | 624 | | | — | |
Interest received | | | | 583 | | | 9,335 | |
| | | | | | | | |
| | | |
Net cash used in investing activities | | | | (272,192 | ) | | (1,917,981 | ) |
| | | | | | | | |
| | | |
Cash flows from financing activities | | | | | | | | |
Payments for financial assets at fair value through profit or loss | | | | (2,767 | ) | | (20 | ) |
Proceeds from borrowings | | | | 9,885 | | | 672,296 | |
Proceeds from notes payable to related companies | | | | 602,000 | | | 20,000 | |
Proceeds from advances from related companies | | | | 57,000 | | | 1,143,792 | |
Proceeds from issuance of ordinary shares pursuant to the global offering | | | | 1,700,900 | | | — | |
Payments for share issuance costs | | | | (70,764 | ) | | — | |
Repayments of borrowings | | | | (680,302 | ) | | — | |
Repayments of notes payable to related companies | | | | (176,200 | ) | | — | |
Repayments of advances from related companies | | | | (1,215,792 | ) | | — | |
Repayments of finance lease liabilities | | | | (168 | ) | | (77 | ) |
Payments for deferred financing costs | | | | (18,927 | ) | | (5,994 | ) |
Interest paid | | | | (145,722 | ) | | (192,617 | ) |
| | | | | | | | |
| | | |
Net cash generated from financing activities | | | | 59,143 | | | 1,637,380 | |
| | | | | | | | |
111
Sands China Ltd.
Consolidated Statement of Cash Flows
(All amounts in US$’000)
| | | | | | | | |
| | | | | Year ended December 31, | |
| | | Note | | 2009 | | | 2008 | |
| | | |
Net increase/(decrease) in cash and cash equivalents | | | | 490,807 | | | (24,418 | ) |
Cash and cash equivalents at beginning of the year | | | | 417,769 | | | 439,395 | |
Effect of exchange rate on cash and cash equivalents | | | | (242 | ) | | 2,792 | |
| | | | | | | | |
| | | |
Cash and cash equivalents at end of the year | | 24 | | 908,334 | | | 417,769 | |
| | | | | | | | |
| | | |
Non-cash transactions | | | | | | | | |
Capitalized share-based compensation | | | | 811 | | | 2,375 | |
Contribution from owners | | | | 6,762 | | | — | |
Issuance of shares upon bond conversion | | 25 | | 582,000 | | | — | |
| | | | | | | | |
The notes on pages 114 to 190 are an integral part of these consolidated financial statements.
112
Annual Report 2009
Consolidated Statement of Changes in Equity
(All amounts in US$’000)
| | | | | | | | | | | | | | | | | | | | |
| | | Share capital | | Capital
reserves | | Share
premium | | | Statutory
reserve | | Share-based
compensation
reserve | | Currency
translation
reserve | | | Retained
earnings | | | Total | |
| | | | | | | | |
Balance at January 1, 2008 | | — | | 80,049 | | — | | | 6,222 | | — | | (2,778 | ) | | 964,357 | | | 1,047,850 | |
Comprehensive income | | | | | | | | | | | | | | | | | | | | |
Profit or loss | | — | | — | | — | | | — | | — | | — | | | 175,736 | | | 175,736 | |
Other comprehensive income | | | | | | | | | | | | | | | | | | | | |
Currency translation differences | | — | | — | | — | | | — | | — | | 8,410 | | | — | | | 8,410 | |
| | | | | | | | | | | | | | | | | | | | |
| | | | | | | | |
Total comprehensive income | | — | | — | | — | | | — | | — | | 8,410 | | | 175,736 | | | 184,146 | |
Share-based compensation granted by LVS | | — | | — | | — | | | — | | 17,538 | | — | | | — | | | 17,538 | |
| | | | | | | | | | | | | | | | | | | | |
| | | | | | | | |
Balance at December 31, 2008 | | — | | 80,049 | | — | | | 6,222 | | 17,538 | | 5,632 | | | 1,140,093 | | | 1,249,534 | |
Comprehensive income | | | | | | | | | | | | | | | | | | | | |
Profit or loss | | — | | — | | — | | | — | | — | | — | | | 213,836 | | | 213,836 | |
Other comprehensive income | | | | | | | | | | | | | | | | | | | | |
Currency translation differences | | — | | — | | — | | | — | | — | | (1,893 | ) | | — | | | (1,893 | ) |
| | | | | | | | | | | | | | | | | | | | |
| | | | | | | | |
Total comprehensive income | | — | | — | | — | | | — | | — | | (1,893 | ) | | 213,836 | | | 211,943 | |
Transactions with owners | | | | | | | | | | | | | | | | | | | | |
Shares issued pursuant to the global offering | | 12,700 | | — | | 1,688,200 | | | — | | — | | — | | | — | | | 1,700,900 | |
Shares issued under the capitalization issue | | 62,800 | | — | | (62,800 | ) | | — | | — | | — | | | — | | | — | |
Shares issued upon bond conversion | | 4,979 | | — | | 655,021 | | | — | | — | | — | | | — | | | 660,000 | |
Deemed distribution upon bond conversion | | — | | — | | (78,000 | ) | | — | | — | | — | | | — | | | (78,000 | ) |
Share issuance costs | | — | | — | | (74,884 | ) | | — | | — | | — | | | — | | | (74,884 | ) |
Contribution from owners | | — | | 6,762 | | — | | | — | | — | | — | | | — | | | 6,762 | |
Disposals of group companies | | — | | 624 | | — | | | — | | — | | — | | | — | | | 624 | |
| | | | | | | | | | | | | | | | | | | | |
| | | | | | | | |
Total transactions with owners | | 80,479 | | 7,386 | | 2,127,537 | | | — | | — | | — | | | — | | | 2,215,402 | |
Transfer to statutory reserve | | — | | — | | — | | | 93 | | — | | — | | | (93 | ) | | — | |
Share-based compensation granted by LVS | | — | | — | | — | | | — | | 8,513 | | — | | | — | | | 8,513 | |
| | | | | | | | | | | | | | | | | | | | |
| | | | | | | | |
Balance at December 31, 2009 | | 80,479 | | 87,435 | | 2,127,537 | | | 6,315 | | 26,051 | | 3,739 | | | 1,353,836 | | | 3,685,392 | |
| | | | | | | | | | | | | | | | | | | | |
The notes on pages 114 to 190 are an integral part of these consolidated financial statements.
113
Sands China Ltd.
Notes to the Consolidated Financial Statements
1. Group reorganization and basis of presentation
(a) Principal activities
Sands China Ltd. (the “Company”) and its subsidiaries (collectively the “Group”) is principally engaged in the development and operation of integrated resorts and other ancillary services (the “Gaming and Other Related Operations”) in the Macao Special Administrative Region of the People’s Republic of China (“Macao”).
The Group owns and operates the Sands Macao, the first Las Vegas-style casino in Macao, pursuant to a 20-year gaming subconcession.
The Group also owns and operates The Venetian Macao Resort Hotel (“The Venetian Macao”), which anchors the
Cotai Strip, the Group’s master-planned development of integrated resort properties in Macao.
In August 2008, the Group opened the Four Seasons Hotel, the Plaza Casino, the Shoppes at Four Seasons (together with the Paiza Mansions opened in July 2009 and the apart-hotel tower, referred to as “The Plaza Macao”). The Plaza Macao is located adjacent to The Venetian Macao.
The Group’s other ancillary services include ferry operations and other related operations.
The Company’s shares were listed on the Main Board of the Stock Exchange on November 30, 2009.
The consolidated financial statements are presented in United States dollars (“US$”), unless otherwise stated. The consolidated financial statements have been approved for issue by the Board of Directors on April 14, 2010.
(b) Organization and reorganization
The Company was incorporated in the Cayman Islands on July 15, 2009 as an exempted company with limited liability under the Companies Law, Cap 22 (Law 3 of 1961, as consolidated and revised) of the Cayman Islands. The address of the Company’s registered office is Walkers Corporate Services Limited, Walker House, 87 Mary Street, George Town, Grand Cayman KY1-9005, Cayman Islands. The Company’s principal place of business in Hong Kong registered under Part XI of the Hong Kong Companies Ordinance at Level 28, Three Pacific Place, 1 Queen’s Road East, Hong Kong.
Together with Las Vegas Sands Corp. (“LVS”), the ultimate holding company, and its subsidiaries, the Group completed a reorganization in 2009 (the “Reorganization”). Pursuant to the Reorganization, the Company became the holding company of the companies now comprising the Group. The Reorganization was accounted for as a business combination under common control in a manner similar to a pooling of interests. The assets and liabilities transferred to the Group have been stated at LVS’s historical carrying amounts. The consolidated financial statements have been prepared as if the Company and current corporate structure had been in existence at all dates and during the years presented.
114
Annual Report 2009
Notes to the Consolidated Financial Statements—(Continued)
2. Summary of significant accounting policies
The principal accounting policies applied in the preparation of the consolidated financial statements are set out below. These policies have been consistently applied to all the years presented, unless otherwise stated.
(a) Basis of preparation
The consolidated financial statements of the Group have been prepared in accordance with International Financial Reporting Standards (“IFRS”) under the historical cost convention, as modified by the revaluation of financial assets at fair value through profit or loss. The preparation of the consolidated financial statements in conformity with IFRS requires the use of certain critical accounting estimates. It also requires management to exercise its judgment in the process of applying the Group’s accounting policies. The areas involving a higher degree of judgment or complexity, or areas where assumptions and estimates are significant to the consolidated financial statements are disclosed in Note 4.
(b) Changes in accounting policies and disclosures
During the year, there have been a number of new/revised standards, amendments to standards and interpretations that have come into effect, for which the Group has adopted such at their respective effective dates. The adoption of these new standards, amendments to standards and interpretations has no material impact to the Group except for the adoption of the amendment to International Accounting Standards (“IAS”) 40 “Investment properties” (“IAS 40 (Amendment)”), which changed the Group’s accounting policy in relation to the classification of the Group’s properties that are under construction or development. Pursuant to the amendment, properties that are under construction or development for long-term rental yields, which were previously accounted for under IAS 16 “Property, plant and equipment”, should be classified as investment properties. As a result of the adoption of IAS 40 (Amendment) for the year ended December 31, 2009, the Group’s properties under construction of US$227.9 million was reclassified from “Property and equipment, net” to “Investment properties, net” on January 1, 2009. IAS 40 (Amendment) has been applied prospectively.
115
Sands China Ltd.
Notes to the Consolidated Financial Statements—(Continued)
2. Summary of significant accounting policies (continued)
(b) Changes in accounting policies and disclosures (continued)
The following new/revised standards, amendments to standards and interpretations to existing standards have been issued but are not effective for the year ended December 31, 2009:
| | | | |
| | | | | Effective for annual periods
beginning on or after |
| IFRSs (Amendments) | | Improvements to IFRSs 2009 | | January 1, 2010 |
| IAS 1 (Amendment) | | Presentation of Financial Statements | | January 1, 2010 |
| IAS 7 (Amendment) | | Statement of Cash Flows | | January 1, 2010 |
| IAS 17 (Amendment) | | Leases | | January 1, 2010 |
| IAS 24 (Revised) | | Related Party Disclosures | | January 1, 2011 |
| IAS 27 (Revised) | | Consolidated and Separate Financial Statements | | July 1, 2009 |
| IAS 28 (Amendment) | | Investments in Associates | | July 1, 2009 |
| IAS 31 (Amendment) | | Interests in Joint Ventures | | July 1, 2009 |
| IAS 32 (Amendment) | | Financial Instruments: Presentation | | February 1, 2010 |
| IAS 36 (Amendment) | | Impairment of Assets | | January 1, 2010 |
| IAS 38 (Amendment) | | Intangible Assets | | July 1, 2009 |
| IAS 39 (Amendment) | | Financial Instruments: Recognition and Measurement | | July 1, 2009, January 1, 2010 |
| IFRS 1 (Revised) | | First-time Adoption of International Financial Reporting Standards | | July 1, 2009, July 1, 2010 |
| IFRS 1 (Amendment) | | First-time Adoption of International Financial Reporting Standards | | January 1, 2010 |
| IFRS 2 (Amendment) | | Share-based Payments | | July 1, 2009, January 1, 2010 |
| IFRS 3 (Revised) | | Business Combinations | | July 1, 2009 |
| IFRS 5 (Amendment) | | Non-current Assets Held for Sale and Discontinued Operations | | July 1, 2009, January 1, 2010 |
| IFRS 8 (Amendment) | | Operating Segments | | January 1, 2010 |
| IFRS 9 | | Financial Instruments — Classification and Measurement | | January 1, 2013 |
| IFRIC 9 (Amendment) | | Reassessment of Embedded Derivatives | | July 1, 2009 |
| IFRIC 14 (Amendment) | | IAS 19 — The limit on a Defined Benefit Asset, Minimum Funding Requirements and their interactions | | January 1,2011 |
| IFRIC 16 (Amendment) | | Hedges of a Net Investment in a Foreign Operation | | July 1, 2009 |
| IFRIC 17 | | Distributions of Non-cash Assets to Owners | | July 1, 2009 |
| IFRIC 18 | | Transfer of Assets from Customers | | July 1, 2009 |
| IFRIC 19 | | Extinguishing Financial Liabilities with Equity Instruments | | July 1, 2010 |
The Group has not early adopted any of the above standards, interpretations and amendments to the existing standards. Management is in the process of making an assessment of their impact and is not yet in a position to state what impact they would have on the Group’s results of operations and financial positions.
116
Annual Report 2009
Notes to the Consolidated Financial Statements—(Continued)
2. Summary of significant accounting policies (continued)
(c) Consolidation
(i) Subsidiaries
Subsidiaries are all entities (including special purpose entities) over which the Group has the power to govern the financial and operating policies generally accompanying a shareholding of more than one half of the voting rights. The existence and effect of potential voting rights that are currently exercisable or convertible are considered when assessing whether the Group controls another entity.
Subsidiaries are fully consolidated from the date on which control is transferred to the Group and are deconsolidated from the date that control ceases.
The purchase method of accounting is used to account for the acquisition of subsidiaries of the Group, except for those acquisitions that qualify as business combinations under common control, which are accounted for using merger accounting.
Intra-group transactions, balances and unrealized gains and losses on transactions between group companies are eliminated. Accounting policies of subsidiaries have been changed where necessary to ensure consistency with the policies adopted by the Group.
The particulars of the Group’s principal subsidiaries as of December 31, 2009 are set out in Note 32.
(ii) Business combinations under common control
The consolidated financial statements incorporate the financial statement items of the combining entities or businesses in which the common control combination occurs as if they had been combined from the date when the combining entities or businesses first came under the control of the controlling party.
The net assets of the combining entities or businesses are combined using the existing book values from the controlling party’s perspective. No amount is recognized with respect to goodwill or any excess of an acquirer’s interest in the net fair value of the acquiree’s identifiable assets, liabilities and contingent liabilities over its cost at the time of common control combination, to the extent of the contribution of the controlling party’s interest. All differences between the cost of acquisition (fair value of consideration paid) and the amounts at which the assets and liabilities are recorded have been recognized directly in equity as part of the capital reserve.
The income statement includes the results of each of the combining entities or businesses from the earliest date presented or since the date when combining entities or businesses first came under common control, where this is a shorter period, regardless of the date of the common control combination.
The comparative amounts in the consolidated financial statements are presented as if the entities or businesses had been combined at the earliest date presented or when they first came under common control, whichever is the later.
117
Sands China Ltd.
Notes to the Consolidated Financial Statements—(Continued)
2. Summary of significant accounting policies (continued)
(c) Consolidation (continued)
(ii) Business combinations under common control (continued)
Intra-group transactions, balances and unrealized gains on transactions between the combining entities or businesses are eliminated. Unrealized losses are also eliminated but considered as an impairment indicator of the asset transferred. Accounting policies of combining entities or businesses have been changed where necessary to ensure consistency with the policies adopted by the Group.
(d) Segment reporting
Operating segments are reported in a manner consistent with the internal reporting provided to the chief operating decision-maker. The chief operating decision-maker, who is responsible for allocating resources and assessing performance of the operating segments, has been identified as a group of senior management that makes strategic decisions.
(e) Foreign currency translation
(i) Functional and presentation currency
Items included in the financial statements of each of the Group’s companies are measured using the currency of the primary economic environment in which the entity operates (the “functional currency”). The Company’s functional currency is Macao Patacas (“MOP”). The consolidated financial statements are presented in US$, which is the presentation currency.
(ii) Transactions and balances
Foreign currency transactions are translated into the functional currency using the exchange rates prevailing at the date of the transactions or valuation where items are remeasured. Foreign exchange gains and losses resulting from the settlement of such transactions and from the translation at balance sheet date exchange rates of monetary assets and liabilities denominated in foreign currencies are recognized in the consolidated income statement.
(iii) Group companies
The results of operations and financial position of all the group companies (none of which has the currency of a hyperinflationary economy) that have a functional currency different from the presentation currency are translated into the presentation currency as follows:
| | • | | Assets and liabilities for each balance sheet presented are translated at the closing rate at the date of that balance sheet; |
| | • | | Income and expenses for each income statement are translated at average exchange rates (unless this average is not a reasonable approximation of the cumulative effect of the rates prevailing on the transaction dates, in which case income and expenses are translated at the dates of the transactions); and |
| | • | | All resulting exchange differences are recognized as a separate component of equity (currency translation differences). |
118
Annual Report 2009
Notes to the Consolidated Financial Statements—(Continued)
2. Summary of significant accounting policies (continued)
(e) Foreign currency translation (continued)
(iii) Group companies (continued)
On consolidation, exchange differences arising from the translation of the net investment in foreign entities, and of borrowings and other currency instruments designated as hedges of such investments, are taken to shareholders’ equity. When a foreign operation is sold, such exchange differences are recognized in the consolidated income statement as part of the gain or loss on sale.
(f) Investment properties
Investment properties, principally comprising buildings and building improvements, are held for long-term rental yields or capital appreciation or both and are not occupied by the Group. Prior to January 1, 2009, investment properties under construction or development were classified as construction-in-progress and included in property and equipment. Completed properties were transferred to investment properties at their carrying costs and subsequently carried at cost less accumulated depreciation and accumulated impairment losses. Investment properties are depreciated on a straight-line basis, at rates sufficient to write off their costs over their estimated useful lives of 15 to 40 years. The residual values and useful lives of investment properties are reviewed, and adjusted as appropriate, at each balance sheet date. The effects of any revision are included in the consolidated income statement when the changes arise.
Upon the adoption of IAS 40 (Amendment) on January 1, 2009, investment properties that are currently being constructed or developed are classified as investment properties and stated at cost less accumulated impairment losses.
(g) Leasehold interests in land
Leasehold interests in land represent payments made for the use of land over an extended period of time. The total lease payments will be amortized on a straight-line basis over the term of the lease agreement.
(h) Property and equipment
Property and equipment are stated at historical cost less accumulated depreciation and accumulated impairment losses. The cost of an asset comprises its purchase price and any directly attributable costs of bringing the asset to its working condition and location for its intended use. Property and equipment are depreciated on a straight- line basis, at rates sufficient to write off their costs over their estimated useful lives. Leasehold improvements are amortized over the shorter of their estimated useful lives or the minimum lease term. Other assets are depreciated as follows:
| | |
Land improvements, buildings and building improvements | | 15–40 years |
Ferries | | 20 years |
Furniture, fittings and equipment | | 3–6 years |
Vehicles | | 5 years |
119
Sands China Ltd.
Notes to the Consolidated Financial Statements—(Continued)
2. Summary of significant accounting policies (continued)
(h) Property and equipment (continued)
Subsequent costs on property and equipment are included in the asset’s carrying amount or recognized as a separate asset, as appropriate, only when it is probable that future economic benefits associated with the item will flow to the Group and the cost of the item can be measured reliably. The carrying amount of the replaced part is derecognized. All other repairs and maintenance are charged to the consolidated income statement during the financial period in which they are incurred.
Construction-in-progress represents property and equipment under construction and is stated at cost. This includes the direct costs of purchase, construction and capitalized borrowing costs. Construction-in-progress is not depreciated until such time as the relevant assets are completed and ready for its intended use and when they are transferred to the relevant asset category.
The assets’ residual values and useful lives are reviewed, and adjusted if applicable, at each balance sheet date. An asset’s carrying amount is written down immediately to its recoverable amount if the asset’s carrying amount is greater than its estimated recoverable amount.
Gains and losses on disposals are determined by comparing the proceeds with the carrying amount and are recognized within “Other expenses” in the consolidated income statement.
(i) Leased assets
Assets acquired pursuant to finance leases and hire purchase contracts that transfer to the Group substantially all the rewards and risks of ownership are accounted for as if purchased.
(j) Intangible assets
(i) Trademarks
Acquired trademarks have a finite useful life and are carried at cost less accumulated amortization and accumulated impairment losses. Trademarks are amortized over their estimated useful lives of 7 years.
(ii) Computer software
Acquired computer software licenses are capitalized on the basis of the costs incurred to acquire and bring to use the specific software. These costs are amortized over their estimated useful lives of 4 years.
(iii) Show production costs
Show production costs include costs of creation, design and initial production of the show. The costs are amortized over the shorter of the contractual run of the show (including any guaranteed renewals), or the estimated useful life of the show, which is assessed at each reporting period.
120
Annual Report 2009
Notes to the Consolidated Financial Statements—(Continued)
2. Summary of significant accounting policies (continued)
(k) Impairment of investments in subsidiaries and non-financial assets
Assets that have an indefinite useful life are not subject to amortization, are tested at least annually for impairment and are reviewed for impairment whenever events or changes in circumstances indicate that the carrying amount may not be recoverable. Assets that are subject to amortization are reviewed for impairment whenever events or changes in circumstances indicate that the carrying amount may not be recoverable. An impairment loss is recognized for the amount by which the asset’s carrying amount exceeds its recoverable amount. The recoverable amount is the higher of an asset’s fair value less costs to sell and value in use. For the purposes of assessing impairment, assets are grouped at the lowest levels for which there are separately identifiable cash flows (i.e. cash generating units or “CGU”). Non-financial assets other than goodwill that suffered impairment are reviewed for possible reversal of the impairment at each reporting date.
Impairment testing of the investments in subsidiaries is required upon receiving dividends from these investments if the dividend exceeds the total comprehensive income of the subsidiary in the period the dividend is declared or if the carrying amount of the investment in the separate financial statements exceeds the carrying amount in the consolidated financial statements of the investee’s net assets including goodwill.
(l) Financial assets
Classification
The Group classifies its financial assets in the following categories: at fair value through profit or loss and loans and receivables. The classification depends on the purpose for which the financial assets were acquired which management determines at initial recognition.
(i) Financial assets at fair value through profit or loss
Financial assets at fair value through profit or loss are financial assets held for trading. A financial asset is classified in this category if acquired principally for the purpose of selling in the short term. Derivatives are classified as held for trading unless they are designated as hedges. Assets in this category are classified as current assets.
(ii) Loans and receivables
Loans and receivables are non-derivative financial assets with fixed or determinable payments that are not quoted in an active market and for which management has no intention of trading. They are included in current assets, except for assets with maturities greater than twelve months after the balance sheet date, which are classified as non-current.
121
Sands China Ltd.
Notes to the Consolidated Financial Statements—(Continued)
2. Summary of significant accounting policies (continued)
(l) Financial assets (continued)
Recognition and measurement
Purchases and sales of financial assets are recognized on the date on which the Group commits to purchase or sell the asset (the trade-date). Investments are initially recognized at fair value plus transaction costs for all financial assets not carried at fair value through profit or loss. Financial assets carried at fair value through profit or loss is initially recognized at fair value and transaction costs are expensed in the consolidated income statement. Financial assets are derecognized when the rights to receive cash flows from the investments have expired or have been transferred, and the Group has transferred substantially all risks and rewards of ownership. Financial assets at fair value through profit or loss are subsequently carried at fair value. Loans and receivables are carried at amortized cost using the effective interest method.
Gains or losses arising from changes in the fair value of the “Financial assets at fair value through profit or loss” category are presented in the consolidated income statement within “Other expenses” in the period in which they arise.
The fair values of quoted investments are based on current bid prices. If the market for a financial asset is not active (or for those securities that are unlisted), the Group establishes fair value by using valuation techniques. These include the use of recent arm’s length transactions, reference to other instruments that are substantially the same, discounted cash flow analysis and option pricing models, making maximum use of market inputs and minimum use of entity-specific inputs.
Impairment of financial assets
The Group assesses at the end of each reporting period whether there is objective evidence that a financial assets or group of financial assets is impaired. A financial asset or a group of financial assets are impaired and impairment losses are incurred only if there is objective evidence of impairment as a result of one or more events that occurred after the initial recognition of the asset (a “loss event”) and that loss event (or events) has an impact on the estimated future cash flows of the financial asset or group of financial assets that can be reliably estimated.
The criteria that the Group uses to determine that there is objective evidence of an impairment loss include:
| | • | | Significant financial difficulty of the issuer or obligor; |
| | • | | A breach of contract, such as a default or delinquency in interest or principal payments; |
| | • | | The Group, for economic or legal reasons relating to the borrower’s financial difficulty, granting to the borrower a concession that the lender would not otherwise consider; |
| | • | | It becomes probable that the borrower will enter bankruptcy or other financial reorganization; |
| | • | | The disappearance of an active market for that financial asset because of financial difficulties; or |
122
Annual Report 2009
Notes to the Consolidated Financial Statements—(Continued)
2. Summary of significant accounting policies (continued)
(l) Financial assets (continued)
Impairment of financial assets (continued)
| | • | | Observable data indicating that there is a measurable decrease in the estimated future cash flows from a portfolio of financial assets since the initial recognition of those assets, although the decrease cannot yet be identified with the individual financial assets in the portfolio, including: |
| | (i) | adverse changes in the payment status of borrowers in the portfolio; |
| | (ii) | national or local economic conditions that correlate with defaults on the assets in the portfolio. |
The Group first assesses whether objective evidence of impairment exists.
The amount of the loss is measured as the difference between the asset’s carrying amount and the present value of estimated future cash flows (excluding future credit losses that have not been incurred) discounted at the financial asset’s original effective interest rate. The asset’s carrying amount of the asset is reduced and the amount of the loss is recognized in the consolidated income statement. If a loan or held-to-maturity investment has a variable interest rate, the discount rate for measuring any impairment loss is the current effective interest rate determined under the contracts. As a practical expedient, the Group may measure impairment on the basis of an instrument’s fair value using an observable market price.
If, in a subsequent period, the amount of the impairment loss decreases and the decrease can be related objectively to an event occurring after the impairment was recognized (such as an improvement in the debtor’s credit rating), the reversal of the previously recognized impairment loss is recognized in the consolidated income statement. Impairment testing of trade and other receivables is described in Note 2(n).
(m) Inventories
Inventories consist primarily of food, beverage, retail products, ferry parts and tobacco and are stated at the lower of cost and net realizable value. Cost is determined using the first-in, first-out method. Net realizable value is the estimated selling price in the ordinary course of business, less applicable selling expenses.
(n) Trade and other receivables
Trade and other receivables are recognized initially at fair value and subsequently measured at amortized cost using the effective interest method, less provision for impairment. A provision for impairment of trade and other receivables is established when there is objective evidence that the Group will not be able to collect all amounts due according to the original terms of the receivables. Significant financial difficulties of the debtor, probability that the debtor will enter bankruptcy or financial reorganization, and default or delinquency in payments are considered indicators that the trade receivable is impaired. The amount of the provision is the difference between the asset’s carrying amount and the present value of estimated future cash flows, discounted at the original effective interest rate. The carrying amount of the assets is reduced through the use of an allowance account, and the amount of the loss is recognized in the consolidated income statement within “Other expenses”. When a trade receivable is uncollectible, it is written off against “Provision for doubtful trade receivables”. Subsequent recoveries of amounts previously written off are credited against “Other expenses” in the consolidated income statement.
123
Sands China Ltd.
Notes to the Consolidated Financial Statements—(Continued)
2. Summary of significant accounting policies (continued)
(o) Cash and cash equivalents
Cash and cash equivalents include cash in hand and short-term deposits with original maturities of three months or less.
(p) Share capital
Ordinary shares are classified as equity.
Incremental costs directly attributable to the issue of new shares are shown in equity as a deduction, net of tax, from the proceeds.
(q) Trade payables
Trade payables are recognized initially at fair value and subsequently measured at amortized cost using the effective interest method.
(r) Borrowings and financing costs
Borrowings are recognized initially at fair value, net of transaction costs incurred. Borrowings are subsequently stated at amortized cost; any difference between the proceeds (net of transaction costs) and the redemption value is recognized in the consolidated income statement over the period of the borrowings using the effective interest method.
Fees paid on the establishment of loan facilities are recognized as transaction costs of the loan to the extent that it is probable that some or all of the facility will be drawn down. In this case, the fee is deferred until the draw-down occurs. To the extent there is no evidence that it is probable that some or all of the facility will be drawn down, the fee is capitalized as a pre-payment of liquidity services and amortized over the period of the facility to which it relates.
Borrowings are classified as current liabilities unless the Group has an unconditional right to defer settlement of the liability for at least twelve months after the balance sheet date.
A qualifying asset is an asset that takes a substantial period of time to get ready for its intended use (Note 2(h)). Financing costs incurred for the construction of any qualifying asset, less any investment income on the temporary investment of related borrowings, are capitalized during the period that is required to complete and prepare the asset for its intended use. Other financing costs, net of interest income, are expensed.
(s) Current and deferred income tax
The income tax expenses comprise current and deferred tax.
Current income tax is calculated on the basis of the tax laws enacted or substantially enacted at the balance sheet date in the countries where the Company and its subsidiaries operate and generate taxable income. Management periodically evaluates positions taken in tax returns with respect to situations in which applicable tax regulation is subject to interpretation and establishes provisions where appropriate on the basis of amounts expected to be paid to the tax authorities.
124
Annual Report 2009
Notes to the Consolidated Financial Statements—(Continued)
2. Summary of significant accounting policies (continued)
(s) Current and deferred income tax (continued)
Deferred income tax is recognized, using the liability method, for temporary differences arising between the tax bases of assets and liabilities and their carrying values in the consolidated financial statements. Deferred income tax is not accounted for if it arises from initial recognition of an asset or a liability in a transaction other than a business combination that, at the time of the transaction, affects neither accounting nor taxable profit or loss. Deferred income tax is determined using tax rates (and laws) that have been enacted or substantially enacted at the balance sheet date and are expected to apply when the related deferred income tax asset is realized or the deferred income tax liability is settled.
Deferred income tax assets are recognized only to the extent that it is probable that future taxable profit will be available against which the temporary differences can be utilized.
Deferred income tax is provided for temporary differences arising from investments in subsidiaries, except when the timing of the reversal of the temporary difference can be controlled and it is probable that the temporary difference will not reverse in the foreseeable future.
Deferred income tax assets and liabilities are offset when there is a legally enforceable right to offset current tax assets against current tax liabilities and when the deferred income tax assets and liabilities relate to income taxes levied by the same taxation authority on either the taxable entity or different taxable entities where there is an intention to settle the balances on a net basis.
(t) Employee benefits
(i) Pension obligations
The Group operates a provident fund scheme, which is funded through payments to an insurance company. The provident fund scheme is a defined contribution plan that is available to certain permanent employees after a three-month probation period. The Group contributes 5% of each employee’s base salary to the fund and the employee is eligible to receive 30% of these contributions after working for three consecutive years, gradually increasing to 100% after working for ten years. The Group has no further payment obligations once the contributions have been paid. The contributions are recognized as employee benefit expenses when they are due. Prepaid contributions are recognized as an asset to the extent that a cash refund or a reduction in the future payments is available.
(ii) Share-based compensation
(1) Share options of the Company
The cash subscribed for the shares issued when the options are exercised is credited to share capital
(nominal value) and share premium, net of any directly attributable transaction costs.
The grant by the Company of options over its equity instruments to the employees of subsidiary undertakings in the Group is treated as a capital contribution. The fair value of employee services received, measured by reference to the grant date fair value, is recognized over the vesting period as an increase to investment in subsidiary undertakings, with a corresponding credit to equity.
125
Sands China Ltd.
Notes to the Consolidated Financial Statements—(Continued)
2. Summary of significant accounting policies (continued)
(t) Employee benefits (continued)
(ii) Share-based compensation (continued)
(2) Share options of LVS
The Group participates in the equity settled share-based compensation plans of LVS and is a party to its nonqualified share option plan, Las Vegas Sands Corp. 2004 Equity Award Plan (the “2004 Plan”). The plan provides for the granting of share options pursuant to the applicable provisions of the Internal Revenue Code and regulations in the United States of America.
The fair value of the employee services received in exchange for the grant of the options is recognized as an expense. The total amount to be expensed is determined by reference to the fair value of the options granted, excluding the impact of any non-market service and performance vesting conditions (for example, profitability, sales growth targets and remaining an employee of the entity over a specified time period). Non-market vesting conditions are included in assumptions about the number of options that are expected to vest. The total amount expensed is recognized over the vesting period, which is the period over which all of the specified vesting conditions are to be satisfied. At each balance sheet date, the Group revises its estimates of the number of options that are expected to vest based on the non-market vesting conditions.
Share-based compensation expense arising from the granting of share options by LVS to the Directors and employees of the Group, to the extent of services rendered to the Group, is deemed to have been allocated to the Group as an expense with the corresponding increase in the share option reserve under equity.
(iii) Social security fund
Full-time employees of the Group are covered by a government-mandated defined contribution plan pursuant to which a fixed amount of retirement benefit would be determined and paid by the Macao Government. Contributions are generally made by both employees and employers by paying a fixed amount on a monthly basis to the Social Security Fund Contribution managed by the Macao Government. The Group funds the entire contribution and has no further commitments beyond its monthly contributions.
(iv) Annual leave and other paid leave
Through December 31, 2008, employee entitlements to annual leave and sick leave are recognized when they accrue to employees. A provision is made for the estimated liability for annual leave as a result of services rendered by employees during the year. Employee entitlement to maternity leave is not recognized until the time of leave.
Beginning January 1, 2009, employee entitlement to sick leave is not recognized until the time of leave, whereas employee entitlements to annual leave and maternity leave remain the same.
126
Annual Report 2009
Notes to the Consolidated Financial Statements—(Continued)
2. Summary of significant accounting policies (continued)
(t) Employee benefits (continued)
(v) Termination benefits
Termination benefits are payable when employment is terminated by the Group before the normal retirement date, or whenever an employee accepts voluntary redundancy in exchange for these benefits. The Group recognizes termination benefits when it is demonstrably committed to either: terminating the employment of current employees according to a detailed formal plan without possibility of withdrawal; or providing termination benefits as a result of an offer made to encourage voluntary redundancy. Benefits falling due more than twelve months after the balance sheet date are discounted to present value.
(u) Provisions
Provisions are recognized when: the Group has a present legal or constructive obligation as a result of past events; it is probable that an outflow of resources will be required to settle the obligation; and the amount has been reliably estimated. Provisions are not recognized for future operating losses.
Where there are a number of similar obligations, the likelihood that an outflow of resources will be required in settlement is determined by considering the class of obligations as a whole. A provision is recognized even if the likelihood of an outflow of resources with respect to any one item included in the same class of obligations may be small.
Provisions are measured at the present value of management’s best estimate of the expenditure required to settle the present obligation at the reporting date. The discount rate used to determine the present value reflects current market assessments of the time value of money and the risks specific to the liability. The increase in the provision due to the passage of time is recognized as interest expense.
(v) Contingent liabilities
A contingent liability is a possible obligation that arises from past events and whose existence will only be confirmed by the occurrence or non-occurrence of one or more uncertain future events not wholly within the control of the Group. It can also be a present obligation arising from past events that is not recognized because it is not probable that an outflow of economic resources will be required or the amount of the obligation cannot be measured reliably.
A contingent liability is not recognized but is disclosed in the consolidated financial statements unless the probability of outflow of resources embodying economic benefits is remote. When a change in the probability of an outflow occurs so that the outflow is probable, it will then be recognized as a provision.
(w) Revenue recognition
Revenue comprises the fair value of the consideration received or receivable for the sale of goods and services in the ordinary course of the Group’s activities.
The Group recognizes revenue when the amount of revenue can be reliably measured, it is probable that future economic benefits will flow to the entity and specific criteria have been met for each of the Group’s activities as described below. The amount of revenue is not considered to be reliably measurable until all contingencies relating to the sale have been resolved. The Group bases its estimates on historical results, taking into consideration the type of customer, the type of transaction and the specifics of each arrangement.
127
Sands China Ltd.
Notes to the Consolidated Financial Statements—(Continued)
2. Summary of significant accounting policies (continued)
(w) Revenue recognition (continued)
(i) Casino revenue
Casino revenue is the aggregate of gaming wins and losses. Commissions rebated directly or indirectly through gaming promoters to customers, cash discounts and other cash incentives to customers related to gaming play are recorded as a reduction of gross casino revenue. Gaming promoters are entities that bring in high-roller customers to casinos and loan them rolling chips.
(ii) Hotel revenue
Hotel revenue is recognized at the time of occupancy.
(iii) Food and beverage revenue
Food and beverage revenue is recognized at the time of service.
(iv) Lease/right of use income
Lease/right of use income from the grant of right of use (net of any incentives given to tenants/retailers) is recognized on a straight-line basis over the terms of the lease/right of use.
(v) Convention revenue
Convention revenue is recognized when the event is held or the related services are rendered.
(vi) Retail sales
Sales of goods are recognized on the transfer of risks and rewards of ownership, which generally coincides with the time when the products are delivered to customers and title has passed.
The Group has a goods return policy. Sales are recorded net of return and discounts.
(vii) Mall management fees
Mall management fees are recognized when services are rendered.
(viii) Entertainment revenue
Entertainment revenue derived from theater shows, concerts and sporting events is recognized at the time of performance.
(ix) Ferry ticket sales
Ferry ticket sales are recognized when the services are rendered.
(x) Commission revenue
Commission revenues from the selling of tickets and travel packages and providing destination marketing services are recognized when services are rendered.
(xi) Interest income
Interest income is recognized on a time-proportion basis using the effective interest method.
128
Annual Report 2009
Notes to the Consolidated Financial Statements—(Continued)
2. Summary of significant accounting policies (continued)
(x) Leases/right of use
(i) As the lessor/grantor for operating leases/right of use
When assets are leased/granted out under an agreement for the right of use, the asset is included in the consolidated balance sheet based on the nature of the asset. Lease rental/income from right of use (net of any incentives given to tenants or to retailers) is recognized over the terms of the lease/right of use on a straight- line basis.
(ii) As the lessee for operating leases
Leases in which a significant portion of the risks and rewards of ownership are retained by the lessor are classified as operating leases. Payments made under operating leases (net of any incentives received from the lessor) are charged to the consolidated income statement on a straight-line basis over the period of the lease.
(iii) As the lessee for finance leases
The Group leases certain equipment. Leases of equipment where the Group has substantially all the risks and rewards of ownership are classified as finance leases. Finance leases are capitalized at the lease’s commencement at the lower of the fair value of the leased assets and the present value of the minimum lease payments.
Each lease payment is allocated between the liability and finance charges so as to achieve a constant rate on the finance balance outstanding. The corresponding rental obligations, net of finance charges, are included in borrowings. The interest element of the finance cost is charged to the consolidated income statement over the lease period so as to produce a constant periodic rate of interest on the remaining balance of the liability for each period. The equipment acquired under a finance lease is depreciated over the shorter of the useful life of the asset and the lease term.
3. Financial risk management
(a) Financial risk factors
The Group’s activities expose it to a variety of financial risks: market risk, credit risk and liquidity risk. The Group’s overall risk management program, mainly carried out by a central treasury department, focuses on the unpredictability of financial markets and seeks to minimize potential adverse effects on the Group’s financial performance.
(i) Market risk
Market risk is the risk of loss arising from adverse changes in market rates and prices, such as interest rates and foreign currency exchange rates.
Cash flow and fair value interest rate risk
The Group’s primary exposure to market risk is interest rate risk associated with its long-term borrowings, which are all issued at variable rates. The Group attempts to manage the interest rate risk associated with its variable-rate borrowings by use of interest rate cap agreements. During the year ended December 31, 2009, the Group’s borrowings at variable rate were denominated in “US$”, Hong Kong dollars (“HK$”) and MOP.
129
Sands China Ltd.
Notes to the Consolidated Financial Statements—(Continued)
3. Financial risk management (continued)
(a) Financial risk factors (continued)
(i) Market risk (continued)
As of December 31, 2009, if interest rates on US$-denominated borrowings had been 50 basis-point higher/ lower with all other variables held constant, post-tax profit for the year would have been US$12.8 million lower/higher (2008: US$16.7 million). As of December 31, 2009, if interest rates on HK$-denominated borrowings had been 50 basis-point higher/lower with all other variables held constant, post-tax profit for the year would have been US$1.1 million lower/higher (2008: US$1.1 million). As of December 31, 2009, if interest rates on MOP-denominated borrowings had been 50 basis-point higher/lower with all other variables held constant, post-tax profit would have been approximately US$0.4 million lower/higher (2008: US$0.5 million).
The Group does not hold or issue financial instruments for trading purposes and does not enter into derivative transactions that would be considered speculative positions. The Group’s derivative financial instruments consist exclusively of interest rate cap agreements, which do not qualify for hedge accounting.
To manage exposure to counterparty credit risk in interest rate cap agreements, the Group enters into agreements with highly rated institutions that can be expected to fully perform under the terms of such agreements. Frequently, these institutions are also members of the bank group providing the Group’s credit facilities, which management believes further minimizes the risk of non-performance.
Foreign exchange risk
The Group’s foreign currency transactions are mainly denominated in US$. The majority of assets and liabilities are denominated in US$, HK$ and MOP, and there are no significant assets and liabilities denominated in other currencies. The Group is subject to foreign exchange rate risk arising from future commercial transactions and recognized assets and liabilities that are denominated in a currency other than MOP, which is the functional currency of the major operating companies within the Group. The Group currently does not have a foreign currency hedging policy.
For companies with MOP as their functional currency, as of December 31, 2009, if the US$ and HK$ had weakened/strengthened by 1% against the MOP with all other variables held constant, pre-tax profit for the year would have been higher/lower by approximately US$25.4 million (2008: US$44.1 million) and US$8.6 million (2008: US$2.7 million), respectively, mainly as a result of the translation of US$-denominated cash and cash equivalents, deposits and borrowings.
(ii) Credit risk
Financial instruments, which potentially subject the Group to concentrations of credit risk, consist principally of cash and cash equivalents, restricted cash and trade and other receivables.
The Group maintains cash and cash equivalents, and restricted cash with various credit worthy financial institutions in Macao, Hong Kong, Singapore and the United States of America. Management monitors this credit risk on an on-going basis and does not believe that the Group has any other significant exposure to any individual or institution as of December 31, 2009.
130
Annual Report 2009
Notes to the Consolidated Financial Statements—(Continued)
3. Financial risk management (continued)
(a) Financial risk factors (continued)
(ii) Credit risk (continued)
Trade receivables are principally comprised of casino, hotel and mall receivables. The Group extends credit to approved customers, tenants and gaming promoters following background checks and investigations of creditworthiness. Business or economic conditions, the legal enforceability of gaming debts, or other significant events in foreign countries could affect the collectability of receivables from customers and gaming promoters residing in these countries.
The Group maintains an allowance for doubtful casino, hotel and mall accounts and regularly evaluates the balances. The Group specifically analyzes the collectability of each account with a balance over a specified dollar amount, based upon the age of the account, the customer’s financial condition, collection history and any other known information, and the Group makes an allowance for trade receivables specifically identified as doubtful. The Group also monitors regional and global economic conditions and forecasts in its evaluation of the adequacy of the recorded reserves. Table games play is primarily cash play, as credit play represented approximately 31.4% of total table games play for the year ended December 31, 2009 (2008: 29.4%). The Group believes that the concentration of its credit risk in casino receivables is mitigated substantially by its credit evaluation process, credit policies, credit control and collection procedures, and also believes that no significant credit risk is inherent in the Group’s trade receivables not provided for as of December 31, 2009 (see Note 21 for further details).
(iii) Liquidity risk
Liquidity risk is the financial risk arising from the difficulty of selling assets, being unable to pay off liabilities upon maturity, funding growth assets or meeting contractual commitments.
The credit agreement entered by VML US Finance LLC (“VMLF”), a wholly-owned subsidiary (the “Borrower”), and Venetian Macau Limited (“VML”), a wholly-owned subsidiary, Venetian Cotai Limited (“VCL”), a wholly- owned subsidiary, and certain other subsidiaries within the Group (collectively, the “Guarantors”) dated May 25, 2006 (the “Macao Credit Facility”), requires VML and its restricted companies (collectively, the “Restricted Group”) to comply with certain financial covenants at the end of each quarter, including maintaining a maximum leverage ratio of the consolidated total debt outstanding, as defined in the Macao Credit Facility. In August 2009, an amendment was made to the Macao Credit Facility, which, among other things, increased the maximum leverage ratios for the quarters beginning after June 30, 2009. The maximum leverage ratios were increased to 4.5:1.0 for the quarters ending September 30 and December 31, 2009, 4.0:1.0 for the quarters ending March 31, June 30, 2010, 3.5:1.0 for the quarters ending September 30 and December 31, 2010 and 3.0:1.0 for all quarterly periods through maturity. If the Restricted Group is unable to maintain compliance with these financial covenants, the Restricted Group would be in default under the Macao Credit Facility, which would trigger a cross-default under the ferry financings (see Note 28). Any defaults or cross defaults under these agreements would allow the lenders, in each case, to exercise their rights to accelerate the due dates of the indebtedness outstanding. There can be no assurance that the Group would be able to pay or refinance any amounts that may become accelerated under such agreements and other obligations when they fall due, which could force the Group to restructure or alter its operations or debt obligation. In order to comply with the maximum leverage ratio covenants, the Group will utilize cash on hand and cash flows from operations and other measures, including cost-cutting initiatives.
131
Sands China Ltd.
Notes to the Consolidated Financial Statements—(Continued)
3. Financial risk management (continued)
(a) Financial risk factors (continued)
(iii) Liquidity risk (continued)
The Group’s financial liabilities, based on the contractual undiscounted cash flows, as of December 31, 2009 are as follows:
| | | | | | | | | | |
| | | Within the
first year
US$’000 | | In the
second
year
US$’000 | | In the
third to
fifth year
US$’000 | | Over the
fifth year
US$’000 | | Total
US$’000 |
| | | | | |
At December 31, 2009 | | | | | | | | | | |
Bank borrowings | | 252,401 | | 1,018,122 | | 2,011,636 | | 47,495 | | 3,329,654 |
Finance lease liabilities | | 255 | | 205 | | 106 | | — | | 566 |
Trade and other payables | | 818,471 | | — | | 12,570 | | — | | 831,041 |
| | | | | |
At December 31, 2008 | | | | | | | | | | |
Bank borrowings | | 141,125 | | 200,856 | | 3,447,470 | | 127,449 | | 3,916,900 |
Notes payable to related companies | | 6,374 | | 6,588 | | 174,093 | | — | | 187,055 |
Finance lease liabilities | | 257 | | 269 | | 306 | | — | | 832 |
Trade and other payables | | 1,982,042 | | — | | 12,409 | | 254 | | 1,994,705 |
(b) Capital risk management
The Group’s primary objective when managing capital is to safeguard the Group’s ability to continue as a going concern in order to provide returns for shareholders and benefits for other stakeholders, by pricing products and services commensurately with the level of risk.
The capital structure of the Group consists of debt, which includes borrowings (including current and non-current borrowings as shown in the consolidated balance sheet), cash and cash equivalents, and equity attributable to shareholders, comprising issued share capital and reserves as disclosed in Notes 25 and 26.
132
Annual Report 2009
Notes to the Consolidated Financial Statements—(Continued)
3. Financial risk management (continued)
(b) Capital risk management (continued)
The Group actively and regularly reviews and manages its capital structure to maintain the net debt-to-capital ratio (gearing ratio) at an appropriate level based on its assessment of the current risk and circumstances. This ratio is calculated as net debt divided by total capital. Net debt is calculated as total borrowings less cash and cash equivalents. Total capital is calculated as equity as shown in the consolidated balance sheet plus net debt:
| | | | | | |
| | | As of December 31, | |
| | | 2009
US$’000 | | | 2008
US$’000 | |
| | |
Total borrowings (Note 28) | | 2,819,297 | | | 3,643,160 | |
Less: cash and cash equivalents (Note 24) | | (908,334 | ) | | (417,769 | ) |
| | | | | | |
| | |
Net debt | | 1,910,963 | | | 3,225,391 | |
Total equity | | 3,685,392 | | | 1,249,534 | |
| | | | | | |
| | |
Total capital | | 5,596,355 | | | 4,474,925 | |
| | | | | | |
| | |
Gearing ratio | | 34 | % | | 72 | % |
| | | | | | |
(c) Fair value estimation
Effective January 1, 2009 the Group adopted the amendment to IFRS 7 for financial instruments that are measured in the consolidated balance sheet at fair value, this requires disclosures of fair value measurements by level of the following fair value hierarchy:
| | • | | Quoted prices (unadjusted) in active markets for identical assets or liabilities (level 1). |
| | • | | Inputs other than quoted prices included within level 1 that are observable for the asset or liability, either directly (that is, as prices) or indirectly (that is, derived from prices) (level 2). |
| | • | | Inputs for the asset or liability that are not based on observable market data (that is, unobservable inputs) (level 3). |
The following table presents the Group’s assets and liabilities that are measured at fair value as of December 31, 2009.
| | | | | | | | |
| | | Level 1
US$’000 | | Level 2
US$’000 | | Level 3
US$’000 | | Total
US$’000 |
| | | | |
Interest rate cap | | — | | 1,529 | | — | | 1,529 |
| | | | | | | | |
The carrying amounts of cash and cash equivalents, restricted cash, trade and other receivables, borrowings and trade and other payables approximate their fair values.
133
Sands China Ltd.
Notes to the Consolidated Financial Statements—(Continued)
3. Financial risk management (continued)
(c) Fair value estimation (continued)
The Group has one interest rate cap agreement with fair value of approximately US$1.5 million, based on quoted market values from the institution holding the agreement as of December 31, 2009.
4. Critical accounting estimates and judgments
Estimates and judgments are continually evaluated and are based on historical experience and other factors, including expectations of future events that are believed to be reasonable under the circumstances.
The Group makes estimates and assumptions concerning the future. The resulting accounting estimates will, by definition, seldom equal the related actual results. The estimates and assumptions that have a significant risk of causing a material adjustment to the carrying amounts of assets and liabilities within the next financial year are addressed below.
(a) Construction project suspension
The Group had commenced construction or pre-construction on Parcels 3, 5, 6, 7 and 8 of Cotai Strip and had capitalized the costs in the consolidated balance sheet, but has suspended these projects given the current conditions in the financial markets and the global economy. These disruptions in the financial markets could adversely affect the Group’s ability to raise additional financing required to complete those projects. Should general economic conditions fail to improve, if the Group is unable to obtain sufficient funding such that completion of the suspended projects is not probable, or should management decide to abandon certain projects, all or a portion of the Group’s investment to date on the suspended projects could be lost and would result in an impairment charge. This could adversely affect the financial condition, results of operations or cash flows from these planned facilities.
In addition, under the revised terms of the land concession that covers Parcel 3 approved by the Macao Government on August 20, 2009, the Group is required to complete development of Parcel 3 by April 17, 2013. Management believes that if the Group is unable to complete the development of Parcel 3 by the deadline, it will be able to obtain an extension from the Macao Government; however, no assurances can be given that an extension will be granted. If the Group is not able to meet the April 2013 deadline and that deadline is not extended, the Macao Government has the right to unilaterally terminate the land concession or any properties developed under the land concession for Parcel 3 without compensation to the Group.
(b) Useful lives of investment properties and property and equipment
The Group depreciates investment properties and property and equipment on a straight-line basis over their estimated useful lives. The estimated useful lives are based on the nature of the assets, as well as current operating strategy and legal considerations, such as contractual life. Future events, such as property expansions, property developments, new competition or new regulations, could result in a change in the manner in which the Group uses certain assets and could have impact on the estimated useful lives of such assets.
134
Annual Report 2009
Notes to the Consolidated Financial Statements—(Continued)
4. Critical accounting estimates and judgments (continued)
(c) Impairment of assets
The Group follows the guidance of IAS 36 “Impairment of Assets” to determine when assets are impaired, which requires significant judgment. In making this judgment, the Group evaluates, among other factors, the duration and extent to which the recoverable amount of assets is less than their carrying balance, including factors such as the industry performance and changes in operational and financing cash flows. The recoverable amount of the CGU has been determined based on value-in-use calculations. These calculations require the use of estimates, including operating results, income and expenses of the business, future economic conditions on growth rates and future returns.
Changes in the key assumptions on which the recoverable amount of the assets is based could significantly affect the Group’s financial condition and results of operations.
(d) Allowance for doubtful trade receivables
The allowance for doubtful trade receivables represents the Group’s best estimate of the amount of probable credit losses in the Group’s existing trade receivable balance. The Group determines the allowance based on specific customer information, historical write-off experience and current industry and economic data. Account balances are charged off against the allowance when the Group believes it is probable the receivables will not be recovered. Management believes that there are no concentrations of credit risk for which an allowance has not been established. Although management believes that the allowance is adequate, it is possible that the estimated amount of cash collections with respect to trade receivables could change.
(e) Litigation provisions
The Group is subject to various claims and legal actions. The accruals for these claims and legal actions are estimated in accordance with IAS 37 “Provisions, Contingent Liabilities and Contingent Assets”. Based on consultation with legal counsel, management estimated that no significant loss would be incurred beyond the amounts provided.
(f) Share-based compensation
The Group’s employees participate in equity award plans of LVS. Management of the Group uses the Black- Scholes option-pricing model to determine the total fair value of the options granted, which is based on fair value and various attributes of the underlying shares of LVS. Significant estimates and assumptions are required to be made in determining the parameters for applying the Black-Scholes option-pricing model, including estimates and assumptions regarding the risk-free rate of return, expected dividend yield and volatility of the underlying shares and the expected life of the options. The total fair value of restricted shares (“RSs”) granted is measured on the grant date based on the fair value of the underlying shares of LVS. In addition, the Group is required to estimate the expected percentage of grantees that will remain in employment with the Group at the end of the vesting period. The Group only recognizes an expense for those options or RSs expected to vest over the vesting period during which the grantees become unconditionally entitled to the options or RSs. These estimates and assumptions could have a material effect on the determination of the fair value of the share options and RSs and the amount of such equity awards expected to vest, which may in turn significantly impact the determination of the share-based compensation expense.
135
Sands China Ltd.
Notes to the Consolidated Financial Statements—(Continued)
4. Critical accounting estimates and judgments (continued)
(f) Share-based compensation (continued)
The fair value of the options and RSs at the time of grant is to be expensed over the vesting period of the options and RSs based on an accelerated graded attribution approach. Under the accelerated graded attribution approach, each vesting installment of a graded vesting award is treated as a separate share option or RSs grant, which means that each vesting installment will be separately measured and attributed to expense, resulting in accelerated recognition of share-based compensation expense.
5. Net revenues and interest income
| | | | | | |
| | | | | Year ended December 31, |
| | | Note | | 2009
US$’000 | | 2008
US$’000 |
| | | |
Net revenues | | | | | | |
Casino | | | | 2,888,545 | | 2,669,661 |
Rooms | | | | 123,431 | | 139,953 |
Food and beverage | | | | 61,991 | | 54,317 |
Mall | | | | | | |
— Income from right of use | | | | 110,259 | | 95,804 |
— Management fees and others | | | | 27,030 | | 27,234 |
Convention, ferry, retail and other | | | | 89,858 | | 66,350 |
| | | | | | |
| | | |
| | | | 3,301,114 | | 3,053,319 |
| | | | | | |
| | | |
Interest income | | | | | | |
Notes receivable from a related company | | 33 (a)(ii) | | 28 | | 46 |
Bank deposits | | | | 499 | | 4,755 |
| | | | | | |
| | | |
| | | | 527 | | 4,801 |
| | | | | | |
| | | |
Total net revenues and interest income | | | | 3,301,641 | | 3,058,120 |
| | | | | | |
6. Segment information
Management has determined the operating segments based on the reports reviewed by a group of senior management to make strategic decisions. The Group considers the business from a property and service perspective.
The Group’s principal operating and developmental activities occur in Macao, which is the sole geographic area that the Group domiciles. The Group reviews the results of operations for each of its key operating segments, which are also the reportable segments: Sands Macao, The Venetian Macao, The Plaza Macao, Ferry and other operations and Other developments (on Parcels 3, 5, 6, 7 and 8 of the Cotai Strip).
136
Annual Report 2009
Notes to the Consolidated Financial Statements—(Continued)
6. Segment information (continued)
Sands Macao, The Venetian Macao, The Plaza Macao and other developments derive their revenue primarily from casino, hotel, food and beverage, mall, convention, retail and others sources. Ferry and other operations mainly derive their revenue from the sale of ferry tickets for transportation between Hong Kong and Macao.
The Group’s segment information is as follows:
| | | | | | |
| | | Year ended December 31, | |
| | | 2009
US$’000 | | | 2008
US$’000 | |
| | |
Net revenues: | | | | | | |
Sands Macao | | 1,020,055 | | | 1,032,121 | |
The Venetian Macao | | 1,984,723 | | | 1,941,636 | |
The Plaza Macao | | 260,571 | | | 62,536 | |
Ferry and other operations | | 35,765 | | | 17,026 | |
Other developments | | — | | | — | |
| | | | | | |
| | |
| | 3,301,114 | | | 3,053,319 | |
| | | | | | |
| | |
Adjusted EBITDAR (unaudited) (Note): | | | | | | |
Sands Macao | | 243,379 | | | 214,434 | |
The Venetian Macao | | 554,772 | | | 497,166 | |
The Plaza Macao | | 40,307 | | | 7,329 | |
Ferry and other operations | | (29,422 | ) | | (32,885 | ) |
Other developments | | — | | | — | |
| | | | | | |
| | |
| | 809,036 | | | 686,044 | |
| | | | | | |
| | |
Depreciation and amortization: | | | | | | |
Sands Macao | | (46,786 | ) | | (51,127 | ) |
The Venetian Macao | | (206,390 | ) | | (192,322 | ) |
The Plaza Macao | | (54,045 | ) | | (16,402 | ) |
Ferry and other operations | | (12,936 | ) | | (8,339 | ) |
Other developments | | (244 | ) | | (30 | ) |
| | | | | | |
| | |
| | (320,401 | ) | | (268,220 | ) |
| | | | | | |
137
Sands China Ltd.
Notes to the Consolidated Financial Statements—(Continued)
6. Segment information (continued)
| | | | | | |
| | | Year ended December 31, | |
| | | 2009
US$’000 | | | 2008
US$’000 | |
| | |
Interest expense, net of amounts capitalized: | | | | | | |
Sands Macao | | 1,176 | | | 1,191 | |
The Venetian Macao | | 74,399 | | | 83,020 | |
The Plaza Macao | | 20,154 | | | 22,198 | |
Ferry and other operations | | 19,837 | | | 7,067 | |
Other developments | | 34,719 | | | 9,394 | |
| | | | | | |
| | |
| | 150,285 | | | 122,870 | |
| | | | | | |
| | |
Income tax expenses: | | | | | | |
Sands Macao | | — | | | — | |
The Venetian Macao | | — | | | — | |
The Plaza Macao | | — | | | — | |
Ferry and other operations | | (201 | ) | | (169 | ) |
Other developments | | — | | | — | |
| | | | | | |
| | |
| | (201 | ) | | (169 | ) |
| | | | | | |
| Note: | Adjusted EBITDAR is profit before interest, income taxes, depreciation and amortization (net of amortization of show production costs), pre-opening expense, net foreign exchange losses or gains, loss or gain on disposal of property and equipment, corporate expense, land lease expense, share- based compensation, fair value losses or gains on financial assets at fair value through profit or loss and loss on modification or early retirement of debt. Adjusted EBITDAR is used by management as the primary measure of operating performance of the Group’s properties and to compare the operating performance of the Group’s properties with that of its competitors. However, adjusted EBITDAR should not be considered in isolation; construed as an alternative to profit or operating profit; as an indicator of the Group’s IFRS operating performance, other combined operations or cash flow data; or as an alternative to cash flow as a measure of liquidity. As a result, adjusted EBITDAR as presented by the Group may not be directly comparable to other similarly titled measures presented by other companies. |
138
Annual Report 2009
Notes to the Consolidated Financial Statements—(Continued)
6. Segment information (continued)
| | | | | | | | |
| | | | | Year ended December 31, | |
| | | Note | | 2009
US$’000 | | | 2008
US$’000 | |
| | | |
Adjusted EBITDAR (unaudited) | | | | 809,036 | | | 686,044 | |
Share-based compensation granted to employees by LVS | | | | (7,702 | ) | | (15,163 | ) |
Corporate expense | | (a) | | (11,516 | ) | | (14,747 | ) |
Land lease expense | | | | (12,903 | ) | | (11,885 | ) |
Pre-opening expense | | (b) | | (82,234 | ) | | (111,435 | ) |
Depreciation and amortization | | | | (320,401 | ) | | (268,220 | ) |
Amortization of show production costs | | | | 4,223 | | | 1,867 | |
Net foreign exchange (losses)/gains | | | | (1,241 | ) | | 29,179 | |
Loss on disposal of property and equipment | | | | (6,042 | ) | | (1,622 | ) |
Fair value losses on financial assets at fair value through profit or loss | | | | (1,239 | ) | | (44 | ) |
| | | | | | | | |
| | | |
Operating profit | | | | 369,981 | | | 293,974 | |
Interest income | | | | 527 | | | 4,801 | |
Interest expense, net of amounts capitalized | | | | (150,285 | ) | | (122,870 | ) |
Loss on modification or early retirement of debt | | | | (6,186 | ) | | — | |
| | | | | | | | |
| | | |
Profit before income tax | | | | 214,037 | | | 175,905 | |
Income tax expenses | | | | (201 | ) | | (169 | ) |
| | | | | | | | |
| | | |
Profit for the year attributable to equity holders of the Company | | | | 213,836 | | | 175,736 | |
| | | | | | | | |
(a) Corporate expense
| | | | | | |
| | | | | Year ended December 31, |
| | | Note | | 2009
US$’000 | | 2008
US$’000 |
| | | |
Management fees | | 33(a)(i) | | 5,625 | | 7,227 |
Employee benefit expenses | | | | 2,954 | | 4,154 |
Royalty fees | | 33(a)(vi) | | 1,753 | | — |
Professional fees | | | | 46 | | 2,361 |
Other expenses | | | | 1,138 | | 1,005 |
| | | | | | |
| | | |
| | | | 11,516 | | 14,747 |
| | | | | | |
139
Sands China Ltd.
Notes to the Consolidated Financial Statements—(Continued)
6. Segment information (continued)
(b) Pre-opening expense
| | | | | | |
| | | | | Year ended December 31, |
| | | Note | | 2009
US$’000 | | 2008
US$’000 |
| | | |
Suspension costs | | | | 65,422 | | 33,581 |
Employee benefit expenses | | | | 12,235 | | 37,801 |
Professional fees | | | | 1,231 | | 6,192 |
Management fees | | 33 (a)(i) | | 532 | | 7,207 |
Advertising costs | | | | 37 | | 6,593 |
Utilities and fuel costs | | | | 9 | | 2,308 |
Other expenses | | | | 2,768 | | 17,753 |
| | | | | | |
| | | |
| | | | 82,234 | | 111,435 |
| | | | | | |
Amounts above exclude share-based compensation granted to employees by LVS.
| | | | |
| | | As of December 31, |
| | | 2009
US$’000 | | 2008
US$’000 |
| | |
Total assets | | | | |
Sands Macao | | 527,737 | | 592,998 |
The Venetian Macao | | 2,883,177 | | 3,182,554 |
The Plaza Macao | | 1,151,028 | | 973,892 |
Ferry and other operations | | 778,022 | | 277,106 |
Other developments | | 1,995,938 | | 1,861,081 |
| | | | |
| | |
| | 7,335,902 | | 6,887,631 |
| | | | |
As of December 31, 2009, included in Ferry and other operations is an amount of approximately US$510.6 million of cash and bank balances of the Company, which was derived from the global offering of the Company and will be allocated to the respective segments according to the Group’s business plan.
140
Annual Report 2009
Notes to the Consolidated Financial Statements—(Continued)
6. Segment information (continued)
| | | | |
| | | As of December 31, |
| | | 2009
US$’000 | | 2008
US$’000 |
| | |
Total non-current assets | | | | |
Held locally | | 5,867,475 | | 5,817,154 |
Held in foreign countries | | 236,249 | | 229,575 |
Deferred income tax assets | | 113 | | 159 |
Financial assets at fair value through profit or loss | | 1,529 | | — |
| | | | |
| | |
| | 6,105,366 | | 6,046,888 |
| | | | |
7. Employee benefit expenses (including Directors’ emoluments)
| | | | |
| | | Year ended December 31, |
| | | 2009
US$’000 | | 2008
US$’000 |
| | |
Wages, salaries, bonus and termination costs | | 420,403 | | 448,829 |
Staff meals | | 22,735 | | 29,963 |
Share-based compensation | | 7,702 | | 15,163 |
Pension costs — defined contribution plan | | 4,907 | | 17,494 |
Other employee benefit expenses | | 7,148 | | 6,461 |
| | | | |
| | |
| | 462,895 | | 517,910 |
| | | | |
Total amounts of share-based compensation and the amounts capitalized are as below:
| | | | | | | | |
| | | | | Year ended December 31, | |
| | | Note | | 2009
US$’000 | | | 2008
US$’000 | |
| | | |
Share-based compensation granted to employees by LVS | | 34 | | 8,513 | | | 17,538 | |
Less: amount capitalized | | | | (811 | ) | | (2,375 | ) |
| | | | | | | | |
| | | |
Share-based compensation charged to the consolidated income statement | | | | 7,702 | | | 15,163 | |
| | | | | | | | |
141
Sands China Ltd.
Notes to the Consolidated Financial Statements—(Continued)
7. Employee benefit expenses (including Directors’ emoluments) (continued)
Other than the share-based compensation of US$0.8 million capitalized for the construction of the apart-hotel tower of The Plaza Macao for the year ended December 31, 2009, capitalization of share-based compensation ceases upon suspension of the respective Cotai Strip development projects (see also Note 31(d)).
(a) Pension costs — defined contribution plan
Contributions totaling US$1.4 million remained payable to the provident fund as of December 31, 2009 (2008: US$3.4 million).
(b) Directors’ emoluments
The remuneration of the Company’s Directors is as follows:
| | | | | | | | | | | | |
| | | Fees
US$’000 | | Salaries,
discretionary
bonuses,
allowance
and benefits
in kind
US$’000 | | Contribution
to defined
contribution
benefit plans
US$’000 | | Subtotal
US$’000 | | Share-based
compensation
benefits
US$’000 | | Total
US$’000 |
| | | | | | |
Year ended December 31, 2009 | | | | | | | | | | | | |
| | | | | | |
Executive Directors | | | | | | | | | | | | |
Steven Craig Jacobs | | — | | 1,389 | | — | | 1,389 | | 2,137 | | 3,526 |
Stephen John Weaver | | — | | 1,367 | | — | | 1,367 | | 824 | | 2,191 |
| | | | | | |
Non-Executive Directors | | | | | | | | | | | | |
Sheldon Gary Adelson | | — | | — | | — | | — | | — | | — |
Jeffrey Howard Schwartz | | 11 | | — | | — | | 11 | | — | | 11 |
Irwin Abe Siegel | | 11 | | — | | — | | 11 | | — | | 11 |
| | | | | | |
Independent Non-Executive Directors | | | | | | | | | | | | |
Iain Ferguson Bruce | | 14 | | — | | — | | 14 | | — | | 14 |
Chiang Yun | | 11 | | — | | — | | 11 | | — | | 11 |
David Muir Turnbull | | 11 | | — | | — | | 11 | | — | | 11 |
| | | | | | | | | | | | |
| | | | | | |
| | 59 | | 2,756 | | — | | 2,815 | | 2,961 | | 5,776 |
| | | | | | | | | | | | |
142
Annual Report 2009
Notes to the Consolidated Financial Statements—(Continued)
7. Employee benefit expenses (including Directors’ emoluments) (continued)
(b) Directors’ emoluments (continued)
| | | | | | | | | | | | |
| | | Fees
US$’000 | | Salaries,
discretionary
bonuses,
allowance
and benefits
in kind
US$’000 | | Contribution
to defined
contribution
benefit plans
US$’000 | | Subtotal
US$’000 | | Share-based
compensation
benefits
US$’000 | | Total
US$’000 |
| | | | | | |
Year ended December 31, 2008 | | | | | | | | | | | | |
| | | | | | |
Executive Directors | | | | | | | | | | | | |
Steven Craig Jacobs | | — | | — | | — | | — | | — | | — |
Stephen John Weaver | | — | | 1,387 | | — | | 1,387 | | 1,247 | | 2,634 |
| | | | | | |
Non-Executive Directors | | | | | | | | | | | | |
Sheldon Gary Adelson | | — | | — | | — | | — | | — | | — |
Jeffrey Howard Schwartz | | — | | — | | — | | — | | — | | — |
Irwin Abe Siegel | | — | | — | | — | | — | | — | | — |
| | | | | | |
Independent Non-Executive Directors | | | | | | | | | | | | |
Iain Ferguson Bruce | | — | | — | | — | | — | | — | | — |
Chiang Yun | | — | | — | | — | | — | | — | | — |
David Muir Turnbull | | — | | — | | — | | — | | — | | — |
| | | | | | | | | | | | |
| | | | | | |
| | — | | 1,387 | | — | | 1,387 | | 1,247 | | 2,634 |
| | | | | | | | | | | | |
In addition to the Directors’ emoluments disclosed above, Sheldon Gary Adelson, received emoluments (inclusive of share-based compensation) from LVS, amounting to US$4.2 million for the year ended December 31, 2009 (2008: US$3.7 million), part of which is in respect of his services to the Group. No apportionment has been made as the Directors consider that it is impracticable to apportion this amount between his services to the Group and his services to LVS.
Jeffrey Howard Schwartz and Irwin Abe Siegel received emoluments (inclusive of share-based compensation) from LVS, amounting to US$0.1 million and US$0.3 million, respectively, for the year ended December 31, 2009 (2008: US$0 and US$0.3 million, respectively). Mr. Siegel was an independent Non-Executive Directors of LVS for the year ended December 31, 2009 and 2008 and Mr. Schwartz was an independent Non-Executive Director of LVS beginning in March 2009.
Steven Craig Jacobs and Stephen John Weaver were appointed as Executive Directors of the Company on August
18, 2009.
Sheldon Gary Adelson, Jeffrey Howard Schwartz and Irwin Abe Siegel were appointed as Non-Executive Directors of the Company on August 18, 2009, October 14, 2009 and October 14, 2009, respectively.
143
Sands China Ltd.
Notes to the Consolidated Financial Statements—(Continued)
7. Employee benefit expenses (including Directors’ emoluments) (continued)
(b) Directors’ emoluments (continued)
Iain Ferguson Bruce, Chiang Yun and David Muir Turnbull were appointed as independent Non-Executive Directors of the Company on October 14, 2009.
The Directors received or will receive fees of US$59,000 in respect of their services to the Company during the year (2008: nil).
No emoluments were paid to any Directors as an inducement to join or upon joining the Group or as compensation for loss of office during the year (2008: nil).
(c) Five highest paid individuals
The five individuals whose emoluments were the highest in the Group include two (2008: one) Directors whose emoluments are reflected in the analysis presented above. The emoluments payable to the remaining three (2008: four) individuals during the year are as follows:
| | | | |
| | | Year ended
December 31, |
| | | 2009
US$’000 | | 2008
US$’000 |
| | |
Basic salaries and allowances | | 1,162 | | 3,194 |
Bonus | | 378 | | 272 |
Share-based compensation | | 1,246 | | 4,245 |
| | | | |
| | |
| | 2,786 | | 7,711 |
| | | | |
144
Annual Report 2009
Notes to the Consolidated Financial Statements—(Continued)
7. Employee benefit expenses (including Directors’ emoluments) (continued)
(c) Five highest paid individuals (continued)
The emoluments of the above mentioned individuals, who are not Directors of the Company, with the highest emoluments fall within the following bands:
| | | | |
| | | Year ended December 31, |
| | | 2009
Number of
individuals | | 2008
Number of
individuals |
| | |
HK$5,000,001 (approximately US$645,000) — HK$5,500,000 (approximately US$710,000) | | 1 | | — |
HK$8,000,001 (approximately US$1,032,000) — HK$8,500,000 (approximately US$1,097,000) | | 2 | | — |
HK$8,500,001 (approximately US$1,097,000) — HK$9,000,000 (approximately US$1,161,000) | | — | | 1 |
HK$13,500,001 (approximately US$1,742,000) — HK$14,000,000 (approximately US$1,806,000) | | — | | 1 |
HK$15,000,001 (approximately US$1,935,000) — HK$15,500,000 (approximately US$2,000,000) | | — | | 1 |
HK$17,500,001 (approximately US$2,258,000) — HK$18,000,000 (approximately US$2,323,000) | | — | | 1 |
| | | | |
| | |
| | 3 | | 4 |
| | | | |
No emoluments were paid to any of the five highest paid individuals as an inducement to join or upon joining the Group or as compensation for loss of office during the year ended December 31, 2009 (2008: nil).
8. Other expenses
(a) An analysis of the operating expenses is as follows:
| | | | | | |
| | | | | Year ended December 31, |
| | | Note | | 2009
US$’000 | | 2008
US$’000 |
| | | |
Gaming tax(1) | | | | 1,395,790 | | 1,300,477 |
Inventories consumed | | | | 40,115 | | 42,241 |
Employee benefit expenses | | | | 462,895 | | 517,910 |
Depreciation and amortization | | | | 320,401 | | 268,220 |
Gaming promoter/agency commissions | | | | 186,659 | | 162,051 |
Other expenses | | (i) | | 525,273 | | 468,446 |
| | | | | | |
| | | |
Operating expenses | | | | 2,931,133 | | 2,759,345 |
| | | | | | |
| (1) | According to the gaming concession granted by the Macao Government and the relevant legislation, the Group is required to pay 35% gaming tax on gross gaming win, which represents net wins from casino operations. The Group is also required to pay an additional 4% of gross gaming win as public development and social related contributions. On a monthly basis, the Group also makes certain variable and fixed payments to the Macao Government based on the number of slot machines and table games in its possession. These expenses are reported as “gaming tax” in the consolidated income statement. |
145
Sands China Ltd.
Notes to the Consolidated Financial Statements—(Continued)
8. Other expenses (continued)
(a) An analysis of the operating expenses is as follows: (continued)
(i) Analysis of other expenses is as follows:
| | | | | | | |
| | | | | Year ended
December 31, | |
| | | Note | | 2009
US$’000 | | 2008
US$’000 | |
| | | |
Advertising costs | | | | 20,393 | | 48,457 | |
Utilities and fuel costs | | | | 78,261 | | 82,717 | |
Professional fees | | | | 7,122 | | 15,495 | |
Guest compliments | | | | 29,663 | | 16,342 | |
Gaming supplies | | | | 13,925 | | 14,406 | |
Land lease expense | | | | 12,903 | | 11,885 | |
Management fees | | 33 (a)(i) | | 26,841 | | 29,493 | |
Royalty fees | | 33 (a)(vi) | | 1,753 | | — | |
Suspension costs(2) | | | | 65,422 | | 33,581 | |
Auditor’s remuneration | | | | 1,238 | | 1,667 | |
Provision for doubtful accounts | | | | 54,066 | | 15,022 | |
Repairs and maintenance | | | | 16,989 | | 17,251 | |
Contract entertainment | | | | 31,212 | | 25,480 | |
Operating supplies | | | | 20,654 | | 29,052 | |
Operating lease payments | | | | 14,662 | | 21,385 | |
Recruitment expenses | | | | 1,832 | | 12,540 | |
Tourism and other taxes | | | | 9,917 | | 8,650 | |
Contract labor | | | | 36,692 | | 35,831 | |
Insurance | | | | 7,119 | | 8,011 | |
Net foreign exchange losses/(gains) | | | | 1,241 | | (29,179 | ) |
Loss on disposal of property and equipment | | | | 6,042 | | 1,622 | |
Fair value losses on financial assets at fair value through profit or loss | | | | 1,239 | | 44 | |
Other operating expenses | | | | 66,087 | | 68,694 | |
| | | | | | | |
| | | |
| | | | 525,273 | | 468,446 | |
| | | | | | | |
| (2) | Suspension costs mainly comprised of labor severance and payroll costs, site management and organization costs, demobilization costs and storage charges incurred during the suspension period. |
146
Annual Report 2009
Notes to the Consolidated Financial Statements—(Continued)
8. Other expenses (continued)
(b) The operating expenses can also be analyzed as follows:
| | | | | |
| | | Year ended December 31, | |
| | | 2009
US$’000 | | 2008
US$’000 | |
| | |
Casino | | 1,946,969 | | 1,875,432 | |
Rooms | | 26,909 | | 32,236 | |
Food and beverage | | 49,389 | | 47,040 | |
Mall | | 33,916 | | 31,508 | |
Convention, ferry, retail and other | | 127,498 | | 109,423 | |
Provision for doubtful accounts | | 54,066 | | 15,022 | |
General and administrative expense | | 256,052 | | 269,026 | |
Corporate expense | | 11,516 | | 14,747 | |
Land lease expense | | 12,903 | | 11,885 | |
Pre-opening expense | | 82,992 | | 112,319 | |
Depreciation and amortization | | 320,401 | | 268,220 | |
Net foreign exchange losses/(gains) | | 1,241 | | (29,179 | ) |
Loss on disposal of property and equipment | | 6,042 | | 1,622 | |
Fair value losses on financial assets at fair value through profit or loss | | 1,239 | | 44 | |
| | | | | |
| | |
Operating expenses | | 2,931,133 | | 2,759,345 | |
| | | | | |
9. Interest expense, net of amounts capitalized
| | | | | | |
| | | Year ended
December 31, | |
| | | 2009
US$’000 | | | 2008
US$’000 | |
| | |
Bank borrowings | | 127,692 | | | 185,247 | |
Notes payable to related companies | | 17,079 | | | 5,761 | |
Amortization of deferred financing costs | | 12,668 | | | 8,580 | |
Interest expense relating to land lease payments | | 2,079 | | | 3,369 | |
Finance lease liabilities | | 62 | | | 35 | |
Bank guarantee charges and other financing costs | | 3,145 | | | 2,175 | |
| | | | | | |
| | |
| | 162,725 | | | 205,167 | |
Less: interest capitalized | | (12,440 | ) | | (82,297 | ) |
| | | | | | |
| | |
Interest expense, net of amounts capitalized | | 150,285 | | | 122,870 | |
| | | | | | |
Capitalization of interest ceased upon suspension of the respective Cotai Strip development projects (see also Note 31(d)).
147
Sands China Ltd.
Notes to the Consolidated Financial Statements—(Continued)
10. Income tax expenses
| | | | | | | | |
| | | | | Year ended
December 31, | |
| | | Note | | 2009
US$’000 | | | 2008
US$’000 | |
| | | |
Current income tax | | | | | | | | |
Macao complementary tax | | | | 169 | | | 233 | |
Hong Kong profits tax | | | | — | | | 12 | |
| | | |
Overprovision in prior years | | | | | | | | |
Hong Kong profits tax | | | | (14 | ) | | — | |
| | | |
Deferred income tax | | 18 | | 46 | | | (76 | ) |
| | | | | | | | |
| | | |
Income tax expenses | | | | 201 | | | 169 | |
| | | | | | | | |
(a) Macao complementary tax
Macao complementary tax is levied at progressive rates ranging from 3% to 9% on the taxable income above MOP32,000 (equivalent to US$4,000) but below MOP300,000 (equivalent to US$37,500), and thereafter at a fixed rate of 12%. For the year ended December 31, 2009, a special complementary tax incentive is provided to effect that tax free income threshold is increased from MOP32,000 to MOP200,000 (equivalent to US$4,000 to US$25,000) with the next MOP100,000 (equivalent to US$12,500) of profit being taxed at a fixed rate of 9% and thereafter at a fixed rate of 12% (2008: same).
Pursuant to the Despatch No. 250/2004 issued by the Chief Executive of the Macao Government on September
30, 2004, VML was exempted from Macao complementary tax on its gaming activities for five years effective from the 2004 year of assessment. On May 21, 2008, VML was granted, pursuant to the Despatch No. 167/2008 issued by the Chief Executive of the Macao Government, an extension of the tax exemption regarding Macao complementary tax on its gaming activities for an additional five years, which is set to expire in 2013. Regarding the other subsidiaries, during the year ended December 31, 2009, Macao complementary tax is calculated progressively at a maximum of 12% of the estimated assessable profit (2008: same).
148
Annual Report 2009
Notes to the Consolidated Financial Statements—(Continued)
10. Income tax expenses (continued)
(b) Hong Kong profits tax
The Company’s subsidiaries that carry on business in Hong Kong are subject to the Hong Kong profits tax rate at 16.5% for the year ended December 31, 2009 (2008: same).
The tax on the Group’s profit before income tax differs from the theoretical amount that would arise using the domestic tax rates applicable to profits of the consolidated entities in the respective jurisdictions as follows:
| | | | | | | | |
| | | | | Year ended
December 31, | |
| | | Note | | 2009
US$’000 | | | 2008
US$’000 | |
| | | |
Profit before income tax | | | | 214,037 | | | 175,905 | |
| | | | | | | | |
| | | |
Tax calculated at domestic rates applicable to profits in the respective jurisdictions | | | | 23,793 | | | 17,277 | |
Tax effects of: | | | | | | | | |
Income not subject to tax | | (i) | | (346,427 | ) | | (405,008 | ) |
Expenses not deductible for tax purposes | | (i), (ii) | | 248,386 | | | 329,947 | |
Amortization of pre-operating expenses previously not recognized | | | | 7,296 | | | 664 | |
Tax losses for which no deferred income tax assets were recognized | | | | 67,151 | | | 57,854 | |
Others | | | | 2 | | | (565 | ) |
| | | | | | | | |
| | | |
Income tax expenses | | | | 201 | | | 169 | |
| | | | | | | | |
| (i) | During the year ended December 31, 2009, VML was exempted from Macao complementary tax on its gaming activities (see also Note 10(a)). In addition, lease/right of use income recorded in VML and VCL were subject to property tax (Note (ii)), and should, therefore, also be excluded from Macao complementary tax calculations. Accordingly, casino revenues and lease/right of use income and their corresponding expenses incurred were presented as “Income not subject to tax” and “Expenses not deductible for tax purposes” respectively in the calculations above (2008: same). |
| (ii) | Lease/right of use income recorded in VML and VCL are exempted from property tax for the first four and six years for the newly constructed buildings in Macao and Cotai Strip, respectively, pursuant to Article 9(1)(a) of Lei no. 19/78/M. This exemption will expire in April 2010 for the Sands Macao. Regarding The Venetian Macao and The Plaza Macao, the procedures for registration at the tax department are being completed and the exact date of expiration of the exemption cannot be determined at this stage. |
149
Sands China Ltd.
Notes to the Consolidated Financial Statements—(Continued)
11. Dividends
No dividend has been paid or declared by the Company for the year ended December 31, 2009 (2008: same).
12. Earnings per share
Basic earnings per share is calculated by dividing the profit for the year attributable to equity holders of the Company by the weighted average number of ordinary shares in issue during the year.
The Company was incorporated on July 15, 2009. The weighted average number of ordinary shares in issue during the year ended December 31, 2009 used in the basic earnings per share calculation is determined on the assumption that the 6,279,999,999 shares at par value of US$0.01 each issued upon the capitalization issue to Venetian Venture Development
Intermediate II (“VVDI (II)”), the immediate holding company, had been in issue prior to the incorporation of the Company (2008: same).
| | | | | | |
| | | Year ended December 31, |
| | | 2009 | | 2008 |
| | |
Profit attributable to equity holders of the Company (US$’000) | | | 213,836 | | | 175,736 |
Weighted average number of shares (thousand shares) | | | 6,434,991 | | | 6,280,000 |
| | |
Earnings per share, basic (US$) | | US$ | 3.32 cents | | US$ | 2.80 cents |
| | | | | | |
| | |
Earnings per share, basic (HK$)(i) | | HK$ | 25.77 cents | | HK$ | 21.69 cents |
| | | | | | |
| (i) | The translation of US$ amounts into HK$ amounts has been made at the rate of US$1.00 to HK$7.7547 (2008: US$1.00 to HK$7.7505). No representation is made that the HK$ amounts have been, could have been or could be converted into US$, or vice versa, at that rate, or at any other rates or at all. |
Diluted earnings per share are equal to basic earnings per share as there were no potential dilutive ordinary shares outstanding during the year (2008: same).
13. Investment properties, net — Group
| | | | | | |
| | | As of December 31, | |
| | | 2009
US$’000 | | | 2008
US$’000 | |
| | |
At the beginning of the year | | 338,014 | | | 292,726 | |
Transfer from property and equipment upon adoption of IAS 40 (Amendment) | | 227,942 | | | — | |
Additions | | 130,980 | | | 5,556 | |
Transfer from property and equipment | | — | | | 56,322 | |
Depreciation | | (20,255 | ) | | (17,606 | ) |
Exchange difference | | (169 | ) | | 1,016 | |
| | | | | | |
| | |
At the end of the year | | 676,512 | | | 338,014 | |
| | | | | | |
150
Annual Report 2009
Notes to the Consolidated Financial Statements—(Continued)
13. Investment properties, net — Group (continued)
| | | | | | |
| | | As of December 31, | |
| | | 2009
US$’000 | | | 2008
US$’000 | |
| | |
Cost | | 718,387 | | | 359,658 | |
Accumulated depreciation | | (41,875 | ) | | (21,644 | ) |
| | | | | | |
| | |
Net book amount | | 676,512 | | | 338,014 | |
| | | | | | |
The Group’s investment properties are revalued by an independent professional qualified valuer, CB Richard Ellis Limited, on an annual basis. Valuations were based on current prices in an active market for all properties as follows:
| | | | |
| | | As of December 31, |
| | | 2009
US$’000 | | 2008
US$’000 |
| | |
Fair value of the investment properties | | 2,256,000 | | 1,995,000 |
| | | | |
The following amounts have been recognized in the consolidated income statement:
| | | | |
| | | Year ended
December 31, |
| | | 2009
US$’000 | | 2008
US$’000 |
| | |
Mall income | | 137,289 | | 123,038 |
| | | | |
Direct operating expenses arising from investment properties that generate rental income | | 40,046 | | 28,052 |
| | | | |
| | |
Direct operating expenses that did not generate rental income | | 13,611 | | 8,851 |
| | | | |
151
Sands China Ltd.
Notes to the Consolidated Financial Statements—(Continued)
14. Leasehold interests in land, net — Group
| | | | | | |
| | | As of December 31, | |
| | | 2009
US$’000 | | | 2008
US$’000 | |
| | |
At the beginning of the year | | 274,443 | | | 234,579 | |
Additions | | 117,343 | | | 49,596 | |
Amortization | | (12,664 | ) | | (11,647 | ) |
Exchange difference | | (204 | ) | | 1,915 | |
| | | | | | |
| | |
At the end of the year | | 378,918 | | | 274,443 | |
| | | | | | |
The Group received a land concession from the Macao Government to build on Parcels 1, 2 and 3 of the Cotai Strip, including the sites on which The Venetian Macao (Parcel 1) and The Plaza Macao (Parcel 2) are located. The Group does not own these land sites; however, the land concession, which has an initial term of 25 years and is renewable at the Group’s option, in accordance with Macao law, grants the Group exclusive use of the land. As specified in the land concession, the Group is required to pay premiums for each parcel, which are either payable in a single lump sum upon acceptance of the land concession by the Macao Government or in seven semi-annual installments bearing interest at 5.0% per annum (provided that the outstanding balance is due upon the completion of the corresponding integrated resort), as well as annual rent for the term of the land concession, which may be revised every five years by the Macao Government.
The Group’s rights arising from the land concession of Sands Macao and Parcels 1 and 2 are collateralized by a first-priority security for the Group’s indebtedness under the Macao Credit Facility (see Note 28 (a)). In addition, the Group’s rights over parcels of land are charged as security to a financial institution for issuing a bank guarantee to the Macao Government to guarantee the payments of the land lease premium.
During the year ended December 31, 2009, the Group made payments of US$12.6 million and US$14.2 million for partial payments of the land premium for Parcels 2 and 3 (2008: US$12.0 million and US$13.5 million), respectively. As construction is still in progress on Parcels 2 and 3, the balance will either be due upon the completion of the integrated resorts on these parcels (with the Four Seasons Apartments expected to be completed during 2010) or will be payable through the remaining two of seven equal semi-annual payments, bearing interest at 5.0% per annum.
In November 2009, the Group made an initial payment of US$87.5 million upon formal acceptance of the final draft of the land concession agreement for Parcels 5 and 6 from the Macao Government. The remaining land premium payments aggregating a total of US$146.5 million will accrue interest at the rate of 5.0% per annum and will be payable in seven semi-annual installments in the amount of US$23.1 million. The first installment payment will be due on the six month anniversary of the date the land concession becomes effective (the date the land concession is published in Macao’s Official Gazette).
Borrowings are secured on land for the carrying amount of US$240.1 million (2008: US$234.7 million).
152
Annual Report 2009
Notes to the Consolidated Financial Statements—(Continued)
15. Property and equipment, net — Group
The movements of property and equipment for the year are as follows:
| | | | | | | | | | | | | | | | | | | | | | | | | | | |
| | | Land
improvements
US$’000 | | | Buildings
US$’000 | | | Building
improvements
US$’000 | | | Leasehold
improvements
US$’000 | | | Vehicles
US$’000 | | | Ferries
US$’000 | | | Furniture,
fittings &
equipment
US$’000 | | | Construction-in
progress
US$’000 | | | Total
US$’000 | |
| | | | | | | | | |
At January 1, 2008 | | | | | | | | | | | | | | | | | | | | | | | | | | | |
Cost | | 92,456 | | | 1,170,166 | | | 853,200 | | | 7,308 | | | 13,854 | | | 32,586 | | | 468,312 | | | 1,096,476 | | | 3,734,358 | |
Accumulated depreciation | | (3,610 | ) | | (32,836 | ) | | (29,333 | ) | | (3,644 | ) | | (765 | ) | | (136 | ) | | (95,303 | ) | | — | | | (165,627 | ) |
| | | | | | | | | | | | | | | | | | | | | | | | | | | |
| | | | | | | | | |
At January 1, 2008 | | 88,846 | | | 1,137,330 | | | 823,867 | | | 3,664 | | | 13,089 | | | 32,450 | | | 373,009 | | | 1,096,476 | | | 3,568,731 | |
| | | | | | | | | | | | | | | | | | | | | | | | | | | |
| | | | | | | | | |
Year ended December 31, 2008 | | | | | | | | | | | | | | | | | | | | | | | | | | | |
Opening net book amount | | 88,846 | | | 1,137,330 | | | 823,867 | | | 3,664 | | | 13,089 | | | 32,450 | | | 373,009 | | | 1,096,476 | | | 3,568,731 | |
Additions | | — | | | — | | | — | | | 16,006 | | | 4,541 | | | 137,515 | | | 86,828 | | | 1,695,732 | | | 1,940,622 | |
Adjustments to project costs | | — | | | — | | | (2,963 | ) | | — | | | — | | | — | | | — | | | — | | | (2,963 | ) |
Disposals | | — | | | (88 | ) | | (64 | ) | | (7 | ) | | (27 | ) | | — | | | (1,467 | ) | | — | | | (1,653 | ) |
Transfers | | 40,169 | | | 239,990 | | | 358,138 | | | (6,565 | ) | | — | | | — | | | 47,593 | | | (735,647 | ) | | (56,322 | ) |
Depreciation | | (6,786 | ) | | (35,942 | ) | | (65,679 | ) | | (8,932 | ) | | (2,418 | ) | | (5,966 | ) | | (121,302 | ) | | — | | | (247,025 | ) |
Exchange difference | | 869 | | | 9,814 | | | 8,921 | | | 117 | | | 89 | | | — | | | (9,142 | ) | | 23,765 | | | 34,433 | |
| | | | | | | | | | | | | | | | | | | | | | | | | | | |
| | | | | | | | | |
Closing net book amount | | 123,098 | | | 1,351,104 | | | 1,122,220 | | | 4,283 | | | 15,274 | | | 163,999 | | | 375,519 | | | 2,080,326 | | | 5,235,823 | |
| | | | | | | | | | | | | | | | | | | | | | | | | | | |
| | | | | | | | | |
At December 31, 2008 | | | | | | | | | | | | | | | | | | | | | | | | | | | |
Cost | | 133,554 | | | 1,420,292 | | | 1,217,753 | | | 11,599 | | | 18,469 | | | 170,101 | | | 583,993 | | | 2,080,326 | | | 5,636,087 | |
Accumulated depreciation | | (10,456 | ) | | (69,188 | ) | | (95,533 | ) | | (7,316 | ) | | (3,195 | ) | | (6,102 | ) | | (208,474 | ) | | — | | | (400,264 | ) |
| | | | | | | | | | | | | | | | | | | | | | | | | | | |
| | | | | | | | | |
At December 31, 2008 | | 123,098 | | | 1,351,104 | | | 1,122,220 | | | 4,283 | | | 15,274 | | | 163,999 | | | 375,519 | | | 2,080,326 | | | 5,235,823 | |
| | | | | | | | | | | | | | | | | | | | | | | | | | | |
| | | | | | | | | |
Year ended December 31, 2009 | | | | | | | | | | | | | | | | | | | | | | | | | | | |
Opening net book amount | | 123,098 | | | 1,351,104 | | | 1,122,220 | | | 4,283 | | | 15,274 | | | 163,999 | | | 375,519 | | | 2,080,326 | | | 5,235,823 | |
Transfer to investment properties upon adoption of IAS 40 (Amendment) | | — | | | — | | | — | | | — | | | — | | | — | | | — | | | (227,942 | ) | | (227,942 | ) |
Additions | | — | | | — | | | 425 | | | 423 | | | 5,399 | | | 80,527 | | | 13,536 | | | 138,694 | | | 239,004 | |
Adjustments to project costs | | (83 | ) | | (1,540 | ) | | (28,206 | ) | | (30 | ) | | — | | | — | | | 18,836 | | | (606 | ) | | (11,629 | ) |
Disposals | | (3 | ) | | (23 | ) | | (2,727 | ) | | (75 | ) | | (2,129 | ) | | — | | | (5,071 | ) | | (2,121 | ) | | (12,149 | ) |
Transfers | | 1,883 | | | 29,776 | | | 52,843 | | | 125 | | | — | | | — | | | 24,977 | | | (109,604 | ) | | — | |
Depreciation | | (8,907 | ) | | (40,309 | ) | | (79,732 | ) | | (1,739 | ) | | (2,707 | ) | | (10,697 | ) | | (149,670 | ) | | — | | | (293,761 | ) |
Exchange difference | | (65 | ) | | (778 | ) | | (1,128 | ) | | (9 | ) | | (10 | ) | | — | | | (297 | ) | | (519 | ) | | (2,806 | ) |
| | | | | | | | | | | | | | | | | | | | | | | | | | | |
| | | | | | | | | |
Closing net book amount | | 115,923 | | | 1,338,230 | | | 1,063,695 | | | 2,978 | | | 15,827 | | | 233,829 | | | 277,830 | | | 1,878,228 | | | 4,926,540 | |
| | | | | | | | | | | | | | | | | | | | | | | | | | | |
| | | | | | | | | |
At December 31, 2009 | | | | | | | | | | | | | | | | | | | | | | | | | | | |
Cost | | 135,275 | | | 1,447,667 | | | 1,238,594 | | | 6,419 | | | 21,727 | | | 250,628 | | | 630,130 | | | 1,878,228 | | | 5,608,668 | |
Accumulated depreciation | | (19,352 | ) | | (109,437 | ) | | (174,899 | ) | | (3,441 | ) | | (5,900 | ) | | (16,799 | ) | | (352,300 | ) | | — | | | (682,128 | ) |
| | | | | | | | | | | | | | | | | | | | | | | | | | | |
| | | | | | | | | |
At December 31, 2009 | | 115,923 | | | 1,338,230 | | | 1,063,695 | | | 2,978 | | | 15,827 | | | 233,829 | | | 277,830 | | | 1,878,228 | | | 4,926,540 | |
| | | | | | | | | | | | | | | | | | | | | | | | | | | |
Interest expense amounting US$12.4 million (Note 9) and other direct costs of US$20.7 million have been capitalized for the year ended December 31, 2009 (2008: US$82.3 million and US$34.1 million).
153
Sands China Ltd.
Notes to the Consolidated Financial Statements—(Continued)
15. Property and equipment, net — Group (continued)
Equipment includes the following amounts where the Group is the lessee under finance leases:
| | | | | | |
| | | As of December 31, | |
| | | 2009
US$’000 | | | 2008
US$’000 | |
| | |
Cost | | 742 | | | 666 | |
Accumulated depreciation | | (237 | ) | | (75 | ) |
| | | | | | |
| | |
Net book amount | | 505 | | | 591 | |
| | | | | | |
The Group leases various equipment under non-cancellable finance lease agreements. The lease terms are between three and five years and ownership of the assets lies within the Group.
16. Financial instruments by category
| | | | | | | | | | |
| | | Note | | Financial
assets at
fair
value
through
profit or
loss
US$’000 | | Group
Loans and
receivables
US$’000 | | Total
US$’000 | | Company
Loans and
receivables
US$’000 |
| | | | | |
Assets | | | | | | | | | | |
| | | | | |
At December 31, 2009 | | | | | | | | | | |
Financial assets at fair value through profit or loss | | 19 | | 1,529 | | — | | 1,529 | | — |
Trade and other receivables, net | | 21 | | — | | 273,827 | | 273,827 | | 483,969 |
Restricted cash | | 23 | | — | | 17,172 | | 17,172 | | — |
Cash and cash equivalents | | 24 | | — | | 908,334 | | 908,334 | | 510,584 |
Deposits | | 20 | | — | | 1,067 | | 1,067 | | 1 |
| | | | | | | | | | |
| | | | | |
Total | | | | 1,529 | | 1,200,400 | | 1,201,929 | | 994,554 |
| | | | | | | | | | |
| | | | | |
At December 31, 2008 | | | | | | | | | | |
Trade and other receivables, net | | 21 | | — | | 253,387 | | 253,387 | | — |
Restricted cash | | 23 | | — | | 124,112 | | 124,112 | | — |
Cash and cash equivalents | | 24 | | — | | 417,769 | | 417,769 | | — |
Deposits | | 20 | | — | | 1,768 | | 1,768 | | — |
| | | | | | | | | | |
| | | | | |
Total | | | | — | | 797,036 | | 797,036 | | — |
| | | | | | | | | | |
154
Annual Report 2009
Notes to the Consolidated Financial Statements—(Continued)
16. Financial instruments by category (continued)
| | | | | | |
| | | Note | | Group
Financial
liabilities at
amortized
cost
US$’000 | | Company
Financial
liabilities
at
amortized
cost
US$’000 |
| | | |
Liabilities | | | | | | |
| | | |
At December 31, 2009 | | | | | | |
Trade and other payables | | 27 | | 697,514 | | 6,667 |
Borrowings | | 28 | | 2,819,297 | | — |
| | | | | | |
| | | |
Total | | | | 3,516,811 | | 6,667 |
| | | | | | |
| | | |
At December 31, 2008 | | | | | | |
Trade and other payables | | 27 | | 1,875,285 | | — |
Borrowings | | 28 | | 3,643,160 | | — |
| | | | | | |
| | | |
Total | | | | 5,518,445 | | — |
| | | | | | |
17. Intangible assets, net — Group
| | | | | | | | | | | | |
| | | Trademarks
US$’000 | | | Computer
software
US$’000 | | | Show
production
costs
US$’000 | | | Total
US$’000 | |
| | | | |
At January 1, 2008 | | | | | | | | | | | | |
Cost | | 105 | | | 9,475 | | | — | | | 9,580 | |
Accumulated amortization | | (46 | ) | | (4,003 | ) | | — | | | (4,049 | ) |
| | | | | | | | | | | | |
| | | | |
At January 1, 2008 | | 59 | | | 5,472 | | | — | | | 5,531 | |
| | | | | | | | | | | | |
Year ended December 31, 2008 | | | | | | | | | | | | |
Opening net book amount | | 59 | | | 5,472 | | | — | | | 5,531 | |
Additions | | — | | | 4,284 | | | 40,320 | | | 44,604 | |
Amortization | | (15 | ) | | (2,334 | ) | | (1,867 | ) | | (4,216 | ) |
Exchange difference | | — | | | 48 | | | 255 | | | 303 | |
| | | | | | | | | | | | |
| | | | |
Closing net book amount | | 44 | | | 7,470 | | | 38,708 | | | 46,222 | |
| | | | | | | | | | | | |
| | | | |
At December 31, 2008 | | | | | | | | | | | | |
Cost | | 105 | | | 13,849 | | | 40,584 | | | 54,538 | |
Accumulated amortization | | (61 | ) | | (6,379 | ) | | (1,876 | ) | | (8,316 | ) |
| | | | | | | | | | | | |
| | | | |
At December 31, 2008 | | 44 | | | 7,470 | | | 38,708 | | | 46,222 | |
| | | | | | | | | | | | |
155
Sands China Ltd.
Notes to the Consolidated Financial Statements—(Continued)
17. Intangible assets, net — Group (continued)
| | | | | | | | | | | | |
| | | Trademarks
US$’000 | | | Computer
software
US$’000 | | | Show
production
costs
US$’000 | | | Total
US$’000 | |
| | | | |
Year ended December 31, 2009 | | | | | | | | | | | | |
Opening net book amount | | 44 | | | 7,470 | | | 38,708 | | | 46,222 | |
Additions | | — | | | 2,119 | | | — | | | 2,119 | |
Adjustments to project costs | | — | | | — | | | (440 | ) | | (440 | ) |
Disposals | | — | | | (4 | ) | | — | | | (4 | ) |
Amortization | | (15 | ) | | (2,631 | ) | | (4,223 | ) | | (6,869 | ) |
Exchange difference | | — | | | (4 | ) | | (19 | ) | | (23 | ) |
| | | | | | | | | | | | |
| | | | |
Closing net book amount | | 29 | | | 6,950 | | | 34,026 | | | 41,005 | |
| | | | | | | | | | | | |
| | | | |
At December 31, 2009 | | | | | | | | | | | | |
Cost | | 106 | | | 15,922 | | | 40,122 | | | 56,150 | |
Accumulated amortization | | (77 | ) | | (8,972 | ) | | (6,096 | ) | | (15,145 | ) |
| | | | | | | | | | | | |
| | | | |
At December 31, 2009 | | 29 | | | 6,950 | | | 34,026 | | | 41,005 | |
| | | | | | | | | | | | |
18. Deferred income tax assets — Group
Deferred tax assets and liabilities are offset when there is a legally enforceable right to set off and when the deferred income taxes relate to income taxes levied by the same taxation authority on either the taxable entity or different taxable entities where there is an intention to settle the balances on a net basis.
The movements of the deferred tax assets/(liabilities) are as follows:
| | | | | | | | | | | | |
| | | Decelerated
depreciation
allowance
US$’000 | | | Tax
losses
US$’000 | | | Accelerated
tax
depreciation
US$’000 | | | Total
US$’000 | |
| | | | |
At January 1, 2008 | | 21 | | | 103 | | | (41 | ) | | 83 | |
Credit/(charge) for the year | | — | | | 200 | | | (124 | ) | | 76 | |
| | | | | | | | | | | | |
| | | | |
At December 31, 2008 | | 21 | | | 303 | | | (165 | ) | | 159 | |
Charge for the year | | (22 | ) | | (24 | ) | | — | | | (46 | ) |
| | | | | | | | | | | | |
| | | | |
At December 31, 2009 | | (1 | ) | | 279 | | | (165 | ) | | 113 | |
| | | | | | | | | | | | |
156
Annual Report 2009
Notes to the Consolidated Financial Statements—(Continued)
18. Deferred income tax assets — Group (continued)
Deferred tax assets are recognized for tax losses carry forwards to the extent that realization of the related tax benefit through future taxable profits is probable. The unrecognized deferred income tax assets in respect of losses that can be carried forward against future taxable income and pre-opening expenses are as follows:
| | | | |
| | | As of December 31, |
| | | 2009
US$’000 | | 2008
US$’000 |
| | |
Arising from unused tax losses | | 157,977 | | 83,769 |
Arising from pre-operating expenses | | 26,221 | | 15,856 |
| | | | |
| | |
| | 184,198 | | 99,625 |
| | | | |
As of December 31, 2009, subject to the agreement by tax authorities, out of the total unrecognized tax losses of approximately US$158.0 million (2008: US$83.8 million), approximately US$9.5 million (2008: US$3.7 million) can be carried forward indefinitely. The remaining amount of approximately US$148.5 million (2008: US$80.1 million) will expire in two to five years.
19. Financial assets at fair value through profit or loss — Group
The Group’s financial assets at fair value through profit or loss are derivative financial instruments, which consist of one interest rate cap agreement (2008: four) (collectively, the “Cap Agreement”) that the Group uses to manage the interest rate risk associated with the Group’s variable-rate borrowings (see Note 28). The notional principal amount of the outstanding Cap Agreement was US$1.59 billion as of December 31, 2009 (2008: US$1.65 billion). The Cap Agreement does not qualify for hedge accounting and is stated at fair value based on quoted market values from the financial institution holding the agreement.
Changes in fair values of financial assets at fair value through profit or loss are recorded in “Other expenses” in the consolidated income statement (Note 8).
157
Sands China Ltd.
Notes to the Consolidated Financial Statements—(Continued)
20. Other assets, net
| | | | | | | | |
| | | Group As of
December 31, | | | Company As of
December 31, |
| | | 2009
US$’000 | | | 2008
US$’000 | | | 2009
US$’000 |
| | | |
Deferred leasing fees | | 26,971 | | | 27,950 | | | — |
Less: amortization of deferred leasing fees | | (11,973 | ) | | (6,023 | ) | | — |
Tenant improvement allowance | | 24,530 | | | 24,930 | | | — |
Less: amortization of tenant improvement allowance | | (6,229 | ) | | (2,671 | ) | | — |
Other deferred incentive allowance | | 6,381 | | | 3,940 | | | — |
Less: amortization of other deferred incentive allowance | | (998 | ) | | (31 | ) | | — |
Deposits | | 1,067 | | | 1,768 | | | 1 |
Others | | 9,045 | | | 10,907 | | | — |
| | | | | | | | |
| | | |
| | 48,794 | | | 60,770 | | | 1 |
| | | | | | | | |
The maximum exposure to credit risk at the reporting date for deposits and others is their carrying values. No impairment charges related to these assets were recorded during the year ended December 31, 2009 (2008: same).
The Group’s and the Company’s deposits are denominated in the following currencies:
| | | | | | |
| | | Group As of
December 31, | | Company As of
December 31, |
| | | 2009
US$’000 | | 2008
US$’000 | | 2009
US$’000 |
| | | |
HK$ | | 616 | | 985 | | 1 |
Renminbi (“RMB”) | | 331 | | 343 | | — |
MOP | | 120 | | 440 | | — |
| | | | | | |
| | | |
| | 1,067 | | 1,768 | | 1 |
| | | | | | |
158
Annual Report 2009
Notes to the Consolidated Financial Statements—(Continued)
21. Trade and other receivables and prepayments, net
| | | | | | | | | | | |
| | | | | Group As of
December 31, | | | Company As of
December 31, | |
| | | Note | | 2009
US$’000 | | | 2008
US$’000 | | | 2009
US$’000 | |
| | | | |
Trade receivables | | | | 308,713 | | | 216,388 | | | — | |
Less: provision for doubtful trade receivables | | | | (55,821 | ) | | (17,000 | ) | | — | |
| | | | | | | | | | | |
| | | | |
Trade receivables, net | | (a) | | 252,892 | | | 199,388 | | | — | |
| | | | | | | | | | | |
| | | | |
Notes receivable from related companies | | 33 (b) | | — | | | 800 | | | 176,200 | |
Other receivables | | | | 19,713 | | | 22,991 | | | 193 | |
Notes interest receivable from related companies | | 33 (c) | | — | | | 57 | | | 849 | |
Receivables from related companies — non-trade | | 33 (d) | | 1,222 | | | 30,151 | | | 306,727 | |
| | | | | | | | | | | |
| | | | |
Other receivables | | | | 20,935 | | | 53,999 | | | 483,969 | |
| | | | | | | | | | | |
| | | | |
Prepayments | | | | 13,022 | | | 84,321 | | | 82 | |
Deferred rent | | | | 78,815 | | | 55,580 | | | — | |
Less: amortization of deferred rent | | | | (32,429 | ) | | (13,884 | ) | | — | |
Less: provision for doubtful deferred rent | | | | (5,880 | ) | | — | | | — | |
| | | | | | | | | | | |
Prepayments | | | | 53,528 | | | 126,017 | | | 82 | |
| | | | | | | | | | | |
Trade and other receivables and prepayments, net | | | | 327,355 | | | 379,404 | | | 484,051 | |
| | | | | | | | | | | |
Less: non-current portion | | | | | | | | | | | |
Notes receivable from related companies | | 33 (b) | | — | | | (500 | ) | | (176,200 | ) |
Prepayments | | | | — | | | (62,848 | ) | | — | |
Deferred rent | | | | (31,955 | ) | | (28,109 | ) | | — | |
| | | | | | | | | | | |
| | | | (31,955 | ) | | (91,457 | ) | | (176,200 | ) |
| | | | | | | | | | | |
Current portion | | | | 295,400 | | | 287,947 | | | 307,851 | |
| | | | | | | | | | | |
159
Sands China Ltd.
Notes to the Consolidated Financial Statements—(Continued)
21. Trade and other receivables and prepayments, net (continued)
The trade and other receivables, net of provision, are denominated in the following currencies:
| | | | | | |
| | | Group As of
December 31, | | Company As of
December 31, |
| | | 2009
US$’000 | | 2008
US$’000 | | 2009
US$’000 |
| | | |
HK$ | | 253,873 | | 197,489 | | 3,327 |
MOP | | 18,258 | | 24,608 | | 4,062 |
US$ | | 1,342 | | 30,790 | | 493,951 |
RMB | | 354 | | 500 | | — |
| | | | | | |
| | | |
| | 273,827 | | 253,387 | | 501,340 |
| | | | | | |
(a) Trade receivables, net, of the Group
The aging analysis of trade receivables, net of provision for doubtful accounts, is as follows:
| | | | |
| | | As of December 31, |
| | | 2009
US$’000 | | 2008
US$’000 |
| | |
0–30 days | | 197,645 | | 148,061 |
31–60 days | | 16,796 | | 12,671 |
61–90 days | | 9,508 | | 8,790 |
Over 90 days | | 28,943 | | 29,866 |
| | | | |
| | |
| | 252,892 | | 199,388 |
| | | | |
The carrying values of trade receivables approximate their fair values at each balance sheet date. The maximum exposure to credit risk is the fair values of trade receivables at each balance sheet date.
Included in gross receivables are casino receivables of US$280.1 million as of December 31, 2009 (2008: US$185.3 million). There is a concentration of credit risk related to gross casino receivables as 39.3% of the casino receivables as of December 31, 2009 (2008: 33.9%) were from the top five customers. Other than casino receivables, there is no other concentration of credit risk with respect to trade receivables as the Group has a large number of customers. The Group has policies to mitigate concentration of credit risk (see Note 3(a)(ii)) and believes its provision is adequate.
160
Annual Report 2009
Notes to the Consolidated Financial Statements—(Continued)
21. Trade and other receivables and prepayments, net (continued)
(a) Trade receivables, net, of the Group (continued)
As of December 31, 2009, gross casino receivables of approximately US$117.7 million (2008: US$47.3 million), were past due but not impaired. These relate to a number of independent customers that have a good track record with the Group. Extension of the credit period, with terms and conditions subject to special approvals, has been granted to these customers. The aging analysis of gross casino receivables that were past due but not impaired based on the original terms is as follows:
| | | | |
| | | As of December 31, |
| | | 2009
US$’000 | | 2008
US$’000 |
| | |
Past due 1–30 days | | 80,587 | | 9,145 |
Past due 31–60 days | | 8,743 | | 7,004 |
Past due 61–90 days | | 3,687 | | 13,355 |
Past due over 90 days | | 24,679 | | 17,818 |
| | | | |
| | |
| | 117,696 | | 47,322 |
| | | | |
Trade receivables other than casino receivables mainly comprised hotel and mall receivables. As of December 31, 2009, these receivables of approximately US$6.6 million (2008: US$24.2 million), were past due but not impaired. These relate to a number of independent customers that have a good track record with the Group. The aging analysis of these trade receivables is as follows:
| | | | |
| | | As of December 31, |
| | | 2009
US$’000 | | 2008
US$’000 |
| | |
Past due 1–30 days | | 3,715 | | 9,137 |
Past due 31–60 days | | 1,767 | | 5,044 |
Past due 61–90 days | | 544 | | 4,409 |
Past due over 90 days | | 576 | | 5,610 |
| | | | |
| | |
| | 6,602 | | 24,200 |
| | | | |
161
Sands China Ltd.
Notes to the Consolidated Financial Statements—(Continued)
21. Trade and other receivables and prepayments, net (continued)
(a) Trade receivables, net, of the Group (continued)
As of December 31, 2009, trade receivables of US$96.8 million (2008: US$20.3 million) were impaired and provided for. The amount of the provision was US$55.8 million as of December 31, 2009 (2008: US$17.0 million). The receivables mainly relate to casino customers and mall retailers, which are in unexpected difficult economic situations. It was assessed that a portion of the receivables is expected to be recovered and thus not impaired. The aging of these receivables provided for is as follows:
| | | | |
| | | As of December 31, |
| | | 2009
US$’000 | | 2008
US$’000 |
| | |
Past due 1–30 days | | 2,440 | | 1,090 |
Past due 31–60 days | | 9,523 | | 526 |
Past due 61–90 days | | 4,765 | | 1,196 |
Past due over 90 days | | 80,069 | | 17,498 |
| | | | |
| | |
| | 96,797 | | 20,310 |
| | | | |
Movements of provision for doubtful trade receivables are as follows:
| | | | | |
| | | As of December 31, |
| | | 2009
US$’000 | | | 2008
US$’000 |
| | |
At the beginning of the year | | 17,000 | | | 1,936 |
Provision made for the year | | 42,729 | | | 15,022 |
Amounts written-off | | (3,881 | ) | | — |
Exchange difference | | (27 | ) | | 42 |
| | | | | |
| | |
At the ending of the year | | 55,821 | | | 17,000 |
| | | | | |
(b) Other receivables and deferred rent
The carrying values of other receivables approximate their fair values at each balance sheet date, which also represent the Group’s maximum exposure to credit risk as of December 31, 2009. The Group holds security deposits, bank guarantees and letters of credit for certain other receivables and deferred rent. Impairment charges of US$5.9 million related to deferred rent were recorded for year ended December 31, 2009 and included in “Other expenses” in the consolidated income statement (2008: nil). Amounts are charged to the provision account and generally written off when the recoverability is remote.
162
Annual Report 2009
Notes to the Consolidated Financial Statements—(Continued)
22. Inventories — Group
| | | | |
| | | As of December 31, |
| | | 2009
US$’000 | | 2008
US$’000 |
| | |
Food and beverage | | 4,740 | | 5,261 |
Retail products | | 1,445 | | 2,228 |
Ferry parts | | 1,131 | | 243 |
Tobacco | | 416 | | 474 |
General operating supplies | | 1,898 | | 2,709 |
| | | | |
| | |
| | 9,630 | | 10,915 |
| | | | |
As of December 31, 2009, all inventories were carried at cost (2008: same).
23. Restricted cash — Group
As required by the Group’s Macao Credit Facility (Note 28 (a)), certain proceeds drawn under this facility need to be deposited into restricted bank accounts that are pledged to a disbursement agent for the Macao Credit Facility Ienders. This restricted cash will be used for Sands Macao, The Venetian Macao and other Cotai Strip project costs under the disbursement terms specified in the Macao Credit Facility. The disbursement account is subject to a security interest in favor of the lenders under the Macao Credit Facility.
| | | | |
| | | As of December 31, |
| | | 2009
US$’000 | | 2008
US$’000 |
| | |
Restricted cash | | 17,172 | | 124,112 |
| | | | |
The Group’s restricted cash is denominated in the following currencies:
| | | | |
| | | As of December 31, |
| | | 2009
US$’000 | | 2008
US$’000 |
| | |
MOP | | 7,934 | | 20,663 |
US$ | | 5,106 | | 103,449 |
HK$ | | 4,132 | | — |
| | | | |
| | |
| | 17,172 | | 124,112 |
| | | | |
The maximum exposure to credit risk is the carrying amount of restricted cash at each balance sheet date.
163
Sands China Ltd.
Notes to the Consolidated Financial Statements—(Continued)
24. Cash and cash equivalents
| | | | | | |
| | | Group As of
December 31, | | Company As of
December 31, |
| | | 2009
US$’000 | | 2008
US$’000 | | 2009
US$’000 |
| | | |
Cash at bank and on hand | | 650,426 | | 364,566 | | 252,676 |
Short-term bank deposits | | 257,908 | | 53,203 | | 257,908 |
| | | | | | |
| | | |
| | 908,334 | | 417,769 | | 510,584 |
| | | | | | |
The cash and cash equivalents are denominated in the following currencies:
| | | | | | |
| | | Group As of
December 31, | | Company As of
December 31, |
| | | 2009
US$’000 | | 2008
US$’000 | | 2009
US$’000 |
| | | |
HK$ | | 849,032 | | 244,048 | | 510,573 |
MOP | | 27,822 | | 16,493 | | — |
US$ | | 17,518 | | 143,041 | | 11 |
Singapore Dollar (“SGD”) | | 12,403 | | 9,534 | | — |
Japanese Yen (“JPY”) | | 1,557 | | 4,403 | | — |
RMB | | 2 | | 250 | | — |
| | | | | | |
| | | |
| | 908,334 | | 417,769 | | 510,584 |
| | | | | | |
The effective interest rates on short-term bank deposits approximated 0.01% per annum, for the year ended December 31, 2009 (2008: 0.08% to 0.33%). These deposits have an average maturity of 88 days (2008: 10 to 37 days).
The carrying values of cash equivalents are their fair values as of December 31, 2009 (2008: same).
The maximum credit exposure of cash and cash equivalents of the Group and the Company as of December 31, 2009, amounted to US$834.6 million and US$510.6 million, respectively (2008: US$345.5 million and nil).
164
Annual Report 2009
Notes to the Consolidated Financial Statements—(Continued)
25. Share capital
(a) Authorized share capital of the Company
| | | | |
| | | Year ended
December 31, 2009 |
| | | Number of shares | | Ordinary
shares
US$’000 |
| | |
Authorized: | | | | |
At July 15, 2009, date of incorporation | | 5,000,000 | | 50 |
Increase in authorized share capital | | 15,995,000,000 | | 159,950 |
| | | | |
| | |
At December 31, 2009 | | 16,000,000,000 | | 160,000 |
| | | | |
As of the date of incorporation, the initial authorized share capital of the Company was US$50,000 divided into
5,000,000 ordinary shares of US$0.01 each.
On November 8, 2009, the authorized share capital was increased from US$50,000 to US$160,000,000 divided into 16,000,000,000 ordinary shares of US$0.01 each.
(b) Issued share capital of the Company
| | | | | | |
| | | | | Year ended
December 31, 2009 |
| | | Note | | Number of
shares | | Ordinary
shares
US$’000 |
| | | |
Issued and fully paid: | | | | | | |
At July 15, 2009, date of incorporation | | | | 1 | | — |
Shares issued pursuant to the global offering | | (i) | | 1,270,000,000 | | 12,700 |
Shares issued under the capitalization issue | | (ii) | | 6,279,999,999 | | 62,800 |
Shares issued upon bond conversion | | (iii) | | 497,865,084 | | 4,979 |
| | | | | | |
At December 31, 2009 | | | | 8,047,865,084 | | 80,479 |
| | | | | | |
| (i) | Pursuant to the allotment resolution dated November 25, 2009, 1,270,000,000 shares (“Shares”) of US$0.01 each were issued at an issue price of HK$10.38 under the global offering. Excess of issue price over the par value of the ordinary shares were credited to share premium. |
| (ii) | Upon the listing of the Company on November 30, 2009, 6,279,999,999 ordinary shares were issued at par to VVDI (II) via the capitalization issue of 6,279,999,999 shares in the Company, through the application of US$62,799,999.99 of the share premium received upon the issuance of shares to pay up the aggregate par value of the capitalization shares. |
| (iii) | On September 4, 2009, US$600.0 million exchangeable bonds due 2014 were issued by VVDI (II), whereas the net proceeds of US$582.0 million from such bond was lent to the Company by way of an intercompany shareholder’s loan. Concurrent with the completion of the global offering, at the instruction of VVDI (II), the Group’s obligations under the intercompany shareholder’s loan were satisfied through the issuance of shares directly to the bondholders in connection with the mandatory and automatic exchange of the bonds for shares at an exchange price equal to 90.0% of the offer price of HK$10.38. Accordingly, an aggregate of 497,865,084 shares were allotted and issued to the bondholders upon the mandatory and automatic exchange of the bonds for shares upon the listing. The excess of the fair value of shares issued by the Company over the then carrying value of the liability received was accounted for as deemed dividend distributions (see Note 26). |
165
Sands China Ltd.
Notes to the Consolidated Financial Statements—(Continued)
26. Reserves
(a) Group
| | | | | | | | | | | | | | | | | | |
| | | Capital
reserve (i)
US$’000 | | Share
premium
US$’000 | | | Statutory
Reserve (ii)
US$’000 | | Share- based
compensation
reserve
US$’000 | | Currency
translation
reserve
US$’000 | | | Retained
earnings
US$’000 | | | Total
US$’000 | |
| | | | | | | |
Balance at January 1, 2008 | | 80,049 | | — | | | 6,222 | | — | | (2,778 | ) | | 964,357 | | | 1,047,850 | |
Total comprehensive income | | — | | — | | | — | | — | | 8,410 | | | 175,736 | | | 184,146 | |
Share-based compensation granted by LVS | | — | | — | | | — | | 17,538 | | — | | | — | | | 17,538 | |
| | | | | | | | | | | | | | | | | | |
| | | | | | | |
Balance at December 31, 2008 | | 80,049 | | — | | | 6,222 | | 17,538 | | 5,632 | | | 1,140,093 | | | 1,249,534 | |
Total comprehensive income | | — | | — | | | — | | — | | (1,893 | ) | | 213,836 | | | 211,943 | |
Shares issued pursuant to the global offering (Note 25 (b)(i)) | | — | | 1,688,200 | | | — | | — | | — | | | — | | | 1,688,200 | |
Shares issued under the capitalization issue (Note 25 (b)(ii)) | | — | | (62,800 | ) | | — | | — | | — | | | — | | | (62,800 | ) |
Shares issued upon bond conversion (Note 25 (b)(iii)) | | — | | 655,021 | | | — | | — | | — | | | — | | | 655,021 | |
Deemed distribution upon bond conversion (Note 25 (b)(iii)) | | — | | (78,000 | ) | | — | | — | | — | | | — | | | (78,000 | ) |
Share issuance costs | | — | | (74,884 | ) | | — | | — | | — | | | — | | | (74,884 | ) |
Contribution from owners | | 6,762 | | — | | | — | | — | | — | | | �� | | | 6,762 | |
Disposals of group companies | | 624 | | — | | | — | | — | | — | | | — | | | 624 | |
Transfer to statutory reserve | | — | | — | | | 93 | | — | | — | | | (93 | ) | | — | |
Share-based compensation granted by LVS | | — | | — | | | — | | 8,513 | | — | | | — | | | 8,513 | |
| | | | | | | | | | | | | | | | | | |
| | | | | | | |
Balance at December 31, 2009 | | 87,435 | | 2,127,537 | | | 6,315 | | 26,051 | | 3,739 | | | 1,353,836 | | | 3,604,913 | |
| | | | | | | | | | | | | | | | | | |
(i) Capital reserve
Capital reserve represents the combined share premium of VVDIL, Cotai WaterJets (HK) Limited and CotaiJet Holdings (II) Limited.
(ii) Statutory reserve
The statutory reserve represents amounts set aside from the income statement and is not distributable to shareholders/quotaholders of the group companies incorporated.
The Macao Commercial Code #432 requires that companies incorporated in Macao that are limited by shares should set aside a minimum of 10% of the company’s profit after taxation to the statutory reserve until the balance of the reserve reaches a level equivalent to 25% of the company’s capital.
For companies incorporated in Macao limited by quotas, the Macao Commercial Code #377 requires that a company should set aside a minimum of 25% of the company’s profit after taxation to the statutory reserve until the balance of the reserve reaches a level equivalent to 50% of the company’s capital.
166
Annual Report 2009
Notes to the Consolidated Financial Statements—(Continued)
26. Reserves (continued)
(b) Company
| | | | | | | | | | | | | | |
| | | Capital
reserve
US$’000 | | Share
premium
US$’000 | | | Currency
translation
reserve
US$’000 | | | Accumulated
losses
US$’000 | | | Total
US$’000 | |
| | | | | |
Balance at July 15, 2009 (date of incorporation) | | — | | — | | | — | | | — | | | — | |
Total comprehensive income | | — | | — | | | (1,228 | ) | | (12,495 | ) | | (13,723 | ) |
Addition to reserves pursuant to business combination | | 105,533 | | — | | | — | | | — | | | 105,533 | |
Shares issued pursuant to the global offering (Note 25 (b)(i)) | | — | | 1,688,200 | | | — | | | — | | | 1,688,200 | |
Shares issued under the capitalization issue (Note 25 (b)(ii)) | | — | | (62,800 | ) | | — | | | — | | | (62,800 | ) |
Shares issued upon bond conversion (Note 25 (b)(iii)) | | — | | 655,021 | | | — | | | — | | | 655,021 | |
Deemed distribution upon bond conversion (Note 25 (b)(iii)) | | — | | (78,000 | ) | | — | | | — | | | (78,000 | ) |
Share issuance costs | | — | | (74,884 | ) | | — | | | — | | | (74,884 | ) |
| | | | | | | | | | | | | | |
| | | | | |
Balance at December 31, 2009 | | 105,533 | | 2,127,537 | | | (1,228 | ) | | (12,495 | ) | | 2,219,347 | |
| | | | | | | | | | | | | | |
The loss attributable to equity holders of the Company is dealt with in the financial statements of the Company to the extent of US$12.5 million.
167
Sands China Ltd.
Notes to the Consolidated Financial Statements—(Continued)
27. Trade and other payables
| | | | | | | | | | |
| | | | | Group
As of
December 31, | | | Company
As of
December 31,
2009
US$’000 |
| | | Note | | 2009
US$’000 | | | 2008
US$’000 | | |
| | | | |
Trade payables | | (a) | | 33,583 | | | 21,434 | | | 906 |
Construction payables and accruals | | | | 201,764 | | | 303,059 | | | — |
Deposits | | | | 68,993 | | | 60,714 | | | — |
Payables to related companies — non-trade | | 33 (d) | | 17,341 | | | 1,240,753 | | | 2,424 |
Other tax payables | | | | 133,527 | | | 119,420 | | | — |
Notes interest payable to related companies | | 33 (f) | | — | | | 1,115 | | | — |
Interest payables | | | | 720 | | | 937 | | | — |
Other payables and accruals | | | | 375,113 | | | 247,273 | | | 3,337 |
| | | | | | | | | | |
| | | | |
| | | | 831,041 | | | 1,994,705 | | | 6,667 |
Less: non-current portion | | | | (12,570 | ) | | (12,663 | ) | | — |
| | | | | | | | | | |
| | | | |
Current portion | | | | 818,471 | | | 1,982,042 | | | 6,667 |
| | | | | | | | | | |
The trade and other payables are denominated in the following currencies:
| | | | | | |
| | | Group
As of
December 31, | | Company
As of
December 31,
2009
US$’000 |
| | | 2009
US$’000 | | 2008
US$’000 | |
| | | |
MOP | | 475,050 | | 516,032 | | 457 |
HK$ | | 284,583 | | 210,694 | | 1,190 |
US$ | | 69,206 | | 1,263,698 | | 5,020 |
Other currencies | | 2,202 | | 4,281 | | — |
| | | | | | |
| | | |
| | 831,041 | | 1,994,705 | | 6,667 |
| | | | | | |
168
Annual Report 2009
Notes to the Consolidated Financial Statements—(Continued)
27. Trade and other payables (continued)
(a) Trade payables
The aging analysis of trade payables is as follows:
| | | | | | |
| | | Group
As of
December 31, | | Company
As of
December 31,
2009
US$’000 |
| | | 2009
US$’000 | | 2008
US$’000 | |
| | | |
0–30 days | | 11,356 | | 6,081 | | 387 |
31–60 days | | 10,977 | | 6,726 | | 172 |
61–90 days | | 8,302 | | 2,037 | | 90 |
Over 90 days | | 2,948 | | 6,590 | | 257 |
| | | | | | |
| | | |
| | 33,583 | | 21,434 | | 906 |
| | | | | | |
28. Borrowings — Group
| | | | | | | | |
| | | | | As of December 31, | |
| | | Note | | 2009
US$’000 | | | 2008
US$’000 | |
| | | |
Non-current portion | | | | | | | | |
Bank loans, secured | | (a),(b),(c) | | 2,768,457 | | | 3,481,400 | |
Notes payable to related companies | | 33 (e) | | — | | | 153,191 | |
Finance lease liabilities, secured | | 29 | | 283 | | | 501 | |
| | | | | | | | |
| | | |
| | | | 2,768,740 | | | 3,635,092 | |
Less: deferred financing costs | | | | (36,128 | ) | | (36,230 | ) |
| | | | | | | | |
| | | |
| | | | 2,732,612 | | | 3,598,862 | |
| | | | | | | | |
| | | |
Current portion | | | | | | | | |
Bank loans, secured | | | | 86,476 | | | 44,107 | |
Finance lease liabilities, secured | | 29 | | 209 | | | 191 | |
| | | | | | | | |
| | | |
| | | | 86,685 | | | 44,298 | |
| | | | | | | | |
| | | |
Total borrowings | | | | 2,819,297 | | | 3,643,160 | |
| | | | | | | | |
The carrying amounts of short-term borrowings approximate their fair values.
169
Sands China Ltd.
Notes to the Consolidated Financial Statements—(Continued)
28. Borrowings — Group (continued)
The maturities of bank loans and notes payable to related companies are as follows:
| | | | |
| | | As of December 31, |
| | | 2009
US$’000 | | 2008
US$’000 |
| | |
Bank loans | | | | |
Repayable within 1 year | | 86,476 | | 44,107 |
Repayable between 1 and 2 years | | 875,395 | | 103,839 |
Repayable between 2 and 5 years | | 1,857,935 | | 3,274,707 |
Repayable after 5 years | | 35,127 | | 102,854 |
| | | | |
| | |
| | 2,854,933 | | 3,525,507 |
| | | | |
| | |
Notes payable to related companies | | | | |
Repayable between 2 and 5 years | | — | | 153,191 |
Repayable after 5 years | | — | | — |
| | | | |
| | |
| | — | | 153,191 |
| | | | |
| | |
Total bank loans and notes payable | | 2,854,933 | | 3,678,698 |
| | | | |
The estimated fair values of the Group’s borrowings as of December 31, 2009 were approximately US$2.71 billion (2008: US$2.28 billion).
The Group’s borrowings are denominated in the following currencies:
| | | | |
| | | As of December 31, |
| | | 2009
US$’000 | | 2008
US$’000 |
| | |
US$ | | 2,529,330 | | 3,312,260 |
HK$ | | 211,187 | | 219,123 |
MOP | | 78,713 | | 111,674 |
RMB | | 67 | | 103 |
| | | | |
| | |
| | 2,819,297 | | 3,643,160 |
| | | | |
170
Annual Report 2009
Notes to the Consolidated Financial Statements—(Continued)
28. Borrowings — Group (continued)
(a) Macao Credit Facility
On May 25, 2006, two subsidiaries of the Group, VMLF (the “Borrower”) and VML, as guarantor, entered into the Macao Credit Facility. The Macao Credit Facility originally consisted of a US$1.2 billion funded term B loan (the “Macao Term B Facility”), a US$700.0 million delayed draw term B loan (the “Macao Term B Delayed Draw Facility”), a US$100.0 million funded local currency term loan (the “Macao Local Term Facility”) and a US$500.0 million revolving credit facility (the “Macao Revolving Facility”). In March 2007, the Macao Credit Facility was amended to expand the use of proceeds and remove certain restrictive covenants. In April 2007, the lenders of the Macao Credit Facility approved a reduction of the interest rate margin for all classes of loans by 50 basis points and the Borrower exercised its rights under the Macao Credit Facility to access the US$800.0 million of incremental facilities under the accordion feature set forth therein, which increased the funded Macao Term B Facility by US$600.0 million, the Macao Revolving Facility by US$200.0 million, and the total Macao Credit Facility to US$3.3 billion.
On August 12, 2009, the Macao Credit Facility was amended to, among other things, allow for the Global Offering and modify certain financial covenants and definitions, including increasing the maximum leverage ratio for the quarterly periods through the end of 2010. As part of the amendment, the credit spread increased by 325 basis points with borrowings bearing interest, at the Group’s option, at either an adjusted Eurodollar rate (or, in the case of the local term loan, adjusted HIBOR) or at an alternate base rate, plus a spread of 5.5% per annum or 4.5% per annum, respectively. In November 2009, in connection with the Global Offering, the Group was required to repay and permanently reduce US$500.0 million of borrowings, on a pro rata basis, under the Macao Credit Facility and in conjunction with the US$500.0 million repayment, the credit spread was reduced by 100 basis points (set at 4.6% for the Macao Local Term Facility and 4.8% for the remainder of the Macao Credit Facility as of December 31, 2009). As a result of this repayment and the August amendment, the Group recorded a charge of US$6.1 million during the year ended December 31, 2009, for loss on modification or early retirement of debt. Borrowings under the Macao Local Term Facility and the Macao Revolving Facility are subject to downward adjustments if certain consolidated leverage ratios are achieved. As of December 31, 2009, the Group had US$120.4 million of available borrowing capacity under the Macao Revolving Facility, net of outstanding letters of credit and undrawn amounts committed to be funded by Lehman Brothers Commercial Paper Inc.
The indebtedness under the Macao Credit Facility is guaranteed by VML, VCL and certain of the Group’s other foreign subsidiaries (collectively, the “Guarantors”). The obligations under the Macao Credit Facility and the guarantees of the Guarantors are collateralized by a first-priority security interest in substantially all of the Borrower’s and the Guarantors’ assets, other than (1) capital stock of the Borrower and the Guarantors, (2) assets that secure permitted furniture, fittings and equipment financings, (3) VML’s gaming subconcession contract and (4) certain other excluded assets.
The Macao Revolving Facility and the Macao Local Term Facility mature on May 25, 2011. The Macao Term B Delayed Draw Facility and the Macao Term B Facility mature on May 25, 2012 and 2013, respectively. The Macao Term B Delayed Draw and the Macao Term B Facility are subject to nominal quarterly amortization payments of US$1.8 million and US$4.5 million, respectively, for the first five and six years, respectively, which commenced in June 2009, with the remainder of the loans payable in four equal quarterly installments in the last year immediately preceding their maturity dates. The Macao Local Term Facility is subject to quarterly amortization payments of US$6.3 million, which commenced in June 2009, with the remainder of the loan payable in four equal installments in the last year immediately preceding the maturity date. The Macao Revolving Facility has no interim amortization payments.
171
Sands China Ltd.
Notes to the Consolidated Financial Statements—(Continued)
28. Borrowings — Group (continued)
(a) Macao Credit Facility (continued)
The Borrower also pays a standby commitment fee of 0.5% per annum on the undrawn amounts under the Macao Revolving Facility. For the year ended December 31, 2009, the weighted average interest rate for the Macao Local Term Facility was 3.6% (2008: 5.1%), and the weighted average interest rate for the remainder of the Macao Credit Facility was 3.9% (2008: 5.8%).
To meet the requirements of the Macao Credit Facility, the Group entered into four interest rate cap agreements in September 2006, May 2007, October 2007 and September 2008 with notional amounts of US$1.0 billion, US$325.0 million, US$165.0 million and US$160.0 million, respectively, all of which expired on September 21, 2009. The provisions of the interest rate cap agreements entitled the Group to receive from the counterparties the amounts, if any, by which the selected market interest rates exceed the strike rate of 6.75%. The Group entered into an additional interest rate cap agreement in September 2009 with a notional amount of US$1.59 billion, which expires in September 2012. The provisions of the interest rate cap agreement entitle the Group to receive from the counterparty the amounts, if any, by which the selected market interest rate exceeds the strike rate of 9.5%. There was no net effect on interest expense as a result of the interest rate cap agreements for the year ended December 31, 2009 (2008: same).
The Macao Credit Facility contains affirmative and negative covenants customary for such financings, including, but not limited to, limitations on incurring additional liens, incurring additional indebtedness, making certain investments, paying dividends and making other restricted payments, and acquiring and selling assets. The Macao Credit Facility also requires the Borrower and the Guarantors to comply with financial covenants, including, but not limited to, generating a minimum adjusted earnings before interest, income taxes, depreciation and amortization (“Adjusted EBITDA”) for a period of time and, thereafter, ratios of Adjusted EBITDA to interest expense and total indebtedness to Adjusted EBITDA, as well as maximum annual capital expenditures. The Macao Credit Facility also contains events of default customary for such financings. A default under the Macao Credit Facility would trigger a cross-default under the Group’s ferry financing (see Note b). Any defaults or cross-defaults under these agreements would allow the lenders, in each case, to exercise their rights and remedies as defined under their respective agreements. If the lenders were to exercise their rights to accelerate the due dates of the indebtedness outstanding, there can be no assurance that the Group would be able to repay or refinance any amounts that may become accelerated under such agreements, which could force the Group to restructure or alter its operations or debt obligations.
(b) Ferry Financing
In January 2008, in order to finance the purchase of ten ferries, which were respectively owned by ten ferry owning companies that are subsidiaries within the Group, Cotai Ferry Company Limited, a subsidiary within the Group, entered into a HK$1.21 billion (approximately US$156.0 million at exchange rates in effect on December 31, 2009) secured credit facility, which was available for borrowing for up to 18 months after closing. The proceeds from the secured credit facility were used to reimburse related companies for cash spent to date on the construction of the ferries and to finance the completion of the remaining ferries. The facility is collateralized by the ferries and is guaranteed by VML.
172
Annual Report 2009
Notes to the Consolidated Financial Statements—(Continued)
28. Borrowings — Group (continued)
(b) Ferry Financing (continued)
In July 2008, the Group exercised the accordion option on the secured credit facility agreement that financed the Group’s original ten ferries and executed a supplement to the secured credit facility agreement. The supplement increased the secured credit facility by an additional HK$561.6 million (approximately US$72.4 million at exchange rates in effect on December 31, 2009), which the Group has fully drawn as of December 31, 2009. The proceeds from this supplemental facility were used to reimburse related companies for cash spent to date on construction of four additional ferries and to finance the remaining progress payments on those ferries. The supplemental facility is collateralized by the additional ferries and is guaranteed by VML. Net book values of the 14 ferries were US$233.8 million as of December 31, 2009 (2008: US$164.0 million).
On August 20, 2009, the ferry financing facility was amended to, among other things, allow for the Global Offering of the Company and remove the requirement to comply with all financial covenants. The facility, as amended, now matures in December 2015 and is subject to 26 quarterly payments of HK$68.1 million (approximately US$8.8 million at exchange rates in effect on December 31, 2009), which commenced in October 2009.
As part of the amendment, the credit spread increased by 50 basis points to 2.5% per annum for borrowings made in HK$ and accruing interest at HIBOR (set at 2.6% as of December 31, 2009) or 2.5% per annum for borrowings made in US$ and accruing interest at LIBOR. All borrowings under the facility, which was fully drawn as of December 31, 2009, were made in HK$. The weighted average interest rate for the facility was 2.4% (2008: 4.7%) for the year ended December 31, 2009.
(c) Motor Vehicle Facility
In March 2008, VML entered into a loan agreement (the “Motor Vehicle Facility”) to borrow MOP200.9 million (approximately US$25.1 million at exchange rates in effect on December 31, 2009) for the purposes of financing the purchase of certain motor vehicles. The Motor Vehicle Facility is available for draw down until December 31, 2010 and any amount undrawn at the expiry of this period will be cancelled. Loans under the Motor Vehicle Facility bear interest at three-month HIBOR plus 2.25% (set at 2.4% per annum as of December 31, 2009 (2008: 3.2%)), with interest payments made quarterly, which began in June 2008. The weighted average interest rate for the facility was 2.9% per annum for the year ended December 31, 2009 (2008: 4.5%). The Motor Vehicle Facility matures in December 2011, with the principal due in four equal quarterly installments in 2011.
The Motor Vehicle Facility is collateralized by all the motor vehicles purchased with this loan. Net book values of these vehicles was MOP51.5 million (approximately US$6.5 million at exchange rates in effect on December 31, 2009) as of December 31, 2009 (2008: US$8.4 million). The lender may accelerate the repayment of any outstanding loans under the Motor Vehicle Facility if an event of default occurs with respect to VML and is not remedied within 30 days. An event of default includes insolvency, a breach of material obligations under the Motor Vehicle Facility by VML, a material adverse change occurs in respect of the financial conditions of VML, suspension or termination of VML’s core business and actual or threatened legal proceedings against VML. As of December 31, 2009, the aggregate outstanding principal amount drawn under the Motor Vehicle Facility was MOP88.0 million (approximately US$11.0 million at exchange rates in effect on December 31, 2009).
173
Sands China Ltd.
Notes to the Consolidated Financial Statements—(Continued)
29. Finance lease liabilities — Group
The Group is a lessee under finance leases for equipment.
Lease liabilities are effectively secured, as the rights of the leased asset revert to the lessor in the event of default.
The future minimum lease payments (including interest), and the present value of the minimum lease payments under finance lease obligations are as follows:
| | | | | | |
| | | As of December 31, | |
| | | 2009
US$’000 | | | 2008
US$’000 | |
| | |
Minimum finance lease payments: | | | | | | |
Later than 1 year and no later than 2 years | | 255 | | | 257 | |
Later than 2 year and no later than 5 years | | 205 | | | 269 | |
Later than 5 years | | 106 | | | 306 | |
| | | | | | |
| | |
| | 566 | | | 832 | |
Future finance charges on finance lease obligations | | (74 | ) | | (140 | ) |
| | | | | | |
| | |
Present value of finance lease liabilities | | 492 | | | 692 | |
| | | | | | |
| | |
Present value of minimum finance lease payments: | | | | | | |
Later than 1 year and no later than 2 years | | 209 | | | 191 | |
Later than 2 year and no later than 5 years | | 183 | | | 221 | |
Later than 5 years | | 100 | | | 280 | |
| | | | | | |
| | |
| | 492 | | | 692 | |
| | | | | | |
174
Annual Report 2009
Notes to the Consolidated Financial Statements—(Continued)
30. Note to the consolidated statement of cash flows
Cash generated from operations is as follows:
| | | | | | |
| | | Year ended December 31, | |
| | | 2009
US$’000 | | | 2008
US$’000 | |
| | |
Profit before income tax | | 214,037 | | | 175,905 | |
Adjustments for: | | | | | | |
Interest income | | (527 | ) | | (4,801 | ) |
Interest and other finance costs | | 134,961 | | | 115,601 | |
Depreciation and amortization | | 320,401 | | | 268,220 | |
Amortization of leasehold interest in land | | 12,664 | | | 11,647 | |
Amortization of deferred financing costs | | 12,668 | | | 6,394 | |
Write-off deferred financing costs | | 777 | | | — | |
Amortization of deferred rent | | 18,560 | | | 11,902 | |
Amortization of other assets | | 10,484 | | | 7,147 | |
Loss on disposal of property and equipment | | 6,042 | | | 1,622 | |
Loss on modification or early retirement of debt | | 6,186 | | | — | |
Provision for doubtful accounts | | 54,066 | | | 15,022 | |
Share-based compensation expense | | 7,702 | | | 15,163 | |
Fair value losses on financial assets through profit or loss | | 1,239 | | | 44 | |
Net foreign exchange losses/(gains) | | 1,130 | | | (27,648 | ) |
Changes in working capital: | | | | | | |
Leasehold interests in land | | (117,343 | ) | | (49,596 | ) |
Inventories | | 1,279 | | | (2,414 | ) |
Trade and other receivables and prepayments | | (89,434 | ) | | (242,074 | ) |
Other assets | | 1,467 | | | (32,790 | ) |
Trade and other payables | | 107,712 | | | (13,117 | ) |
| | | | | | |
| | |
Cash generated from operations | | 704,071 | | | 256,227 | |
| | | | | | |
175
Sands China Ltd.
Notes to the Consolidated Financial Statements—(Continued)
31. Commitments and contingencies
(a) Capital commitments
Property and equipment commitments not provided for are as follows:
| | | | |
| | | As of December 31, |
| | | 2009
US$’000 | | 2008
US$’000 |
| | |
Contracted but not provided for | | 162,054 | | 1,422,130 |
Authorized but not contracted for | | 1,708,208 | | 6,296,869 |
| | | | |
| | |
| | 1,870,262 | | 7,718,999 |
| | | | |
(b) Operating lease commitments
(i) The Group as the lessee
The Group had future aggregate minimum lease payments under non-cancellable operating leases for interests in land and property and equipment as follows:
| | | | |
| | | As of December 31, |
| | | 2009
US$’000 | | 2008
US$’000 |
| | |
No later than 1 year | | 58,496 | | 52,166 |
Later than 1 year and no later than 5 years | | 161,756 | | 38,288 |
Later than 5 years | | 96,931 | | 57,357 |
| | | | |
| | |
| | 317,183 | | 147,811 |
| | | | |
(ii) The Group as the lessor/grantor of the right of use
The future aggregate minimum lease/base fee rent receivables under non-cancellable agreements are as follows:
| | | | |
| | | As of December 31, |
| | | 2009
US$’000 | | 2008
US$’000 |
| | |
No later than 1 year | | 96,200 | | 135,708 |
Later than 1 year and no later than 5 years | | 217,469 | | 331,458 |
Later than 5 years | | 130,972 | | 135,057 |
| | | | |
| | |
| | 444,641 | | 602,223 |
| | | | |
176
Annual Report 2009
Notes to the Consolidated Financial Statements—(Continued)
31. Commitments and contingencies (continued)
(c) Litigation
The Group has contingent liabilities with respect to legal claims arising in the ordinary course of business in addition to the matter noted below. Management has made certain estimates for potential litigation costs based upon consultation with legal counsel and believes that no significant loss will be incurred beyond the amounts provided for as of December 31, 2009. Actual results could differ from these estimates; however, in the opinion of management, it is not anticipated that any material liabilities will arise from the contingent liabilities.
(d) Cotai Strip development projects
Given current conditions in the capital markets and the global economy and their impact on the Group’s ongoing operations, the Group announced in November 2008 its revised development plan to suspend its development projects. Should general economic conditions fail to improve or if the Group is unable to obtain sufficient funding such that completion of the suspended projects is not probable, all or a portion of the Group’s investment to date on the suspended projects could be lost and would result in an impairment charge.
The Group has obtained a final draft of the land concession contract for Parcels 5 and 6 from the Macao Government and upon successfully obtaining the land concession for Parcels 5 and 6, will subsequently negotiate the land concession for Parcels 7 and 8. Based on historical experience with the Macao Government with respect to the Group’s land concessions for Sands Macao and Parcels 1, 2 and 3, management believes that the land concessions for Parcels 5, 6, 7 and 8 will be granted. However, if the Group does not obtain these land concessions, the Group could forfeit all or a substantial part of its US$1.85 billion capitalized construction costs as of December 31, 2009, incurred for the developments on Parcels 5, 6, 7 and 8 (2008: US$1.77 billion).
The Group had commenced pre-construction on Parcel 3, and has capitalized costs of approximately US$35.7 million as of December 31, 2009 (2008: US$35.6 million). Under the revised terms of the land concession approved by the Macao Government on August 20, 2009 that covers Parcel 3, the Group is required to complete development of Parcel 3 by April 17, 2013. Management believes that if the Group is unable to complete the development of Parcel 3 by the deadline, it will be able to obtain an extension from the Macao Government; however, no assurances can be given that an extension will be granted. If the Group is not able to meet the April 2013 deadline and that deadline is not extended, the Macao Government has the right to unilaterally terminate the land concession and the Group could lose its investment in, and right to operate, any properties developed under the land concession for Parcel 3 without compensation to the Group.
(e) Construction labor
The Group has utilized imported construction labor quota granted to it by the Macao Department of Labor for purposes of constructing the Cotai Strip properties. The Group is primarily liable for all employer costs associated with persons employed under this grant. Such employees are managed and supervised by various construction companies contracted by the Group to build the Cotai Strip properties. The construction companies are contractually obligated to pay all employer costs and to indemnify the Group for any costs it may incur as a result of the persons employed. In addition, the Group has the right of offsetting such costs against any amounts due to the construction companies. However, the Group may still have the contingency for the payments to the construction labor if the construction companies fail to pay the salaries and the amounts owed by the Group to the construction companies are not sufficient to offset the amounts due to the construction labor. As of December 31, 2009, the Group continued to employ workers under this arrangement with various construction companies.
177
Sands China Ltd.
Notes to the Consolidated Financial Statements—(Continued)
32. Interests in subsidiaries
| | | | |
| | | Note | | As of December 31,
2009
US$’000 |
| | |
Unlisted shares — at cost | | | | 105,533 |
Notes receivable from subsidiaries | | 33(b) | | 582,000 |
Receivable from a subsidiary | | 33(d) | | 624,324 |
| | | | |
| | |
| | | | 1,311,857 |
| | | | |
Receivables from subsidiaries are unsecured, interest free and not repayable in the coming twelve months.
Details of the Group’s principal subsidiaries as of December 31, 2009 are as follows:
| | | | | | | | | |
Name | | Place and date of incorporation/ establishment | | Principal activities | | Particulars of issued share/ registered capital | | Effective
interests
held | |
| | | | |
Directly held: | | | | | | | | | |
| | | | |
Venetian Venture
Development Intermediate
Limited (“VVDIL”) | | Cayman Islands, June 21, 2002 | | Investment holding | | US$1 | | 100 | % |
| | | | |
LVS IP Holdings, LLC | | United States of America, September 29, 2009 | | Holder of trademark licenses | | US$100 | | 100 | % |
| | | | |
Indirectly held: | | | | | | | | | |
| | | | |
VML US Finance LLC | | United States of America, January 3, 2006 | | Financing | | Nil | | 100 | % |
| | | | |
Cotai Strip Lot 2 Apart Hotel
(Macau) Limited | | Macao, October 27, 2008 | | Hotel apartments | | MOP4,100,000 MOP3,121,000 (preference shares) | | 100
100 | %
% |
| | | | |
Venetian Cotai Hotel
Management Limited | | Macao, March 12, 2008 | | Human resources administration | | MOP500,000 | | 100 | % |
| | | | |
Venetian Orient Limited | | Macao, February 2, 2006 | | Hotels and restaurants | | MOP100,000 | | 100 | % |
| | | | |
Venetian Travel Limited | | Macao, October 16, 2006 | | Travel and tourism agency services | | MOP1,800,000 | | 100 | % |
| | | | |
Cotai Retail Concepts Limited | | Macao, May 10, 2007 | | Retail distribution of merchandise | | MOP100,000 | | 100 | % |
178
Annual Report 2009
Notes to the Consolidated Financial Statements—(Continued)
32. Interests in subsidiaries (continued)
| | | | | | | | | |
Name | | Place and date of incorporation/ establishment | | Principal activities | | Particulars of issued share/ registered capital | | Effective
interests
held | |
| | | | |
Venetian Retail Limited | | Macao, June 15, 2007 | | Mall management | | MOP1,500,000 | | 100 | % |
| | | | |
Cotai Ferry Company Limited | | Macao, July 19, 2007 | | High speed ferry transportation services | | MOP10,000,000 | | 100 | % |
| | | | |
Cotai Human Resources
Management Limited | | Macao, July 21, 2007 | | Human resources administration | | MOP1,000,000 | | 100 | % |
| | | | |
Cotai WaterJets (HK) Limited | | Hong Kong, July 11, 2007 | | Holding investments | | HK$1 | | 100 | % |
| | | | |
CotaiJet Holdings (II) Limited | | Hong Kong, November 23, 2007 | | Holding investments | | HK$1 | | 100 | % |
| | | | |
Venetian Macau Finance
Company | | Cayman Islands, July 23, 2003 | | Financing (dormant since May 2005) | | US$1 | | 100 | % |
| | | | |
V-HK Services Limited | | Hong Kong, September 6, 2004 | | Marketing and customer development services for VML | | HK$1 | | 100 | % |
| | | | |
Venetian Cotai Limited | | Macao, November 11, 2004 | | Hotels, restaurants, shopping mall, and conference and convention | | MOP200,000,000 | | 100 | % |
| | | | |
Venetian Macau Limited
(Note) | | Macao, June 21, 2002 | | Gaming and other related activities | | MOP200,000,000 | | 100 | % |
| | | | |
Zhuhai Cotai Logistics Hotel
Services Co., Ltd. | | The People’s Republic of China, September 27, 2007 | | Procurement, marketing and administrative services | | US$4,500,000 | | 100 | % |
| | | | |
CotaiJet 311 Limited | | Cayman Islands, August 14, 2007 | | Ferry leasing | | US$1 | | 100 | % |
| Note: | 10% of the company’s issued share capital is held through an usufruct agreement whereby VVDIL has the sole and exclusive benefit. Accordingly, the profits and losses and assets and liabilities of the company have been consolidated as to 100% thereof into the consolidated financial statements. |
179
Sands China Ltd.
Notes to the Consolidated Financial Statements—(Continued)
32. Interests in subsidiaries (continued)
| | | | | | | | | |
Name | | Place and date of incorporation/ establishment | | Principal activities | | Particulars of issued share/ registered capital | | Effective
interests
held | |
| | | | |
CotaiJet 312 Limited | | Cayman Islands, August 14, 2007 | | Ferry leasing | | US$1 | | 100 | % |
| | | | |
CotaiJet 313 Limited | | Cayman Islands, August 14, 2007 | | Ferry leasing | | US$1 | | 100 | % |
| | | | |
CotaiJet 314 Limited | | Cayman Islands, September 12, 2007 | | Ferry leasing | | US$1 | | 100 | % |
| | | | |
CotaiJet 315 Limited | | Cayman Islands, September 12, 2007 | | Ferry leasing | | US$1 | | 100 | % |
| | | | |
CotaiJet 316 Limited | | Cayman Islands, October 8, 2007 | | Ferry leasing | | US$1 | | 100 | % |
| | | | |
CotaiJet 317 Limited | | Cayman Islands, October 8, 2007 | | Ferry leasing | | US$1 | | 100 | % |
| | | | |
CotaiJet 318 Limited | | Cayman Islands, October 8, 2007 | | Ferry leasing | | US$1 | | 100 | % |
| | | | |
CotaiJet 319 Limited | | Cayman Islands, October 8, 2007 | | Ferry leasing | | US$1 | | 100 | % |
| | | | |
CotaiJet 320 Limited | | Cayman Islands, October 8, 2007 | | Ferry leasing | | US$1 | | 100 | % |
| | | | |
CotaiJet 350 Limited | | Cayman Islands, January 21, 2008 | | Ferry leasing | | US$1 | | 100 | % |
| | | | |
CotaiJet 351 Limited | | Cayman Islands, January 21, 2008 | | Ferry leasing | | US$1 | | 100 | % |
| | | | |
CotaiJet 352 Limited | | Cayman Islands, January 21, 2008 | | Ferry leasing | | US$1 | | 100 | % |
| | | | |
CotaiJet 353 Limited | | Cayman Islands, January 21, 2008 | | Ferry leasing | | US$1 | | 100 | % |
180
Annual Report 2009
Notes to the Consolidated Financial Statements—(Continued)
33. Related party transactions
For the purposes of these consolidated financial statements, parties are considered to be related to the Group if the party has the ability, directly or indirectly, to exercise significant influence over the Group in making financial and operating decisions, or vice versa. Related parties may be individuals (being members of key management personnel, significant shareholders and/or their close family members) or other entities, and include entities which are under the significant influence of related parties of the Group where those parties are individuals.
Immediately after the Reorganization, the Group’s immediate holding company is VVDI (II), a company incorporated in the Cayman Islands. LVS is the Group’s ultimate holding company. Related companies represent the group companies of the LVS group.
Save as disclosed elsewhere in the consolidated financial statements, the Group has the following transactions during the year:
(a) Transactions during the year — Group
(i) Management fees
| | | | |
| | | Year ended December 31, |
| | | 2009
US$’000 | | 2008
US$’000 |
| | |
LVS | | 3,412 | | 6,448 |
Fellow subsidiaries | | 18,153 | | 22,952 |
| | | | |
| | |
| | 21,565 | | 29,400 |
| | | | |
Management services are provided by LVS and six other fellow subsidiaries for providing services including but not limited to human resources support, accounting services, sourcing of goods and services, sourcing of tenants for the malls and other various types of marketing and promotion activities for the Group. Management fees are charged on a cost-plus basis, allowing a margin of 5% to 10%.
181
Sands China Ltd.
Notes to the Consolidated Financial Statements—(Continued)
33. Related party transactions (continued)
(a) Transactions during the year — Group (continued)
(i) Management fees (continued)
Management fees disclosed below can be reconciled to the management fees as disclosed in Note 6(a), Note 6(b) and Note 8(a)(i) as follows:
| | | | | | | | |
| | | | | Year ended December 31, | |
| | | Note | | 2009
US$’000 | | | 2008
US$’000 | |
| | | |
Total management fees disclosed in “Related party transactions” | | | | 21,565 | | | 29,400 | |
Less: | | | | | | | | |
— amounts included as “Deferred leasing fees” | | | | — | | | (574 | ) |
— amount capitalized as “Construction-in-progress” | | | | (145 | ) | | (2,600 | ) |
| | | | | | | | |
| | | |
Net amounts expensed in the consolidated income statement | | | | 21,420 | | | 26,226 | |
| | | | | | | | |
| | | |
Represented by management fees presented within: | | | | | | | | |
Segment information — Corporate expense | | 6(a) | | 5,625 | | | 7,227 | |
Segment information — Pre-opening expense | | 6(b) | | 532 | | | 7,207 | |
Other operating and administrative departments | | | | 15,263 | | | 11,792 | |
| | | | | | | | |
| | | |
| | | | 21,420 | | | 26,226 | |
| | | | | | | | |
| | | |
Reconciled to management fees presented with “Other expenses” as below: | | | | | | | | |
Net management fees charged by related parties and expensed through the consolidated income statement | | | | 21,420 | | | 26,226 | |
Management fees charged by third parties | | | | 5,421 | | | 3,267 | |
| | | | | | | | |
| | | |
Total management fees expensed | | 8(a)(i) | | 26,841 | | | 29,493 | |
| | | | | | | | |
182
Annual Report 2009
Notes to the Consolidated Financial Statements—(Continued)
33. Related party transactions (continued)
(a) Transactions during the year — Group (continued)
(ii) Interest income
| | | | |
| | | Year ended December 31, |
| | | 2009
US$’000 | | 2008
US$’000 |
| | |
Fellow subsidiaries | | 28 | | 46 |
| | | | |
(iii) Interest expense
| | | | |
| | | Year ended December 31, |
| | | 2009
US$’000 | | 2008
US$’000 |
| | |
LVS | | 3,072 | | 2,702 |
Intermediate holding companies | | 14,007 | | 3,059 |
| | | | |
| | |
| | 17,079 | | 5,761 |
| | | | |
(iv) Expenses billed to/paid by other LVS group companies
During the year ended December 31, 2009, the Group charged an LVS group company for certain expenses paid on its behalf at cost of US$3.7 million (2008: US$1.6 million).
During the year ended December 31, 2009, LVS group companies recharged certain expenses paid on the Group’s behalf at cost of US$0.9 million (2008: nil).
Other LVS group companies incurred certain expenses on behalf of the Group. These expenses were reimbursed by the Group at cost.
(v) Legal services
The Group’s previous Managing Director provided legal services to the Group on a regular basis. During the year ended December 31, 2009, no payment was made for related services as the services ceased in August 2008 (2008: US$1.0 million).
183
Sands China Ltd.
Notes to the Consolidated Financial Statements—(Continued)
33. Related party transactions (continued)
(a) Transactions during the year — Group (continued)
(vi) Royalty fees
In November 2009, the Group entered into an agreement with Las Vegas Sands, LLC (“LVSLLC”), an intermediate holding company incorporated in the United States of America, for using the trademarks and other intellectual property rights as defined in the agreement. For each of the full fiscal years through the full fiscal year ending December 31, 2012, the Group is required to pay LVSLLC an annual royalty in the amount of 1.5% of non-gaming revenue and Paiza-related gaming revenue of the Sands Macao, 1.5% of all revenue of The Venetian Macao, and 1.5% of all gaming revenue of the Plaza Casino at The Plaza Macao (the “Relevant Royalty”), provided that the total royalty payable in connection with these three properties in each fiscal year will be capped at US$20.0 million per full fiscal year. For each of the subsequent full fiscal years through the full fiscal year ending December 31, 2022, the Group is required to pay an annual royalty being the lesser of the Relevant Royalty or the annual caps reflecting an increase of 20% for each subsequent year. During the year ended December 31, 2009, the Group incurred approximately US$1.8 million of royalty fees.
(b) Notes receivable from related companies — non-trade
| | | | | | | | |
| | | Group
As of
December 31, | | | Company
As of
December 31,
2009
US$’000 | |
| | | 2009
US$’000 | | 2008
US$’000 | | |
| | | |
A fellow subsidiary | | — | | 800 | | | — | |
Subsidiaries | | — | | — | | | 758,200 | |
Less: non-current portion | | — | | (500 | ) | | (758,200 | ) |
| | | | | | | | |
| | | |
Current portion | | — | | 300 | | | — | |
| | | | | | | | |
Notes receivable from subsidiaries of approximately US$582.0 million are unsecured, non-interest bearing and not repayable in the coming twelve months. The remaining notes receivable from subsidiaries are unsecured, bear interest at prevailing market rates and not repayable in the coming twelve months.
184
Annual Report 2009
Notes to the Consolidated Financial Statements—(Continued)
33. Related party transactions (continued)
(c) Notes interest receivable from related companies — non-trade
| | | | | | |
| | | Group
As of
December 31, | | Company
As of
December 31,
2009
US$’000 |
| | | 2009
US$’000 | | 2008
US$’000 | |
| | | |
Fellow subsidiaries | | — | | 57 | | — |
Subsidiaries | | — | | — | | 849 |
| | | | | | |
| | | |
| | — | | 57 | | 849 |
| | | | | | |
(d) Year-end balances arising from operating expenses paid by/on behalf of and advances to/from the Group:
| | | | | | | |
| | | Group
As of
December 31, | | Company
As of
December 31,
2009
US$’000 | |
| | | 2009
US$’000 | | 2008
US$’000 | |
| | | |
Receivables from fellow subsidiaries | | 1,222 | | 30,151 | | — | |
Receivables from subsidiaries | | — | | — | | 931,051 | |
Less: non-current portion | | — | | — | | (624,324 | ) |
| | | | | | | |
| | | |
Current portion | | 1,222 | | 30,151 | | 306,727 | |
| | | | | | | |
| | | |
Payables to related companies: | | | | | | | |
LVS | | 2,555 | | 366,220 | | 1,678 | |
Intermediate holding companies | | 4,086 | | 871,157 | | — | |
Fellow subsidiaries | | 10,700 | | 3,376 | | — | |
Subsidiaries | | — | | — | | 746 | |
| | | | | | | |
| | | |
| | 17,341 | | 1,240,753 | | 2,424 | |
| | | | | | | |
Receivable from a subsidiary of approximately US$624.3 million is unsecured, interest-free and not repayable in the coming twelve months. The remaining receivables and payables are unsecured, interest-free and have no fixed terms of repayment.
185
Sands China Ltd.
Notes to the Consolidated Financial Statements—(Continued)
33. Related party transactions (continued)
(e) Notes payable to related companies
| | | | | | |
| | | Group
As of
December 31, | | Company
As of
December 31,
2009
US$’000 |
| | | 2009
US$’000 | | 2008
US$’000 | |
| | | |
LVS | | — | | 94,310 | | — |
Intermediate holding company | | — | | 58,881 | | — |
| | | | | | |
| | | |
| | — | | 153,191 | | — |
| | | | | | |
(f) Notes interest payable to related companies
| | | | | | |
| | | Group
As of
December 31, | | Company
As of
December 31,
2009
US$’000 |
| | | 2009
US$’000 | | 2008
US$’000 | |
| | | |
LVS | | — | | 322 | | — |
Intermediate holding company | | — | | 793 | | — |
| | | | | | |
| | | |
| | — | | 1,115 | | — |
| | | | | | |
(g) Key management personnel remuneration
No transaction has been entered with the Directors of the Company (being the key management personnel) during the year ended December 31, 2009 other than the emoluments paid to them (being the key management personnel remuneration) as disclosed in Note 7 (2008: same).
(h) Share-based compensation
The Group participates in the share-based compensation plan of the LVS (Notes 7 and 34).
186
Annual Report 2009
Notes to the Consolidated Financial Statements—(Continued)
34. Share-based compensation
(a) Share options of the Company
The Company has approved a share option scheme under which it may grant options to employees of the Group (including Executive Directors of the Company) to subscribe for shares of the Company. Options are granted and exercisable in accordance with the terms set out in the share option scheme. The Group has no legal or constructive obligation to repurchase or settle the options in cash.
As of December 31, 2009, no options had been granted under the share option scheme.
(b) Share options of LVS
The Group participates in the equity settled share-based compensation plan of LVS and is a party to a nonqualified share option plan, the 2004 Plan, which is described below. The plan provides for the granting of share options pursuant to the applicable provisions of the Internal Revenue Code and regulations in the United States of America.
LVS adopted the 2004 Plan, to which the Group is a party, for grants of option to purchase its common shares. The purpose of the 2004 Plan is to give LVS and its subsidiaries (collectively the “LVS Group”) a competitive edge in attracting, retaining, and motivating employees, Directors and consultants and to provide the LVS Group with a share plan providing incentives directly related to increases in its shareholder value. Any of the LVS Group’s employees, Directors or officers and many of its consultants are eligible for awards under the 2004 Plan. The 2004 Plan provides for an aggregate of 26,344,000 shares of LVS’s common shares to be available for awards. The 2004 Plan has a term of ten years and no further awards may be granted after the expiration of the term. LVS’s compensation committee may grant awards of nonqualified share options, incentive (qualified) share options, share appreciation rights, restricted share awards, restricted share units, share bonus awards, performance compensation awards or any combination of the foregoing. As of December 31, 2009, there were 9,981,102 shares available for grant under the 2004 Plan.
Stock option awards are granted with an exercise price equal to the fair market value (as defined in the 2004 Plan) of LVS’s stock on the date of grant. The outstanding stock options generally vest over four years and have ten-year contractual terms. Compensation cost for all stock option grants is net of estimated forfeitures and is recognized on an accelerated granted attribution approach over the awards’ respective requisite service periods. LVS estimates the fair value of stock options using the Black-Scholes option-pricing model. Expected volatilities are based on a combination of LVS’s historical volatility and the historical volatilities from a selection of companies from LVS’s peer group due to LVS’s lack of historical information. The Group estimated the expected option life based on life of options, exercise prices, current price of the underlying shares and other factors. The risk-free interest rate for periods equal to the expected term of the share options is based on the U.S Treasury yield curve in effect at the time of grant. LVS has no legal or constructive obligation to repurchase or settle the options in cash.
Prior to 2008, LVS charged the Group the share-based compensation expenses equivalent to the fair value of the share options granted by LVS to the Directors and employees of the Group. The share-based compensation expenses were charged to the consolidated income statement and credited to payables to related companies.
187
Sands China Ltd.
Notes to the Consolidated Financial Statements—(Continued)
34. Share-based compensation (continued)
(b) Share options of LVS (continued)
Starting from 2008, LVS ceased to charge the Group the share-based compensation. For the purpose of financial reporting of the Group, share-based compensation expense arising from the granting of share options by LVS to the Directors and employees of the Group, to the extent of services rendered to the Group, is deemed to have been allocated to the Group as its expense with the corresponding increase in the share option reserve under equity in the relevant companies comprising the Group.
Movements in the number of share options outstanding and their related weighted average exercise prices attributable to the employees of the Group as grantees of the share option scheme operated by LVS are as follows:
| | | | | | | | | | |
| | | Year ended December 31, | |
| | | 2009 | | | 2008 | |
| | | Weighted
average
exercise
price(i) | | Number
of options
‘000(ii) | | | Weighted
average
exercise
price(i) | | Number
of options
‘000(ii) | |
| | | US$ | | | | | US$ | | | |
| | | | |
Outstanding at January 1 | | 63.36 | | 2,872 | | | 59.41 | | 1,862 | |
Granted | | 10.22 | | 679 | | | 67.72 | | 1,479 | |
Transfer-in(iii) | | 56.14 | | 109 | | | 60.63 | | 41 | |
Exercised | | 5.03 | | (3 | ) | | 34.82 | | (69 | ) |
Transfer-out(iii) | | 51.43 | | (261 | ) | | 65.24 | | (122 | ) |
Forfeited | | 67.07 | | (759 | ) | | 65.54 | | (291 | ) |
Expired | | 63.31 | | (271 | ) | | 66.38 | | (28 | ) |
| | | | | | | | | | |
| | | | |
Outstanding at December 31 | | 47.97 | | 2,366 | | | 63.36 | | 2,872 | |
| | | | | | | | | | |
| | | | |
Exercisable at December 31 | | 56.90 | | 684 | | | 52.26 | | 514 | |
| | | | | | | | | | |
| (i) | Exercise price is expressed in US dollars. |
| (ii) | Number of options represents the number of ordinary shares in LVS into which the options are exercisable. |
| (iii) | Transfer-in and transfer-out represent movement of options owned by grantees who transferred from other subsidiaries of LVS to the Group, or vice versa. |
188
Annual Report 2009
Notes to the Consolidated Financial Statements—(Continued)
34. Share-based compensation (continued)
The above share options outstanding as of the dates indicated have the following remaining contractual lives and exercise prices:
| | | | | | | | |
| | | As of December 31, |
| | | 2009 | | 2008 |
Exercise price (US$)(i) | | Number
of options
outstanding
‘000(ii) | | Weighted
average
remaining
contractual life | | Number
of options
outstanding
‘000(ii) | | Weighted
average
remaining
contractual life |
| | | | |
5.03 | | 33,750 | | 8.92 | | 130,000 | | 9.92 |
5.93 | | 5,100 | | 9.03 | | — | | — |
7.73 | | 174,000 | | 9.46 | | — | | — |
11.13 | | 500,000 | | 9.60 | | — | | — |
29.00 | | 173,925 | | 4.95 | | 272,487 | | 5.95 |
30.54 | | 2,500 | | 5.80 | | 13,500 | | 6.80 |
33.55 | | 5,000 | | 8.53 | | 5,000 | | 9.53 |
37.18 | | 60,000 | | 5.52 | | 60,000 | | 6.52 |
39.30 | | 5,000 | | 8.52 | | 5,000 | | 9.52 |
42.59 | | 215,875 | | 6.03 | | 318,100 | | 7.03 |
44.03 | | 45,000 | | 8.58 | | 55,000 | | 9.58 |
47.53 | | 31,250 | | 6.12 | | 48,250 | | 7.12 |
50.93 | | 5,000 | | 8.63 | | 5,000 | | 9.63 |
62.20 | | — | | — | | 105,000 | | 7.32 |
64.11 | | 7,500 | | 8.43 | | 7,500 | | 9.43 |
69.60 | | 395,750 | | 8.31 | | 664,500 | | 9.31 |
72.76 | | — | | — | | 5,000 | | 9.38 |
76.70 | | 246,250 | | 7.38 | | 381,375 | | 8.38 |
78.02 | | 30,000 | | 7.41 | | 30,000 | | 8.41 |
82.35 | | 31,050 | | 6.86 | | 46,050 | | 7.86 |
82.83 | | 356,750 | | 8.23 | | 526,000 | | 9.23 |
83.84 | | — | | — | | 17,500 | | 8.16 |
87.91 | | — | | — | | 2,500 | | 8.16 |
91.44 | | — | | — | | 7,500 | | 9.12 |
93.76 | | 20,000 | | 7.59 | | 20,000 | | 8.59 |
94.84 | | — | | — | | 50,000 | | 7.95 |
97.79 | | 5,000 | | 7.65 | | 5,000 | | 8.65 |
99.57 | | — | | — | | 50,000 | | 8.10 |
99.92 | | — | | — | | 5,000 | | 8.64 |
118.15 | | 17,000 | | 7.87 | | 37,000 | | 8.87 |
| | | | | | | | |
| | | | |
| | 2,365,700 | | 7.98 | | 2,872,262 | | 8.36 |
| | | | | | | | |
| (i) | Exercise price is expressed in US dollars. |
| (ii) | Number of options represents the number of ordinary shares in LVS into which the options are exercisable. |
Options exercised during the years ended December 31, 2008 and 2009 resulted in 68,912 and 2,500 shares, respectively, of LVS being issued at weighted average prices of US$34.82 and US$5.03, respectively. The related weighted average share prices at the time of exercise were US$83.72 and US$16.08 per share during the years ended December 31, 2008 and 2009, respectively.
189
Sands China Ltd.
Notes to the Consolidated Financial Statements—(Continued)
34. Share-based compensation (continued)
The significant inputs into the Black-Scholes option-pricing model in determining the fair value of the share options granted by LVS during the years presented are as follows:
| | | | | | |
| | | Year ended December 31, | |
| | | 2009 | | | 2008 | |
| | |
Risk-free annual interest rate | | 3.01 | % | | 2.97 | % |
Dividend yield | | — | | | — | |
Expected life (years) | | 5.9 | | | 6.4 | |
Expected volatility(1) | | 78.99 | % | | 36.56 | % |
Weighted average share price (US$) | | 10.22 | | | 67.72 | |
Weighted average exercise price (US$) | | 10.22 | | | 67.72 | |
Weighted average fair value of each share option granted by LVS (US$) | | 7.02 | | | 27.78 | |
| | | | | | |
| (1) | Expected volatility is calculated based on a combination of LVS’s historical volatility and the historical volatilities from a selection of LVS’s peer group over the period that has the same length as the expected life of each grant. |
Movements in the number of restricted shares outstanding and the respective weighted average grant date fair value attributable to the employees of the Group as grantees of the restricted shares granted by LVS are as follows:
| | | | | | | | | |
| | | Year ended December 31, | |
| | | 2009 | | 2008 | |
| | | Weighted
average
exercise
price(i) | | Number
of options
‘000(ii) | | Weighted
average
exercise
price(i) | | Number
of options
‘000(ii) | |
| | | US$ | | | | US$ | | | |
| | | | |
Outstanding at January 1 | | | | | | | | | |
Granted | | 7.30 | | 14 | | 78.62 | | 1 | |
Vested | | — | | — | | — | | — | |
Cancelled/forfeited | | — | | — | | 78.62 | | (1 | ) |
| | | | | | | | | |
| | | | |
Outstanding at December 31 | | 7.30 | | 14 | | — | | — | |
| | | | | | | | | |
| (i) | Grant date fair value represents the fair value of the ordinary shares of LVS. |
| (ii) | Number of restricted shares outstanding represents the number of ordinary shares of LVS given to the employees upon vesting. |
35. Subsequent events
On January 7, 2010, the Group was granted a 10-year license to operate its ferries between Macao and Hong Kong under the new licensing regime approved by the Macao Government. The license also increases the number of routes the Group could operate, including the addition of several daily roundtrip sailings between the Hong Kong International Airport and Taipa Ferry Terminal, and between the China Ferry Terminal in Kowloon and Taipa Ferry Terminal, respectively. In conjunction with the grant of this new license, the court appeal for a litigation case with Norte Oeste Expresso Ltd. filed on January 2, 2008 was dismissed.
190
Annual Report 2009
Financial Summary
Consolidated Income Statements
| | | | | | | | | | | |
| | | Year ended December 31, | |
| | | 2006
US$’000 | | | 2007
US$’000 | | 2008
US$’000 | | | 2009
US$’000 | |
| | | | |
Net revenues | | 1,281,093 | | | 1,966,212 | | 3,053,319 | | | 3,301,114 | |
| | | | | | | | | | | |
| | | | |
Profit from operations | | 378,324 | | | 243,895 | | 293,974 | | | 369,981 | |
| | | | | | | | | | | |
| | | | |
Profit before income tax | | 375,836 | | | 196,084 | | 175,905 | | | 214,037 | |
Income tax (expenses)/credits | | (2 | ) | | 54 | | (169 | ) | | (201 | ) |
| | | | | | | | | | | |
| | | | |
Profit for the year attributable to equity holders of the Company | | 375,834 | | | 196,138 | | 175,736 | | | 213,836 | |
| | | | | | | | | | | |
Consolidated Balance Sheets
| | | | | | | | |
| | | As of December 31, |
| | | 2006
US$’000 | | 2007
US$’000 | | 2008
US$’000 | | 2009
US$’000 |
| | | | |
Assets | | | | | | | | |
Non-current assets | | 2,255,733 | | 4,161,521 | | 6,046,888 | | 6,105,366 |
Current assets | | 531,214 | | 746,982 | | 840,743 | | 1,230,536 |
| | | | | | | | |
| | | | |
Total assets | | 2,786,947 | | 4,908,503 | | 6,887,631 | | 7,335,902 |
| | | | | | | | |
| | | | |
Equity and liabilities | | | | | | | | |
Equity | | 854,973 | | 1,047,850 | | 1,249,534 | | 3,685,392 |
| | | | | | | | |
| | | | |
Non-current liabilities | | 1,387,407 | | 2,942,050 | | 3,611,525 | | 2,745,182 |
Current liabilities | | 544,567 | | 918,603 | | 2,026,572 | | 905,328 |
| | | | | | | | |
| | | | |
Total liabilities | | 1,931,974 | | 3,860,653 | | 5,638,097 | | 3,650,510 |
| | | | | | | | |
| | | | |
Total equity and liabilities | | 2,786,947 | | 4,908,503 | | 6,887,631 | | 7,335,902 |
| | | | | | | | |
191
Sands China Ltd.
Corporate Information
Directors
Executive Directors
Mr. Steven Craig Jacobs
(Chief Executive Officer, President)
Mr. Stephen John Weaver
(Chief Development Officer)
Non-Executive Director
Mr. Sheldon Gary Adelson(Chairman)
Mr. Jeffrey Howard Schwartz
Mr. Irwin Abe Siegel
Independent Non-Executive Directors
Mr. Iain Ferguson Bruce
Ms. Chiang Yun
Mr. David Muir Turnbull
Registered Office in Cayman Islands
Walkers Corporate Services Limited
Walker House, 87 Mary Street
George Town, Grand Cayman KY1-9005
Cayman Islands
Principal place of Business and Head Office in Macao
The Venetian Macao-Resort-Hotel
Executive Offices, L2
Estrada da Baia de N. Senhora da Esperanca, s/n
Taipa, Macao
Principal Place of Business in Hong Kong
Level 28, Three Pacific Place
1 Queen’s Road East
Hong Kong
Company’s Website
www.sandschinaltd.com
Joint Company Secretaries
Mr. Luis Nuno Mesquita de Melo
Ms. Ho Siu Pik(ACS, ACIS)
Audit committee
Mr. Iain Ferguson Bruce(Chairman)
Ms. Chiang Yun
Mr. Irwin Abe Siegel
Remuneration Committee
Mr. David Muir Turnbull(Chairman)
Mr. Iain Ferguson Bruce
Mr. Jeffrey Howard Schwartz
LVSC Announcements Committee
Mr. Steven Craig Jacobs(Chairman)
Mr. Iain Ferguson Bruce
Mr. David Muir Turnbull
Authorized Representatives
Mr. Steven Craig Jacobs
The Venetian Macao-Resort-Hotel
Executive Offices, L3
Estrada da Baia de N. Senhora da Esperanca, s/n
Taipa, Macao
Mr. Luis Nuno Mesquita de Melo
The Venetian Macao-Resort-Hotel
Executive Offices – L2
Estrada da Baia de N. Senhora da Esperanca, s/n
Taipa, Macao
Cayman Islands principal share registrar and transfer office
Walkers Corporate Services Limited
Walker House, 87 Mary Street
George Town, Grand Cayman KY1-9005
Cayman Islands
Hong Kong Share Registrar
Computershare Hong Kong Investor Services Limited
Shops 1712–1716, 17th Floor
Hopewell Centre
183 Queen’s Road East
Wanchai
Hong Kong
Compliance Advisor
CLSA Equity Capital Markets Limited
Principal Bankers
Banco Nacional Ultramarino S.A.
Avenida Almeida Ribeiro, 22,
Macao
Bank of China Limited, Macao Branch
Bank of China Building
Avenida Doutor Mario Soares,
Macao
Stock Code
1928
192
Annual Report 2009
Contact Us
Annual Report
Printed in English and Chinese languages, available on our website at www.sandschinaltd.com on April 23, 2010 and posted to Shareholders on April 26, 2010.
Those Shareholders who (a) received our 2009 Annual Report electronically and would like to receive a printed copy or vice versa; or (b) received our 2009 Annual Report in either English or Chinese language only and would like to receive a printed copy of the other language version or to receive printed copies of both language versions in the future, may at any time change their choice of the language or means of receipt of the Company’s corporate communications free of charge by reasonable notice in writing or by email to sandschina.com@computershare.com.hk to the Company c/o the Hong Kong Share Registrar.
Register of Members
To be closed from June 8 to June 19, 2010, both days inclusive.
Annual General Meeting (AGM)
To be held on June 19, 2010. The Notice of the AGM, which constitutes part of the circular to shareholders, will be sent together with this Annual Report. The Notice of the AGM and the proxy form will also be available from the Company’s website.
Hong Kong Share Registrar
Computershare Hong Kong Investor Services Limited
| | |
| Address: | | Shops 1712–1716, 17th Floor, Hopewell Centre, 183 Queen’s Road East, Wanchai, Hong Kong |
| Telephone: | | +852 2862 8628 |
| Facsimile: | | +852 2865 0990 |
| Email: | | hkinfo@computershare.com.hk |
|
| Contact Us |
| |
| Address: | | Level 28, Three Pacific Place, 1 Queen’s Road East, Hong Kong |
| Telephone: | | +853 8118 2888 |
| Facsimile: | | +853 2888 3382 |
| Email: | | scl-enquires@venetian.com.mo |
193
Sands China Ltd.
Glossary
| | |
“adjusted EBITDAR” | | adjusted EBITDAR is profit before interest, income taxes, depreciation and amortization (net of amortization of show production costs), pre-opening expense, development expense, net foreign exchange losses or gains, loss or gain on disposal of property and equipment, corporate expense, land lease expense, share-based compensation, loss on modification or early retirement of debt and fair value losses or gains on financial assets at fair value through profit or loss. With respect to adjusted EBITDAR for each of our properties, we make allocations of the shared support expenses based on revenue attributable to each property. Adjusted EBITDAR is used by management as the primary measure of operating performance of our Group’s properties and to compare the operating performance of our Group’s properties with that of its competitors. However, adjusted EBITDAR should not be considered in isolation; construed as an alternative to profit or operating profit; as an indicator of our IFRS operating performance, other combined operations or cash flow data; or as an alternative to cash flow as a measure of liquidity. Adjusted EBITDAR presented in the Prospectus may not be comparable to other similarly titled measures of other companies. In addition, our adjusted EBITDAR presented in the Prospectus may differ from adjusted EBITDAR presented by LVS for its Macao segment in its filings with the U.S. Securities and Exchange Commission. |
| |
“ADR” | | the average daily rate per occupied room in a given time period, calculated as room revenue divided by the number of rooms sold |
| |
“Bonds” | | the US$600.0 million exchangeable bonds due 2014 issued by VVDI (II), which were mandatorily and automatically exchanged for Shares upon the Listing |
| |
“cage” | | a secure room within a casino with a facility that allows patrons to exchange cash for chips required to participate in gaming activities, or to exchange chips for cash |
| |
“CAGR” | | compound annual growth rate |
| |
“Capitalization Issue” | | the issue of Shares made upon the capitalization of certain sums standing to the credit of the share premium account of our Company as further described in “Statutory and General Information — Further Information About Our Group — Resolutions in Writing of the Sole Shareholder of Our Company Passed on November 8, 2009” in Appendix VII of our Prospectus |
| |
“casino(s)” | | a gaming facility that provides casino games consisting of table games operated in VIP areas or mass market areas, electronic games, slot machines and other casino games |
| |
“China” or the “PRC” | | the People’s Republic of China excluding, for the purpose of this annual report only, Hong Kong, Macao and Taiwan, unless the context otherwise requires |
| |
“chip(s)” | | tokens issued by a casino to players in exchange for cash or credit, which may be used to place bets on gaming tables, in lieu of cash |
194
Annual Report 2009
Glossary
| | |
| |
“Company,” “our,” “we,” “us,” or “Sands China” | | Sands China Ltd., a company incorporated in the Cayman Islands on July 15, 2009 as an exempted company with limited liability and, except where the context otherwise requires, all of its subsidiaries, or where the context refers to the time before it became the holding company of its present subsidiaries, its present subsidiaries. When used in the context of gaming operations or the Subconcession, “we,” “us,” or “our” refers exclusively to VML |
| |
“Companies Ordinance” | | the Companies Ordinance (Chapter 32 of the Laws of Hong Kong) as amended, supplemented or otherwise modified from time to time |
| |
“Concessionaire(s)” | | the holder(s) of a concession for the operation of casino games in the MSAR. As of the Latest Practicable Date, the Concessionaires were Galaxy, SJM and Wynn Macau |
| |
“Controlling Shareholder(s)” | | has the meaning ascribed to it under the Listing Rules and, with respect to our Company, the controlling shareholders as referred to in “Relationship with Our Controlling Shareholders” of our Prospectus |
| |
“Cotai” | | the name given to the land reclamation area in the MSAR between the islands of Coloane and Taipa |
| |
“Cotai Strip” | | integrated resort projects on Cotai being developed by us and inspired by the Las Vegas Strip in Las Vegas, Nevada, U.S.A. LVS has registered the Cotai Strip trademark in Hong Kong and Macao |
| |
“DICJ” | | Gaming Inspection and Coordination Bureau (“Direcça¯o de Inspecção e Coordenação de Jogos”) under the Secretary for Economy and Finance of the MSAR |
| |
“DSEC” | | the Statistics and Census Service of the MSAR |
| |
“EBITDA” | | earnings before interest, taxes, depreciation and amortization |
| |
“Exchange Rate” | | save as otherwise stated, amounts denominated in U.S. dollars, MOP and Hong Kong dollars have been converted, for the purposes of illustration only, in this Annual Report at: |
| |
| | US$1.00 : HK$7.75 |
| | US$1.00 : MOP8.00 |
| | US$1.00 : RMB6.84 |
| | HK$1.00 : MOP1.03 |
| |
“Four Seasons Hotel” | | refers to the Four Seasons Hotel Macao, Cotai Strip®, which is managed and operated by FS Macau Lda., an affiliate of Four Seasons Hotels Limited |
| |
“Galaxy” | | Galaxy Casino S.A. (also known as Galaxy Casino Company Limited), a company incorporated in Macao on November 30, 2001 and one of the three Concessionaires |
| |
“gaming area(s)” | | a gaming facility that provides casino games consisting of table games operated in VIP areas or mass market areas, electronic games, slot machines and other casino games but has not been designated as a casino by the Macao Government |
195
Sands China Ltd.
Glossary
| | |
| |
“Gaming Promoter(s)” | | individuals or corporations licensed by and registered with the Macao Government to promote games of fortune and chance to patrons, through the arrangement of certain services, including extension of credit (regulated by Law No. 5/2004), transportation, accommodation, dining and entertainment, whose activity is regulated by Administrative Regulation No. 6/2002 |
| |
“GDP” | | gross domestic product |
| |
“Global Offering” | | the offer of Shares in the Company by subscription for cash at HK$10.38 on November 30, 2009 on and subject to the terms outlined in the Prospectus |
| |
“Group” | | our Company and its subsidiaries and, in respect of the period before our Company became the holding company of such subsidiaries, the entities which carried on the business of the present Group at the relevant time |
| |
“HIBOR” | | the Hong Kong Interbank Offered Rate |
| |
“HK$” or “HK dollars” | | Hong Kong dollars, the lawful currency of Hong Kong |
| |
“Hong Kong” | | the Hong Kong Special Administrative Region of the PRC |
| |
“IFRS” | | International Financial Reporting Standards |
| |
“integrated resort(s)” | | a resort which provides customers with a combination of hotel accommodations, casinos or gaming areas, retail and dining facilities, MICE space, entertainment venues and spas |
| |
“Latest Practicable Date” | | April 14, 2010 |
| |
“LIBOR” | | London Interbank Offered Rate |
| |
“Listing” | | the listing of the Shares on the Main Board on November 30, 2009 |
| |
“Listing Date” | | November 30, 2009, the date on which dealings in the Shares first commenced on the Main Board |
| |
“Listing Rules” | | the Rules Governing the Listing of Securities on the Stock Exchange (as amended from time to time) |
| |
“LVS” | | Las Vegas Sands Corp., a company incorporated in Nevada, U.S.A. in August 2004 and the common stock of which is listed on the New York Stock Exchange |
| |
“LVS Dutch” | | LVS Dutch Intermediate Holding BV, an indirect, wholly owned subsidiary of LVS |
| |
“LVS Group” | | LVS and its subsidiaries (excluding our Group) |
| |
“Macao” or “MSAR” | | the Macao Special Administrative Region of the PRC |
196
Annual Report 2009
Glossary
| | |
| |
“Macao Government” | | the local government of the MSAR, established on December 20, 1999 and the local administration before this date |
| |
“Main Board” | | the stock exchange (excluding the option market) operated by the Stock Exchange which is independent of and operated in parallel with the Growth Enterprise Market of the Stock Exchange |
| |
“mass market player(s)” | | non-rolling chip players |
| |
“Melco Crown” | | Melco Crown Jogos (Macau), S.A., a private company limited by shares (“sociedade anónima”) incorporated on May 10, 2006 under the laws of Macao and one of the three Subconcessionaires |
| |
“MGM Grand Paradise” | | MGM Grand Paradise, S.A. (also known as MGM Grand Paradise Limited), a private company limited by shares (“sociedade anónima”) incorporated on June 17, 2004 under the laws of Macao and one of the three Subconcessionaires |
| |
“MICE” | | Meetings, Incentives, Conventions and Exhibitions, an acronym commonly used to refer to tourism involving large groups brought together for an event or corporate meeting |
| |
“MOP” or “pataca(s)” | | Macao pataca, the lawful currency of Macao |
| |
“Parcel 1” | | a land parcel in Cotai totaling 291,479 square meters described under Registration No. 23225 by the Macau Property Registry, on which The Venetian Macao has been constructed |
| |
“Parcel 2” | | a land parcel in Cotai totaling 53,700 square meters described under Registration No. 23223 by the Macau Property Registry, on which The Plaza Macao has been constructed |
| |
“Parcel 3” | | a land parcel in Cotai totaling 60,479 square meters described under Registration No. 23224 by the Macau Property Registry, which is expected to contain an integrated resort that will be connected to The Plaza Macao and the CotaiExpo center at The Venetian Macao, and may contain over 4,000 branded hotel rooms, gaming areas and other integrated resort amenities. These plans are based on general building plans submitted to the Land, Public Works and Transport Bureau of the MSAR on June 18, 2009, which we are continuing to refine and update during the course of its overall design and development |
| |
“Parcels 5 and 6” | | land parcels in Cotai totaling 150,134 square meters, including 44,576 square meters designated as a tropical garden. On November 11, 2009, we received a final draft land concession contract for Parcels 5 and 6. The final draft land concession incorporates all the terms and conditions as agreed between us and the Macao Government. The Group intends to accept the draft land concession contract and pay the initial land premium payment before the Listing Date by following the standard MSAR land grant process |
197
Sands China Ltd.
Glossary
| | |
| |
“premium player(s)” | | rolling chip players who have a direct relationship with gaming operators and typically participate in gaming activities in casinos or gaming areas without the use of Gaming Promoters |
| |
“Prospectus” | | our Listing prospectus dated November 16, 2009, which is available from our website at www. sandschinaltd.com |
| |
“PwC” | | PricewaterhouseCoopers, the global professional services company |
| |
“RMB” or “Renminbi” | | Renminbi, the lawful currency of China |
| |
“rolling chip play” | | play by VIP and premium players (excludes Paiza cash players) using non-negotiable chips |
| |
“rolling chip volume” | | casino revenue measurement, measured as the sum of all non-negotiable chips wagered and lost by VIP and premium players (excludes Paiza cash players) |
| |
“Sands Macao” | | the Sands Macao, which includes gaming areas, a hotel tower, restaurants and a theater |
| |
“SFO” | | the Securities and Futures Ordinance of Hong Kong (Chapter 571 of the Laws of Hong Kong) as amended, supplemented or otherwise modified from time to time |
| |
“Shared Services Agreement” | | the shared services agreement dated November 8, 2009 entered into between LVS and our Company to regulate their relationship with respect to the provision of certain shared services |
| |
“Share(s)” | | ordinary shares in our Company with a nominal value of US$0.01 each |
| |
“Shareholder(s)” | | holder(s) of Shares |
| |
“Share Option Scheme” | | the share option scheme conditionally adopted by our Company on November 8, 2009, the principal terms of which are summarized on page 100 |
| |
“SJM” | | Sociedade de Jogos de Macau, S.A., a private company limited by shares (“sociedade anónima”), incorporated on November 28, 2001 under the laws of Macao and one of the three Concessionaires |
| |
“slot machine(s)” | | traditional gaming machines operated by a single player and electronic multiple-player gaming machines. In the Prospectus, the number of slot machines is counted on the same basis used by the DICJ, namely, the number of slot machines equals the number of single-player electronic gaming machines plus the number of player-positions on multiple-player electronic gaming machines |
| |
“SOX” | | the United States federal law Sarbanes Oxley Act of 2002 |
| |
“Stock Exchange” | | The Stock Exchange of Hong Kong Limited |
198
Annual Report 2009
Glossary
| | |
| |
“Subconcession” or “Subconcession Contract” | | the tripartite Subconcession Contract for the operation of casino games dated December 26, 2002 among Galaxy, the Macao Government and VML |
| |
“Subconcessionaire(s)” | | the holder(s) of a subconcession for the operation of casino games in the MSAR. As of the Latest Practicable Date, the Subconcessionaires were VML (one of our subsidiaries), Melco Crown and MGM Grand Paradise |
| |
“subsidiary(ies)” | | has the meaning ascribed to it under Section 2 of the Companies Ordinance |
| |
“table games” | | typical casino games, including card games such as baccarat, blackjack and hi-lo (also known as “Sic bo”) as well as craps and roulette |
| |
“The Plaza Macao” | | an integrated resort which includes (i) the Four Seasons Hotel; (ii) the Plaza Casino gaming area operated by VML; (iii) the Paiza Mansions, The Shoppes at Four Seasons, restaurants and a spa, each of which are operated by us; and (iv) a luxury apart-hotel tower, which is anticipated to be branded and serviced by Four Seasons; except where the context indicates otherwise |
| |
“The Venetian Macao” | | The Venetian® Macao-Resort-Hotel, an integrated resort that includes casino and gaming areas, a hotel, MICE space, The Grand Canal Shoppes, over 50 different restaurants and food outlets, a 15,000-seat arena and other entertainment venues |
| |
“United States,” “U.S.” or “U.S.A.” | | the United States of America, including its territories and possessions and all areas subject to its jurisdiction |
| |
“US$” or “U.S. dollars” | | United States dollars, the lawful currency of the United States |
| |
“VIP player(s)” | | rolling chip players who play almost exclusively in dedicated VIP rooms or designated casino or gaming areas and are sourced from Gaming Promoters |
| |
“VIP room(s)” | | rooms or designated areas within a casino or gaming area where VIP players and premium players gamble |
| |
“visit(s)” or “visitation(s)” | | with respect to visitation of our properties, the number of times a property is entered during a fixed time period. Estimates of the number of visits to our properties is based on information collected from digital cameras placed above every entrance in our properties which use video signal image processor detection and include repeat visitors to our properties on a given day |
| |
“VML” | | our subsidiary, Venetian Macau, S.A. (also known as Venetian Macau Limited), a private company limited by shares (“sociedade anónima”) incorporated on June 21, 2002 under the laws of Macao, one of the three Subconcessionaires and the holder of the Subconcession |
199
Sands China Ltd.
Glossary
| | |
| |
“VVDIL” | | our subsidiary, Venetian Venture Development Intermediate Limited, a company incorporated in the Cayman Islands on June 21, 2002 as an exempted company with limited liability |
| |
“VVDI (I)” | | Venetian Venture Development Intermediate I, an indirect, wholly owned subsidiary of LVS |
| |
“VVDI (II)” | | Venetian Venture Development Intermediate II, a company incorporated in the Cayman Islands on January 23, 2003 as an exempted company with limited liability and an indirect, wholly owned subsidiary of LVS and our immediate Controlling Shareholder |
200