Sands China Ltd. (Incorporated in the Cayman Islands with limited liability) Stock Code: 1928 INTERIM REPORT 2010

Exhibit 99.1 Contents 1. Overview 2 1.1 Financial Highlights 2 1.2 Interim Dividend 2 2. Management Discussion and Analysis 3 3. Corporate Governance 15 3.1 Corporate Governance Practices 15 3.2 Board and Board Committees Composition 15 3.3 Director Remuneration 17 3.4 Internal Controls 17 3.5 Audit Committee Review 17 3.6 Re-appointment of PricewaterhouseCoopers 17 3.7 Loan Agreement Disclosure 17 3.8 Disclosure of Interests 18 3.9 Share Option Scheme 20 3.10 Purchase, Sale or Redemption of the Company's Listed Shares 22 4. Condensed Consolidated Interim Financial Information 23 4.1 Report on Review of Condensed Consolidated Interim Financial Information 23 4.2 Condensed Consolidated Interim Financial Information 25 4.3 Notes to the Condensed Consolidated Interim Financial Information 31 5. Corporate Information 54 6. Contact Us 55 7. Glossary 56
| Sands China Ltd. |
|
Overview
Financial Highlights
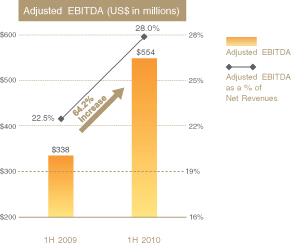
We generated an all-time half year record of US$554.4 million (HK$4,314.7 million) of adjusted EBITDA across all our Group properties, an increase of 64.2% compared to US$337.7 million (HK$2,617.2 million) in the first half of 2009.
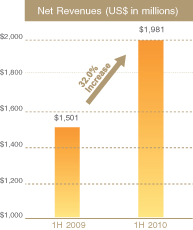
Total net revenues for the Group increased 32.0% to US$1,980.5 million (HK$15,413.6 million) in the first half of 2010, compared to US$1,500.6 million (HK$11,629.7 million) in the first half of 2009.
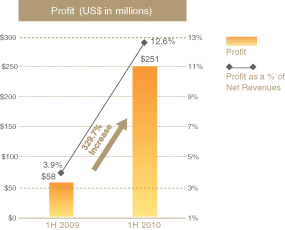
Profit for the Group increased 329.7% to US$250.5 million (HK$1,949.6 million) in the first half of 2010, compared to US$58.3 million (HK$451.8 million) in the first half of 2009.
Interim Dividend
The Board does not declare any interim dividend for the Reporting Period.
| Note: | The translation of US$ amounts into HK$ amounts has been made at the rate of US$1.00 to HK$7.7827 (six months ended June 30, 2009: US$1.00 to HK$7.750) for the purposes of illustration only. |
2
| Interim Report 2010 |
|
Management Discussion and Analysis
Results of Operations
We are pleased to present our unaudited consolidated results of the Group for the six months ended June 30, 2010 compared to the six months ended June 30, 2009.
Net Revenues
Net revenues were US$1,980.5 million for the six months ended June 30, 2010, an increase of US$479.9 million, or 32.0%, compared to US$1,500.6 million for the six months ended June 30, 2009. Net revenues increased
primarily due to an increase in net casino revenues, driven by strong visitation resulting in part from marketing initiatives such as the launch of the Sands Rewards Club, a stable macroeconomic environment in China, as well as management’s focus on driving the high-margin mass market gaming segment, while continuing to provide luxury amenities and high service levels to our VIP premium and junket players.
Our net revenues consisted of the following:
| Six months ended June 30, | |||||||
| 2010 | 2009 | Percent Change | |||||
| (US$ in millions, except percentages) | |||||||
Casino | 1,768.5 | 1,317.1 | 34.3% | ||||
Rooms | 67.5 | 55.5 | 21.6% | ||||
Food and beverage | 34.9 | 25.4 | 37.4% | ||||
Mall | 54.5 | 64.1 | (15.0)% | ||||
Convention, ferry, retail and other | 55.1 | 38.4 | 43.5% | ||||
Total net revenues | 1,980.5 | 1,500.6 | 32.0% | ||||
Our net casino revenues for the six months ended June 30, 2010 were US$1,768.5 million, an increase of US$451.4 million, or 34.3%, compared to US$1,317.1 million for the six months ended June 30, 2009. Net casino
revenues of the Sands Macao, The Venetian Macao and The Plaza Macao increased by US$123.2 million, US$181.1 million and US$147.1 million respectively, due to the factors mentioned above.

3
| Sands China Ltd. |
|
Management Discussion and Analysis
The following table summarizes the results of our casino activity:
| Six months ended June 30, | |||||||
| 2010 | 2009 | Change | |||||
| (US$ in millions, except percentages and points) | |||||||
Sands Macao | |||||||
Total net casino revenues | 572.1 | 448.9 | 27.4% | ||||
Non-rolling chip table games drop | 1,193.1 | 1,208.4 | (1.3)% | ||||
Non-rolling chip table games win percentage | 20.5% | 19.1% | 1.4 pts | ||||
Rolling chip volume | 13,627.8 | 9,845.3 | 38.4% | ||||
Rolling chip win percentage | 3.1% | 2.7% | 0.4 pts | ||||
Slot handle | 769.1 | 577.2 | 33.2% | ||||
Slot hold percentage | 5.8% | 6.7% | (0.9) pts | ||||
The Venetian Macao | |||||||
Total net casino revenues | 974.4 | 793.3 | 22.8% | ||||
Non-rolling chip table games drop | 1,819.6 | 1,623.3 | 12.1% | ||||
Non-rolling chip table games win percentage | 25.0% | 23.2% | 1.8 pts | ||||
Rolling chip volume | 19,815.3 | 18,590.1 | 6.6% | ||||
Rolling chip win percentage | 3.1% | 2.7% | 0.4 pts | ||||
Slot handle | 1,372.3 | 1,093.8 | 25.5% | ||||
Slot hold percentage | 7.2% | 7.5% | (0.3) pts | ||||
The Plaza Macao | |||||||
Total net casino revenues | 222.1 | 75.0 | 196.1% | ||||
Non-rolling chip table games drop | 194.6 | 167.5 | 16.2% | ||||
Non-rolling chip table games win percentage | 26.8% | 25.2% | 1.6 pts | ||||
Rolling chip volume | 8,562.9 | 1,125.2 | 661.0% | ||||
Rolling chip win percentage | 2.8% | 3.2% | (0.4) pts | ||||
Slot handle | 256.3 | 100.0 | 156.3% | ||||
Slot hold percentage | 5.6% | 5.7% | (0.1) pts | ||||
4
| Interim Report 2010 |
|
Management Discussion and Analysis
Net room revenues for the six months ended June 30, 2010 were US$67.5 million, an increase of US$12.0 million, or 21.6%, compared to US$55.5 million for the six months ended June 30, 2009. The increase was primarily driven by continued economic recovery from the global economic downturn
in 2009 as well as a continued focus on promotions such as the Winter, Spring & Summer Packages and incentive schemes given to selected wholesalers.
The following table summarizes our room activity. The suites at the Sands Macao are primarily provided to gaming patrons on a complimentary basis and therefore related statistics have not been included.
| Six months ended June 30, | |||||||
| 2010 | 2009 | Change | |||||
| (US$, except percentages and points) | |||||||
The Venetian Macao | |||||||
Gross room revenues (in millions) | 95.3 | 79.5 | 19.9% | ||||
Average daily rate | 203 | 209 | (2.9)% | ||||
Occupancy rate | 92.4% | 76.7% | 15.7 pts | ||||
Revenue per available room | 187 | 160 | 16.9% | ||||
The Plaza Macao | |||||||
Gross room revenues (in millions) | 13.5 | 7.9 | 70.9% | ||||
Average daily rate | 288 | 293 | (1.7)% | ||||
Occupancy rate | 71.0% | 41.5% | 29.5 pts | ||||
Revenue per available room | 204 | 122 | 67.2% | ||||
Note: Information in this table takes into account rooms provided to customers on a complimentary basis that are recorded at discounted rates.
Net food and beverage revenues for the six months ended June 30, 2010 were US$34.9 million, an increase of US$9.5 million, or 37.4%, compared to US$25.4 million for the six months ended June 30, 2009. The increase was primarily due to the growth in banquet operations as a result of more group business and wedding banquets. In addition, other food and beverage outlets also experienced better performance as a result of improved hotel occupancy.
Mall revenues for the six months ended June 30, 2010 were US$54.5 million, a decrease of US$9.6 million, or 15.0%, compared to US$64.1
million for the six months ended June 30, 2009. The decrease was primarily due to lower occupancy and rent restructuring for certain retailers.
Net convention, ferry, retail and other revenue for the six months ended June 30, 2010 were US$55.1 million, an increase of US$16.7 million, or 43.5%, compared to US$38.4 million for the six months ended June 30, 2009. The increase was primarily attributable to an increase in ferry revenue resulting from an increase in the number of sailings and higher occupancy and an increase in entertainment revenue due to an increase in arena events.

5
| Sands China Ltd. |
|
Management Discussion and Analysis
Operating Expenses
Operating expenses were US$1,659.6 million for the six months ended June 30, 2010, an increase of US$271.3 million, or 19.5%, compared to US$1,388.3 million for the six months ended June 30, 2009. The increase in operating expenses was primarily attributable to the increase in total
gaming tax and premiums as a result of increased gaming revenue, the expansion of our ferry service operations, as well as increases in general and administrative expense, corporate expense and loss on disposal of property and equipment, partially offset by a decrease in pre-opening expenses.
Our operating expenses consisted of the following:
| Six months ended June 30, | |||||||
| 2010 | 2009 | Percent Change | |||||
| (US$ in millions, except percentages) | |||||||
Casino | 1,161.2 | 916.2 | 26.7% | ||||
Rooms | 12.4 | 14.0 | (11.4)% | ||||
Food and beverage | 24.7 | 22.7 | 8.8% | ||||
Mall | 13.7 | 16.8 | (18.5)% | ||||
Convention, ferry, retail and other | 71.1 | 59.7 | 19.1% | ||||
Provision for doubtful accounts | 19.4 | 18.7 | 3.7% | ||||
General and administrative expense | 128.6 | 115.9 | 11.0% | ||||
Corporate expense | 13.6 | 4.7 | 189.4% | ||||
Pre-opening expense | 12.2 | 52.4 | (76.7)% | ||||
Depreciation and amortization | 163.3 | 162.4 | 0.6% | ||||
Loss on disposal of property and equipment | 29.4 | 4.9 | 500.0% | ||||
Fair value losses on financial assets at fair value through | 1.4 | — | — | ||||
Net foreign exchange losses | 8.4 | 0.1 | 8,300.0% | ||||
Total operating expenses | 1,659.6 | 1,388.3 | 19.5% | ||||
Casino expenses for the six months ended June 30, 2010 were US$1,161.2 million, an increase of US$245.0 million, or 26.7%, compared to US$916.2 million for the six months ended June 30, 2009. The increase was primarily due to the increase in total gaming tax and gaming premiums of US$239.1 million as a result of higher casino revenues.
Room expenses for the six months ended June 30, 2010 were US$12.4 million, a decrease of US$1.6 million, or 11.4%, compared to US$14.0 million for the six months ended June 30, 2009. Payroll expenses and hotel supplies decreased by US$4.9 million driven by our cost savings initiatives.
These decreases were partially offset by increases in the management fee to Four Seasons Hotel Management due to higher revenue, outside services for laundry, and travel agent commission of US$2.9 million due to the increase in occupancy.
Food and beverage expenses for the six months ended June 30, 2010 were US$24.7 million, an increase of US$2.0 million, or 8.8%, compared to US$22.7 million for the six months ended June 30, 2009. The increase was driven by the increase in cost of sales of US$2.3 million associated with the increase in food and beverage revenues.
6
| Interim Report 2010 |
|
Management Discussion and Analysis
Mall expenses for the six months ended June 30, 2010 were US$13.7 million, a decrease of US$3.1 million, or 18.5%, compared to US$16.8 million for the six months ended June 30, 2009. The decrease was primarily attributable to the decrease of common area maintenance costs, payroll expenses, utilities, contract labor and special events of US$2.8 million.
Convention, ferry, retail and other expenses for the six months ended June 30, 2010 were US$71.1 million, an increase of US$11.4 million, or 19.1%, compared to US$59.7 million for the six months ended June 30, 2009. The increase was primarily attributable to an increase in ferry expenses of US$9.8 million and an increase of US$3.2 million related to the contract entertainment mainly for Cotai Arena events at The Venetian Macao. These increases were partially offset by a reduction in payroll expenses of US$1.0 million, primarily resulting from management’s continued focus on driving operational efficiencies at the various properties.
Provision for doubtful accounts was US$19.4 million for the six months ended June 30, 2010, an increase of US$0.7 million or 3.7%, compared to US$18.7 million for the six months ended June 30, 2009.
General and administrative expenses were US$128.6 million for the six months ended June 30, 2010, an increase of US$12.7 million, or 11.0%, compared to US$115.9 million for the six months ended June 30, 2009. The increase was primarily attributable to bonus expenses, marketing expenses and utilities expenses of US$22.7 million. The increase was partially offset by a decrease of US$9.8 million driven by reductions in payroll expenses and transportation costs as a result of management’s continued focus on driving operational efficiencies throughout the various properties.
Corporate expenses were US$13.6 million for the six months ended June 30, 2010, an increase of US$8.9 million, or 189.4%, compared to US$4.7 million for the six months ended June 30, 2009. The increase was the result of royalty fees of US$10.0 million payable to Las Vegas Sands, LLC under the terms of the Second Trademark Sublicense Agreement entered into on November 8, 2009.
Pre-opening expenses were US$12.2 million for the six months ended June 30, 2010, a decrease of US$40.2 million, or 76.7%, compared to US$52.4 million for the six months ended June 30, 2009. Pre-opening expenses for the six months ended June 30, 2010 were primarily related to costs associated with the suspension of construction at Parcels 5 and 6, as well as costs related to the Four Seasons Service Apartment. Pre-opening expenses for the six months ended June 30, 2009 were primarily related to costs associated with the suspension of construction at Parcels 5 and 6.
Depreciation and amortization expense was US$163.3 million for the six months ended June 30, 2010, an increase of US$0.9 million, or 0.6%, compared to US$162.4 million for the six months ended June 30, 2009.
Loss on disposal of property and equipment was US$29.4 million for the six months ended June 30, 2010, an increase of US$24.5 million or 500.0% compared to US$4.9 million for the six months ended June 30, 2009. The increase was primarily related to the disposition of construction materials from construction sites at Parcels 5 and 6.
Net foreign exchange losses for the six months ended June 30, 2010 were US$8.4 million, primarily associated with U.S. dollar denominated debt held in Macao. This compares with net foreign exchange losses of US$0.1 million for the six months ended June 30, 2009.

7
| Sands China Ltd. |
|
Management Discussion and Analysis
Adjusted EBITDA(1)
Adjusted EBITDA for the six months ended June 30, 2010 was US$554.4 million, an increase of US$216.7 million, or 64.2%, compared to US$337.7 million for the six months ended June 30, 2009. This strong performance was driven by a significant increase in net casino revenues as a result of management’s focus on both driving the high-margin mass market gaming
segment as well as continuing to provide high service levels to our VIP premium and junket players. In addition, the management team continued to focus on driving operational efficiencies throughout both gaming and non-gaming areas of the business, driving further improvement in adjusted EBITDA.
The following table summarizes information related to our operations:
| Six months ended June 30, | ||||||||
| 2010 | 2009 | Percent Change | ||||||
| (US$ in millions, except percentages) | ||||||||
Adjusted EBITDA: | ||||||||
The Venetian Macao | 362.6 | 229.2 | 58.2% | |||||
Sands Macao | 150.4 | 111.3 | 35.1% | |||||
The Plaza Macao | 52.4 | 9.3 | 463.4% | |||||
Ferry and other operations | (11.0 | ) | (12.2 | ) | (9.8)% | |||
| 554.4 | 337.7 | 64.2% | ||||||
Note: The comparative figures have been reclassified to conform to the presentation of the current period.
Interest Expense
The following table summarizes information related to interest expense:
| Six months ended June 30, | ||||||||
| 2010 | 2009 | Percent change | ||||||
| (US$ in millions, except percentages) | ||||||||
Interest and other finance cost | 82.9 | 58.7 | 41.2% | |||||
Less — capitalized interest | (11.4 | ) | (4.6 | ) | 147.8% | |||
Interest expense, net | 71.5 | 54.0 | 32.4% | |||||
| (1) | Adjusted EBITDA is profit before interest, income taxes, depreciation and amortization (net of amortization of show production costs), pre-opening expense, net foreign exchange losses or gains, loss or gain on disposal of property and equipment, corporate expense, share-based compensation and fair value losses or gains on financial assets at fair value through profit or loss. With respect to adjusted EBITDA for each of our properties, we make allocations of the shared support expenses based on revenue attributable to each property. Adjusted EBITDA is used by management as the primary measure of operating performance of our Group’s properties and to compare the operating performance of our Group’s properties with |
that of its competitors. However, adjusted EBITDA should not be considered in isolation; construed as an alternative to profit or operating profit; as an indicator of our IFRS operating performance, other combined operations or cash flow data; or as an alternative to cash flow as a measure of liquidity. Adjusted EBITDA presented in the report may not be comparable to other similarly titled measures of other companies. In addition, our adjusted EBITDA presented in the report may differ from adjusted EBITDA presented by Las Vegas Sands Corp. (“LVS”) for its Macao segment in its filings with the U.S. Securities and Exchange Commission. |
8
| Interim Report 2010 |
|
Management Discussion and Analysis
Interest and other finance cost for the six months ended June 30, 2010 was US$82.9 million, an increase of US$24.2 million, or 41.2%, compared to US$58.7 million for the six months ended June 30, 2009. The increase was primarily a result of an increase in the weighted average interest rate driven by an increase in the credit spread on the Macao Credit Facility. The US$6.8 million increase in capitalized interest was primarily due to the recommencement of construction activities at Parcels 5 and 6 in May 2010.
Profit for the Period
Profit for the six months ended June 30, 2010 was US$250.5 million, an increase of US$192.2 million, or 329.7%, compared to US$58.3 million for the six months ended June 30, 2009.
Liquidity and Capital Resources
Historically, we have funded our operations through cash generated from our operations and our debt financings, as well as financial support from
LVS and its subsidiaries (excluding our Group) prior to the Global Offering.
On May 17, 2010, Venetian Orient Limited (“VOL”) entered into a credit agreement (the “VOL Credit Facility”) providing for up to US$1.75 billion (or equivalent in HK$ or MOP), which consists of a US$750.0 million term loan (the “VOL Term Facility”) that was fully drawn on July 16, 2010, a US$750.0 million delayed draw term loan available for 18 months after closing (the “VOL Delayed Draw Facility”) and a US$250.0 million revolving facility available until April 17, 2015 (the “VOL Revolving Facility”). As at June 30, 2010, the Company had not drawn any amounts under the VOL Revolving Facility.
As at June 30, 2010, we had cash and cash equivalents of US$673.8 million, restricted cash of US$25.0 million and short term deposits of US$173.5 million.
Cash Flows — Summary
Our cash flows consisted of the following:
| Six months ended June 30, | ||||||
| 2010 | 2009 | |||||
| (US$ in millions) | ||||||
Net cash generated from operating activities | 584.9 | 298.8 | ||||
Net cash used in investing activities | (288.3 | ) | (244.5 | ) | ||
Net cash used in financing activities | (528.6 | ) | (131.2 | ) | ||
Net decrease in cash and cash equivalents | (232.0 | ) | (76.8 | ) | ||
Cash and cash equivalents at beginning of the period | 908.3 | 417.8 | ||||
Effect of exchange rate on cash and cash equivalents | (2.6 | ) | (0.3 | ) | ||
Cash and cash equivalents at end of the period | 673.8 | 340.6 | ||||

9
| Sands China Ltd. |
|
Management Discussion and Analysis
Cash Flows — Operating Activities
We derive most of our operating cash flows from our casino, hotel room and retail mall operations.
Net cash generated from operating activities for the six months ended June 30, 2010 was US$584.9 million, an increase of US$286.1 million, or 95.7%, as compared to US$298.8 million for the six months ended June 30, 2009. The increase in net cash generated from operating activities was primarily due to an increase in profit before tax and improved working capital.
Cash Flows — Investing Activities
Net cash used in investing activities for the six months ended June 30, 2010 was US$288.3 million, which primarily consisted of capital expenditures and purchases of US$173.9 million of short term deposits. Capital expenditures amounted to US$112.4 million, including US$68.1
million for Parcels 5 and 6 of our Cotai Strip development and US$37.3 million for our operations mainly at The Venetian Macao and The Plaza Macao.
Cash Flows — Financing Activities
For the six months ended June 30, 2010, net cash flows used in financing activities were US$528.6 million, primarily attributable to US$392.6 million in repayment of borrowings under our credit facilities, interest paid of US$63.0 million, and financing costs paid of US$56.1 million.
Capital Expenditures
Capital expenditures were used primarily for new projects and to renovate, upgrade and maintain existing properties. Set forth below is historical information on our capital expenditures, excluding capitalized interest and construction payables:
| Six months ended June 30, | ||||||
| 2010 | 2009 | |||||
| (US$ in millions) | ||||||
The Venetian Macao | 18.0 | 7.8 | ||||
Sands Macao | 1.9 | 4.7 | ||||
The Plaza Macao | 15.0 | 128.1 | ||||
Ferry and other operations | 2.4 | 15.9 | ||||
Parcels 5 and 6 | 68.1 | 53.6 | ||||
Other developments | 7.0 | 0.1 | ||||
Total capital expenditures | 112.4 | 210.2 | ||||
Our capital expenditure plans are significant. We recommenced construction activities on Parcels 5 and 6 in May 2010 to complete Phases I and II. We intend to fully fund the development and construction costs
related to Phases I and II with at least US$500.0 million of the proceeds from the Global Offering, up to US$1.75 billion from the VOL Credit Facility and, to the extent necessary, cash flow from existing and future operations.
10
| Interim Report 2010 |
|
Management Discussion and Analysis
We expect to commence construction of Phase III at a future date as demand and market conditions warrant. As at June 30, 2010, we had capitalized construction costs of US$2.03 billion on the development of Parcels 5 and 6 including land, and we expect to spend an additional US$2.1 billion to complete Phases I and II.
These investment plans are preliminary and subject to change based upon the execution of our business plan, the progress of our capital projects, market conditions and the outlook on future business conditions.
Capital Commitments
Future commitments for property and equipment that are not recorded in the financial statements herein are as follows:
| As at June 30, 2010 | | As at December 31, 2009 | | |||
| (US$ in millions) | ||||||
Contracted but not provided for | 479.9 | 162.1 | ||||
Authorized but not contracted for | 1,364.2 | 1,708.2 | ||||
| 1,844.1 | 1,870.3 | |||||
Interim Dividend
The Board does not recommend the payment of an interim dividend for the six months ended June 30, 2010.
Pledge of Fixed Assets
We have pledged a substantial portion of our fixed assets to secure our loan facilities. We have pledged buildings; building, land and leasehold improvements; furniture, fittings and equipment; construction in progress; ferries and vehicles with an aggregate net book value of approximately US$5.35 billion as at June 30, 2010 (December 31, 2009: US$3.68 billion).
Contingent Liabilities and Risk Factors
The Group has contingent liabilities arising in the ordinary course of business. Management has made certain estimates for potential litigation costs based upon consultation with legal counsel and believes that no significant loss will be incurred beyond the amounts provided for as at June 30, 2010. Actual results could differ from these estimates; however, in the opinion of management, it is not anticipated that any material liabilities will arise from the contingent liabilities.
11
| Sands China Ltd. |
|
Management Discussion and Analysis
The land concession for Parcels 5 and 6 was published in Macao’s Official Gazette on May 12, 2010. We will subsequently negotiate the land concession for Parcels 7 and 8. Based on historical experience with the Macao Government with respect to the Group’s land concessions for the Sands Macao and Parcels 1, 2, 3, 5 and 6, management believes that the land concession for Parcels 7 and 8 will be granted. However, if the Group does not obtain the land concession, the Group could forfeit all or a substantial part of its US$102.3 million in construction costs incurred for the development of Parcels 7 and 8 as at June 30, 2010.
The Group had commenced pre-construction on Parcel 3, and had capitalized costs of approximately US$35.5 million as at June 30, 2010. Under the revised terms of the land concession approved by the Macao Government on August 20, 2009 that covers Parcel 3, the Group is required to complete the development of Parcel 3 by April 17, 2013. The land concession for Parcels 5 and 6 contains a similar requirement that the corresponding development be completed by May 2014. Management believes that if the Group is unable to complete the developments by the respective deadlines, it will likely be able to obtain an extension from the Macao Government. However, no assurances can be given that an extension will be granted. If the Group is not able to meet the deadlines and those deadlines are not extended, the Macao Government has the
right to unilaterally terminate the land concessions and the Group could lose its investment in, and right to operate, any properties developed under the land concessions for Parcels 3 and 5 and 6 without compensation to the Group.
Capital Risk Management
The Group’s primary objective when managing capital is to safeguard the Group’s ability to continue as a going concern in order to provide returns for Shareholders and benefits for other stakeholders, by pricing products and services commensurately with the level of risk.
The capital structure of the Group consists of debt, which includes interest bearing borrowings (including current and non-current bank loans as shown in Note 9 to the consolidated interim financial information), cash and cash equivalents, investments (short-term cash deposits with maturities over 90 days) and equity attributable to Shareholders, comprising issued share capital and reserves. The Group actively and regularly reviews and manages its capital structure to maintain the net debt-to-capital ratio (gearing ratio) at an appropriate level based on its assessment of the current risk and circumstances. This ratio is calculated as net debt divided by total capital. Net debt is calculated as interest bearing borrowings less cash and cash equivalents and investments. Total capital is calculated as equity as shown in the consolidated balance sheet plus net debt:
| As at June 30, 2010 | | As at December 31, 2009 | | |||
| (US$ in millions, except percentages) | ||||||
Interest bearing borrowings | 2,379.4 | 2,818.8 | ||||
Less: cash and cash equivalents | (673.8 | ) | (908.3 | ) | ||
Less: investments (short-term cash deposits with maturities over 90 days) | (173.5 | ) | — | |||
Net debt | 1,532.2 | 1,910.5 | ||||
Total equity | 3,943.9 | 3,698.9 | ||||
Total capital | 5,476.1 | 5,609.4 | ||||
Gearing ratio | 28.0% | 34.1% | ||||
12
| Interim Report 2010 |
|
Management Discussion and Analysis
Foreign exchange risk
The Group’s foreign currency transactions are mainly denominated in US$. The majority of assets and liabilities are denominated in US$, HK$ and MOP, and there are no significant assets and liabilities denominated in other currencies. The Group is subject to foreign exchange rate risk arising from future commercial transactions and recognized assets and liabilities that are denominated in a currency other than MOP, which is the functional currency of major operating companies within the Group. The Group currently does not have a foreign currency hedging policy.
Business Review and Prospects
Our business strategy is to continue to successfully execute our Cotai Strip developments and to leverage our integrated resort business model to create Asia’s premier gaming, leisure and convention destination. The Company continues to execute on the strategies outlined in our 2009 Annual Report. These strategies have proven to be successful in the first half of 2010 and we are confident they will continue to be so throughout the rest of the year.
We are making solid progress on the development of our integrated resort on Parcels 5 and 6 on Cotai. We recommenced construction of the project in May 2010 and entered into the VOL Credit Facility on May 17, 2010. Upon completion of Phases I and II, the integrated resort is expected to feature approximately 6,000 luxury and mid- scale hotel rooms, approximately 300,000 square feet of gaming space, approximately 1.2 million square feet of retail, entertainment and dining facilities, exhibition and conference facilities and a multipurpose theater.
Due to matters beyond the Company’s control, we have faced challenges acquiring the construction labor that we need quickly enough to be able to meet our original development and opening deadlines. We estimate that it will take approximately sixteen months to complete Phase I once we have sufficient labor to ramp up our construction activity to requisite levels. We currently expect to open Phase I of the project in the fourth quarter of 2011. Phase II, is expected to open six months thereafter.
On August 26, 2010, the Board approved an increase in the budget for the development of the integrated resort on Parcels 5 and 6 of approximately US$100.0 million. The additional funds will be used for, amongst other things, improving and updating the design and fit-out of the casino and hotel rooms and enhancing the layout of the convention, exhibition and meeting room spaces, along with some additional costs associated with the suspension of the project between November 2008 and May 2010. The Directors believe that the Company has sufficient funds available to be able to fund this budget increase.
The Directors removed Mr. Steven Craig Jacobs from the Board on July 23, 2010 and also terminated his employment as the Company’s Chief Executive Officer, President and Executive Director. Mr. Michael Alan Leven, President and Chief Operating Officer of our controlling shareholder, LVS, was appointed our Acting Chief Executive Officer on July 23, 2010. He will serve in this position until such time as a permanent Chief Executive Officer is found. Mr. Leven served as a Special Advisor to the Board from October 14, 2009 until his appointment as an Executive Director on July 27, 2010. Mr. Leven brings with him extensive experience in the gaming and hospitality industries.
13
| Sands China Ltd. |
|
Management Discussion and Analysis
On July 27, 2010 the Board approved the appointment of Mr. Edward M. Tracy and Mr. David R. Sisk. Mr. Tracy will serve as the Company’s President and Chief Operating Officer. Mr. Sisk will serve as the Company’s Executive Vice President, Chief Casino Officer. Both executives bring many years of development and operations experience to the Company.
Human Resources
As at June 30, 2010, our team member profile was as follows:
Number of full-time team members: | 14,766 | |
Average age: | 37 | |
Average years of service: | 3.52 | |
Gender Ratio: | Male 45.08% | |
| Female 54.92% | ||
Number of nationalities in | 32 | |
Total number of nationalities: | 48 |
Save as disclosed in this 2010 Interim Report, there have been no material changes to the information disclosed in the 2009 Annual Report in respect of the remuneration of employees, remuneration policies, bonus and share option schemes and staff development.
Environment
We recognize the impact our business has on the environment and we continue to strive to achieve the goals we have set ourselves in the areas of resource conservation and reducing our environmental foot print. We encourage and are grateful to those Shareholders who have elected to receive our annual and interim reports via electronic means, thereby reducing the need to print hard copies of our reports. Should you wish to start receiving an electronic copy of our annual and interim reports, please refer to page 55 of this report for more information.
To minimize the impact on our environment, this 2010 Interim Report is printed on recycled paper using soy based inks.
Awards
We are particularly pleased to report that the Company has continued to receive various prestigious awards during 2010 including:
| LACP 2009 Annual Report Vision Awards, Overall, GOLD | |
LACP 2009 Annual Report Vision Awards, Best Report Financials, BRONZE | ||
| International ARC Awards Competition, 2009 Annual Report, Cover Photo/Design (Hotel & Casino), GOLD Award | |
International ARC Awards Competition, 2009 Annual Report, Financial Data (Hotel & Casino), SILVER Award | ||
2010 Business Traveler Asia-Pacific Readers’ Poll, Best Business Hotel in Macao | ||
FinanceAsia Business Travel Poll Awards 2009, Best Hotel in Macao | ||
TTG China Travel Awards 2009, Best Meeting and Conventions Hotel in Macao | ||
The 5th China Hotel Starlight Award, TOP 10 MICE Hotels of China | ||
International Gaming Awards, Casino Interior Design | ||
Forbes Travel Guide 2010, Four-Star Lodging award, Sands Macao |


14
| Interim Report 2010 |
|
Corporate Governance
Corporate Governance Practices
The Company is committed to the maintenance of good corporate governance practices and procedures. In the Corporate Governance Report of April 14, 2010, which was published in our 2009 Annual Report, we reported that the Company has devised its own corporate governance guidelines, which incorporate most of the policies, principles and practices set out in the Code on Corporate Governance Practices (the “CG Code”) contained in Appendix 14 of the Rules Governing the Listing of Securities (the “Listing Rules”) on The Stock Exchange of Hong Kong Limited (the “Stock Exchange”). Except as disclosed below, the Company has fully complied with all the code provisions and certain recommended best practices set out in the CG Code throughout the six months ended June 30, 2010.
In the Corporate Governance Report of April 14, 2010 we had also reported on six deviations from the provisions of the CG Code. Set out below is an update on these deviations:
Code Provision
| A.1.1 | The Board is pleased to report that it meets regularly at least once every quarter. The Board has already exceeded the suggested minimum number of meetings in 2010. |
| A.1.7 | The Board is pleased to report that it has established a procedure to enable directors, upon reasonable request, to seek independent professional advice, in appropriate circumstances, at the Company’s expense. |
| C.2.1 | The Directors are pleased to report that they meet regularly and conduct a review of the effectiveness of the system of internal control of the Company and its subsidiaries. The review covers all material controls, including financial, operational and compliance controls and risk management functions. |
| C.2.2 | The Directors are pleased to report that they consider the Company’s accounting and financial reporting teams to be adequately resourced and qualified. |
| D.1.2 | The Board is currently reviewing and discussing those functions reserved to the Board and those delegated to management. We look forward to providing an update on this matter in our 2010 Annual Report. |
| D.2.2 | The Board will shortly be amending the terms of reference of the LVSC Announcements Committee to require the committee to report back to the Board on their decisions or recommendations. We look forward to providing an update on this matter in our 2010 Annual Report. |
As reported on page 82 of our 2009 Annual Report, the Company has devised its own securities trading code for securities transactions (the “Company Code”) by the Directors and relevant employees who are likely to be in possession of unpublished price-sensitive information of the Company on terms no less exacting than the Model Code for Securities Transactions by Directors of Listed Issuers as set out in Appendix 10 of the Listing Rules (the “Model Code”). Following specific enquiry by the Company, all Directors save for Mr. Steven Craig Jacobs who was removed as Executive Director on July 23, 2010 and cannot be reached to obtain his confirmation up to the date of this report, have confirmed that they have complied with the required standard set out in the Company Code during the six months ended June 30, 2010.
Board and Board Committees Composition
During the first half of 2010, there were two changes to the composition of the Board:
| • | Mr. Stephen John Weaver, an Executive Director and the Company’s Chief Development Officer, retired at the Annual General Meeting of the Company on June 19, 2010 and did not offer himself for re-election. |
| • | Mr. Toh Hup Hock, the Company’s Executive Vice President and Chief Financial Officer, was appointed an Executive Director with effect from June 30, 2010. As an Executive Director, Mr. Toh does not receive any emoluments for his position on the Board and his appointment is not governed by a service contract. Mr. Toh will serve as an Executive Director of the Company without any specific term, however he is subject to retirement by rotation and re-election in accordance with the articles of association of the Company. |
15
| Sands China Ltd. |
|
Corporate Governance
As at June 30, 2010, the composition of the Board was as follows:
Non-executive Directors |
Sheldon Gary Adelson |
Jeffrey Howard Schwartz |
Irwin Abe Siegel |
Independent Non-executive Directors |
Iain Ferguson Bruce |
Chiang Yun |
David Muir Turnbull |
Executive Directors |
Steven Craig Jacobs |
Toh Hup Hock |
The composition of the Board Committees as at June 30, 2010 was as follows:
Audit Committee |
Iain Ferguson Bruce (Chairman) |
Irwin Abe Siegel |
Chiang Yun |
Remuneration Committee |
David Muir Turnbull (Chairman) |
Iain Ferguson Bruce |
Jeffrey Howard Schwartz |
LVSC Announcements Committee |
Steven Craig Jacobs (Chairman) |
Iain Ferguson Bruce |
David Muir Turnbull |
Since June 30, 2010, there have been additional changes to the Board. In order to provide our Shareholders with the most up to date information on the Company, the most recent changes to the Board of the Company are detailed below:
| • | On July 23, 2010, Mr. Steven Craig Jacobs, the Company’s Chief Executive Officer, President and Executive Director, was removed from office by the Board. |
| • | On July 27, 2010, Mr. Michael Alan Leven, the Company’s Special Advisor to the Board and our Acting Chief Executive Officer, was appointed an Executive Director. His position as a Special Adviser to the Board was simultaneously dissolved on that date. As an Executive Director, Mr. Leven does not receive any emoluments for his position on the Board and his appointment is not governed by a service contract. Mr. Leven will serve for an initial period of 3 years and is subject to retirement by rotation and re-election in accordance with the articles of association of the Company. |
As at the date of this 2010 Interim Report, the composition of the Board was as follows:
Non-executive Directors |
Sheldon Gary Adelson |
Jeffrey Howard Schwartz |
Irwin Abe Siegel |
Independent Non-executive Directors |
Iain Ferguson Bruce |
Chiang Yun |
David Muir Turnbull |
Executive Directors |
Michael Alan Leven |
Toh Hup Hock |
In addition, two new committees of the Board were formed on July 27, 2010 — the CEO Search Committee and the Transitional Advisory Committee. We look forward to providing additional information and reporting on the work of these two committees in our 2010 Annual Report.
On August 26, 2010 Ms. Anne Maree Salt replaced Mr. Luis Nuno Mesquita de Melo as Joint Company Secretary.
16
| Interim Report 2010 |
|
Corporate Governance
Director Remuneration
On April 14, 2010, on the recommendation of the Remuneration Committee, the Board resolved to increase the fees paid to Non-executive Directors for their participation on the Board on the basis that, in their view,
the considerable responsibilities of the Non-executive Directors were not adequately compensated under the remuneration terms then in existence. The revised fees paid to Non-executive Directors as of April 14, 2010 are set out below:
Position | Annual Fee | |||
Independent Non-executive Director or Non-executive Director | US$ | 75,000.00 | ||
Chairman of Audit Committee, being also an Independent Non-executive Director | US$ | 25,000.00 | ||
Chairman of Remuneration Committee, whether an Independent Non-executive Director or | US$ | 25,000.00 | ||
Internal Controls
During the six months ended June 30, 2010, the Audit Committee met twice to consider the effectiveness and adequacy of the Company’s internal control system. On both occasions, the Audit Committee received a report from the Company’s Internal Audit Department and no significant areas of concern that might affect Shareholders were noted. Details of the standards, processes and effectiveness of the Company’s internal control system can be found on pages 84 to 85 of the 2009 Annual Report.
Audit Committee Review
The Audit Committee has reviewed the accounting policies adopted by the Group and the unaudited condensed consolidated interim financial information for the six months ended June 30, 2010. All of the Audit Committee members are Non-executive Directors, with the Chairman and one other member possessing the appropriate professional qualifications or accounting or related financial management experience. None of the members of the Audit Committee is a former partner of the Company’s existing external auditor.
Re-appointment of PricewaterhouseCoopers
At the Company’s Annual General Meeting held on June 19, 2010, Shareholders approved the re-appointment of PricewaterhouseCoopers as the Company’s external auditors for the financial year ending December 31, 2010.
Loan Agreement Disclosure
On May 17, 2010, VOL, a wholly-owned subsidiary of the Company, as borrower, entered into a credit agreement pursuant to which a syndicate of banks and financial institutions agreed to grant certain term loan facilities and revolving loan facilities amounting to US$1.75 billion (the “Credit Facility”). The facilities will be used to pay for project costs and as working capital and for general corporate purposes associated with the construction of the Company’s integrated resort being developed by VOL opposite The Venetian Macao and The Plaza Macao on Parcels 5 and 6. The maturity date of all the loans will be the earlier of June 16, 2015 and the fifth anniversary of the initial borrowing date.
The Credit Agreement imposes a specific performance obligation on our controlling Shareholder, LVS. Under the Credit Agreement, it would constitute an event of default if there is any sale, pledge or other transfer of
17
| Sands China Ltd. |
|
Corporate Governance
securities whereby LVS and/or its affiliates cease to own, directly or indirectly, in the aggregate at least 35% of the voting securities of the Company (a “Change of Control”).
Upon the occurrence of an event of default, including a Change of Control, that is continuing, the Administrative Agent may, or at the request of the lenders holding more than 50% of the sum of the aggregate principal amount of all loans outstanding under the Credit Agreement and any available undrawn commitments of all lenders thereunder, by written notice to VOL declare that all or any portion of (a) the aggregate principal amount of all outstanding loans and accrued but unpaid interest on the loans; (b) an amount equal to the maximum amount that may at any time be drawn under any letters of credit then outstanding; and (c) all other
obligations, in each case, outstanding under the Credit Agreement be immediately due and payable. In addition, upon the occurrence and continuation of an event of default, the obligation of each lender to make any loan or issue any letters of credit shall terminate.
Disclosure of Interests
Interests of Directors and Chief Executives
The interests/short positions of each of the Directors and Chief Executives in the shares, underlying shares and debentures of the Company and any of the Company’s associated corporations (within the meaning of Part XV of the SFO) as at June 30, 2010, as recorded in the register required to be kept under Section 352 of Part XV of the SFO, are set out in the table and explanatory notes below:
Name of Director | Company | Nature of Interest | Number of ordinary shares | Approximate percentage of shareholding interest | ||||
Sheldon Gary Adelson | Company | Interest in a controlled corporation | 5,657,814,855(L) | 70.3% | ||||
Steven Craig Jacobs | Company | Beneficial Owner | 2,500,000(L)(6) | 0.03% | ||||
Toh Hup Hock | Company | Beneficial Owner | 1,078,000(L)(7) | 0.01% | ||||
Name of Director | Associated Corporation | Nature of Interest | Number of Securities | Approximate percentage of shareholding interest | ||||
Sheldon Gary Adelson | LVS | Beneficial Owner | 218,544,122(L)(1) | 33.08% | ||||
| LVS | Family Interest | 213,345,002(L)(2) | 32.29% | |||||
| 5,250,000(L)(3) | 56.21% | |||||||
Jeffrey Howard Schwartz | LVS | Beneficial owner | 114,917(L)(4) | 0.02% | ||||
Irwin Abe Siegel | LVS | Beneficial owner | 51,870(L)(5) | 0.01% | ||||
Steven Craig Jacobs | LVS | Beneficial owner | 658,530(L)(6) | 0.10% | ||||
Toh Hup Hock | LVS | Beneficial owner | 69,000(L)(7) | 0.01% | ||||
The letter “L” denotes the person’s long position in such securities.
| (1) | This amount includes (a) 100 shares of LVS’s common stock, (b) 5,948 shares of restricted stock of which 1,983 shares are vested, (c) 255,362 vested and exercisable options to purchase 255,362 shares of LVS’s common stock, (d) 5,623,125 shares of LVS’s common stock held by the Sheldon G. Adelson 2005 Family |
Trust over which Mr. Adelson, as trustee, retains sole dispositive and voting control, (e) 382,280 shares of LVS’s common stock owned by the Dr. Miriam and Sheldon G. Adelson Charitable Trust over which Mr. Adelson, as trustee, retains sole voting and dispositive power, (f) 15,246,471 shares of LVS’s common stock owned by the Sheldon G. Adelson November 2008 Two Year LVS Annuity Trust over which Mr. Adelson, as trustee, retains sole dispositive control, (g) 44,922,412 shares of LVS’s common stock |
18
| Interim Report 2010 |
|
Corporate Governance
owned by the Sheldon G. Adelson December 2008 Three Year LVS Annuity Trust over which Mr. Adelson, as trustee, retains sole dispositive control, (h) 11,471,421 shares of LVS’s common stock owned by the Sheldon G. Adelson February 2009 Two Year LVS Annuity Trust over which Mr. Adelson, as trustee, retains sole dispositive control, (i) 23,336,445 shares of LVS’s common stock owned by the Sheldon G. Adelson February 2009 Three Year LVS Annuity Trust over which Mr. Adelson, as trustee, retains sole dispositive control, (j) 28,546,985 shares of LVS’s common stock owned by the Sheldon G. Adelson October 2009 Two Year LVS Annuity Trust over which Mr. Adelson, as trustee, retains sole dispositive control, (k) 29,105,939 shares of LVS’s common stock held by the Sheldon G. Adelson October 2009 Three Year LVS Annuity Trust over which Mr. Adelson, as trustee, retains sole dispositive control, (l) 32,000,000 shares of LVS’s common stock held by the Sheldon G. Adelson June 28, 2010 Two Year LVS Annuity Trust over which Mr. Adelson, as trustee, retains sole dispositive control, (m) 27,005,967 shares of LVS’s common stock held by the Sheldon G. Adelson June 29, 2010 Two Year LVS Annuity Trust over which Mr. Adelson, as trustee, retains sole dispositive control, and (n) 641,667 unvested options to purchase 641,667 shares of LVS’s common stock. Mr. Adelson and his wife together are entitled to control the exercise of one-third or more of the voting power at stockholders’ meetings of LVS. LVS’s interests in our Company are set out below. |
| (2) | This amount includes (a) 53,363,636 shares of LVS’s common stock held by Dr. Miriam Adelson, (b) 13,692,516 shares of LVS’s common stock held by the ESBT S Trust over which Dr. Adelson, as trustee, retains sole voting control, (c) 13,692,516 shares of LVS’s common stock held by the ESBT Y Trust over which Dr. Adelson, as trustee, retains sole voting control, (d) 13,692,517 shares of LVS’s common stock held by the QSST A Trust over which Dr. Adelson, as trustee, retains sole voting control, (e) 13,692,517 shares of LVS’s common stock held by the QSST M Trust over which Dr. Adelson, as trustee, retains sole voting control, (f) 5,144,415 shares of LVS’s common stock held by the Sheldon G. Adelson 2004 Remainder Trust over which Dr. Adelson, as trustee, retains sole voting control, (g) 12,566,710 shares of LVS’s common stock owned by Adfam Investment Company LLC over which Dr. Adelson, as co-manager, shares voting and dispositive control with Mr. Adelson and (h) warrants to purchase 87,500,175 shares of LVS’s common stock that are exercisable. |
| (3) | Dr. Adelson holds 5,250,000 shares of preferred stock. |
| (4) | This amount includes (a) 7,273 shares of restricted stock of which 5,268 shares are vested and (b) 107,644 options to purchase 107,644 shares of LVS’s common stock of which 16,528 options are vested and exercisable. |
| (5) | This amount includes (a) 1,000 shares of LVS’s common stock, (b) 10,770 shares of restricted stock of which 8,765 shares are vested and (c) 40,100 options to purchase 40,100 shares of LVS’s common stock, of which 9,100 options are vested and exercisable. |
| (6) | This amount includes (a) 2,500,000 unvested options to purchase 2,500,000 shares of the Company, (b) 352,280 shares of LVS’s common stock and (c) 306,250 unvested options to purchase 306,250 shares of LVS’s common stock. |
| (7) | This amount includes (a) 78,000 shares of the Company, (b) 1,000,000 unvested options to purchase 1,000,000 shares of the Company, (c) 9,000 shares of LVS’s common stock and (d) 60,000 options to purchase 60,000 shares of LVS’s common stock, of which 22,500 options are vested and exercisable. |
None of the Directors or the Chief Executive had short positions in respect of shares, underlying shares and debentures of the Company and its associated corporations (within the meaning of Part XV of the SFO) as at June 30, 2010.
Save as disclosed above, so far as was known to any Director, as at June 30, 2010, none of the Directors or the Chief Executive of the Company had, pursuant to Divisions 7 and 8 of Part XV of the SFO, nor were they taken or deemed to have under such provisions of the SFO, any interest or short position in any shares or underlying shares or interest in debentures of the Company or any of its associated corporations (within the meaning of Part XV of the SFO) that were required to be notified to the Company and the Stock Exchange, or any interests which were required, pursuant to Section 352 of the SFO, to be entered into the register referred to therein, or any interests which were required, pursuant to the Model Code, to be notified to the Company and the Stock Exchange.
As at June 30, 2010, saved as disclosed above, none of the Directors nor the Chief Executive of the Company (including their spouses and children under 18 years of age) had any interest in, or had been granted, or exercised, any rights to subscribe for Shares (or warrants or debentures, if applicable) of the Company and its associated corporations within the meaning of the SFO.
19
| Sands China Ltd. |
|
Corporate Governance
Interests of Substantial Shareholders
The interests/short positions of substantial Shareholders in the shares and underlying shares of the Company as at June 30, 2010, as recorded in the register required to be kept under Section 336 of Part XV of the SFO, are set out in the table and explanatory notes below:
The Company had been notified of the following substantial Shareholders’ interests in the shares as at June 30, 2010:
Name of Substantial Shareholder | Capacity/Nature of interest | Number of shares interested | % of issued share capital | |||
Sheldon Gary Adelson | Interest in a controlled corporation | 5,657,814,885 | 70.30(L) | |||
Las Vegas Sands Corp. | Interest in a controlled corporation | 5,657,814,885 | 70.30(L) | |||
Las Vegas Sands, LLC | Interest in a controlled corporation | 5,657,814,885 | 70.30(L) | |||
Venetian Casino Resort, LLC | Interest in a controlled corporation | 5,657,814,885 | 70.30(L) | |||
LVS (Nevada) International Holdings, Inc. | Interest in a controlled corporation | 5,657,814,885 | 70.30(L) | |||
LVS Dutch Finance CV | Interest in a controlled corporation | 5,657,814,885 | 70.30(L) | |||
LVS Dutch Holding BV | Interest in a controlled corporation | 5,657,814,885 | 70.30(L) | |||
LVS Dutch Intermediate Holding BV | Interest in a controlled corporation | 5,657,814,885 | 70.30(L) | |||
Venetian Venture Development Intermediate I | Interest in a controlled corporation | 5,657,814,885 | 70.30(L) | |||
Venetian Venture Development Intermediate II | Beneficial owner | 5,657,814,885 | 70.30(L) | |||
As at June 30, 2010, the Company had not been notified of any short positions being held by any substantial shareholder in the shares or underlying shares of the Company.
Interests of Any Other Persons
Save as disclosed above, as at June 30, 2010, the Company had not been notified of any persons who had interests or short positions in the shares or underlying shares of the Company, as recorded in the register required to be kept under Section 336 of Part XV of the SFO.
Share Option Scheme
On November 8, 2009, our Company adopted the Share Option Scheme for the purpose of attracting able persons to enter and remain in the employment of our Group. The Share Option Scheme also provides a means whereby employees, directors and consultants of our Group can
acquire and maintain share ownership, thereby strengthening their commitment to the welfare of our Group and promoting an identity of interest between Shareholders and these persons. For more information on the Share Option Scheme, please refer to pages 100 and 101 of our 2009 Annual Report or pages VII-22 to VII-33 of our Prospectus.
During the Reporting Period, the Company granted 20,376,100 options under the Share Option Scheme on March 31, 2010 and May 11, 2010 to a director and various members of the senior management of the Group. As at June 30, 2010, 566,700 options had lapsed in accordance with the terms of the Share Option Scheme due to resignations or terminations.
20
| Interim Report 2010 |
|
Corporate Governance
Details of the grant of share options and a summary of movements of the outstanding share options during the period under the Share Option Scheme were as follows:
| Number of options | ||||||||||||||||||
| Date of grant | Outstanding as at January 1, 2010 | Granted during Reporting Period | Exercised during Reporting Period | Lapsed during Reporting Period | Cancelled during Reporting Period | Outstanding as at June 30, 2010 | Validity period | Vesting Period | Subscription price per share | |||||||||
March 31, 2010 | — | 17,876,100 | — | 566,700 | — | 17,309,400 | Ten (10) years | 25% will vest on each of | HK$12.40 | |||||||||
May 11, 2010 | — | 2,500,000 | — | — | — | 2,500,000 | Ten (10) years | 50% will vest on each of January 1, 2011 and January 1, 2012 | HK$11.83 | |||||||||
Total: | — | 20,376,100 | — | 566,700 | — | 19,809,400 | ||||||||||||
21
| Sands China Ltd. |
|
Corporate Governance
The closing prices of the Shares immediately before the grant of options on March 31, 2010 and May 11, 2010 were HK$12.10 and HK$11.28 respectively.
Among the options granted above, a total of 2,500,000 options were granted to Mr. Steven Craig Jacobs, an Executive Director, on May 11, 2010. It should be noted that as at the Latest Practicable Date, these options had lapsed due to Mr. Jacobs’ termination.
Save as disclosed herein, no options were granted under the Share Option Scheme or any share option scheme of the Group as at June 30, 2010.
The Company estimates the fair value of options granted using the Black-Scholes option-pricing model. The weighted average fair value of options granted during the Reporting Period, measured as at the date of grant, was approximately US$1.03.
Significant estimates and assumptions are required to be made in determining the parameters for applying the Black-Scholes option-pricing model, including estimates and assumptions regarding the risk-free rate of return, expected dividend yield and volatility of the underlying shares and
the expected life of the options. These estimates and assumptions could have a material effect on the determination of the fair value of the share options and the amount of such equity awards expected to vest, which may in turn significantly impact the determination of the share- based compensation expense. The following assumptions were used to derive the fair values:
Weighted average volatility | 73.6% | |
Expected term (in years) | 6.2 | |
Risk-free rate | 2.0% | |
Expected dividends | — |
Purchase, Sale or Redemption of the Company’s Listed Shares
There was no purchase, sale or redemption of the Company’s listed shares by the Company or any of its subsidiaries during the six months ended June 30, 2010.
By order of the Board of Directors
Sands China Ltd.
Sheldon Gary Adelson
Chairman of the Board
Macao, August 26, 2010
22
| Interim Report 2010 |
|
Report on Review of Condensed Consolidated Interim Financial Information

To the Board of Directors of Sands China Ltd.
(incorporated in the Cayman Islands with limited liability)
Introduction
We have reviewed the condensed consolidated interim financial information set out on pages 25 to 53, which comprises the consolidated balance sheet of Sands China Ltd. (the “Company”) and its subsidiaries (together, the “Group”) as at June 30, 2010 and the related consolidated income statement, the consolidated statement of comprehensive income, the consolidated statement of changes in equity and the condensed consolidated statement of cash flows for the six-month period then ended, and a summary of significant accounting policies and other explanatory notes. The Rules Governing the Listing of Securities on The Stock Exchange of Hong Kong Limited require the preparation of a report on interim financial information to be in compliance with the relevant provisions thereof and International Accounting Standard 34 “Interim Financial Reporting”. The directors of the Company are responsible for the preparation and presentation of this condensed consolidated interim financial information in accordance with International Accounting Standard 34 “Interim Financial Reporting”. Our responsibility is to express a conclusion on this condensed consolidated interim financial information based on our review and to report our conclusion solely to you, as a body, in accordance with our agreed terms of engagement and for no other purpose. We do not assume responsibility towards or accept liability to any other person for the contents of this report.
Scope of review
We conducted our review in accordance with International Standard on Review Engagements 2410, “Review of Interim Financial Information Performed by the Independent Auditor of the Entity”. A review of interim financial information consists of making inquiries, primarily of persons responsible for financial and accounting matters, and applying analytical and other review procedures. A review is substantially less in scope than an audit conducted in accordance with International Standards on Auditing and consequently does not enable us to obtain assurance that we would become aware of all significant matters that might be identified in an audit. Accordingly, we do not express an audit opinion.
23
| Sands China Ltd. |
|
Report on Review of Condensed Consolidated Interim Financial Information
Conclusion
Based on our review, nothing has come to our attention that causes us to believe that the condensed consolidated interim financial information is not prepared, in all material respects, in accordance with International Accounting Standard 34 “Interim Financial Reporting”.
PricewaterhouseCoopers
Certified Public Accountants
Hong Kong, August 26, 2010
24
| Interim Report 2010 |
|
Consolidated Balance Sheet
| As at June 30, 2010 | | As at December 31, 2009 | | |||||||
| US$’000 | ||||||||||
| Note | (Unaudited | ) | (Audited, as restated) |
| ||||||
ASSETS | ||||||||||
Non-current assets | ||||||||||
Investment properties, net | 764,626 | 748,743 | ||||||||
Property and equipment, net | 5 | 5,414,194 | 5,525,057 | |||||||
Intangible assets, net | 38,050 | 41,005 | ||||||||
Deferred income tax assets | 96 | 113 | ||||||||
Financial assets at fair value through profit or loss | 114 | 1,529 | ||||||||
Other assets, net | 41,360 | 48,794 | ||||||||
Trade and other receivables and prepayments, net | 28,946 | 31,955 | ||||||||
Total non-current assets | 6,287,386 | 6,397,196 | ||||||||
Current assets | ||||||||||
Inventories | 8,307 | 9,630 | ||||||||
Trade and other receivables and prepayments, net | 6 | 282,803 | 295,400 | |||||||
Investments | 7 | 173,461 | — | |||||||
Restricted cash | 25,041 | 17,172 | ||||||||
Cash and cash equivalents | 673,763 | 908,334 | ||||||||
Total current assets | 1,163,375 | 1,230,536 | ||||||||
Total assets | 7,450,761 | 7,627,732 | ||||||||
The notes on pages 31 to 53 form an integral part of this condensed consolidated interim financial information.
25
| Sands China Ltd. |
|
Consolidated Balance Sheet
| As at June 30, 2010 | | As at December 31, 2009 | | |||||||
| US$’000 | ||||||||||
| Note | (Unaudited | ) | (Audited, as restated) | | ||||||
EQUITY | ||||||||||
Capital and reserves attributable to equity holders | ||||||||||
Share capital | 8 | 80,479 | 80,479 | |||||||
Reserves | 3,863,381 | 3,618,415 | ||||||||
Total equity | 3,943,860 | 3,698,894 | ||||||||
LIABILITIES | ||||||||||
Non-current liabilities | ||||||||||
Trade and other payables | 14,794 | 12,570 | ||||||||
Borrowings | 9 | 2,324,213 | 2,950,849 | |||||||
Total non-current liabilities | 2,339,007 | 2,963,419 | ||||||||
Current liabilities | ||||||||||
Trade and other payables | 10 | 860,990 | 828,791 | |||||||
Current income tax liabilities | 242 | 172 | ||||||||
Borrowings | 9 | 306,662 | 136,456 | |||||||
Total current liabilities | 1,167,894 | 965,419 | ||||||||
Total liabilities | 3,506,901 | 3,928,838 | ||||||||
Total equity and liabilities | 7,450,761 | 7,627,732 | ||||||||
Net current (liabilities)/assets | (4,519 | ) | 265,117 | |||||||
Total assets less current liabilities | 6,282,867 | 6,662,313 | ||||||||
Approved by the Board of Directors on August 26, 2010 and signed on behalf of the Board by
Michael Alan Leven | Toh Hup Hock | |
Director | Director |
The notes on pages 31 to 53 form an integral part of this condensed consolidated interim financial information.
26
| Interim Report 2010 |
|
Consolidated Income Statement
| Six months ended June 30, | ||||||||||
| 2010 | 2009 | |||||||||
| US$’000, except per share data | ||||||||||
| Note | (Unaudited | ) | (Audited, as restated) |
| ||||||
Net revenues | 11 | 1,980,499 | 1,500,587 | |||||||
Gaming tax | (872,525 | ) | (633,417 | ) | ||||||
Inventories consumed | (20,507 | ) | (20,408 | ) | ||||||
Employee benefit expenses | (223,039 | ) | (232,856 | ) | ||||||
Depreciation and amortization | (163,339 | ) | (162,362 | ) | ||||||
Gaming promoter/agency commissions | (109,177 | ) | (86,827 | ) | ||||||
Other expenses | (270,984 | ) | (252,459 | ) | ||||||
Operating profit | 320,928 | 112,258 | ||||||||
Interest income | 1,175 | 281 | ||||||||
Interest expense, net of amounts capitalized | (71,450 | ) | (54,026 | ) | ||||||
Profit before income tax | 250,653 | 58,513 | ||||||||
Income tax expense | 12 | (153 | ) | (167 | ) | |||||
Profit for the period and attributable to | 250,500 | 58,346 | ||||||||
Dividends | 13 | — | — | |||||||
Earnings per share for profit attributable to | ||||||||||
Basic and diluted | 14 | US3.11 cents | US0.93 cents | |||||||
The notes on pages 31 to 53 form an integral part of this condensed consolidated interim financial information.
27
| Sands China Ltd. |
|
Consolidated Statement of Comprehensive Income
| Six months ended June 30, | ||||||
| 2010 | 2009 | |||||
| US$’000 | ||||||
| (Unaudited | ) | (Audited, as restated) | | |||
Profit for the period attributable to equity holders of the Company | 250,500 | 58,346 | ||||
Other comprehensive (loss)/income, net of tax: | ||||||
Currency translation differences | (13,969 | ) | 182 | |||
Total comprehensive income for the period attributable to | 236,531 | 58,528 | ||||
The notes on pages 31 to 53 form an integral part of this condensed consolidated interim financial information.
28
| Interim Report 2010 |
|
Consolidated Statement of Changes in Equity
| Share-based | Currency | ||||||||||||||||||
| Capital | Share | Statutory | compensation | translation | Retained | ||||||||||||||
| Share capital | reserve | premium | reserve | reserve | reserve | earnings | Total | ||||||||||||
| US$’000
(Audited, as restated) |
| ||||||||||||||||||
For the six months ended June 30, 2009 | |||||||||||||||||||
Balance at December 31, 2008, | — | 80,049 | — | 6,222 | 17,538 | 5,632 | 1,140,093 | 1,249,534 | |||||||||||
Effect on adoption of IAS17 Amendment | — | — | — | — | — | — | 12,322 | 12,322 | |||||||||||
Balance at December 31, 2008, as restated | — | 80,049 | — | 6,222 | 17,538 | 5,632 | 1,152,415 | 1,261,856 | |||||||||||
Total comprehensive income | — | — | — | — | — | 182 | 58,346 | 58,528 | |||||||||||
Share-based compensation charged by LVS | — | — | — | — | 3,849 | — | — | 3,849 | |||||||||||
Transfer to statutory reserve | — | — | — | 93 | — | — | (93 | ) | — | ||||||||||
Balance at June 30, 2009 | — | 80,049 | — | 6,315 | 21,387 | 5,814 | 1,210,668 | 1,324,233 | |||||||||||
| (Unaudited) | |||||||||||||||||||
For the six months ended June 30, 2010 | |||||||||||||||||||
Balance at December 31, 2009, | 80,479 | 87,435 | 2,127,537 | 6,315 | 26,051 | 3,739 | 1,353,836 | 3,685,392 | |||||||||||
Effect on adoption of IAS17 Amendment | — | — | — | — | — | — | 13,502 | 13,502 | |||||||||||
Balance at December 31, 2009, as restated | 80,479 | 87,435 | 2,127,537 | 6,315 | 26,051 | 3,739 | 1,367,338 | 3,698,894 | |||||||||||
Total comprehensive income | — | — | — | — | — | (13,969 | ) | 250,500 | 236,531 | ||||||||||
Share-based compensation of the Company | — | — | — | — | 2,374 | — | — | 2,374 | |||||||||||
Share-based compensation charged by LVS | — | — | — | — | 6,061 | — | — | 6,061 | |||||||||||
Balance at June 30, 2010 | 80,479 | 87,435 | 2,127,537 | 6,315 | 34,486 | (10,230 | ) | 1,617,838 | 3,943,860 | ||||||||||
The notes on pages 31 to 53 form an integral part of this condensed consolidated interim financial information.
29
| Sands China Ltd. |
|
Condensed Consolidated Statement of Cash Flows
| Six months ended June 30, | ||||||
| 2010 | 2009 | |||||
| US$’000 | ||||||
| (Unaudited | ) | (Audited, as restated) | | |||
Net cash generated from operating activities | 584,949 | 298,828 | ||||
Net cash used in investing activities | (288,270 | ) | (244,495 | ) | ||
Net cash used in financing activities | (528,641 | ) | (131,160 | ) | ||
Net decrease in cash and cash equivalents | (231,962 | ) | (76,827 | ) | ||
Cash and cash equivalents at beginning of the period | 908,334 | 417,769 | ||||
Effect of exchange rate on cash and cash equivalents | (2,609 | ) | (322 | ) | ||
Cash and cash equivalents at end of the period | 673,763 | 340,620 | ||||
The notes on pages 31 to 53 form an integral part of this condensed consolidated interim financial information.
30
| Interim Report 2010 |
|
Notes to the Condensed Consolidated Interim Financial Information
| 1. | General information |
Principal activities
Sands China Ltd. (the “Company”) and its subsidiaries (collectively the “Group”) is principally engaged in the development and operation of integrated resorts and other ancillary services (the “Gaming and Other Related Operations”) in the Macao Special Administrative Region of the People’s Republic of China (“Macao”).
The Company was incorporated in the Cayman Islands on July 15, 2009 as an exempted company with limited liability under the Companies Law, Cap 22 (Law 3 of 1961, as consolidated and revised) of the Cayman Islands. The address of the Company’s registered office is Walkers Corporate Services Limited, Walker House, 87 Mary Street, George Town, Grand Cayman KY1-9005, Cayman Islands. The Company’s principal place of business in Hong Kong registered under Part XI of the Hong Kong Companies Ordinance at Level 28, Three Pacific Place, 1 Queen’s Road East, Hong Kong.
The Group owns and operates the Sands Macao, the first Las Vegas-style casino in Macao, pursuant to a 20-year gaming subconcession.
The Group also owns and operates The Venetian Macao Resort Hotel (“The Venetian Macao”), which anchors the Cotai Strip, the Group’s master-planned development of integrated resort properties in Macao.
In August 2008, the Group opened the Four Seasons Hotel, the Plaza Casino, the Shoppes at Four Seasons (together with the Paiza Mansions opened in July 2009 and the apart-hotel tower, referred to as “The Plaza Macao”). The Plaza Macao is located adjacent to The Venetian Macao.
The Group’s other ancillary services include ferry operations and other related operations.
The Company’s shares were listed on the Main Board of the Stock Exchange on November 30, 2009.
The unaudited condensed consolidated interim financial information (the “Interim Financial Information”) is presented in United States dollars (“US$”), unless otherwise stated. The Interim Financial Information was approved and authorized for issue by the Board of Directors of the Company on August 26, 2010.
This Interim Financial Information has not been audited.
| 2. | Basis of preparation |
The Interim Financial Information for the six months ended June 30, 2010 has been prepared in accordance with the International Accounting Standard (“IAS”) 34 ‘Interim Financial Reporting’ issued by the International Accounting Standard Board (“IASB”) and the applicable disclosure requirements of Appendix 16 to the Listing Rules. It should be read in conjunction with the Group’s annual financial statements for the year ended December 31, 2009, which were prepared in accordance with International Financial Reporting Standards (“IFRS”).
31
| Sands China Ltd. |
|
Notes to the Condensed Consolidated Interim Financial Information
| 3. | Changes in accounting policies and disclosures |
The accounting policies adopted in the preparation of the Interim Financial Information for the six months ended June 30, 2010 are consistent with those adopted and as described in the Group’s annual financial statements for the year ended December 31, 2009, except for the adoption of new standards and interpretations as of January 1, 2010, noted below which are relevant to the Group.
IAS 17 (amendment), ‘Leases’ (effective from January 1, 2010). The amendment is part of the IASB’s annual improvements project published in April 2009 and the Group has applied IAS 17 (amendment) from January 1, 2010. The adoption of IAS 17 (amendment) resulted in retrospective adjustments of leasehold interests in land from operating lease to finance lease, and finance lease liabilities on leasehold interests in land, and the consequential adjustments on investment properties, property and equipment, operating lease amortization, finance lease depreciation, interest expense and related interest capitalization. The effect of the adoption is set out in Note 18 to the Group’s Interim Financial Information.
International Financial Reporting Interpretations Committee (“IFRIC”) 17 ‘Distribution of non-cash assets to owners’ (effective on or after July 1, 2009), provides guidance on accounting for arrangements whereby an entity distributes non- cash assets to shareholders either as a distribution of reserves or as dividends. IFRS 5 has also been amended to require that assets are classified as held for distribution only when they are available for distribution in their present condition and the distribution is highly probable. The adoption of IFRIC 17 has no material impact on the Group’s Interim Financial Information.
IAS 27 (revised), ‘Consolidated and separate financial statements’, (effective from July 1, 2009). The revised standard requires the effects of all transactions with minority interest to be recorded in equity if there is no change in control and these transactions will no longer result in goodwill or gains and losses. The standard also specifies the accounting when control is lost. Any remaining interest in the entity is re-measured to fair value, and a gain or loss is recognized in the consolidated income statement. The Group adopted IAS 27 (revised) prospectively to transactions with minority interest from January 1, 2010 and the adoption of IAS 27 (revised) has no material impact on the Group’s Interim Financial Information.
IFRS 3 (revised), ‘Business combinations’ (effective from July 1, 2009). The revised standard continues to apply the acquisition method to business combinations, with some significant changes. For example, all payments to purchase a business are to be recorded at fair value at the acquisition date, with contingent payments classified as debt subsequently re-measured through the consolidated income statement. There is a choice on an acquisition-by-acquisition basis to measure the non-controlling interest in the acquiree either at fair vale or at the non-controlling interest’s proportionate share of the acquiree’s net assets. All acquisition-related costs should be expensed. The Group adopted IFRS 3 (revised) prospectively to all business combinations from January 1, 2010 and the adoption of IFRS 3 (revised) has no material impact on the Group’s Interim Financial Information.
IAS 38 (amendment), ‘Intangible Assets’ (effective from July 1, 2009), clarifies guidance in measuring the fair value of an intangible asset acquired in a business combination and it permits the grouping of intangible assets as a single asset if each asset has similar useful economic lives. The amendment has no material impact on the Group’s Interim Financial Information.
32
| Interim Report 2010 |
|
Notes to the Condensed Consolidated Interim Financial Information
| 3. | Changes in accounting policies and disclosures (continued) |
IFRS 5 (amendment), ‘Measurement of non-current assets (or disposal groups) classified as held for sale’, provides clarification that IFRS 5 specifies the disclosures required in respect of non-current assets (or disposal groups) classified as held for sale or discontinued operations. It also clarifies that the general requirements of IAS 1 still apply, particularly paragraph 15 (to achieve a fair presentation) and paragraph 125 (sources of estimation uncertainty) of IAS 1. The Group adopted IFRS 5 (amendment) from January 1, 2010 and the amendment has no material impact on the Group’s Interim Financial Information.
IAS 1 (amendment), ‘Presentation of financial statements’, provides clarification that the potential settlement of a liability by the issue of equity is not relevant to its classification as current or non-current. By amending the definition of current liability, the amendment permits a liability to be classified as non-current (provided that the entity has an unconditional right to defer settlement by transfer of cash or other assets for at least 12 months after the accounting period) notwithstanding the fact that the entity could be required by the counterparty to settle in shares at any time. The Group adopted IAS 1 (amendment) from January 1, 2010 and the amendment has no material impact on the Group’s Interim Financial Information.
IFRS 2 (amendments), ‘Group cash-settled share-based payment transactions’ (effective from January 1, 2010). In addition to incorporating IFRIC-Int 8, ‘Scope of IFRS 2’, and IFRIC-Int 11, ‘IFRS 2 — Group and treasury share transactions’, the amendments expand on the guidance in IFRIC 11 to address the classification of group arrangements that were not covered by the interpretation. The new guidance is not expected to have a material impact on the Group’s Interim Financial Information.
IFRS 8 (amendment) allows that total segment assets are to be disclosed only when such information is regularly provided to chief operating decision maker, like segment liabilities under the current IFRS 8.
The Group has not early adopted the following new or revised standards, amendments, improvements and interpretations that have been issued but are not yet effective for the period:
Revised standards, amendments and interpretations
Effective from | ||||
IAS 24 (Revised) | Related Party Disclosures | January 1, 2011 | ||
IAS 32 (Amendment) | Financial Instruments Disclosures — Classification of Rights Issues | February 1, 2010 | ||
IFRS 9 | Financial Instruments — Classification and Measurements | January 1, 2013 | ||
IFRIC–Int 14 (Amendment) | IAS 19 — The Limit on a Defined Benefit Asset, Minimum Funding Requirements and their Interactions | January 1, 2011 | ||
IFRIC–Int 19 | Extinguishing Financial Liabilities with Equity Instruments | July 1, 2010 | ||
33
| Sands China Ltd. |
|
Notes to the Condensed Consolidated Interim Financial Information
| 3. | Changes in accounting policies and disclosures (continued) |
Third annual improvements project (2010) published in May 2010 by the IASB
Effective from | ||||
IFRS 3 (Revised) | Business Combinations | July 1, 2010 | ||
IFRS 7 | Financial Instruments: Disclosures | January 1, 2011 | ||
IAS 1 | Presentation of Financial Statements | January 1, 2011 | ||
IAS 27 | Consolidated and Separate Financial Statements | January 1, 2011 | ||
IAS 34 | Interim Financial Reporting | January 1, 2011 | ||
IFRIC–Int 13 | Customer Loyalty Programmes | January 1, 2011 | ||
The Group will adopt the above new and revised standards, amendments, interpretations and improvements to existing standards as and when they become effective. The Group has already commenced the assessment of the impact to the Group and is not yet in a position to state whether these would have a significant impact on the results of operations and financial position of the Group.
| 4. | Segment information |
Management has determined the operating segments based on the reports reviewed by a group of senior management to make strategic decisions. The Group considers the business from a property and service perspective.
The Group’s principal operating and developmental activities occur in Macao, which is the sole geographic area that the Group domiciles. The Group reviews the results of operations for each of its key operating segments, which are also the reportable segments: Sands Macao, The Venetian Macao, The Plaza Macao, ferry and other operations and other developments (on Parcels 3, 5, 6, 7 and 8 of the Cotai Strip).
Sands Macao, The Venetian Macao, The Plaza Macao and other developments, once in operation will, derive their revenue primarily from casino, hotel, food and beverage, mall, convention, retail and other sources. Ferry and other operations mainly derive their revenue from the sale of ferry tickets for transportation between Hong Kong and Macao.
34
| Interim Report 2010 |
|
Notes to the Condensed Consolidated Interim Financial Information
| 4. | Segment information (continued) |
The Group’s segment information is as follows:
| Six months ended June 30, | ||||||
| 2010 | 2009 | |||||
| US$’000 | ||||||
| (Unaudited | ) | (Audited, Note 19 | ) | |||
Net revenues: | ||||||
The Venetian Macao | 1,128,446 | 931,754 | ||||
Sands Macao | 584,159 | 458,612 | ||||
The Plaza Macao | 246,226 | 95,691 | ||||
Ferry and other operations | 44,351 | 33,226 | ||||
Other developments | — | — | ||||
Inter-segment revenues | (22,683 | ) | (18,696 | ) | ||
| 1,980,499 | 1,500,587 | |||||
| Six months ended June 30, | ||||||
| 2010 | 2009 | |||||
| US$’000 | ||||||
| (Unaudited | ) | (Unaudited, Note 19 | ) | |||
Adjusted EBITDA (Note): | ||||||
The Venetian Macao | 362,624 | 229,189 | ||||
Sands Macao | 150,359 | 111,346 | ||||
The Plaza Macao | 52,434 | 9,326 | ||||
Ferry and other operations | (10,983 | ) | (12,208 | ) | ||
Other developments | — | — | ||||
| 554,434 | 337,653 | |||||
| Note: | Adjusted EBITDA is profit before interest, income taxes, depreciation and amortization (net of amortization of show production costs), pre-opening expense, net foreign exchange losses or gains, loss or gain on disposal of property and equipment, corporate expense, share-based compensation and fair value losses or gains on financial assets at fair value through profit or loss. Adjusted EBITDA is used by management as the primary measure of operating performance of the Group’s properties and to compare the operating performance of the Group’s properties with that of its competitors. However, adjusted EBITDA should not be considered in isolation; construed as an alternative to profit or operating profit; as an indicator of the Group’s IFRS operating performance, other combined operations or cash flow data; or as an alternative to cash flow as a measure of liquidity. As a result, adjusted EBITDA as presented by the Group may not be directly comparable to other similarly titled measures presented by other companies. |
35
| Sands China Ltd. |
|
Notes to the Condensed Consolidated Interim Financial Information
| 4. | Segment information (continued) |
| Six months ended June 30, | ||||||
| 2010 | 2009 | |||||
| US$’000 | ||||||
| (Unaudited | ) | (Audited, as restated | ) | |||
Depreciation and amortization: | ||||||
The Venetian Macao | 108,928 | 105,586 | ||||
Sands Macao | 21,470 | 25,287 | ||||
The Plaza Macao | 25,257 | 25,327 | ||||
Ferry and other operations | 7,596 | 6,020 | ||||
Other developments | 88 | 142 | ||||
| 163,339 | 162,362 | |||||
The following is a reconciliation of adjusted EBITDA to profit for the period attributable to equity holders of the Company:
| Six months ended June 30, | ||||||
| 2010 | 2009 | |||||
| US$’000 | ||||||
| (Unaudited) | ||||||
Adjusted EBITDA | 554,434 | 337,653 | ||||
Share-based compensation granted to employees by LVS and | (7,224 | ) | (3,457 | ) | ||
Corporate expense | (13,571 | ) | (4,692 | ) | ||
Pre-opening expense | (12,213 | ) | (51,956 | ) | ||
Depreciation and amortization | (163,339 | ) | (162,362 | ) | ||
Amortization of show production costs | 2,105 | 2,115 | ||||
Net foreign exchange losses | (8,414 | ) | (149 | ) | ||
Loss on disposal of property and equipment | (29,435 | ) | (4,894 | ) | ||
Fair value losses on financial assets at fair value through profit or loss | (1,415 | ) | — | |||
Operating profit | 320,928 | 112,258 | ||||
Interest income | 1,175 | 281 | ||||
Interest expense, net of amounts capitalized | (71,450 | ) | (54,026 | ) | ||
Profit before income tax | 250,653 | 58,513 | ||||
Income tax expense | (153 | ) | (167 | ) | ||
Profit for the period attributable to equity holders of the Company | 250,500 | 58,346 | ||||
36
| Interim Report 2010 |
|
Notes to the Condensed Consolidated Interim Financial Information
| 4. | Segment information (continued) |
| As at June 30, 2010 | | As at December 31, 2009 | | |||
| US$’000 | ||||||
| (Unaudited | ) | (Audited, as restated | ) | |||
Total assets | ||||||
The Venetian Macao | 2,816,945 | 2,873,777 | ||||
Sands Macao | 531,232 | 530,354 | ||||
The Plaza Macao | 1,185,073 | 1,181,847 | ||||
Ferry and other operations | 351,642 | 774,907 | ||||
Other developments | 2,565,869 | 2,266,847 | ||||
| 7,450,761 | 7,627,732 | |||||
During the six months ended June 30, 2010, US$391.6 million of cash and bank balances that the Company derived from the Global Offering was allocated from the ferry and other operations segment to the other developments segment.
| As at June 30, 2010 | | As at December 31, 2009 | | |||
| US$’000 | ||||||
| (Unaudited | ) | (Audited, as restated | ) | |||
Total non-current assets | ||||||
Held locally | 6,012,102 | 6,159,305 | ||||
Held in foreign countries | 275,074 | 236,249 | ||||
Deferred income tax assets | 96 | 113 | ||||
Financial assets at fair value through profit or loss | 114 | 1,529 | ||||
| 6,287,386 | 6,397,196 | |||||
37
| Sands China Ltd. |
|
Notes to the Condensed Consolidated Interim Financial Information
| 5. | Property and equipment, net |
| As at June 30, 2010 | | As at December 31, 2009 | | |||
| US$’000 | ||||||
| (Unaudited | ) | (Audited, as restated | ) | |||
Balance, beginning of period/year | 5,525,057 | 5,569,025 | ||||
Transfer to investment properties upon adoption of IAS 40 (Amendment) | — | (227,942 | ) | |||
Additions | 89,945 | 511,171 | ||||
Adjustment to project costs | (293 | ) | (11,629 | ) | ||
Disposals | (34,338 | ) | (12,149 | ) | ||
Depreciation | (149,317 | ) | (300,858 | ) | ||
Exchange differences | (16,860 | ) | (2,561 | ) | ||
Balance, end of the period/year | 5,414,194 | 5,525,057 | ||||
| 6. | Trade and other receivables and prepayments, net |
The aging analysis of trade receivables, net of provision for doubtful accounts, is as follows:
| As at June 30, 2010 | | As at December 31, 2009 | | |||
| US$’000 | ||||||
| (Unaudited | ) | (Audited | ) | |||
0–30 days | 163,536 | 197,645 | ||||
31–60 days | 34,251 | 16,796 | ||||
61–90 days | 12,285 | 9,508 | ||||
Over 90 days | 32,727 | 28,943 | ||||
| 242,799 | 252,892 | |||||
38
| Interim Report 2010 |
|
Notes to the Condensed Consolidated Interim Financial Information
| 7. | Investments |
The investments as at June 30, 2010 comprise fixed deposits with maturities over 90 days.
| 8. | Share capital |
Issued share capital of the Company:
| As at June 30, 2010 | As at December 31, 2009 | |||||||||
| Number of shares | Ordinary shares | | Number of shares | Ordinary shares | | |||||
| US$’000 | US$’000 | |||||||||
| (Unaudited) | (Audited) | |||||||||
Issued and fully paid: | ||||||||||
At July 15, 2009, date of incorporation | — | — | 1 | — | ||||||
At January 1, 2010 | 8,047,865,084 | 80,479 | — | — | ||||||
Shares issued pursuant to the global offering | — | — | 1,270,000,000 | 12,700 | ||||||
Shares issued under the Capitalization Issue | — | — | 6,279,999,999 | 62,800 | ||||||
Shares issued upon bond conversion | — | — | 497,865,084 | 4,979 | ||||||
At end of the period/year | 8,047,865,084 | 80,479 | 8,047,865,084 | 80,479 | ||||||
39
| Sands China Ltd. |
|
Notes to the Condensed Consolidated Interim Financial Information
| 9. | Borrowings |
| As at June 30, 2010 | | As at December 31, 2009 | | |||
| US$’000 | ||||||
| (Unaudited | ) | (Audited, as restated | ) | |||
Non-current portion | ||||||
Bank loans, secured | 2,211,309 | 2,768,457 | ||||
Finance lease liabilities on leasehold interests in land, secured | 194,662 | 218,237 | ||||
Other finance lease liabilities, secured | 180 | 283 | ||||
| 2,406,151 | 2,986,977 | |||||
Less: deferred financing costs | (81,938 | ) | (36,128 | ) | ||
| 2,324,213 | 2,950,849 | |||||
Current portion | ||||||
Bank loans, secured | 250,060 | 86,476 | ||||
Finance lease liabilities on leasehold interests in land, secured | 56,408 | 49,771 | ||||
Other finance lease liabilities, secured | 194 | 209 | ||||
| 136,456 | ||||||
Total borrowings | 2,630,875 | 3,087,305 | ||||
The Group’s borrowings are denominated in the following currencies:
| As at June 30, 2010 | | As at December 31, 2009 | | |||
| US$’000 | ||||||
| (Unaudited | ) | (Audited, as restated | ) | |||
US$ | 2,121,021 | 2,529,330 | ||||
Macao Patacas (“MOP”) | 316,977 | 346,721 | ||||
Hong Kong Dollar (“HK$”) | 192,832 | 211,187 | ||||
Renminbi | 45 | 67 | ||||
| 2,630,875 | 3,087,305 | |||||
40
| Interim Report 2010 |
|
Notes to the Condensed Consolidated Interim Financial Information
| 9. | Borrowings (continued) |
The movements of bank loans are analyzed as follows:
| As at June 30, 2010 | | As at December 31, 2009 | | |||
| US$’000 | ||||||
| (Unaudited | ) | (Audited | ) | |||
Balance, beginning of period/year | 2,854,933 | 3,525,507 | ||||
Proceeds from borrowings | — | 9,885 | ||||
Repayments of borrowings | (392,575 | ) | (680,302 | ) | ||
Exchange differences | (989 | ) | (157 | ) | ||
Balance, end of period/year | 2,461,369 | 2,854,933 | ||||
The estimated fair value of the Group’s bank loans as at June 30, 2010 was approximately US$2.40 billion (as at December 31, 2009: US$2.71 billion). The maturities of bank loans are as follows:
| As at June 30, 2010 | | As at December 31, 2009 | | |||
| US$’000 | ||||||
| (Unaudited | ) | (Audited | ) | |||
Bank loans | ||||||
Repayable within 1 year | 250,060 | 86,476 | ||||
Repayable between 1 and 2 years | 632,018 | 875,395 | ||||
Repayable between 2 and 5 years | 1,561,791 | 1,857,935 | ||||
Repayable after 5 years | 17,500 | 35,127 | ||||
| 2,461,369 | 2,854,933 | |||||
41
| Sands China Ltd. |
|
Notes to the Condensed Consolidated Interim Financial Information
| 9. | Borrowings (continued) |
The movements of finance lease liabilities on leasehold interests in land are analyzed as follows:
| As at June 30, 2010 | | As at December 31, 2009 | | |||
| US$’000 | ||||||
| (Unaudited) | ||||||
Balance, beginning of period/year | 268,008 | 112,612 | ||||
Additions | — | 272,167 | ||||
Repayments | (16,938 | ) | (116,771 | ) | ||
Balance, end of period/year | 251,070 | 268,008 | ||||
The contractual maturities of the Group’s current and future financial liabilities, based on undiscounted cash flows, are as follows:
| Within the first year | In the second year | In the third to fifth year | Over the fifth year | Total | |||||||
| US$’000 | |||||||||||
| (Unaudited) | |||||||||||
At June 30, 2010 | |||||||||||
Bank borrowings | 390,265 | 740,599 | 1,645,849 | 20,071 | 2,796,784 | ||||||
Finance lease liabilities on leasehold | 64,248 | 49,697 | 83,190 | 236,907 | 434,042 | ||||||
Other finance lease liabilities | 226 | 160 | 34 | — | 420 | ||||||
Trade and other payables | 860,990 | — | 14,794 | — | 875,784 | ||||||
| (Audited, as restated) | |||||||||||
At December 31, 2009 | |||||||||||
Bank borrowings | 252,401 | 1,018,122 | 2,011,636 | 47,495 | 3,329,654 | ||||||
Finance lease liabilities on leasehold | 55,860 | 49,876 | 105,020 | 243,031 | 453,787 | ||||||
Other finance lease liabilities | 255 | 205 | 106 | — | 566 | ||||||
Trade and other payables | 828,791 | — | 12,570 | — | 841,361 | ||||||
42
| Interim Report 2010 |
|
Notes to the Condensed Consolidated Interim Financial Information
| 9. | Borrowings (continued) |
VOL Credit Facility
On May 17, 2010, a subsidiary of the Company, Venetian Orient Limited (“VOL”, owner and developer of the integrated resort on Cotai Strip Parcels 5 and 6), entered into a credit agreement (the “VOL Credit Facility”) providing for up to US$1.75 billion (or equivalent in HK$ or MOP), which consists of a US$750.0 million term loan (the “VOL Term Facility”) that was fully drawn on July 16, 2010, a US$750.0 million delayed draw term loan available for 18 months after closing (the “VOL Delayed Draw Facility”) and a US$250.0 million revolving facility available until April 17, 2015 (the “VOL Revolving Facility”). As at June 30, 2010, the Company had not drawn any amounts under the VOL Revolving Facility.
The indebtedness under the VOL Credit Facility is guaranteed by any future restricted subsidiaries of VOL. The obligations under the VOL Credit Facility are collateralized by a first-priority security interest in substantially all of VOL’s assets, other than (1) capital stock and similar ownership interests, (2) certain furniture, fixtures, fittings and equipment and (3) certain other excluded assets.
The VOL Credit Facility matures on June 16, 2015, with VOL required to repay or prepay the VOL Credit Facility under certain circumstances. Commencing on March 31, 2013, and at the end of each subsequent quarter in 2013, VOL is required to repay the outstanding VOL Term and Delayed Draw Facilities on a pro rata basis in an amount equal to 5% of the aggregate principal amount of term loans outstanding as of November 17, 2011. Commencing on March 31, 2014, and at the end of each subsequent quarter in 2014, VOL is required to repay the outstanding VOL Term and Delayed Draw Facilities on a pro rata bases in an amount equal to 7.5% of the aggregate principal amount of term loans outstanding as of November 17, 2011. In addition, commencing with December 31, 2013, and the end of each fiscal year thereafter, VOL is required to further repay the outstanding VOL Term and Delayed Draw Facilities on a pro rata basis with 50%, subject to downward adjustments if certain conditions are met, of its excess free cash flow (as defined by the VOL Credit Facility).
Borrowings under the VOL Credit Facility bear interest at either the adjusted Eurodollar rate or an alternative base rate (in the case of U.S. dollar denominated loans) or HIBOR (in the case of HK$ and MOP denominated loans), as applicable, plus a spread of 4.5% per annum. VOL will pay standby fees of 2.0% per annum on the undrawn amounts under the VOL Term and Delayed Draw Facilities and 1.50% per annum on the undrawn amounts under the VOL Revolving Facility.
The VOL Credit Facility contains affirmative and negative covenants customary for such financings, including, but not limited to, limitations on liens, annual capital expenditures other than project costs, incurrence of indebtedness, loans and guarantees, investments, acquisitions and asset sales, restricted payments and other distributions, affiliate transactions and use of proceeds from the facility. The VOL Credit Facility also requires VOL to comply with financial covenants as of the first full quarter beginning six months after the commencement of substantial operations of Phases I and II of the integrated resort on Cotai Strip Parcels 5 and 6, including maximum ratios of total indebtedness to EBITDA (as defined in the VOL Credit Facility) and minimum ratios of EBITDA to total interest expense. The VOL Credit Facility also contains events of default customary for such financings.
43
| Sands China Ltd. |
|
Notes to the Condensed Consolidated Interim Financial Information
| 10. | Trade and other payables |
The aging analysis of trade payables is as follows:
| As at June 30, 2010 | | As at December 31, 2009 | | |||
| US$’000 | ||||||
| (Unaudited | ) | (Audited | ) | |||
0–30 days | 17,785 | 11,356 | ||||
31–60 days | 4,911 | 10,977 | ||||
61–90 days | 588 | 8,302 | ||||
Over 90 days | 2,741 | 2,948 | ||||
| 26,025 | 33,583 | |||||
| 11. | Net revenues |
| Six months ended June 30, | ||||||
| 2010 | 2009 | |||||
| US$’000 | ||||||
| (Unaudited | ) | (Audited | ) | |||
Casino | 1,768,543 | 1,317,124 | ||||
Rooms | 67,477 | 55,477 | ||||
Food and beverage | 34,882 | 25,446 | ||||
Mall | ||||||
— Income from right of use | 43,477 | 50,961 | ||||
— Management fees and other | 11,026 | 13,161 | ||||
Convention, ferry, retail and other | 55,094 | 38,418 | ||||
| 1,980,499 | 1,500,587 | |||||
44
| Interim Report 2010 |
|
Notes to the Condensed Consolidated Interim Financial Information
| 12. | Income tax expense |
| Six months ended June 30, | ||||||
| 2010 | 2009 | |||||
| US$’000 | ||||||
| (Unaudited | ) | (Audited | ) | |||
Current income tax | ||||||
Macao complementary tax | 70 | 160 | ||||
Hong Kong profit tax | — | 1 | ||||
Other overseas taxes | 66 | — | ||||
Deferred income tax | 17 | 6 | ||||
Income tax expense | 153 | 167 | ||||
Macao complementary tax is levied at progressive rates ranging from 3% to 9% on the taxable income above MOP32,000 (equivalent to US$4,000) but below MOP300,000 (equivalent to US$37,500), and thereafter at a fixed rate of 12%. For the period ended June 30, 2010, a special complementary tax incentive is provided to effect that tax free income threshold is increased from MOP32,000 to MOP200,000 (equivalent to US$4,000 to US$25,000) with the next MOP100,000 (equivalent to US$12,500) of profit being taxed at a fixed rate of 9% and thereafter at a fixed rate of 12% (six months ended June 30, 2009: same).
Pursuant to the Despatch No. 250/2004 issued by the Chief Executive of the Macao Government on September 30, 2004, VML was exempted from Macao complementary tax on its gaming activities for five years effective from the 2004 year of assessment. On May 21, 2008, VML was granted, pursuant to the Despatch No. 167/2008 issued by the Chief Executive of the Macao Government, an extension of the tax exemption regarding Macao complementary tax on its gaming activities for an additional five years, which is set to expire in 2013. Regarding the other subsidiaries, during the period ended June 30, 2010, Macao complementary tax is calculated progressively at a maximum of 12% (six months ended June 30, 2009: same).
| 13. | Dividends |
No dividend has been paid or declared by the Company for the six months ended June 30, 2010 (six months ended June 30, 2009: same).
| 14. | Earnings per share |
Basic earnings per share is calculated by dividing the profit for the period attributable to equity holders of the Company by the weighted average number of ordinary shares in issue during the period.
The Company was incorporated on July 15, 2009. The weighted average number of ordinary shares in issue during the six months ended June 30, 2009 used in the basic earnings per share calculation is determined on the assumption that the 6,279,999,999 shares at par value of US$0.01 each issued upon the capitalization issue to Venetian Venture Development Intermediate II, the immediate holding company, had been in issue prior to the incorporation of the Company.
45
| Sands China Ltd. |
|
Notes to the Condensed Consolidated Interim Financial Information
| 14. | Earnings per share (continued) |
| Six months ended June 30, | ||||||
| 2010 | 2009 | |||||
| (Unaudited) | ||||||
Profit attributable to equity holders of the Company (US$’000) | 250,500 | 58,346 | ||||
Weighted average number of shares (thousand shares) | 8,047,865 | 6,280,000 | ||||
Earning per share, basic (US$) | US3.11 cents | US0.93 cents | ||||
Earning per share, basic (HK$)(i) | HK24.20 cents | HK7.21 cents | ||||
| (i) | The translation of US$ amounts into HK$ amounts has been made at the rate of US$1.00 to HK$7.7827 (six months ended June 30, 2009: US$1.00 to HK$7.750). No representation is made that the HK$ amounts have been, could have been or could be converted into US$, or vice versa, at that rate, or at any other rates or at all. |
Diluted earnings per share are equal to basic earnings per share as the share options of the Company did not result in any potential dilutive effect on the ordinary shares outstanding during the period (six months ended June 30, 2009: same).
| 15. | Related party transactions |
For the purposes of this Interim Financial Information, parties are considered to be related to the Group if the party has the ability, directly or indirectly, to exercise significant influence over the Group in making financial and operating decisions, or vice versa. Related parties may be individuals (being members of key management personnel, significant shareholders and/or their close family members) or other entities, and include entities which are under the significant influence of related parties of the Group where those parties are individuals. Related companies represent the group companies of the LVS group. LVS is the Group’s ultimate holding company.
Save as disclosed elsewhere in this Interim Financial Information, the Group has the following significant transactions with the related parties as defined in IAS 24 ‘Related Party Disclosures’:
| (a) | Management fees |
| Six months ended June 30, | ||||||
| 2010 | 2009 | |||||
| US$’000 | ||||||
| (Unaudited | ) | (Audited | ) | |||
LVS | 2,805 | 1,361 | ||||
Intermediate holding company | 131 | — | ||||
Fellow subsidiaries | 7,201 | 9,261 | ||||
| 10,137 | 10,622 | |||||
46
| Interim Report 2010 |
|
Notes to the Condensed Consolidated Interim Financial Information
| 15. | Related party transactions (continued) |
| (a) | Management fees (continued) |
Management services are provided by LVS and other fellow subsidiaries for providing services including but not limited to human resources support, accounting services, sourcing of goods and services, sourcing of tenants for the malls and other various types of marketing and promotion activities for the Group. Management fees are charged on a cost-plus basis, allowing a margin of 5% to 10%.
| (b) | Interest expense |
| Six months ended June 30, | ||||||
| 2010 | 2009 | |||||
| US$’000 | ||||||
| (Unaudited) | (Audited) | |||||
LVS | — | 1,579 | ||||
Intermediate holding company | — | 676 | ||||
| — | 2,255 | |||||
Immediately prior to the completion of the Global Offering, the Group repaid all of the shareholders’ loans owed to LVS and one of its U.S. subsidiaries.
| (c) | Period-end balances arising from operating expenses paid by/on behalf of and advances to/from the Group: |
| As at June 30, 2010 | | As at December 31, 2009 | | |||
| US$’000 | ||||||
| (Unaudited) | (Audited) | |||||
Receivables from fellow subsidiaries | 6,167 | 1,222 | ||||
Payables to related companies: | ||||||
LVS | 938 | 2,555 | ||||
Intermediate holding companies | 276 | 4,086 | ||||
Fellow subsidiaries | 9,482 | 10,700 | ||||
| 10,696 | 17,341 | |||||
The receivables and payables are unsecured, interest-free and have no fixed terms of repayment.
| (d) | Key management personnel remuneration |
No transaction has been entered with the directors of the Company (being the key management personnel) during the six months ended June 30, 2010 other than the emoluments paid or payable to them totaling US$2.9 million (six months ended June 30, 2009: US$1.3 million).
47
| Sands China Ltd. |
|
Notes to the Condensed Consolidated Interim Financial Information
| 15. | Related party transactions (continued) |
| (e) | Royalty fees |
There has been no change in the terms of the royalty agreement that was entered into with Las Vegas Sands, LLC in November 2009 since the 2009 annual report. During the six months ended June 30, 2010, the Group incurred US$10.0 million (six months ended June 30, 2009: nil) of royalty fees under this agreement.
| (f) | Share-based compensation |
The Company adopted an equity award plan (the “SCL Equity Plan”) for grants of options to purchase ordinary shares of the Company (Note 16(a)). The Group participates in the share-based compensation plan of the LVS (Note 16(b)).
| 16. | Share-based compensation |
| (a) | Share options of the Company |
The purpose of the SCL Equity Plan is to give the Company a competitive edge in attracting, retaining and motivating employees, directors and consultants and to provide the Company with a stock plan providing incentives directly related to increases in its stockholder value. Subject to certain criteria as defined in the SCL Equity Plan, the Company’s subsidiaries’ or affiliates’ employees, directors or officers and many of its consultants are eligible for awards under the SCL Equity Plan. The SCL Equity Plan provides for an aggregate of 804,786,508 shares of the Company’s ordinary shares to be available for awards, representing 10% of the outstanding shares upon completion of the global offering. The SCL Equity Plan has a term of ten years and no further awards may be granted after the expiration of the term. The Company’s Remuneration Committee may grant awards of share options, stock appreciation rights, restricted stock awards, restricted stock units, stock bonus awards, performance compensation awards or any combination of the foregoing. As at June 30, 2010, there were 784,410,408 shares available for grant under the SCL Equity Plan.
Share option awards are granted with an exercise price not less than (i) the closing price of the Company’s ordinary shares on the date of grant or (ii) the average closing price of the Company’s ordinary shares for the five business days immediately preceding the date of grant. The outstanding share options generally vest over four years and have ten-year contractual terms. Compensation cost for all share option grants, which all have graded vesting, is net of estimated forfeitures and is recognized on an accelerated granted attribution approach over the awards’ respective requisite service periods. The Company estimates the fair value of share options using the Black-Scholes option- pricing model. Expected volatilities are based on the historical volatilities from a selection of companies from the Company’s peer group due to the Company’s lack of historical information. The risk-free interest rate for periods equal to the expected term of the share option is based on the Hong Kong Exchange Fund Note rate in effect at the time of grant.
48
| Interim Report 2010 |
|
Notes to the Condensed Consolidated Interim Financial Information
| 16. | Share-based compensation (continued) |
| (a) | Share options of the Company (continued) |
During the six months ended June 30, 2010, share-based compensation expense incurred under the SCL Equity Plan was US$2.4 million (six months ended June 30, 2009: nil), of which US$0.3 million (six months ended June 30, 2009: nil) was capitalized as part of property and equipment. Movements in the number of share options outstanding and their related weighted average exercise prices during the period are as follows:
| Six months ended June 30, | ||||||||||
| 2010 | 2009 | |||||||||
| Weighted average exercise price | Number of options (‘000) | | Weighted average exercise price | Number of options (‘000) | | |||||
| US$ | US$ | |||||||||
| (Unaudited) | (Audited) | |||||||||
Outstanding at January 1 | — | — | — | — | ||||||
Granted | 1.58 | 20,376 | — | — | ||||||
Exercised | — | — | — | — | ||||||
Forfeited | 1.59 | (567 | ) | — | — | |||||
Outstanding at June 30 | 1.58 | 19,809 | — | — | ||||||
Exercisable at June 30 | — | — | — | — | ||||||
49
| Sands China Ltd. |
|
Notes to the Condensed Consolidated Interim Financial Information
| 16. | Share-based compensation (continued) |
| (b) | Share options of LVS |
The Group participates in the share-based compensation plan of LVS. The share-based compensation expenses charged by LVS during the six months ended June 30, 2010 amounted to US$6.1 million (six months ended June 30, 2009: US$3.8 million).
| Six months ended June 30, | ||||||||||
| 2010 | 2009 | |||||||||
| Weighted average exercise price(i) | Number of options (‘000)(ii) | | Weighted average exercise price(i) | Number of options (‘000)(ii) | | |||||
| US$ | US$ | |||||||||
| (Unaudited) | (Audited) | |||||||||
Outstanding at January 1 | 47.97 | 2,366 | 63.36 | 2,872 | ||||||
Granted | — | — | 7.68 | 179 | ||||||
Transfer-in(iii) | 72.16 | 11 | 56.14 | 109 | ||||||
Exercised | 10.89 | (269 | ) | — | — | |||||
Transfer-out(iii) | 69.50 | (82 | ) | 50.50 | (254 | ) | ||||
Forfeited | 64.47 | (71 | ) | 68.63 | (654 | ) | ||||
Expired | 78.88 | (30 | ) | 62.59 | (248 | ) | ||||
Outstanding at June 30 | 51.27 | 1,925 | 58.00 | 2,004 | ||||||
Exercisable at June 30 | 58.20 | 930 | 58.59 | 601 | ||||||
| (i) | Exercise price is expressed in US$. |
| (ii) | Number of options represents the number of ordinary shares in LVS into which the options are exercisable. |
| (iii) | Transfer-in and transfer-out represent movement of options held by grantees who transferred from other subsidiaries of LVS to the Group, or vice versa. |
50
| Interim Report 2010 |
|
Notes to the Condensed Consolidated Interim Financial Information
| 17. | Commitments and contingencies |
| (a) | Capital commitments |
Future commitments for property and equipment that are not recorded in the financial statements herein are as follows:
| As at June 30, 2010 | | As at December 31, 2009 | | |||
| US$’000 | ||||||
| (Unaudited) | (Audited) | |||||
Contracted but not provided for | 479,883 | 162,054 | ||||
Authorized but not contracted for | 1,364,199 | 1,708,208 | ||||
| 1,844,082 | 1,870,262 | |||||
| (b) | Operating lease commitments |
| (i) | The Group as the lessee |
The Group had future aggregate minimum lease payments under non-cancellable operating leases for interests in property and equipment as follows:
| As at June 30, 2010 | | As at December 31, 2009 | | |||
| US$’000 | ||||||
| (Unaudited) | (Audited, as restated) | | ||||
No later than 1 year | 2,919 | 2,898 | ||||
Later than 1 year and no later than 5 years | 6,358 | 7,750 | ||||
| 9,277 | 10,648 | |||||
51
| Sands China Ltd. |
|
Notes to the Condensed Consolidated Interim Financial Information
| 17. | Commitments and contingencies (continued) |
| (b) | Operating lease commitments (continued) |
| (ii) | The Group as the lessor/grantor of the right of use |
The future aggregate minimum lease/base fee rent receivables under non-cancellable agreements are as follows:
| As at June 30, 2010 | | As at December 31, 2009 | | |||
| US$’000 | ||||||
| (Unaudited | ) | (Audited | ) | |||
No later than 1 year | 104,173 | 96,200 | ||||
Later than 1 year and no later than 5 years | 191,001 | 217,469 | ||||
Later than 5 years | 111,570 | 130,972 | ||||
| 406,744 | 444,641 | |||||
| (c) | Contingencies |
There have been no material changes in contingencies since the last annual report.
| 18. | Adoption of IAS 17 (Amendment) |
| (i) | Effect on the consolidated balance sheet at January 1, 2009 |
| At January 1, 2009 as previously stated | Effects of IAS 17 Amendment | | At January 1, 2009 as restated | | ||||
| US$’000 | ||||||||
Investment properties, net | 338,014 | 72,990 | 411,004 | |||||
Property and equipment, net | 5,235,823 | 333,202 | 5,569,025 | |||||
Leasehold interests in land, net | 274,443 | (274,443 | ) | — | ||||
Borrowings | 3,643,160 | 112,612 | 3,755,772 | |||||
Trade and other payables | 1,994,705 | 6,815 | 2,001,520 | |||||
Retained earnings | 1,140,093 | 12,322 | 1,152,415 |
52
| Interim Report 2010 |
|
Notes to the Condensed Consolidated Interim Financial Information
| 18. | Adoption of IAS 17 (Amendment) (continued) |
| (ii) | Effect on the consolidated income statement for the six months ended June 30, 2009 |
| For the six months ended June 30, 2009 as previously stated | Effects of IAS 17 Amendment | | For the six months ended June 30, 2009 as restated | | ||||
| US$’000 | ||||||||
Depreciation and amortization | 158,444 | 3,918 | 162,362 | |||||
Land lease expense | 6,125 | (6,125 | ) | — | ||||
Interest expense, net of amounts capitalized | 52,211 | 1,815 | 54,026 | |||||
Net foreign exchange losses | 125 | 24 | 149 |
| (iii) | Effect on the consolidated balance sheet at January 1, 2010 |
| At January 1, 2010 as previously stated | Effects of IAS 17 Amendment | | At January 1, 2010 as restated | | ||||
| US$’000 | ||||||||
Investment properties, net | 676,512 | 72,231 | 748,743 | |||||
Property and equipment, net | 4,926,540 | 598,517 | 5,525,057 | |||||
Leasehold interests in land, net | 378,918 | (378,918 | ) | — | ||||
Borrowings | 2,819,297 | 268,008 | 3,087,305 | |||||
Trade and other payables | 831,041 | 10,320 | 841,361 | |||||
Retained earnings | 1,353,836 | 13,502 | 1,367,338 | |||||
| (iv) | Effect on the consolidated income statement for the six months ended June 30, 2010 |
| For the six months ended June 30, 2010 prior to adoption | Effects of IAS 17 Amendment | For the six months ended June 30, 2010 | | ||||
| US$’000 | |||||||
Depreciation and amortization | 159,421 | 3,918 | 163,339 | ||||
Land lease expense | 14,119 | -14,119 | — | ||||
Interest expense, net of amounts capitalized | 68,805 | 2,645 | 71,450 | ||||
Net foreign exchange losses | 8,383 | 32 | 8,415 | ||||
| 19. | Comparatives |
Certain comparative figures have been reclassified to conform to the presentation of the current period.
53
| Sands China Ltd. |
|
Corporate Information
(as at the Latest Practicable Date)
Directors
Executive Directors
Mr. Michael Alan Leven(Acting Chief Executive Officer)
Mr. Toh Hup Hock(Chief Financial Officer)
Non-Executive Director
Mr. Sheldon Gary Adelson(Chairman)
Mr. Jeffrey Howard Schwartz
Mr. Irwin Abe Siegel
Independent Non-Executive Directors
Mr. Iain Ferguson Bruce
Ms. Chiang Yun
Mr. David Muir Turnbull
Registered Office in Cayman Islands
Walkers Corporate Services Limited
Walker House, 87 Mary Street
George Town, Grand Cayman KY1-9005
Cayman Islands
Principal place of Business and Head Office in Macao
The Venetian Macao-Resort-Hotel
Executive Offices, L2
Estrada da Baia de N. Senhora da Esperanca, s/n
Taipa, Macao
Principal Place of Business in Hong Kong
Level 28, Three Pacific Place
1 Queen’s Road East
Hong Kong
Company’s Website
www.sandschinaltd.com
Joint Company Secretaries
Ms. Anne Maree Salt
Ms. Ho Siu Pik(ACS, ACIS)
Board Committees
Audit Committee
Mr. Iain Ferguson Bruce(Chairman)
Ms. Chiang Yun
Mr. Irwin Abe Siegel
Remuneration Committee
Mr. David Muir Turnbull(Chairman)
Mr. Iain Ferguson Bruce
Mr. Jeffrey Howard Schwartz
LVSC Announcements Committee
Mr. Irwin Abe Siegel(Chairman)
Mr. Iain Ferguson Bruce
Mr. David Muir Turnbull
CEO Search Committee
Mr. Irwin Abe Siegel(Chairman)
Mr. Michael Alan Leven
Mr. David Muir Turnbull
Transitional Advisory Committee
Mr. Irwin Abe Siegel(Chairman)
Mr. Michael Alan Leven
Mr. David Muir Turnbull
Authorized Representatives
Mr. Irwin Abe Siegel
Ms. Anne Maree Salt
Level 28, Three Pacific Place
1 Queen’s Road East
Hong Kong
Cayman Islands principal share registrar and transfer office
Walkers Corporate Services Limited
Walker House, 87 Mary Street
George Town, Grand Cayman KY1-9005
Cayman Islands
Hong Kong Share Registrar
Computershare Hong Kong Investor Services Limited
Shops 1712–1716, 17th Floor
Hopewell Centre
183 Queen’s Road East
Wanchai
Hong Kong
Compliance Advisor
CLSA Equity Capital Markets Limited
Principal Bankers
Banco Nacional Ultramarino S.A.
Avenida Almeida Ribeiro, 22,
Macao
Bank of China Limited, Macao Branch
Bank of China Building
Avenida Doutor Mario Soares,
Macao
Stock Code
1928
54
| Interim Report 2010 |
|
Contact Us
Interim Report
This 2010 Interim Report is printed in English and Chinese languages and is available on our website at www.sandschinaltd.com from September 14, 2010 and was posted to Shareholders on September 15, 2010.
Those Shareholders who received our 2010 Interim Report electronically and would like to receive a printed copy or vice versa may at any time change their means of receipt of the Company’s corporate communications free of charge by reasonable notice in writing or by email to sandschina.ecom@computershare.com.hk to the Company c/o the Hong Kong Share Registrar. Those Shareholders who have chosen to receive this 2010 Interim Report by electronic means and who, for any reason, have difficulty in receiving or gaining access to this 2010 Interim Report, may also request to be sent a copy of this 2010 Interim Report in printed form free of charge by submitting a written request or email to the Company c/o the Hong Kong Share Registrar.
Contact Us
Address: | Level 28, Three Pacific Place, 1 Queen’s Road East, Hong Kong | |
Telephone: | +853 8118 2888 | |
Facsimile: | +853 2888 3382 | |
Email: | scl-enquires@venetian.com.mo |
55
| Sands China Ltd. |
|
Glossary
“adjusted EBITDA” | adjusted EBITDA is profit before interest, income taxes, depreciation and amortization (net of amortization of show production costs), pre-opening expense, net foreign exchange losses or gains, loss or gain on disposal of property and equipment, corporate expense, share-based compensation and fair value losses or gains on financial assets at fair value through profit or loss. With respect to adjusted EBITDA for each of our properties, we make allocations of the shared support expenses based on revenue attributable to each property. Adjusted EBITDA is used by management as the primary measure of operating performance of our Group’s properties and to compare the operating performance of our Group’s properties with that of its competitors. However, adjusted EBITDA should not be considered in isolation; construed as an alternative to profit or operating profit; as an indicator of our IFRS operating performance, other combined operations or cash flow data; or as an alternative to cash flow as a measure of liquidity. Adjusted EBITDA presented in the report may not be comparable to other similarly titled measures of other companies. In addition, our adjusted EBITDA presented in the report may differ from adjusted EBITDA presented by LVS for its Macao segment in its filings with the U.S. Securities and Exchange Commission | |
“ADR” | the average daily rate per occupied room in a given time period, calculated as room revenue divided by the number of rooms sold | |
“Board” | the board of directors of the Company | |
“Bonds” | the US$600.0 million exchangeable bonds due 2014 issued by VVDI (II), which were mandatorily and automatically exchanged for Shares upon the Listing | |
“cage” | a secure room within a casino with a facility that allows patrons to exchange cash for chips required to participate in gaming activities, or to exchange chips for cash | |
“CAGR” | compound annual growth rate | |
“Capitalization Issue” | the issue of Shares made upon the capitalization of certain sums standing to the credit of the share premium account of our Company as further described in “Statutory and General Information — Further Information About Our Group — Resolutions in Writing of the Sole Shareholder of Our Company Passed on November 8, 2009” in Appendix VII of our Prospectus | |
“casino(s)” | a gaming facility that provides casino games consisting of table games operated in VIP areas or mass market areas, electronic games, slot machines and other casino games | |
“Chief Executive” | a person who either alone or together with one or more other persons is or will be responsible under the immediate authority of the board of directors for the conduct of the business of the Company | |
“China” or the “PRC” | the People’s Republic of China excluding, for the purpose of this report only, Hong Kong, Macao and Taiwan, unless the context otherwise requires | |
56
| Interim Report 2010 |
|
Glossary
“chip(s)” | tokens issued by a casino to players in exchange for cash or credit, which may be used to place bets on gaming tables, in lieu of cash | |
“Company,” “our,” | Sands China Ltd., a company incorporated in the Cayman Islands on July 15, 2009 as an exempted company with limited liability and, except where the context otherwise requires, all of its subsidiaries, or where the context refers to the time before it became the holding company of its present subsidiaries, its present subsidiaries. When used in the context of gaming operations or the Subconcession, “we,” “us,” or “our” refers exclusively to VML | |
“Companies Ordinance” | the Companies Ordinance (Chapter 32 of the Laws of Hong Kong) as amended, supplemented or otherwise modified from time to time | |
“Concessionaire(s)” | the holder(s) of a concession for the operation of casino games in the MSAR. As at the Latest Practicable Date, the Concessionaires were Galaxy, SJM and Wynn Macau | |
“Controlling Shareholder(s)” | has the meaning ascribed to it under the Listing Rules and, with respect to our Company, the controlling shareholders as referred to in “Relationship with Our Controlling Shareholders” of our Prospectus | |
“Cotai” | the name given to the land reclamation area in the MSAR between the islands of Coloane and Taipa | |
“Cotai Strip” | integrated resort projects on Cotai being developed by us and inspired by the Las Vegas Strip in Las Vegas, Nevada, U.S.A. LVS has registered the Cotai Strip trademark in Hong Kong and Macao | |
“DICJ” | Gaming Inspection and Coordination Bureau (“Direcção de Inspecção e Coordenação de Jogos”) under the Secretary for Economy and Finance of the MSAR | |
“Director(s)” | member(s) of the board of directors of the Company | |
“DSEC” | the Statistics and Census Service of the MSAR | |
“EBITDA” | earnings before interest, taxes, depreciation and amortization | |
“Exchange Rate” | save as otherwise stated, amounts denominated in U.S. dollars, MOP and Hong Kong dollars have been converted, for the purposes of illustration only, in this report at: US$1.00 : HK$7.7827 US$1.00 : MOP8.00 US$1.00 : RMB6.80 HK$1.00 : MOP1.03 | |
“Four Seasons Hotel” | refers to the Four Seasons Hotel Macao, Cotai Strip®, which is managed and operated by FS Macau Lda., an affiliate of Four Seasons Hotels Limited | |
57
| Sands China Ltd. |
|
Glossary
“Galaxy” | Galaxy Casino S.A. (also known as Galaxy Casino Company Limited), a company incorporated in Macao on November 30, 2001 and one of the three Concessionaires | |
“gaming area(s)” | a gaming facility that provides casino games consisting of table games operated in VIP areas or mass market areas, electronic games, slot machines and other casino games but has not been designated as a casino by the Macao Government | |
“Gaming Promoter(s)” | individuals or corporations licensed by and registered with the Macao Government to promote games of fortune and chance to patrons, through the arrangement of certain services, including extension of credit (regulated by Law No. 5/2004), transportation, accommodation, dining and entertainment, whose activity is regulated by Administrative Regulation No. 6/2002 | |
“GDP” | gross domestic product | |
“Global Offering” | the offer of Shares in the Company by subscription for cash at HK$10.38 on November 30, 2009 on and subject to the terms outlined in the Prospectus | |
“Group” | our Company and its subsidiaries and, in respect of the period before our Company became the holding company of such subsidiaries, the entities which carried on the business of the present Group at the relevant time | |
“HIBOR” | the Hong Kong Interbank Offered Rate | |
“HK$” or “HK dollars” | Hong Kong dollars, the lawful currency of Hong Kong | |
“Hong Kong” | the Hong Kong Special Administrative Region of the PRC | |
“IFRS” | International Financial Reporting Standards | |
“integrated resort(s)” | a resort which provides customers with a combination of hotel accommodations, casinos or gaming areas, retail and dining facilities, MICE space, entertainment venues and spas | |
“Latest Practicable Date” | September 3, 2010 | |
“LIBOR” | London Interbank Offered Rate | |
“Listing” | the listing of the Shares on the Main Board on November 30, 2009 | |
“Listing Date” | November 30, 2009, the date on which dealings in the Shares first commenced on the Main Board | |
“Listing Rules” | the Rules Governing the Listing of Securities on the Stock Exchange (as amended from time to time) | |
58
| Interim Report 2010 |
|
Glossary
“LVS” | Las Vegas Sands Corp., a company incorporated in Nevada, U.S.A. in August 2004 and the common stock of which is listed on the New York Stock Exchange | |
“LVSDutch” | LVS Dutch Intermediate Holding BV, an indirect, wholly owned subsidiary of LVS | |
“LVSGroup” | LVS and its subsidiaries (excluding our Group) | |
“Macao” or “MSAR” | the Macao Special Administrative Region of the PRC | |
“Macao Government” | the local government of the MSAR, established on December 20, 1999 and the local administration before this date | |
“Main Board” | the stock exchange (excluding the option market) operated by the Stock Exchange which is independent of and operated in parallel with the Growth Enterprise Market of the Stock Exchange | |
“mass market player(s)” | non-rolling chip players | |
“Melco Crown” | Melco Crown Jogos (Macau), S.A., a private company limited by shares (“sociedade anónima”) incorporated on May 10, 2006 under the laws of Macao and one of the three Subconcessionaires | |
“MGM Grand Paradise” | MGM Grand Paradise, S.A. (also known as MGM Grand Paradise Limited), a private company limited by shares (“sociedade anónima”) incorporated on June 17, 2004 under the laws of Macao and one of the three Subconcessionaires | |
“MICE” | Meetings, Incentives, Conventions and Exhibitions, an acronym commonly used to refer to tourism involving large groups brought together for an event or corporate meeting | |
“MOP” or “pataca(s)” | Macao pataca, the lawful currency of Macao | |
“Parcel 1” | a land parcel in Cotai totaling 291,479 square meters described under Registration No. 23225 by the Macau Property Registry, on which The Venetian Macao has been constructed | |
“Parcel 2” | a land parcel in Cotai totaling 53,700 square meters described under Registration No. 23223 by the Macau Property Registry, on which The Plaza Macao has been constructed | |
59
| Sands China Ltd. |
|
Glossary
“Parcel 3” | a land parcel in Cotai totaling 60,479 square meters described under Registration No. 23224 by the Macau Property Registry, which is expected to contain an integrated resort that will be connected to The Plaza Macao and the CotaiExpo center at The Venetian Macao, and may contain over 4,000 branded hotel rooms, gaming areas and other integrated resort amenities. These plans are based on general building plans submitted to the Land, Public Works and Transport Bureau of the MSAR on June 18, 2009, which we are continuing to refine and update during the course of its overall design and development | |
“Parcels 5 and 6” | land parcels in Cotai totaling 150,134 square meters, including 44,576 square meters designated as a tropical garden, described under Registration No. 23288 by the Macau Property Registry | |
“Parcels 7 and 8” | land parcels in Cotai totaling 110,200 square meters for which we have not obtained a land concession and are expected to contain an integrated resort similar in size and scope to the integrated resort located on Parcels 5 and 6. These plans are based on initial conceptual designs, which we will continue to refine and update during the course of its overall design and development. The size of the land parcel may be subject to further surveyance | |
“premium player(s)” | rolling chip players who have a direct relationship with gaming operators and typically participate in gaming activities in casinos or gaming areas without the use of Gaming Promoters | |
“Prospectus” | our Listing prospectus dated November 16, 2009, which is available from our website at www.sandschinaltd.com | |
“PwC” | PricewaterhouseCoopers, the global professional services company | |
“Reporting Period” | January 1, 2010 to June 30, 2010 | |
“RMB” or “Renminbi” | Renminbi, the lawful currency of China | |
“rolling chip play” | play by VIP and premium players (excludes Paiza cash players) using non-negotiable chips | |
“rolling chip volume” | casino revenue measurement, measured as the sum of all non-negotiable chips wagered and lost by VIP and premium players (excludes Paiza cash players) | |
“Sands Macao” | the Sands Macao, which includes gaming areas, a hotel tower, restaurants and a theater | |
“SFO” | the Securities and Futures Ordinance of Hong Kong (Chapter 571 of the Laws of Hong Kong) as amended, supplemented or otherwise modified from time to time | |
“Shared Services Agreement” | the shared services agreement dated November 8, 2009 entered into between LVS and our Company to regulate their relationship with respect to the provision of certain shared services | |
“Share(s)” | ordinary shares in our Company with a nominal value of US$0.01 each | |
60
| Interim Report 2010 |
|
Glossary
“Shareholder(s)” | holder(s) of Shares | |
“Share Option Scheme” | the share option scheme conditionally adopted by our Company on November 8, 2009 | |
“SJM” | Sociedade de Jogos de Macau, S.A., a private company limited by shares (“sociedade anónima”), incorporated on November 28, 2001 under the laws of Macao and one of the three Concessionaires | |
“SOX” | the United States federal law Sarbanes Oxley Act of 2002 | |
“Stock Exchange” | The Stock Exchange of Hong Kong Limited | |
“Subconcession” or | the tripartite Subconcession Contract for the operation of casino games dated December 26, 2002 among Galaxy, the Macao Government and VML | |
“Subconcessionaire(s)” | the holder(s) of a subconcession for the operation of casino games in the MSAR. As at the Latest Practicable Date, the Subconcessionaires were VML (one of our subsidiaries), Melco Crown and MGM Grand Paradise | |
“subsidiary(ies)” | has the meaning ascribed to it under Section 2 of the Companies Ordinance | |
“table games” | typical casino games, including card games such as baccarat, blackjack and hi-lo (also known as “Sic bo”) as well as craps and roulette | |
“The Plaza Macao” | an integrated resort which includes (i) the Four Seasons Hotel; (ii) the Plaza Casino gaming area operated by VML; (iii) the Paiza Mansions, The Shoppes at Four Seasons, restaurants and a spa, each of which are operated by us; and (iv) a luxury apart-hotel tower, which is anticipated to be branded and serviced by Four Seasons; except where the context indicates otherwise | |
“The Venetian Macao” | The Venetian® Macao-Resort-Hotel, an integrated resort that includes casino and gaming areas, a hotel, MICE space, The Grand Canal Shoppes, over 50 different restaurants and food outlets, a 15,000-seat arena and other entertainment venues | |
“United States,” | the United States of America, including its territories and possessions and all areas subject to its jurisdiction | |
“US$” or “U.S. dollars” | United States dollars, the lawful currency of the United States | |
“VIP player(s)” | rolling chip players who play almost exclusively in dedicated VIP rooms or designated casino or gaming areas and are sourced from Gaming Promoters | |
61
| Sands China Ltd. |
|
Glossary
“VIP room(s)” | rooms or designated areas within a casino or gaming area where VIP players and premium players gamble | |
“visit(s)” or | with respect to visitation of our properties, the number of times a property is entered during a fixed time period. Estimates of the number of visits to our properties is based on information collected from digital cameras placed above every entrance in our properties which use video signal image processor detection and include repeat visitors to our properties on a given day | |
“VML” | our subsidiary, Venetian Macau, S.A. (also known as Venetian Macau Limited), a private company limited by shares (“sociedade anónima”) incorporated on June 21, 2002 under the laws of Macao, one of the three Subconcessionaires and the holder of the Subconcession | |
“VOL” | Venetian Orient Limited, a wholly owned subsidiary of the Company | |
“VVDIL” | our subsidiary, Venetian Venture Development Intermediate Limited, a company incorporated in the Cayman Islands on June 21, 2002 as an exempted company with limited liability | |
“VVDI (I)” | Venetian Venture Development Intermediate I, an indirect, wholly owned subsidiary of LVS | |
“VVDI (II)” | Venetian Venture Development Intermediate II, a company incorporated in the Cayman Islands on January 23, 2003 as an exempted company with limited liability and an indirect, wholly owned subsidiary of LVS and our immediate Controlling Shareholder | |
62