Exhibit 99.1
Exhibit 99.1
Sands China Ltd.
(Incorporated in the cayman Islands with limited liability)
Stock code: 1928
Sands China Ltd.
2011
Interim Report
This interim report is printed on recycled paper using soy ink
* For identification purposes only

Contents
1. Overview 2
1.1 Financial Highlights 2
2. Management Discussion and Analysis 3
2.1 Results of Operations 3
2.2 Liquidity and Capital Resources 9
2.3 Capital Expenditures 10
2.4 Capital Commitments 11
2.5 Interim Dividend 11
2.6 Pledge of Fixed Assets 11
2.7 Contingent Liabilities and Risk Factors 11
2.8 Capital Risk Management 12
2.9 Foreign Exchange Risk 12
2.10 Business Review and Prospects 13
3. Corporate Governance 14
3.1 Human Resources 14
3.2 Environment 14
3.3 Corporate Governance Practices 14
3.4 Code Provision 14
3.5 Model Code for Securities Transactions 14
3.6 Board and Board Committees Composition 15
3.7 Disclosure of Director’s Information 17
3.8 Audit Committee Review 17
3.9 Disclosure of Interests 17
3.10 Share Option Scheme 20
3.11 Purchase, Sale or Redemption of 21
the Company’s Listed Shares
4. Interim Financial Information 22
4.1 Report on Review of 22
Interim Financial Information
4.2 Condensed Consolidated 23
Interim Financial Information
4.3 Notes to the Condensed Consolidated 29
Interim Financial Information
5. Corporate Information 49
6. Contact Us 50
7. Glossary 51
Interim Report 2011
1. Overview
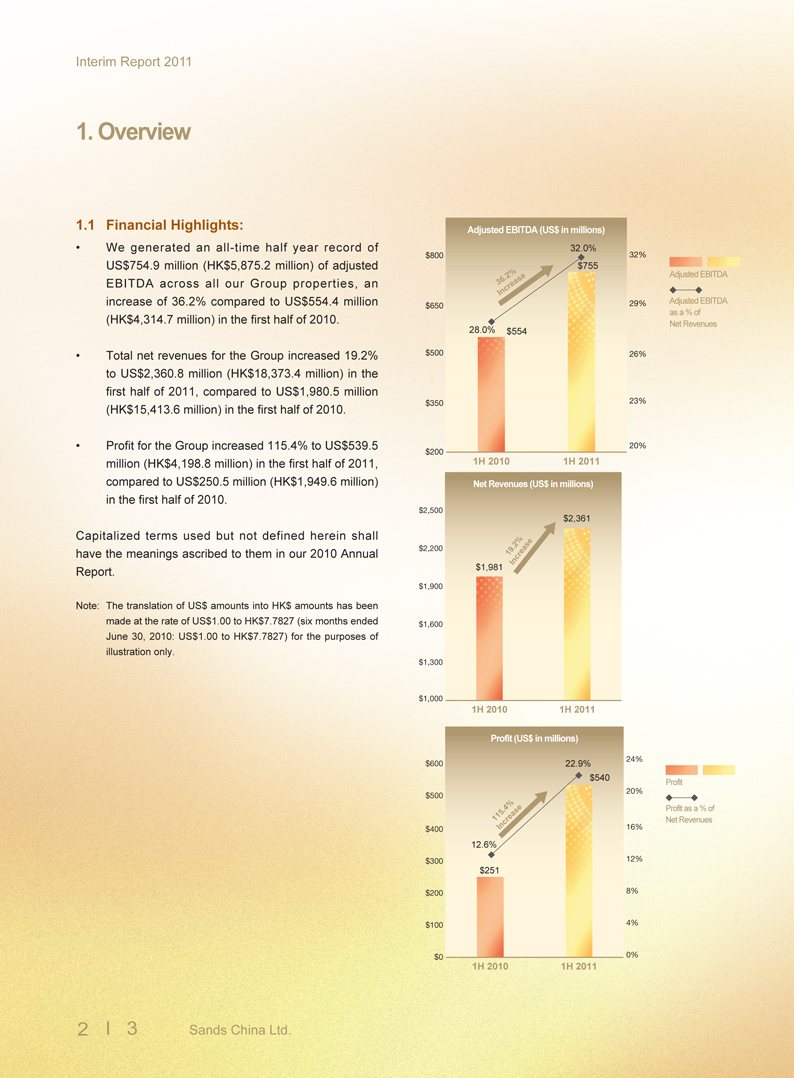
1.1 Financial Highlights:
• We generated an all-time half year record of
US$754.9 million (HK$5,875.2 million) of adjusted
EBITDA across all our Group properties, an
increase of 36.2% compared to US$554.4 million
(HK$4,314.7 million) in the first half of 2010.
• Total net revenues for the Group increased 19.2%
to US$2,360.8 million (HK$18,373.4 million) in the
first half of 2011, compared to US$1,980.5 million
(HK$15,413.6 million) in the first half of 2010.
• Profit for the Group increased 115.4% to US$539.5
million (HK$4,198.8 million) in the first half of 2011,
compared to US$250.5 million (HK$1,949.6 million)
in the first half of 2010.
Capitalized terms used but not defined herein shall
have the meanings ascribed to them in our 2010 Annual
Report.
Note: The translation of US$ amounts into HK$ amounts has been
made at the rate of US$1.00 to HK$7.7827 (six months ended
June 30, 2010: US$1.00 to HK$7.7827) for the purposes of
illustration only.
Adjusted EBITDA (US$ in millions)
32.0%
$800 32%
$755
. 2%
36 Increase
$650 29%
28.0% $554
$500 26%
$350 23%
20%
$200
1H 2010 1H 2011
Adjusted EBITDA
Adjusted EBITDA
as a % of
Net Revenues
Net Revenues (US$ in millions)
$2,500 $2,361
$2,200 . 2%
19 Increase
$1,981
$1,900
$1,600
$1,300
$1,000
1H 2010 1H 2011
Profit (US$ in millions)
24%
$600 22.9%
$540
20%
$500
. 4%
115 Increase 16%
$400
12.6%
$300 12%
$251
$200 8%
$100 4%
$0 0%
1H 2010 1H 2011
Profit
Profit as a % of
Net Revenues
Interim Report 2011
2. Management Discussion and Analysis
2.1 Results of Operations
The Board of Directors (the “Board”) of Sands China Ltd. (“we” or our “Company”) is pleased to present the
Net Revenues
Our net revenues consisted of the following:
Six months ended June 30,
2011 2010 Percent change
(US$ in millions, except percentages)
Casino 2,083.6 1,768.5 17.8%
Rooms 86.7 67.5 28.4%
Food and beverage 38.8 34.9 11.2%
Mall 69.0 54.5 26.6%
Convention, ferry, retail and other 82.7 55.1 50.1%
Total net revenues 2,360.8 1,980.5 19.2%
Net revenues were US$2,360.8 million for the six months ended June 30, 2011, an increase of US$380.3 million, or 19.2%, compared to US$1,980.5 million for the six months ended June 30, 2010. Net revenues increased in all segments, driven by strong visitation resulting in part from continuous efforts in marketing, a stable macroeconomic environment in China, as well as management’s focus on driving the high-margin mass market gaming segment, while continuing to provide luxury amenities and high service levels to our VIP premium and junket players.
unaudited consolidated results of the Company and its subsidiaries (the “Group”) for the six months ended June 30, 2011 compared to the six months ended June 30, 2010.
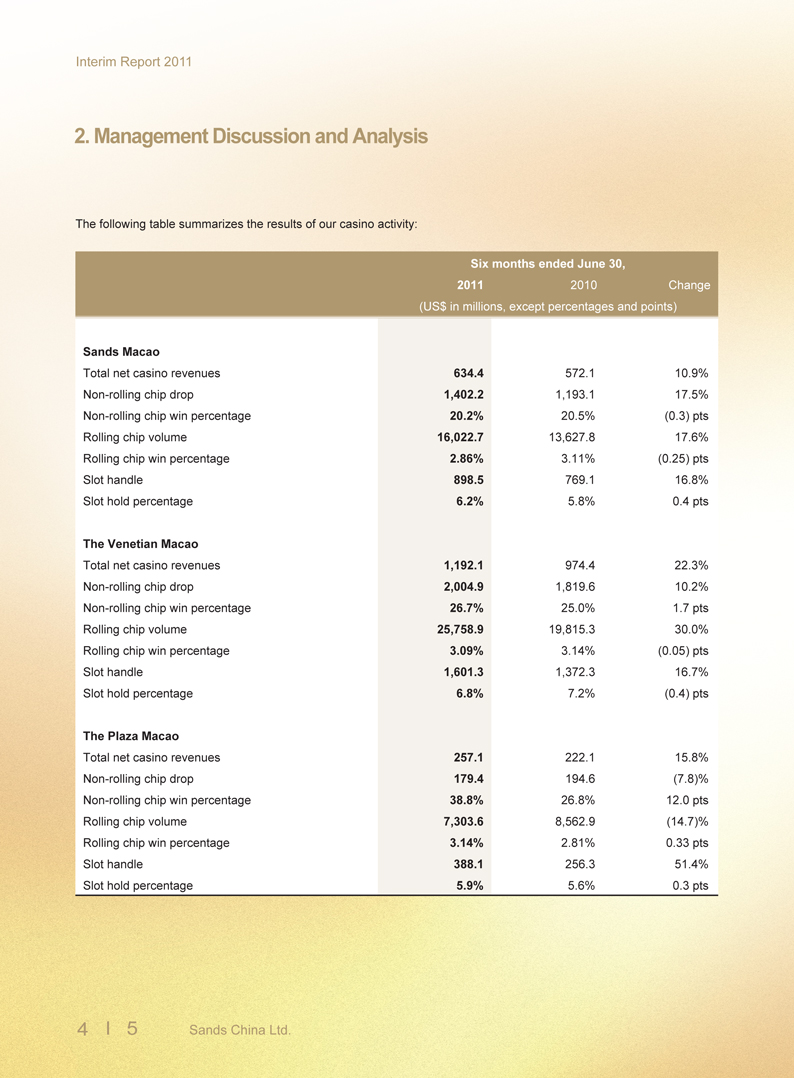
Our net casino revenues for the six months ended June 30, 2011 were US$2,083.6 million, an increase of US$315.1 million, or 17.8%, compared to US$1,768.5 million for the six months ended June 30, 2010. Net casino revenues of the Sands Macao, The Venetian Macao and The Plaza Macao increased by US$62.3 million, US$217.7 million and US$35.0 million respectively, due to the factors mentioned above.
Interim Report 2011
2. Management Discussion and Analysis
The following table summarizes the results of our casino activity:
Six months ended June 30,
2011 2010 Change
(US$ in millions, except percentages and points)
Sands Macao
Total net casino revenues 634.4 572.1 10.9%
Non-rolling chip drop 1,402.2 1,193.1 17.5%
Non-rolling chip win percentage 20.2% 20.5% (0.3) pts
Rolling chip volume 16,022.7 13,627.8 17.6%
Rolling chip win percentage 2.86% 3.11% (0.25) pts
Slot handle 898.5 769.1 16.8%
Slot hold percentage 6.2% 5.8% 0.4 pts
The Venetian Macao
Total net casino revenues 1,192.1 974.4 22.3%
Non-rolling chip drop 2,004.9 1,819.6 10.2%
Non-rolling chip win percentage 26.7% 25.0% 1.7 pts
Rolling chip volume 25,758.9 19,815.3 30.0%
Rolling chip win percentage 3.09% 3.14% (0.05) pts
Slot handle 1,601.3 1,372.3 16.7%
Slot hold percentage 6.8% 7.2% (0.4) pts
The Plaza Macao
Total net casino revenues 257.1 222.1 15.8%
Non-rolling chip drop 179.4 194.6 (7.8)%
Non-rolling chip win percentage 38.8% 26.8% 12.0 pts
Rolling chip volume 7,303.6 8,562.9 (14.7)%
Rolling chip win percentage 3.14% 2.81% 0.33 pts
Slot handle 388.1 256.3 51.4%
Slot hold percentage 5.9% 5.6% 0.3 pts
4 5 Sands China Ltd.
Interim Report 2011
2. Management Discussion and Analysis
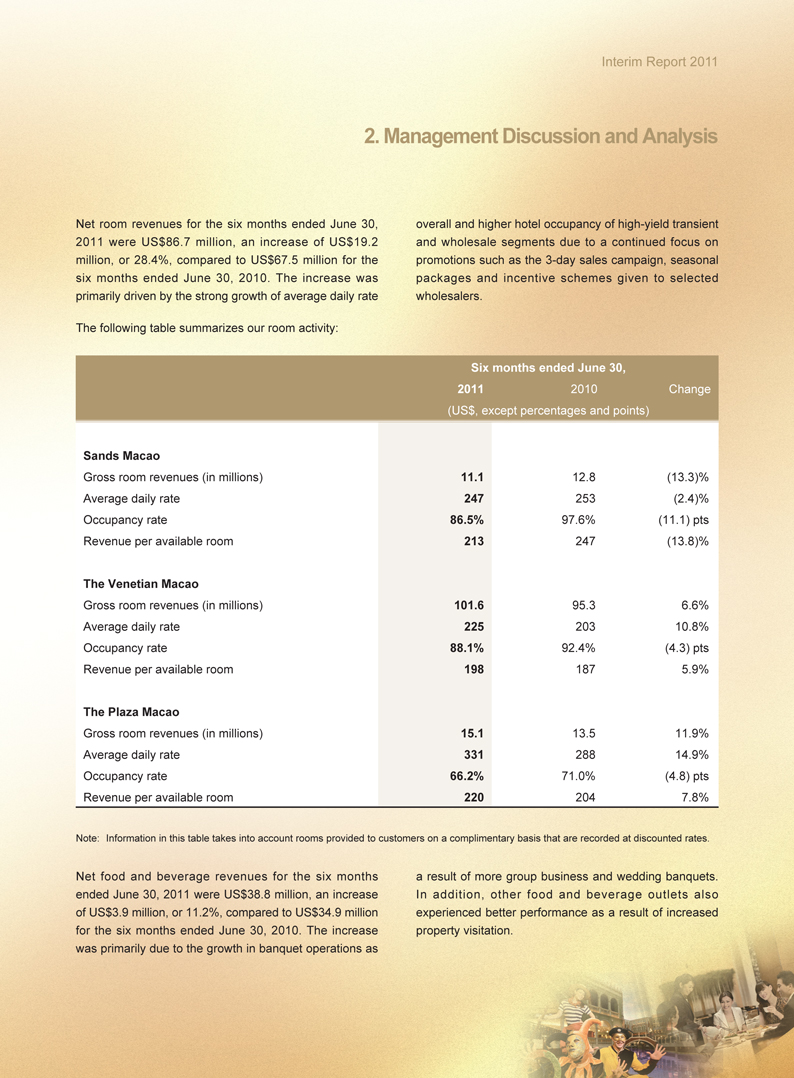
Net room revenues for the six months ended June 30, 2011 were US$86.7 million, an increase of US$19.2 million, or 28.4%, compared to US$67.5 million for the six months ended June 30, 2010. The increase was primarily driven by the strong growth of average daily rate
The following table summarizes our room activity:
Six months ended June 30,
2011 2010 Change
(US$, except percentages and points)
Sands Macao
Gross room revenues (in millions) 11.1 12.8 (13.3)%
Average daily rate 247 253 (2.4)%
Occupancy rate 86.5% 97.6% (11.1) pts
Revenue per available room 213 247 (13.8)%
The Venetian Macao
Gross room revenues (in millions) 101.6 95.3 6.6%
Average daily rate 225 203 10.8%
Occupancy rate 88.1% 92.4% (4.3) pts
Revenue per available room 198 187 5.9%
The Plaza Macao
Gross room revenues (in millions) 15.1 13.5 11.9%
Average daily rate 331 288 14.9%
Occupancy rate 66.2% 71.0% (4.8) pts
Revenue per available room 220 204 7.8%
Note: Information in this table takes into account rooms provided to customers on a complimentary basis that are recorded at discounted rates.
Net food and beverage revenues for the six months ended June 30, 2011 were US$38.8 million, an increase of US$3.9 million, or 11.2%, compared to US$34.9 million for the six months ended June 30, 2010. The increase was primarily due to the growth in banquet operations as
overall and higher hotel occupancy of high-yield transient and wholesale segments due to a continued focus on promotions such as the 3-day sales campaign, seasonal packages and incentive schemes given to selected wholesalers.
a result of more group business and wedding banquets. In addition, other food and beverage outlets also experienced better performance as a result of increased property visitation.
Interim Report 2011
2. Management Discussion and Analysis
Mall revenues for the six months ended June 30, 2011 were US$69.0 million, an increase of US$14.5 million, or 26.6%, compared to US$54.5 million for the six months ended June 30, 2010. The increase was primarily due to higher turnover rent.
Net convention, ferry, retail and other revenues for the six months ended June 30, 2011 were US$82.7 million,
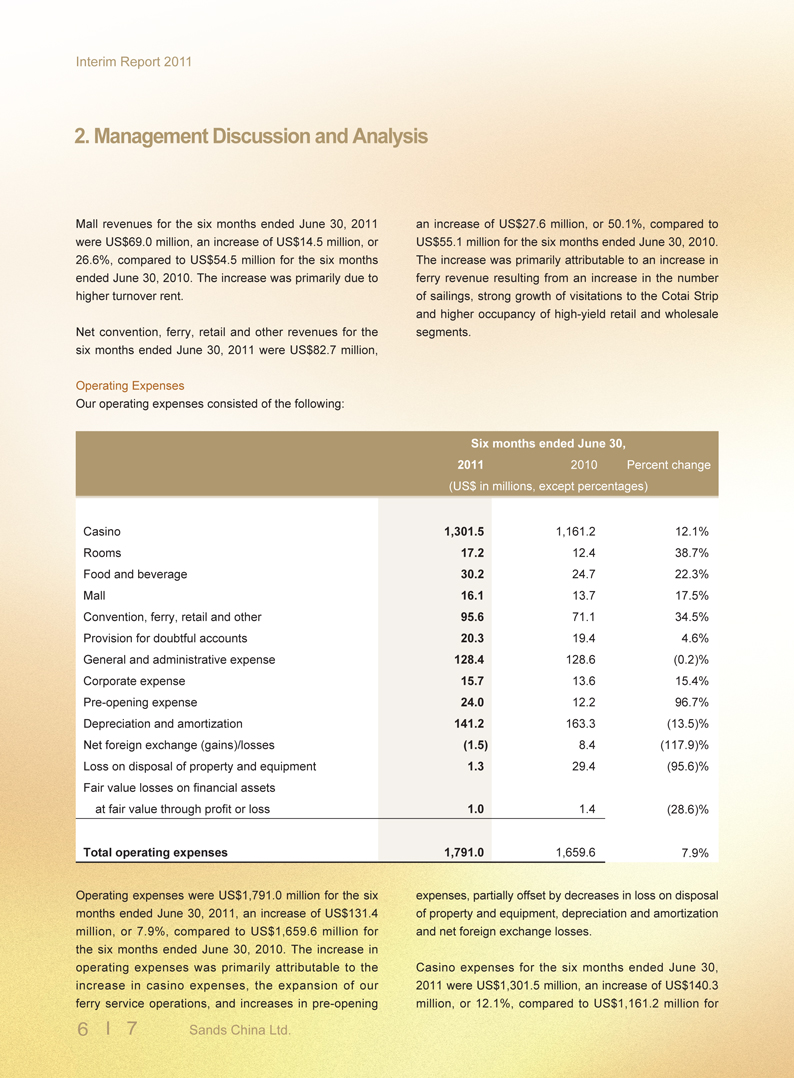
Operating Expenses
Our operating expenses consisted of the following:
Six months ended June 30,
2011 2010 Percent change
(US$ in millions, except percentages)
Casino 1,301.5 1,161.2 12.1%
Rooms 17.2 12.4 38.7%
Food and beverage 30.2 24.7 22.3%
Mall 16.1 13.7 17.5%
Convention, ferry, retail and other 95.6 71.1 34.5%
Provision for doubtful accounts 20.3 19.4 4.6%
General and administrative expense 128.4 128.6 (0.2)%
Corporate expense 15.7 13.6 15.4%
Pre-opening expense 24.0 12.2 96.7%
Depreciation and amortization 141.2 163.3 (13.5)%
Net foreign exchange (gains)/losses (1.5) 8.4 (117.9)%
Loss on disposal of property and equipment 1.3 29.4 (95.6)%
Fair value losses on financial assets
at fair value through profit or loss 1.0 1.4 (28.6)%
Total operating expenses 1,791.0 1,659.6 7.9%
Operating expenses were US$1,791.0 million for the six months ended June 30, 2011, an increase of US$131.4 million, or 7.9%, compared to US$1,659.6 million for the six months ended June 30, 2010. The increase in operating expenses was primarily attributable to the increase in casino expenses, the expansion of our ferry service operations, and increases in pre-opening
an increase of US$27.6 million, or 50.1%, compared to US$55.1 million for the six months ended June 30, 2010. The increase was primarily attributable to an increase in ferry revenue resulting from an increase in the number of sailings, strong growth of
visitations to the Cotai Strip and higher occupancy of high-yield retail and wholesale segments.
expenses, partially offset by decreases in loss on disposal of property and equipment, depreciation and amortization and net foreign exchange losses.
Casino expenses for the six months ended June 30, 2011 were US$1,301.5 million, an increase of US$140.3 million, or 12.1%, compared to US$1,161.2 million for
6 7 Sands China Ltd.
Interim Report 2011
2. Management Discussion and Analysis
the six months ended June 30, 2010. The increase was primarily due to the increase in total gaming tax as a result of increased gaming revenues.
Room expenses for the six months ended June 30, 2011 were US$17.2 million, an increase of US$4.8 million, or 38.7%, compared to US$12.4 million for the six months ended June 30, 2010. The increase is mainly driven by increases in payroll expenses and travel agent commissions as a result of increased room revenues, increased payroll rate and increased occupancy in high-yield transient and wholesale segments.
Food and beverage expenses for the six months ended June 30, 2011 were US$30.2 million, an increase of US$5.5 million, or 22.3%, compared to US$24.7 million for the six months ended June 30, 2010. The increase was primarily driven by increases in payroll expenses and cost of sales as a result of increased food and beverage revenues and increased payroll rate.
Mall expenses for the six months ended June 30, 2011 were US$16.1 million, an increase of US$2.4 million, or 17.5%, compared to US$13.7 million for the six months ended June 30, 2010. The increase was primarily attributable to increases in payroll expenses and repair and maintenance expenses as a result of increased payroll rate and increased mall business volume and revenues.
Convention, ferry, retail and other expenses for the six months ended June 30, 2011 were US$95.6 million, an increase of US$24.5 million, or 34.5%, compared to US$71.1 million for the six months ended June 30, 2010. The increase was primarily attributable to an increase in ferry expenses due to an increased number of sailings, partially offset by a decrease in entertainment events expenses mainly for Cotai Arena at The Venetian Macao.
General and administrative expenses were US$128.4 million for the six months ended June 30, 2011, a decrease of US$0.2 million, or 0.2%, compared to
US$128.6 million for the six months ended June 30, 2010. Management continued to focus on driving operational efficiencies throughout the various properties. The decrease in expense from savings was partially offset by an increase in payroll expenses as a result of increased payroll rate.
Corporate expenses were US$15.7 million for the six months ended June 30, 2011, an increase of US$2.1 million, or 15.4%, compared to US$13.6 million for the six months ended June 30, 2010. The increase was mainly driven by increases in legal and management fees.
Pre-opening expenses were US$24.0 million for the six months ended June 30, 2011, an increase of US$11.8 million, or 96.7%, compared to US$12.2 million for the six months ended June 30, 2010. The increase in pre-opening expenses was primarily related to costs associated with Sands Cotai Central (formerly known as Parcels 5 and 6), as we recommenced construction activities and prepared the property to open.
Depreciation and amortization expense was US$141.2 million for the six months ended June 30, 2011, a decrease of US$22.1 million, or 13.5%, compared to US$163.3 million for the six months ended June 30, 2010. The decrease was primarily due to the full depreciation of some assets during the six months ended June 30, 2011.
Net foreign exchange gains for the six months ended June 30, 2011 were US$1.5 million, primarily associated with US$ denominated debt held in Macao. This compares with net foreign exchange losses of US$8.4 million for the six months ended June 30, 2010.
Loss on disposal of property and equipment was US$1.3 million for the six months ended June 30, 2011, a decrease of US$28.1 million or 95.6% compared to US$29.4 million for the six months ended June 30, 2010. The decrease was primarily related to disposition of construction materials from construction sites at Sands Cotai Central during the six months ended June 30, 2010.
Interim Report 2011
2. Management Discussion and Analysis
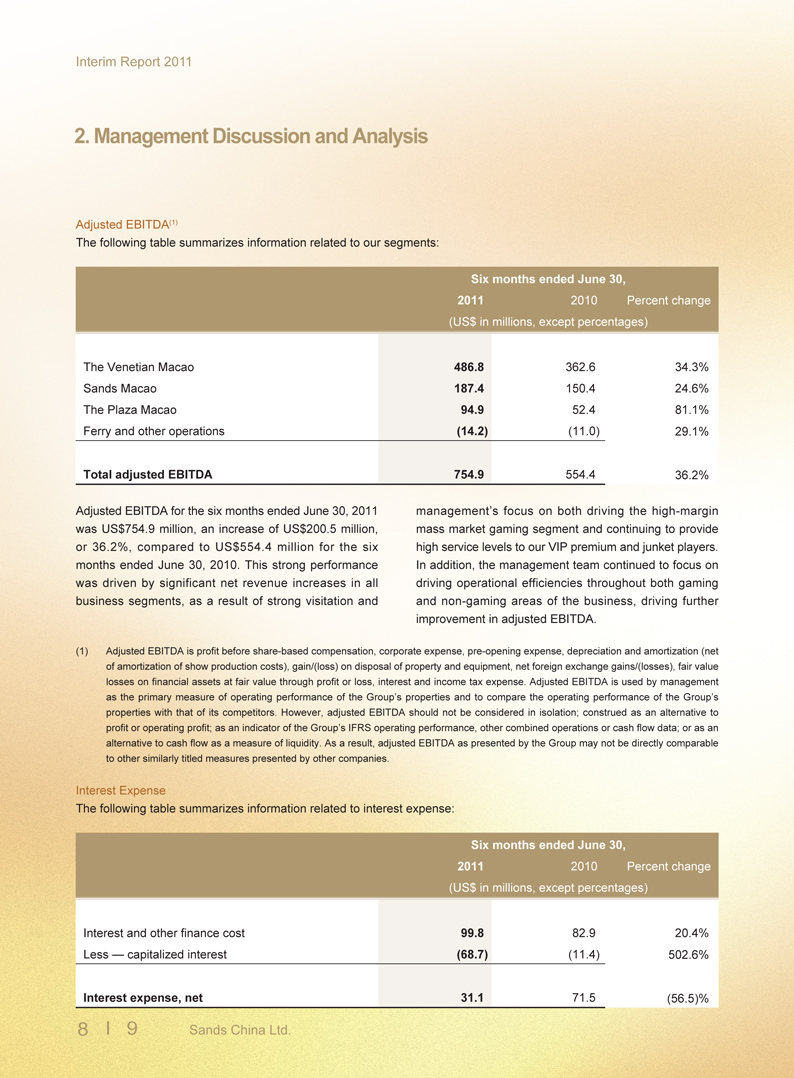
Adjusted EBITDA(1)
The following table summarizes information related to our segments:
Six months ended June 30,
2011 2010 Percent change
(US$ in millions, except percentages)
The Venetian Macao 486.8 362.6 34.3%
Sands Macao 187.4 150.4 24.6%
The Plaza Macao 94.9 52.4 81.1%
Ferry and other operations (14.2) (11.0) 29.1%
Total adjusted EBITDA 754.9 554.4 36.2%
Adjusted EBITDA for the six months ended June 30, 2011 was US$754.9 million, an increase of US$200.5 million, or 36.2%, compared to US$554.4 million for the six months ended June 30, 2010. This strong performance was driven by significant net revenue increases in all business segments, as a result of strong visitation and
management’s focus on both driving the high-margin mass market gaming segment and continuing to provide high service levels to our VIP premium and junket players. In addition, the management team continued to focus on driving operational efficiencies throughout both gaming and non-gaming areas of the business, driving further improvement in adjusted EBITDA.
(1) Adjusted EBITDA is profit before share-based compensation, corporate expense, pre-opening expense, depreciation and amortization (net of amortization of show production costs), gain/(loss) on disposal of property and equipment, net foreign exchange gains/(losses), fair value losses on financial assets at fair value through profit or loss, interest and income tax expense. Adjusted EBITDA is used by management
as the primary measure of operating performance of the Group’s properties and to compare the operating performance of the Group’s
properties with that of its competitors. However, adjusted EBITDA should not be considered in isolation; construed as an alternative to profit or operating profit; as an indicator of the Group’s IFRS operating performance, other combined operations or cash flow data; or as an alternative to cash flow as a measure of liquidity. As a result, adjusted EBITDA as presented by the Group may not be directly comparable
to other similarly titled measures presented by other companies.
Interest Expense
The following table summarizes information related to interest expense:
Six months ended June 30,
2011 2010 Percent change
(US$ in millions, except percentages)
Interest and other finance cost 99.8 82.9 20.4%
Less — capitalized interest (68.7) (11.4) 502.6%
Interest expense, net 31.1 71.5 (56.5)%
8 9 Sands China Ltd.
Interim Report 2011
2. Management Discussion and Analysis
Interest and other finance cost for the six months ended June 30, 2011 was US$99.8 million, an increase of US$16.9 million, or 20.4%, compared to US$82.9 million for the six months ended June 30, 2010. The increase was a result of an increase in total outstanding borrowings primarily for the development of Sands Cotai Central. The US$57.3 million increase in capitalized interest was primarily due to the recommencement of construction activities at Sands Cotai Central in May 2010.
Profit for the Period
Profit for the six months ended June 30, 2011 was US$539.5 million, an increase of US$289.0 million, or
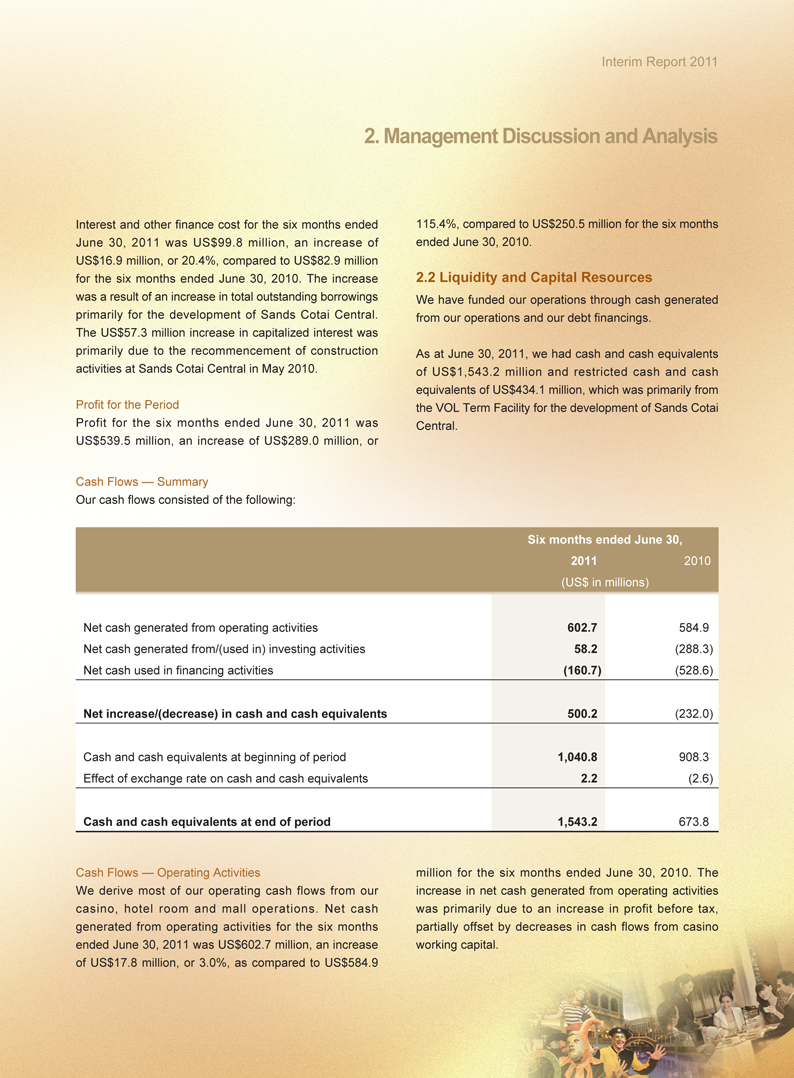
Cash Flows — Summary
Our cash flows consisted of the following:
115.4%, compared to US$250.5 million for the six months ended June 30, 2010.
2.2 Liquidity and Capital Resources
We have funded our operations through cash generated from our operations and our debt financings.
As at June 30, 2011, we had cash and cash equivalents of US$1,543.2 million and restricted cash and cash equivalents of US$434.1 million, which was primarily from the VOL Term Facility for the development of Sands Cotai Central.
Six months ended June 30,
2011 2010
(US$ in millions)
Net cash generated from operating activities 602.7 584.9
Net cash generated from/(used in) investing activities 58.2 (288.3)
Net cash used in financing activities (160.7) (528.6)
Net increase/(decrease) in cash and cash equivalents 500.2 (232.0)
Cash and cash equivalents at beginning of period 1,040.8 908.3
Effect of exchange rate on cash and cash equivalents 2.2 (2.6)
Cash and cash equivalents at end of period 1,543.2 673.8
Cash Flows — Operating Activities
We derive most of our operating cash flows from our casino, hotel room and mall operations. Net cash generated from operating activities for the six months ended June 30, 2011 was US$602.7 million, an increase of US$17.8 million, or 3.0%, as compared to US$584.9
million for the six months ended June 30, 2010. The increase in net cash generated from operating activities was primarily due to an increase in profit before tax, partially offset by decreases in cash flows from casino working capital.
Interim Report 2011
2. Management Discussion and Analysis
Cash Flows — Investing Activities
Net cash generated from investing activities for the six months ended June 30, 2011 was US$58.2 million, which primarily consisted of a decrease of US$343.9 million in restricted cash and cash equivalents, offset by capital expenditures of US$291.9 million. Capital expenditures include US$278.8 million for Sands Cotai Central and US$13.2 million for our operations mainly at the Sands Macao, The Venetian Macao and The Plaza Macao.
Cash Flows — Financing Activities
For the six months ended June 30, 2011, net cash flows used in financing activities were US$160.7 million, primarily attributable to US$42.5 million for repayment of borrowings under our credit facilities, US$96.4 million for payment of interest, and US$23.0 million for payment of finance lease liabilities.
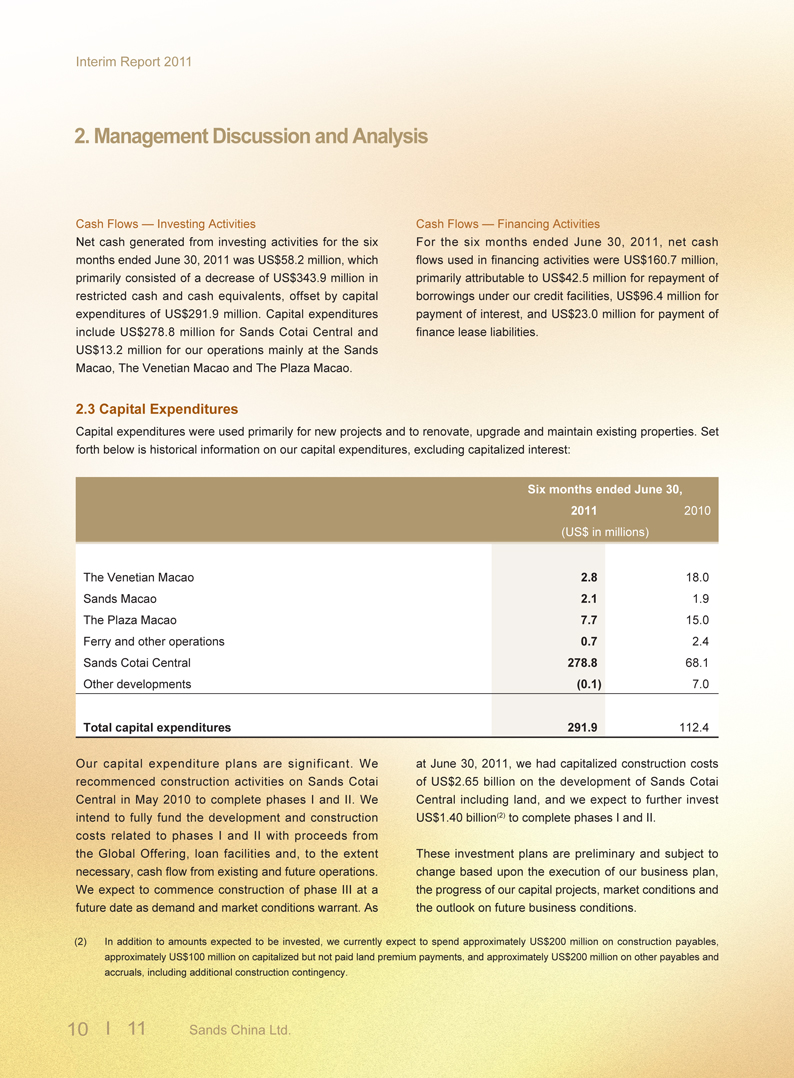
2.3 Capital Expenditures
Capital expenditures were used primarily for new projects and to renovate, upgrade and maintain existing properties. Set forth below is historical information on our capital expenditures, excluding capitalized interest:
Six months ended June 30,
2011 2010
(US$ in millions)
The Venetian Macao 2.8 18.0
Sands Macao 2.1 1.9
The Plaza Macao 7.7 15.0
Ferry and other operations 0.7 2.4
Sands Cotai Central 278.8 68.1
Other developments (0.1) 7.0
Total capital expenditures 291.9 112.4
Our capital expenditure plans are significant. We recommenced construction activities on Sands Cotai Central in May 2010 to complete phases I and II. We intend to fully fund the development and construction costs related to phases I and II with proceeds from the Global Offering, loan facilities and, to the extent necessary, cash flow from existing and future operations. We expect to commence construction of phase III at a future date as demand and market conditions warrant. As
at June 30, 2011, we had capitalized construction costs of US$2.65 billion on the development of Sands Cotai Central including land, and we expect to further invest US$1.40 billion(2) to complete phases I and II.
These investment plans are preliminary and subject to change based upon the execution of our business plan, the progress of our capital projects, market conditions and the outlook on future business conditions.
(2) In addition to amounts expected to be invested, we currently expect to spend approximately US$200 million on construction payables,
approximately US$100 million on capitalized but not paid land premium payments, and approximately US$200 million on other payables and
accruals, including additional construction contingency.
10 11 Sands China Ltd.
Interim Report 2011
2. Management Discussion and Analysis
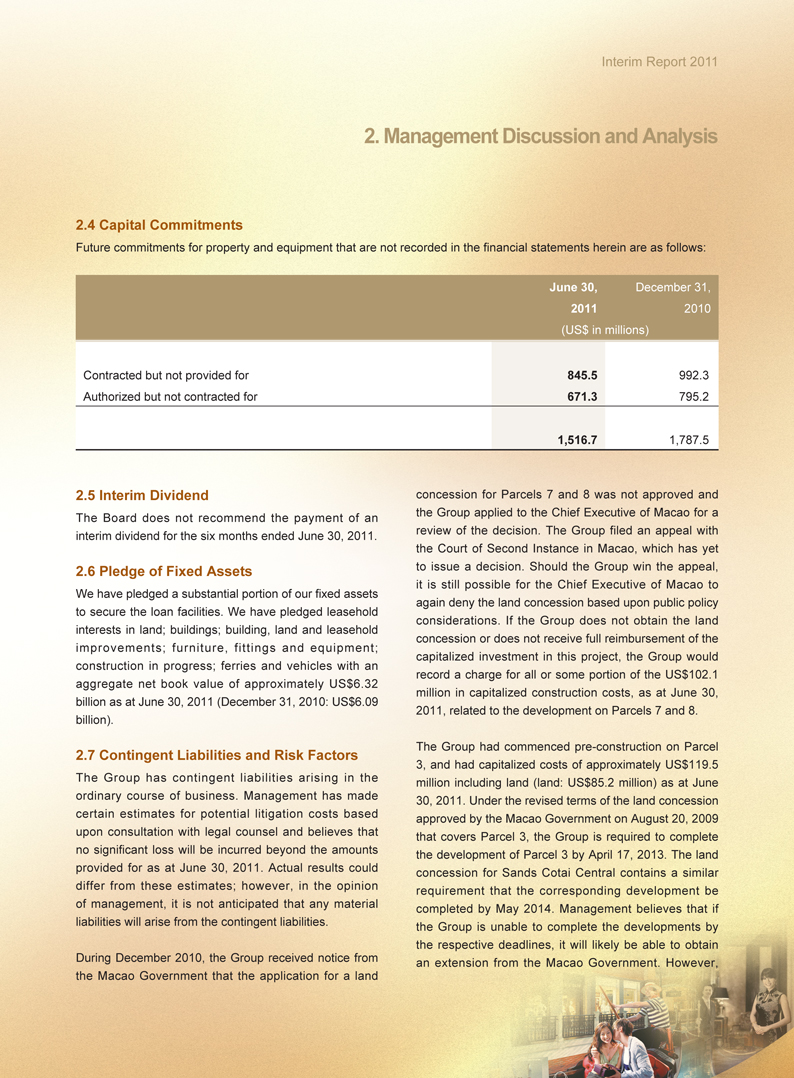
2.4 Capital Commitments
Future commitments for property and equipment that are not recorded in the financial statements herein are as follows:
June 30, December 31,
2011 2010
(US$ in millions)
Contracted but not provided for 845.5 992.3
Authorized but not contracted for 671.3 795.2
1,516.7 1,787.5
2.5 Interim Dividend
The Board does not recommend the payment of an interim dividend for the six months ended June 30, 2011.
2.6 Pledge of Fixed Assets
We have pledged a substantial portion of our fixed assets to secure the loan facilities. We have pledged leasehold interests in land; buildings; building, land and leasehold improvements; furniture, fittings and equipment; construction in progress; ferries and vehicles with an aggregate net book value of approximately US$6.32 billion as at June 30, 2011 (December 31, 2010: US$6.09 billion).
2.7 Contingent Liabilities and Risk Factors
The Group has contingent liabilities arising in the ordinary course of business. Management has made certain estimates for potential litigation costs based upon consultation with legal counsel and believes that no significant loss will be incurred beyond the amounts provided for as at June 30, 2011. Actual results could differ from these estimates; however, in the opinion of management, it is not anticipated that any material liabilities will arise from the contingent liabilities.
During December 2010, the Group received notice from the Macao Government that the application for a land
concession for Parcels 7 and 8 was not approved and the Group applied to the Chief Executive of Macao for a review of the decision. The Group filed an appeal with the Court of Second Instance in Macao, which has yet to issue a decision. Should the Group win the appeal, it is still possible for the Chief Executive of Macao to again deny the land concession based upon public policy considerations. If the Group does not obtain the land concession or does not receive full reimbursement of the capitalized investment in this project, the Group would record a charge for all or some portion of the US$102.1 million
in capitalized construction costs, as at June 30, 2011, related to the development on Parcels 7 and 8.
The Group had commenced pre-construction on Parcel 3, and had capitalized costs of approximately US$119.5 million including land (land: US$85.2 million) as at June 30, 2011. Under the revised terms of the land concession approved by the Macao Government on August 20, 2009 that covers Parcel 3, the Group is required to complete the development of Parcel 3 by April 17, 2013. The land concession for Sands Cotai Central contains a similar requirement that the corresponding development be completed by May 2014. Management believes that if the Group is unable to complete the developments by the respective deadlines, it will likely be able to obtain an extension from the Macao Government. However,
Interim Report 2011
2. Management Discussion and Analysis
no assurances can be given that an extension will be granted. If the Group is not able to meet the deadlines and those deadlines are not extended, the Macao Government has the right to unilaterally terminate the land concessions and the Group could lose its investment in, and right to operate, any properties developed under the land concessions for Parcel 3 and Sands Cotai Central without compensation to the Group.
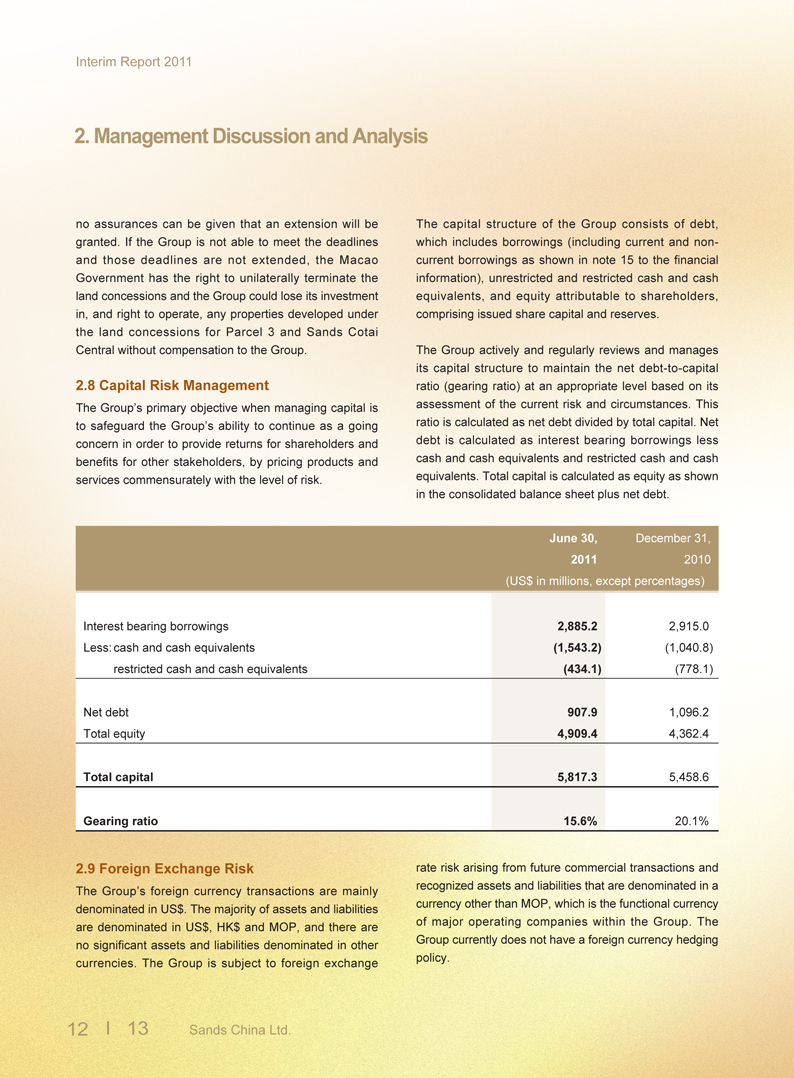
2.8 Capital Risk Management
The Group’s primary objective when managing capital is to safeguard the Group’s ability to continue as a going concern in order to provide returns for shareholders and benefits for other stakeholders, by pricing products and services commensurately with the level of risk.
June 30, December 31,
2011 2010
(US$ in millions, except percentages)
Interest bearing borrowings 2,885.2 2,915.0
Less: cash and cash equivalents (1,543.2) (1,040.8)
restricted cash and cash equivalents (434.1) (778.1)
Net debt 907.9 1,096.2
Total equity 4,909.4 4,362.4
Total capital 5,817.3 5,458.6
Gearing ratio 15.6% 20.1%
2.9 Foreign Exchange Risk
The Group’s foreign currency transactions are mainly denominated in US$. The majority of assets and liabilities are denominated in US$, HK$ and MOP, and there are no significant assets and liabilities denominated in other currencies. The Group is subject to foreign exchange
The capital structure of the Group consists of debt, which includes borrowings (including current and non-current borrowings as shown in note 15 to the financial information), unrestricted and restricted cash and cash equivalents, and equity attributable to shareholders, comprising issued share capital and reserves.
The Group actively and regularly reviews and manages its capital structure to maintain the net debt-to-capital ratio (gearing ratio) at an appropriate level based on its assessment of the current risk and circumstances. This ratio is calculated as net debt divided by total capital. Net debt is calculated as interest bearing borrowings less cash and cash
equivalents and restricted cash and cash equivalents. Total capital is calculated as equity as shown in the consolidated balance sheet plus net debt.
rate risk arising from future commercial transactions and recognized assets and liabilities that are denominated in a currency other than MOP, which is the functional currency of major operating companies within the Group. The Group currently does not have a foreign currency hedging policy.
12 13 Sands China Ltd.
Interim Report 2011
2. Management Discussion and Analysis
2.10 Business Review and Prospects
Our business strategy is to continue to successfully execute our Cotai Strip developments and to leverage our integrated resort business model to create Asia’s premier gaming, leisure and convention destination. The Company continues to execute on the strategies outlined in our 2010 Annual Report. These strategies have proven to be successful in the first half of 2011 and we are confi dent they will continue to be so throughout the rest of the year.
We are making solid progress on the development of our integrated resort on Parcels 5 and 6 on Cotai, which on August 5, 2011 we officially branded Sands Cotai Central. The Company is completing the construction of this integrated resort development in phases. Upon completion of phases I and II of the project, Sands Cotai Central is expected to feature approximately 5,800 hotel rooms, approximately 300,000 square feet of gaming space, approximately 1.2 million square feet of retail, entertainment and dining facilities, exhibition and conference facilities and a multipurpose theater.
Phase I of the project is expected to include two hotel towers, one of which will be managed by Sheraton International Inc. and Sheraton Overseas Management Co. (collectively “Starwood”) under its Sheraton brand, as well as completion of the structural work of an adjacent hotel tower to be managed by Starwood under its Sheraton Towers brand. The second hotel tower was to be managed by Shangri-La International Hotel Management Limited (“Shangri-La”); however, in March 2011, the Company and Shangri-La mutually agreed to terminate the hotel management agreement. This second hotel tower will now be managed by Hilton Worldwide and IHG (InterContinental Hotels Group) under their Conrad and Holiday Inn brands respectively.
The Company’s anticipated opening of phase I of Sands Cotai Central will be progressive starting in the first
quarter of 2012 with the opening of parcel 5, which will feature approximately 600 five-star Conrad rooms and suites along with approximately 1,200 four-star Holiday Inn rooms and suites. Parcel 5 will also open with a variety of retail offerings, more than 300,000 square feet of meeting space, several food and beverage establishments along with the approximately 106,000 square foot casino and VIP gaming areas. Phase I also includes the opening of the first hotel tower on parcel 6, which will feature approximately 2,000 Sheraton-branded rooms, along with the second casino and the remaining dining, entertainment, retail and meeting facilities, and is currently scheduled to open in the third quarter of 2012.
Phase II of the project, consisting of the second hotel tower on parcel 6, which will feature approximately 2,000 additional rooms and suites under the Sheraton Towers brand, is projected to open in early 2013. We expect to further invest US$1.4 billion(3) to complete phases I and II.
Phase III of the project is expected to include a fourth hotel and mixed-use tower to be managed by Starwood under its St. Regis brand and the total cost is expected to be approximately US$450 million. The Company intends to commence construction of phase III of the project as demand and market conditions warrant it.
On July 27, 2011, the Board was pleased to approve and announce the promotion of Mr. Edward Matthew Tracy to the position of President and Chief Executive Officer. Mr. Tracy served as the President and Chief Operating Officer of the Company from July 27, 2010 until July 27, 2011 and served as a special advisor on the Parcels 5 and 6 Capital Expenditure Committee from March 1, 2011 until July 27, 2011. Mr. Tracy has over twenty years of hands on management and development experience in the gaming and hospitality industry and we are confident in his ability to provide stability and deliver growth for the Company.
(3) In addition to amounts expected to be invested, we currently expect to spend approximately US$200 million on construction payables,
approximately US$100 million on capitalized but not paid land premium payments, and approximately US$200 million on other payables and
accruals, including additional construction contingency.

Interim Report 2011
3. Corporate Governance
3.1 Human Resources
As at June 30, 2011, our team member profile was as follows:
Number of full-time team members: 15,322
Average age: 37
Average years of service: 3.97
Gender Ratio: Male 45.82%
Female 54.18%
Number of nationalities in management team: 36
Total number of nationalities: 51
Save as disclosed in this 2011 Interim Report, there have been no material changes to the information disclosed in
the 2010 Annual Report in respect of the remuneration of
the employees, remuneration policies, bonus and share
option schemes and staff development.
3.2 Environment
We recognize the impact our business has on the environment and we continue to strive to achieve the goals we have set ourselves in the areas of resource conservation and reducing our environmental foot print. We encourage and are grateful to those Shareholders who have elected to receive our annual and interim reports via electronic means, thereby reducing the need to print hard copies of our reports. Should you wish to start receiving an electronic copy of our annual and interim reports, please refer to page 50 of this report for more information.
To minimize the impact on our environment, this 2011 Interim Report is printed on recycled paper using soy based inks.
3.3 Corporate Governance Practices
The Company is committed to achieving and maintaining a sensible framework in the interests of monitoring the highest standards of corporate governance to safeguard the interests of shareholders and to enhance corporate value and accountability. In the Corporate Governance Report of April 13, 2011, which was published in our 2010 Annual Report, we reported that the Company has devised its own corporate governance principles and guidelines, which not only incorporate most of the
policies, principles and practices set out in the Code on Corporate Governance Practices (the “CG Code”) contained in Appendix 14 of the Rules Governing the Listing of
Securities (the “Listing Rules”) on The Stock Exchange of Hong Kong Limited (the “Stock Exchange”), but also incorporates corporate governance best practices.
Except as disclosed below, the Company has fully complied with all the code provisions and certain recommended best practices set out in the CG Code throughout the six months ended June 30, 2011.
3.4 Code Provision
Code Provision D.1.2
Under code provision D.1.2 of the CG Code, functions reserved to the board and those delegated to the management should be formalized and periodic review should be conducted to ensure those arrangements remain appropriate to the needs of the Company. As noted in our 2010 Annual Report, such functions were formalized and adopted on March 1, 2011.
Code Provision D.2.1
Under code provision D.2.1 of the CG Code, board committees should be formed with specific terms of reference that deal clearly with the committee’s authority and duties. The Company formed the CEO Search Committee and the Transitional Advisory Committee on July 27, 2010, shortly after the removal of Mr. Steven Jacobs as the Company’s Chief Executive Officer, President and Executive Director. Written terms of reference for these two committees were not established at that time although the committees were provided with a clear mandate from the Board. These two committees functioned as advisory committees only and had no delegated powers or decision making authority from the Board. The CEO Search Committee and Transitional Advisory Committee were dissolved on February 14, 2011.
3.5 Model Code for Securities Transactions
As reported on page 56 of our 2010 Annual Report, the Company has devised its own securities trading code for securities transactions (the “Company Code”) by the Directors and relevant employees who are likely to be
14 15 Sands China Ltd.
Interim Report 2011
3. Corporate Governance
in possession of unpublished price-sensitive information of the Company on terms no less exacting than the Model Code for Securities Transactions by Directors of Listed Issuers as set out in Appendix 10 of the Listing Rules (the “Model Code”). Following specific enquiry by the Company, all Directors have confirmed that they have complied with the required standard set out in the Company Code during the six months ended June 30, 2011.
3.6 Board and Board Committees Composition
There were no changes to the composition of the Board during the first half of 2011; however, on July 27, 2011 the following changes were made:
Mr. Edward Matthew Tracy, the Company’s President and Chief Executive Officer from July 27, 2011, and the President and Chief Operating Officer from July 27, 2010 to July 27, 2011, was appointed an Executive Director with effect from July 27, 2011. As an Executive Director, Mr. Tracy does not receive any emoluments for his position on the Board and his appointment is not governed by a service contract. Mr. Tracy will serve as an Executive Director of the Company for an initial term of three years; however, he is subject to retirement by rotation and re-election at the annual general meeting of the Company in accordance with the articles of association of the Company.
Mr. Lau Wong William was appointed as a Non-Executive Director of the Company with effect from July 27, 2011. As a Non-Executive Director, Mr. Lau will receive directors’ fees amounting to US$75,000 per annum. The emoluments of Mr. Lau are determined by the Board with reference to his duties and responsibilities with the Company and the Company’s remuneration policy and are subject to review by the Remuneration Committee from time to time. His emoluments are covered by the letter of appointment issued by the Company and any subsequent revision approved by the Board. Mr. Lau was appointed for an initial term of three years commencing from July 27, 2011. He is subject to retirement by rotation and re-election at the annual general meeting of the Company in accordance with the articles of association of the Company.
Mr. Michael Alan Leven, the Company’s Acting Chief Executive Officer from July 23, 2010 until July 27, 2011, a Special Advisor to the Board from October 14, 2009 until July 27, 2010 and an Executive Director of the Company from July 27, 2010 until July 27, 2011, was redesignated as Non-Executive Director of the Company with effect from July 27, 2011. Mr. Leven will serve as a Non-Executive Director of the Company for a term of two years, and is subject to retirement by rotation and reelection at the annual general meeting of the Company in accordance with the articles of association of the Company. Mr. Leven will not receive any director’s fees/ emoluments for services provided to the Company in his capacity as a Non-Executive Director of the Company.
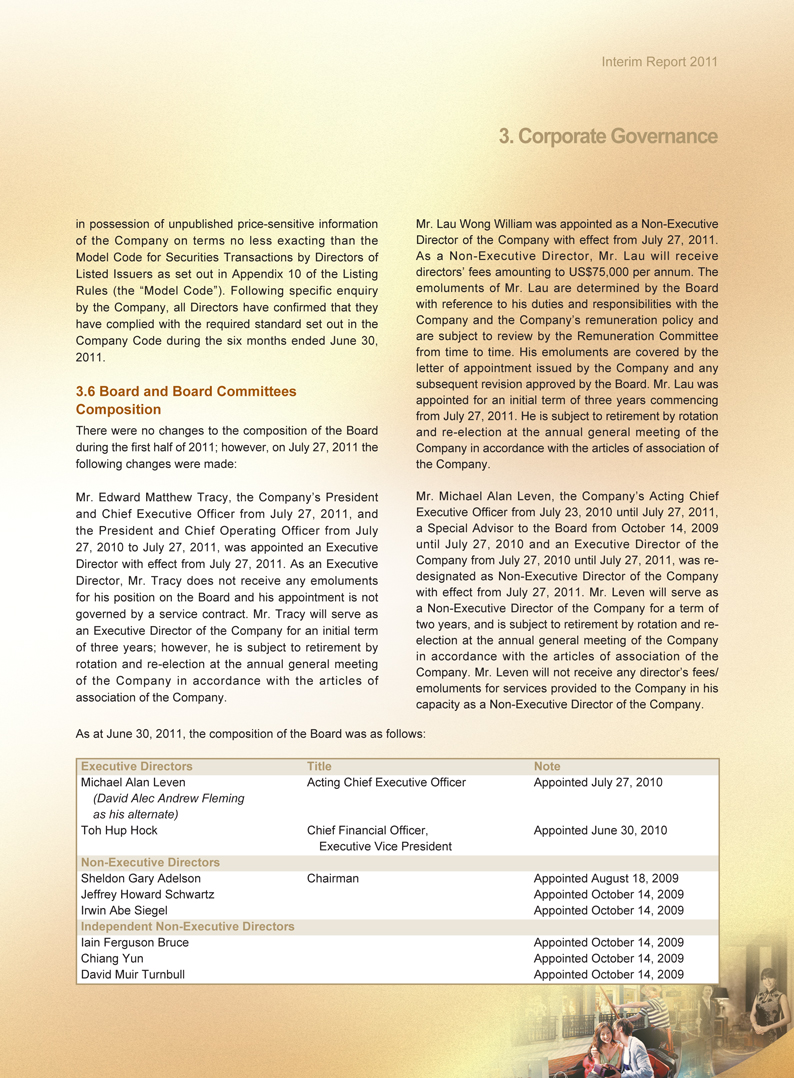
As at June 30, 2011, the composition of the Board was as follows:
Executive Directors Title Note
Michael Alan Leven Acting Chief Executive Officer Appointed July 27, 2010
(David Alec Andrew Fleming
as his alternate)
Toh Hup Hock Chief Financial Officer, Appointed June 30, 2010
Executive Vice President
Non-Executive Directors
Sheldon Gary Adelson Chairman Appointed August 18, 2009
Jeffrey Howard Schwartz Appointed October 14, 2009
Irwin Abe Siegel Appointed October 14, 2009
Independent Non-Executive Directors
Iain Ferguson Bruce Appointed October 14, 2009
Chiang Yun Appointed October 14, 2009
David Muir Turnbull Appointed October 14, 2009
Interim Report 2011
3. Corporate Governance
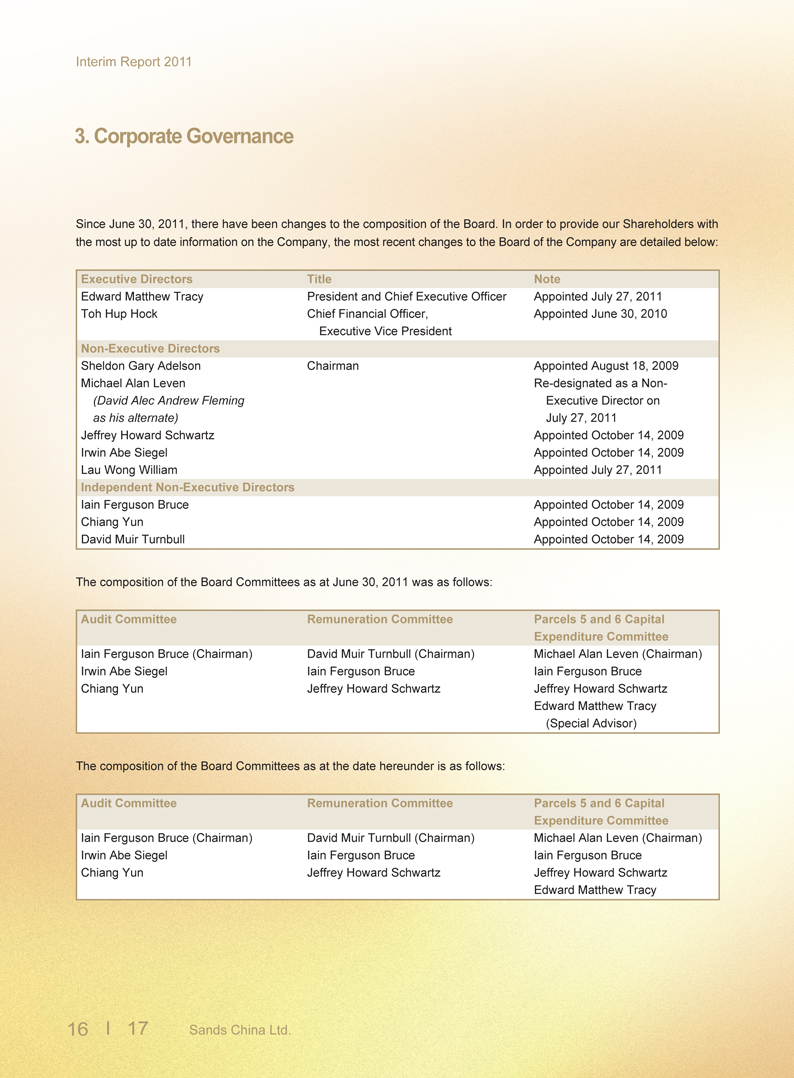
Since June 30, 2011, there have been changes to the composition of the Board. In order to provide our Shareholders with the most up to date information on the Company, the most recent changes to the Board of the Company are detailed below:
Executive Directors Title Note
Edward Matthew Tracy President and Chief Executive Officer Appointed July 27, 2011
Toh Hup Hock Chief Financial Officer, Appointed June 30, 2010
Executive Vice President
Non-Executive Directors
Sheldon Gary Adelson Chairman Appointed August 18, 2009
Michael Alan Leven Re-designated as a Non-
(David Alec Andrew Fleming Executive Director on
as his alternate) July 27, 2011
Jeffrey Howard Schwartz Appointed October 14, 2009
Irwin Abe Siegel Appointed October 14, 2009
Lau Wong William Appointed July 27, 2011
Independent Non-Executive Directors
Iain Ferguson Bruce Appointed October 14, 2009
Chiang Yun Appointed October 14, 2009
David Muir Turnbull Appointed October 14, 2009
The composition of the Board Committees as at June 30, 2011 was as follows:
Audit Committee Remuneration Committee Parcels 5 and 6 Capital
Expenditure Committee
Iain Ferguson Bruce (Chairman) David Muir Turnbull (Chairman) Michael Alan Leven (Chairman)
Irwin Abe Siegel Iain Ferguson Bruce Iain Ferguson Bruce
Chiang Yun Jeffrey Howard Schwartz Jeffrey Howard Schwartz
Edward Matthew Tracy
(Special Advisor)
The composition of the Board Committees as at the date hereunder is as follows:
Audit Committee Remuneration Committee Parcels 5 and 6 Capital
Expenditure Committee
Iain Ferguson Bruce (Chairman) David Muir Turnbull (Chairman) Michael Alan Leven (Chairman)
Irwin Abe Siegel Iain Ferguson Bruce Iain Ferguson Bruce
Chiang Yun Jeffrey Howard Schwartz Jeffrey Howard Schwartz
Edward Matthew Tracy
16 17 Sands China Ltd.
Interim Report 2011
3. Corporate Governance
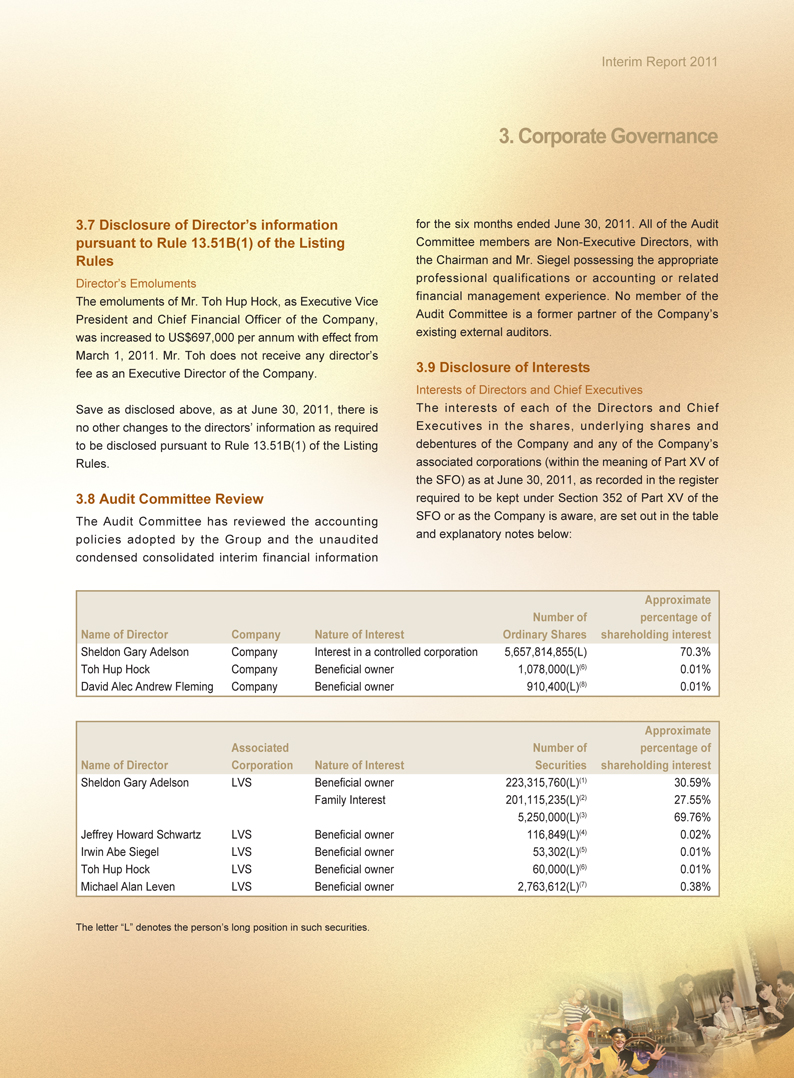
3.7 Disclosure of Director’s information pursuant to Rule 13.51B(1) of the Listing Rules
Director’s Emoluments
The emoluments of Mr. Toh Hup Hock, as Executive Vice President and Chief Financial Officer of the Company, was increased to US$697,000 per annum with effect from March 1, 2011. Mr. Toh does not receive any director’s fee as an Executive Director of the Company.
Save as disclosed above, as at June 30, 2011, there is no other changes to the directors’ information as required to be disclosed pursuant to Rule 13.51B(1) of the Listing Rules.
3.8 Audit Committee Review
The Audit Committee has reviewed the accounting policies adopted by the Group and the unaudited condensed consolidated interim financial information
for the six months ended June 30, 2011. All of the Audit Committee members are Non-Executive Directors, with the Chairman and Mr. Siegel possessing the appropriate professional qualifications or accounting or related financial management experience. No member of the Audit Committee is a former partner of the Company’s existing external auditors.
3.9 Disclosure of Interests
Interests of Directors and Chief Executives
The interests of each of the Directors and Chief Executives in the shares, underlying shares and debentures of the Company and any of the Company’s associated corporations (within the meaning of Part XV of the SFO) as at June 30, 2011, as recorded in the register required to be kept under Section 352 of Part XV of the SFO or as the Company is aware, are set out in the table and explanatory notes below:
Approximate
Number of percentage of
Name of Director Company Nature of Interest Ordinary Shares shareholding interest
Sheldon Gary Adelson Company Interest in a controlled corporation 5,657,814,855(L) 70.3%
Toh Hup Hock Company Beneficial owner 1,078,000(L)(6) 0.01%
David Alec Andrew Fleming Company Beneficial owner 910,400(L)(8) 0.01%
Approximate
Associated Number of percentage of
Name of Director Corporation Nature of Interest Securities shareholding interest
Sheldon Gary Adelson LVS Beneficial owner 223,315,760(L)(1) 30.59%
Family Interest 201,115,235(L)(2) 27.55%
5,250,000(L)(3) 69.76%
Jeffrey Howard Schwartz LVS Beneficial owner 116,849(L)(4) 0.02%
Irwin Abe Siegel LVS Beneficial owner 53,302(L)(5) 0.01%
Toh Hup Hock LVS Beneficial owner 60,000(L)(6) 0.01%
Michael Alan Leven LVS Beneficial owner 2,763,612(L)(7) 0.38%
The letter “L” denotes the person’s long position in such securities.
Interim Report 2011
3. Corporate Governance
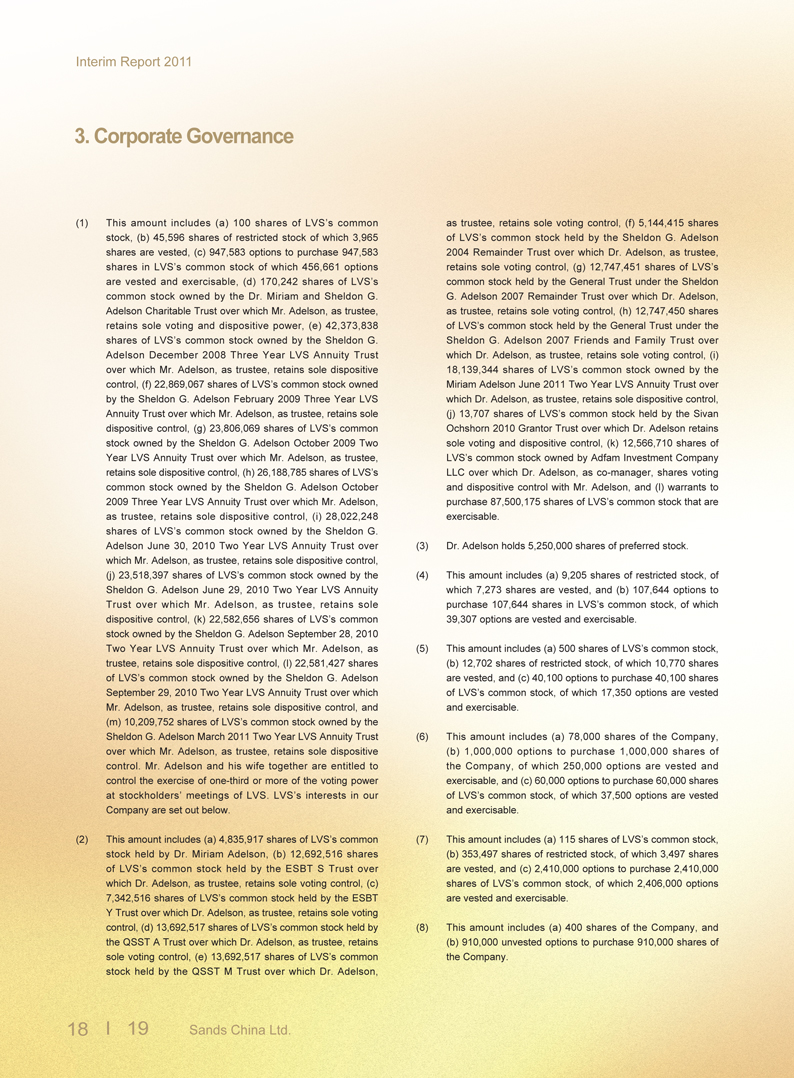
(1) This amount includes (a) 100 shares of LVS’s common
stock, (b) 45,596 shares of restricted stock of which 3,965
shares are vested, (c) 947,583 options to purchase 947,583
shares in LVS’s common stock of which 456,661 options
are vested and exercisable, (d) 170,242 shares of LVS’s
common stock owned by the Dr. Miriam and Sheldon G.
Adelson Charitable Trust over which Mr. Adelson, as trustee,
retains sole voting and dispositive power, (e) 42,373,838
shares of LVS’s common stock owned by the Sheldon G.
Adelson December 2008 Three Year LVS Annuity Trust
over which Mr. Adelson, as trustee, retains sole dispositive
control, (f) 22,869,067 shares of LVS’s common stock owned
by the Sheldon G. Adelson February 2009 Three Year LVS
Annuity Trust over which Mr. Adelson, as trustee, retains sole
dispositive control, (g) 23,806,069 shares of LVS’s common
stock owned by the Sheldon G. Adelson October 2009 Two
Year LVS Annuity Trust over which Mr. Adelson, as trustee,
retains sole dispositive control, (h) 26,188,785 shares of LVS’s
common stock owned by the Sheldon G. Adelson October
2009 Three Year LVS Annuity Trust over which Mr. Adelson,
as trustee, retains sole dispositive control, (i) 28,022,248
shares of LVS’s common stock owned by the Sheldon G.
Adelson June 30, 2010 Two Year LVS Annuity Trust over
which Mr. Adelson, as trustee, retains sole dispositive control,
(j) 23,518,397 shares of LVS’s common stock owned by the
Sheldon G. Adelson June 29, 2010 Two Year LVS Annuity
Trust over which Mr. Adelson, as trustee, retains sole
dispositive control, (k) 22,582,656 shares of LVS’s common
stock owned by the Sheldon G. Adelson September 28, 2010
Two Year LVS Annuity Trust over which Mr. Adelson, as
trustee, retains sole dispositive control, (l) 22,581,427 shares
of LVS’s common stock owned by the Sheldon G. Adelson
September 29, 2010 Two Year LVS Annuity Trust over which
Mr. Adelson, as trustee, retains sole dispositive control, and
(m) 10,209,752 shares of LVS’s common stock owned by the
Sheldon G. Adelson March 2011 Two Year LVS Annuity Trust
over which Mr. Adelson, as trustee, retains sole dispositive
control. Mr. Adelson and his wife together are entitled to
control the exercise of one-third or more of the voting power
at stockholders’ meetings of LVS. LVS’s interests in our
Company are set out below.
(2) This amount includes (a) 4,835,917 shares of LVS’s common
stock held by Dr. Miriam Adelson, (b) 12,692,516 shares
of LVS’s common stock held by the ESBT S Trust over
which Dr. Adelson, as trustee, retains sole voting control, (c)
7,342,516 shares of LVS’s common stock held by the ESBT
Y Trust over which Dr. Adelson, as trustee, retains sole voting
control, (d) 13,692,517 shares of LVS’s common stock held by
the QSST A Trust over which Dr. Adelson, as trustee, retains
sole voting control, (e) 13,692,517 shares of LVS’s common
stock held by the QSST M Trust over which Dr. Adelson,
as trustee, retains sole voting control, (f) 5,144,415 shares
of LVS’s common stock held by the Sheldon G. Adelson
2004 Remainder Trust over which Dr. Adelson, as trustee,
retains sole voting control, (g) 12,747,451 shares of LVS’s
common stock held by the General Trust under the Sheldon
G. Adelson 2007 Remainder Trust over which Dr. Adelson,
as trustee, retains sole voting control, (h) 12,747,450 shares
of LVS’s common stock held by the General Trust under the
Sheldon G. Adelson 2007 Friends and Family Trust over
which Dr. Adelson, as trustee, retains sole voting control, (i)
18,139,344 shares of LVS’s common stock owned by the
Miriam Adelson June 2011 Two Year LVS Annuity Trust over
which Dr. Adelson, as trustee, retains sole dispositive control,
(j) 13,707 shares of LVS’s common stock held by the Sivan
Ochshorn 2010 Grantor Trust over which Dr. Adelson retains
sole voting and dispositive control, (k) 12,566,710 shares of
LVS’s common stock owned by Adfam Investment Company
LLC over which Dr. Adelson, as co-manager, shares voting
and dispositive control with Mr. Adelson, and (l) warrants to
purchase 87,500,175 shares of LVS’s common stock that are
exercisable.
(3) Dr. Adelson holds 5,250,000 shares of preferred stock.
(4) This amount includes (a) 9,205 shares of restricted stock, of
which 7,273 shares are vested, and (b) 107,644 options to
purchase 107,644 shares in LVS’s common stock, of which
39,307 options are vested and exercisable.
(5) This amount includes (a) 500 shares of LVS’s common stock,
(b) 12,702 shares of restricted stock, of which 10,770 shares
are vested, and (c) 40,100 options to purchase 40,100 shares
of LVS’s common stock, of which 17,350 options are vested
and exercisable.
(6) This amount includes (a) 78,000 shares of the Company,
(b) 1,000,000 options to purchase 1,000,000 shares of
the Company, of which 250,000 options are vested and
exercisable, and (c) 60,000 options to purchase 60,000 shares
of LVS’s common stock, of which 37,500 options are vested
and exercisable.
(7) This amount includes (a) 115 shares of LVS’s common stock,
(b) 353,497 shares of restricted stock, of which 3,497 shares
are vested, and (c) 2,410,000 options to purchase 2,410,000
shares of LVS’s common stock, of which 2,406,000 options
are vested and exercisable.
(8) This amount includes (a) 400 shares of the Company, and
(b) 910,000 unvested options to purchase 910,000 shares of
the Company.
18 19 Sands China Ltd.
Interim Report 2011
3. Corporate Governance
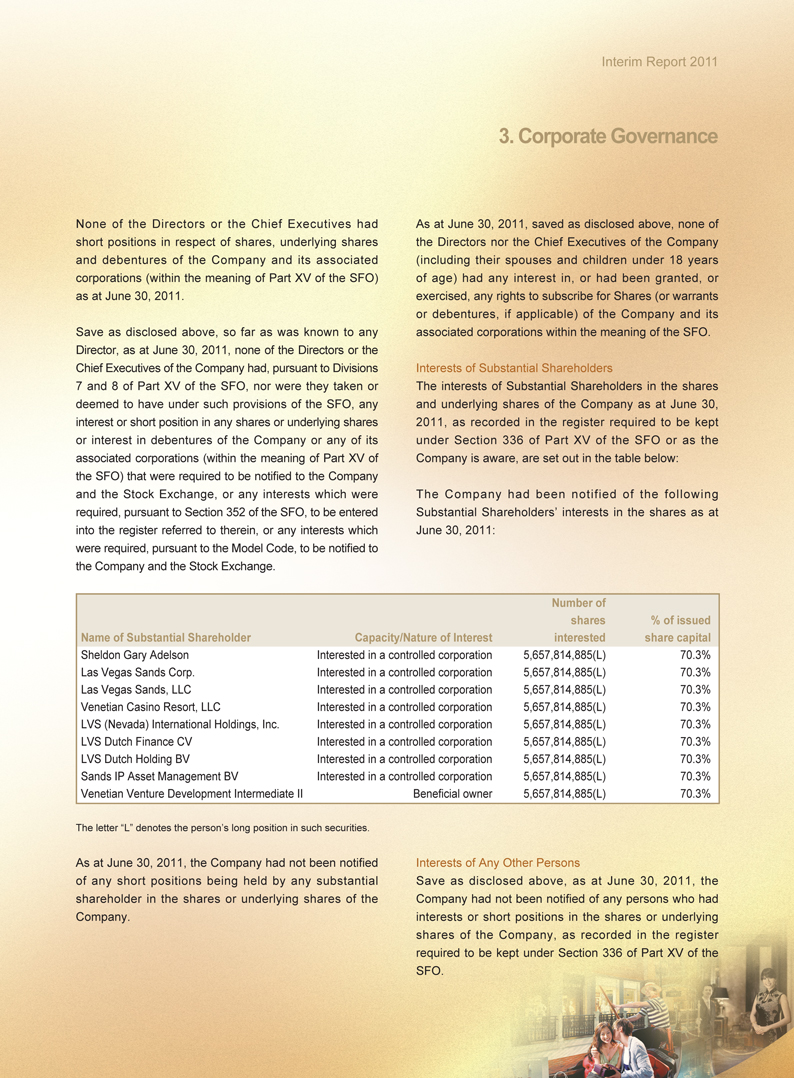
None of the Directors or the Chief Executives had short positions in respect of shares, underlying shares and debentures of the Company and its associated corporations (within the meaning of Part XV of the SFO) as at June 30, 2011.
Save as disclosed above, so far as was known to any Director, as at June 30, 2011, none of the Directors or the Chief Executives of the Company had, pursuant to Divisions 7 and 8 of Part XV of the SFO, nor were they taken or deemed to have under such provisions of the SFO, any interest or short position in any shares or underlying shares or interest in debentures of the Company or any of its associated corporations (within the meaning of Part XV of the SFO) that were required to be notified to the Company and the Stock Exchange, or any interests which were required, pursuant to Section 352 of the SFO, to be entered into the register referred to therein, or any interests which were required, pursuant to the Model Code, to be notified to the Company and the Stock Exchange.
Number of
shares % of issued
Name of Substantial Shareholder Capacity/Nature of Interest interested share capital
Sheldon Gary Adelson Interested in a controlled corporation 5,657,814,885(L) 70.3%
Las Vegas Sands Corp. Interested in a controlled corporation 5,657,814,885(L) 70.3%
Las Vegas Sands, LLC Interested in a controlled corporation 5,657,814,885(L) 70.3%
Venetian Casino Resort, LLC Interested in a controlled corporation 5,657,814,885(L) 70.3%
LVS (Nevada) International Holdings, Inc. Interested in a controlled corporation 5,657,814,885(L) 70.3%
LVS Dutch Finance CV Interested in a controlled corporation 5,657,814,885(L) 70.3%
LVS Dutch Holding BV Interested in a controlled corporation 5,657,814,885(L) 70.3%
Sands IP Asset Management BV Interested in a controlled corporation 5,657,814,885(L) 70.3%
Venetian Venture Development Intermediate II Beneficial owner 5,657,814,885(L) 70.3%
The letter “L” denotes the person’s long position in such securities.
As at June 30, 2011, the Company had not been notified of any short positions being held by any substantial shareholder in the shares or underlying shares of the Company.
As at June 30, 2011, saved as disclosed above, none of the Directors nor the Chief Executives of the Company (including their spouses and children under 18 years of age) had any interest in, or had been granted, or exercised, any rights to subscribe for Shares (or warrants or debentures, if applicable) of the Company and its associated corporations within the meaning of the SFO.
Interests of Substantial Shareholders
The interests of Substantial Shareholders in the shares and underlying shares of the Company as at June 30, 2011, as recorded in the register required to be kept under Section 336 of Part XV of the SFO or as the Company is aware, are set out in the table below:
The Company had been notified of the following Substantial Shareholders’ interests in the shares as at June 30, 2011:
Interests of Any Other Persons
Save as disclosed above, as at June 30, 2011, the Company had not been notified of any persons who had interests or short positions in the shares or underlying shares of the Company, as recorded in the register required to be kept under Section 336 of Part XV of the SFO.
Interim Report 2011
3. Corporate Governance
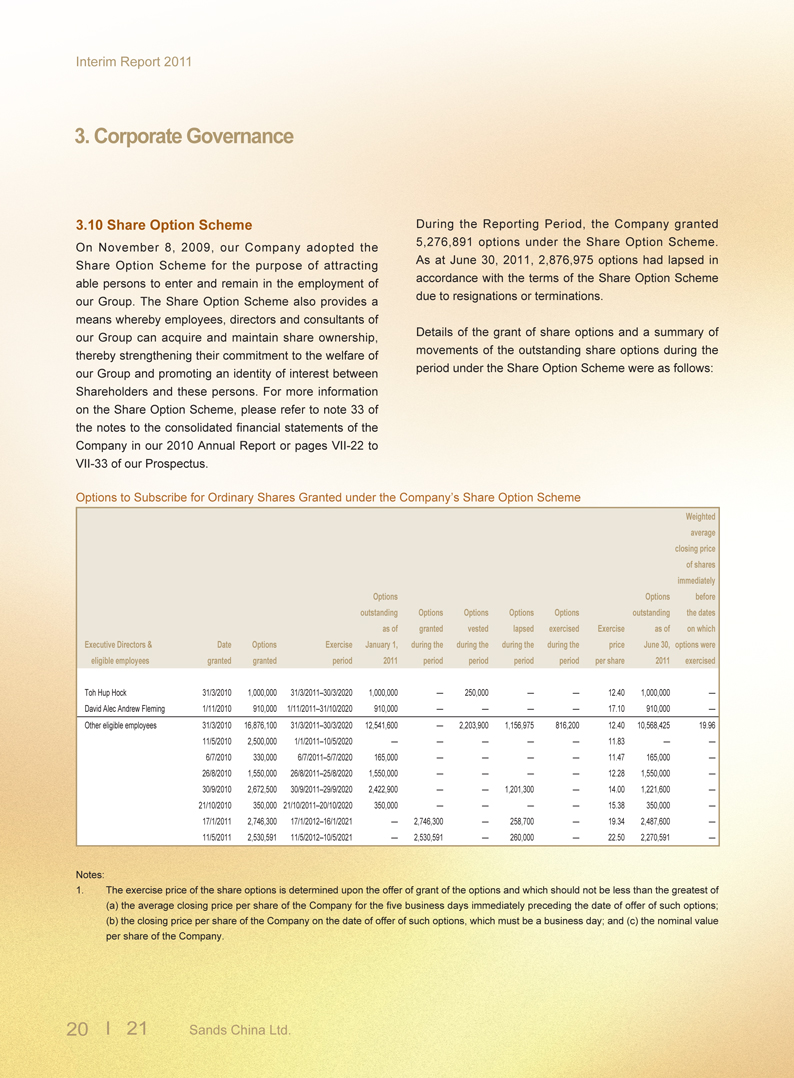
3.10 Share Option Scheme
On November 8, 2009, our Company adopted the Share Option Scheme for the purpose of attracting able persons to enter and remain in the employment of our Group. The Share Option Scheme also provides a means whereby employees, directors and consultants of our Group can acquire and maintain share ownership, thereby strengthening their commitment to the welfare of our Group and promoting an identity of interest between Shareholders and these persons. For more information on the Share Option Scheme, please refer to note 33 of the notes to the consolidated financial statements of the Company in our 2010 Annual Report or pages VII-22 to VII-33 of our Prospectus.
During the Reporting Period, the Company granted 5,276,891 options under the Share Option Scheme. As at June 30, 2011, 2,876,975 options had lapsed in accordance with the terms of the Share Option Scheme due to resignations or terminations.
Details of the grant of share options and a summary of movements of the outstanding share options during the period under the Share Option Scheme were as follows:
Options to Subscribe for Ordinary Shares Granted under the Company’s Share Option Scheme
Weighted
average
closing price
of shares
immediately
Options Options before
outstanding Options Options Options Options outstanding the dates
as of granted vested lapsed exercised Exercise as of on which
Executive Directors & Date Options Exercise January 1, during the during the during the during the price June 30, options were
eligible employees granted granted period 2011 period period period period per share 2011 exercised
Toh Hup Hock 31/3/2010 1,000,000 31/3/2011–30/3/2020 1,000,000 — 250,000 — — 12.40 1,000,000 —
David Alec Andrew Fleming 1/11/2010 910,000 1/11/2011–31/10/2020 910,000 — — — — 17.10 910,000 —
Other eligible employees 31/3/2010 16,876,100 31/3/2011–30/3/2020 12,541,600 — 2,203,900 1,156,975 816,200 12.40 10,568,425 19.96
11/5/2010 2,500,000 1/1/2011–10/5/2020 — — — — — 11.83 — —
6/7/2010 330,000 6/7/2011–5/7/2020 165,000 — — — — 11.47 165,000 —
26/8/2010 1,550,000 26/8/2011–25/8/2020 1,550,000 — — — — 12.28 1,550,000 —
30/9/2010 2,672,500 30/9/2011–29/9/2020 2,422,900 — — 1,201,300 — 14.00 1,221,600 —
21/10/2010 350,000 21/10/2011–20/10/2020 350,000 — — — — 15.38 350,000 —
17/1/2011 2,746,300 17/1/2012–16/1/2021 — 2,746,300 — 258,700 — 19.34 2,487,600 —
11/5/2011 2,530,591 11/5/2012–10/5/2021 — 2,530,591 — 260,000 — 22.50 2,270,591 —
Notes:
1. The exercise price of the share options is determined upon the offer of grant of the options and which should not be less than the greatest of
(a) the average closing price per share of the Company for the five business days immediately preceding the date of offer of such options;
(b) the closing price per share of the Company on the date of offer of such options, which must be a business day; and (c) the nominal value
per share of the Company.
20 21 Sands China Ltd.

Interim Report 2011
3. Corporate Governance
2. The proportion of underlying shares in respect of which the above share options will vest is as follows:
Proportion of underlying
shares in respect of
which the above
share options will
Date vest is as follows:
Before the first anniversary of the date of grant of the option (the “Offer Anniversary”) None
From the first Offer Anniversary to the date immediately before the second Offer Anniversary One-quarter
From the second Offer Anniversary to the date immediately before the third Offer Anniversary Two-quarters
From the third Offer Anniversary to the date immediately before the forth Offer Anniversary Three-quarters
From the forth Offer Anniversary to the date immediately before the fifth Offer Anniversary All
Save as disclosed herein, no options were granted under the Share Option Scheme or any share option scheme of the Group as at June 30, 2011. The Company estimates the fair value of options granted using the Black-Scholes option-pricing model. The weighted average fair value of options granted during the Reporting Period, measured as at the date of grant, was approximately US$1.66.
Significant estimates and assumptions are required to be made in determining the parameters for applying the Black-Scholes option-pricing model, including estimates and assumptions regarding the risk-free rate of return, expected dividend yield and volatility of the underlying shares and the expected life of the options. These estimates and assumptions could have a material effect on the determination of the fair value of the share options and the amount of such equity awards expected to vest, which may in turn significantly impact the determination
of the share based compensation expense. The following
assumptions were used to derive the fair values:
Weighted average volatility 68.7%
Expected term (in years) 6.3
Risk-free rate 1.6%
Expected dividends —
3.11 Purchase, Sale or Redemption of the
Company’s Listed Shares
There was no purchase, sale or redemption of the
Company’s listed shares by the Company or any of its
subsidiaries during the six months ended June 30, 2011.
By order of the Board of Directors
Sands China Ltd.
Sheldon Gary Adelson
Chairman of the Board
Macao, August 29, 2011
Interim Report 2011
4.1 Report on Review of Interim Financial Information
To the Board of Directors of Sands China Ltd.
(incorporated in the Cayman Islands with limited liability)
Introduction
We have reviewed the interim financial information set out on pages 23 to 48, which comprises the consolidated balance sheet of Sands China Ltd. (the “Company”) and its subsidiaries (together, the “Group”) as at June 30, 2011 and the related condensed consolidated statements of income, comprehensive income, changes in equity and cash flows for the six-month period then ended, and a summary of significant accounting policies and other explanatory notes. The Rules Governing the Listing of Securities on The Stock Exchange of Hong Kong Limited require the preparation of a report on interim financial information to be in compliance with the relevant provisions thereof and International Accounting Standard 34 “Interim Financial Reporting”. The directors of the Company are responsible for the preparation and presentation of this interim financial information in accordance with International Accounting Standard 34 “Interim Financial Reporting”. Our responsibility is to express a conclusion on this interim financial information based on our review and to report our conclusion solely to you, as a body, in accordance with our agreed terms of engagement and for no other purpose. We do not assume responsibility towards or accept liability to any other person for the contents of this report.
Scope of review
We conducted our review in accordance with International Standard on Review Engagements 2410, “Review of Interim Financial Information Performed by the Independent Auditor of the Entity”. A review of interim financial information consists of making inquiries, primarily of persons responsible for financial and accounting matters, and applying analytical and other review procedures. A review is substantially less in scope than an audit conducted in accordance with International Standards on Auditing and consequently does not enable us to obtain assurance that we would become aware of all significant matters that might be identified in an audit. Accordingly, we do not express an audit opinion.
Conclusion
Based on our review, nothing has come to our attention that causes us to believe that the interim financial information is not prepared, in all material respects, in accordance with International Accounting Standard 34 “Interim Financial Reporting”.
PricewaterhouseCoopers
Certified Public Accountants
Hong Kong, August 29, 2011
PricewaterhouseCoopers, 22/F, Prince’s Building, Central, Hong Kong
T: +85222898888, F: +85228109888, www.pwchk.com
22 Sands China Ltd.
Interim Report 2011
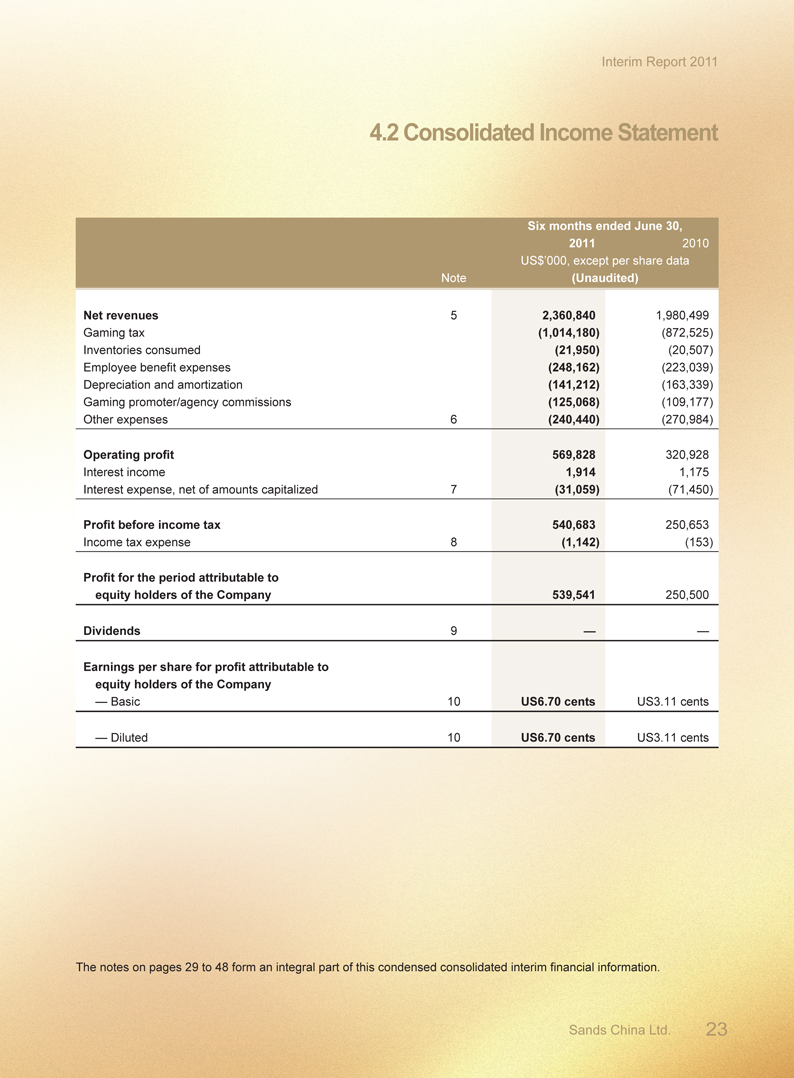
4.2 Consolidated Income Statement
Six months ended June 30,
2011 2010
US$’000, except per share data
Note (Unaudited)
Net revenues 5 2,360,840 1,980,499
Gaming tax (1,014,180) (872,525)
Inventories consumed (21,950) (20,507)
Employee benefit expenses (248,162) (223,039)
Depreciation and amortization (141,212) (163,339)
Gaming promoter/agency commissions (125,068) (109,177)
Other expenses 6 (240,440) (270,984)
Operating profit 569,828 320,928
Interest income 1,914 1,175
Interest expense, net of amounts capitalized 7 (31,059) (71,450)
Profit before income tax 540,683 250,653
Income tax expense 8 (1,142) (153)
Profit for the period attributable to
equity holders of the Company 539,541 250,500
Dividends 9 — —
Earnings per share for profit attributable to
equity holders of the Company
— Basic 10 US6.70 cents US3.11 cents
— Diluted 10 US6.70 cents US3.11 cents
The notes on pages 29 to 48 form an integral part of this condensed consolidated interim financial information.
Sands China Ltd. 23
Interim Report 2011
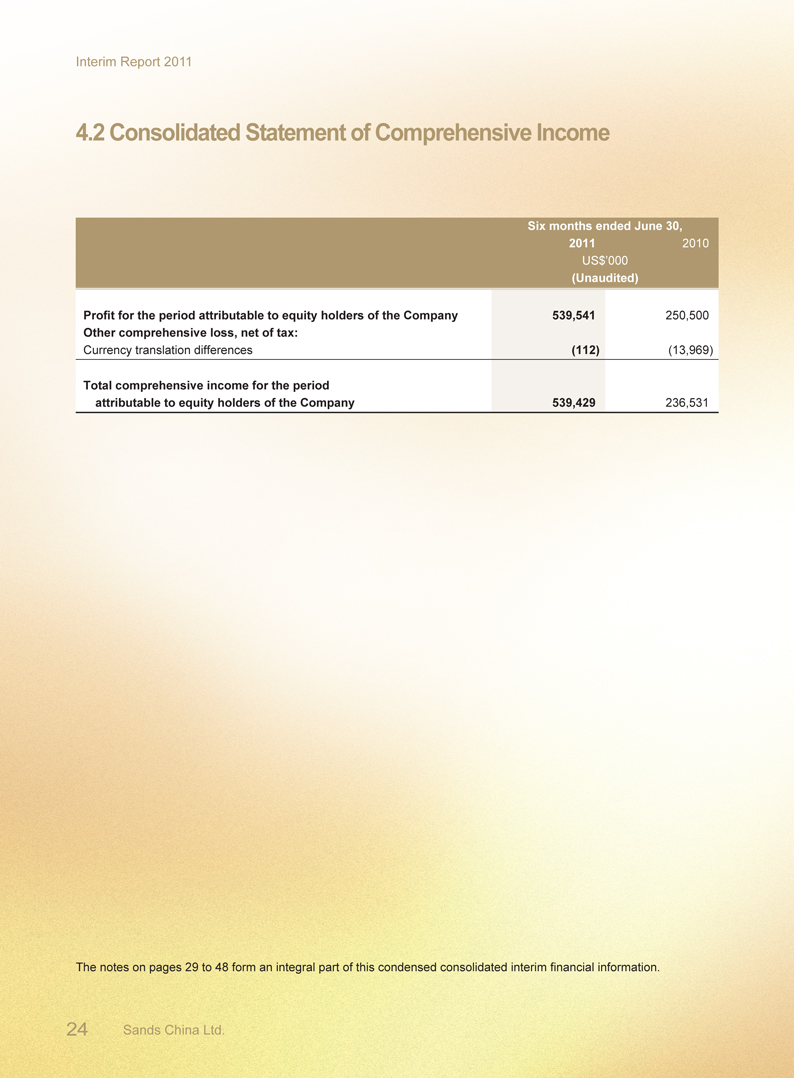
4.2 Consolidated Statement of Comprehensive Income
Six months ended June 30,
2011 2010
US$’000
(Unaudited)
Profit for the period attributable to equity holders of the Company 539,541 250,500
Other comprehensive loss, net of tax:
Currency translation differences (112) (13,969)
Total comprehensive income for the period
attributable to equity holders of the Company 539,429 236,531
The notes on pages 29 to 48 form an integral part of this condensed consolidated interim financial information.
24 Sands China Ltd.
Interim Report 2011
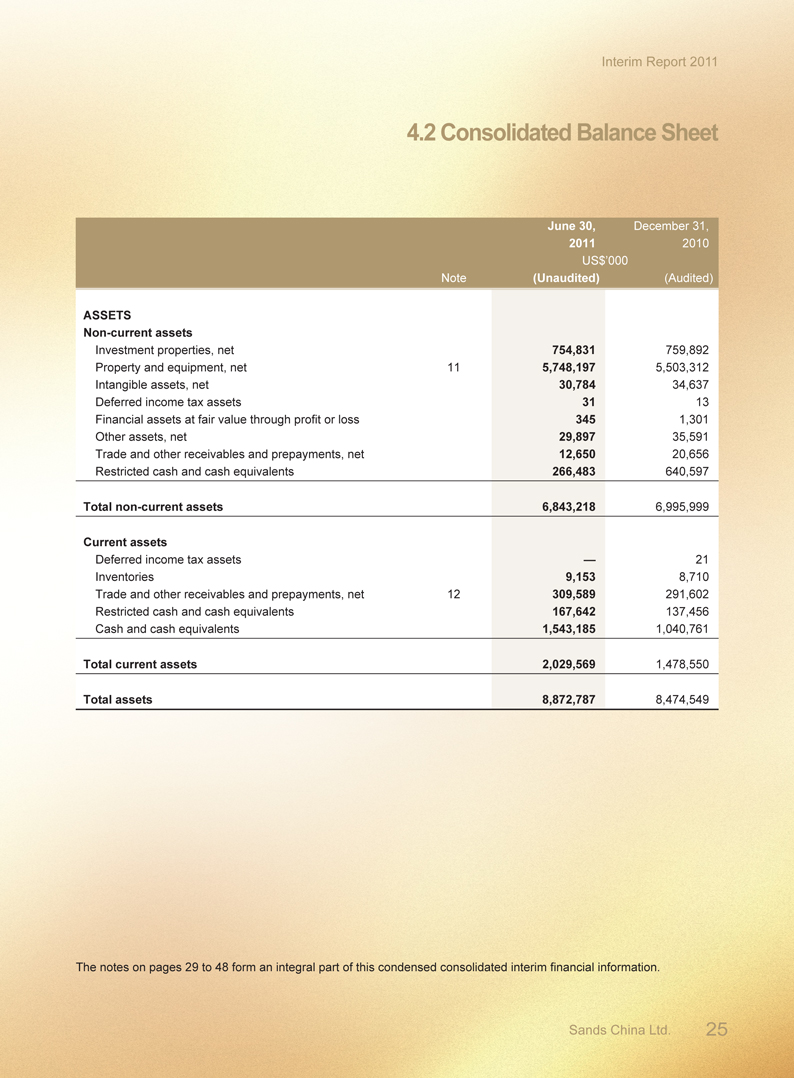
4.2 Consolidated Balance Sheet
June 30, December 31,
2011 2010
US$’000
Note (Unaudited) (Audited)
ASSETS
Non-current assets
Investment properties, net 754,831 759,892
Property and equipment, net 11 5,748,197 5,503,312
Intangible assets, net 30,784 34,637
Deferred income tax assets 31 13
Financial assets at fair value through profit or loss 345 1,301
Other assets, net 29,897 35,591
Trade and other receivables and prepayments, net 12,650 20,656
Restricted cash and cash equivalents 266,483 640,597
Total non-current assets 6,843,218 6,995,999
Current assets
Deferred income tax assets — 21
Inventories 9,153 8,710
Trade and other receivables and prepayments, net 12 309,589 291,602
Restricted cash and cash equivalents 167,642 137,456
Cash and cash equivalents 1,543,185 1,040,761
Total current assets 2,029,569 1,478,550
Total assets 8,872,787 8,474,549
The notes on pages 29 to 48 form an integral part of this condensed consolidated interim financial information.
Sands China Ltd. 25
Interim Report 2011
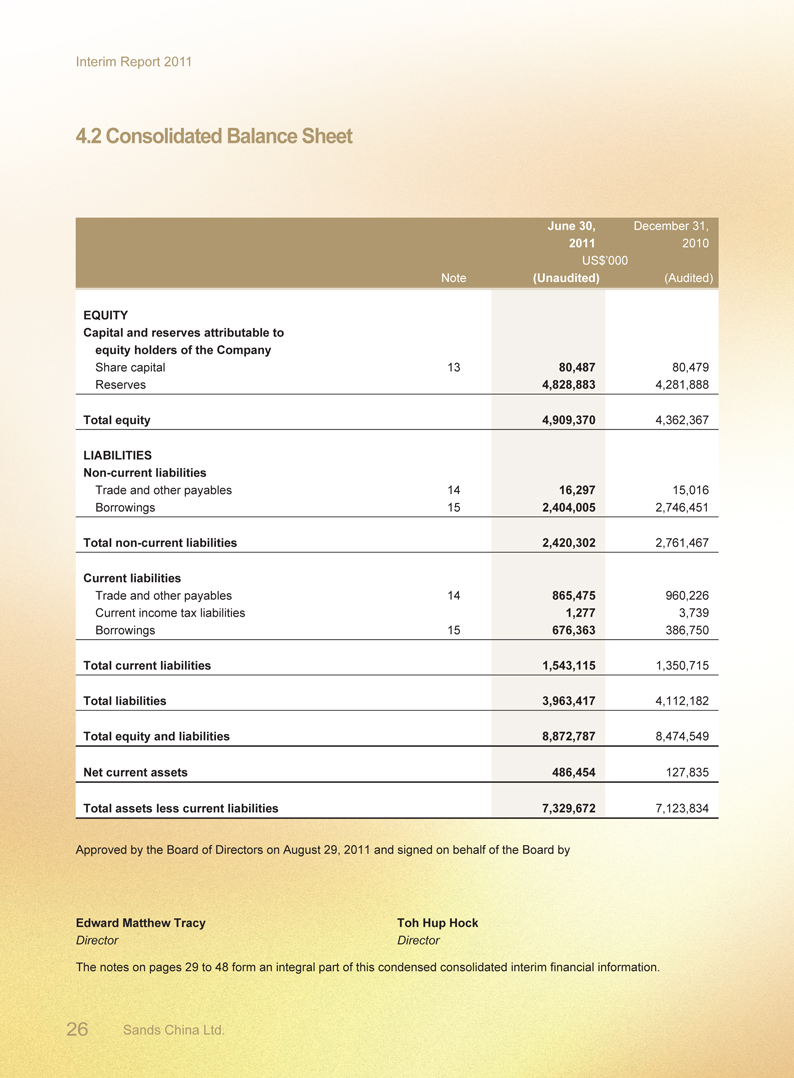
4.2 Consolidated Balance Sheet
June 30, December 31,
2011 2010
US$’000
Note (Unaudited) (Audited)
EQUITY
Capital and reserves attributable to
equity holders of the Company
Share capital 13 80,487 80,479
Reserves 4,828,883 4,281,888
Total equity 4,909,370 4,362,367
LIABILITIES
Non-current liabilities
Trade and other payables 14 16,297 15,016
Borrowings 15 2,404,005 2,746,451
Total non-current liabilities 2,420,302 2,761,467
Current liabilities
Trade and other payables 14 865,475 960,226
Current income tax liabilities 1,277 3,739
Borrowings 15 676,363 386,750
Total current liabilities 1,543,115 1,350,715
Total liabilities 3,963,417 4,112,182
Total equity and liabilities 8,872,787 8,474,549
Net current assets 486,454 127,835
Total assets less current liabilities 7,329,672 7,123,834
Approved by the Board of Directors on August 29, 2011 and signed on behalf of the Board by
Edward Matthew Tracy Toh Hup Hock
Director Director
The notes on pages 29 to 48 form an integral part of this condensed consolidated interim financial information.
26 Sands China Ltd.
Interim Report 2011
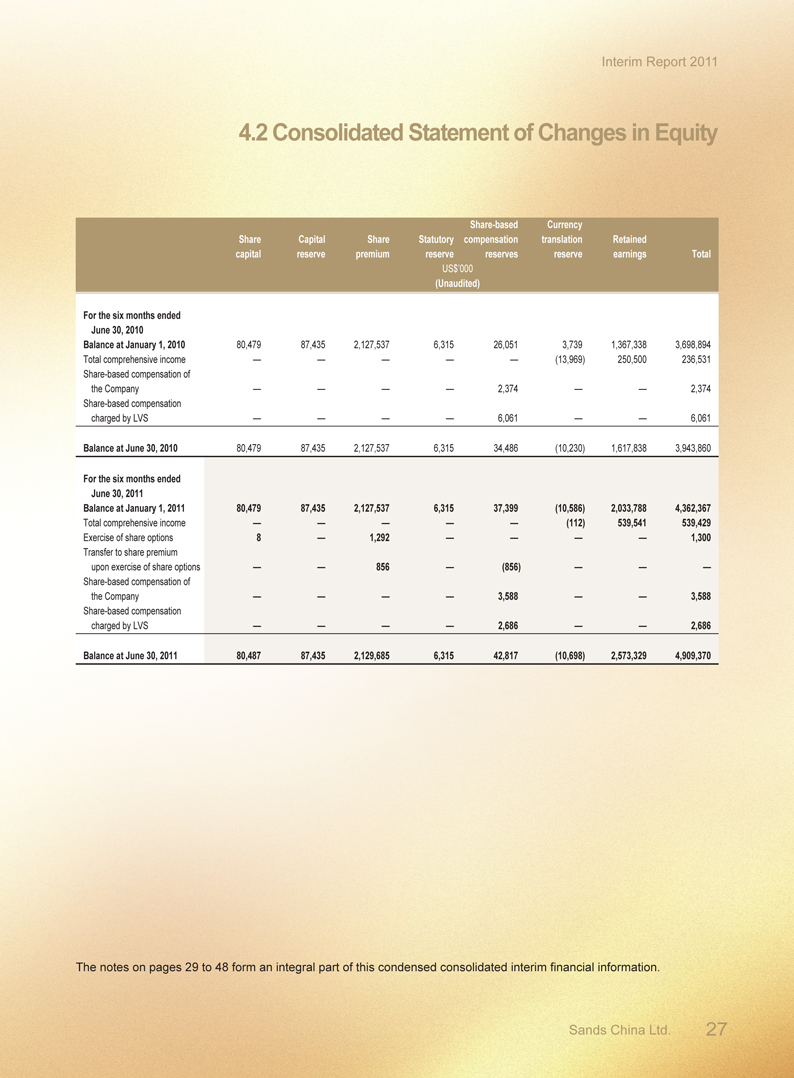
4.2 Consolidated Statement of Changes in Equity
Share-based Currency
Share Capital Share Statutory compensation translation Retained
capital reserve premium reserve reserves reserve earnings Total
US$’000
(Unaudited)
For the six months ended
June 30, 2010
Balance at January 1, 2010 80,479 87,435 2,127,537 6,315 26,051 3,739 1,367,338 3,698,894
Total comprehensive income — — — — — (13,969) 250,500 236,531
Share-based compensation of
the Company — — — — 2,374 — — 2,374
Share-based compensation
charged by LVS — — — — 6,061 — — 6,061
Balance at June 30, 2010 80,479 87,435 2,127,537 6,315 34,486 (10,230) 1,617,838 3,943,860
For the six months ended
June 30, 2011
Balance at January 1, 2011 80,479 87,435 2,127,537 6,315 37,399 (10,586) 2,033,788 4,362,367
Total comprehensive income — — — — — (112) 539,541 539,429
Exercise of share options 8 — 1,292 — — — — 1,300
Transfer to share premium
upon exercise of share options — — 856 — (856) — — —
Share-based compensation of
the Company — — — — 3,588 — — 3,588
Share-based compensation
charged by LVS — — — — 2,686 — — 2,686
Balance at June 30, 2011 80,487 87,435 2,129,685 6,315 42,817 (10,698) 2,573,329 4,909,370
The notes on pages 29 to 48 form an integral part of this condensed consolidated interim financial information.
Sands China Ltd. 27
Interim Report 2011
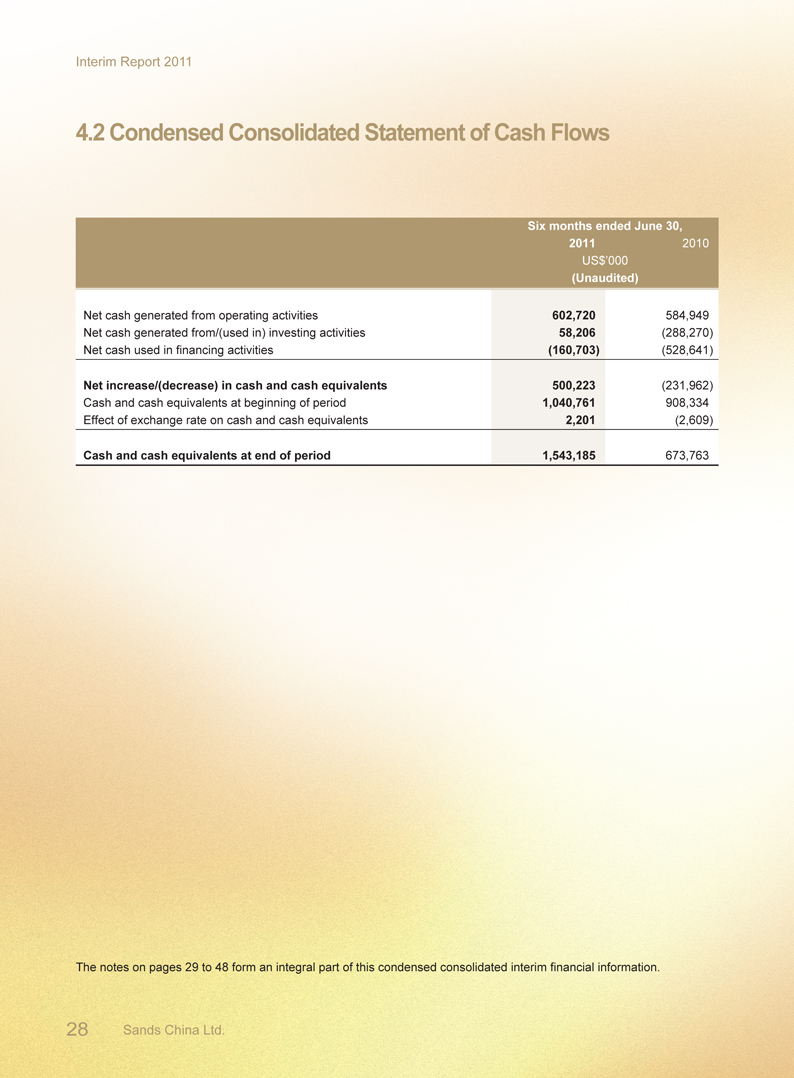
4.2 Condensed Consolidated Statement of Cash Flows
Six months ended June 30,
2011 2010
US$’000
(Unaudited)
Net cash generated from operating activities 602,720 584,949
Net cash generated from/(used in) investing activities 58,206 (288,270)
Net cash used in financing activities (160,703) (528,641)
Net increase/(decrease) in cash and cash equivalents 500,223 (231,962)
Cash and cash equivalents at beginning of period 1,040,761 908,334
Effect of exchange rate on cash and cash equivalents 2,201 (2,609)
Cash and cash equivalents at end of period 1,543,185 673,763
The notes on pages 29 to 48 form an integral part of this condensed consolidated interim financial information.
28 Sands China Ltd.
Interim Report 2011
4.3 Notes to the Condensed Consolidated Interim Financial Information
1. General information
Principal activities
Sands China Ltd. (the “Company”) and its subsidiaries (collectively the “Group”) are principally engaged in the
operation of casino games of chance or games of other forms, the development and operation of integrated resorts
and other ancillary services in the Macao Special Administrative Region of the People’s Republic of China (“Macao”).
The Group’s immediate holding company is Venetian Venture Development Intermediate II (“VVDI (II)”). Las Vegas
Sands Corp. (“LVS”) is the Group’s ultimate holding company.
The Company was incorporated in the Cayman Islands on July 15, 2009 as an exempted company with limited
liability under the Companies Law, Cap 22 (Law 3 of 1961, as consolidated and revised) of the Cayman Islands. The
address of the Company’s registered office is Walkers Corporate Services Limited, Walker House, 87 Mary Street,
George Town, Grand Cayman KY1-9005, Cayman Islands. The Company’s principal place of business in Hong Kong
registered under Part XI of the Hong Kong Companies Ordinance is Level 28, Three Pacific Place, 1 Queen’s Road
East, Hong Kong.
The Group owns and operates the Sands Macao, the first Las Vegas-style casino in Macao, pursuant to a 20-year
gaming subconcession.
The Group also owns and operates The Venetian Macao Resort Hotel (“The Venetian Macao”), which anchors the
Cotai Strip, the Group’s master-planned development of integrated resort properties in Macao.
In August 2008, the Group opened the Four Seasons Hotel, the Plaza Casino and the Shoppes at Four Seasons
(together with the Paiza Mansions, which opened in July 2009 and the apart-hotel tower, referred to as “The Plaza
Macao”). The Plaza Macao is located adjacent to The Venetian Macao.
The Group’s other ancillary services include ferry operations and other related operations.
The Company’s shares were listed on the Main Board of the Stock Exchange on November 30, 2009.
The unaudited condensed consolidated interim financial information (the “Interim Financial Information”) is presented
in United States dollars (“US$”), unless otherwise stated. The Interim Financial Information was approved and
authorized for issue by the Board of Directors of the Company on August 29, 2011.
This Interim Financial Information has not been audited.
2. Basis of preparation
The Interim Financial Information for the six months ended June 30, 2011 has been prepared in accordance with
the International Accounting Standard (“IAS”) 34 ‘Interim Financial Reporting’ issued by the International Accounting
Standard Board (“IASB”) and the applicable disclosure requirements of Appendix 16 to the Listing Rules. It should be
read in conjunction with the Group’s annual financial statements for the year ended December 31, 2010, which were
prepared in accordance with International Financial Reporting Standards (“IFRS”).
Sands China Ltd. 29
Interim Report 2011
4.3 Notes to the Condensed Consolidated Interim Financial Information
3. Significant accounting policies
Except as described below, the accounting policies adopted in the preparation of the Interim Financial Information for the six months ended June 30, 2011 are consistent with those adopted and as described in the Group’s annual financial statements for the year ended December 31, 2010.
During the period, there have been a number of new or revised standards, amendments to standards and interpretations that have come to effect, for which the Group has adopted such at their respective effective dates. The adoption of these new standards, amendments to standards and interpretations has no material impact on the results of operations and financial position of the Group. Amendment to IAS 34 “Interim Financial Reporting” is effective for annual periods beginning on or after January 1, 2011. It emphasizes the existing disclosure principles in IAS 34 and adds further guidance to illustrate how to apply these principles. Greater emphasis has been placed on the disclosure principles for significant events and transactions. Additional requirements cover disclosure of changes to fair value measurement (if signifi cant), and the need to update relevant information from the most recent annual report. The amendment does not result in additional disclosures to the Group.
Effective for annual periods
beginning on or after
IAS 1 (Amendment)
Presentation of Financial Statements
July 1, 2012
IAS 12 (Amendment)
Deferred Tax — Recovery of Underlying Assets
January 1, 2012
IAS 19 (Amendment)
Employee Benefits
January 1, 2013
IAS 27 (Revised 2011)
Separate Financial Statements
January 1, 2013
IAS 28 (Revised 2011)
Investments in Associates and Joint Ventures
January 1, 2013
IFRS 1 (Amendment)
Severe Hyperinflation and Removal of Fixed Dates
July 1, 2011
for First-time Adopters
IFRS 7 (Amendments)
Disclosures — Transfers of Financial Assets
July 1, 2011
IFRS 9
Financial Instruments
January 1, 2013
IFRS 10
Consolidated Financial Statements
January 1, 2013
IFRS 11
Joint Arrangements
January 1, 2013
IFRS 12
Disclosure of Interests in Other Entities
January 1, 2013
IFRS 13
Fair Value Measurements
January 1, 2013
The Group has not early adopted the following new or revised standards, amendments and interpretations that have been issued but are not yet effective for the period:
The Group will adopt the above new and revised standards, amendments and interpretations as and when they
become effective. The Group has already commenced the assessment of the impact to the Group and is not yet in a
position to state whether these would have a significant impact on the results of operations and financial position of
the Group.
4. Segment information
Management has determined the operating segments based on the reports reviewed by a group of senior
management to make strategic decisions. The Group considers the business from a property and service
perspective.
The Group’s principal operating and developmental activities occur in Macao, which is the sole geographic area that
the Group domiciles. The Group reviews the results of operations for each of its key operating segments, which are
also the reportable segments: Sands Macao, The Venetian Macao, The Plaza Macao, ferry and other operations and
other developments (on Parcels 3, 5, 6, 7 and 8 on Cotai).
30 Sands China Ltd.
Interim Report 2011
4.3 Notes to the Condensed Consolidated Interim Financial Information
4. Segment information (continued)
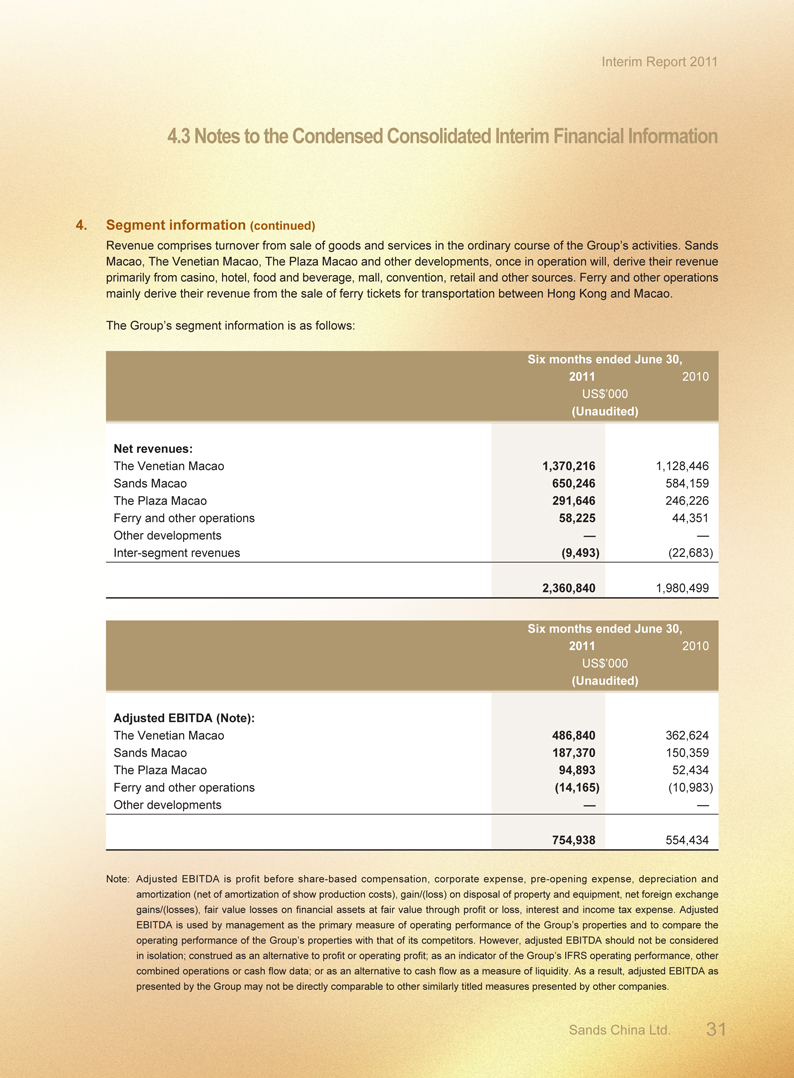
Revenue comprises turnover from sale of goods and services in the ordinary course of the Group’s activities. Sands Macao, The Venetian Macao, The Plaza Macao and other developments, once in operation will, derive their revenue primarily from casino, hotel, food and beverage, mall, convention, retail and other sources. Ferry and other operations mainly derive their revenue from the sale of ferry tickets for transportation between Hong Kong and Macao.
The Group’s segment information is as follows:
Six months ended June 30,
2011 2010
US$’000
(Unaudited)
Net revenues:
The Venetian Macao 1,370,216 1,128,446
Sands Macao 650,246 584,159
The Plaza Macao 291,646 246,226
Ferry and other operations 58,225 44,351
Other developments — —
Inter-segment revenues (9,493) (22,683)
2,360,840 1,980,499
Six months ended June 30,
2011 2010
US$’000
(Unaudited)
Adjusted EBITDA (Note):
The Venetian Macao 486,840 362,624
Sands Macao 187,370 150,359
The Plaza Macao 94,893 52,434
Ferry and other operations (14,165) (10,983)
Other developments — —
754,938 554,434
Note: Adjusted EBITDA is profit before share-based compensation, corporate expense, pre-opening expense, depreciation and amortization (net of amortization of show production costs), gain/(loss) on disposal of property and equipment, net foreign exchange gains/(losses), fair value losses on financial assets at fair value through profit or loss, interest and income tax expense. Adjusted EBITDA is used by management as the primary measure of operating performance of the Group’s properties and to compare the operating performance of the Group’s properties with that of its competitors. However, adjusted EBITDA should not be considered in isolation; construed as an alternative to profit or operating profit; as an indicator of the Group’s IFRS operating performance, other combined operations or cash flow data; or as an alternative to cash flow as a measure of liquidity. As a result, adjusted EBITDA as presented by the Group may not be directly comparable to other similarly titled measures presented by other companies.
Sands China Ltd. 31
Interim Report 2011
4.3 Notes to the Condensed Consolidated Interim Financial Information
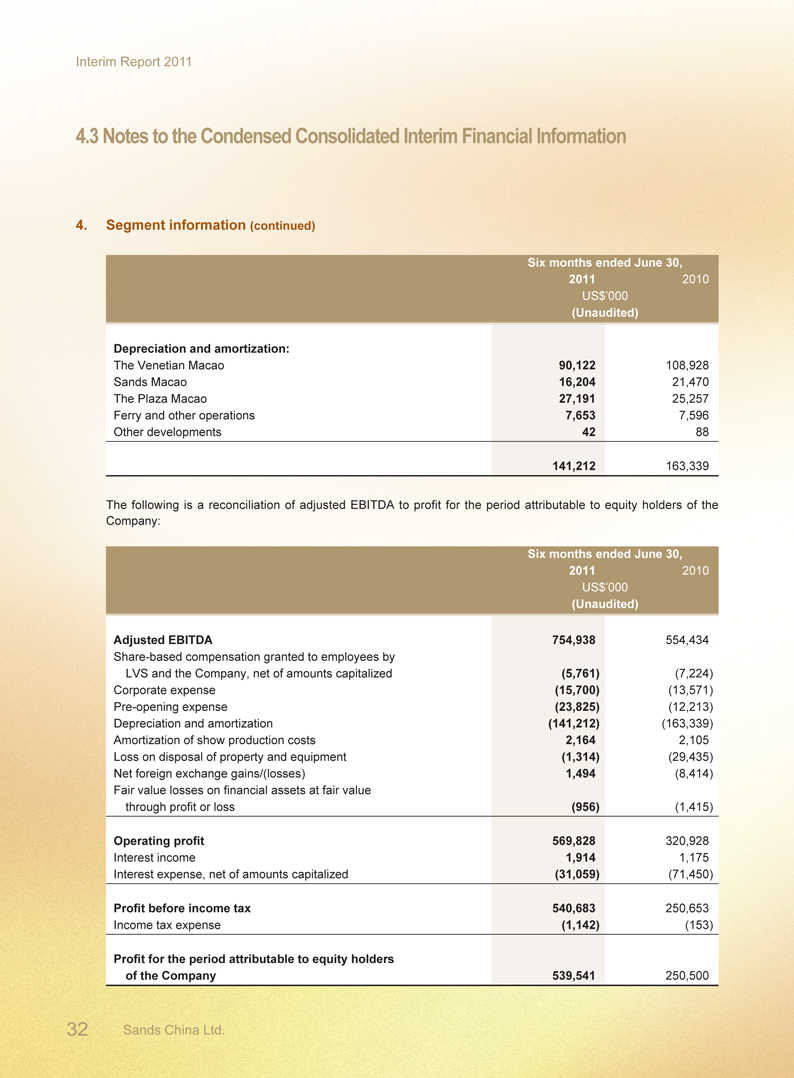
4. Segment information (continued)
Six months ended June 30,
2011 2010
US$’000
(Unaudited)
Depreciation and amortization:
The Venetian Macao 90,122 108,928
Sands Macao 16,204 21,470
The Plaza Macao 27,191 25,257
Ferry and other operations 7,653 7,596
Other developments 42 88
141,212 163,339
The following is a reconciliation of adjusted EBITDA to profit for the period attributable to equity holders of the Company:
Six months ended June 30,
2011 2010
US$’000
(Unaudited)
Adjusted EBITDA 754,938 554,434
Share-based compensation granted to employees by
LVS and the Company, net of amounts capitalized (5,761) (7,224)
Corporate expense (15,700) (13,571)
Pre-opening expense (23,825) (12,213)
Depreciation and amortization (141,212) (163,339)
Amortization of show production costs 2,164 2,105
Loss on disposal of property and equipment (1,314) (29,435)
Net foreign exchange gains/(losses) 1,494 (8,414)
Fair value losses on financial assets at fair value
through profit or loss (956) (1,415)
Operating profit 569,828 320,928
Interest income 1,914 1,175
Interest expense, net of amounts capitalized (31,059) (71,450)
Profit before income tax 540,683 250,653
Income tax expense (1,142) (153)
Profit for the period attributable to equity holders
of the Company 539,541 250,500
32 Sands China Ltd.
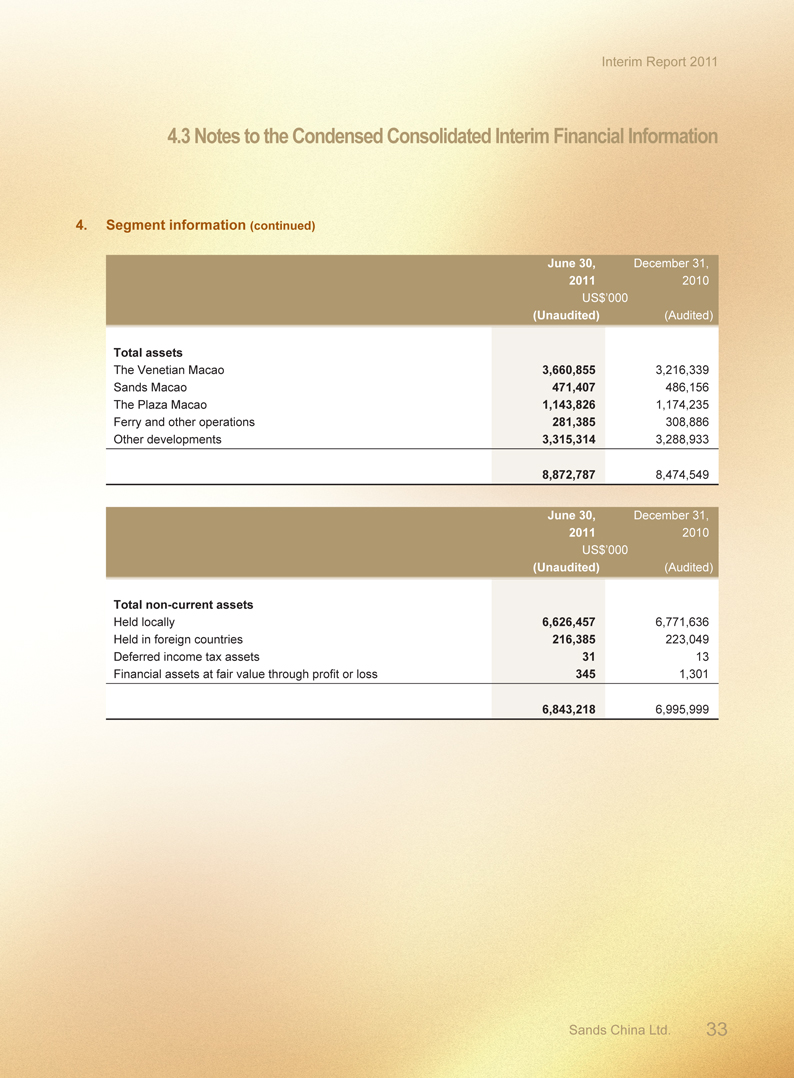
Interim Report 2011
4.3 Notes to the Condensed Consolidated Interim Financial Information
4. Segment information (continued)
June 30, December 31,
2011 2010
US$’000
(Unaudited) (Audited)
Total assets
The Venetian Macao 3,660,855 3,216,339
Sands Macao 471,407 486,156
The Plaza Macao 1,143,826 1,174,235
Ferry and other operations 281,385 308,886
Other developments 3,315,314 3,288,933
8,872,787 8,474,549
June 30, December 31,
2011 2010
US$’000
(Unaudited) (Audited)
Total non-current assets
Held locally 6,626,457 6,771,636
Held in foreign countries 216,385 223,049
Deferred income tax assets 31 13
Financial assets at fair value through profit or loss 345 1,301
6,843,218 6,995,999
Sands China Ltd. 33
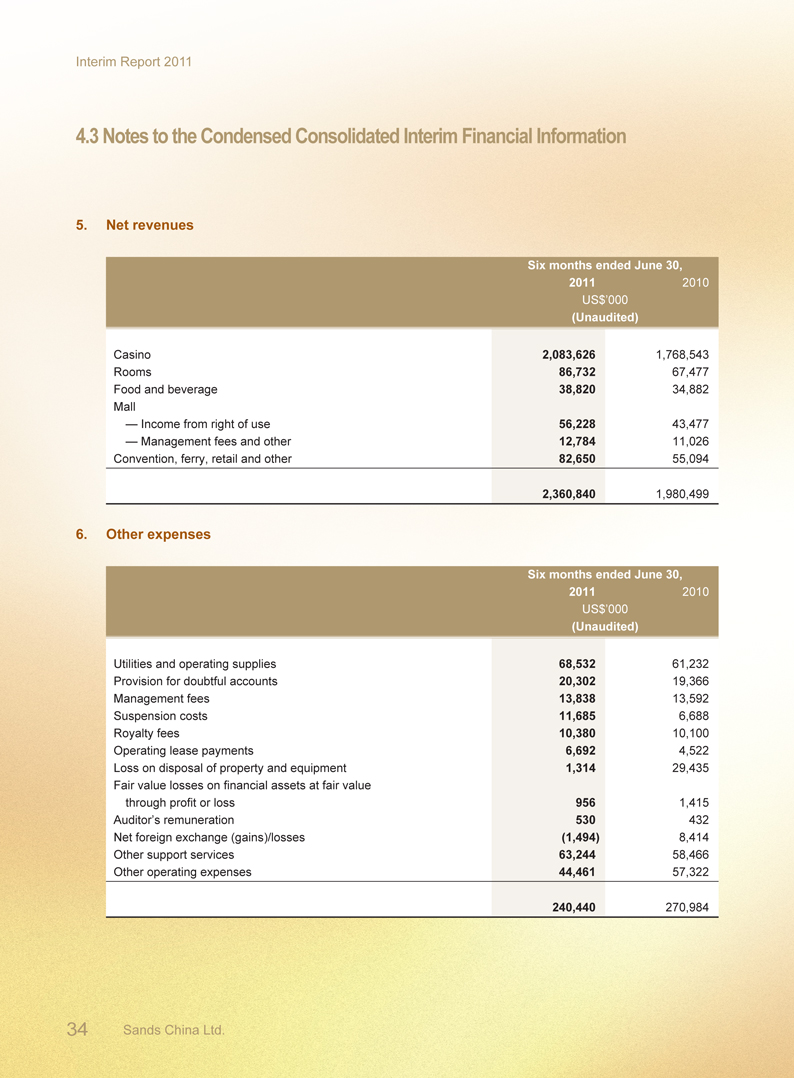
Interim Report 2011
4.3 Notes to the Condensed Consolidated Interim Financial Information
5. Net revenues
Six months ended June 30,
2011 2010
US$’000
(Unaudited)
Casino 2,083,626 1,768,543
Rooms 86,732 67,477
Food and beverage 38,820 34,882
Mall
— Income from right of use 56,228 43,477
— Management fees and other 12,784 11,026
Convention, ferry, retail and other 82,650 55,094
2,360,840 1,980,499
6. Other expenses
Six months ended June 30,
2011 2010
US$’000
(Unaudited)
Utilities and operating supplies 68,532 61,232
Provision for doubtful accounts 20,302 19,366
Management fees 13,838 13,592
Suspension costs 11,685 6,688
Royalty fees 10,380 10,100
Operating lease payments 6,692 4,522
Loss on disposal of property and equipment 1,314 29,435
Fair value losses on financial assets at fair value
through profit or loss 956 1,415
Auditor’s remuneration 530 432
Net foreign exchange (gains)/losses (1,494) 8,414
Other support services 63,244 58,466
Other operating expenses 44,461 57,322
240,440 270,984
34 Sands China Ltd.
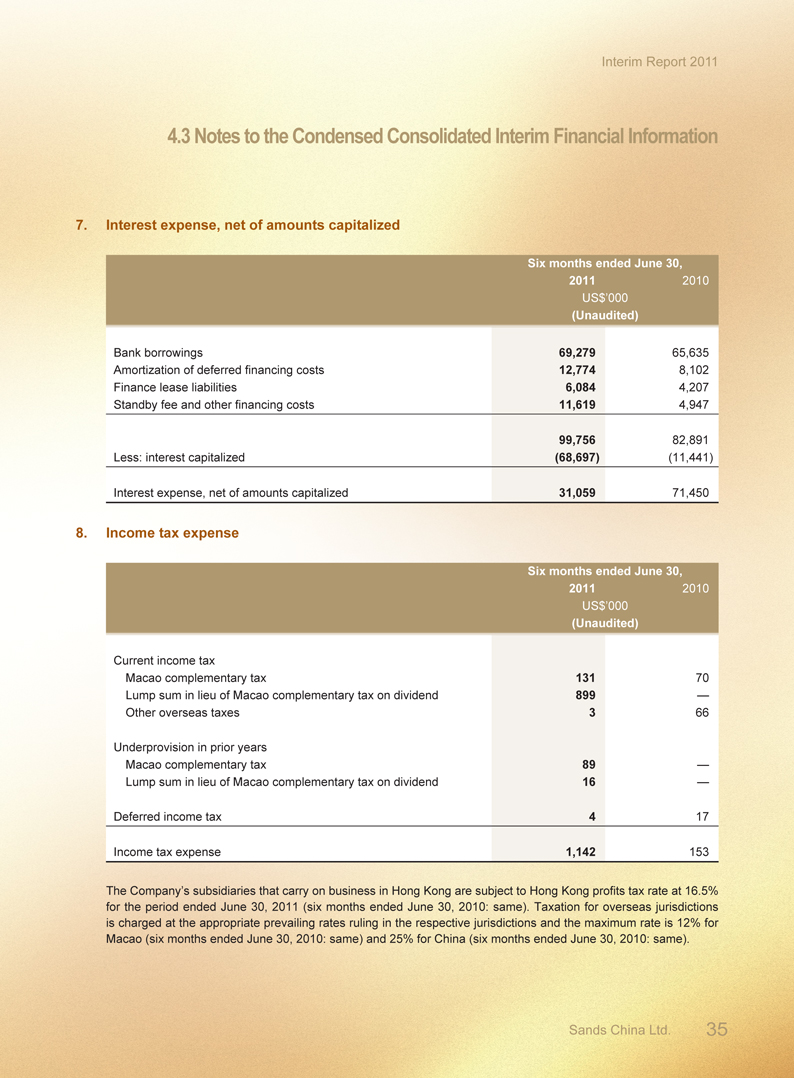
Interim Report 2011
4.3 Notes to the Condensed Consolidated Interim Financial Information
7. Interest expense, net of amounts capitalized
Six months ended June 30,
2011 2010
US$’000
(Unaudited)
Bank borrowings 69,279 65,635
Amortization of deferred financing costs 12,774 8,102
Finance lease liabilities 6,084 4,207
Standby fee and other financing costs 11,619 4,947
99,756 82,891
Less: interest capitalized (68,697) (11,441)
Interest expense, net of amounts capitalized 31,059 71,450
8. Income tax expense
Six months ended June 30,
2011 2010
US$’000
(Unaudited)
Current income tax
Macao complementary tax 131 70
Lump sum in lieu of Macao complementary tax on dividend 899 —
Other overseas taxes 3 66
Underprovision in prior years
Macao complementary tax 89 —
Lump sum in lieu of Macao complementary tax on dividend 16 —
Deferred income tax 4 17
Income tax expense 1,142 153
The Company’s subsidiaries that carry on business in Hong Kong are subject to Hong Kong profits tax rate at 16.5% for the period ended June 30, 2011 (six months ended June 30, 2010: same). Taxation for overseas jurisdictions is charged at the appropriate prevailing rates ruling in the respective jurisdictions and the maximum rate is 12% for Macao (six months ended June 30, 2010: same) and 25% for China (six months ended June 30, 2010: same).
Sands China Ltd. 35
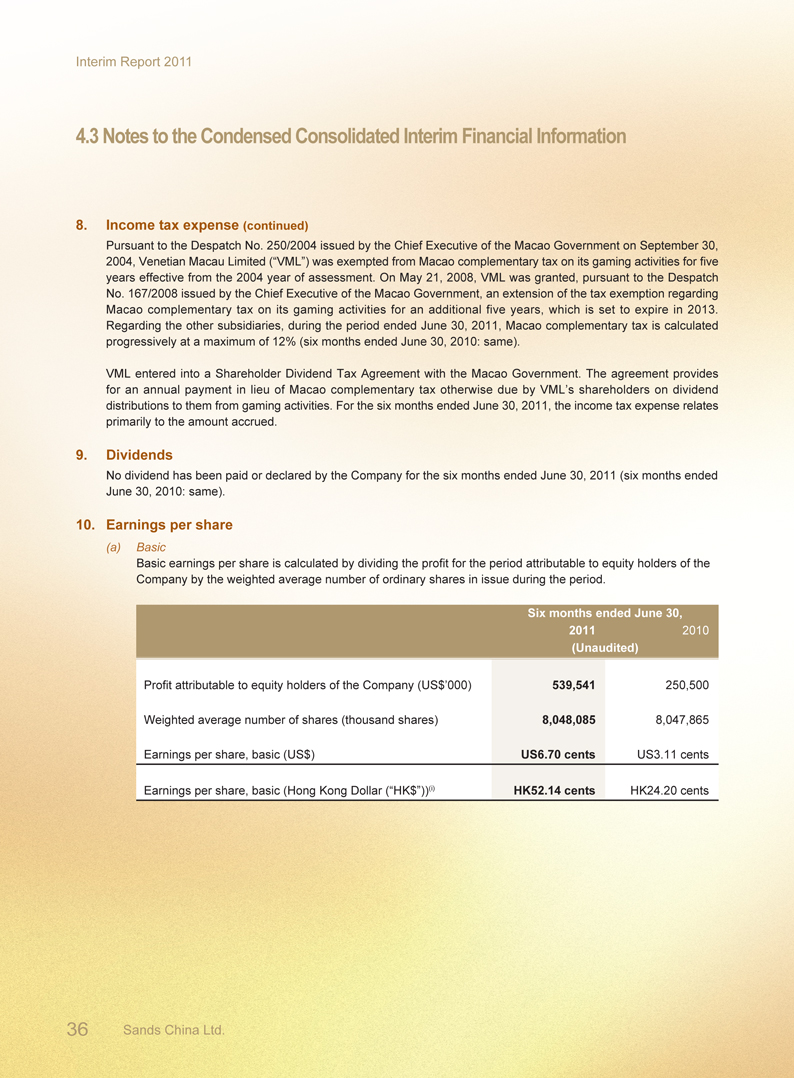
Interim Report 2011
4.3 Notes to the Condensed Consolidated Interim Financial Information
8. Income tax expense (continued)
Pursuant to the Despatch No. 250/2004 issued by the Chief Executive of the Macao Government on September 30,
2004, Venetian Macau Limited (“VML”) was exempted from Macao complementary tax on its gaming activities for five
years effective from the 2004 year of assessment. On May 21, 2008, VML was granted, pursuant to the Despatch
No. 167/2008 issued by the Chief Executive of the Macao Government, an extension of the tax exemption regarding
Macao complementary tax on its gaming activities for an additional five years, which is set to expire in 2013.
Regarding the other subsidiaries, during the period ended June 30, 2011, Macao complementary tax is calculated
progressively at a maximum of 12% (six months ended June 30, 2010: same).
VML entered into a Shareholder Dividend Tax Agreement with the Macao Government. The agreement provides
for an annual payment in lieu of Macao complementary tax otherwise due by VML’s shareholders on dividend
distributions to them from gaming activities. For the six months ended June 30, 2011, the income tax expense relates
primarily to the amount accrued.
9. Dividends
No dividend has been paid or declared by the Company for the six months ended June 30, 2011 (six months ended
June 30, 2010: same).
10. Earnings per share
(a) Basic
Basic earnings per share is calculated by dividing the profit for the period attributable to equity holders of the
Company by the weighted average number of ordinary shares in issue during the period.
Six months ended June 30,
2011 2010
(Unaudited)
Profit attributable to equity holders of the Company (US$’000) 539,541 250,500
Weighted average number of shares (thousand shares) 8,048,085 8,047,865
Earnings per share, basic (US$) US6.70 cents US3.11 cents
Earnings per share, basic (Hong Kong Dollar (“HK$”))(i) HK52.14 cents HK24.20 cents
36 Sands China Ltd.
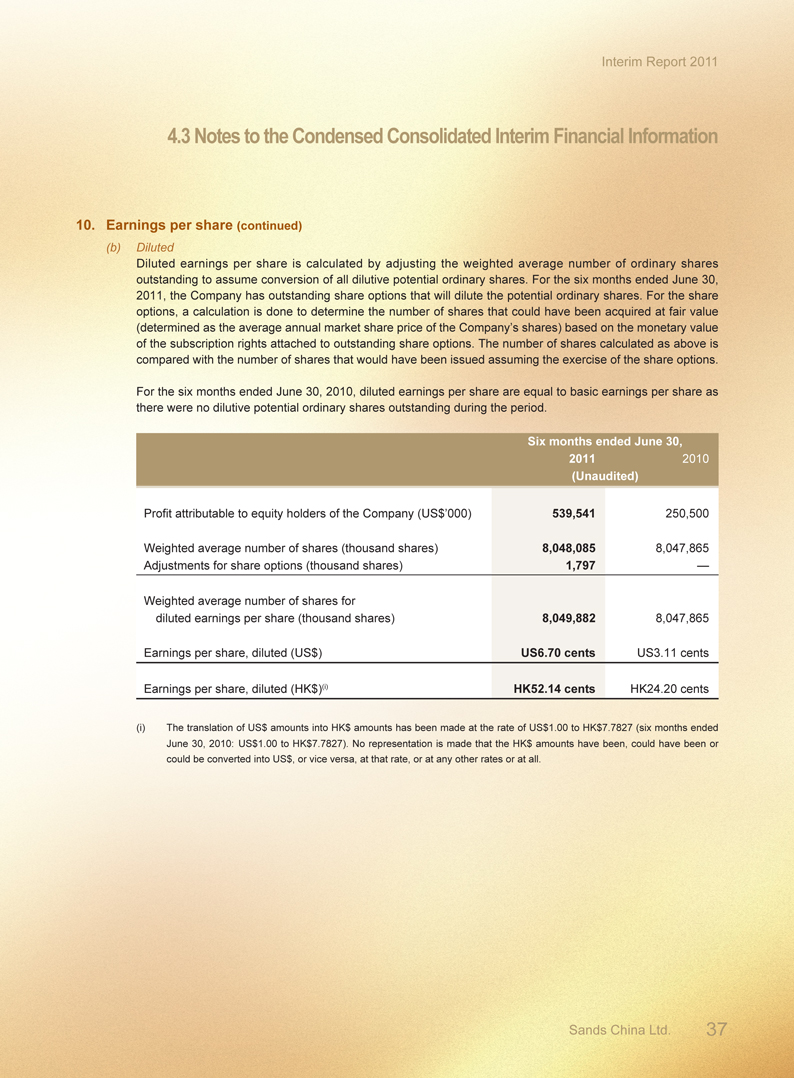
Interim Report 2011
4.3 Notes to the Condensed Consolidated Interim Financial Information
10. Earnings per share (continued)
(b) Diluted
Diluted earnings per share is calculated by adjusting the weighted average number of ordinary shares
outstanding to assume conversion of all dilutive potential ordinary shares. For the six months ended June 30,
2011, the Company has outstanding share options that will dilute the potential ordinary shares. For the share
options, a calculation is done to determine the number of shares that could have been acquired at fair value
(determined as the average annual market share price of the Company’s shares) based on the monetary value
of the subscription rights attached to outstanding share options. The number of shares calculated as above is
compared with the number of shares that would have been issued assuming the exercise of the share options.
For the six months ended June 30, 2010, diluted earnings per share are equal to basic earnings per share as
there were no dilutive potential ordinary shares outstanding during the period.
Six months ended June 30,
2011 2010
(Unaudited)
Profit attributable to equity holders of the Company (US$’000) 539,541 250,500
Weighted average number of shares (thousand shares) 8,048,085 8,047,865
Adjustments for share options (thousand shares) 1,797 —
Weighted average number of shares for
diluted earnings per share (thousand shares) 8,049,882 8,047,865
Earnings per share, diluted (US$) US6.70 cents US3.11 cents
Earnings per share, diluted (HK$)(i) HK52.14 cents HK24.20 cents
(i) The translation of US$ amounts into HK$ amounts has been made at the rate of US$1.00 to HK$7.7827 (six months ended
June 30, 2010: US$1.00 to HK$7.7827). No representation is made that the HK$ amounts have been, could have been or
could be converted into US$, or vice versa, at that rate, or at any other rates or at all.
Sands China Ltd. 37
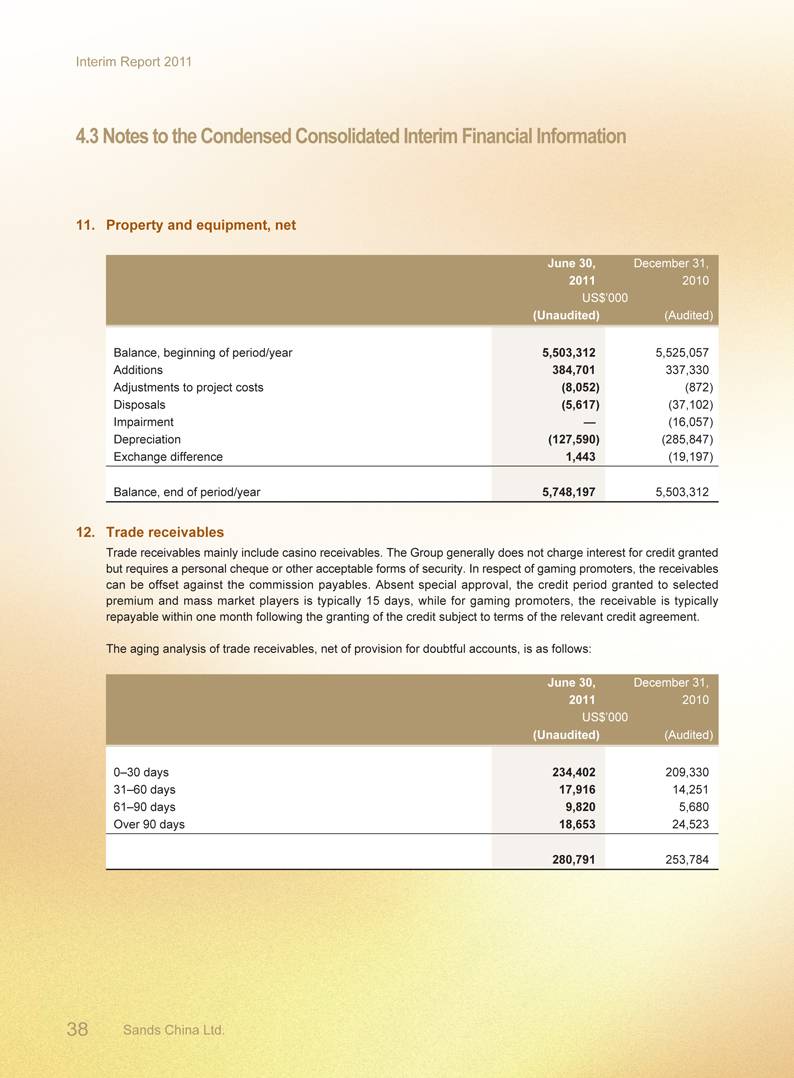
Interim Report 2011
4.3 Notes to the Condensed Consolidated Interim Financial Information
11. Property and equipment, net
June 30, December 31,
2011 2010
US$’000
(Unaudited) (Audited)
Balance, beginning of period/year 5,503,312 5,525,057
Additions 384,701 337,330
Adjustments to project costs (8,052) (872)
Disposals (5,617) (37,102)
Impairment — (16,057)
Depreciation (127,590) (285,847)
Exchange difference 1,443 (19,197)
Balance, end of period/year 5,748,197 5,503,312
12. Trade receivables
Trade receivables mainly include casino receivables. The Group generally does not charge interest for credit granted
but requires a personal cheque or other acceptable forms of security. In respect of gaming promoters, the receivables
can be offset against the commission payables. Absent special approval, the credit period granted to selected
premium and mass market players is typically 15 days, while for gaming promoters, the receivable is typically
repayable within one month following the granting of the credit subject to terms of the relevant credit agreement.
The aging analysis of trade receivables, net of provision for doubtful accounts, is as follows:
June 30, December 31,
2011 2010
US$’000
(Unaudited) (Audited)
0–30 days 234,402 209,330
31–60 days 17,916 14,251
61–90 days 9,820 5,680
Over 90 days 18,653 24,523
280,791 253,784
38 Sands China Ltd.
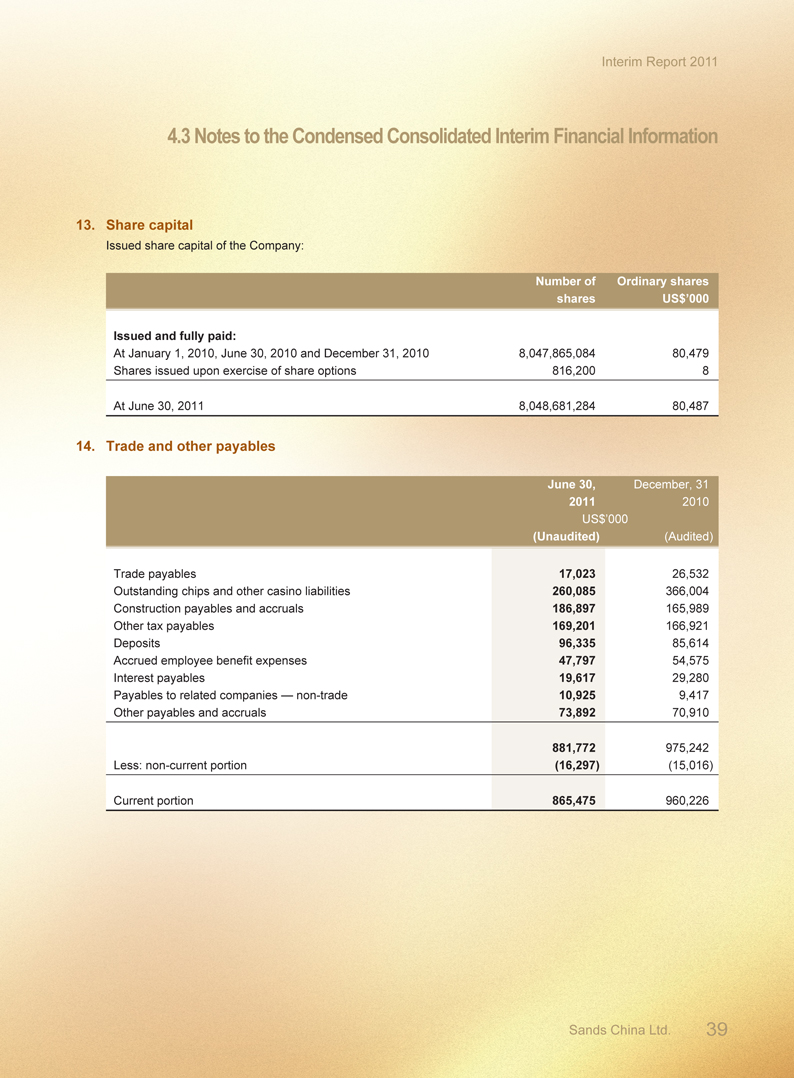
Interim Report 2011
4.3 Notes to the Condensed Consolidated Interim Financial Information
13. Share capital
Issued share capital of the Company:
Number of Ordinary shares
shares US$’000
Issued and fully paid:
At January 1, 2010, June 30, 2010 and December 31, 2010 8,047,865,084 80,479
Shares issued upon exercise of share options 816,200 8
At June 30, 2011 8,048,681,284 80,487
14. Trade and other payables
June 30, December, 31
2011 2010
US$’000
(Unaudited) (Audited)
Trade payables 17,023 26,532
Outstanding chips and other casino liabilities 260,085 366,004
Construction payables and accruals 186,897 165,989
Other tax payables 169,201 166,921
Deposits 96,335 85,614
Accrued employee benefit expenses 47,797 54,575
Interest payables 19,617 29,280
Payables to related companies — non-trade 10,925 9,417
Other payables and accruals 73,892 70,910
881,772 975,242
Less: non-current portion (16,297) (15,016)
Current portion 865,475 960,226
Sands China Ltd. 39
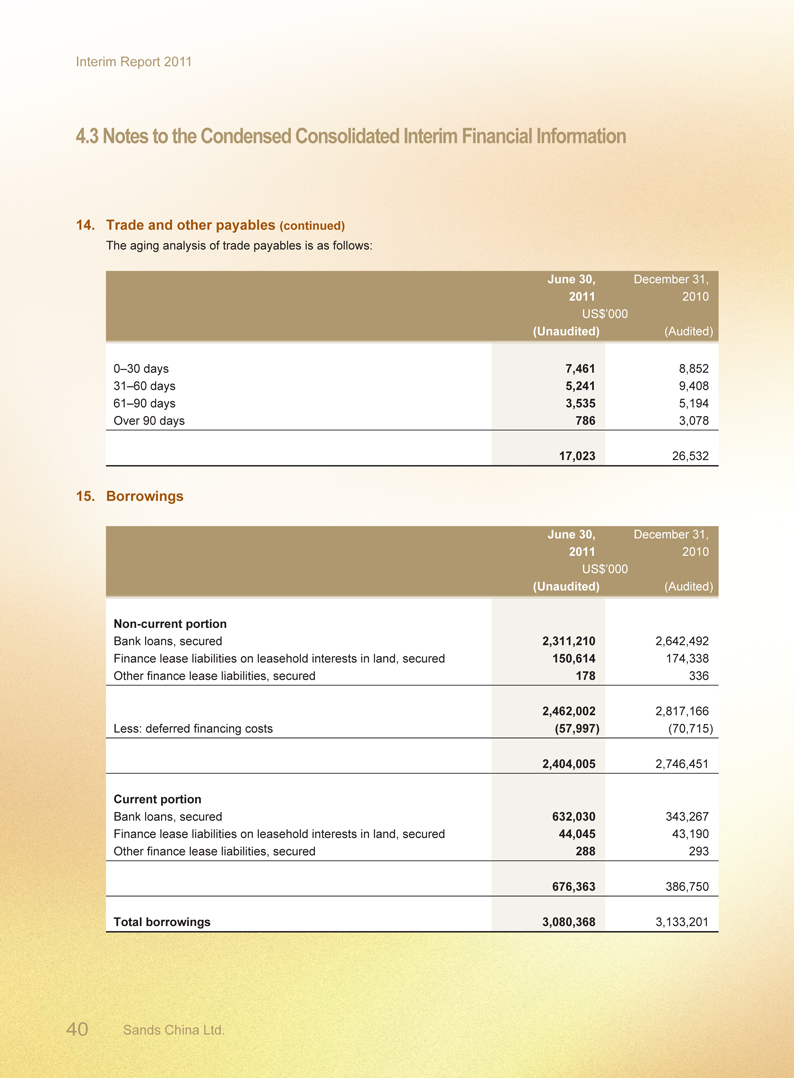
Interim Report 2011
4.3 Notes to the Condensed Consolidated Interim Financial Information
14. Trade and other payables (continued)
The aging analysis of trade payables is as follows:
June 30, December 31,
2011 2010
US$’000
(Unaudited) (Audited)
0–30 days 7,461 8,852
31–60 days 5,241 9,408
61–90 days 3,535 5,194
Over 90 days 786 3,078
17,023 26,532
15. Borrowings
June 30, December 31,
2011 2010
US$’000
(Unaudited) (Audited)
Non-current portion
Bank loans, secured 2,311,210 2,642,492
Finance lease liabilities on leasehold interests in land, secured 150,614 174,338
Other finance lease liabilities, secured 178 336
2,462,002 2,817,166
Less: deferred financing costs (57,997) (70,715)
2,404,005 2,746,451
Current portion
Bank loans, secured 632,030 343,267
Finance lease liabilities on leasehold interests in land, secured 44,045 43,190
Other finance lease liabilities, secured 288 293
676,363 386,750
Total borrowings 3,080,368 3,133,201
40 Sands China Ltd.
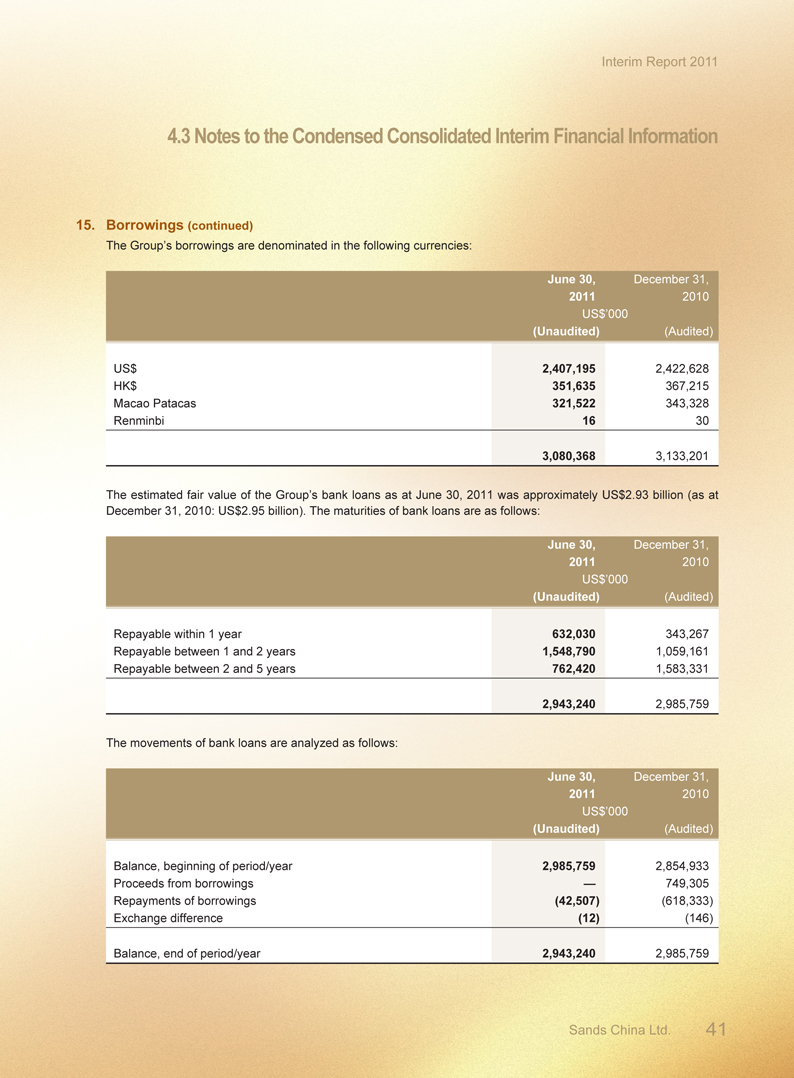
Interim Report 2011
4.3 Notes to the Condensed Consolidated Interim Financial Information
15. Borrowings (continued)
The Group’s borrowings are denominated in the following currencies:
June 30, December 31,
2011 2010
US$’000
(Unaudited) (Audited)
US$ 2,407,195 2,422,628
HK$ 351,635 367,215
Macao Patacas 321,522 343,328
Renminbi 16 30
3,080,368 3,133,201
The estimated fair value of the Group’s bank loans as at June 30, 2011 was approximately US$2.93 billion (as at December 31, 2010: US$2.95 billion). The maturities of bank loans are as follows:
June 30, December 31,
2011 2010
US$’000
(Unaudited) (Audited)
Repayable within 1 year 632,030 343,267
Repayable between 1 and 2 years 1,548,790 1,059,161
Repayable between 2 and 5 years 762,420 1,583,331
2,943,240 2,985,759
The movements of bank loans are analyzed as follows:
June 30, December 31,
2011 2010
US$’000
(Unaudited) (Audited)
Balance, beginning of period/year 2,985,759 2,854,933
Proceeds from borrowings — 749,305
Repayments of borrowings (42,507) (618,333)
Exchange difference (12) (146)
Balance, end of period/year 2,943,240 2,985,759
Sands China Ltd. 41
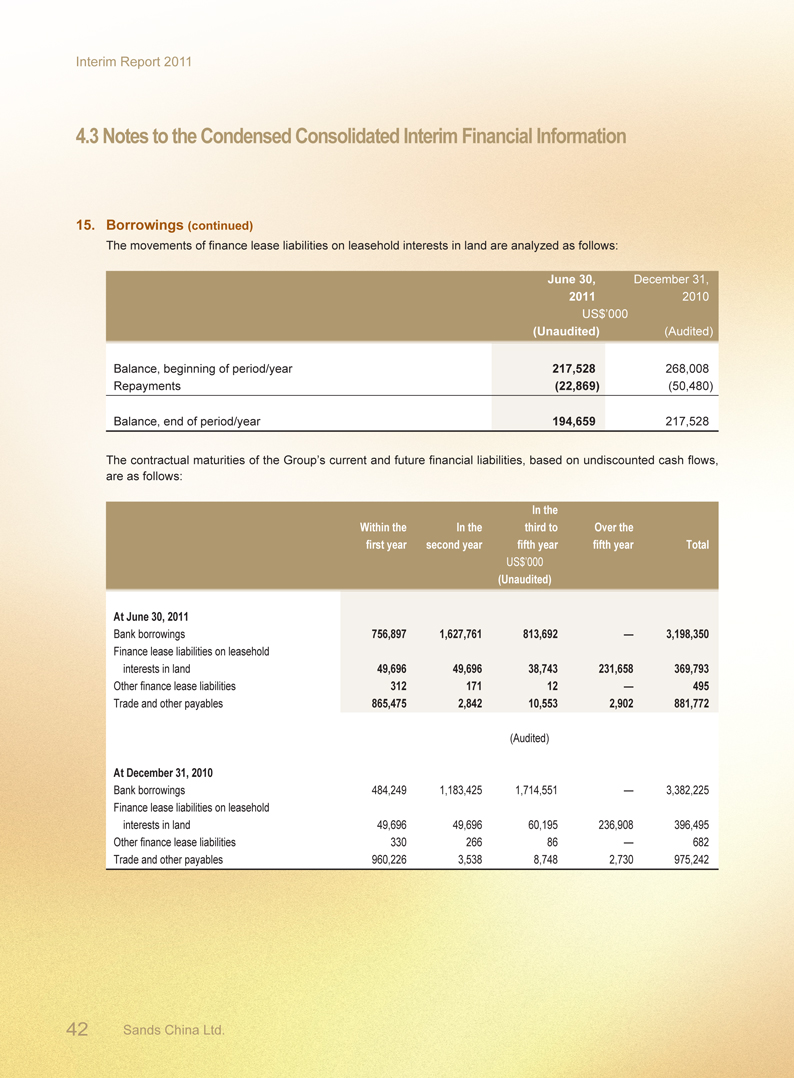
Interim Report 2011
4.3 Notes to the Condensed Consolidated Interim Financial Information
15. Borrowings (continued)
The movements of finance lease liabilities on leasehold interests in land are analyzed as follows:
June 30, December 31,
2011 2010
US$’000
(Unaudited) (Audited)
Balance, beginning of period/year 217,528 268,008
Repayments (22,869) (50,480)
Balance, end of period/year 194,659 217,528
The contractual maturities of the Group’s current and future financial liabilities, based on undiscounted cash flows, are as follows:
In the
Within the In the third to Over the
first year second year fifth year fifth year Total
US$’000
(Unaudited)
At June 30, 2011
Bank borrowings 756,897 1,627,761 813,692 — 3,198,350
Finance lease liabilities on leasehold
interests in land 49,696 49,696 38,743 231,658 369,793
Other finance lease liabilities 312 171 12 — 495
Trade and other payables 865,475 2,842 10,553 2,902 881,772
(Audited)
At December 31, 2010
Bank borrowings 484,249 1,183,425 1,714,551 — 3,382,225
Finance lease liabilities on leasehold
interests in land 49,696 49,696 60,195 236,908 396,495
Other finance lease liabilities 330 266 86 — 682
Trade and other payables 960,226 3,538 8,748 2,730 975,242
42 Sands China Ltd.
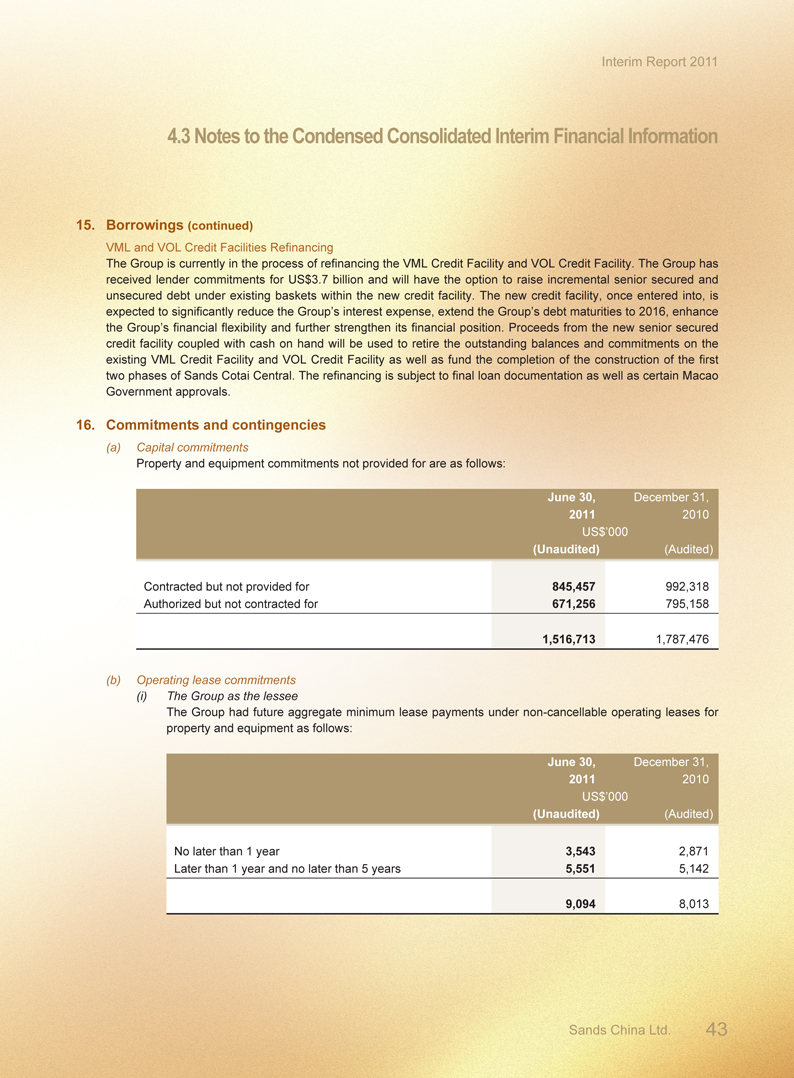
Interim Report 2011
4.3 Notes to the Condensed Consolidated Interim Financial Information
15. Borrowings (continued)
VML and VOL Credit Facilities Refinancing
The Group is currently in the process of refinancing the VML Credit Facility and VOL Credit Facility. The Group has
received lender commitments for US$3.7 billion and will have the option to raise incremental senior secured and
unsecured debt under existing baskets within the new credit facility. The new credit facility, once entered into, is
expected to significantly reduce the Group’s interest expense, extend the Group’s debt maturities to 2016, enhance
the Group’s financial flexibility and further strengthen its financial position. Proceeds from the new senior secured
credit facility coupled with cash on hand will be used to retire the outstanding balances and commitments on the
existing VML Credit Facility and VOL Credit Facility as well as fund the completion of the construction of the fi rst
two phases of Sands Cotai Central. The refinancing is subject to final loan documentation as well as certain Macao
Government approvals.
16. Commitments and contingencies
(a) Capital commitments
Property and equipment commitments not provided for are as follows:
June 30, December 31,
2011 2010
US$’000
(Unaudited) (Audited)
Contracted but not provided for 845,457 992,318
Authorized but not contracted for 671,256 795,158
1,516,713 1,787,476
(b) Operating lease commitments
(i) The Group as the lessee
The Group had future aggregate minimum lease payments under non-cancellable operating leases for
property and equipment as follows:
June 30, December 31,
2011 2010
US$’000
(Unaudited) (Audited)
No later than 1 year 3,543 2,871
Later than 1 year and no later than 5 years 5,551 5,142
9,094 8,013
Sands China Ltd. 43
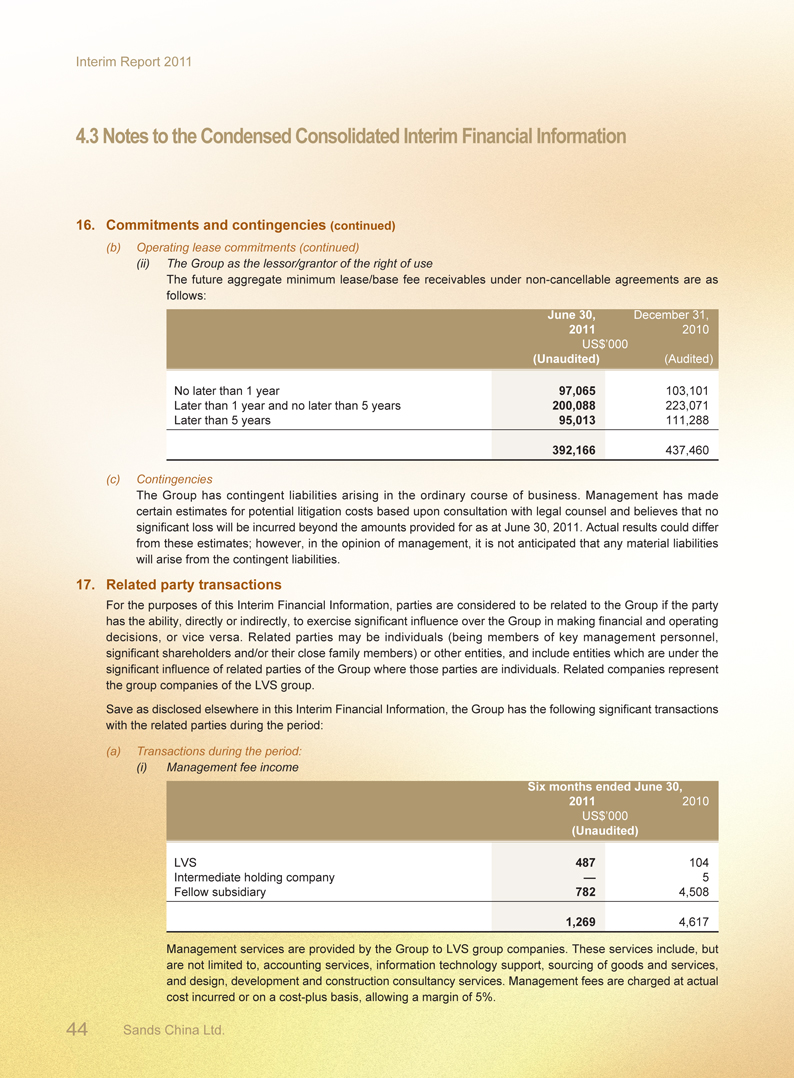
Interim Report 2011
4.3 Notes to the Condensed Consolidated Interim Financial Information
16. Commitments and contingencies (continued)
(b) Operating lease commitments (continued)
(ii) The Group as the lessor/grantor of the right of use
The future aggregate minimum lease/base fee receivables under non-cancellable agreements are as
follows:
June 30, December 31,
2011 2010
US$’000
(Unaudited) (Audited)
No later than 1 year 97,065 103,101
Later than 1 year and no later than 5 years 200,088 223,071
Later than 5 years 95,013 111,288
392,166 437,460
(c) Contingencies
The Group has contingent liabilities arising in the ordinary course of business. Management has made
certain estimates for potential litigation costs based upon consultation with legal counsel and believes that no
significant loss will be incurred beyond the amounts provided for as at June 30, 2011. Actual results could differ
from these estimates; however, in the opinion of management, it is not anticipated that any material liabilities
will arise from the contingent liabilities.
17. Related party transactions
For the purposes of this Interim Financial Information, parties are considered to be related to the Group if the party
has the ability, directly or indirectly, to exercise significant influence over the Group in making financial and operating
decisions, or vice versa. Related parties may be individuals (being members of key management personnel,
significant shareholders and/or their close family members) or other entities, and include entities which are under the
significant influence of related parties of the Group where those parties are individuals. Related companies represent
the group companies of the LVS group.
Save as disclosed elsewhere in this Interim Financial Information, the Group has the following significant transactions
with the related parties during the period:
(a) Transactions during the period:
(i) Management fee income
Six months ended June 30,
2011 2010
US$’000
(Unaudited)
LVS 487 104
Intermediate holding company — 5
Fellow subsidiary 782 4,508
1,269 4,617
Management services are provided by the Group to LVS group companies. These services include, but are not limited to, accounting services, information technology support, sourcing of goods and services, and design, development and construction consultancy services. Management fees are charged at actual cost incurred or on a cost-plus basis, allowing a margin of 5%.
44 Sands China Ltd.
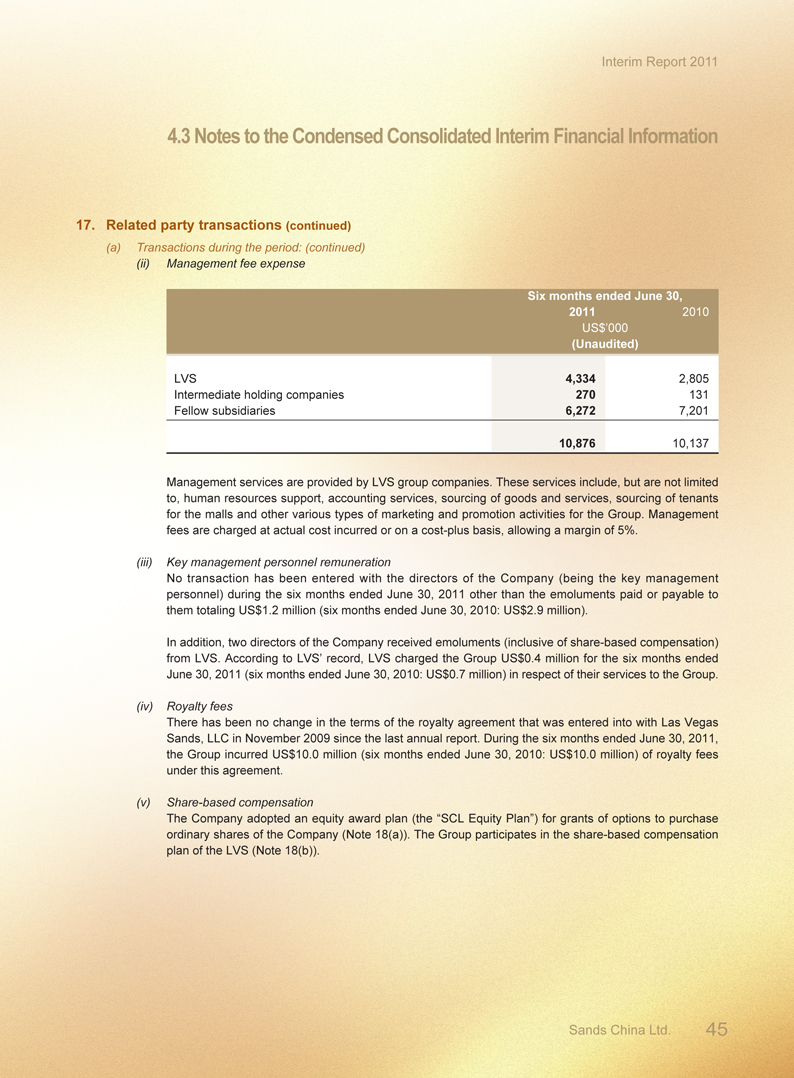
Interim Report 2011
4.3 Notes to the Condensed Consolidated Interim Financial Information
17. Related party transactions (continued)
(a) Transactions during the period: (continued)
(ii) Management fee expense
Six months ended June 30,
2011 2010
US$’000
(Unaudited)
LVS 4,334 2,805
Intermediate holding companies 270 131
Fellow subsidiaries 6,272 7,201
10,876 10,137
Management services are provided by LVS group companies. These services include, but are not limited
to, human resources support, accounting services, sourcing of goods and services, sourcing of tenants
for the malls and other various types of marketing and promotion activities for the Group. Management
fees are charged at actual cost incurred or on a cost-plus basis, allowing a margin of 5%.
(iii) Key management personnel remuneration
No transaction has been entered with the directors of the Company (being the key management
personnel) during the six months ended June 30, 2011 other than the emoluments paid or payable to
them totaling US$1.2 million (six months ended June 30, 2010: US$2.9 million).
In addition, two directors of the Company received emoluments (inclusive of share-based compensation)
from LVS. According to LVS’ record, LVS charged the Group US$0.4 million for the six months ended
June 30, 2011 (six months ended June 30, 2010: US$0.7 million) in respect of their services to the Group.
(iv) Royalty fees
There has been no change in the terms of the royalty agreement that was entered into with Las Vegas
Sands, LLC in November 2009 since the last annual report. During the six months ended June 30, 2011,
the Group incurred US$10.0 million (six months ended June 30, 2010: US$10.0 million) of royalty fees
under this agreement.
(v) Share-based compensation
The Company adopted an equity award plan (the “SCL Equity Plan”) for grants of options to purchase
ordinary shares of the Company (Note 18(a)). The Group participates in the share-based compensation
plan of the LVS (Note 18(b)).
Sands China Ltd. 45
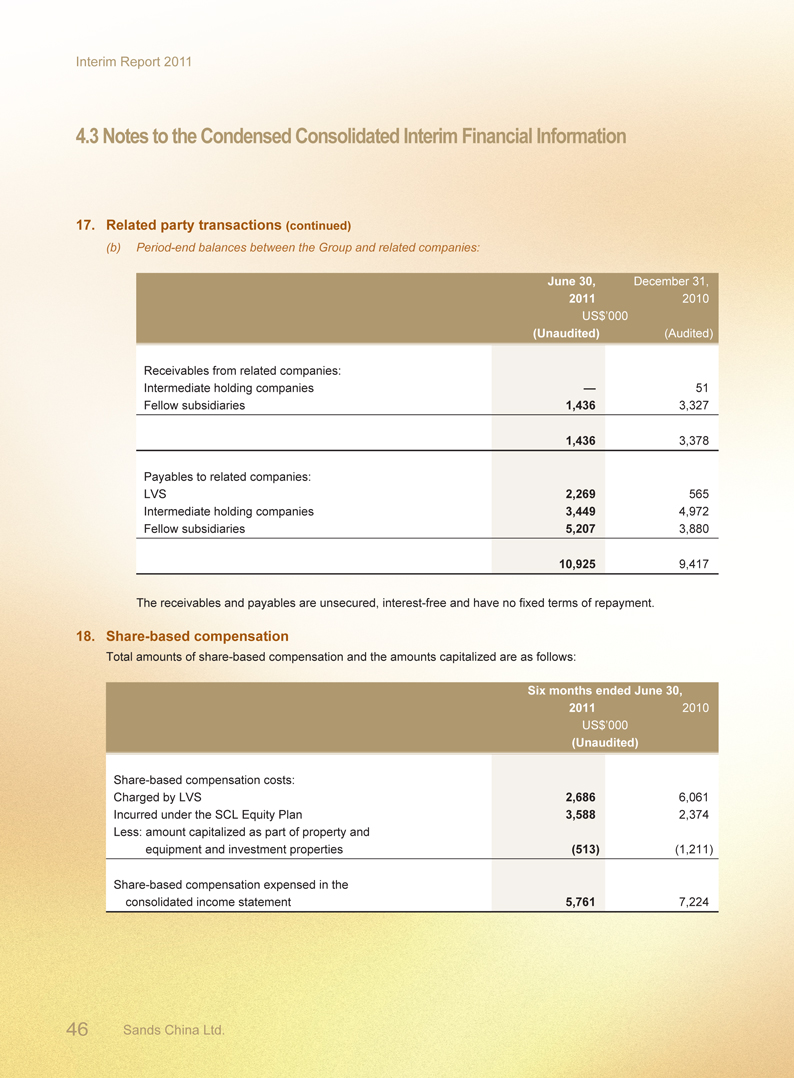
Interim Report 2011
4.3 Notes to the Condensed Consolidated Interim Financial Information
17. Related party transactions (continued)
(b) Period-end balances between the Group and related companies:
June 30, December 31,
2011 2010
US$’000
(Unaudited) (Audited)
Receivables from related companies:
Intermediate holding companies — 51
Fellow subsidiaries 1,436 3,327
1,436 3,378
Payables to related companies:
LVS 2,269 565
Intermediate holding companies 3,449 4,972
Fellow subsidiaries 5,207 3,880
10,925 9,417
The receivables and payables are unsecured, interest-free and have no fixed terms of repayment.
18. Share-based compensation
Total amounts of share-based compensation and the amounts capitalized are as follows:
Six months ended June 30,
2011 2010
US$’000
(Unaudited)
Share-based compensation costs:
Charged by LVS 2,686 6,061
Incurred under the SCL Equity Plan 3,588 2,374
Less: amount capitalized as part of property and
equipment and investment properties (513) (1,211)
Share-based compensation expensed in the
consolidated income statement 5,761 7,224
46 Sands China Ltd.
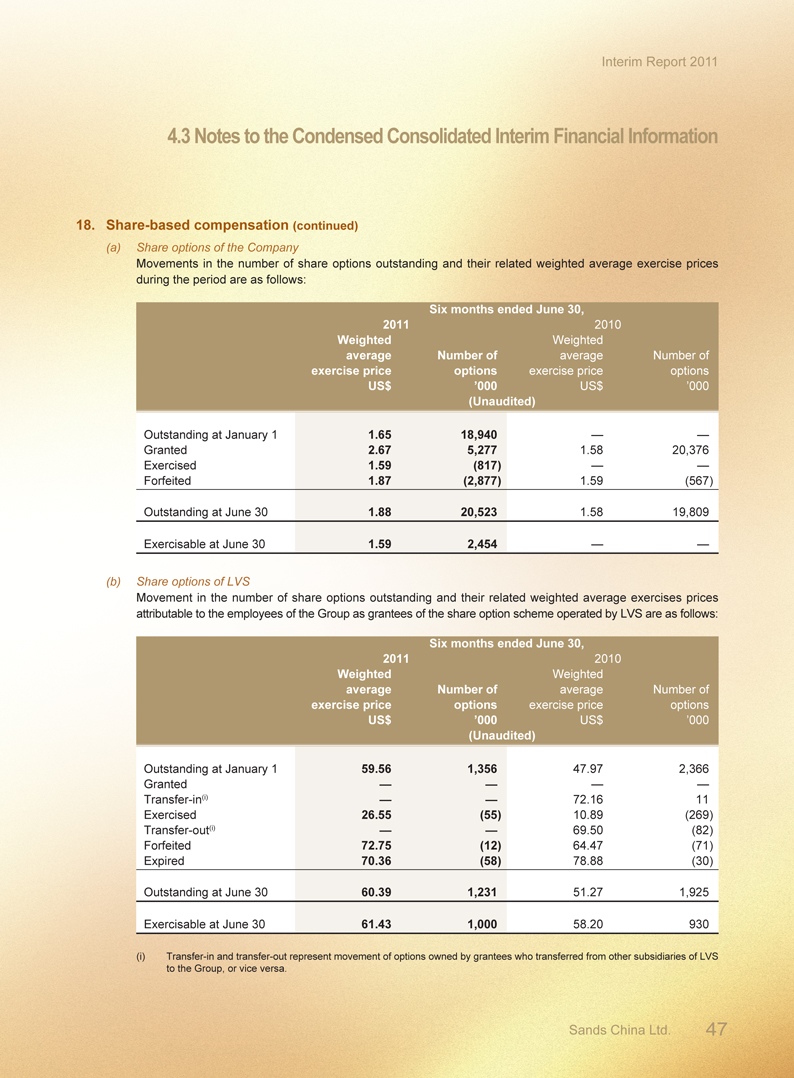
Interim Report 2011
4.3 Notes to the Condensed Consolidated Interim Financial Information
18. Share-based compensation (continued)
(a) Share options of the Company
Movements in the number of share options outstanding and their related weighted average exercise prices
during the period are as follows:
Six months ended June 30,
2011 2010
Weighted Weighted
average Number of average Number of
exercise price options exercise price options
US$ ‘000 US$’000
(Unaudited)
Outstanding at January 1 1.65 18,940 — —
Granted 2.67 5,277 1.58 20,376
Exercised 1.59 (817) — —
Forfeited 1.87 (2,877) 1.59 (567)
Outstanding at June 30 1.88 20,523 1.58 19,809
Exercisable at June 30 1.59 2,454 — —
(b) Share options of LVS
Movement in the number of share options outstanding and their related weighted average exercises prices attributable to the employees of the Group as grantees of the share option scheme operated by LVS are as follows:
Six months ended June 30,
2011 2010
Weighted Weighted
average Number of average Number of
exercise price options exercise price options
US$ ‘000 US$’000
(Unaudited)
Outstanding at January 1 59.56 1,356 47.97 2,366
Granted — — — —
Transfer-in(i) — — 72.16 11
Exercised 26.55 (55) 10.89 (269)
Transfer-out(i) — — 69.50 (82)
Forfeited 72.75 (12) 64.47 (71)
Expired 70.36 (58) 78.88 (30)
Outstanding at June 30 60.39 1,231 51.27 1,925
Exercisable at June 30 61.43 1,000 58.20 930
(i) Transfer-in and transfer-out represent movement of options owned by grantees who transferred from other subsidiaries of LVS to the Group, or vice versa.
Sands China Ltd. 47
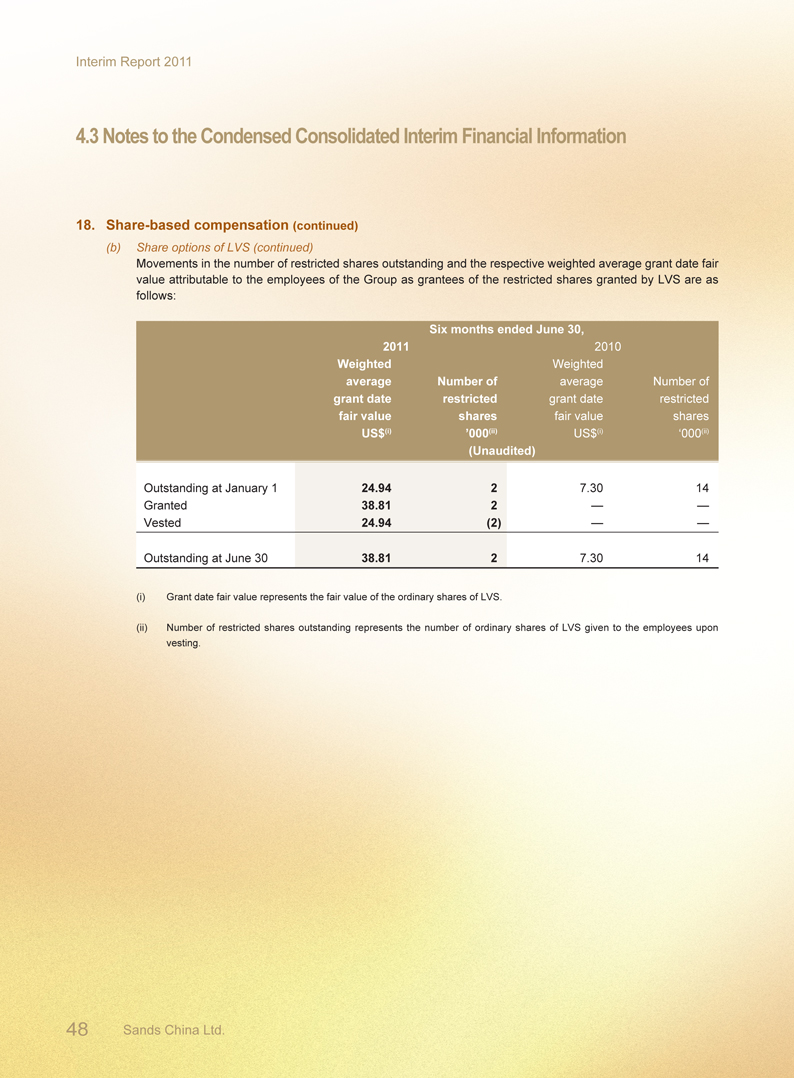
Interim Report 2011
4.3 Notes to the Condensed Consolidated Interim Financial Information
18. Share-based compensation (continued)
(b) Share options of LVS (continued)
Movements in the number of restricted shares outstanding and the respective weighted average grant date fair
value attributable to the employees of the Group as grantees of the restricted shares granted by LVS are as
follows:
Six months ended June 30,
2011 2010
Weighted average grant date fair value
Number of restricted shares
Weighted average grant date fair value
Number of restricted shares
US$(i) ’000(ii) US$(i) ’000(ii)
(Unaudited)
Outstanding at January 1 24.94 2 7.30 14
Granted 38.81 2 — —
Vested 24.94 (2) — —
Outstanding at June 30 38.81 2 7.30 14
(i) Grant date fair value represents the fair value of the ordinary shares of LVS.
(ii) Number of restricted shares outstanding represents the number of ordinary shares of LVS given to the employees upon
vesting.
48 Sands China Ltd.
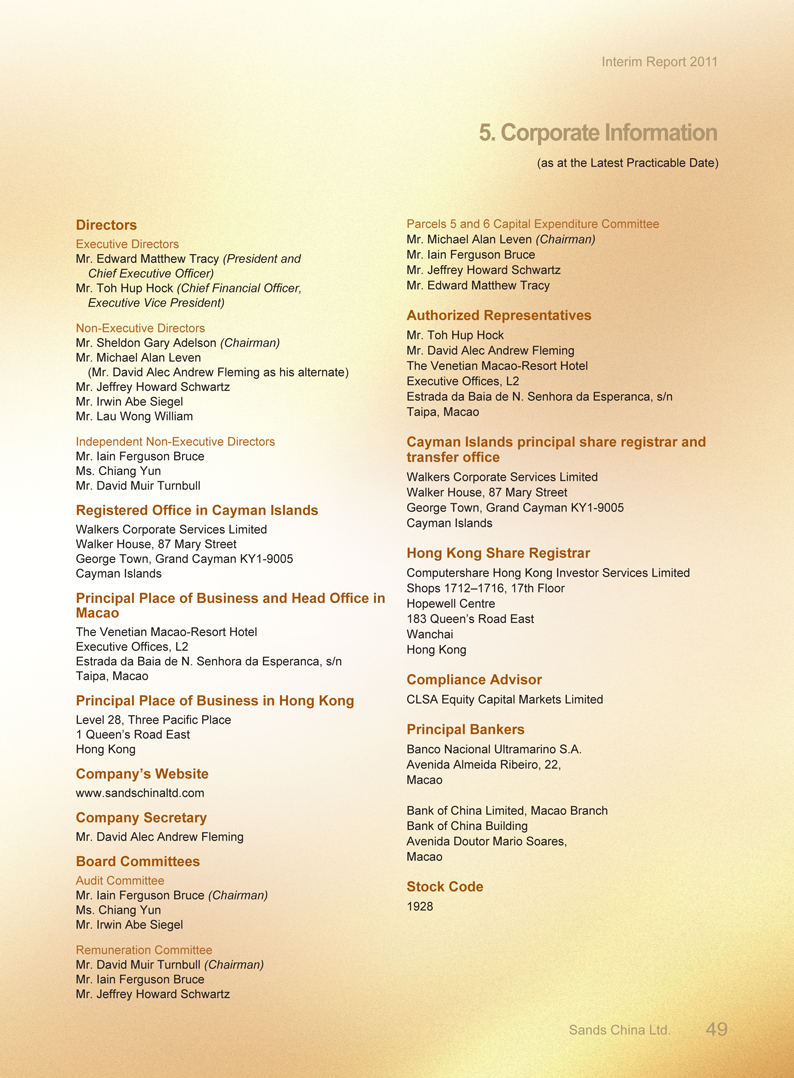
Interim Report 2011
5. Corporate Information
(as at the Latest Practicable Date)
Directors
Executive Directors
Mr. Edward Matthew Tracy (President and
Chief Executive Officer)
Mr. Toh Hup Hock (Chief Financial Officer,
Executive Vice President)
Non-Executive Directors
Mr. Sheldon Gary Adelson (Chairman)
Mr. Michael Alan Leven
(Mr. David Alec Andrew Fleming as his alternate)
Mr. Jeffrey Howard Schwartz
Mr. Irwin Abe Siegel
Mr. Lau Wong William
Independent Non-Executive Directors
Mr. Iain Ferguson Bruce
Ms. Chiang Yun
Mr. David Muir Turnbull
Registered Office in Cayman Islands
Walkers Corporate Services Limited
Walker House, 87 Mary Street
George Town, Grand Cayman KY1-9005
Cayman Islands
Principal Place of Business and Head Office in
Macao
The Venetian Macao-Resort Hotel
Executive Offices, L2
Estrada da Baia de N. Senhora da Esperanca, s/n
Taipa, Macao
Principal Place of Business in Hong Kong
Level 28, Three Pacific Place
1 Queen’s Road East
Hong Kong
Company’s Website
www.sandschinaltd.com
Company Secretary
Mr. David Alec Andrew Fleming
Board Committees
Audit Committee
Mr. Iain Ferguson Bruce (Chairman)
Ms. Chiang Yun
Mr. Irwin Abe Siegel
Remuneration Committee
Mr. David Muir Turnbull (Chairman)
Mr. Iain Ferguson Bruce
Mr. Jeffrey Howard Schwartz
Parcels 5 and 6 Capital Expenditure Committee
Mr. Michael Alan Leven (Chairman)
Mr. Iain Ferguson Bruce
Mr. Jeffrey Howard Schwartz
Mr. Edward Matthew Tracy
Authorized Representatives
Mr. Toh Hup Hock
Mr. David Alec Andrew Fleming
The Venetian Macao-Resort Hotel
Executive Offices, L2
Estrada da Baia de N. Senhora da Esperanca, s/n
Taipa, Macao
Cayman Islands principal share registrar and
transfer office
Walkers Corporate Services Limited
Walker House, 87 Mary Street
George Town, Grand Cayman KY1-9005
Cayman Islands
Hong Kong Share Registrar
Computershare Hong Kong Investor Services Limited
Shops 1712–1716, 17th Floor
Hopewell Centre
183 Queen’s Road East
Wanchai
Hong Kong
Compliance Advisor
CLSA Equity Capital Markets Limited
Principal Bankers
Banco Nacional Ultramarino S.A.
Avenida Almeida Ribeiro, 22,
Macao
Bank of China Limited, Macao Branch
Bank of China Building
Avenida Doutor Mario Soares,
Macao
Stock Code
1928
Sands China Ltd. 49
Interim Report 2011
6. Contact Us
Interim Report
This 2011 Interim Report is printed in English and Chinese languages and is available on our website at
www.sandschinaltd.com from September 15, 2011 and was posted to Shareholders on September 16, 2011.
Those Shareholders who received our 2011 Interim Report electronically and would like to receive a printed copy or vice
versa may at any time change their means of receipt of the Company’s corporate communications free of charge by
reasonable notice in writing or by email to sandschina.ecom@computershare.com.hk to the Company c/o the Hong Kong
Share Registrar. Those Shareholders who have chosen to receive this 2011 Interim Report by electronic means and who,
for any reason, have difficulty in receiving or gaining access to this 2011 Interim Report, may also request to be sent a copy
of this 2011 Interim Report in printed form free of charge by submitting a written request or email to the Company c/o the
Hong Kong Share Registrar.
Contact Us
Address: Level 28, Three Pacific Place, 1 Queen’s Road East, Hong Kong
Telephone: +853 8118 2888
Facsimile: +853 2888 3382
Email: scl-enquiries@venetian.com.mo
50 Sands China Ltd.
Interim Report 2011
7. Glossary
“adjusted EBITDA” adjusted EBITDA is profit before share-based compensation, corporate expense, pre-
opening expense, depreciation and amortization (net of amortization of show production
costs), gain/(loss) on disposal of property and equipment, net foreign exchange gains/
(losses), fair value losses on financial assets at fair value through profit or loss, interest
and income tax expense. With respect to adjusted EBITDA for each of our properties, we
make allocations of the shared support expenses based on revenue attributable to each
property. Adjusted EBITDA is used by management as the primary measure of operating
performance of our Group’s properties and to compare the operating performance of
our Group’s properties with that of its competitors. However, adjusted EBITDA should
not be considered in isolation; construed as an alternative to profit or operating profit;
as an indicator of our IFRS operating performance, other combined operations or cash
flow data; or as an alternative to cash flow as a measure of liquidity. Adjusted EBITDA
presented in the report may not be comparable to other similarly titled measures of other
companies. In addition, our adjusted EBITDA presented in the report may differ from
adjusted EBITDA presented by LVS for its Macao segment in its filings with the U.S.
Securities and Exchange Commission
“ADR” the average daily rate per occupied room in a given time period, calculated as room
revenue divided by the number of rooms sold
“Board” the board of directors of the Company
“Bonds” the US$600.0 million exchangeable bonds due 2014 issued by VVDI (II), which were
mandatorily and automatically exchanged for Shares upon the Listing
“cage” a secure room within a casino with a facility that allows patrons to exchange cash for chips
required to participate in gaming activities, or to exchange chips for cash
“CAGR” compound annual growth rate
“Capitalization Issue” the issue of Shares made upon the capitalization of certain sums standing to the credit
of the share premium account of our Company as further described in “Statutory and
General Information — Further Information About Our Group — Resolutions in Writing of
the Sole Shareholder of Our Company Passed on November 8, 2009” in Appendix VII of
our Prospectus
“casino(s)” a gaming facility that provides casino games consisting of table games operated in VIP
areas or mass market areas, electronic games, slot machines and other casino games
Sands China Ltd. 51
Interim Report 2011
7. Glossary
“Chief Executive” a person who either alone or together with one or more other persons is or will be
responsible under the immediate authority of the board of directors for the conduct of the
business of the Company
“China” or the “PRC” the People’s Republic of China excluding, for the purpose of this report only, Hong Kong,
Macao and Taiwan, unless the context otherwise requires
“chip(s)” tokens issued by a casino to players in exchange for cash or credit, which may be used to
place bets on gaming tables, in lieu of cash
“Company,” “our,” Sands China Ltd., a company incorporated in the Cayman Islands on July 15, 2009 as an
“we,” “us,” or exempted company with limited liability and, except where the context otherwise requires,
“Sands China” all of its subsidiaries, or where the context refers to the time before it became the holding
company of its present subsidiaries, its present subsidiaries. When used in the context of
gaming operations or the Subconcession, “we,” “us,” or “our” refers exclusively to VML
“Companies the Companies Ordinance (Chapter 32 of the Laws of Hong Kong) as amended,
Ordinance” supplemented or otherwise modified from time to time
“Concessionaire(s)” the holder(s) of a concession for the operation of casino games in the MSAR. As at the
Latest Practicable Date, the Concessionaires were Galaxy, SJM and Wynn Macau
“Controlling has the meaning ascribed to it under the Listing Rules and, with respect to our Company,
Shareholder(s)” the controlling shareholders as referred to in “Relationship with Our Controlling
Shareholders” of our Prospectus
“Cotai” the name given to the land reclamation area in the MSAR between the islands of Coloane
and Taipa
“Cotai Strip” integrated resort projects on Cotai being developed by us and inspired by the Las Vegas
Strip in Las Vegas, Nevada, U.S.A. LVS has registered the Cotai Strip trademark in Hong
Kong and Macao
“DICJ” Gaming Inspection and Coordination Bureau (“Direcção de Inspecção e Coordenação de
Jogos”) under the Secretary for Economy and Finance of the MSAR
“Director(s)” member(s) of the board of directors of the Company
52 Sands China Ltd.
Interim Report 2011
7. Glossary
“DSEC” the Statistics and Census Service of the MSAR
“EBITDA” earnings before interest, taxes, depreciation and amortization
“Exchange Rate” save as otherwise stated, amounts denominated in U.S. dollars, MOP and Hong Kong
dollars have been converted, for the purposes of illustration only, in this report at:
US$1.00 : HK$7.7827
US$1.00 : MOP8.00
US$1.00 : RMB6.80
HK$1.00 : MOP1.03
“Four Seasons Hotel” refers to the Four Seasons Hotel Macao, Cotai Strip®, which is managed and operated by
FS Macau Lda., an affiliate of Four Seasons Hotels Limited
“Galaxy” Galaxy Casino S.A. (also known as Galaxy Casino Company Limited), a company
incorporated in Macao on November 30, 2001 and one of the three Concessionaires
“gaming area(s)” a gaming facility that provides casino games consisting of table games operated in VIP
areas or mass market areas, electronic games, slot machines and other casino games but
has not been designated as a casino by the Macao Government
“Gaming Promoter(s)” individuals or corporations licensed by and registered with the Macao Government to
promote games of fortune and chance to patrons, through the arrangement of certain
services, including extension of credit (regulated by Law No. 5/2004), transportation,
accommodation, dining and entertainment, whose activity is regulated by Administrative
Regulation No. 6/2002
“GDP” gross domestic product
“Global Offering” the offer of Shares in the Company by subscription for cash at HK$10.38 on November 30,
2009 on and subject to the terms outlined in the Prospectus
“Group” our Company and its subsidiaries and, in respect of the period before our Company
became the holding company of such subsidiaries, the entities which carried on the
business of the present Group at the relevant time
“HIBOR” the Hong Kong Interbank Offered Rate
Sands China Ltd. 53
Interim Report 2011
7. Glossary
“HK$” or “HK dollars” Hong Kong dollars, the lawful currency of Hong Kong
“Hong Kong” the Hong Kong Special Administrative Region of the PRC
“IFRS” International Financial Reporting Standards
“integrated resort(s)” a resort which provides customers with a combination of hotel accommodations, casinos
or gaming areas, retail and dining facilities, MICE space, entertainment venues and spas
“Latest Practicable September 9, 2011
Date”
“LIBOR” London Interbank Offered Rate
“Listing” the listing of the Shares on the Main Board on November 30, 2009
“Listing Date” November 30, 2009, the date on which dealings in the Shares first commenced on the
Main Board
“Listing Rules” the Rules Governing the Listing of Securities on the Stock Exchange (as amended from
time to time)
“LVS” Las Vegas Sands Corp., a company incorporated in Nevada, U.S.A. in August 2004 and
the common stock of which is listed on the New York Stock Exchange
“LVS Group” LVS and its subsidiaries (excluding our Group)
“Macao” or “MSAR” the Macao Special Administrative Region of the PRC
“Macao Government” the local government of the MSAR, established on December 20, 1999 and the local
administration before this date
“Main Board” the stock exchange (excluding the option market) operated by the Stock Exchange which
is independent of and operated in parallel with the Growth Enterprise Market of the Stock
Exchange
54 Sands China Ltd.
Interim Report 2011
7. Glossary
“mass market non-rolling chip players
player(s)”
“Melco Crown” Melco Crown Jogos (Macau), S.A., a private company limited by shares (“sociedade
anónima”) incorporated on May 10, 2006 under the laws of Macao and one of the three
Subconcessionaires
“MGM Grand Paradise” MGM Grand Paradise, S.A. (also known as MGM Grand Paradise Limited), a private
company limited by shares (“sociedade anónima”) incorporated on June 17, 2004 under
the laws of Macao and one of the three Subconcessionaires
“MICE” Meetings, Incentives, Conventions and Exhibitions, an acronym commonly used to refer
to tourism involving large groups brought together for an event or corporate meeting
“MOP” or “pataca(s)” Macao pataca, the lawful currency of Macao
“Parcel 1” a land parcel in Cotai totaling 291,479 square meters described under Registration
No. 23225 by the Macau Property Registry, on which The Venetian Macao has been
constructed
“Parcel 2” a land parcel in Cotai totaling 53,700 square meters described under Registration No.
23223 by the Macau Property Registry, on which The Plaza Macao has been constructed
“Parcel 3” a land parcel in Cotai totaling 60,479 square meters described under Registration No.
23224 by the Macau Property Registry, which is expected to contain an integrated resort
that will be connected to The Plaza Macao and the CotaiExpo center at The Venetian
Macao, and may contain over 4,000 branded hotel rooms, gaming areas and other
integrated resort amenities. These plans are based on general building plans submitted
to the Land, Public Works and Transport Bureau of the MSAR on June 18, 2009, which
we are continuing to refine and update during the course of its overall design and
development
“Parcels 5 and 6” land parcels in Cotai totaling 150,134 square meters, including 44,576 square meters
designated as a tropical garden, described under Registration No. 23288 by the Macau
Property Registry
Sands China Ltd. 55
Interim Report 2011
7. Glossary
“Parcels 7 and 8” land parcels in Cotai totaling 110,200 square meters which are expected to contain an
integrated resort similar in size and scope to Sands Cotai Central. The size of the land
parcel may be subject to further surveyance
“premium player(s)” rolling chip players who have a direct relationship with gaming operators and typically
participate in gaming activities in casinos or gaming areas without the use of Gaming
Promoters
“Prospectus” our Listing prospectus dated November 16, 2009, which is available from our website at
www.sandschinaltd.com
“PwC” PricewaterhouseCoopers, the global professional services company
“Reporting Period” January 1, 2011 to June 30, 2011
“RMB” or “Renminbi” Renminbi, the lawful currency of China
“rolling chip play” play by VIP and premium players (excludes Paiza cash players) using non-negotiable
chips
“rolling chip volume” casino revenue measurement, measured as the sum of all non-negotiable chips wagered
and lost by VIP and premium players (excludes Paiza cash players)
“Sands Cotai Central” our integrated resort development on Parcels 5 and 6 which, upon completion of phases
I and II, is expected to feature approximately 5,800 hotel rooms, approximately 300,000
square feet of gaming space, approximately 1.2 million square feet of retail, entertainment
and dining facilities, exhibition and conference facilities and a multipurpose theater.
Phase III of the project is expected to include a fourth hotel and mixed-use tower to be
developed as demand and market conditions warrant it
“Sands IP” Sands IP Asset Management BV, an indirect, wholly owned subsidiary of LVS
“Sands Macao” the Sands Macao, which includes gaming areas, a hotel tower, restaurants and a theater
“SFO” the Securities and Futures Ordinance of Hong Kong (Chapter 571 of the Laws of Hong
Kong) as amended, supplemented or otherwise modified from time to time
56 Sands China Ltd.
Interim Report 2011
7. Glossary
“Shared Services the shared services agreement dated November 8, 2009 entered into between LVS and
Agreement” our Company to regulate their relationship with respect to the provision of certain shared
services
“Share(s)” ordinary shares in our Company with a nominal value of US$0.01 each
“Shareholder(s)” holder(s) of Shares
“Share Option the share option scheme conditionally adopted by our Company on November 8, 2009
Scheme”
“SJM” Sociedade de Jogos de Macau, S.A., a private company limited by shares (“sociedade
anónima”), incorporated on November 28, 2001 under the laws of Macao and one of the
three Concessionaires
“SOX” the United States federal law Sarbanes Oxley Act of 2002
“Stock Exchange” The Stock Exchange of Hong Kong Limited
“Subconcession” or the tripartite Subconcession Contract for the operation of casino games dated December
“Subconcession 26, 2002 among Galaxy, the Macao Government and VML
Contract”
“Subconcessionaire(s)” the holder(s) of a subconcession for the operation of casino games in the MSAR. As at
the Latest Practicable Date, the Subconcessionaires were VML (one of our subsidiaries),
Melco Crown and MGM Grand Paradise
“subsidiary(ies)” has the meaning ascribed to it under Section 2 of the Companies Ordinance
“table games” typical casino games, including card games such as baccarat, blackjack and hi-lo (also
known as “Sic bo”) as well as craps and roulette
“The Plaza Macao” an integrated resort which includes (i) the Four Seasons Hotel; (ii) the Plaza Casino
gaming area operated by VML; (iii) the Paiza Mansions, The Shoppes at Four Seasons,
restaurants and a spa, each of which are operated by us; and (iv) a luxury apart-hotel
tower, which is anticipated to be branded and serviced by Four Seasons; except where
the context indicates otherwise
Sands China Ltd. 57
Interim Report 2011
7. Glossary
“The Venetian Macao” The Venetian® Macao-Resort-Hotel, an integrated resort that includes casino and gaming
areas, a hotel, MICE space, The Grand Canal Shoppes, over 50 different restaurants and
food outlets, a 15,000-seat arena and other entertainment venues
“United States,” the United States of America, including its territories and possessions and all areas
“U.S.” or “U.S.A.” subject to its jurisdiction
“US$” or “U.S. dollars” United States dollars, the lawful currency of the United States
“VIP player(s)” rolling chip players who play almost exclusively in dedicated VIP rooms or designated
casino or gaming areas and are sourced from Gaming Promoters
“VIP room(s)” rooms or designated areas within a casino or gaming area where VIP players and
premium players gamble
“visit(s)” or with respect to visitation of our properties, the number of times a property is entered
“visitation(s)” during a fixed time period. Estimates of the number of visits to our properties is based on
information collected from digital cameras placed above every entrance in our properties
which use video signal image processor detection and include repeat visitors to our
properties on a given day
“VML” our subsidiary, Venetian Macau, S.A. (also known as Venetian Macau Limited), a private
company limited by shares (“sociedade anónima”) incorporated on June 21, 2002
under the laws of Macao, one of the three Subconcessionaires and the holder of the
Subconcession
“VOL” Venetian Orient Limited, a wholly owned subsidiary of the Company and owner and
developer of Sands Cotai Central
“VVDIL” our subsidiary, Venetian Venture Development Intermediate Limited, a company
incorporated in the Cayman Islands on June 21, 2002 as an exempted company with
limited liability
“VVDI (II)” Venetian Venture Development Intermediate II, a company incorporated in the Cayman
Islands on January 23, 2003 as an exempted company with limited liability and an indirect,
wholly owned subsidiary of LVS and our immediate Controlling Shareholder
58 Sands China Ltd.