Exhibit 99.1
Sands China Ltd.2012 Interim Report
(Incorporated in the Cayman islands with limited liability)
Stock Code: 1928
This interim report is printed on recycled paper using soy ink
*For identification purpose only

CONRAD
MACAO. COTAI CENTRAL
Holiday Inn
This interim report is prepared in English and Chinese. In case of inconsistency, the English version shall prevail.
Contents
1. Overview 2
1.1 Financial Highlights 2
2. Management Discussion and Analysis 3
2.1 Results of Operations 3
2.2 Liquidity and Capital Resources 9
2.3 Capital Expenditures 10
2.4 Capital Commitments 11
2.5 Dividends 11
2.6 Pledge of Fixed Assets 11
2.7 Contingent Liabilities and Risk Factors 11
2.8 Capital Risk Management 12
2.9 Foreign Exchange Risk 12
2.10 Business Review and Prospects 13
3. Corporate Governance 14
3.1 Human Resources 14
3.2 Environment 14
3.3 Corporate Governance Practices 14
3.4 Code Provisions 14
3.5 Model Code for Securities Transactions 15
3.6 Board and Board Committees Composition 15
3.7 Disclosure of Director’s Information pursuant to 16
Rule 13.51B(1) of the Listing Rules
3.8 Audit Committee Review 16
3.9 Disclosure of Interests 17
3.10 Share Option Scheme 19
3.11 Purchase, Sale or Redemption of the Company’s 21
Listed Shares
4. Interim Financial Information 22
4.1 Report on Review of Interim Financial Information 22
4.2 Condensed Consolidated Interim 23
Financial Information
4.3 Notes to the Condensed Consolidated 29
Interim Financial Information
5. Corporate Information 56
6. Contact Us 57
7. Glossary 58
1. Overview
1.1 Financial Highlights
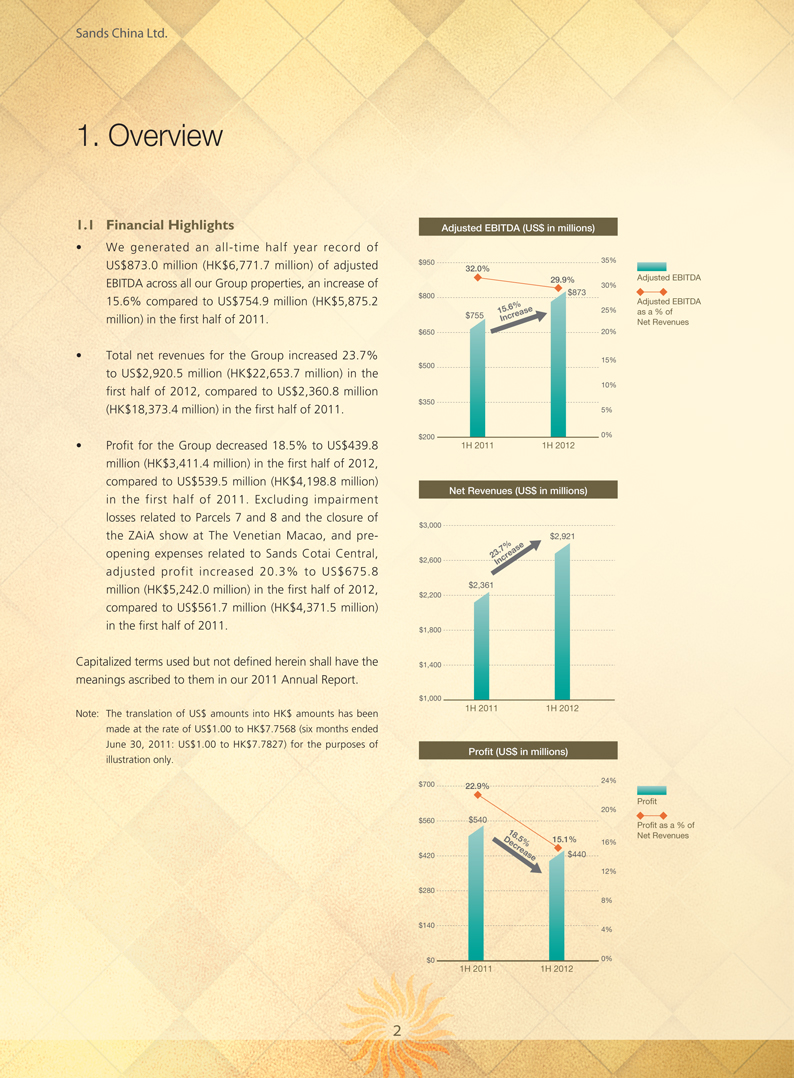
• We generated an all-time half year record of US$873.0 million (HK$6,771.7 million) of adjusted EBITDA across all our Group properties, an increase of 15.6% compared to US$754.9 million (HK$5,875.2 million) in the first half of 2011.
• Total net revenues for the Group increased 23.7% to US$2,920.5 million (HK$22,653.7 million) in the first half of 2012, compared to US$2,360.8 million (HK$18,373.4 million) in the first half of 2011.
• Profit for the Group decreased 18.5% to US$439.8 million (HK$3,411.4 million) in the first half of 2012, compared to US$539.5 million (HK$4,198.8 million) in the first half of 2011. Excluding impairment losses related to Parcels 7 and 8 and the closure of the ZAiA show at The Venetian Macao, and pre-opening expenses related to Sands Cotai Central, adjusted profit increased 20.3% to US$675.8 million (HK$5,242.0 million) in the first half of 2012, compared to US$561.7 million (HK$4,371.5 million) in the first half of 2011.
Capitalized terms used but not defined herein shall have the meanings ascribed to them in our 2011 Annual Report.
Note: The translation of US$ amounts into HK$ amounts has been made at the rate of US$1.00 to HK$7.7568 (six months ended June 30, 2011: US$1.00 to HK$7.7827) for the purposes of illustration only.
Adjusted EBITDA (US$ in millions)
$950 35%
32.0%
29.9% Adjusted EBITDA
30% $873 $800 Adjusted EBITDA
$755 15.6% 25% as a % of
Increase
Net Revenues $650 20%
$500 15%
10%
$350
5%
$200 0%
1H 2011 1H 2012
Net Revenues (US$ in millions)
$3,000 $2,921
23.7% $2,600 Increase
$2,361 $2,200
$1,800
$1,400
$1,000
1H 2011 1H 2012
Profit (US$ in millions)
24% $700 22.9%
Profit
20% $560 $540 Profit as a % of
Net Revenues
18.5% 15.1% 16%
$420 Decrease $440
12%
$280
8%
$140
4%
$0 0%
1H 2011 1H 2012
2
2. Management Discussion and Analysis
2.1 Results of Operations
The Board of Directors (the “Board”) of Sands China Ltd. (“we” or our “Company”) is pleased to present the unaudited consolidated results of the Company and its subsidiaries (the “Group”) for the six months ended June 30, 2012 compared to the six months ended June 30, 2011.
Net Revenues
Six months ended June 30,
2012 2011 Percent change
(US$ in millions, except percentages)
Casino 2,592.8 2,083.6 24.4%
Rooms 93.9 86.7 8.3%
Mall 92.5 69.0 34.1%
Food and beverage 43.4 38.8 11.9%
Convention, ferry, retail and other 98.0 82.7 18.5%
Total net revenues 2,920.5 2,360.8 23.7%
Our net revenues consisted of the following:
Net revenues were US$2,920.5 million for the six months ended June 30, 2012, an increase of US$559.7 million, or 23.7%, compared to US$2,360.8 million for the six months ended June 30, 2011. Net revenues increased in all segments, mainly driven by the opening of our newest integrated resort, Sands Cotai Central, on April 11, 2012, as well as strong visitation resulting from continuous efforts in marketing and management’s focus on driving the high-margin mass market gaming segment, while continuing to provide luxury amenities and high service levels to our VIP premium and junket players.
Our net casino revenues for the six months ended June 30, 2012 were US$2,592.8 million, an increase of US$509.2 million, or 24.4%, compared to US$2,083.6 million for the six months ended June 30, 2011. The increase is primarily attributable to US$247.1 million at Sands Cotai Central and an increase of US$263.6 million at The Plaza Macao driven by an increase in Rolling Chip volume.
3
2. Management Discussion and Analysis
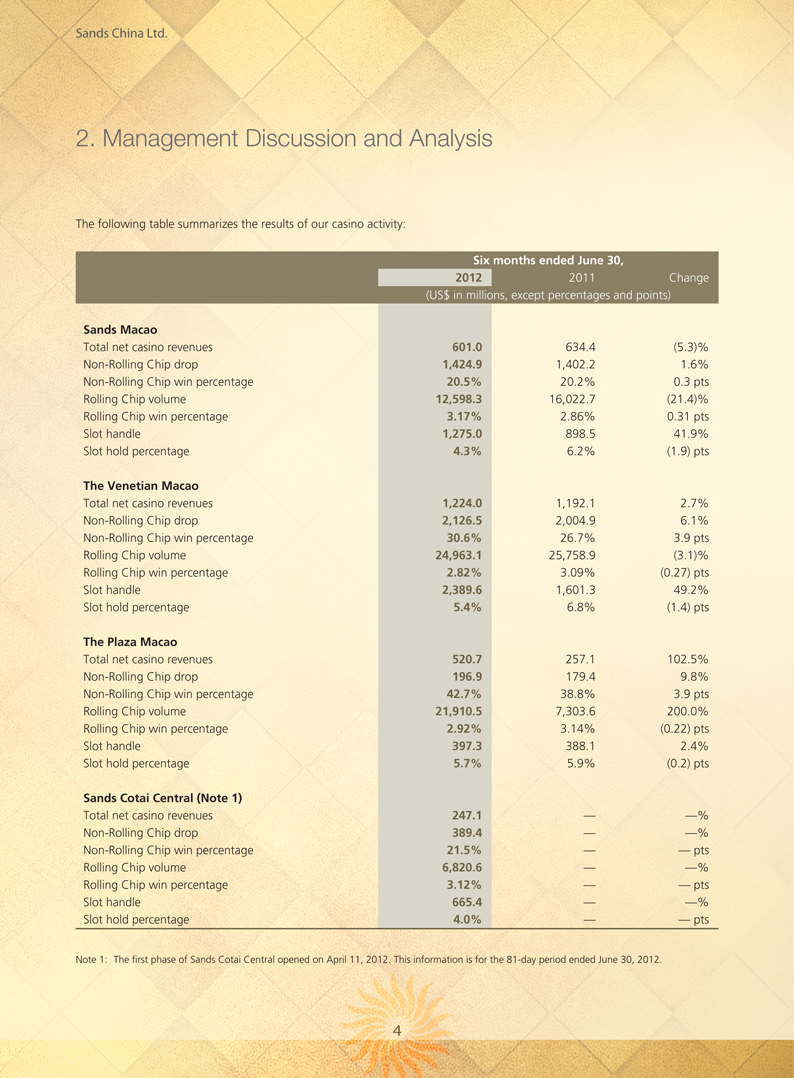
The following table summarizes the results of our casino activity:
Six months ended June 30,
2012 2011 Change
(US$ in millions, except percentages and points)
Sands Macao
Total net casino revenues 601.0 634.4 (5.3)%
Non-Rolling Chip drop 1,424.9 1,402.2 1.6%
Non-Rolling Chip win percentage 20.5% 20.2% 0.3 pts
Rolling Chip volume 12,598.3 16,022.7 (21.4)%
Rolling Chip win percentage 3.17% 2.86% 0.31 pts
Slot handle 1,275.0 898.5 41.9%
Slot hold percentage 4.3% 6.2% (1.9) pts
The Venetian Macao
Total net casino revenues 1,224.0 1,192.1 2.7%
Non-Rolling Chip drop 2,126.5 2,004.9 6.1%
Non-Rolling Chip win percentage 30.6% 26.7% 3.9 pts
Rolling Chip volume 24,963.1 25,758.9 (3.1)%
Rolling Chip win percentage 2.82% 3.09% (0.27) pts
Slot handle 2,389.6 1,601.3 49.2%
Slot hold percentage 5.4% 6.8% (1.4) pts
The Plaza Macao
Total net casino revenues 520.7 257.1 102.5%
Non-Rolling Chip drop 196.9 179.4 9.8%
Non-Rolling Chip win percentage 42.7% 38.8% 3.9 pts
Rolling Chip volume 21,910.5 7,303.6 200.0%
Rolling Chip win percentage 2.92% 3.14% (0.22) pts
Slot handle 397.3 388.1 2.4%
Slot hold percentage 5.7% 5.9% (0.2) pts
Sands Cotai Central (Note 1)
Total net casino revenues 247.1 — —%
Non-Rolling Chip drop 389.4 — —%
Non-Rolling Chip win percentage 21.5% — — pts
Rolling Chip volume 6,820.6 — —%
Rolling Chip win percentage 3.12% — — pts
Slot handle 665.4 — —%
Slot hold percentage 4.0% — — pts
Note 1: The first phase of Sands Cotai Central opened on April 11, 2012. This information is for the 81-day period ended June 30, 2012.
4
2. Management Discussion and Analysis
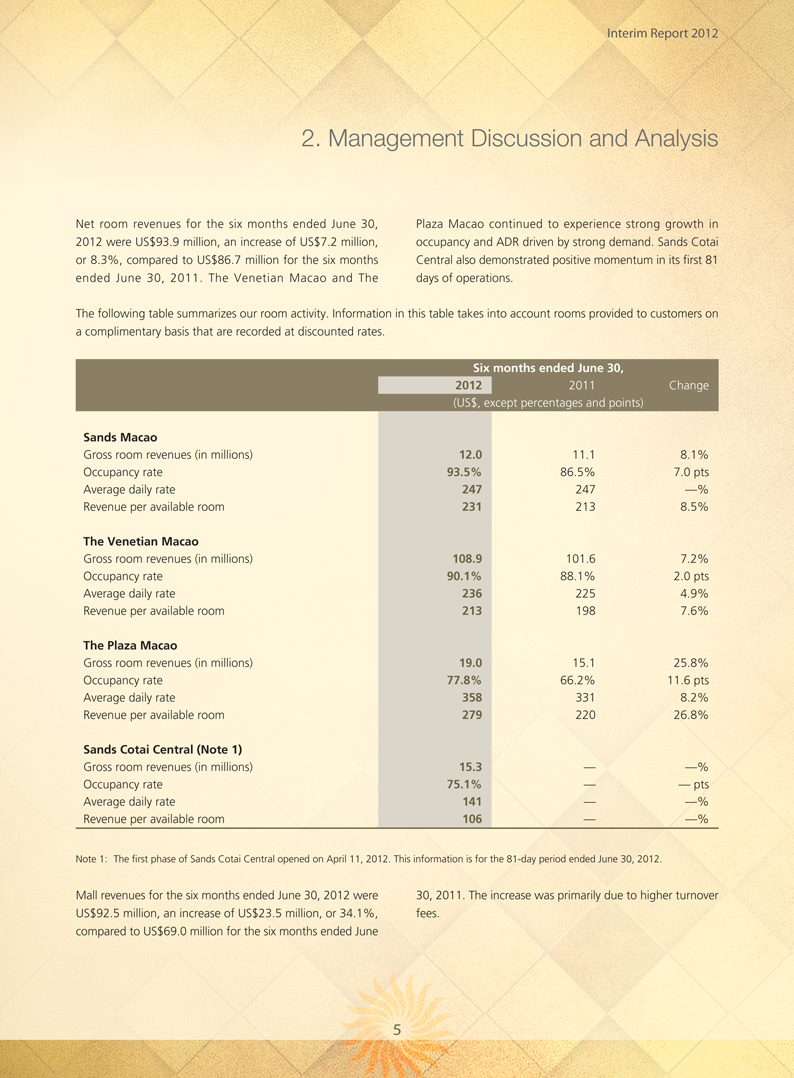
Net room revenues for the six months ended June 30, 2012 were US$93.9 million, an increase of US$7.2 million, or 8.3%, compared to US$86.7 million for the six months ended June 30, 2011. The Venetian Macao and The Plaza Macao continued to experience strong growth in occupancy and ADR driven by strong demand. Sands Cotai Central also demonstrated positive momentum in its first 81 days of operations.
The following table summarizes our room activity. Information in this table takes into account rooms provided to customers on a complimentary basis that are recorded at discounted rates.
Six months ended June 30,
2012 2011 Change
(US$, except percentages and points)
Sands Macao
Gross room revenues (in millions) 12.0 11.1 8.1%
Occupancy rate 93.5% 86.5% 7.0 pts
Average daily rate 247 247 —%
Revenue per available room 231 213 8.5%
The Venetian Macao
Gross room revenues (in millions) 108.9 101.6 7.2%
Occupancy rate 90.1% 88.1% 2.0 pts
Average daily rate 236 225 4.9%
Revenue per available room 213 198 7.6%
The Plaza Macao
Gross room revenues (in millions) 19.0 15.1 25.8%
Occupancy rate 77.8% 66.2% 11.6 pts
Average daily rate 358 331 8.2%
Revenue per available room 279 220 26.8%
Sands Cotai Central (Note 1)
Gross room revenues (in millions) 15.3 — —%
Occupancy rate 75.1% — — pts
Average daily rate 141 — —%
Revenue per available room 106 — —%
Note 1: The first phase of Sands Cotai Central opened on April 11, 2012. This information is for the 81-day period ended June 30, 2012.
Mall revenues for the six months ended June 30, 2012 were US$92.5 million, an increase of US$23.5 million, or 34.1%, compared to US$69.0 million for the six months ended June 30, 2011. The increase was primarily due to higher turnover fees.
5
2. Management Discussion and Analysis
Net food and beverage revenues for the six months ended June 30, 2012 were US$43.4 million, an increase of US$4.6 million, or 11.9%, compared to US$38.8 million for the six months ended June 30, 2011. The increase was primarily driven by the additional food and beverage outlets at Sands Cotai Central. Food and beverage outlets in other properties also experienced better performance as a result of increased property visitation.
Net convention, ferry, retail and other revenues for the six months ended June 30, 2012 were US$98.0 million, an increase of US$15.3 million, or 18.5%, compared to US$82.7 million for the six months ended June 30, 2011. The increase was primarily attributable to an increase in ferry revenue, driven by strong growth in visitation to the Cotai Strip, especially after the opening of Sands Cotai Central.
Operating Expenses
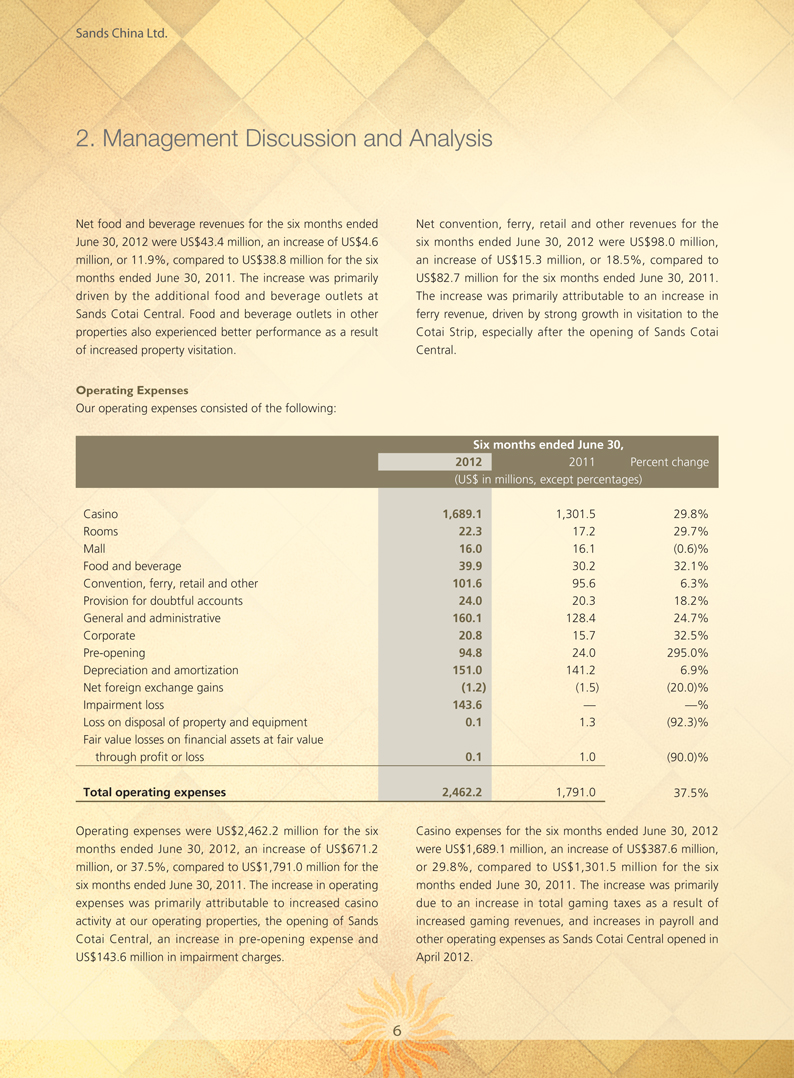
Our operating expenses consisted of the following:
Six months ended June 30,
2012 2011 Percent change
(US$ in millions, except percentages)
Casino 1,689.1 1,301.5 29.8%
Rooms 22.3 17.2 29.7%
Mall 16.0 16.1 (0.6)%
Food and beverage 39.9 30.2 32.1%
Convention, ferry, retail and other 101.6 95.6 6.3%
Provision for doubtful accounts 24.0 20.3 18.2%
General and administrative 160.1 128.4 24.7%
Corporate 20.8 15.7 32.5%
Pre-opening 94.8 24.0 295.0%
Depreciation and amortization 151.0 141.2 6.9%
Net foreign exchange gains (1.2) (1.5) (20.0)%
Impairment loss 143.6 — —%
Loss on disposal of property and equipment 0.1 1.3 (92.3)%
Fair value losses on financial assets at fair value
through profit or loss 0.1 1.0 (90.0)%
Total operating expenses 2,462.2 1,791.0 37.5%
Operating expenses were US$2,462.2 million for the six months ended June 30, 2012, an increase of US$671.2 million, or 37.5%, compared to US$1,791.0 million for the six months ended June 30, 2011. The increase in operating expenses was primarily attributable to increased casino activity at our operating properties, the opening of Sands Cotai Central, an increase in pre-opening expense and US$143.6 million in impairment charges.
Casino expenses for the six months ended June 30, 2012 were US$1,689.1 million, an increase of US$387.6 million, or 29.8%, compared to US$1,301.5 million for the six months ended June 30, 2011. The increase was primarily due to an increase in total gaming taxes as a result of increased gaming revenues, and increases in payroll and other operating expenses as Sands Cotai Central opened in April 2012.
6
2. Management Discussion and Analysis
Room expenses for the six months ended June 30, 2012 were US$22.3 million, an increase of US$5.1 million, or 29.7%, compared to US$17.2 million for the six months ended June 30, 2011. The increase was mainly driven by the opening of Sands Cotai Central, as well as increases in payroll expenses and operating supplies for other properties as a result of higher hotel occupancy.
Corporate expenses were US$20.8 million for the six months ended June 30, 2012, an increase of US$5.1 million, or 32.5%, compared to US$15.7 million for the six months ended June 30, 2011. The increase was mainly driven by royalty fees related to Sands Cotai Central, which opened in April 2012.
Food and beverage expenses for the six months ended June 30, 2012 were US$39.9 million, an increase of US$9.7 million, or 32.1%, compared to US$30.2 million for the six months ended June 30, 2011. The increase was primarily driven by the opening of Sands Cotai Central in April 2012.
Pre-opening expenses were US$94.8 million for the six months ended June 30, 2012, an increase of US$70.8 million, or 295.0%, compared to US$24.0 million for the six months ended June 30, 2011. The increase was primarily related to the opening of Sands Cotai Central.
Convention, ferry, retail and other expenses for the six months ended June 30, 2012 were US$101.6 million, an increase of US$6.0 million, or 6.3%, compared to US$95.6 million for the six months ended June 30, 2011. The increase was primarily attributable to an increase in ferry operating expenses as a result of increased revenue and the opening of Sands Cotai Central, partially offset by a decrease in entertainment expenses due to the closure of the ZAiA show.
Depreciation and amortization expense was US$151.0 million for the six months ended June 30, 2012, an increase of US$9.8 million, or 6.9%, compared to US$141.2 million for the six months ended June 30, 2011, due to the opening of Sands Cotai Central in April 2012, partially offset by a decrease in other properties due to some assets being fully depreciated.
Provision for doubtful accounts expenses were US$24.0 million for the six months ended June 30, 2012, an increase of US$3.7 million, or 18.2%, compared to US$20.3 million for the six months ended June 30, 2011. The increase was mainly driven by increased business volume.
Net foreign exchange gains for the six months ended June 30, 2012 were US$1.2 million, primarily associated with US$ denominated debt held in Macao. This compares with net foreign exchange gains of US$1.5 million for the six months ended June 30, 2011.
General and administrative expenses were US$160.1 million for the six months ended June 30, 2012, an increase of US$31.7 million, or 24.7%, compared to US$128.4 million for the six months ended June 30, 2011. The increase was mainly attributable to the opening of Sands Cotai Central.
Impairment loss was US$143.6 million for the six months ended June 30, 2012, as we recorded an impairment loss of US$100.7 million during the six months ended June 30, 2012 related to the capitalized construction costs of our development on Parcels 7 and 8, and an impairment loss of US$42.9 million related to the closure of the ZAiA show at The Venetian Macao.
7
2. Management Discussion and Analysis
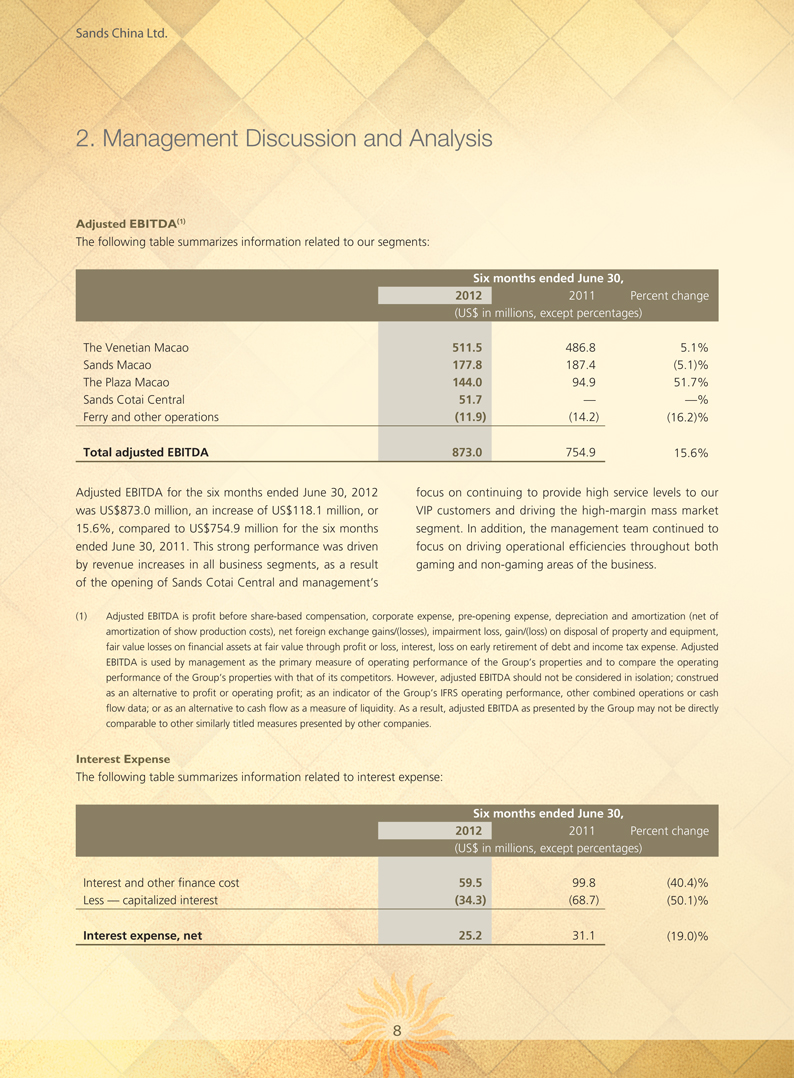
Adjusted EBITDA(1)
The following table summarizes information related to our segments:
Six months ended June 30,
2012 2011 Percent change
(US$ in millions, except percentages)
The Venetian Macao 511.5 486.8 5.1%
Sands Macao 177.8 187.4 (5.1)%
The Plaza Macao 144.0 94.9 51.7%
Sands Cotai Central 51.7 — —%
Ferry and other operations (11.9) (14.2) (16.2)%
Total adjusted EBITDA 873.0 754.9 15.6%
Adjusted EBITDA for the six months ended June 30, 2012 was US$873.0 million, an increase of US$118.1 million, or 15.6%, compared to US$754.9 million for the six months ended June 30, 2011. This strong performance was driven by revenue increases in all business segments, as a result of the opening of Sands Cotai Central and management’s focus on continuing to provide high service levels to our VIP customers and driving the high-margin mass market segment. In addition, the management team continued to focus on driving operational efficiencies throughout both gaming and non-gaming areas of the business.
(1) Adjusted EBITDA is profit before share-based compensation, corporate expense, pre-opening expense, depreciation and amortization (net of amortization of show production costs), net foreign exchange gains/(losses), impairment loss, gain/(loss) on disposal of property and equipment, fair value losses on financial assets at fair value through profit or loss, interest, loss on early retirement of debt and income tax expense. Adjusted EBITDA is used by management as the primary measure of operating performance of the Group’s properties and to compare the operating performance of the Group’s properties with that of its
competitors. However, adjusted EBITDA should not be considered in isolation; construed as an alternative to profit or operating profit; as an indicator of the Group’s IFRS operating performance, other combined operations or cash flow data; or as an alternative to cash flow as a measure of liquidity. As a result, adjusted EBITDA as presented by the Group may not be directly comparable to other similarly titled measures presented by other companies.
Interest Expense
The following table summarizes information related to interest expense:
Six months ended June 30,
2012 2011 Percent change
(US$ in millions, except percentages)
Interest and other finance cost 59.5 99.8 (40.4)%
Less — capitalized interest (34.3) (68.7) (50.1)%
Interest expense, net 25.2 31.1 (19.0)%
8
2. Management Discussion and Analysis
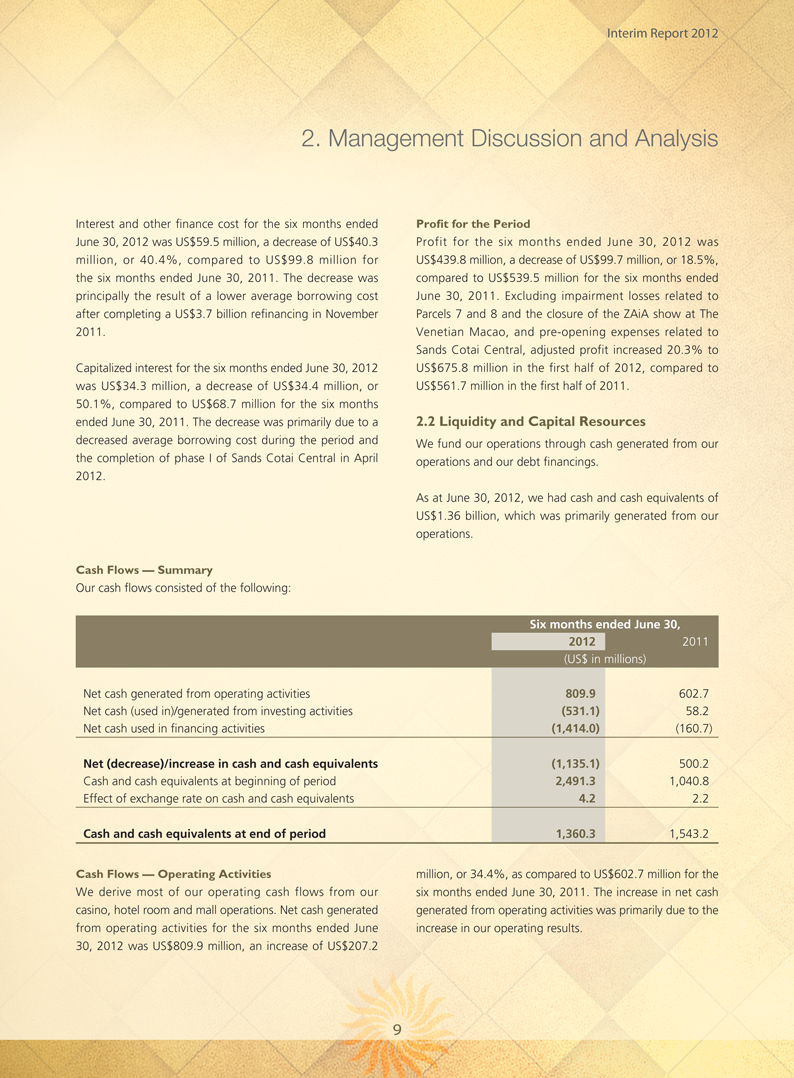
Interest and other finance cost for the six months ended June 30, 2012 was US$59.5 million, a decrease of US$40.3 million, or 40.4%, compared to US$99.8 million for the six months ended June 30, 2011. The decrease was principally the result of a lower average borrowing cost after completing a US$3.7 billion refinancing in November 2011.
Profit for the Period
Profit for the six months ended June 30, 2012 was US$439.8 million, a decrease of US$99.7 million, or 18.5%, compared to US$539.5 million for the six months ended June 30, 2011. Excluding impairment losses related to Parcels 7 and 8 and the closure of the ZAiA show at The Venetian Macao, and pre-opening expenses related to Sands Cotai Central, adjusted profit increased 20.3% to US$675.8 million in the first half of 2012, compared to US$561.7 million in the first half of 2011.
Capitalized interest for the six months ended June 30, 2012 was US$34.3 million, a decrease of US$34.4 million, or 50.1%, compared to US$68.7 million for the six months ended June 30, 2011. The decrease was primarily due to a decreased average borrowing cost during the period and the completion of phase I of Sands Cotai Central in April 2012.
2.2 Liquidity and Capital Resources
We fund our operations through cash generated from our operations and our debt financings.
As at June 30, 2012, we had cash and cash equivalents of US$1.36 billion, which was primarily generated from our operations.
Cash Flows — Summary
Our cash flows consisted of the following:
Six months ended June 30,
2012 2011
(US$ in millions)
Net cash generated from operating activities 809.9 602.7
Net cash (used in)/generated from investing activities (531.1) 58.2
Net cash used in financing activities (1,414.0) (160.7)
Net (decrease)/increase in cash and cash equivalents (1,135.1) 500.2
Cash and cash equivalents at beginning of period 2,491.3 1,040.8
Effect of exchange rate on cash and cash equivalents 4.2 2.2
Cash and cash equivalents at end of period 1,360.3 1,543.2
Cash Flows — Operating Activities
We derive most of our operating cash flows from our casino, hotel room and mall operations. Net cash generated from operating activities for the six months ended June 30, 2012 was US$809.9 million, an increase of US$207.2 million, or 34.4%, as compared to US$602.7 million for the six months ended June 30, 2011. The increase in net cash generated from operating activities was primarily due to the increase in our operating results.
9
2. Management Discussion and Analysis
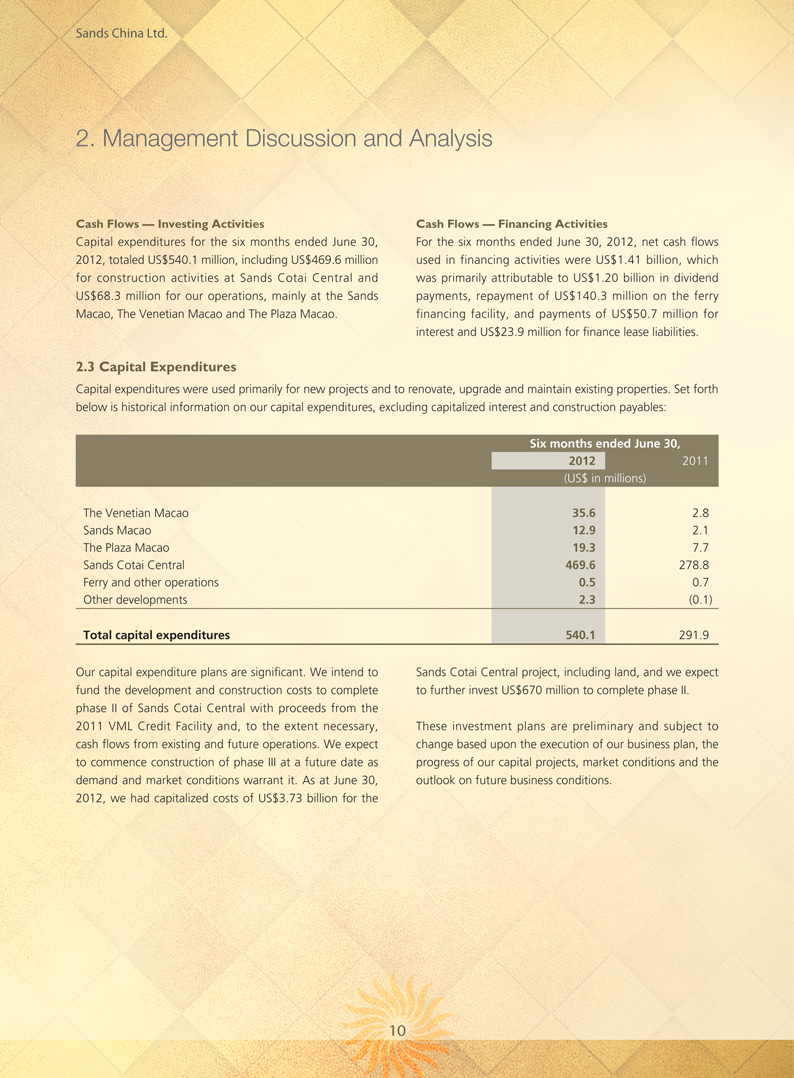
Cash Flows — Investing Activities
Capital expenditures for the six months ended June 30, 2012, totaled US$540.1 million, including US$469.6 million for construction activities at Sands Cotai Central and US$68.3 million for our operations, mainly at the Sands Macao, The Venetian Macao and The Plaza Macao.
Cash Flows — Financing Activities
For the six months ended June 30, 2012, net cash flows used in financing activities were US$1.41 billion, which was primarily attributable to US$1.20 billion in dividend payments, repayment of US$140.3 million on the ferry financing facility, and payments of US$50.7 million for interest and US$23.9 million for finance lease liabilities.
2.3 Capital Expenditures
Capital expenditures were used primarily for new projects and to renovate, upgrade and maintain existing properties. Set forth below is historical information on our capital expenditures, excluding capitalized interest and construction payables:
Six months ended June 30,
2012 2011
(US$ in millions)
The Venetian Macao 35.6 2.8
Sands Macao 12.9 2.1
The Plaza Macao 19.3 7.7
Sands Cotai Central 469.6 278.8
Ferry and other operations 0.5 0.7
Other developments 2.3 (0.1)
Total capital expenditures 540.1 291.9
Our capital expenditure plans are significant. We intend to fund the development and construction costs to complete phase II of Sands Cotai Central with proceeds from the 2011 VML Credit Facility and, to the extent necessary, cash flows from existing and future operations. We expect to commence construction of phase III at a future date as demand and market conditions warrant it. As at June 30, 2012, we had capitalized costs of US$3.73 billion for the Sands Cotai Central project, including land, and we expect to further invest US$670 million to complete phase II.
These investment plans are preliminary and subject to change based upon the execution of our business plan, the progress of our capital projects, market conditions and the outlook on future business conditions.
10
2. Management Discussion and Analysis
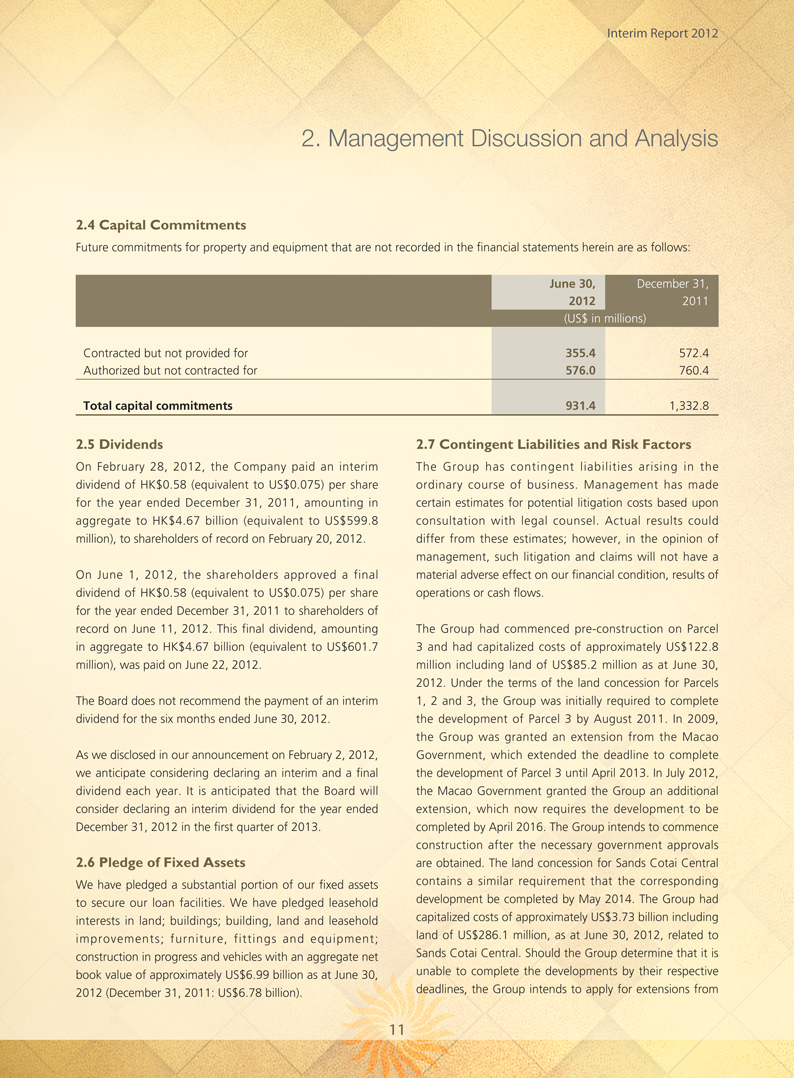
2.4 Capital Commitments
Future commitments for property and equipment that are not recorded in the financial statements herein are as follows:
June 30, December 31,
2012 2011
(US$ in millions)
Contracted but not provided for 355.4 572.4
Authorized but not contracted for 576.0 760.4
Total capital commitments 931.4 1,332.8
2.5 Dividends
On February 28, 2012, the Company paid an interim dividend of HK$0.58 (equivalent to US$0.075) per share for the year ended December 31, 2011, amounting in aggregate to HK$4.67 billion (equivalent to US$599.8 million), to shareholders of record on February 20, 2012.
On June 1, 2012, the shareholders approved a final dividend of HK$0.58 (equivalent to US$0.075) per share for the year ended December 31, 2011 to shareholders of record on June 11, 2012. This final dividend, amounting in aggregate to HK$4.67 billion (equivalent to US$601.7 million), was paid on June 22, 2012.
The Board does not recommend the payment of an interim dividend for the six months ended June 30, 2012.
As we disclosed in our announcement on February 2, 2012, we anticipate considering declaring an interim and a final dividend each year. It is anticipated that the Board will consider declaring an interim dividend for the year ended December 31, 2012 in the first quarter of 2013.
2.6 Pledge of Fixed Assets
We have pledged a substantial portion of our fixed assets to secure our loan facilities. We have pledged leasehold interests in land; buildings; building, land and leasehold improvements; furniture, fittings and equipment; construction in progress and vehicles with an aggregate net book value of approximately US$6.99 billion as at June 30, 2012 (December 31, 2011: US$6.78 billion).
2.7 Contingent Liabilities and Risk Factors
The Group has contingent liabilities arising in the ordinary course of business. Management has made certain estimates for potential litigation costs based upon consultation with legal counsel. Actual results could differ from these estimates; however, in the opinion of management, such litigation and claims will not have a material adverse effect on our financial condition, results of operations or cash flows.
The Group had commenced pre-construction on Parcel 3 and had capitalized costs of approximately US$122.8 million including land of US$85.2 million as at June 30, 2012. Under the terms of the land concession for Parcels 1, 2 and 3, the Group was initially required to complete the development of Parcel 3 by August 2011. In 2009, the Group was granted an extension from the Macao Government, which extended the deadline to complete the development of Parcel 3 until April 2013. In July 2012, the Macao Government granted the Group an additional extension, which now requires the development to be completed by April 2016. The Group intends to commence construction after the necessary government approvals are obtained. The land concession for Sands Cotai Central contains a similar requirement that the corresponding development be completed by May 2014. The Group had capitalized costs of approximately US$3.73 billion including land of US$286.1 million, as at June 30, 2012, related to Sands Cotai Central. Should the Group determine that it is unable to complete the developments by their respective deadlines, the Group intends to apply for extensions from
11
2. Management Discussion and Analysis
the Macao Government; however, no assurances can be given that extensions will be granted. If the Group is unable to meet these deadlines and the deadlines are not extended, it could lose its land concessions for Sands Cotai Central or Parcel 3, which would prohibit the Group from operating any facilities developed under the respective land concessions. As a result, the Group could record a charge for all or some portion of its capitalized construction costs including land related to Sands Cotai Central and Parcel 3.
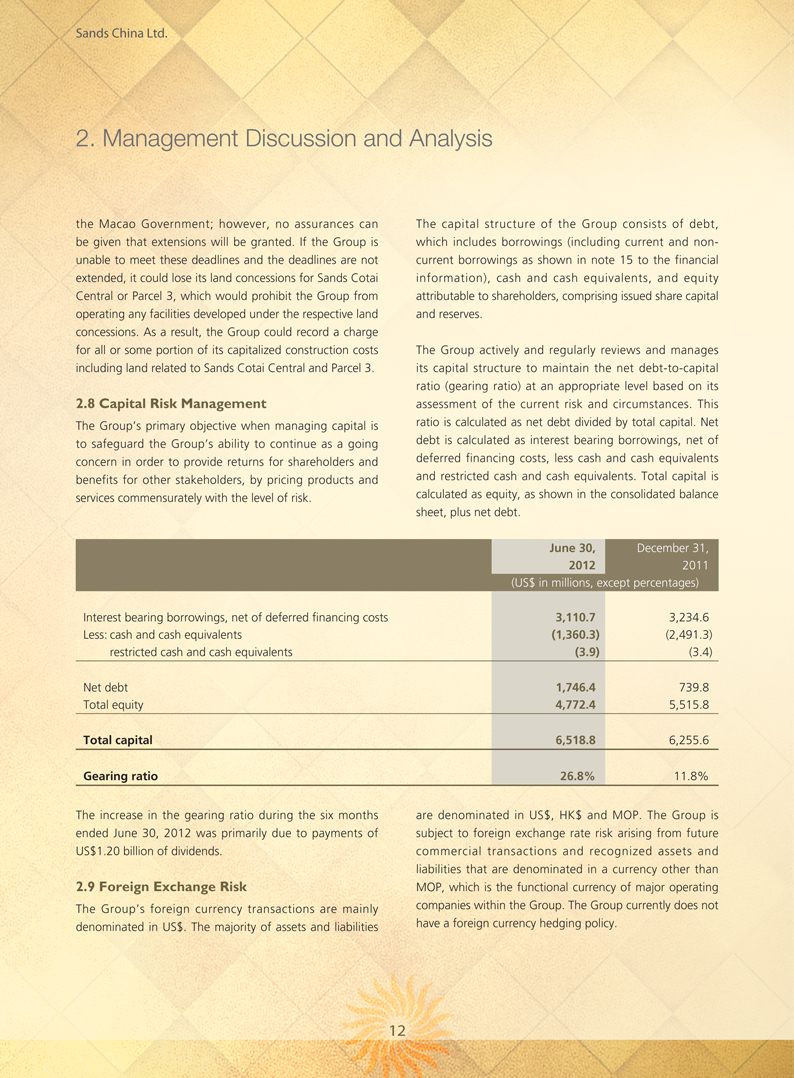
2.8 Capital Risk Management
The Group’s primary objective when managing capital is to safeguard the Group’s ability to continue as a going concern in order to provide returns for shareholders and benefits for other stakeholders, by pricing products and services commensurately with the level of risk.
The capital structure of the Group consists of debt, which includes borrowings (including current and non-current borrowings as shown in note 15 to the financial information), cash and cash equivalents, and equity attributable to shareholders, comprising issued share capital and reserves.
The Group actively and regularly reviews and manages its capital structure to maintain the net debt-to-capital ratio (gearing ratio) at an appropriate level based on its assessment of the current risk and circumstances. This ratio is calculated as net debt divided by total capital. Net debt is calculated as interest bearing borrowings, net of deferred financing costs, less cash and cash equivalents and restricted cash and cash equivalents. Total capital is calculated as equity, as shown in the consolidated balance sheet, plus net debt.
June 30, December 31,
2012 2011
(US$ in millions, except percentages)
Interest bearing borrowings, net of deferred financing costs 3,110.7 3,234.6
Less: cash and cash equivalents (1,360.3) (2,491.3)
restricted cash and cash equivalents (3.9) (3.4)
Net debt 1,746.4 739.8
Total equity 4,772.4 5,515.8
Total capital 6,518.8 6,255.6
Gearing ratio 26.8% 11.8%
The increase in the gearing ratio during the six months ended June 30, 2012 was primarily due to payments of US$1.20 billion of dividends.
2.9 Foreign Exchange Risk
The Group’s foreign currency transactions are mainly denominated in US$. The majority of assets and liabilities are denominated in US$, HK$ and MOP. The Group is subject to foreign exchange rate risk arising from future commercial transactions and recognized assets and liabilities that are denominated in a currency other than MOP, which is the functional currency of major operating companies within the Group. The Group currently does not have a foreign currency hedging policy.
12
2. Management Discussion and Analysis
2.10 Business Review and Prospects
Our business strategy is to continue to successfully execute our Cotai Strip developments and to leverage our integrated resort business model to create Asia’s premier gaming, leisure and convention destination. The Company continues to execute on the strategies outlined in our 2011 Annual Report. These strategies have proven to be successful in the first half of 2012 and we are confident they will continue to be so throughout the rest of the year.
Sands Cotai Central
On April 11, 2012, we opened phase I of Sands Cotai Central, the newest addition to our Cotai Strip development, which features more than 600 rooms and suites under the Conrad hotel brand and more than 1,200 rooms under the Holiday Inn hotel brand.
Phase I of the project also included completion of the structural work of an adjacent hotel tower, located on parcel 6, to be managed by Starwood Asia Pacific Hotels and Resorts Pte Ltd. and Sheraton Overseas Management Co. under the Sheraton brand, a variety of retail offerings, more than 300,000 square feet of meeting space, several food and beverage establishments, along with the 106,000-square-foot casino and VIP gaming areas. Phase IIA, which is scheduled to open on September 20, 2012, includes the opening of the first hotel tower on parcel 6, featuring 1,829 Sheraton-branded hotel rooms and suites, along with additional gaming area and the remaining retail, entertainment, dining and MICE facilities. Phase IIB, which is projected to open in early 2013, consists of the second hotel tower on parcel 6 and will feature 2,067 additional Sheraton-branded hotel rooms and suites. We expect to invest a further US$670 million to complete phase II.
Phase III of the project is expected to include a fourth luxury St. Regis-branded hotel and mixed-use tower. The total cost to complete phase III is expected to be approximately US$450 million. We intend to commence construction of phase III of the project as demand and market conditions warrant it.
Parcel 3
Our next phase of expansion after opening Sands Cotai Central is the integrated resort to be developed on Parcel
3. By a letter dated July 13, 2012, the Macao Government informed us that, by a decision of the Secretary for Transport and Public Works, our application to extend the Parcel 3 development deadline was approved up to April 17, 2016. We intend to commence construction on Parcel 3 after the designs for this integrated resort have been finalized and approved and all necessary government construction approvals, permits and licenses have been obtained. Parcel 3 is
expected to contain an integrated resort that will be connected to The Plaza Macao and The Venetian Macao and contain hotel rooms, gaming areas, MICE facilities and other integrated resort amenities.
Parcels 7 and 8
On May 30, 2012, we withdrew the judicial appeal filed with the Court of Second Instance in Macao in relation to the December 2, 2010 decision of the Macao Government not to approve our application for a land concession for Parcels 7 and 8. The appeal was withdrawn in accordance with articles 84(d) and 86 of Macao’s Administrative Litigation Procedure Code.
13
3. Corporate Governance
3.1 Human Resources
As of June 30, 2012, our team member profile was as follows:
Number of full-time team members: 22,676
Average age: 37
Average years of service: 3.26
Gender ratio: Male 48%
Female 52%
Number of nationalities
in management team: 37
Total number of nationalities: 55
Save as disclosed in this 2012 Interim Report, there have been no material changes to the information disclosed in the 2011 Annual Report in respect of the remuneration of the employees, remuneration policies, bonus and share option schemes and staff development.
3.2 Environment
We recognize the impact our business has on the environment and we continue to strive to achieve the goals we have set ourselves in the areas of resource conservation and reducing our environmental foot print. We encourage and are grateful to those Shareholders who have elected to receive our annual and interim reports via electronic means, thereby reducing the need to print hard copies of our reports. Should you wish to start receiving an electronic copy of our annual and interim reports, please refer to page 57 of this report for more information.
To minimize the impact on our environment, this 2012 Interim Report is printed on recycled paper using soy ink.
3.3 Corporate Governance Practices
Our Company is relatively young as a listed company. Nonetheless, we recognize the importance of good corporate governance for many reasons. The Board has a key role to play in setting strategy and overseeing the Company’s financial and operational performance: an effective governance framework enables the Board to exercise direction and oversight. We also want to give our
investors confidence that we are exercising our stewardship responsibilities with due skill and care, and that we have adopted and applied the principles of good governance. We believe that communicating how we achieve this openly and transparently is the best way of achieving this. Please refer to the Corporate Governance Report in our 2011 Annual Report for more information about how we achieve our corporate governance objectives.
In late 2011, the Listing Rules related to the Corporate Governance Code contained in Appendix 14 of the Listing Rules (the “Code”) were revised. The Board fully supports the changes that were introduced. Many of the changes that were introduced as Code amendments reflect practices that the Company already follows. Where they did not, we have made or planned changes. Corporate governance principles, however, need to be applied in a way that is fit-for-purpose for each organization so we have done this in a way that supports the performance of our business and enables effective oversight, whilst reflecting our specific circumstances.
During the period from January 1, 2012 to March 31, 2012, the Company fully complied with all the code provisions and certain recommended best practices set out in the former Code.
Except as disclosed below, the Company fully complied with all the code provisions and certain recommended best practices set out in the revised Code for the period from April 1, 2012 to June 30, 2012.
3.4 Code Provisions
Code Provision A.6.7
Under code provision A.6.7 of the revised Code, the Independent Non-Executive Directors and Non-Executive Directors should attend general meetings of the Company. Mr. David Muir Turnbull (Independent Non-Executive Director) and Mr. Lau Wong William (Non-Executive Director) attended the annual general meeting
held on June 1, 2012. The remaining Independent Non-Executive Directors and Non-Executive Directors were absent from that annual general meeting due to business commitments.
14
3. Corporate Governance
Code Provision E.1.2
Under code provision E.1.2 of the revised Code, the Chairman of the Board should attend the annual general meeting. The Chairman of the Board was absent from the annual general meeting held on June 1, 2012 due to business commitments.
3.5 Model Code for Securities Transactions
As reported in our 2011 Annual Report, the Company has devised its own securities trading code for securities transactions (the “Company Code”) by the Directors and relevant employees who are likely to be in possession of unpublished price-sensitive information of the Company on terms no less exacting than the Model Code for Securities Transactions by Directors of Listed Issuers as set out in Appendix 10 of the Listing Rules (the “Model Code”). Following specific enquiry by the Company, all Directors have confirmed that they have complied with the required standard set out in the Company Code and, therefore, with the Model Code during the six months ended June 30, 2012.
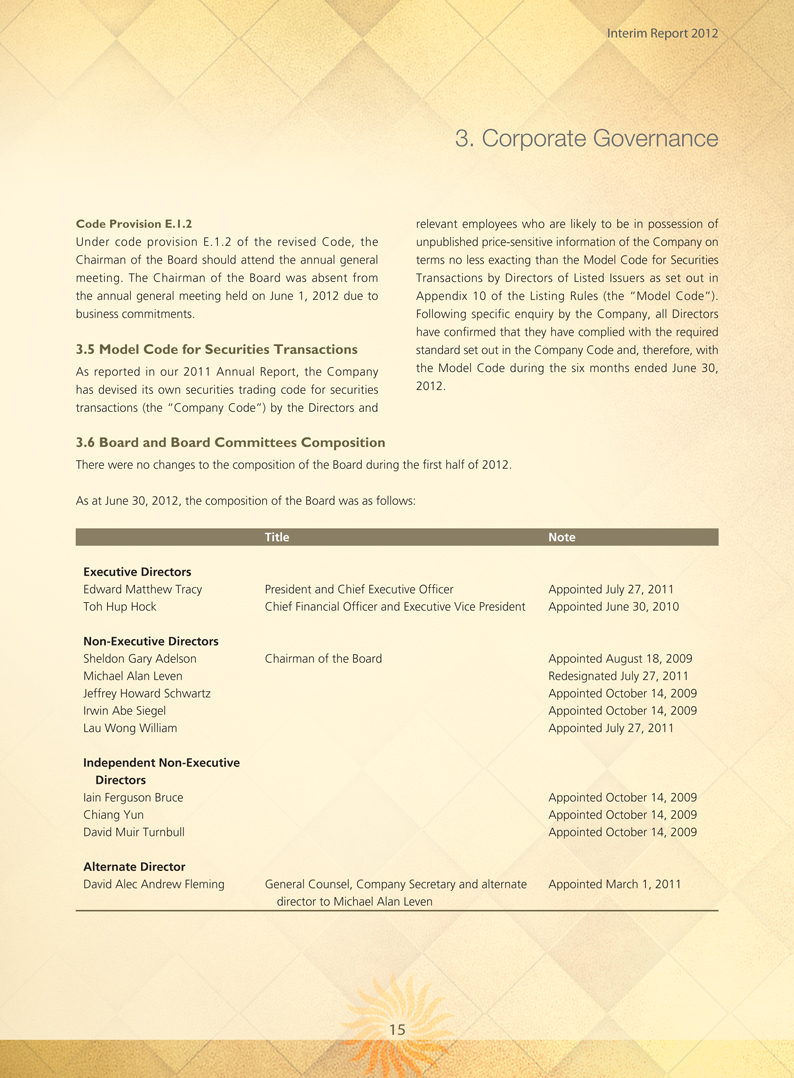
3.6 Board and Board Committees Composition
There were no changes to the composition of the Board during the first half of 2012.
As at June 30, 2012, the composition of the Board was as follows:
Title Note
Executive Directors
Edward Matthew Tracy President and Chief Executive Officer Appointed July 27, 2011
Toh Hup Hock Chief Financial Officer and Executive Vice President Appointed June 30, 2010
Non-Executive Directors
Sheldon Gary Adelson Chairman of the Board Appointed August 18, 2009
Michael Alan Leven Redesignated July 27, 2011
Jeffrey Howard Schwartz Appointed October 14, 2009
Irwin Abe Siegel Appointed October 14, 2009
Lau Wong William Appointed July 27, 2011
Independent Non-Executive
Directors
Iain Ferguson Bruce Appointed October 14, 2009
Chiang Yun Appointed October 14, 2009
David Muir Turnbull Appointed October 14, 2009
Alternate Director
David Alec Andrew Fleming General Counsel, Company Secretary and alternate Appointed March 1, 2011
director to Michael Alan Leven
15
3. Corporate Governance
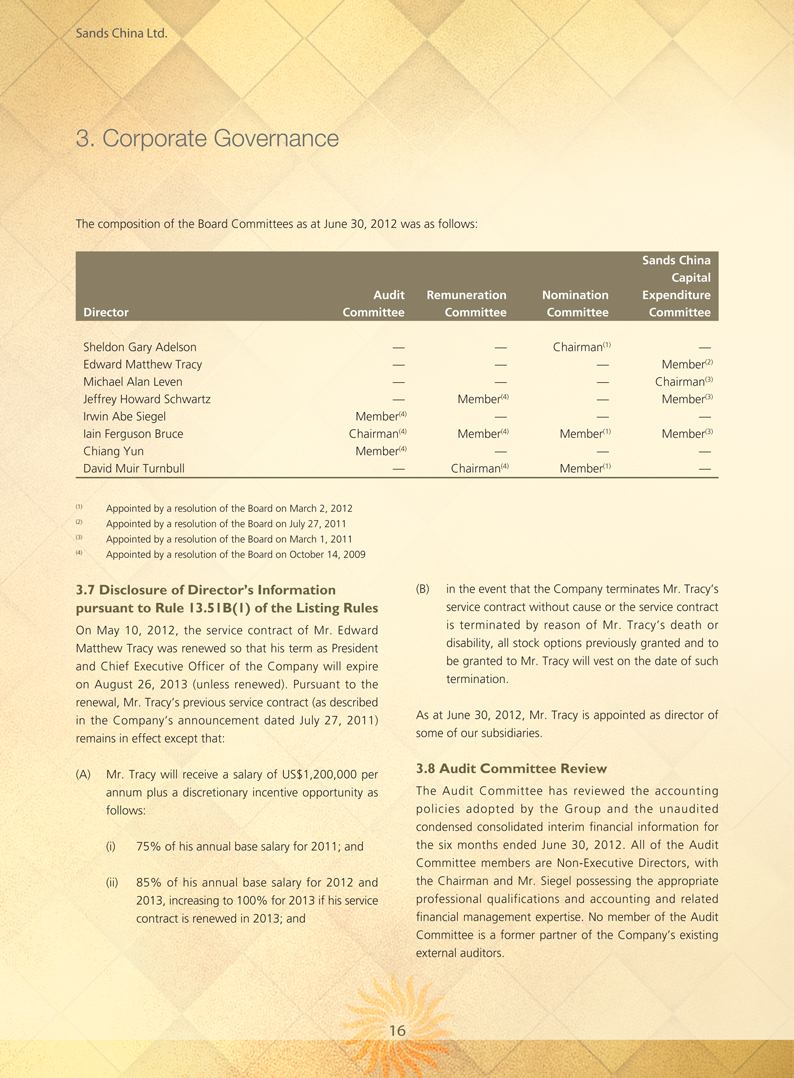
The composition of the Board Committees as at June 30, 2012 was as follows:
Sands China
Capital
Audit Remuneration Nomination Expenditure
Director Committee Committee Committee Committee
Sheldon Gary Adelson — — Chairman(1) —
Edward Matthew Tracy — — — Member(2)
Michael Alan Leven — — — Chairman(3)
Jeffrey Howard Schwartz — Member(4) — Member(3)
Irwin Abe Siegel Member(4) — — —
Iain Ferguson Bruce Chairman(4) Member(4) Member(1) Member(3)
Chiang Yun Member(4) — — —
David Muir Turnbull — Chairman(4) Member(1) —
(1) Appointed by a resolution of the Board on March 2, 2012 (2) Appointed by a resolution of the Board on July 27, 2011 (3) Appointed by a resolution of the Board on March 1, 2011 (4) Appointed by a resolution of the Board on October 14, 2009
3.7 Disclosure of Director’s Information pursuant to Rule 13.51B(1) of the Listing Rules
On May 10, 2012, the service contract of Mr. Edward Matthew Tracy was renewed so that his term as President and Chief Executive Officer of the Company will expire on August 26, 2013 (unless renewed). Pursuant to the renewal, Mr. Tracy’s previous service contract (as described in the Company’s announcement dated July 27, 2011) remains in effect except that:
(A) Mr. Tracy will receive a salary of US$1,200,000 per annum plus a discretionary incentive opportunity as follows:
(i) 75% of his annual base salary for 2011; and
(ii) 85% of his annual base salary for 2012 and 2013, increasing to 100% for 2013 if his service contract is renewed in 2013; and
(B) in the event that the Company terminates Mr. Tracy’s service contract without cause or the service contract is terminated by reason of Mr. Tracy’s death or disability, all stock options previously granted and to be granted to Mr. Tracy will vest on the date of such termination.
As at June 30, 2012, Mr. Tracy is appointed as director of some of our subsidiaries.
3.8 Audit Committee Review
The Audit Committee has reviewed the accounting policies adopted by the Group and the unaudited condensed consolidated interim financial information for the six months ended June 30, 2012. All of the Audit Committee members are Non-Executive Directors, with the Chairman and Mr. Siegel possessing the appropriate professional qualifications and accounting and related financial management expertise. No member of the Audit Committee is a former partner of the Company’s existing external auditors.
16
3. Corporate Governance
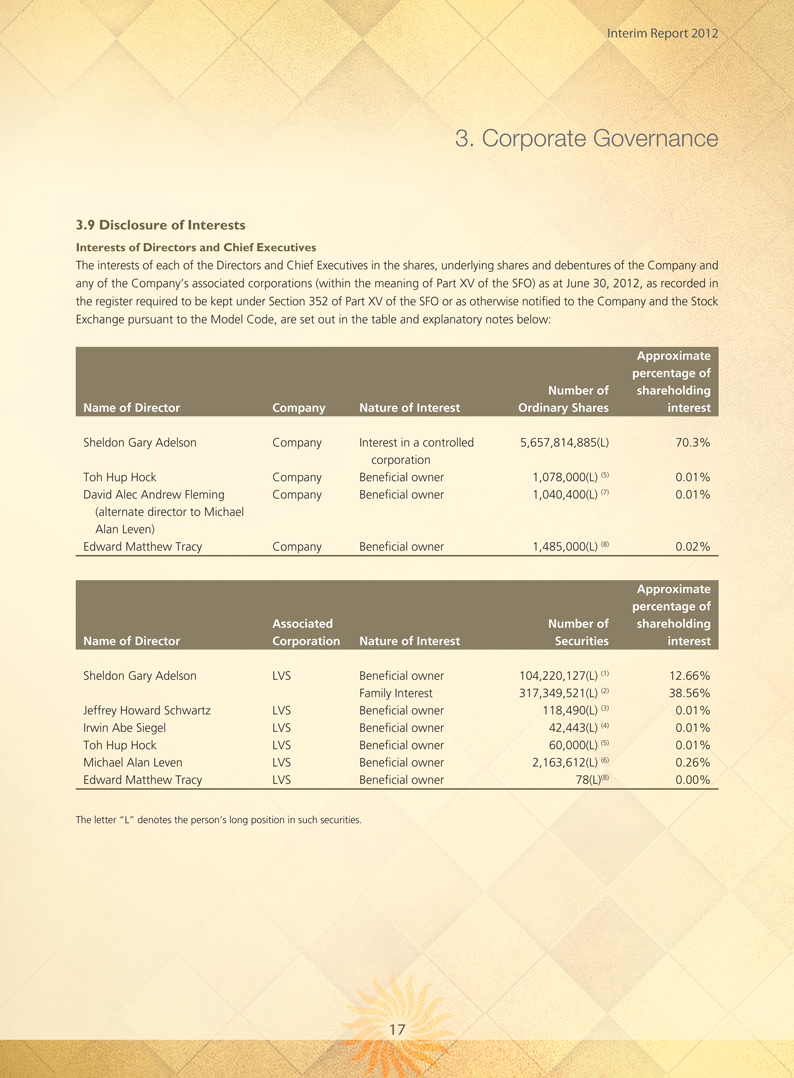
3.9 Disclosure of Interests
Interests of Directors and Chief Executives
The interests of each of the Directors and Chief Executives in the shares, underlying shares and debentures of the Company and any of the Company’s associated corporations (within the meaning of Part XV of the
SFO) as at June 30, 2012, as recorded in the register required to be kept under Section 352 of Part XV of the SFO or as otherwise notified to the Company and the Stock Exchange pursuant to the Model Code, are set out in the table and explanatory notes below:
Approximate
percentage of
Number of shareholding
Name of Director Company Nature of Interest Ordinary Shares interest
Sheldon Gary Adelson Company Interest in a controlled 5,657,814,885(L) 70.3%
corporation
Toh Hup Hock Company Beneficial owner 1,078,000(L) (5) 0.01%
David Alec Andrew Fleming Company Beneficial owner 1,040,400(L) (7) 0.01%
(alternate director to Michael
Alan Leven)
Edward Matthew Tracy Company Beneficial owner 1,485,000(L) (8) 0.02%
Approximate
percentage of
Associated Number of shareholding
Name of Director Corporation Nature of Interest Securities interest
Sheldon Gary Adelson LVS Beneficial owner 104,220,127(L) (1) 12.66%
Family Interest 317,349,521(L) (2) 38.56%
Jeffrey Howard Schwartz LVS Beneficial owner 118,490(L) (3) 0.01%
Irwin Abe Siegel LVS Beneficial owner 42,443(L) (4) 0.01%
Toh Hup Hock LVS Beneficial owner 60,000(L) (5) 0.01%
Michael Alan Leven LVS Beneficial owner 2,163,612(L) (6) 0.26%
Edward Matthew Tracy LVS Beneficial owner 78(L)(8) 0.00%
The letter “L” denotes the person’s long position in such securities.
17

3. Corporate Governance
(1) This amount includes (a) 42,227,770 shares of LVS’s common stock (see note 9), (b) 61,160 unvested shares of LVS’s restricted stock, (c) 328,407 unvested options to purchase 328,407 shares in LVS’s common stock, and (d) 61,602,790 shares of LVS’s common stock held by various trusts for the benefit of Mr. Adelson and his family members over which Mr. Adelson, as trustee, retains sole dispositive control. Mr. Adelson and his wife together are entitled to control the exercise of one-third or more of the voting power at stockholders’ meetings of LVS. LVS’s interests in our Company are set out below.
(2) This amount includes (a) 90,772,522 shares of LVS’s common stock held by Dr. Miriam Adelson, (b) 186,656,812 shares of LVS’s common stock held by trusts for the benefit of Dr. Adelson and her family members over which Dr. Adelson, as trustee, retains sole voting control, (c) 27,116,993 shares of LVS’s common stock held by trusts for the benefit of Dr. Adelson and her family members over which Dr. Adelson, as trustee, retains sole dispositive control, (d) 236,484 shares of LVS’s common stock held by trusts or custodial accounts for the benefit of Dr.
Adelson’s family members over which Dr. Adelson, as trustee or in another fiduciary capacity, retains sole voting and dispositive control, and (e) 12,566,710 shares of LVS’s common stock held by Adfam Investment Company LLC over which Dr. Adelson, as co-manager, shares voting and dispositive control with Mr. Adelson.
(3) This amount includes (a) 9,205 shares of LVS’s common stock (see note 9), (b) 1,641 unvested shares of LVS’s restricted stock, and (c) 107,644 options to purchase 107,644 shares in LVS’s common stock, of which 62,086 options are vested and exercisable.
(4) This amount includes (a) 13,202 shares of LVS’s common stock (see note 9), (b) 1,641 unvested shares of LVS’s restricted stock, and (c) 27,600 options to purchase 27,600 shares of LVS’s common stock, of which 13,100 options are vested and exercisable.
(5) This amount includes (a) 78,000 shares of the Company, (b) 1,000,000 options to purchase 1,000,000 shares of the Company, of which 500,000 options are vested and exercisable, and (c) 60,000 options to purchase 60,000 shares of LVS’s common stock, of which 50,000 options are vested and exercisable.
(6) This amount includes (a) 3,612 shares of LVS’s common stock (see note 9), (b) 350,000 unvested shares of LVS’s restricted stock, (c) 300,000 unvested LVS’s restricted stock units, and (d) 1,510,000 options to purchase 1,510,000 shares of LVS’s common stock, of which 1,508,000 options are vested and exercisable.
(7) This amount includes (a) 400 shares of the Company, and (b) 1,040,000 options to purchase 1,040,000 shares of the Company, of which 227,500 options are vested and exercisable.
(8) This amount includes (a) 1,485,000 options to purchase 1,485,000 shares of the Company, of which 150,000 options are vested and exercisable, and (b) 78 shares of LVS’s common stock.
(9) In the previous annual and interim reports, the Company has disclosed LVS’s common stock and vested restricted stock separately. From this interim report, the total number of LVS’s common stock will include the number of vested LVS’s restricted stock and LVS’s common stock.
None of the Directors or the Chief Executives had short positions in respect of shares, underlying shares and debentures of the Company and its associated corporations (within the meaning of Part XV of the SFO) as at June 30, 2012.
Save as disclosed above, so far as was known to any Director, as at June 30, 2012, none of the Directors or the Chief Executives of the Company had, pursuant to Divisions 7 and 8 of Part XV of the SFO, nor were they taken or deemed to have under such provisions of the SFO, any interest or short position in any shares or underlying shares or interest in debentures of the Company or any of its associated corporations (within the meaning of Part XV of the SFO) that were required to be
notified to the Company and the Stock Exchange, or any interests which were required, pursuant to Section 352 of the SFO, to be entered into the register referred to therein, or any interests which were required, pursuant to the Model Code, to be notified to the Company and the Stock Exchange.
As at June 30, 2012, save as disclosed above, none of the Directors nor the Chief Executives of the Company (including their spouses and children under 18 years of age) had any interest in, or had been granted, or exercised, any rights to subscribe for Shares (or warrants or debentures, if applicable) of the Company and its associated corporations within the meaning of the SFO.
18
3. Corporate Governance
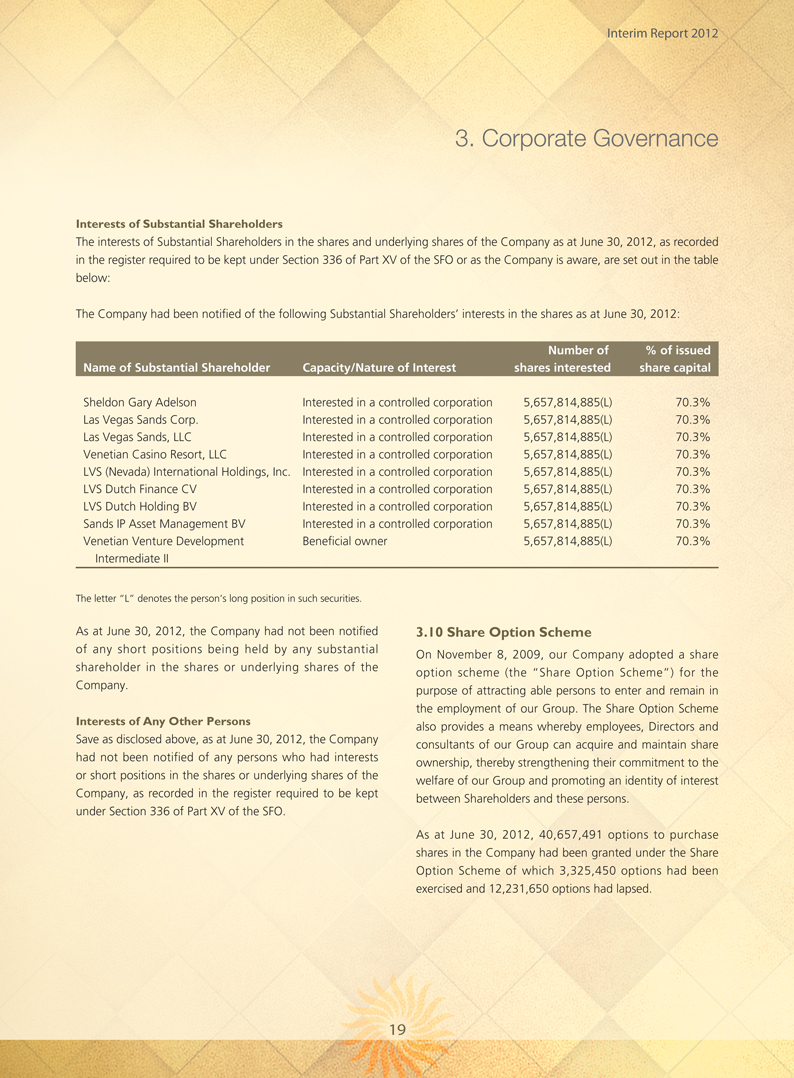
Interests of Substantial Shareholders
The interests of Substantial Shareholders in the shares and underlying shares of the Company as at June 30, 2012, as recorded in the register required to be kept under Section 336 of Part XV of the SFO or as the Company is aware, are set out in the table below:
The Company had been notified of the following Substantial Shareholders’ interests in the shares as at June 30, 2012:
Number of % of issued
Name of Substantial Shareholder Capacity/Nature of Interest shares interested share capital
Sheldon Gary Adelson Interested in a controlled corporation 5,657,814,885(L) 70.3%
Las Vegas Sands Corp. Interested in a controlled corporation 5,657,814,885(L) 70.3%
Las Vegas Sands, LLC Interested in a controlled corporation 5,657,814,885(L) 70.3%
Venetian Casino Resort, LLC Interested in a controlled corporation 5,657,814,885(L) 70.3%
LVS (Nevada) International Holdings, Inc. Interested in a controlled corporation 5,657,814,885(L) 70.3%
LVS Dutch Finance CV Interested in a controlled corporation 5,657,814,885(L) 70.3%
LVS Dutch Holding BV Interested in a controlled corporation 5,657,814,885(L) 70.3%
Sands IP Asset Management BV Interested in a controlled corporation 5,657,814,885(L) 70.3%
Venetian Venture Development Beneficial owner 5,657,814,885(L) 70.3%
Intermediate II
The letter “L” denotes the person’s long position in such securities.
As at June 30, 2012, the Company had not been notified of any short positions being held by any substantial shareholder in the shares or underlying shares of the Company.
Interests of Any Other Persons
Save as disclosed above, as at June 30, 2012, the Company had not been notified of any persons who had interests or short positions in the shares or underlying shares of the Company, as recorded in the register required to be kept under Section 336 of Part XV of the SFO.
3.10 Share Option Scheme
On November 8, 2009, our Company adopted a share option scheme (the “Share Option Scheme”) for the purpose of attracting able persons to enter and remain in the employment of our Group. The Share Option Scheme also provides a means whereby employees, Directors and consultants of our Group can acquire and maintain share ownership, thereby strengthening their commitment to the welfare of our Group and promoting an identity of interest between Shareholders and these persons.
As at June 30, 2012, 40,657,491 options to purchase shares in the Company had been granted under the Share Option Scheme of which 3,325,450 options had been exercised and 12,231,650 options had lapsed.
19
3. Corporate Governance
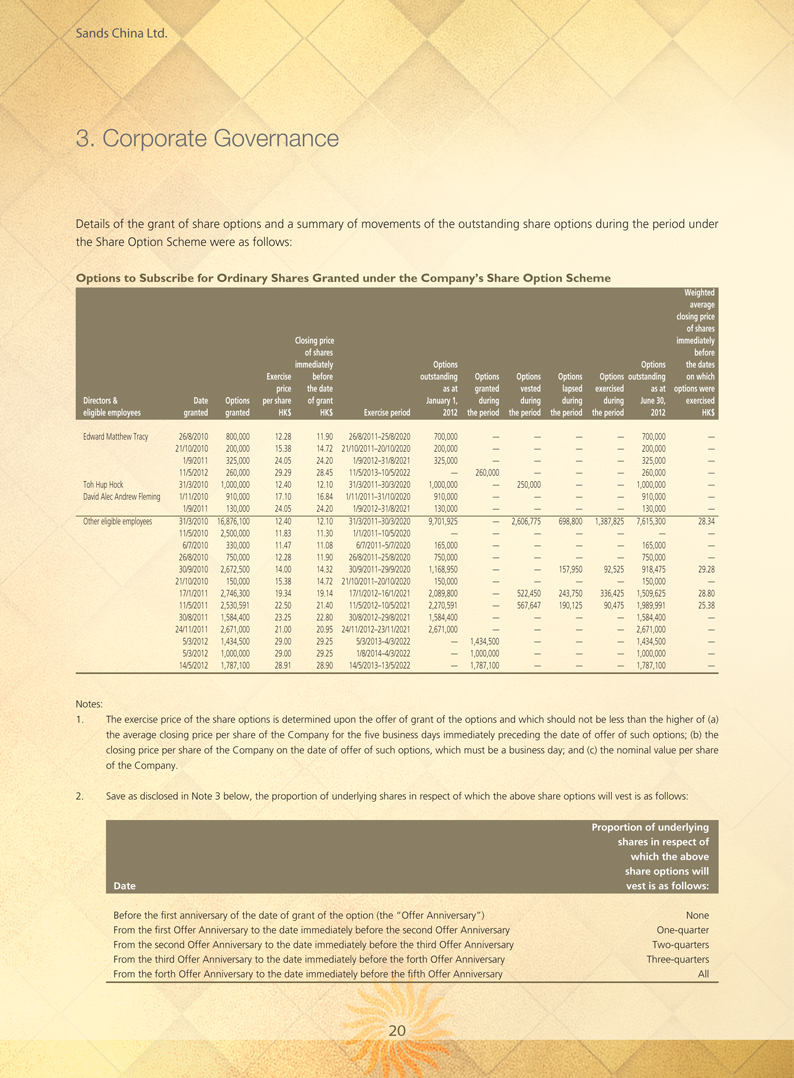
Details of the grant of share options and a summary of movements of the outstanding share options during the period under the Share Option Scheme were as follows:
Options to Subscribe for Ordinary Shares Granted under the Company’s Share Option Scheme
Weighted
average
closing price
of shares
Closing price immediately
of shares before
immediately Options Options the dates
Exercise before outstanding Options Options Options Options outstanding on which
price the date as at granted vested lapsed exercised as at options were
Directors & Date Options per share of grant January 1, during during during during June 30, exercised
eligible employees granted granted HK$ HK$ Exercise period 2012 the period the period the period the period 2012 HK$
Edward Matthew Tracy 26/8/2010 800,000 12.28 11.90 26/8/2011–25/8/2020 700,000 — — — — 700,000 —
21/10/2010 200,000 15.38 14.72 21/10/2011–20/10/2020 200,000 — — — — 200,000 —
1/9/2011 325,000 24.05 24.20 1/9/2012–31/8/2021 325,000 — — — — 325,000 —
11/5/2012 260,000 29.29 28.45 11/5/2013–10/5/2022 — 260,000 — — — 260,000 —
Toh Hup Hock 31/3/2010 1,000,000 12.40 12.10 31/3/2011–30/3/2020 1,000,000 — 250,000 — — 1,000,000 —
David Alec Andrew Fleming 1/11/2010 910,000 17.10 16.84 1/11/2011–31/10/2020 910,000 — — — — 910,000 —
1/9/2011 130,000 24.05 24.20 1/9/2012–31/8/2021 130,000 — — — — 130,000 —
Other eligible employees 31/3/2010 16,876,100 12.40 12.10 31/3/2011–30/3/2020 9,701,925 — 2,606,775 698,800 1,387,825 7,615,300 28.34
11/5/2010 2,500,000 11.83 11.30 1/1/2011–10/5/2020 — — — — — — —
6/7/2010 330,000 11.47 11.08 6/7/2011–5/7/2020 165,000 — — — — 165,000 —
26/8/2010 750,000 12.28 11.90 26/8/2011–25/8/2020 750,000 — — — — 750,000 —
30/9/2010 2,672,500 14.00 14.32 30/9/2011–29/9/2020 1,168,950 — — 157,950 92,525 918,475 29.28
21/10/2010 150,000 15.38 14.72 21/10/2011–20/10/2020 150,000 — — — — 150,000 —
17/1/2011 2,746,300 19.34 19.14 17/1/2012–16/1/2021 2,089,800 — 522,450 243,750 336,425 1,509,625 28.80
11/5/2011 2,530,591 22.50 21.40 11/5/2012–10/5/2021 2,270,591 — 567,647 190,125 90,475 1,989,991 25.38
30/8/2011 1,584,400 23.25 22.80 30/8/2012–29/8/2021 1,584,400 — — — — 1,584,400 —
24/11/2011 2,671,000 21.00 20.95 24/11/2012–23/11/2021 2,671,000 — — — — 2,671,000 —
5/3/2012 1,434,500 29.00 29.25 5/3/2013–4/3/2022 — 1,434,500 — — — 1,434,500 —
5/3/2012 1,000,000 29.00 29.25 1/8/2014–4/3/2022 — 1,000,000 — — — 1,000,000 —
14/5/2012 1,787,100 28.91 28.90 14/5/2013–13/5/2022 — 1,787,100 — — — 1,787,100 —
Notes:
1. The exercise price of the share options is determined upon the offer of grant of the options and which should not be less than the higher of (a) the average closing price per share of the Company for the five business days immediately preceding the date of offer of such options; (b) the closing price per share of the Company on the date of offer of such options, which must be a business day; and (c) the nominal value per share of the Company.
2. Save as disclosed in Note 3 below, the proportion of underlying shares in respect of which the above share options will vest is as follows:
Proportion of underlying
shares in respect of
which the above
share options will
Date vest is as follows:
Before the first anniversary of the date of grant of the option (the “Offer Anniversary”) None
From the first Offer Anniversary to the date immediately before the second Offer Anniversary One-quarter
From the second Offer Anniversary to the date immediately before the third Offer Anniversary Two-quarters
From the third Offer Anniversary to the date immediately before the forth Offer Anniversary Three-quarters
From the forth Offer Anniversary to the date immediately before the fifth Offer Anniversary All
20
3. Corporate Governance
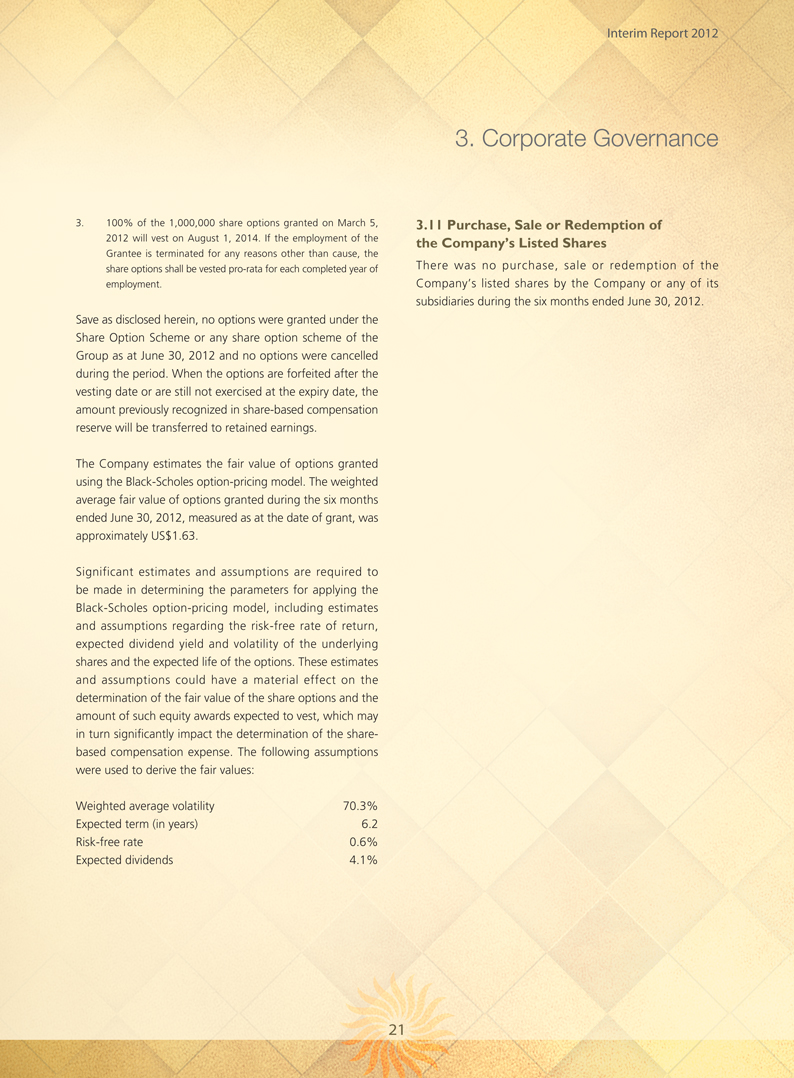
3. 100% of the 1,000,000 share options granted on March 5, 2012 will vest on August 1, 2014. If the employment of the Grantee is terminated for any reasons other than cause, the share options shall be vested pro-rata for each completed year of employment.
Save as disclosed herein, no options were granted under the Share Option Scheme or any share option scheme of the Group as at June 30, 2012 and no options were cancelled during the period. When the options are forfeited after the vesting date or are still not exercised at the expiry date, the amount previously recognized in share-based compensation reserve will be transferred to retained earnings.
The Company estimates the fair value of options granted using the Black-Scholes option-pricing model. The weighted average fair value of options granted during the six months ended June 30, 2012, measured as at the date of grant, was approximately US$1.63.
Significant estimates and assumptions are required to be made in determining the parameters for applying the Black-Scholes option-pricing model, including estimates and assumptions regarding the risk-free rate of return, expected dividend yield and volatility of the underlying shares and the expected life of the options. These estimates and assumptions could have a material effect on the determination of the fair value of the share options and the amount of such equity awards expected to vest, which may in turn significantly impact the determination of the share-based compensation expense. The following assumptions were used to derive the fair values:
Weighted average volatility 70.3%
Expected term (in years) 6.2
Risk-free rate 0.6%
Expected dividends 4.1%
3.11 Purchase, Sale or Redemption of the Company’s Listed Shares
There was no purchase, sale or redemption of the Company’s listed shares by the Company or any of its subsidiaries during the six months ended June 30, 2012.
21
4. Interim Financial Information
4.1 Report on Review of Interim Financial Information
To the Board of Directors of Sands China Ltd.
(incorporated in the Cayman Islands with limited liability)
Introduction
We have reviewed the interim financial information set out on pages 23 to 55 which comprises the interim consolidated balance sheet of Sands China Ltd. (the “Company”) and its subsidiaries (together, the “Group”) as at June 30, 2012 and the related interim condensed consolidated statements of income, comprehensive income, changes in equity and cash flows for the six-month period then ended, and a summary of significant accounting policies and other explanatory notes. The Rules Governing the Listing of Securities on The Stock Exchange of Hong Kong Limited require the preparation of a report on interim financial information to be in compliance with the relevant provisions thereof and International Accounting Standard 34 “Interim Financial Reporting”. The directors of the Company are responsible for the preparation and presentation of this interim financial information in accordance with International Accounting Standard 34 “Interim Financial Reporting”. Our responsibility is to express a conclusion on this interim financial information based on our review and to report our conclusion solely to you, as a body, in accordance with our agreed terms of engagement and for no other purpose. We do not assume responsibility towards or accept liability to any other person for the contents of this report.
Scope of review
We conducted our review in accordance with International Standard on Review Engagements 2410, “Review of Interim Financial Information Performed by the Independent Auditor of the Entity”. A review of interim financial information consists of making inquiries, primarily of persons responsible for financial and accounting matters, and applying analytical and other review procedures. A review is substantially less in scope than an audit conducted in accordance with International Standards on Auditing and consequently does not enable us to obtain assurance that we would become aware of all significant matters that might be identified in an audit. Accordingly, we do not express an audit opinion.
Conclusion
Based on our review, nothing has come to our attention that causes us to believe that the interim financial information is not prepared, in all material respects, in accordance with International Accounting Standard 34 “Interim Financial Reporting”.
PricewaterhouseCoopers
Certified Public Accountants
Hong Kong, August 27, 2012
PricewaterhouseCoopers, 22/F Prince’s Building, Central, Hong Kong
T: +852 2289 8888, F: +852 2810 9888, www.pwchk.com
22
4.2 Condensed Consolidated Interim Financial Information
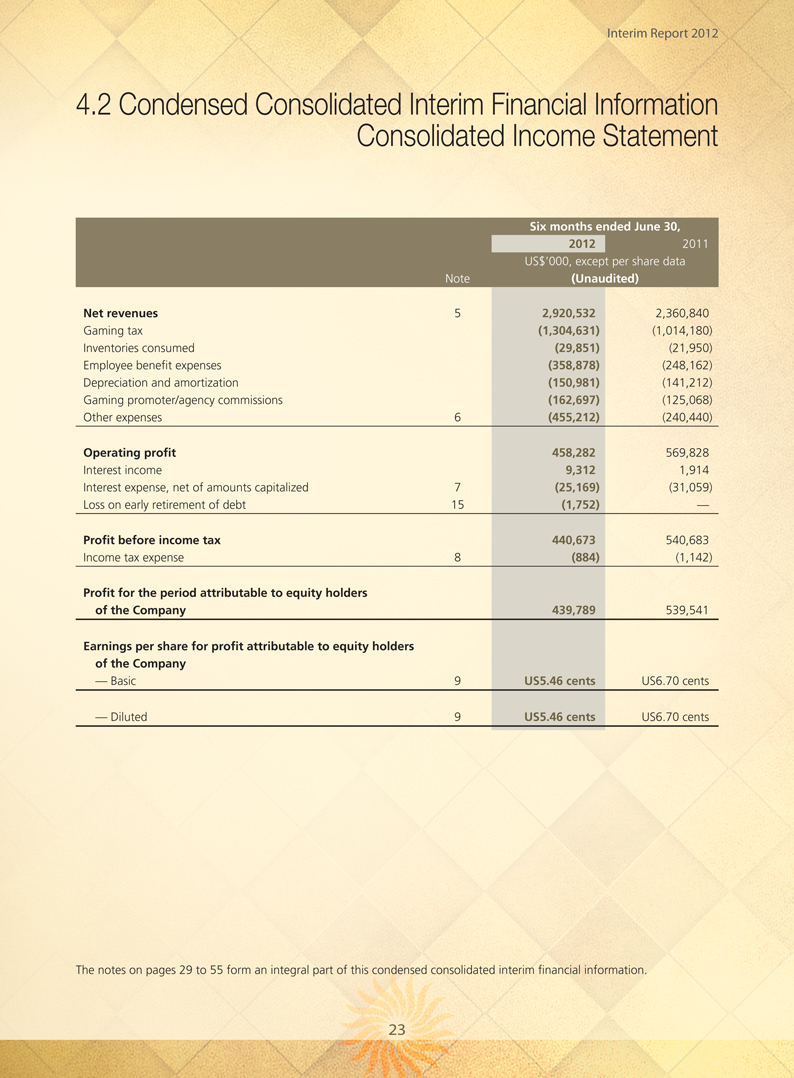
Consolidated Income Statement
Six months ended June 30,
2012 2011
US$’000, except per share data
Note(Unaudited)
Net revenues 5 2,920,532 2,360,840
Gaming tax(1,304,631)(1,014,180)
Inventories consumed(29,851)(21,950)
Employee benefit expenses(358,878)(248,162)
Depreciation and amortization(150,981)(141,212)
Gaming promoter/agency commissions(162,697)(125,068)
Other expenses 6(455,212)(240,440)
Operating profit 458,282 569,828
Interest income 9,312 1,914
Interest expense, net of amounts capitalized 7(25,169)(31,059)
Loss on early retirement of debt 15(1,752) —
Profit before income tax 440,673 540,683
Income tax expense 8(884)(1,142)
Profit for the period attributable to equity holders
of the Company 439,789 539,541
Earnings per share for profit attributable to equity holders
of the Company
— Basic 9 US5.46 cents US6.70 cents
— Diluted 9 US5.46 cents US6.70 cents
The notes on pages 29 to 55 form an integral part of this condensed consolidated interim financial information.
23
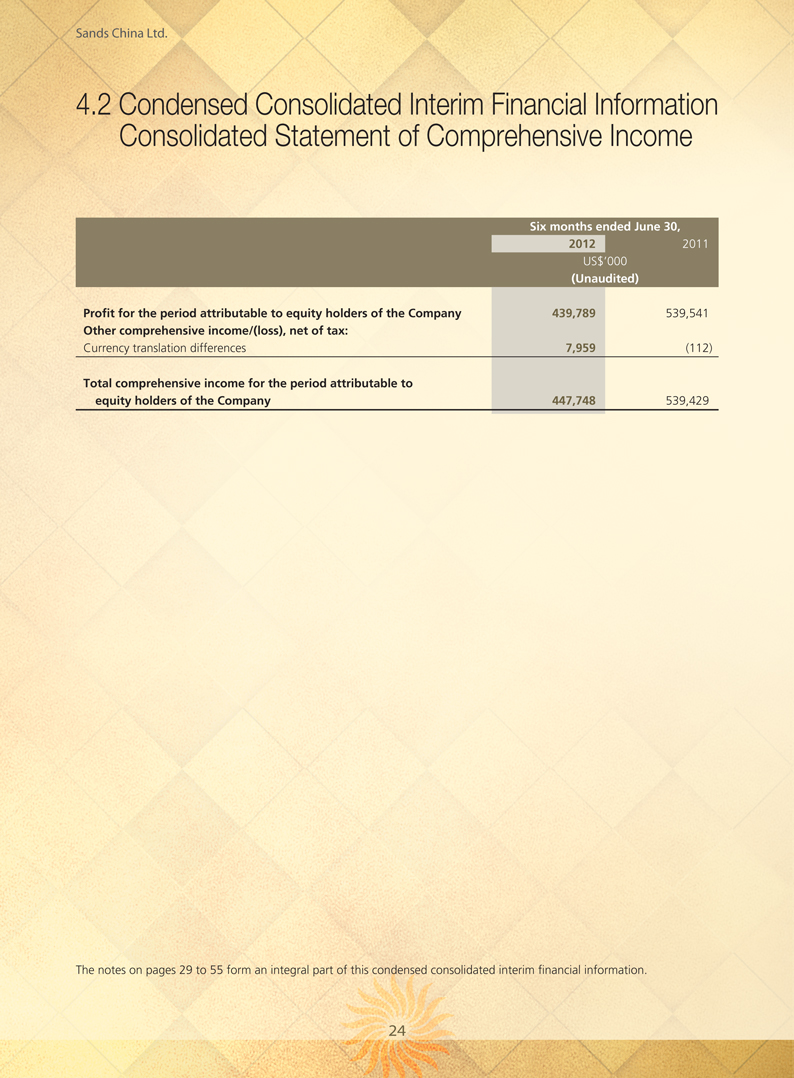
4.2 Condensed Consolidated Interim Financial Information Consolidated Statement of Comprehensive Income
Six months ended June 30,
2012 2011
US$’000
(Unaudited)
Profit for the period attributable to equity holders of the Company 439,789 539,541
Other comprehensive income/(loss), net of tax:
Currency translation differences 7,959(112)
Total comprehensive income for the period attributable to
equity holders of the Company 447,748 539,429
The notes on pages 29 to 55 form an integral part of this condensed consolidated interim financial information.
24
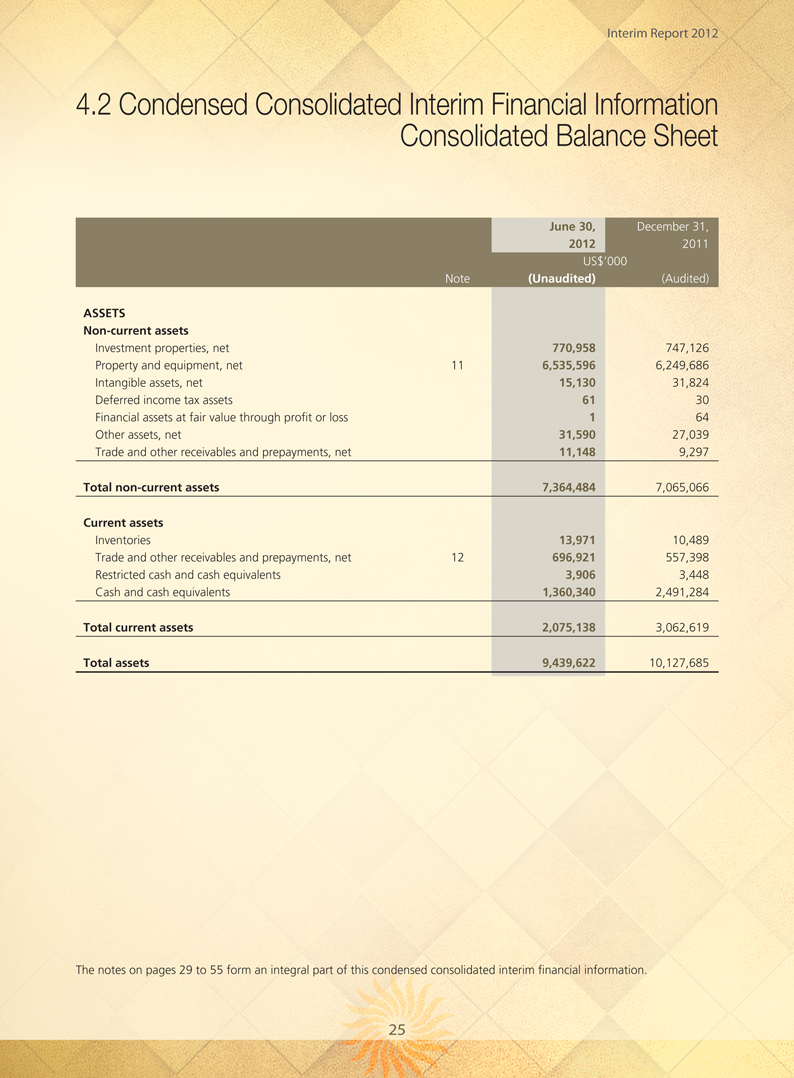
4.2 Condensed Consolidated Interim Financial Information
Consolidated Balance Sheet
June 30, December 31,
2012 2011
US$’000
Note(Unaudited)(Audited)
ASSETS
Non-current assets
Investment properties, net 770,958 747,126
Property and equipment, net 11 6,535,596 6,249,686
Intangible assets, net 15,130 31,824
Deferred income tax assets 61 30
Financial assets at fair value through profit or loss 1 64
Other assets, net 31,590 27,039
Trade and other receivables and prepayments, net 11,148 9,297
Total non-current assets 7,364,484 7,065,066
Current assets
Inventories 13,971 10,489
Trade and other receivables and prepayments, net 12 696,921 557,398
Restricted cash and cash equivalents 3,906 3,448
Cash and cash equivalents 1,360,340 2,491,284
Total current assets 2,075,138 3,062,619
Total assets 9,439,622 10,127,685
The notes on pages 29 to 55 form an integral part of this condensed consolidated interim financial information.
25
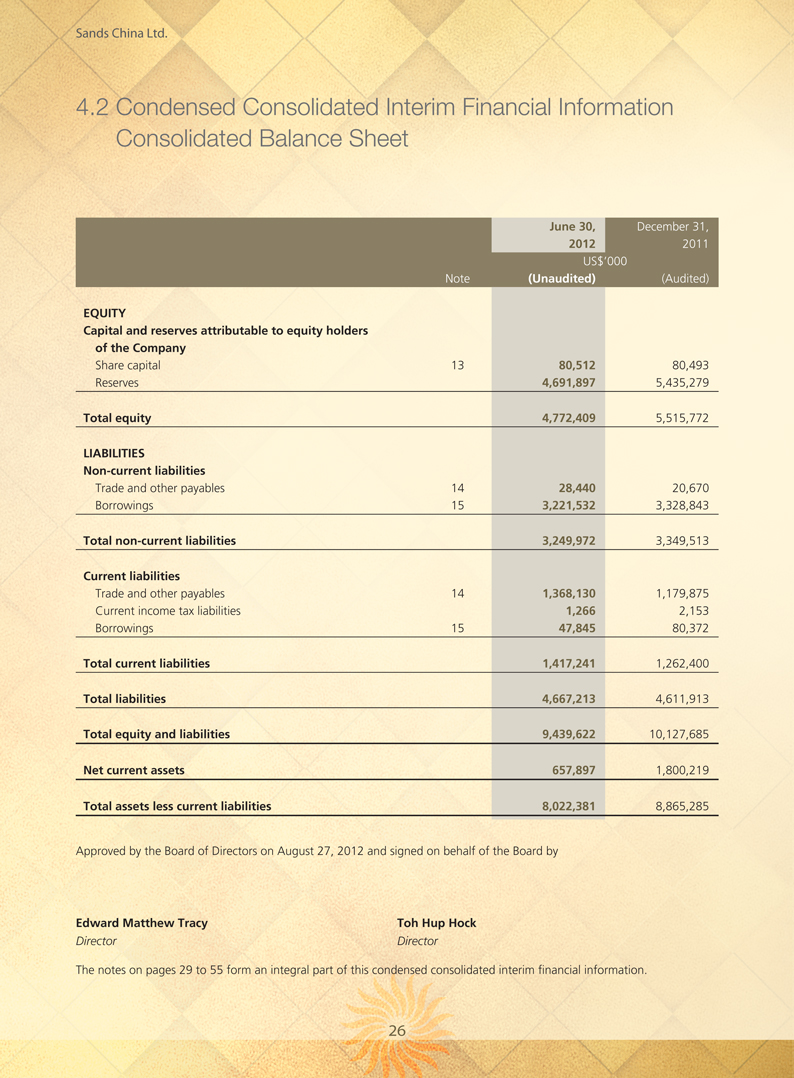
4.2 Condensed Consolidated Interim Financial Information Consolidated Balance Sheet
June 30, December 31,
2012 2011
US$’000
Note(Unaudited)(Audited)
EQUITY
Capital and reserves attributable to equity holders
of the Company
Share capital 13 80,512 80,493
Reserves 4,691,897 5,435,279
Total equity 4,772,409 5,515,772
LIABILITIES
Non-current liabilities
Trade and other payables 14 28,440 20,670
Borrowings 15 3,221,532 3,328,843
Total non-current liabilities 3,249,972 3,349,513
Current liabilities
Trade and other payables 14 1,368,130 1,179,875
Current income tax liabilities 1,266 2,153
Borrowings 15 47,845 80,372
Total current liabilities 1,417,241 1,262,400
Total liabilities 4,667,213 4,611,913
Total equity and liabilities 9,439,622 10,127,685
Net current assets 657,897 1,800,219
Total assets less current liabilities 8,022,381 8,865,285
Approved by the Board of Directors on August 27, 2012 and signed on behalf of the Board by
Edward Matthew Tracy
Toh Hup Hock
Director
Director
The notes on pages 29 to 55 form an integral part of this condensed consolidated interim financial information.
26
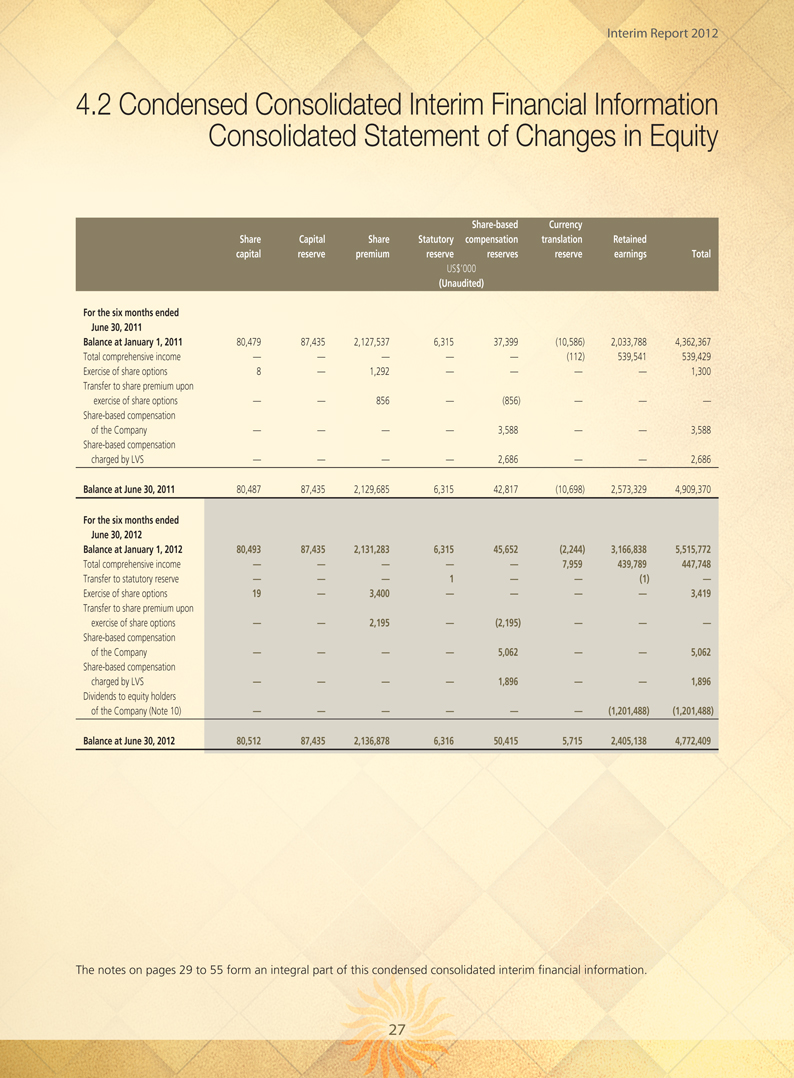
4.2 Condensed Consolidated Interim Financial Information
Consolidated Statement of Changes in Equity
Share-based Currency
Share Capital Share Statutory compensation translation Retained
capital reserve premium reserve reserves reserve earnings Total
US$’000
(Unaudited)
For the six months ended
June 30, 2011
Balance at January 1, 2011 80,479 87,435 2,127,537 6,315 37,399(10,586) 2,033,788 4,362,367
Total comprehensive income — — — — —(112) 539,541 539,429
Exercise of share options 8 — 1,292 — — — — 1,300
Transfer to share premium upon
exercise of share options — — 856 —(856) — — —
Share-based compensation
of the Company — — — — 3,588 — — 3,588
Share-based compensation
charged by LVS — — — — 2,686 — — 2,686
Balance at June 30, 2011 80,487 87,435 2,129,685 6,315 42,817(10,698) 2,573,329 4,909,370
For the six months ended
June 30, 2012
Balance at January 1, 2012 80,493 87,435 2,131,283 6,315 45,652(2,244) 3,166,838 5,515,772
Total comprehensive income — — — — — 7,959 439,789 447,748
Transfer to statutory reserve — — — 1 — —(1) —
Exercise of share options 19 — 3,400 — — — — 3,419
Transfer to share premium upon
exercise of share options — — 2,195 —(2,195) — — —
Share-based compensation
of the Company — — — — 5,062 — — 5,062
Share-based compensation
charged by LVS — — — — 1,896 — — 1,896
Dividends to equity holders
of the Company (Note 10) — — — — — —(1,201,488)(1,201,488)
Balance at June 30, 2012 80,512 87,435 2,136,878 6,316 50,415 5,715 2,405,138 4,772,409
The notes on pages 29 to 55 form an integral part of this condensed consolidated interim financial information.
27
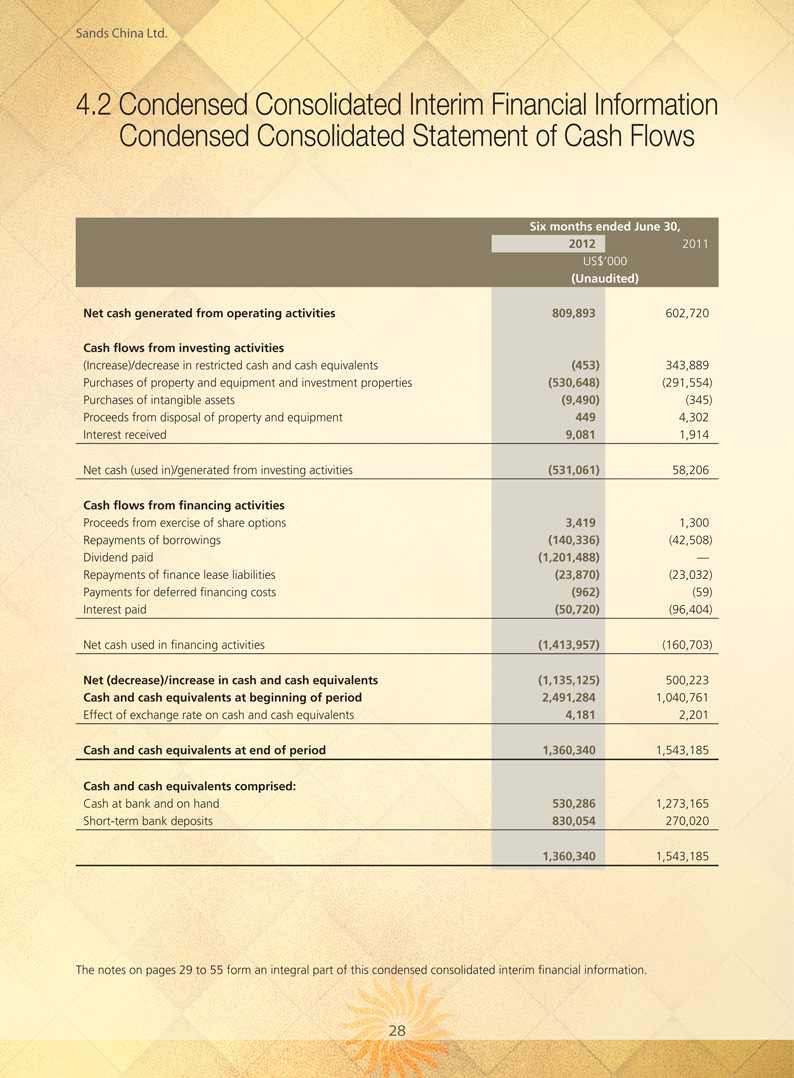
4.2 Condensed Consolidated Interim Financial Information Condensed Consolidated Statement of Cash Flows
Six months ended June 30,
2012 2011
US$’000
(Unaudited)
Net cash generated from operating activities 809,893 602,720
Cash flows from investing activities
(Increase)/decrease in restricted cash and cash equivalents(453) 343,889
Purchases of property and equipment and investment properties(530,648)(291,554)
Purchases of intangible assets(9,490)(345)
Proceeds from disposal of property and equipment 449 4,302
Interest received 9,081 1,914
Net cash (used in)/generated from investing activities(531,061) 58,206
Cash flows from financing activities
Proceeds from exercise of share options 3,419 1,300
Repayments of borrowings(140,336)(42,508)
Dividend paid(1,201,488) —
Repayments of finance lease liabilities(23,870)(23,032)
Payments for deferred financing costs(962)(59)
Interest paid(50,720)(96,404)
Net cash used in financing activities(1,413,957)(160,703)
Net (decrease)/increase in cash and cash equivalents(1,135,125) 500,223
Cash and cash equivalents at beginning of period 2,491,284 1,040,761
Effect of exchange rate on cash and cash equivalents 4,181 2,201
Cash and cash equivalents at end of period 1,360,340 1,543,185
Cash and cash equivalents comprised:
Cash at bank and on hand 530,286 1,273,165
Short-term bank deposits 830,054 270,020
1,360,340 1,543,185
The notes on pages 29 to 55 form an integral part of this condensed consolidated interim financial information.
28
4.3 Notes to the Condensed Consolidated Interim Financial Information
1. General information
Principal activities
Sands China Ltd. (the “Company”) and its subsidiaries (collectively the “Group”) are principally engaged in the operation of casino games of chance or games of other forms and the development and operation of integrated resorts and other ancillary services in the Macao Special Administrative Region of the People’s Republic of China (“Macao”). The Group’s immediate holding company is Venetian Venture Development Intermediate II (“VVDI (II)”). Las Vegas Sands Corp. (“LVS”) is the Group’s ultimate holding company.
The Company was incorporated in the Cayman Islands on July 15, 2009 as an exempted company with limited liability under the Companies Law, Cap 22 (Law 3 of 1961, as consolidated and revised) of the Cayman Islands. The address of the Company’s registered office is Walkers Corporate Services Limited, Walker House, 87 Mary Street, George Town, Grand Cayman KY1-9005, Cayman Islands. The Company’s principal place of business in Hong Kong registered under Part XI of the Hong Kong Companies Ordinance is Level 28, Three Pacific Place, 1 Queen’s Road East, Hong Kong.
The Group owns and operates The Venetian Macao Resort Hotel (“The Venetian Macao”), which anchors the Cotai Strip, the Group’s master-planned development of integrated resort properties in Macao. In August 2008, the Group opened The Plaza Macao, which is located adjacent and connected to The Venetian Macao. The Plaza Macao is an integrated resort that includes the Four Seasons Hotel Macao, the Plaza Casino, the Shoppes at Four Seasons and Paiza Mansions (which opened in July 2009). The Plaza Macao will also feature an apart-hotel tower consisting of Four Seasons-serviced and -branded luxury apartment-hotel units and common areas. The Group also owns and operates the Sands Macao, the first Las Vegas-style casino in Macao, situated on the Macao peninsula near the New Macau Maritime Ferry Terminal. In April 2012, the Group opened the first phase of the Sands Cotai Central integrated resort, which is part of the Cotai Strip development. The Group’s other ancillary services include ferry operations and other related operations.
The Company’s shares were listed on the Main Board of the Stock Exchange of Hong Kong Limited on November 30, 2009.
The unaudited condensed consolidated interim financial information (the “Interim Financial Information”) is presented in United States dollars (“US$”), unless otherwise stated. The Interim Financial Information was approved and authorized for issue by the Board of Directors of the Company on August 27, 2012.
This Interim Financial Information has not been audited.
29
4.3 Notes to the Condensed Consolidated Interim Financial Information
1. General information (continued)
Key events
The first phase of Sands Cotai Central opened on April 11, 2012. Segment results of Sands Cotai Central are given in Note 4.
In May 2012, the Group repaid the US$131.6 million outstanding balance under the ferry financing facility. Further details are given in Note 15.
During the six months ended June 30, 2012, the Group recorded an impairment loss of US$100.7 million on Parcels 7 and 8 and US$42.9 million on the closure of the ZAiA show at The Venetian Macao. Further information is given in Note 6.
Under the terms of the land concession for Parcels 1, 2 and 3, the Group was initially required to complete the development of Parcel 3 by August 2011. In 2009, the Group was granted an extension from the Macao Government, which extended the deadline to complete the development of Parcel 3 until April 2013. In July 2012, the Macao Government granted the Group an additional extension, which now requires the development to be completed by April 2016. The Group intends to commence construction after the necessary government approvals are obtained. Further details are given in Note 16.
2. Basis of preparation
The Interim Financial Information for the six months ended June 30, 2012 has been prepared in accordance with the International Accounting Standard (“IAS”) 34 ‘Interim Financial Reporting’ issued by the International Accounting Standard Board (“IASB”) and the applicable disclosure requirements of Appendix 16 to the Listing Rules. It should be read in conjunction with the Group’s annual financial statements for the year ended December 31, 2011, which were prepared in accordance with International Financial Reporting Standards (“IFRS”).
30
4.3 Notes to the Condensed Consolidated Interim Financial Information
3. Significant accounting policies
Except as described below, the accounting policies adopted in the preparation of the Interim Financial Information for the six months ended June 30, 2012 are consistent with those adopted and as described in the Group’s annual financial statements for the year ended December 31, 2011.
During the period, there have been a number of new or revised standards, amendments to standards and interpretations that have come to effect, for which the Group has adopted such at their respective effective dates. The adoption of these new standards, amendments to standards and interpretations had no material impact on the results of operations and financial position of the Group.
The Group has not early adopted the following new or revised standards, amendments and interpretations that have been issued but are not yet effective for the period:
Effective for annual periods
beginning on or after
IFRSs (Amendments) Improvements to IFRSs 2009–2011 Cycle January 1, 2013
IAS 1 (Amendment) Presentation of Financial Statements July 1, 2012
IAS 19 (Amendment) Employee Benefits January 1, 2013
IAS 27 (Revised 2011) Separate Financial Statements January 1, 2013
IAS 28 (Revised 2011) Investments in Associates and Joint Ventures January 1, 2013
IAS 32 (Amendment) Amendments to IAS 32 Financial Instruments: January 1, 2014
Presentation — Offsetting Financial Assets and
Financial Liabilities
IFRS 7 (Amendment) Financial Instruments: Disclosure — Offsetting January 1, 2013
Financial Assets and Financial Liabilities
IFRS 9 Financial Instruments January 1, 2015
IFRS 7 and IFRS 9 Mandatory Effective Date and Transition Disclosures January 1, 2015
(Amendments)
IFRS 10 Consolidated Financial Statements January 1, 2013
IFRS 11 Joint Arrangements January 1, 2013
IFRS 12 Disclosure of Interests in Other Entities January 1, 2013
IFRS 13 Fair Value Measurements January 1, 2013
IFRIC – Int 20 Stripping Costs in the Production Phase of a January 1, 2013
Surface Mine
The Group has already commenced the assessment of the impact of the above new and revised standards, amendments and interpretations to the Group and is not yet in a position to state whether these would have a significant impact on the results of operations and financial position of the Group.
The preparation of Interim Financial Information requires management to make judgments, estimates and assumptions that affect the application of accounting policies and the reported amounts of assets, liabilities, income and expenses. Actual results may differ from these estimates. In preparing this Interim Financial Information, the significant judgments made by management in the process of applying the Group’s accounting policies and the key sources of estimation uncertainty were the same as those that were applied to the consolidated financial statements for the year ended December 31, 2011.
31
4.3 Notes to the Condensed Consolidated Interim Financial Information
3. Significant accounting policies (continued)
The Group’s activities expose it to a variety of financial risks: market risk, credit risk and liquidity risk. The Interim Financial Information does not include all financial risk management information and disclosures required in the annual financial statements, and should be read in conjunction with the Group’s annual financial statements for the year ended December 31, 2011. There have been no changes in any risk management policies since year-end 2011.
During the six months ended June 30, 2012, there were no transfers between levels of the fair value hierarchy used in measuring the fair value of financial instruments.
4. Segment information
Management has determined the operating segments based on the reports reviewed by a group of senior management to make strategic decisions. The Group considers the business from a property and service perspective.
The Group’s principal operating and developmental activities occur in Macao, which is the sole geographic area that the Group domiciles. The Group reviews the results of operations for each of its operating segments, which are also the reportable segments: The Venetian Macao, Sands Macao, The Plaza Macao, Sands Cotai Central and ferry and other operations. The Group also reviews construction and development activities for each of its primary projects under development, some of which have been suspended, in addition to its reportable segments noted above. The Group’s primary projects under development are Sands Cotai Central (phases II and III) and Cotai Strip Parcel 3.
Revenue comprises turnover from sale of goods and services in the ordinary course of the Group’s activities. The Venetian Macao, Sands Macao, The Plaza Macao, Sands Cotai Central and other developments, once in operation will, derive their revenue primarily from casino, hotel, mall, food and beverage, convention, retail and other sources. Ferry and other operations mainly derive their revenue from the sale of ferry tickets for transportation between Hong Kong and Macao.
Following a change in reportable segments of “Other developments” to “Sands Cotai Central” and “Other developments” by senior management at the year end of 2011, the Group has restated the previously reported segment information for the six months ended June 30, 2011, to conform to the disclosure requirements of IFRS 8 “Operating Segments”.
The Group’s segment information is as follows:
Six months ended June 30,
2012 2011
US$’000
(Unaudited)
(Restated)
Net revenues:
The Venetian Macao 1,416,416 1,370,216
Sands Macao 616,783 650,246
The Plaza Macao 564,462 291,646
Sands Cotai Central 263,896 —
Ferry and other operations 67,105 58,225
Other developments — —
Inter-segment revenues(8,130)(9,493)
2,920,532 2,360,840
32
4.3 Notes to the Condensed Consolidated Interim Financial Information
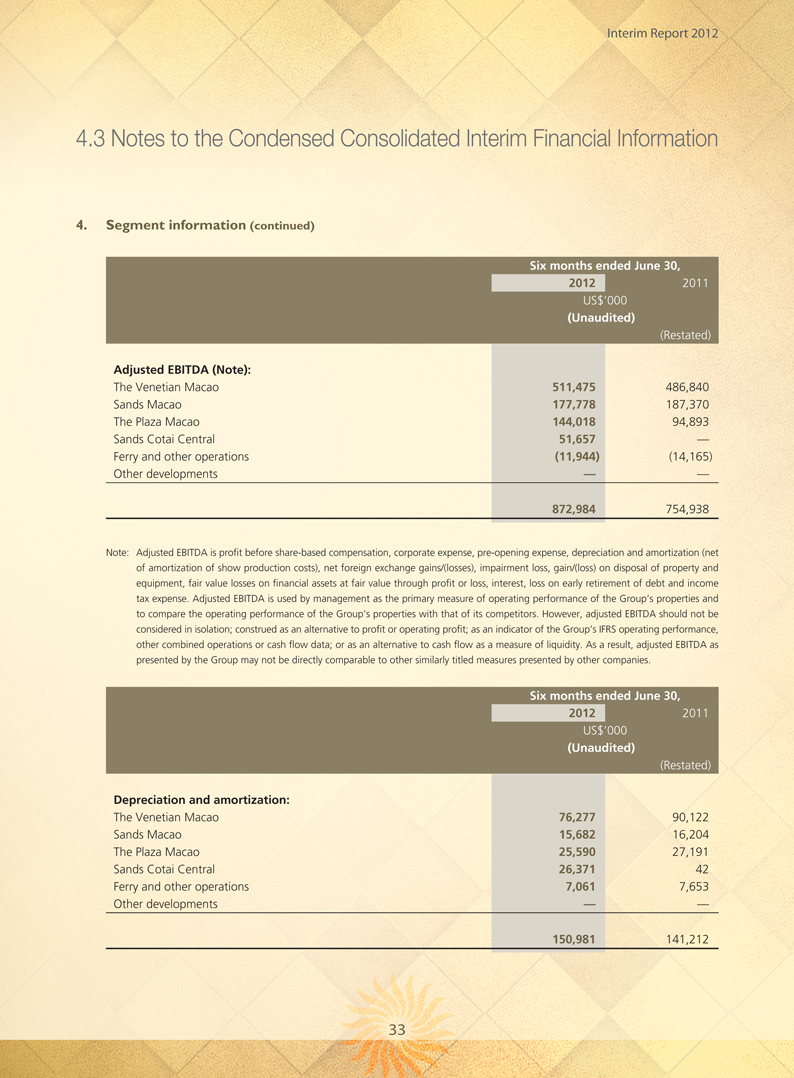
4. Segment information (continued)
Six months ended June 30,
2012 2011
US$’000
(Unaudited)
(Restated)
Adjusted EBITDA (Note):
The Venetian Macao 511,475 486,840
Sands Macao 177,778 187,370
The Plaza Macao 144,018 94,893
Sands Cotai Central 51,657 —
Ferry and other operations(11,944)(14,165)
Other developments — —
872,984 754,938
Note: Adjusted EBITDA is profit before share-based compensation, corporate expense, pre-opening expense, depreciation and amortization (net of amortization of show production costs), net foreign exchange gains/(losses), impairment loss, gain/(loss) on disposal of property and equipment, fair value losses on financial assets at fair value through profit or loss, interest, loss on early retirement of debt and income tax expense. Adjusted EBITDA is used by management as the primary measure of operating performance of the Group’s properties and to compare the operating performance of the Group’s properties with that of its competitors. However, adjusted EBITDA should not be considered in isolation; construed as an alternative to profit or operating profit; as an indicator of the Group’s IFRS operating performance, other combined operations or cash flow data; or as an alternative to cash flow as a measure of liquidity. As a result, adjusted EBITDA as presented by the Group may not be directly comparable to other similarly titled measures presented by other companies.
Six months ended June 30,
2012 2011
US$’000
(Unaudited)
(Restated)
Depreciation and amortization:
The Venetian Macao 76,277 90,122
Sands Macao 15,682 16,204
The Plaza Macao 25,590 27,191
Sands Cotai Central 26,371 42
Ferry and other operations 7,061 7,653
Other developments — —
150,981 141,212
33
4.3 Notes to the Condensed Consolidated Interim Financial Information
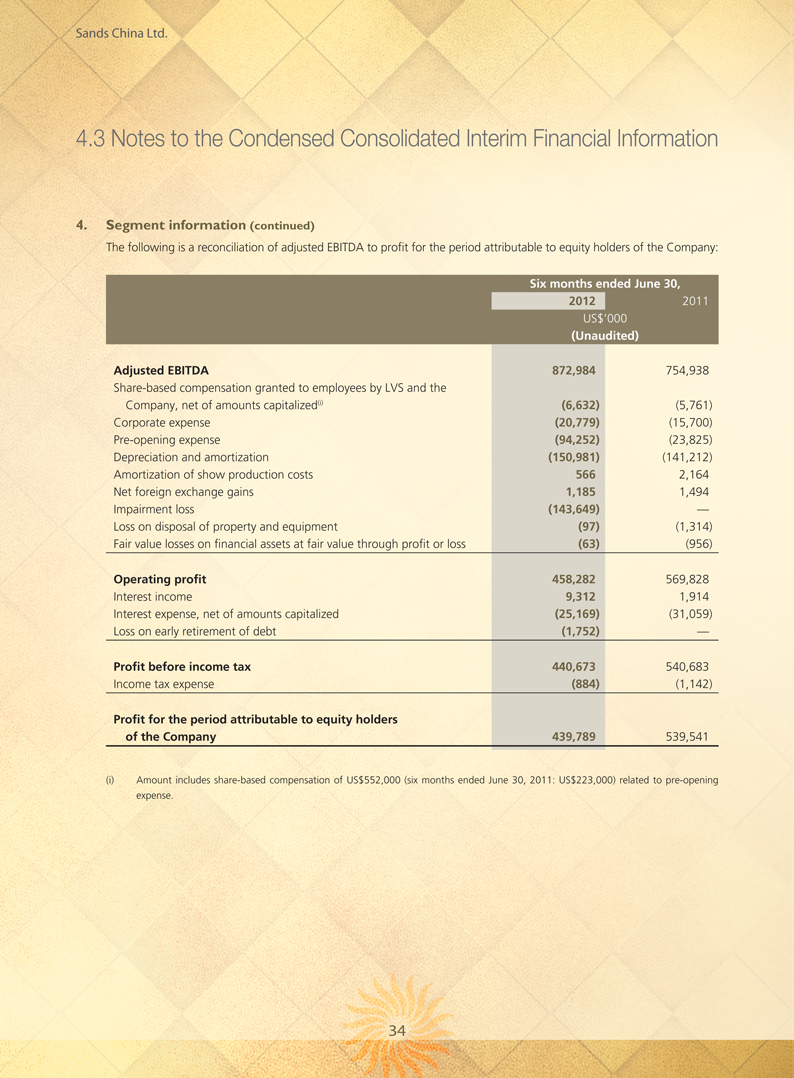
4. Segment information (continued)
The following is a reconciliation of adjusted EBITDA to profit for the period attributable to equity holders of the Company:
Six months ended June 30,
2012 2011
US$’000
(Unaudited)
Adjusted EBITDA 872,984 754,938
Share-based compensation granted to employees by LVS and the
Company, net of amounts capitalized(i)(6,632)(5,761)
Corporate expense(20,779)(15,700)
Pre-opening expense(94,252)(23,825)
Depreciation and amortization(150,981)(141,212)
Amortization of show production costs 566 2,164
Net foreign exchange gains 1,185 1,494
Impairment loss(143,649) —
Loss on disposal of property and equipment(97)(1,314)
Fair value losses on financial assets at fair value through profit or loss(63)(956)
Operating profit 458,282 569,828
Interest income 9,312 1,914
Interest expense, net of amounts capitalized(25,169)(31,059)
Loss on early retirement of debt(1,752) —
Profit before income tax 440,673 540,683
Income tax expense(884)(1,142)
Profit for the period attributable to equity holders
of the Company 439,789 539,541
(i) Amount includes share-based compensation of US$552,000 (six months ended June 30, 2011: US$223,000) related to pre-opening expense.
34
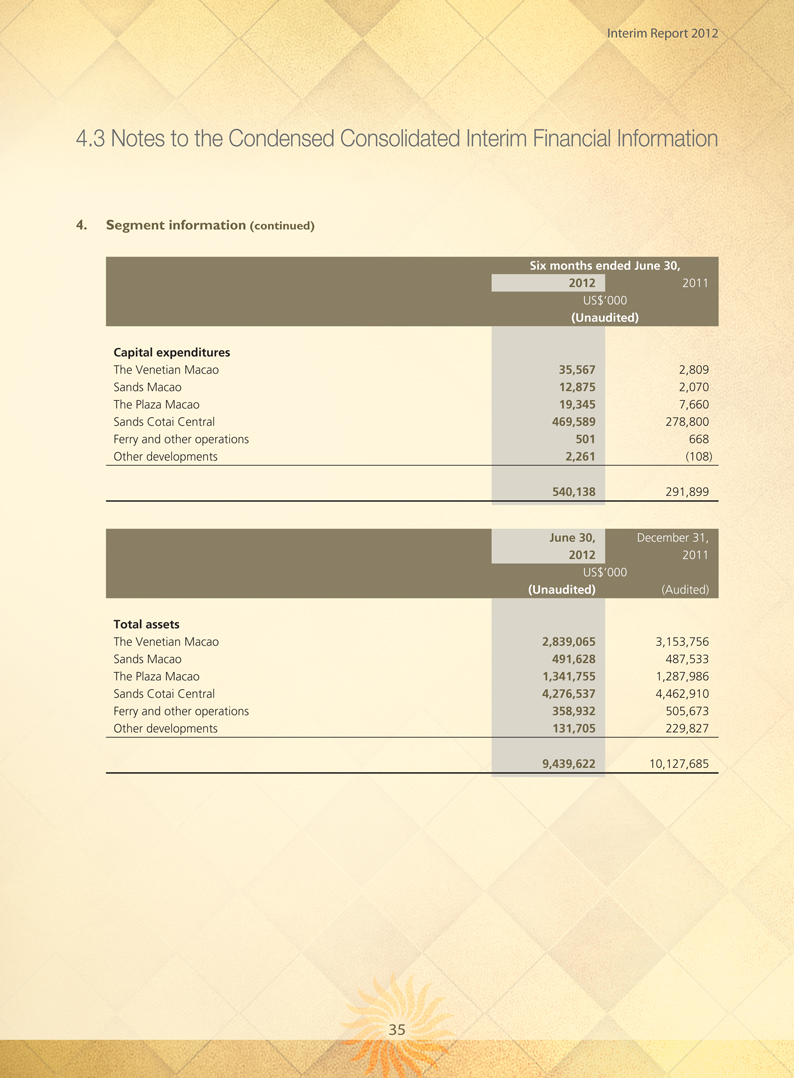
4.3 Notes to the Condensed Consolidated Interim Financial Information
4. Segment information (continued)
Six months ended June 30,
2012 2011
US$’000
(Unaudited)
Capital expenditures
The Venetian Macao 35,567 2,809
Sands Macao 12,875 2,070
The Plaza Macao 19,345 7,660
Sands Cotai Central 469,589 278,800
Ferry and other operations 501 668
Other developments 2,261(108)
540,138 291,899
June 30, December 31,
2012 2011
US$’000
(Unaudited)(Audited)
Total assets
The Venetian Macao 2,839,065 3,153,756
Sands Macao 491,628 487,533
The Plaza Macao 1,341,755 1,287,986
Sands Cotai Central 4,276,537 4,462,910
Ferry and other operations 358,932 505,673
Other developments 131,705 229,827
9,439,622 10,127,685
35
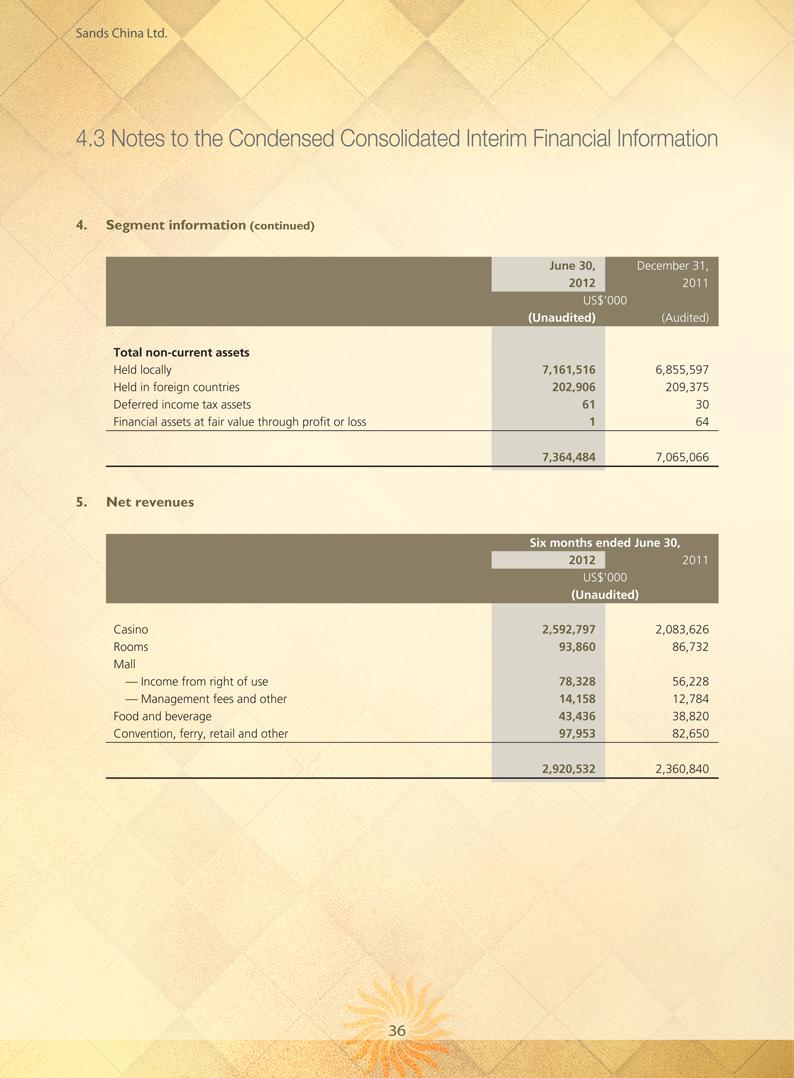
4.3 Notes to the Condensed Consolidated Interim Financial Information
4. Segment information (continued)
June 30, December 31,
2012 2011
US$’000
(Unaudited)(Audited)
Total non-current assets
Held locally 7,161,516 6,855,597
Held in foreign countries 202,906 209,375
Deferred income tax assets 61 30
Financial assets at fair value through profit or loss 1 64
7,364,484 7,065,066
5. Net revenues
Six months ended June 30,
2012 2011
US$’000
(Unaudited)
Casino 2,592,797 2,083,626
Rooms 93,860 86,732
Mall
— Income from right of use 78,328 56,228
— Management fees and other 14,158 12,784
Food and beverage 43,436 38,820
Convention, ferry, retail and other 97,953 82,650
2,920,532 2,360,840
36
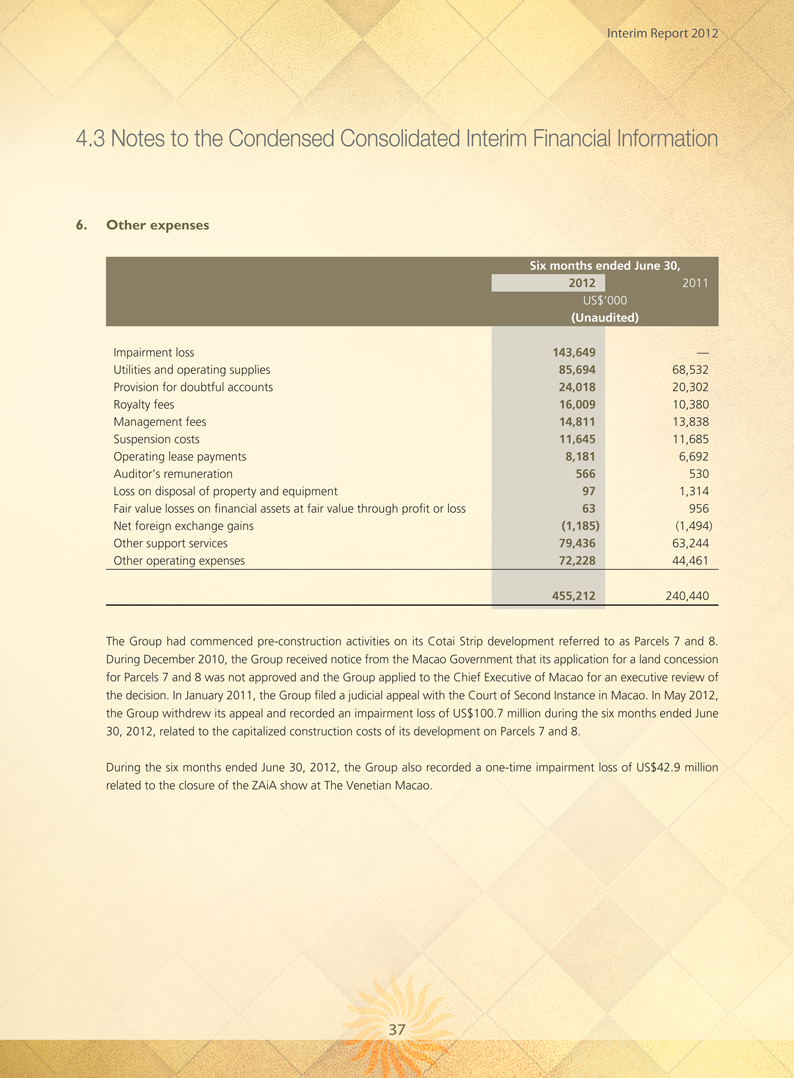
4.3 Notes to the Condensed Consolidated Interim Financial Information
6. Other expenses
Six months ended June 30,
2012 2011
US$’000
(Unaudited)
Impairment loss 143,649 —
Utilities and operating supplies 85,694 68,532
Provision for doubtful accounts 24,018 20,302
Royalty fees 16,009 10,380
Management fees 14,811 13,838
Suspension costs 11,645 11,685
Operating lease payments 8,181 6,692
Auditor’s remuneration 566 530
Loss on disposal of property and equipment 97 1,314
Fair value losses on financial assets at fair value through profit or loss 63 956
Net foreign exchange gains(1,185)(1,494)
Other support services 79,436 63,244
Other operating expenses 72,228 44,461
455,212 240,440
The Group had commenced pre-construction activities on its Cotai Strip development referred to as Parcels 7 and 8. During December 2010, the Group received notice from the Macao Government that its application for a land concession for Parcels 7 and 8 was not approved and the Group applied to the Chief Executive of Macao for an executive review of the decision. In January 2011, the Group filed a judicial appeal with the Court of Second Instance in Macao. In May 2012, the Group withdrew its appeal and recorded an impairment loss of US$100.7 million during the six months ended June 30, 2012, related to the capitalized construction costs of its development on Parcels 7 and 8.
During the six months ended June 30, 2012, the Group also recorded a one-time impairment loss of US$42.9 million related to the closure of the ZAiA show at The Venetian Macao.
37
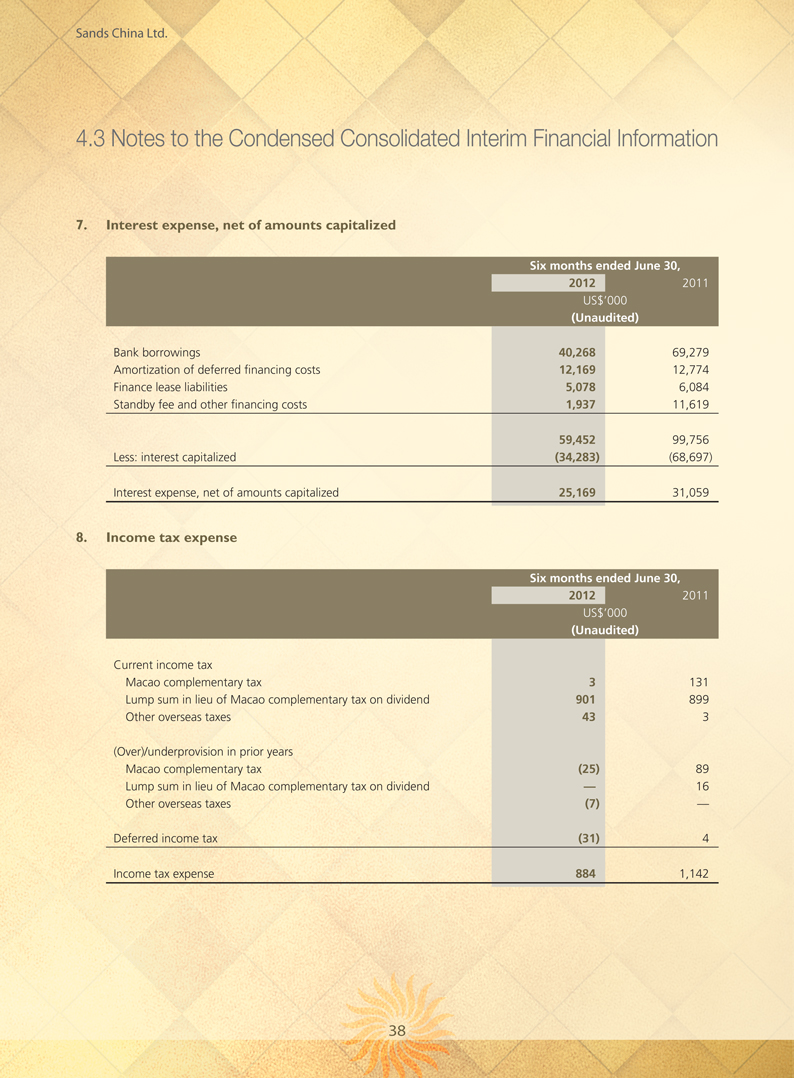
4.3 Notes to the Condensed Consolidated Interim Financial Information
7. Interest expense, net of amounts capitalized
Six months ended June 30,
2012 2011
US$’000
(Unaudited)
Bank borrowings 40,268 69,279
Amortization of deferred financing costs 12,169 12,774
Finance lease liabilities 5,078 6,084
Standby fee and other financing costs 1,937 11,619
59,452 99,756
Less: interest capitalized(34,283)(68,697)
Interest expense, net of amounts capitalized 25,169 31,059
8. Income tax expense
Six months ended June 30,
2012 2011
US$’000
(Unaudited)
Current income tax
Macao complementary tax 3 131
Lump sum in lieu of Macao complementary tax on dividend 901 899
Other overseas taxes 43 3
(Over)/underprovision in prior years
Macao complementary tax(25) 89
Lump sum in lieu of Macao complementary tax on dividend — 16
Other overseas taxes(7) —
Deferred income tax(31) 4
Income tax expense 884 1,142
38
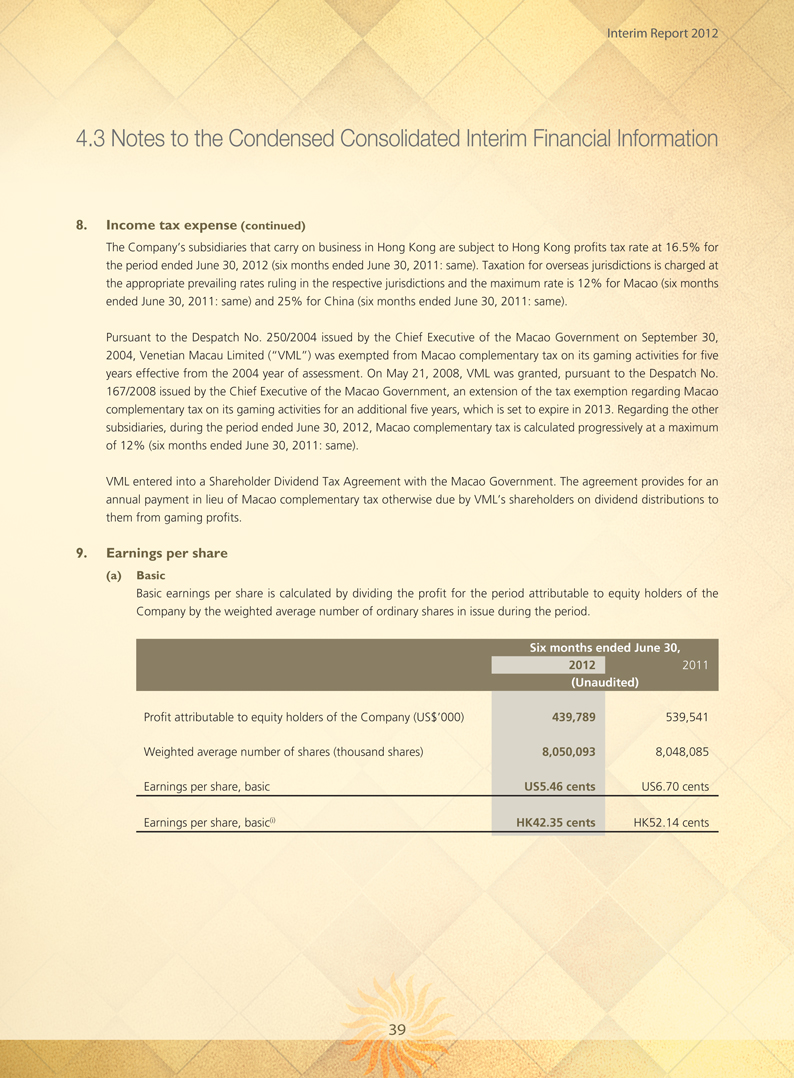
4.3 Notes to the Condensed Consolidated Interim Financial Information
8. Income tax expense (continued)
The Company’s subsidiaries that carry on business in Hong Kong are subject to Hong Kong profits tax rate at 16.5% for the period ended June 30, 2012 (six months ended June 30, 2011: same). Taxation for overseas jurisdictions is charged at the appropriate prevailing rates ruling in the respective jurisdictions and the maximum rate is 12% for Macao (six months ended June 30, 2011: same) and 25% for China (six months ended June 30, 2011: same).
Pursuant to the Despatch No. 250/2004 issued by the Chief Executive of the Macao Government on September 30, 2004, Venetian Macau Limited (“VML”) was exempted from Macao complementary tax on its gaming activities for five years effective from the 2004 year of assessment. On May 21, 2008, VML was granted, pursuant to the Despatch No. 167/2008 issued by the Chief Executive of the Macao Government, an extension of the tax exemption regarding Macao complementary tax on its gaming activities for an additional five years, which is set to expire in 2013. Regarding the other subsidiaries, during the period ended June 30, 2012, Macao complementary tax is calculated progressively at a maximum of 12% (six months ended June 30, 2011: same).
VML entered into a Shareholder Dividend Tax Agreement with the Macao Government. The agreement provides for an annual payment in lieu of Macao complementary tax otherwise due by VML’s shareholders on dividend distributions to them from gaming profits.
9. Earnings per share
(a) Basic
Basic earnings per share is calculated by dividing the profit for the period attributable to equity holders of the Company by the weighted average number of ordinary shares in issue during the period.
Six months ended June 30,
2012 2011
(Unaudited)
Profit attributable to equity holders of the Company (US$’000) 439,789 539,541
Weighted average number of shares (thousand shares) 8,050,093 8,048,085
Earnings per share, basic US5.46 cents US6.70 cents
Earnings per share, basic(i) HK42.35 cents HK52.14 cents
39

4.3 Notes to the Condensed Consolidated Interim Financial Information
9. Earnings per share (continued)
(b) Diluted
Diluted earnings per share is calculated by adjusting the weighted average number of ordinary shares outstanding to assume conversion of all dilutive potential ordinary shares. For the six months ended June 30, 2012, the Company has outstanding share options that will potentially dilute the ordinary shares. For the share options, a calculation is done to determine the number of shares that could have been acquired at fair value (determined as the average annual market share price of the Company’s shares) based on the monetary value of the subscription rights attached to outstanding share options. The number of shares calculated as above is compared with the number of shares that would have been issued assuming the exercise of the share options.
Six months ended June 30,
2012 2011
(Unaudited)
Profit attributable to equity holders of the Company (US$’000) 439,789 539,541
Weighted average number of shares (thousand shares) 8,050,093 8,048,085
Adjustments for share options (thousand shares) 6,399 1,797
Weighted average number of shares for diluted
earnings per share (thousand shares) 8,056,492 8,049,882
Earnings per share, diluted US5.46 cents US6.70 cents
Earnings per share, diluted(i) HK42.35 cents HK52.14 cents
40
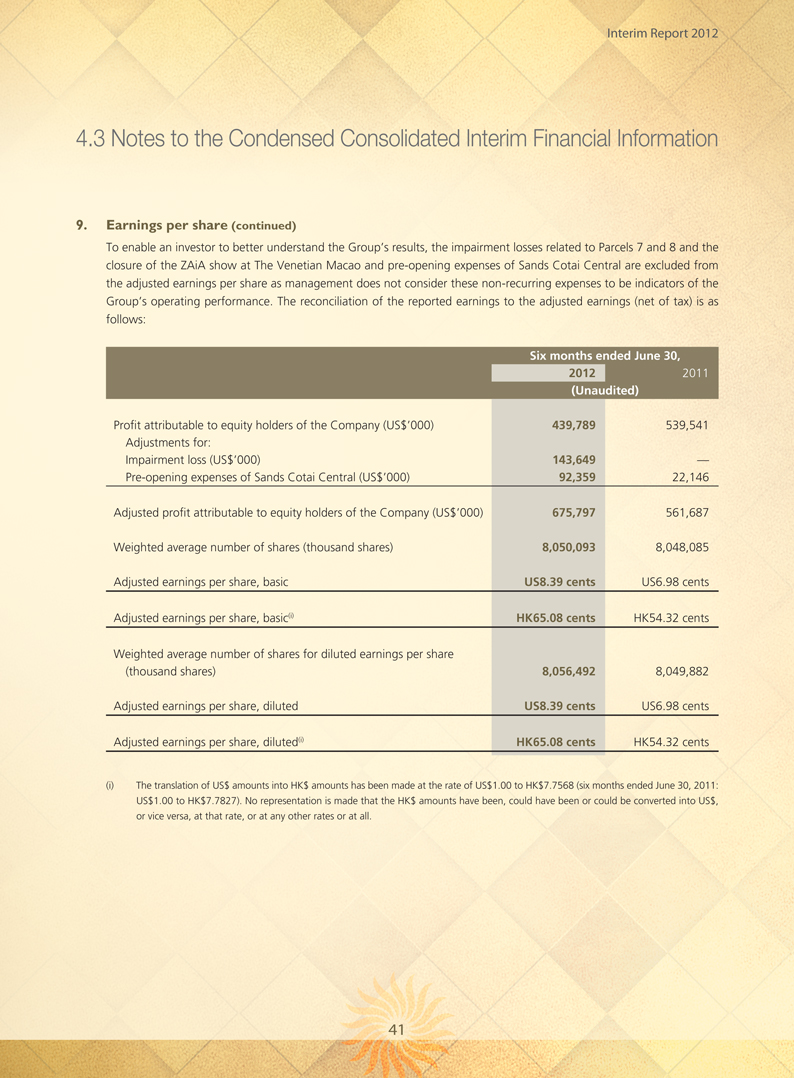
4.3 Notes to the Condensed Consolidated Interim Financial Information
9. Earnings per share (continued)
To enable an investor to better understand the Group’s results, the impairment losses related to Parcels 7 and 8 and the closure of the ZAiA show at The Venetian Macao and pre-opening expenses of Sands Cotai Central are excluded from the adjusted earnings per share as management does not consider these non-recurring expenses to be indicators of the Group’s operating performance. The reconciliation of the reported earnings to the adjusted earnings (net of tax) is as follows:
Six months ended June 30,
2012 2011
(Unaudited)
Profit attributable to equity holders of the Company (US$’000) 439,789 539,541
Adjustments for:
Impairment loss (US$’000) 143,649 —
Pre-opening expenses of Sands Cotai Central (US$’000) 92,359 22,146
Adjusted profit attributable to equity holders of the Company (US$’000) 675,797 561,687
Weighted average number of shares (thousand shares) 8,050,093 8,048,085
Adjusted earnings per share, basic US8.39 cents US6.98 cents
Adjusted earnings per share, basic(i) HK65.08 cents HK54.32 cents
Weighted average number of shares for diluted earnings per share
(thousand shares) 8,056,492 8,049,882
Adjusted earnings per share, diluted US8.39 cents US6.98 cents
Adjusted earnings per share, diluted(i) HK65.08 cents HK54.32 cents
(i) The translation of US$ amounts into HK$ amounts has been made at the rate of US$1.00 to HK$7.7568 (six months ended June 30, 2011: US$1.00 to HK$7.7827). No representation is made that the HK$ amounts have been, could have been or could be converted into US$, or vice versa, at that rate, or at any other rates or at all.
41
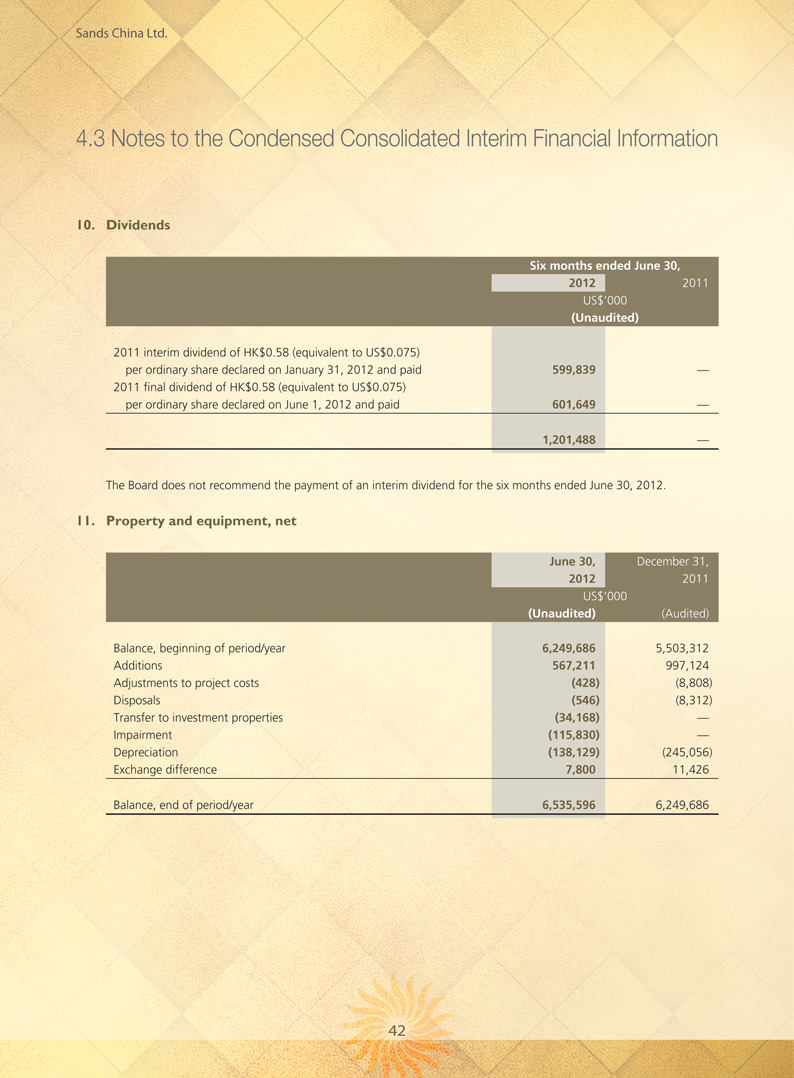
4.3 Notes to the Condensed Consolidated Interim Financial Information
10. Dividends
Six months ended June 30,
2012 2011
US$’000
(Unaudited)
2011 interim dividend of HK$0.58 (equivalent to US$0.075)
per ordinary share declared on January 31, 2012 and paid 599,839 —
2011 final dividend of HK$0.58 (equivalent to US$0.075)
per ordinary share declared on June 1, 2012 and paid 601,649 —
1,201,488 —
The Board does not recommend the payment of an interim dividend for the six months ended June 30, 2012.
11. Property and equipment, net
June 30, December 31,
2012 2011
US$’000
(Unaudited) (Audited)
Balance, beginning of period/year 6,249,686 5,503,312
Additions 567,211 997,124
Adjustments to project costs (428) (8,808)
Disposals (546) (8,312)
Transfer to investment properties (34,168) —
Impairment (115,830) —
Depreciation (138,129) (245,056)
Exchange difference 7,800 11,426
Balance, end of period/year 6,535,596 6,249,686
42
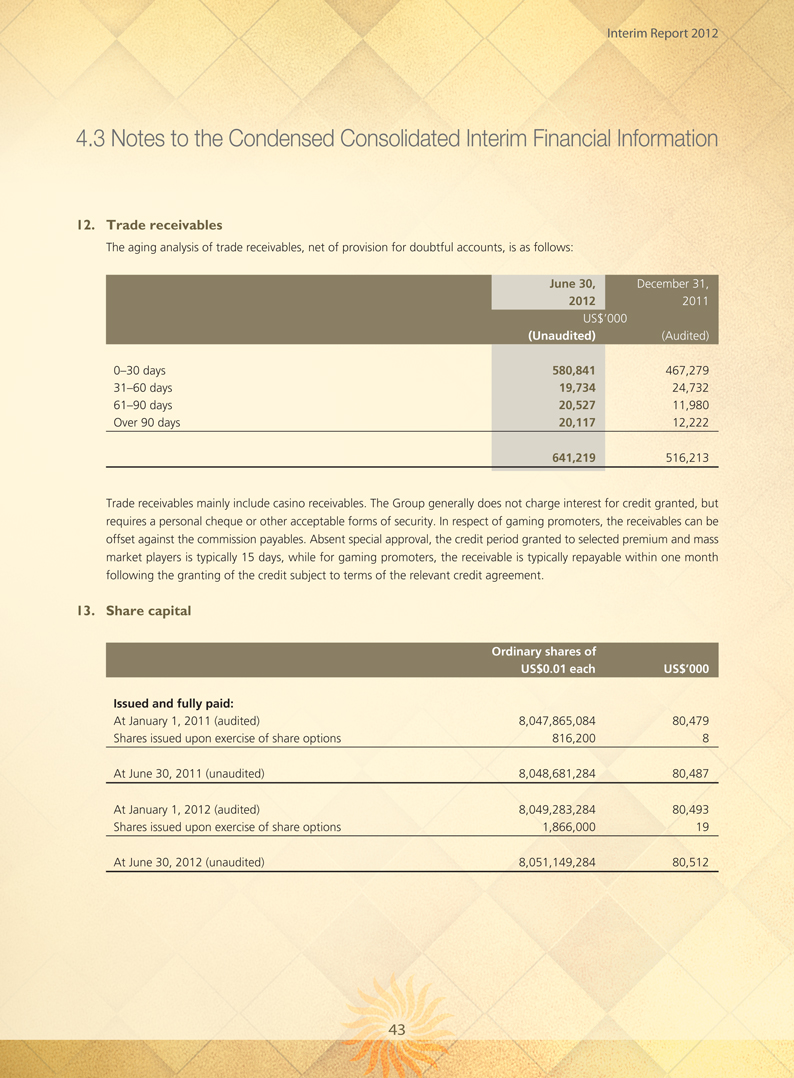
4.3 Notes to the Condensed Consolidated Interim Financial Information
12. Trade receivables
The aging analysis of trade receivables, net of provision for doubtful accounts, is as follows:
June 30, December 31,
2012 2011
US$’000
(Unaudited) (Audited)
0–30 days 580,841 467,279
31–60 days 19,734 24,732
61–90 days 20,527 11,980
Over 90 days 20,117 12,222
641,219 516,213
Trade receivables mainly include casino receivables. The Group generally does not charge interest for credit granted, but requires a personal cheque or other acceptable forms of security. In respect of gaming promoters, the receivables can be offset against the commission payables. Absent special approval, the credit period granted to selected premium and mass market players is typically 15 days, while for gaming promoters, the receivable is typically repayable within one month following the granting of the credit subject to terms of the relevant credit agreement.
13. Share capital
Ordinary shares of
US$0.01 each US$’000
Issued and fully paid:
At January 1, 2011 (audited) 8,047,865,084 80,479
Shares issued upon exercise of share options 816,200 8
At June 30, 2011 (unaudited) 8,048,681,284 80,487
At January 1, 2012 (audited) 8,049,283,284 80,493
Shares issued upon exercise of share options 1,866,000 19
At June 30, 2012 (unaudited) 8,051,149,284 80,512
43
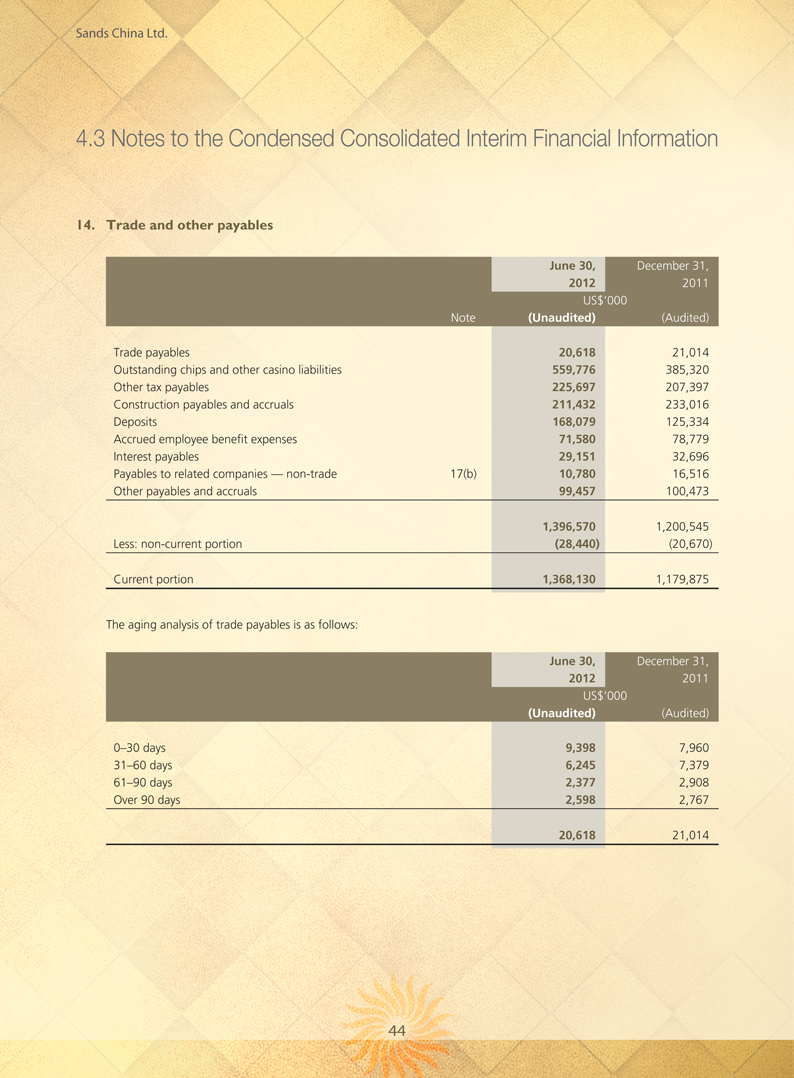
4.3 Notes to the Condensed Consolidated Interim Financial Information
14. Trade and other payables
June 30, December 31,
2012 2011
US$’000
Note (Unaudited) (Audited)
Trade payables 20,618 21,014
Outstanding chips and other casino liabilities 559,776 385,320
Other tax payables 225,697 207,397
Construction payables and accruals 211,432 233,016
Deposits 168,079 125,334
Accrued employee benefit expenses 71,580 78,779
Interest payables 29,151 32,696
Payables to related companies — non-trade 17(b) 10,780 16,516
Other payables and accruals 99,457 100,473
1,396,570 1,200,545
Less: non-current portion (28,440) (20,670)
Current portion 1,368,130 1,179,875
The aging analysis of trade payables is as follows:
June 30, December 31,
2012 2011
US$’000
(Unaudited) (Audited)
0–30 days 9,398 7,960
31–60 days 6,245 7,379
61–90 days 2,377 2,908
Over 90 days 2,598 2,767
20,618 21,014
44
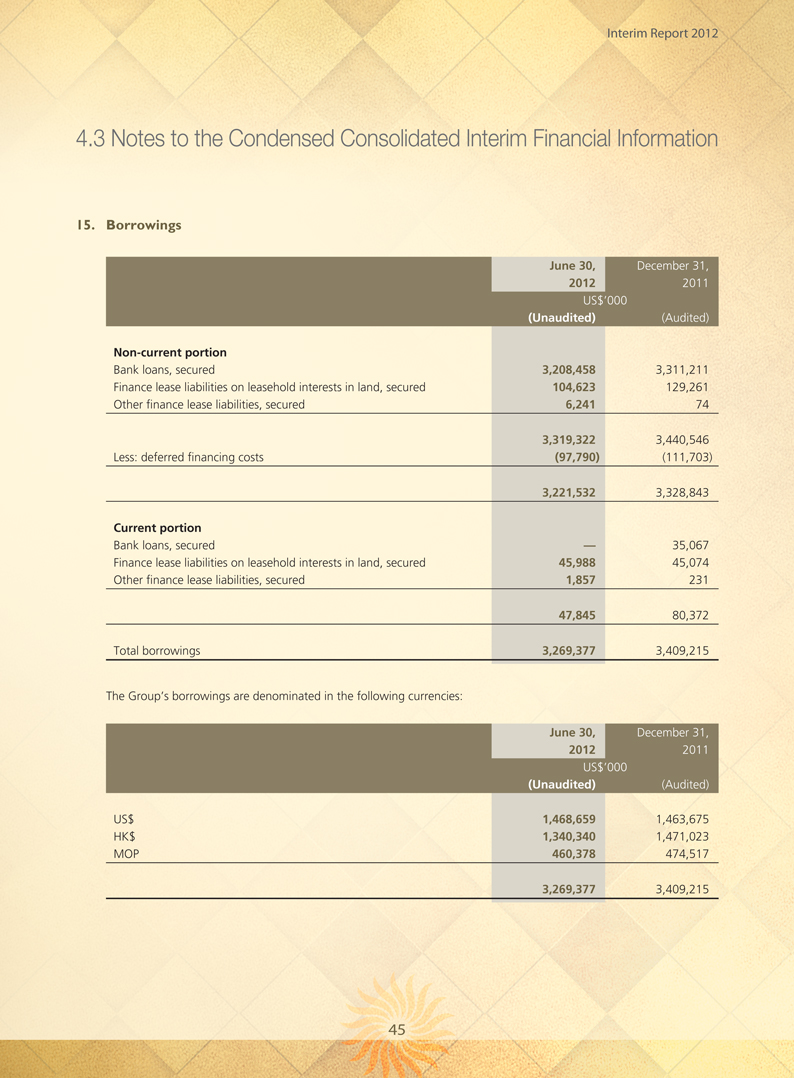
4.3 Notes to the Condensed Consolidated Interim Financial Information
15. Borrowings
June 30, December 31,
2012 2011
US$’000
(Unaudited) (Audited)
Non-current portion
Bank loans, secured 3,208,458 3,311,211
Finance lease liabilities on leasehold interests in land, secured 104,623 129,261
Other finance lease liabilities, secured 6,241 74
3,319,322 3,440,546
Less: deferred financing costs (97,790) (111,703)
3,221,532 3,328,843
Current portion
Bank loans, secured — 35,067
Finance lease liabilities on leasehold interests in land, secured 45,988 45,074
Other finance lease liabilities, secured 1,857 231
47,845 80,372
Total borrowings 3,269,377 3,409,215
The Group’s borrowings are denominated in the following currencies:
June 30, December 31,
2012 2011
US$’000
(Unaudited) (Audited)
US$ 1,468,659 1,463,675
HK$ 1,340,340 1,471,023
MOP 460,378 474,517
3,269,377 3,409,215
45
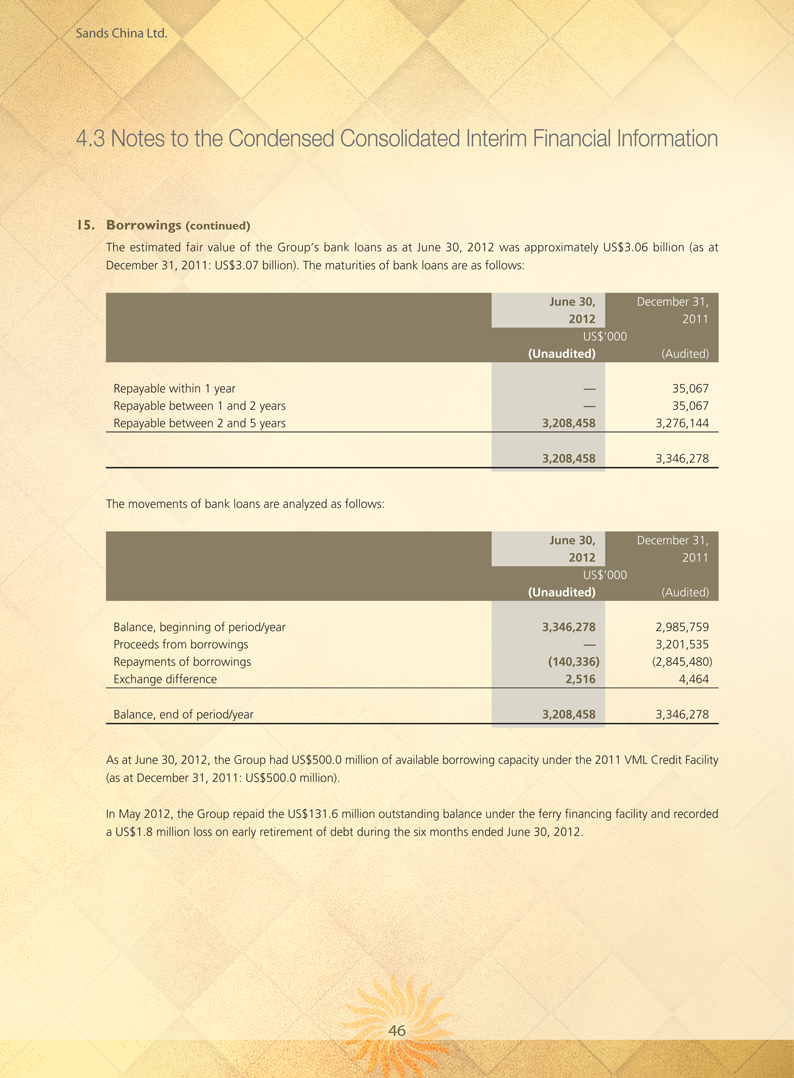
4.3 Notes to the Condensed Consolidated Interim Financial Information
15. Borrowings (continued)
The estimated fair value of the Group’s bank loans as at June 30, 2012 was approximately US$3.06 billion (as at December 31, 2011: US$3.07 billion). The maturities of bank loans are as follows:
June 30, December 31,
2012 2011
US$’000
(Unaudited) (Audited)
Repayable within 1 year — 35,067
Repayable between 1 and 2 years — 35,067
Repayable between 2 and 5 years 3,208,458 3,276,144
3,208,458 3,346,278
The movements of bank loans are analyzed as follows:
June 30, December 31,
2012 2011
US$’000
(Unaudited) (Audited)
Balance, beginning of period/year 3,346,278 2,985,759
Proceeds from borrowings — 3,201,535
Repayments of borrowings (140,336) (2,845,480)
Exchange difference 2,516 4,464
Balance, end of period/year 3,208,458 3,346,278
As at June 30, 2012, the Group had US$500.0 million of available borrowing capacity under the 2011 VML Credit Facility (as at December 31, 2011: US$500.0 million).
In May 2012, the Group repaid the US$131.6 million outstanding balance under the ferry financing facility and recorded a US$1.8 million loss on early retirement of debt during the six months ended June 30, 2012.
46
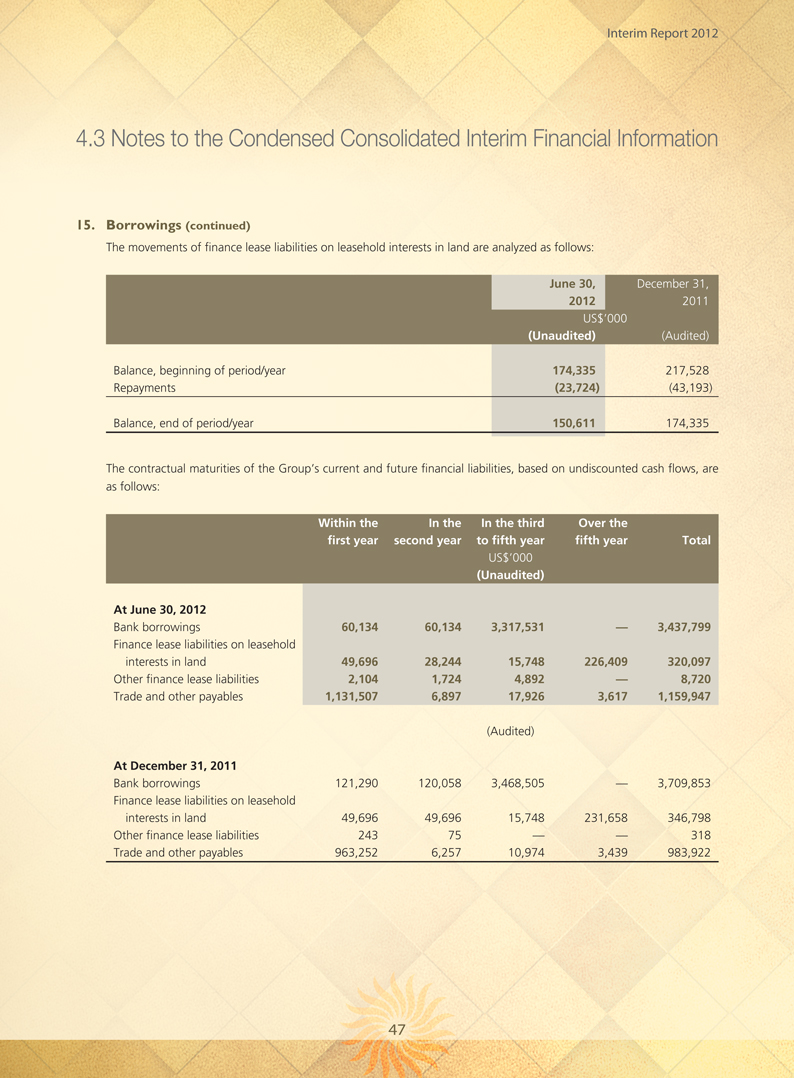
4.3 Notes to the Condensed Consolidated Interim Financial Information
15. Borrowings (continued)
The movements of finance lease liabilities on leasehold interests in land are analyzed as follows:
June 30, December 31,
2012 2011
US$’000
(Unaudited) (Audited)
Balance, beginning of period/year 174,335 217,528
Repayments (23,724) (43,193)
Balance, end of period/year 150,611 174,335
The contractual maturities of the Group’s current and future financial liabilities, based on undiscounted cash flows, are as follows:
Within the In the In the third Over the
first year second year to fifth year fifth year Total
US$’000
(Unaudited)
At June 30, 2012
Bank borrowings 60,134 60,134 3,317,531 — 3,437,799
Finance lease liabilities on leasehold
interests in land 49,696 28,244 15,748 226,409 320,097
Other finance lease liabilities 2,104 1,724 4,892 — 8,720
Trade and other payables 1,131,507 6,897 17,926 3,617 1,159,947
(Audited)
At December 31, 2011
Bank borrowings 121,290 120,058 3,468,505 — 3,709,853
Finance lease liabilities on leasehold
interests in land 49,696 49,696 15,748 231,658 346,798
Other finance lease liabilities 243 75 — — 318
Trade and other payables 963,252 6,257 10,974 3,439 983,922
47
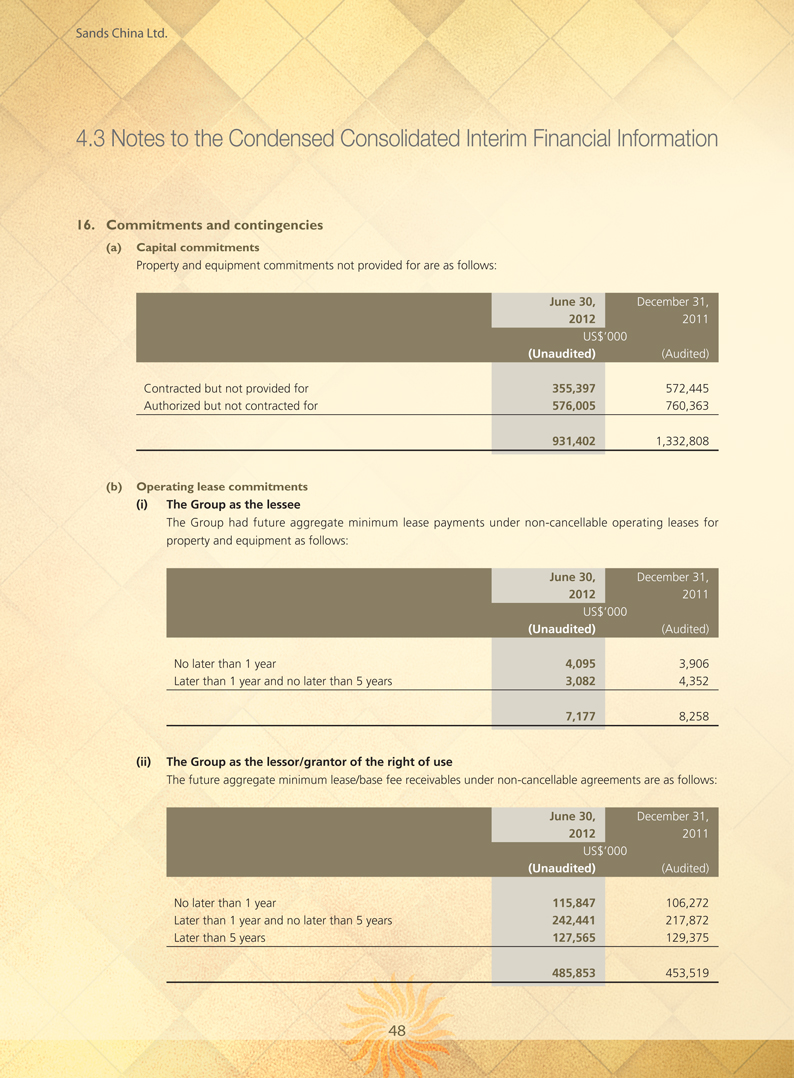
4.3 Notes to the Condensed Consolidated Interim Financial Information
16. Commitments and contingencies
(a) Capital commitments
Property and equipment commitments not provided for are as follows:
June 30, December 31,
2012 2011
US$’000
(Unaudited) (Audited)
Contracted but not provided for 355,397 572,445
Authorized but not contracted for 576,005 760,363
931,402 1,332,808
(b) Operating lease commitments
(i) The Group as the lessee
The Group had future aggregate minimum lease payments under non-cancellable operating leases for property and equipment as follows:
June 30, December 31,
2012 2011
US$’000
(Unaudited) (Audited)
No later than 1 year 4,095 3,906
Later than 1 year and no later than 5 years 3,082 4,352
7,177 8,258
(ii) The Group as the lessor/grantor of the right of use
The future aggregate minimum lease/base fee receivables under non-cancellable agreements are as follows:
June 30, December 31,
2012 2011
US$’000
(Unaudited) (Audited)
No later than 1 year 115,847 106,272
Later than 1 year and no later than 5 years 242,441 217,872
Later than 5 years 127,565 129,375
485,853 453,519
48
4.3 Notes to the Condensed Consolidated Interim Financial Information
16. Commitments and contingencies (continued)
(c) Contingencies
The Group has contingent liabilities arising in the ordinary course of business. Management has made certain estimates for potential litigation costs based upon consultation with legal counsel. Actual results could differ from these estimates; however, in the opinion of management, such litigation and claims will not have a material adverse effect on our financial condition, results of operations or cash flows.
(d) Cotai Strip development projects
The Group had commenced pre-construction on Parcel 3 and had capitalized costs of approximately US$122.8 million including land of US$85.2 million as at June 30, 2012. Under the terms of the land concession for Parcels 1, 2 and 3, the Group was initially required to complete the development of Parcel 3 by August 2011. In 2009, the Group was granted an extension from the Macao Government, which extended the deadline to complete the development of Parcel 3 until April 2013. In July 2012, the Macao Government granted the Group an additional extension, which now requires the development to be completed by April 2016. The Group intends to commence construction after the necessary government approvals are obtained. The land concession for Sands Cotai Central contains a similar requirement that the corresponding development be completed by May 2014. The Group had capitalized costs of approximately US$3.73 billion including land of US$286.1 million, as at June 30, 2012, related to Sands Cotai Central. Should the Group determine that it is unable to complete the developments by their respective deadlines, the Group intends to apply for extensions from the Macao Government; however, no assurances can be given that extensions will be granted. If the Group is unable to meet these deadlines and the deadlines are not extended, it could lose its land concessions for Sands Cotai Central or Parcel 3, which would prohibit the Group from operating any facilities developed under the respective land concessions. As a result, the Group could record a charge for all or some portion of its capitalized construction costs including land related to Sands Cotai Central and Parcel 3.
49
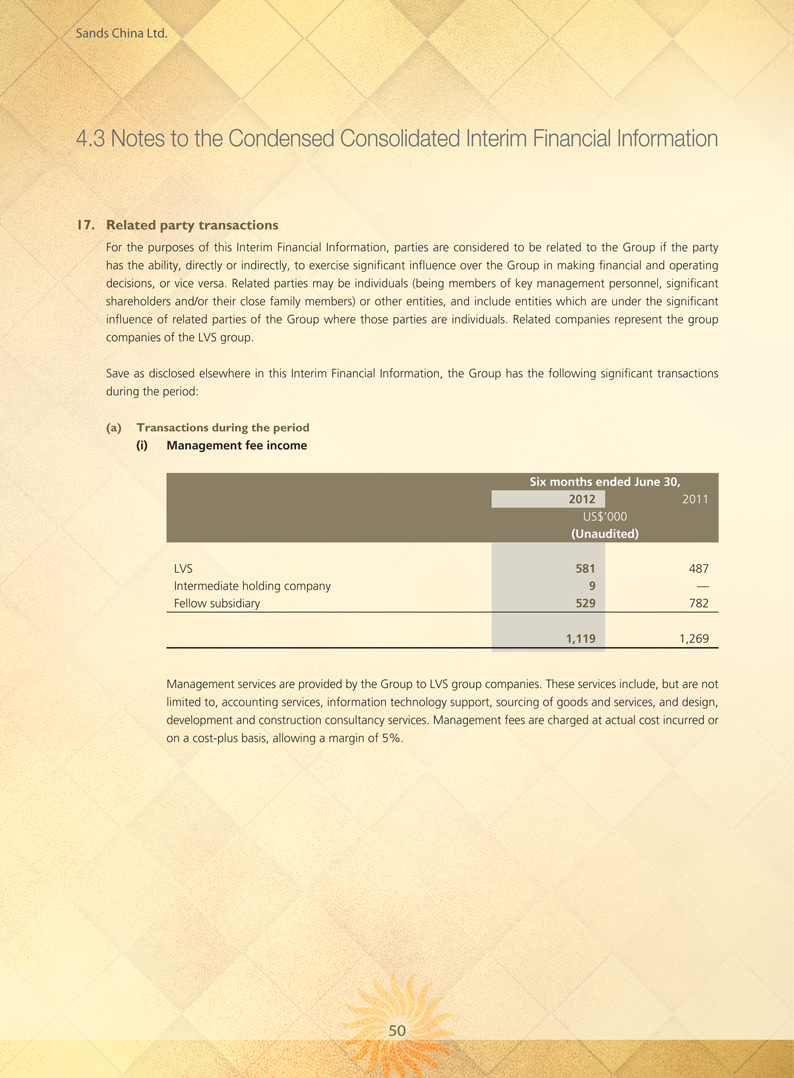
4.3 Notes to the Condensed Consolidated Interim Financial Information
17. Related party transactions
For the purposes of this Interim Financial Information, parties are considered to be related to the Group if the party has the ability, directly or indirectly, to exercise significant influence over the Group in making financial and operating decisions, or vice versa. Related parties may be individuals (being members of key management personnel, significant shareholders and/or their close family members) or other entities, and include entities which are under the significant influence of related parties of the Group where those parties are individuals. Related companies represent the group companies of the LVS group.
Save as disclosed elsewhere in this Interim Financial Information, the Group has the following significant transactions during the period:
(a) Transactions during the period
(i) Management fee income
Six months ended June 30,
2012 2011
US$’000
(Unaudited)
LVS 581 487
Intermediate holding company 9 —
Fellow subsidiary 529 782
1,119 1,269
Management services are provided by the Group to LVS group companies. These services include, but are not limited to, accounting services, information technology support, sourcing of goods and services, and design, development and construction consultancy services. Management fees are charged at actual cost incurred or on a cost-plus basis, allowing a margin of 5%.
50
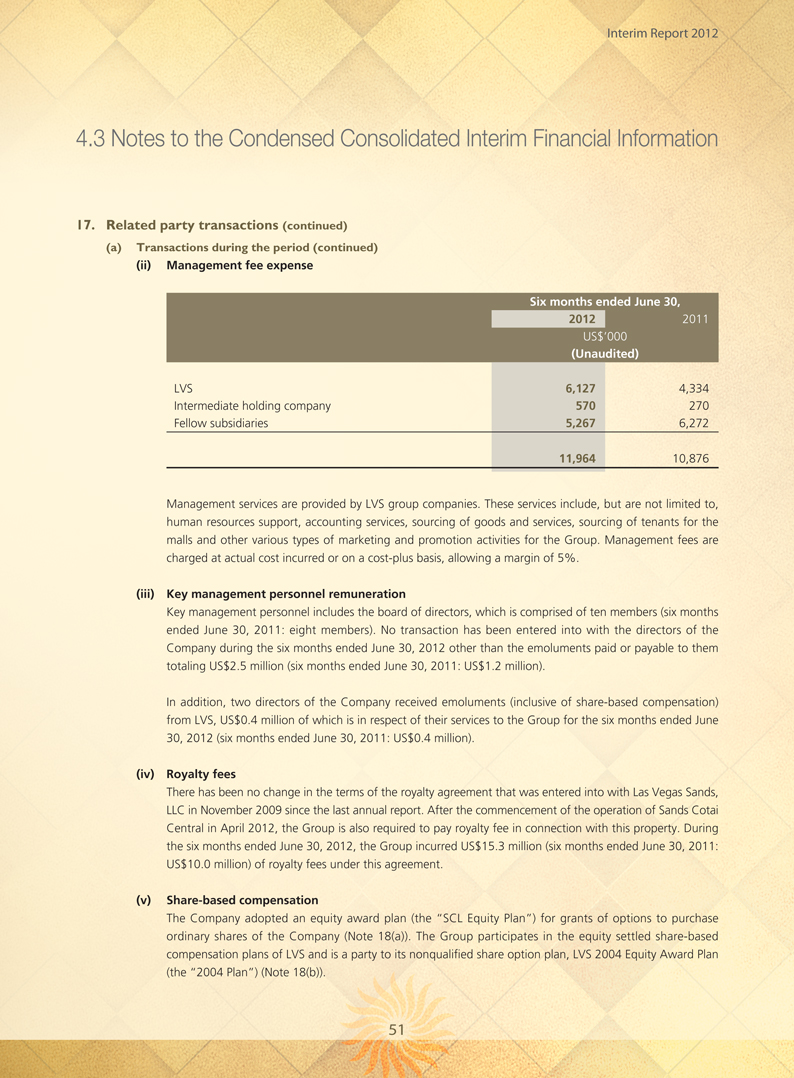
4.3 Notes to the Condensed Consolidated Interim Financial Information
17. Related party transactions (continued)
(a) Transactions during the period (continued)
(ii) Management fee expense
Six months ended June 30,
2012 2011
US$’000
(Unaudited)
LVS 6,127 4,334
Intermediate holding company 570 270
Fellow subsidiaries 5,267 6,272
11,964 10,876
Management services are provided by LVS group companies. These services include, but are not limited to, human resources support, accounting services, sourcing of goods and services, sourcing of tenants for the malls and other various types of marketing and promotion activities for the Group. Management fees are charged at actual cost incurred or on a cost-plus basis, allowing a margin of 5%.
(iii) Key management personnel remuneration
Key management personnel includes the board of directors, which is comprised of ten members (six months ended June 30, 2011: eight members). No transaction has been entered into with the directors of the Company during the six months ended June 30, 2012 other than the emoluments paid or payable to them totaling US$2.5 million (six months ended June 30, 2011: US$1.2 million).
In addition, two directors of the Company received emoluments (inclusive of share-based compensation) from LVS, US$0.4 million of which is in respect of their services to the Group for the six months ended June 30, 2012 (six months ended June 30, 2011: US$0.4 million).
(iv) Royalty fees
There has been no change in the terms of the royalty agreement that was entered into with Las Vegas Sands, LLC in November 2009 since the last annual report. After the commencement of the operation of Sands Cotai Central in April 2012, the Group is also required to pay royalty fee in connection with this property. During the six months ended June 30, 2012, the Group incurred US$15.3 million (six months ended June 30, 2011: US$10.0 million) of royalty fees under this agreement.
(v) Share-based compensation
The Company adopted an equity award plan (the “SCL Equity Plan”) for grants of options to purchase ordinary shares of the Company (Note 18(a)). The Group participates in the equity settled share-based compensation plans of LVS and is a party to its nonqualified share option plan, LVS 2004 Equity Award Plan (the “2004 Plan”) (Note 18(b)).
51
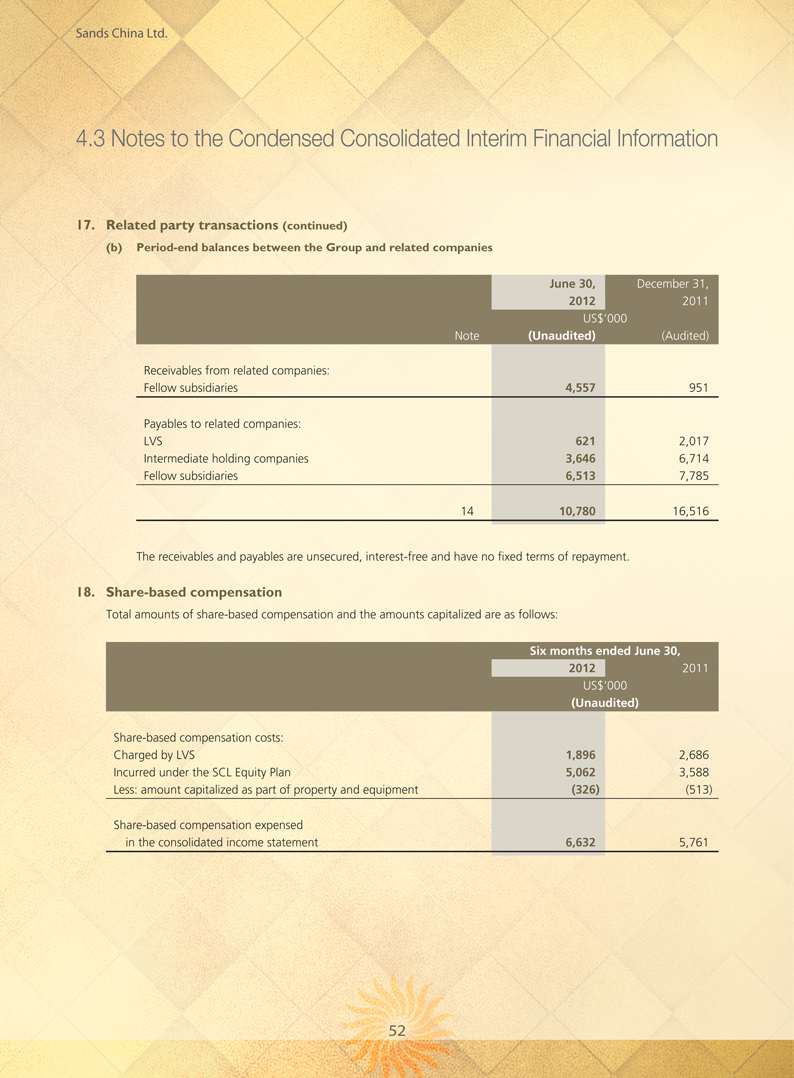
4.3 Notes to the Condensed Consolidated Interim Financial Information
17. Related party transactions (continued)
(b) Period-end balances between the Group and related companies
June 30, December 31,
2012 2011
US$’000
Note (Unaudited) (Audited)
Receivables from related companies:
Fellow subsidiaries 4,557 951
Payables to related companies:
LVS 621 2,017
Intermediate holding companies 3,646 6,714
Fellow subsidiaries 6,513 7,785
14 10,780 16,516
The receivables and payables are unsecured, interest-free and have no fixed terms of repayment.
18. Share-based compensation
Total amounts of share-based compensation and the amounts capitalized are as follows:
Six months ended June 30,
2012 2011
US$’000
(Unaudited)
Share-based compensation costs:
Charged by LVS 1,896 2,686
Incurred under the SCL Equity Plan 5,062 3,588
Less: amount capitalized as part of property and equipment (326) (513)
Share-based compensation expensed
in the consolidated income statement 6,632 5,761
52
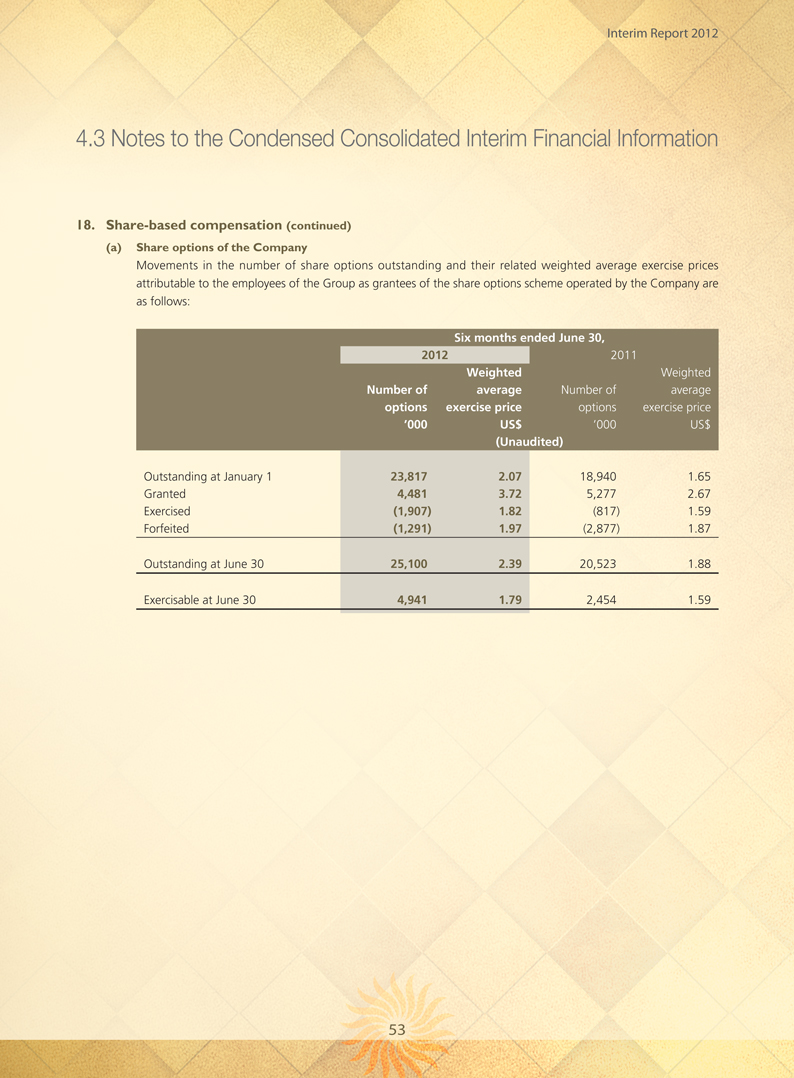
4.3 Notes to the Condensed Consolidated Interim Financial Information
18. Share-based compensation (continued)
(a) Share options of the Company
Movements in the number of share options outstanding and their related weighted average exercise prices attributable to the employees of the Group as grantees of the share options scheme operated by the Company are as follows:
Six months ended June 30,
2012 2011
Weighted Weighted
Number of average Number of average
options exercise price options exercise price
‘000 US$ ‘000 US$
(Unaudited)
Outstanding at January 1 23,817 2.07 18,940 1.65
Granted 4,481 3.72 5,277 2.67
Exercised (1,907) 1.82 (817) 1.59
Forfeited (1,291) 1.97 (2,877) 1.87
Outstanding at June 30 25,100 2.39 20,523 1.88
Exercisable at June 30 4,941 1.79 2,454 1.59
53
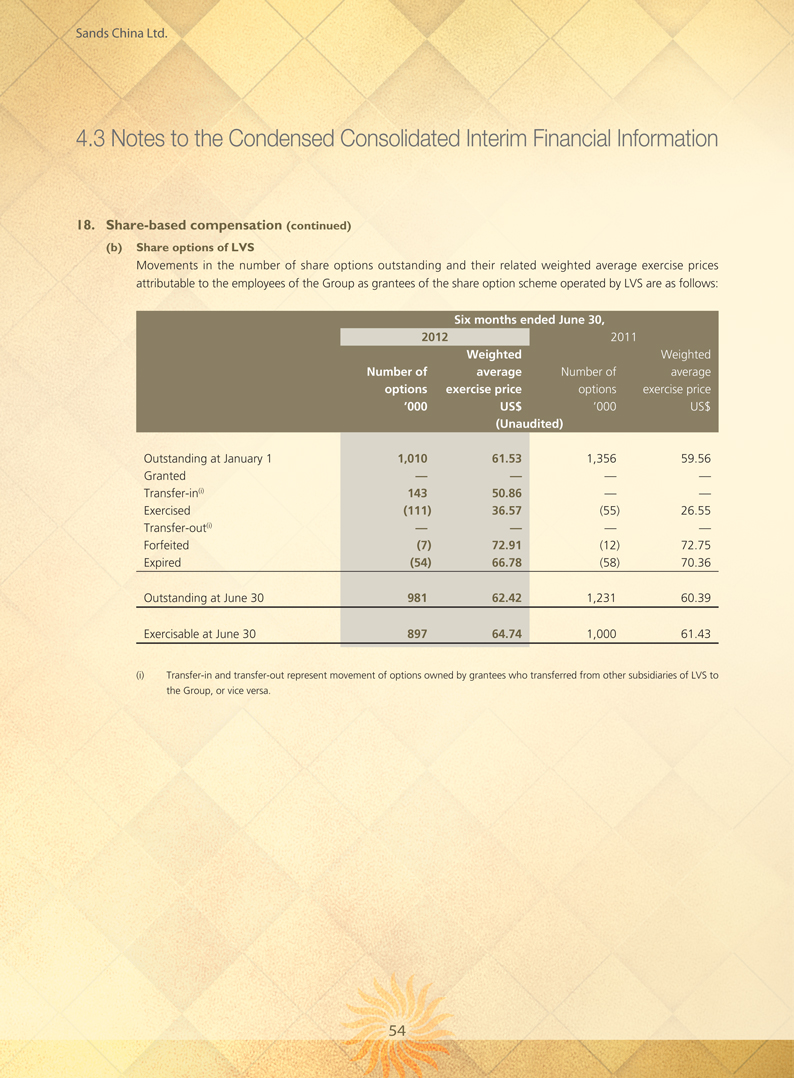
4.3 Notes to the Condensed Consolidated Interim Financial Information
18. Share-based compensation (continued)
(b) Share options of LVS
Movements in the number of share options outstanding and their related weighted average exercise prices attributable to the employees of the Group as grantees of the share option scheme operated by LVS are as follows:
Six months ended June 30,
2012 2011
Weighted Weighted
Number of average Number of average
options exercise price options exercise price
‘000 US$ ‘000 US$
(Unaudited)
Outstanding at January 1 1,010 61.53 1,356 59.56
Granted — — — —
Transfer-in(i) 143 50.86 — —
Exercised (111) 36.57 (55) 26.55
Transfer-out(i) — — — —
Forfeited (7) 72.91 (12) 72.75
Expired (54) 66.78 (58) 70.36
Outstanding at June 30 981 62.42 1,231 60.39
Exercisable at June 30 897 64.74 1,000 61.43
(i) Transfer-in and transfer-out represent movement of options owned by grantees who transferred from other subsidiaries of LVS to
the Group, or vice versa.
54
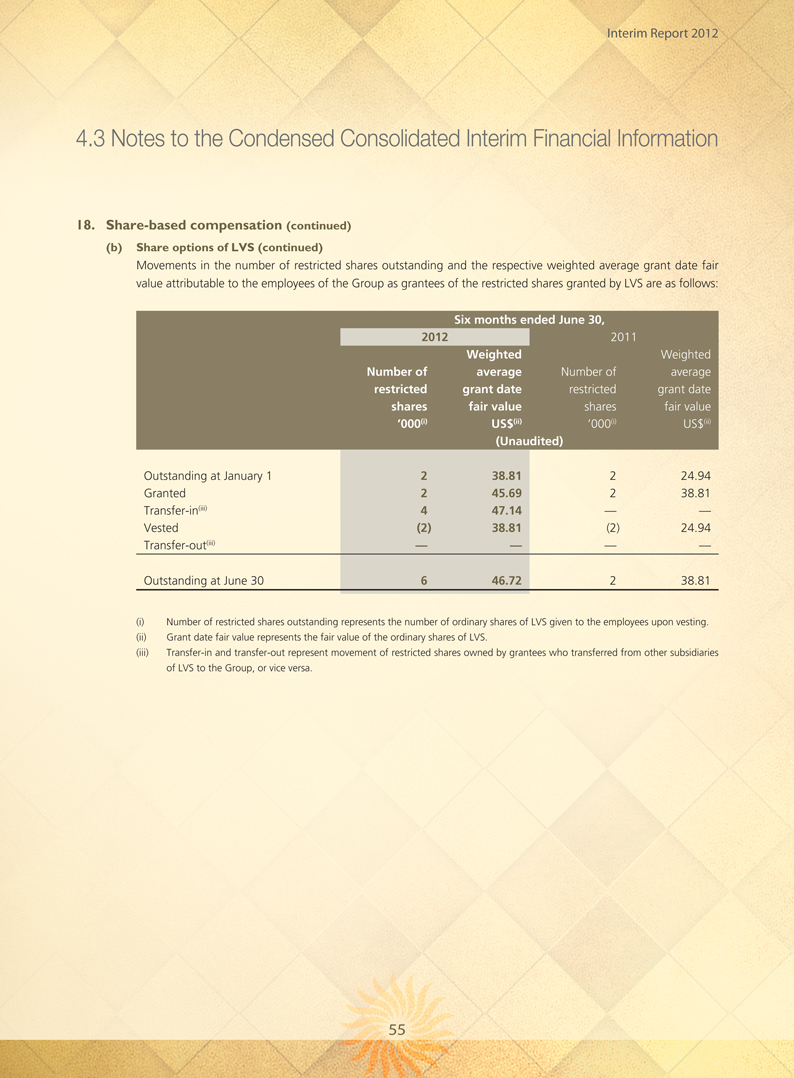
4.3 Notes to the Condensed Consolidated Interim Financial Information
18. Share-based compensation (continued)
(b) Share options of LVS (continued)
Movements in the number of restricted shares outstanding and the respective weighted average grant date fair value attributable to the employees of the Group as grantees of the restricted shares granted by LVS are as follows:
Six months ended June 30,
2012 2011
Weighted Weighted
Number of average Number of average
restricted grant date restricted grant date
shares fair value shares fair value
‘000(i) US$(ii) ‘000(i) US$(ii)
(Unaudited)
Outstanding at January 1 2 38.81 2 24.94
Granted 2 45.69 2 38.81
Transfer-in(iii) 4 47.14 — —
Vested (2) 38.81 (2) 24.94
Transfer-out(iii) — — — —
Outstanding at June 30 6 46.72 2 38.81
(i) Number of restricted shares outstanding represents the number of ordinary shares of LVS given to the employees upon vesting.
(ii) Grant date fair value represents the fair value of the ordinary shares of LVS.
(iii) Transfer-in and transfer-out represent movement of restricted shares owned by grantees who transferred from other subsidiaries
of LVS to the Group, or vice versa.
55
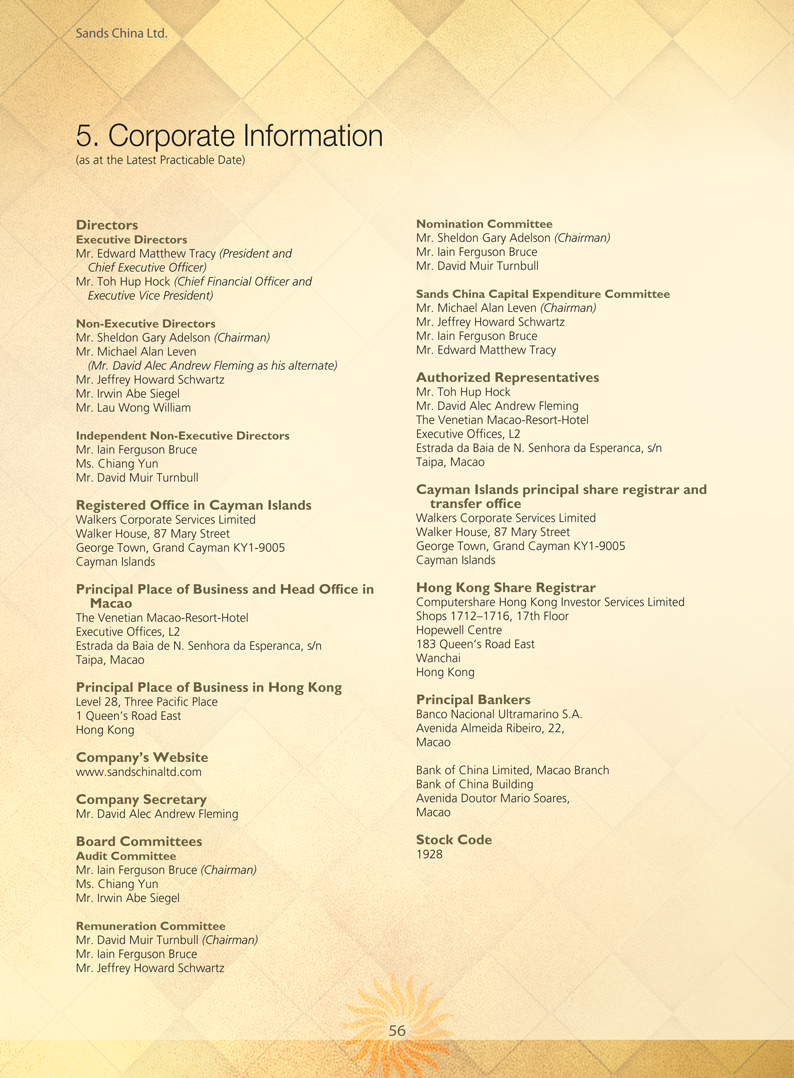
5. Corporate Information
(as at the Latest Practicable Date)
Directors
Executive Directors
Mr. Edward Matthew Tracy (President and
Chief Executive Officer)
Mr. Toh Hup Hock (Chief Financial Officer and Executive Vice President)
Non-Executive Directors
Mr. Sheldon Gary Adelson (Chairman) Mr. Michael Alan Leven
(Mr. David Alec Andrew Fleming as his alternate)
Mr. Jeffrey Howard Schwartz Mr. Irwin Abe Siegel Mr. Lau Wong William
Independent Non-Executive Directors
Mr. Iain Ferguson Bruce Ms. Chiang Yun Mr. David Muir Turnbull
Registered Office in Cayman Islands
Walkers Corporate Services Limited Walker House, 87 Mary Street George Town, Grand Cayman KY1-9005 Cayman Islands
Principal Place of Business and Head Office in Macao
The Venetian Macao-Resort-Hotel Executive Offices, L2
Estrada da Baia de N. Senhora da Esperanca, s/n Taipa, Macao
Principal Place of Business in Hong Kong
Level 28, Three Pacific Place
1 Queen’s Road East Hong Kong
Company’s Website www.sandschinaltd.com
Company Secretary
Mr. David Alec Andrew Fleming
Board Committees
Audit Committee
Mr. Iain Ferguson Bruce (Chairman) Ms. Chiang Yun Mr. Irwin Abe Siegel
Remuneration Committee
Mr. David Muir Turnbull (Chairman) Mr. Iain Ferguson Bruce Mr. Jeffrey Howard Schwartz
Nomination Committee
Mr. Sheldon Gary Adelson (Chairman) Mr. Iain Ferguson Bruce Mr. David Muir Turnbull
Sands China Capital Expenditure Committee
Mr. Michael Alan Leven (Chairman) Mr. Jeffrey Howard Schwartz Mr. Iain Ferguson Bruce Mr. Edward Matthew Tracy
Authorized Representatives
Mr. Toh Hup Hock
Mr. David Alec Andrew Fleming The Venetian Macao-Resort-Hotel Executive Offices, L2
Estrada da Baia de N. Senhora da Esperanca, s/n Taipa, Macao
Cayman Islands principal share registrar and transfer office
Walkers Corporate Services Limited Walker House, 87 Mary Street George Town, Grand Cayman KY1-9005 Cayman Islands
Hong Kong Share Registrar
Computershare Hong Kong Investor Services Limited Shops 1712–1716, 17th Floor Hopewell Centre 183 Queen’s Road East Wanchai Hong Kong
Principal Bankers
Banco Nacional Ultramarino S.A. Avenida Almeida Ribeiro, 22, Macao
Bank of China Limited, Macao Branch Bank of China Building Avenida Doutor Mario Soares, Macao
Stock Code
1928
56

6. Contact Us
Interim Report
This 2012 Interim Report is printed in English and Chinese languages and is available on our website at www.sandschinaltd.com from September 6, 2012 and was posted to Shareholders on September 7, 2012.
Those Shareholders who received our 2012 Interim Report electronically and would like to receive a printed copy or vice versa may at any time change their means of receipt of the Company’s corporate communications free of charge by reasonable notice in writing to the Company c/o the Hong Kong Share Registrar by post at Computershare Hong Kong Investor Services Limited, 17M Floor, Hopewell Centre, 183 Queen’s Road East, Wanchai, Hong Kong or by email to sandschina.ecom@computershare.com.hk.
Those Shareholders who have chosen to receive this 2012 Interim Report by electronic means and who, for any reason, have difficulty in receiving or gaining access to this 2012 Interim Report, may also request to be sent a copy of this 2012 Interim Report in printed form free of charge by submitting a written request to the Company c/o the Hong Kong Share Registrar by post or by email.
Contact Us
Address: Level 28, Three Pacific Place, 1 Queen’s Road East, Hong Kong
Telephone: +853 8118 2888
Facsimile: +853 2888 3382
Email: scl-enquiries@venetian.com.mo
57
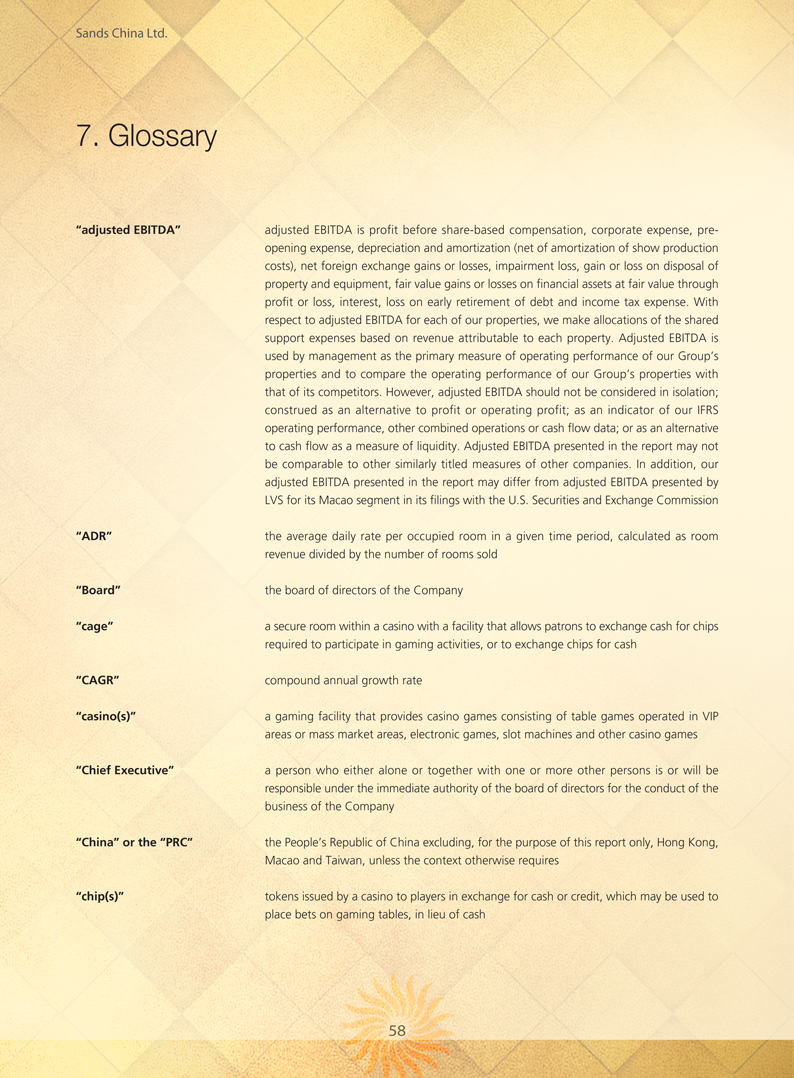
7. Glossary
“adjusted EBITDA” adjusted EBITDA is profit before share-based compensation, corporate expense, pre-
opening expense, depreciation and amortization (net of amortization of show production
costs), net foreign exchange gains or losses, impairment loss, gain or loss on disposal of
property and equipment, fair value gains or losses on financial assets at fair value through
profit or loss, interest, loss on early retirement of debt and income tax expense. With
respect to adjusted EBITDA for each of our properties, we make allocations of the shared
support expenses based on revenue attributable to each property. Adjusted EBITDA is
used by management as the primary measure of operating performance of our Group’s
properties and to compare the operating performance of our Group’s properties with
that of its competitors. However, adjusted EBITDA should not be considered in isolation;
construed as an alternative to profit or operating profit; as an indicator of our IFRS
operating performance, other combined operations or cash flow data; or as an alternative
to cash flow as a measure of liquidity. Adjusted EBITDA presented in the report may not
be comparable to other similarly titled measures of other companies. In addition, our
adjusted EBITDA presented in the report may differ from adjusted EBITDA presented by
LVS for its Macao segment in its filings with the U.S. Securities and Exchange Commission
“ADR” the average daily rate per occupied room in a given time period, calculated as room
revenue divided by the number of rooms sold
“Board” the board of directors of the Company
“cage” a secure room within a casino with a facility that allows patrons to exchange cash for chips
required to participate in gaming activities, or to exchange chips for cash
“CAGR” compound annual growth rate
“casino(s)” a gaming facility that provides casino games consisting of table games operated in VIP
areas or mass market areas, electronic games, slot machines and other casino games
“Chief Executive” a person who either alone or together with one or more other persons is or will be
responsible under the immediate authority of the board of directors for the conduct of the
business of the Company
“China” or the “PRC” the People’s Republic of China excluding, for the purpose of this report only, Hong Kong,
Macao and Taiwan, unless the context otherwise requires
“chip(s)” tokens issued by a casino to players in exchange for cash or credit, which may be used to
place bets on gaming tables, in lieu of cash
58
7. Glossary
“Company,” “our,” “we,” “us,” Sands China Ltd., a company incorporated in the Cayman Islands on July 15, 2009 as
or “Sands China” an exempted company with limited liability and, except where the context otherwise
requires, all of its subsidiaries, or where the context refers to the time before it became
the holding company of its present subsidiaries, its present subsidiaries. When used in
the context of gaming operations or the Subconcession, “we,” “us,” or “our” refers
exclusively to VML
“Companies Ordinance” the Companies Ordinance (Chapter 32 of the Laws of Hong Kong) as amended,
supplemented or otherwise modified from time to time
“Concessionaire(s)” the holder(s) of a concession for the operation of casino games in the MSAR. As at the
Latest Practicable Date, the Concessionaires were Galaxy, SJM and Wynn Macau
“Controlling Shareholder(s)” has the meaning ascribed to it under the Listing Rules and, with respect to our Company,
the controlling shareholders as referred to in “Relationship with Our Controlling
Shareholders” of our Prospectus
“Cotai” the name given to the land reclamation area in the MSAR between the islands of Coloane
and Taipa
“Cotai Strip” integrated resort projects on Cotai being developed by us and inspired by the Las Vegas
Strip in Las Vegas, Nevada, U.S.A. LVS has registered the Cotai Strip trademark in Hong
Kong and Macao
“DICJ” Gaming Inspection and Coordination Bureau (“Direcção de Inspecção e Coordenação de
Jogos”) under the Secretary for Economy and Finance of the MSAR
“Director(s)” member(s) of the board of directors of the Company
“DSEC” the Statistics and Census Service of the MSAR
“EBITDA” earnings before interest, taxes, depreciation and amortization
“Exchange Rate” save as otherwise stated, amounts denominated in U.S. dollars, MOP and Hong Kong
dollars have been converted, for the purposes of illustration only, in this report at:
US$1.00: HK$7.7568
US$1.00: MOP8.00
HK$1.00: MOP1.03
“Four Seasons Hotel” refers to the Four Seasons Hotel Macao, Cotai Strip®, which is managed and operated by
FS Macau Lda., an affiliate of Four Seasons Hotels Limited
59
7. Glossary
“Galaxy” Galaxy Casino S.A. (also known as Galaxy Casino Company Limited), a company
incorporated in Macao on November 30, 2001 and one of the three Concessionaires
“gaming area(s)” a gaming facility that provides casino games consisting of table games operated in VIP
areas or mass market areas, electronic games, slot machines and other casino games but
has not been designated as a casino by the Macao Government
“Gaming Promoter(s)” individuals or corporations licensed by and registered with the Macao Government to
promote games of fortune and chance to patrons, through the arrangement of certain
services, including extension of credit (regulated by Law No. 5/2004), transportation,
accommodation, dining and entertainment, whose activity is regulated by Administrative
Regulation No. 6/2002
“GDP” gross domestic product
“Global Offering” the offer of Shares in the Company by subscription for cash at HK$10.38 on November
30, 2009 on and subject to the terms outlined in the Prospectus
“Group” our Company and its subsidiaries and, in respect of the period before our Company
became the holding company of such subsidiaries, the entities that carried on the business
of the present Group at the relevant time
“HIBOR” the Hong Kong Interbank Offered Rate
“HK$” or “HK dollars” Hong Kong dollars, the lawful currency of Hong Kong
“Hong Kong” the Hong Kong Special Administrative Region of the PRC
“IFRS” International Financial Reporting Standards
“integrated resort(s)” a resort which provides customers with a combination of hotel accommodations, casinos
or gaming areas, retail and dining facilities, MICE space, entertainment venues and spas
“Latest Practicable Date” August 31, 2012
“LIBOR” London Interbank Offered Rate
“Listing” the listing of the Shares on the Main Board on November 30, 2009
“Listing Date” November 30, 2009, the date on which dealings in the Shares first commenced on the
Main Board
60

7. Glossary
“Listing Rules” the Rules Governing the Listing of Securities on the Stock Exchange (as amended from
time to time)
“LVS” Las Vegas Sands Corp., a company incorporated in Nevada, U.S.A. in August 2004 and
the common stock of which is listed on the New York Stock Exchange
“LVS Group” LVS and its subsidiaries (excluding our Group)
“Macao” or “MSAR” the Macao Special Administrative Region of the PRC
“Macao Government” the local government of the MSAR, established on December 20, 1999 and the local
administration before this date
“Main Board” the stock exchange (excluding the option market) operated by the Stock Exchange which
is independent of and operated in parallel with the Growth Enterprise Market of the Stock
Exchange
“mass market player(s)” Non-Rolling Chip players
“Melco Crown” Melco Crown Jogos (Macau), S.A., a private company limited by shares (“sociedade
anónima”) incorporated on May 10, 2006 under the laws of Macao and one of the three
Subconcessionaires
“MGM Grand Paradise” MGM Grand Paradise, S.A. (also known as MGM Grand Paradise Limited), a private
company limited by shares (“sociedade anónima”) incorporated on June 17, 2004 under
the laws of Macao and one of the three Subconcessionaires
“MICE” Meetings, Incentives, Conventions and Exhibitions, an acronym commonly used to refer
to tourism involving large groups brought together for an event or corporate meeting
“MOP” or “pataca(s)” Macao pataca, the lawful currency of Macao
“Parcel 1” a land parcel in Cotai totaling 291,479 square meters described under Registration
No. 23225 by the Macau Property Registry, on which The Venetian Macao has been
constructed
“Parcel 2” a land parcel in Cotai totaling 53,700 square meters described under Registration No.
23223 by the Macau Property Registry, on which The Plaza Macao has been constructed
61

7. Glossary
“Parcel 3” a land parcel in Cotai totaling 60,479 square meters described under Registration No.
23224 by the Macau Property Registry, which is expected to contain an integrated resort
that will be connected to The Plaza Macao and the CotaiExpo center at The Venetian
Macao and contain hotel rooms, gaming areas, MICE facilities and other integrated resort
amenities
“Parcels 5 and 6” land parcels in Cotai totaling 150,134 square meters, including 44,576 square meters
designated as a tropical garden, described under Registration No. 23288 by the Macau
Property Registry, on which Sands Cotai Central has been constructed
“Parcels 7 and 8” land parcels in Cotai totaling 110,200 square meters adjacent to Sands Cotai Central. The
size of the land parcel may be subject to further surveyance
“premium player(s)” Rolling Chip players who have a direct relationship with gaming operators and typically
participate in gaming activities in casinos or gaming areas without the use of Gaming
Promoters
“Prospectus” our Listing prospectus dated November 16, 2009, which is available from our website at
www.sandschinaltd.com
“PwC” PricewaterhouseCoopers, the global professional services company
“Reporting Period” January 1, 2012 to June 30, 2012
“RMB” or “Renminbi” Renminbi, the lawful currency of China
“Rolling Chip play” play by VIP and premium players (excludes Paiza cash players) using non-negotiable chips
“Rolling Chip volume” casino revenue measurement, measured as the sum of all non-negotiable chips wagered
and lost by VIP and premium players (excludes Paiza cash players)
“Sands Cotai Central” Our integrated resort development on Parcels 5 and 6. Phase I opened on April 11, 2012
and features more than 600 rooms and suites under the Conrad hotel brand, more
than 1,200 rooms under the Holiday Inn hotel brand, along with significant gaming,
MICE, retail space and other integrated resort amenities. Phase IIA, which is scheduled
to open on September 20, 2012, will feature 1,829 Sheraton-branded hotel rooms
and suites, along with additional gaming area, retail, entertainment, dining and MICE
facilities. Phase IIB, which is projected to open in early 2013, will feature 2,067 additional
Sheraton-branded hotel rooms and suites. Phase III of the project is expected to include
a fourth luxury St. Regis-branded hotel and mixed-use tower. We intend to commence
construction of phase III of the project as demand and market conditions warrant it
62
7. Glossary
“Sands Macao” the Sands Macao, which includes gaming areas, a hotel tower, restaurants and a theater
“SFO” the Securities and Futures Ordinance of Hong Kong (Chapter 571 of the Laws of Hong
Kong) as amended, supplemented or otherwise modified from time to time
“Shared Services Agreement” the shared services agreement dated November 8, 2009 and renewed on December 21,
2011, entered into between LVS and our Company to regulate their relationship with
respect to the provision of certain shared services
“Share(s)” ordinary shares in our Company with a nominal value of US$0.01 each
“Shareholder(s)” holder(s) of Shares
“Share Option Scheme” the share option scheme conditionally adopted by our Company on November 8, 2009
“SJM” Sociedade de Jogos de Macau, S.A., a private company limited by shares (“sociedade
anónima”), incorporated on November 28, 2001 under the laws of Macao and one of the
three Concessionaires
“SOX” the United States federal law Sarbanes Oxley Act of 2002
“Stock Exchange” The Stock Exchange of Hong Kong Limited
“Subconcession” “Subconcession Contract” or the tripartite Subconcession Contract for the operation of casino games dated December
26, 2002 among Galaxy, the Macao Government and VML
“Subconcessionaire(s)” the holder(s) of a subconcession for the operation of casino games in the MSAR. As at the
Latest Practicable Date, the Subconcessionaires were VML (one of our subsidiaries), Melco
Crown and MGM Grand Paradise
“subsidiary(ies)” has the meaning ascribed to it under Section 2 of the Companies Ordinance
“table games” typical casino games, including card games such as baccarat, blackjack and hi-lo (also
known as “Sic bo”) as well as craps and roulette
“The Plaza Macao” an integrated resort which includes (i) the Four Seasons Hotel; (ii) the Plaza Casino gaming
area operated by VML; (iii) the Paiza Mansions, The Shoppes at Four Seasons, restaurants
and a spa, each of which are operated by us; and (iv) a luxury apart-hotel tower, which
is anticipated to be branded and serviced by Four Seasons; except where the context
indicates otherwise
63
7. Glossary
“The Venetian Macao” The Venetian® Macao-Resort-Hotel, an integrated resort that includes casino and gaming
areas, a hotel, MICE space, The Grand Canal Shoppes, over 50 different restaurants and
food outlets, a 15,000-seat arena and other entertainment venues
“United States,” “U.S.” the United States of America, including its territories and possessions and all areas subject
or “U.S.A.” to its jurisdiction
“US$” or “U.S. dollars” United States dollars, the lawful currency of the United States
“VIP player(s)” Rolling Chip players who play almost exclusively in dedicated VIP rooms or designated
casino or gaming areas and are sourced from Gaming Promoters
“VIP room(s)” rooms or designated areas within a casino or gaming area where VIP players and premium
players gamble
“visit(s)” or “visitation(s)” with respect to visitation of our properties, the number of times a property is entered
during a fixed time period. Estimates of the number of visits to our properties is based on
information collected from digital cameras placed above every entrance in our properties
which use video signal image processor detection and include repeat visitors to our
properties on a given day
“VML” our subsidiary, Venetian Macau, S.A. (also known as Venetian Macau Limited), a private
company limited by shares (“sociedade anónima”) incorporated on June 21, 2002
under the laws of Macao, one of the three Subconcessionaires and the holder of the
Subconcession
“VOL” Venetian Orient Limited, a wholly owned subsidiary of the Company and owner and
developer of Sands Cotai Central
“VVDIL” our subsidiary, Venetian Venture Development Intermediate Limited, a company
incorporated in the Cayman Islands on June 21, 2002 as an exempted company with
limited liability
“VVDI (II)” Venetian Venture Development Intermediate II, a company incorporated in the Cayman
Islands on January 23, 2003 as an exempted company with limited liability and an indirect,
wholly owned subsidiary of LVS and our immediate Controlling Shareholder
“Wynn Macau” Wynn Resorts (Macau) S.A., a private company limited by shares (“sociedade anónima”)
incorporated on October 17, 2001 under the laws of Macao and one of the three
Concessionaires
64