Exhibit 99.1
Exhibit 99.1
INTERIM REPORT2014
Sands Macao
May 2004
The Venetian Macao
August 2007
The Plaza Macao
August 2008
Sands Cotai Central
April 2012
The Parisian Macao
2015
Sands china Ltd.
(incorporated in the Cayman Islands with limited liability)
Stock Code: 1928
This interim report is printed on recycled paper using soy ink

FROM FABULOUS RESTAURANTS AND LUXURIOUS HOTEL SUITES TO WORLD-CLASS MICE AND ENTERTAINMENT, COME AND DISCOVER EVERYTHING
SANDS CHINA LTD.
CONTENTS
1. Overview 3
1.1 Financial Highlights 3
2. Management Discussion
5
and Analysis
2.1 Results of Operations 5
2.2 Liquidity and Capital Resources 11
2.3 Capital Expenditures 12
2.4 Capital Commitments 13
2.5 Dividends 13
2.6 Pledge of Fixed Assets 13
2.7 Contingent Liabilities and Risk Factors 14
2.8 Capital Risk Management 14
2.9 Foreign Exchange Risk 15
2.10 Business Review and Prospects 15
3. Corporate Governance 17
3.1 Human Resources 17
3.2 Environment 17
3.3 Corporate Governance Practices 19
3.4 Model Code for Securities Transactions 19
3.5 Board and Board Committees Composition 19
3.6 Disclosure of Directors’ Information pursuant to 21
Rule 13.51B(1) of the Listing Rules
3.7 Audit Committee Review 22
3.8 Interests of Directors and Chief Executives 22
3.9 Interests of Substantial Shareholders 24
3.10 Interests of Any Other Persons 24
3.11 Equity Award Plan 24
3.12 Purchase, Sale or Redemption of 27
the Company’s Listed Shares
4. Condensed Consolidated
28
Financial Statements
4.1 Report on Review of Condensed Consolidated 28
Financial Statements
4.2 Condensed Consolidated Financial Statements 29
4.3 Notes to the Condensed Consolidated 35
Financial Statements
5. Corporate Information 57
6. Contact Us 58
7. Glossary 59
This interim report is prepared in English and Chinese. In case of any inconsistency, please refer to the English version as it shall prevail.

OUR LUXURIOUS HOTEL ROOMS AND SUITES AWAIT YOU.
SANDS CHINA LTD. Interim Report 2014
1. OVERVIEW
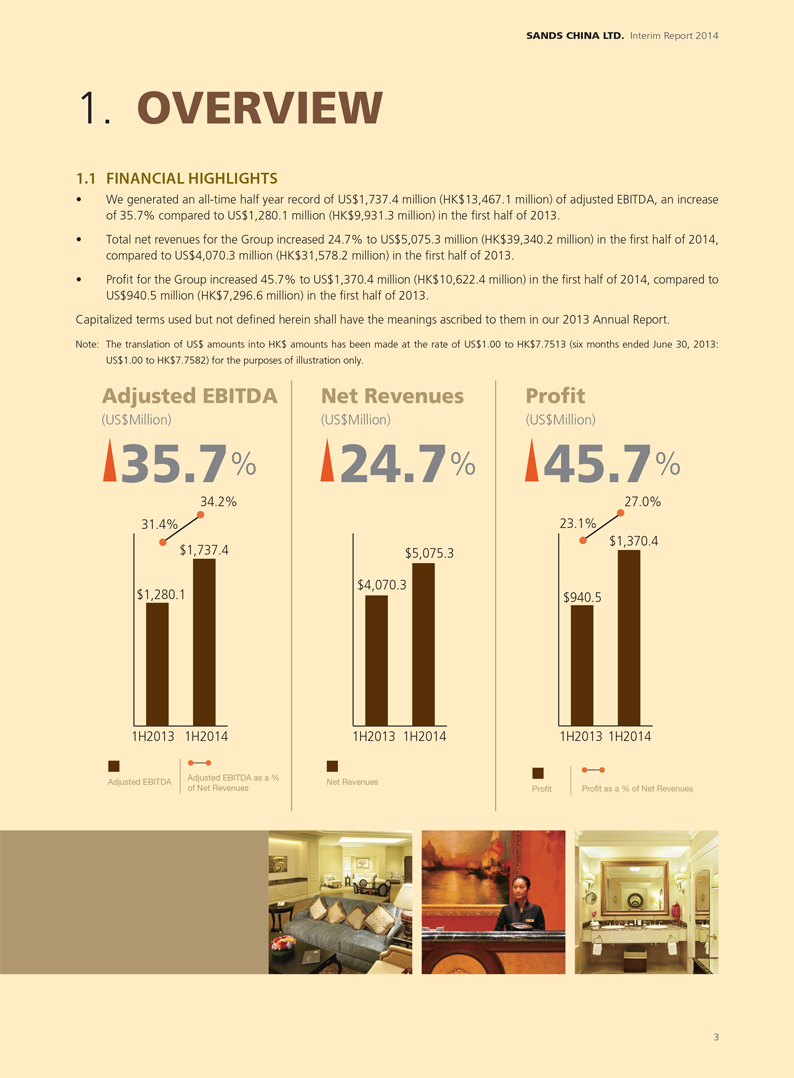
1.1 FINANCIAL HIGHLIGHTS
We generated an all-time half year record of US$1,737.4 million (HK$13,467.1 million) of adjusted EBITDA, an increase
of 35.7% compared to US$1,280.1 million (HK$9,931.3 million) in the first half of 2013.
Total net revenues for the Group increased 24.7% to US$5,075.3 million (HK$39,340.2 million) in the first half of 2014,
compared to US$4,070.3 million (HK$31,578.2 million) in the first half of 2013.
Profit for the Group increased 45.7% to US$1,370.4 million (HK$10,622.4 million) in the first half of 2014, compared to
US$940.5 million (HK$7,296.6 million) in the first half of 2013.
Capitalized terms used but not defined herein shall have the meanings ascribed to them in our 2013 Annual Report.
Note: The translation of US$ amounts into HK$ amounts has been made at the rate of US$1.00 to HK$7.7513 (six months ended June 30, 2013:
US$1.00 to HK$7.7582) for the purposes of illustration only.
Adjusted EBITDA
(US$Million)
35.7%
34.2% 31.4% $1,737.4
$1,280.1
1H2013 1H2014
Adjusted EBITDA
Adjusted EBITDA as a % of Net Revenues
Net Revenues
(US$Million)
24.7%
$5,075.3
$4,070.3
1H2013 1H2014
Net Revenues
Profit
(US$Million)
45.7%
27.0% 23.1% $1,370.4
$940.5
1H2013 1H2014
Profit
Profit as a % of Net Revenues
3
SOMETHING
SUMPTUOUS
TO SUIT EVERY TASTE.
SANDS CHINA LTD. Interim Report 2014
2. MANAGEMENT
DISCUSSION
AND ANALYSIS
2.1 RESULTS OF OPERATIONS
The Board of Directors (the “Board”) of Sands China Ltd. (“we” or our “Company”) is pleased to present the unaudited consolidated results of the Company and its subsidiaries (the “Group”) for the six months ended June 30, 2014 compared to the six months ended June 30, 2013.
Net Revenues
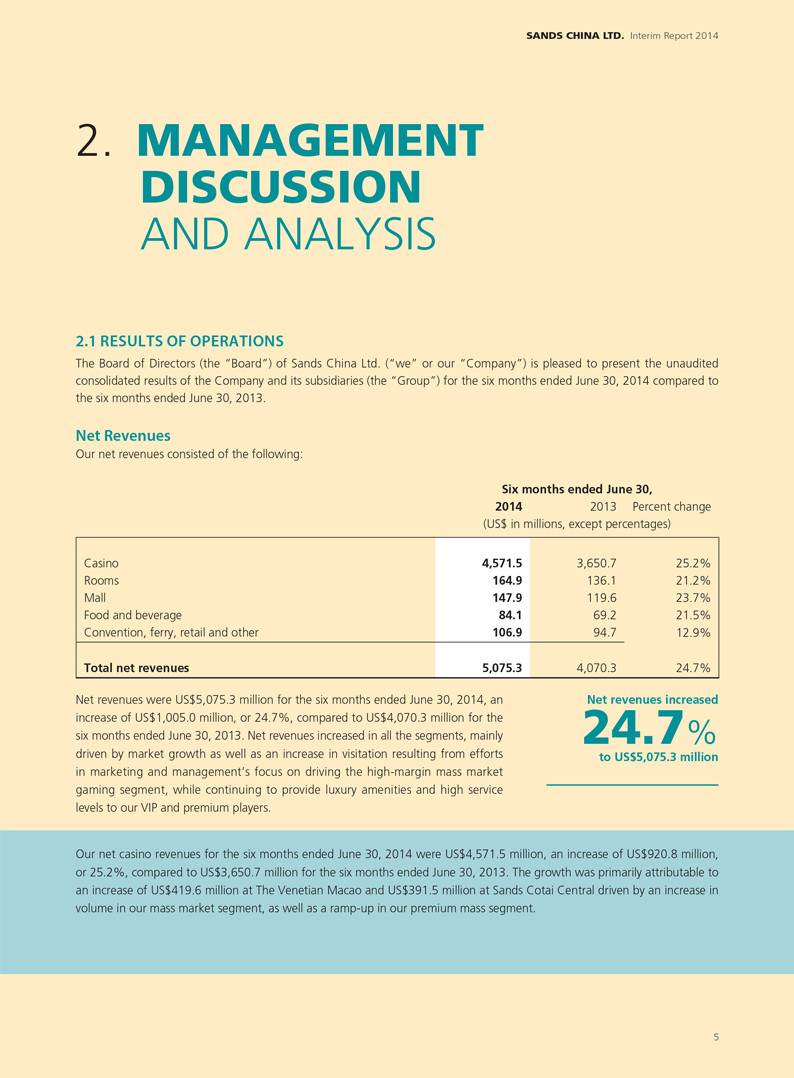
Our net revenues consisted of the following:
Casino Rooms Mall
Food and beverage
Convention, ferry, retail and other
Total net revenues
Six months ended June 30,
2014 2013 Percent change
(US$ in millions, except percentages)
4,571.5
164.9
147.9
84.1
106.9
5,075.3
3,650.7
136.1
119.6
69.2
94.7
4,070.3
25.2% 21.2% 23.7% 21.5% 12.9%
24.7%
Net revenues were US$5,075.3 million for the six months ended June 30, 2014, an increase of US$1,005.0 million, or 24.7%, compared to US$4,070.3 million for the six months ended June 30, 2013. Net revenues increased in all the segments, mainly driven by market growth as well as an increase in visitation resulting from efforts in marketing and management’s focus on driving the high-margin mass market gaming segment, while continuing to provide luxury amenities and high service levels to our VIP and premium players.
Net revenues increased
24.7%
to US$5,075.3 million
Our net casino revenues for the six months ended June 30, 2014 were US$4,571.5 million, an increase of US$920.8 million, or 25.2%, compared to US$3,650.7 million for the six months ended June 30, 2013. The growth was primarily attributable to an increase of US$419.6 million at The Venetian Macao and US$391.5 million at Sands Cotai Central driven by an increase in volume in our mass market segment, as well as a ramp-up in our premium mass segment.
5
2. MANAGEMENT DISCUSSION
AND ANALYSIS
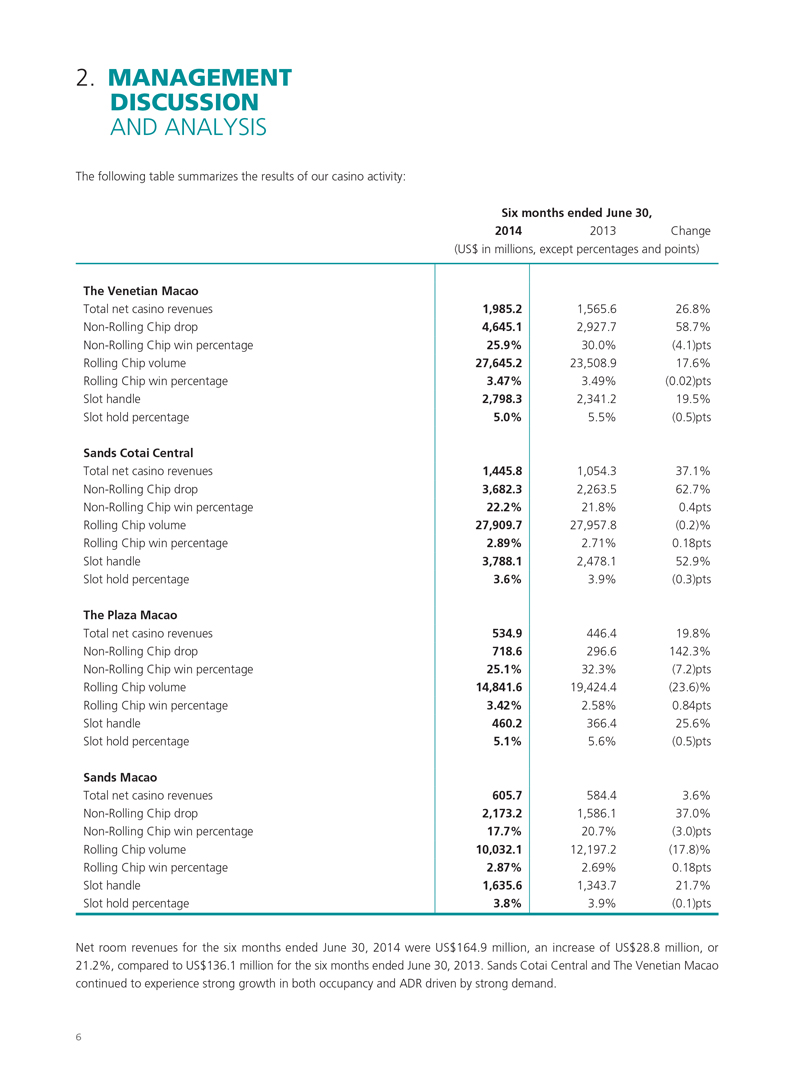
The following table summarizes the results of our casino activity:
Six months ended June 30,
2014 2013 Change
(US$ in millions, except percentages and points)
The Venetian Macao
Total net casino revenues
Non-Rolling Chip drop
Non-Rolling Chip win percentage
Rolling Chip volume
Rolling Chip win percentage
Slot handle
Slot hold percentage
Sands Cotai Central
Total net casino revenues
Non-Rolling Chip drop
Non-Rolling Chip win percentage
Rolling Chip volume
Rolling Chip win percentage
Slot handle
Slot hold percentage
The Plaza Macao
Total net casino revenues
Non-Rolling Chip drop
Non-Rolling Chip win percentage
Rolling Chip volume
Rolling Chip win percentage
Slot handle
Slot hold percentage
Sands Macao
Total net casino revenues
Non-Rolling Chip drop
Non-Rolling Chip win percentage
Rolling Chip volume
Rolling Chip win percentage
Slot handle
Slot hold percentage
1,985.2
4,645.1
25.9%
27,645.2
3.47%
2,798.3
5.0%
1,445.8
3,682.3
22.2%
27,909.7
2.89%
3,788.1
3.6%
534.9
718.6
25.1%
14,841.6
3.42%
460.2
5.1%
605.7
2,173.2
17.7%
10,032.1
2.87%
1,635.6
3.8%
1,565.6
2,927.7
30.0%
23,508.9
3.49%
2,341.2
5.5%
1,054.3
2,263.5
21.8%
27,957.8
2.71%
2,478.1
3.9%
446.4
296.6
32.3%
19,424.4
2.58%
366.4
5.6%
584.4
1,586.1
20.7%
12,197.2
2.69%
1,343.7
3.9%
26.8%
58.7%
(4.1)pts
17.6%
(0.02)pts
19.5%
(0.5)pts
37.1%
62.7%
0.4pts
(0.2)%
0.18pts
52.9%
(0.3)pts
19.8%
142.3%
(7.2)pts
(23.6)%
0.84pts
25.6%
(0.5)pts
3.6%
37.0%
(3.0)pts
(17.8)%
0.18pts
21.7%
(0.1)pts
Net room revenues for the six months ended June 30, 2014 were US$164.9 million, an increase of US$28.8 million, or 21.2%, compared to US$136.1 million for the six months ended June 30, 2013. Sands Cotai Central and The Venetian Macao continued to experience strong growth in both occupancy and ADR driven by strong demand.
6
SANDS CHINA LTD. Interim Report 2014
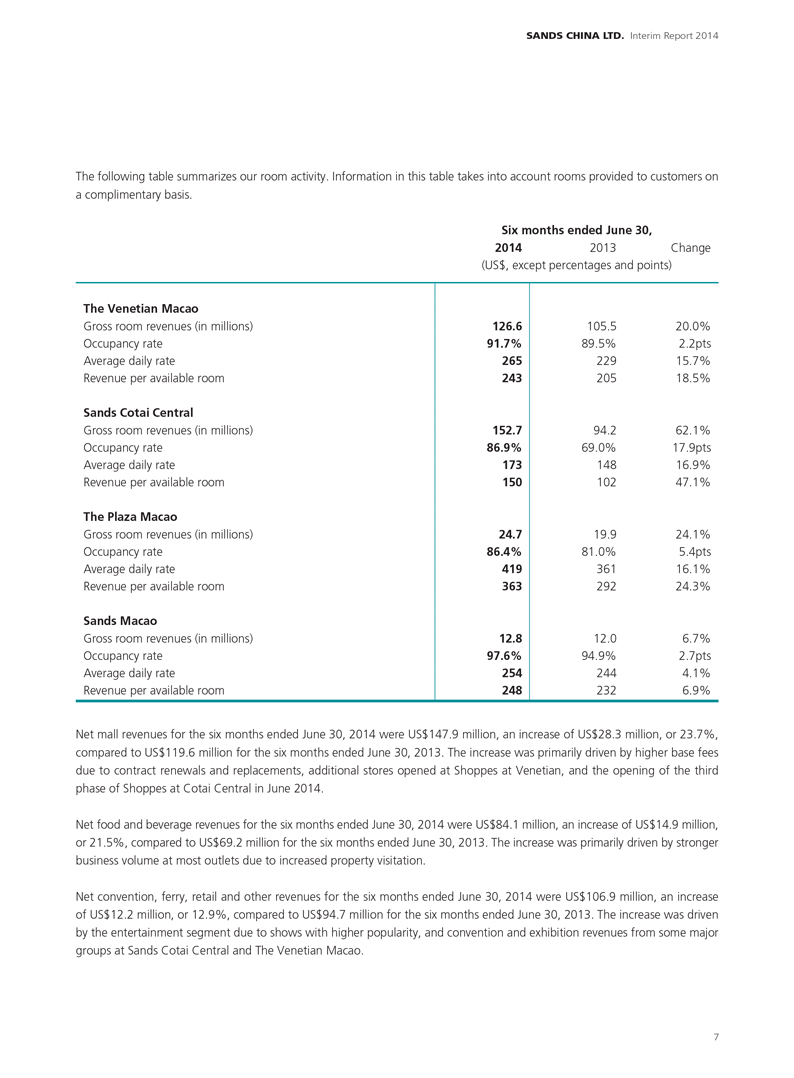
The following table summarizes our room activity. Information in this table takes into account rooms provided to customers on a complimentary basis.
Six months ended June 30,
2014 2013 Change
(US$, except percentages and points)
The Venetian Macao
Gross room revenues (in millions)
Occupancy rate
Average daily rate
Revenue per available room
Sands Cotai Central
Gross room revenues (in millions)
Occupancy rate
Average daily rate
Revenue per available room
The Plaza Macao
Gross room revenues (in millions)
Occupancy rate
Average daily rate
Revenue per available room
Sands Macao
Gross room revenues (in millions)
Occupancy rate
Average daily rate
Revenue per available room
126.6
91.7%
265
243
152.7
86.9%
173
150
24.7
86.4%
419
363
12.8
97.6%
254
248
105.5
89.5%
229
205
94.2
69.0%
148
102
19.9
81.0%
361
292
12.0
94.9%
244
232
20.0%
2.2pts
15.7%
18.5%
62.1%
17.9pts
16.9%
47.1%
24.1%
5.4pts
16.1%
24.3%
6.7%
2.7pts
4.1%
6.9%
Net mall revenues for the six months ended June 30, 2014 were US$147.9 million, an increase of US$28.3 million, or 23.7%, compared to US$119.6 million for the six months ended June 30, 2013. The increase was primarily driven by higher base fees due to contract renewals and replacements, additional stores opened at Shoppes at Venetian, and the opening of the third phase of Shoppes at Cotai Central in June 2014.
Net food and beverage revenues for the six months ended June 30, 2014 were US$84.1 million, an increase of US$14.9 million, or 21.5%, compared to US$69.2 million for the six months ended June 30, 2013. The increase was primarily driven by stronger business volume at most outlets due to increased property visitation.
Net convention, ferry, retail and other revenues for the six months ended June 30, 2014 were US$106.9 million, an increase of US$12.2 million, or 12.9%, compared to US$94.7 million for the six months ended June 30, 2013. The increase was driven by the entertainment segment due to shows with higher popularity, and convention and exhibition revenues from some major groups at Sands Cotai Central and The Venetian Macao.
7
2. MANAGEMENT
DISCUSSION
AND ANALYSIS
Operating Expenses
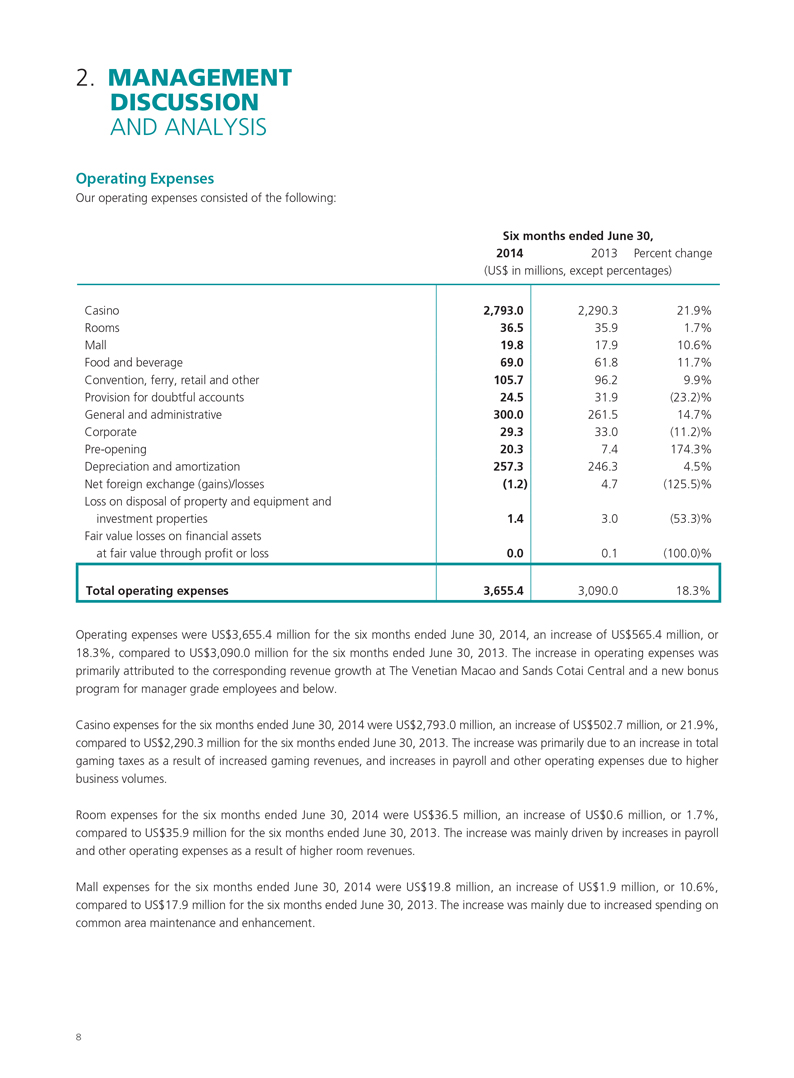
Our operating expenses consisted of the following:
Six months ended June 30,
2014 2013 Percent change
(US$ in millions, except percentages)
Casino
Rooms
Mall
Food and beverage
Convention, ferry, retail and other
Provision for doubtful accounts
General and administrative
Corporate
Pre-opening
Depreciation and amortization
Net foreign exchange (gains)/losses
Loss on disposal of property and equipment and
investment properties
Fair value losses on financial assets
at fair value through profit or loss
Total operating expenses
2,793.0
36.5
19.8
69.0
105.7
24.5
300.0
29.3
20.3
257.3
(1.2)
1.4
0.0
3,655.4
2,290.3
35.9
17.9
61.8
96.2
31.9
261.5
33.0
7.4
246.3
4.7
3.0
0.1
3,090.0
21.9%
1.7%
10.6%
11.7%
9.9%
(23.2)%
14.7%
(11.2)%
174.3%
4.5%
(125.5)%
(53.3)%
(100.0)%
18.3%
Operating expenses were US$3,655.4 million for the six months ended June 30, 2014, an increase of US$565.4 million, or 18.3%, compared to US$3,090.0 million for the six months ended June 30, 2013. The increase in operating expenses was primarily attributed to the corresponding revenue growth at The Venetian Macao and Sands Cotai Central and a new bonus program for manager grade employees and below.
Casino expenses for the six months ended June 30, 2014 were US$2,793.0 million, an increase of US$502.7 million, or 21.9%, compared to US$2,290.3 million for the six months ended June 30, 2013. The increase was primarily due to an increase in total gaming taxes as a result of increased gaming revenues, and increases in payroll and other operating expenses due to higher business volumes.
Room expenses for the six months ended June 30, 2014 were US$36.5 million, an increase of US$0.6 million, or 1.7%, compared to US$35.9 million for the six months ended June 30, 2013. The increase was mainly driven by increases in payroll and other operating expenses as a result of higher room revenues.
Mall expenses for the six months ended June 30, 2014 were US$19.8 million, an increase of US$1.9 million, or 10.6%, compared to US$17.9 million for the six months ended June 30, 2013. The increase was mainly due to increased spending on common area maintenance and enhancement.
8
SANDS CHINA LTD. Interim Report 2014
Food and beverage expenses for the six months ended June 30, 2014 were US$69.0 million, an increase of US$7.2 million, or 11.7%, compared to US$61.8 million for the six months ended June 30, 2013. The increase was primarily driven by increases in cost of sales and payroll expenses associated with the increased food and beverage revenues.
Convention, ferry, retail and other expenses for the six months ended June 30, 2014 were US$105.7 million, an increase of US$9.5 million, or 9.9%, compared to US$96.2 million for the six months ended June 30, 2013. The increase was primarily driven by an increase in contract entertainment expenses for hosting shows with higher popularity.
Provision for doubtful accounts expenses were US$24.5 million for the six months ended June 30, 2014, a decrease of US$7.4 million, or 23.2%, compared to US$31.9 million for the six months ended June 30, 2013. The decrease was mainly driven by credit control and the improvement of the overall casino receivables balance.
General and administrative expenses were US$300.0 million for the six months ended June 30, 2014, an increase of US$38.5 million, or 14.7%, compared to US$261.5 million for the six months ended June 30, 2013. The increase was mainly driven by increases in marketing expenses to promote the properties, and increases in payroll expenses to support business expansions.
Corporate expenses were US$29.3 million for the six months ended June 30, 2014, a decrease of US$3.7 million, or 11.2%, compared to US$33.0 million for the six months ended June 30, 2013. The decrease was mainly driven by a decrease in corporate legal expenses.
Pre-opening expenses were US$20.3 million for the six months ended June 30, 2014, an increase of US$12.9 million, or 174.3%, compared to US$7.4 million for the six months ended June 30, 2013. The increase was primarily driven by pre-opening expenses of The Parisian Macao.
Depreciation and amortization expense was US$257.3 million for the six months ended June 30, 2014, an increase of US$11.0 million, or 4.5%, compared to US$246.3 million for the six months ended June 30, 2013, driven by The Venetian Macao and Sands Cotai Central properties, partially offset by a decrease at the other properties due to some assets being fully depreciated.
9
2. MANAGEMENT
DISCUSSION
AND ANALYSIS
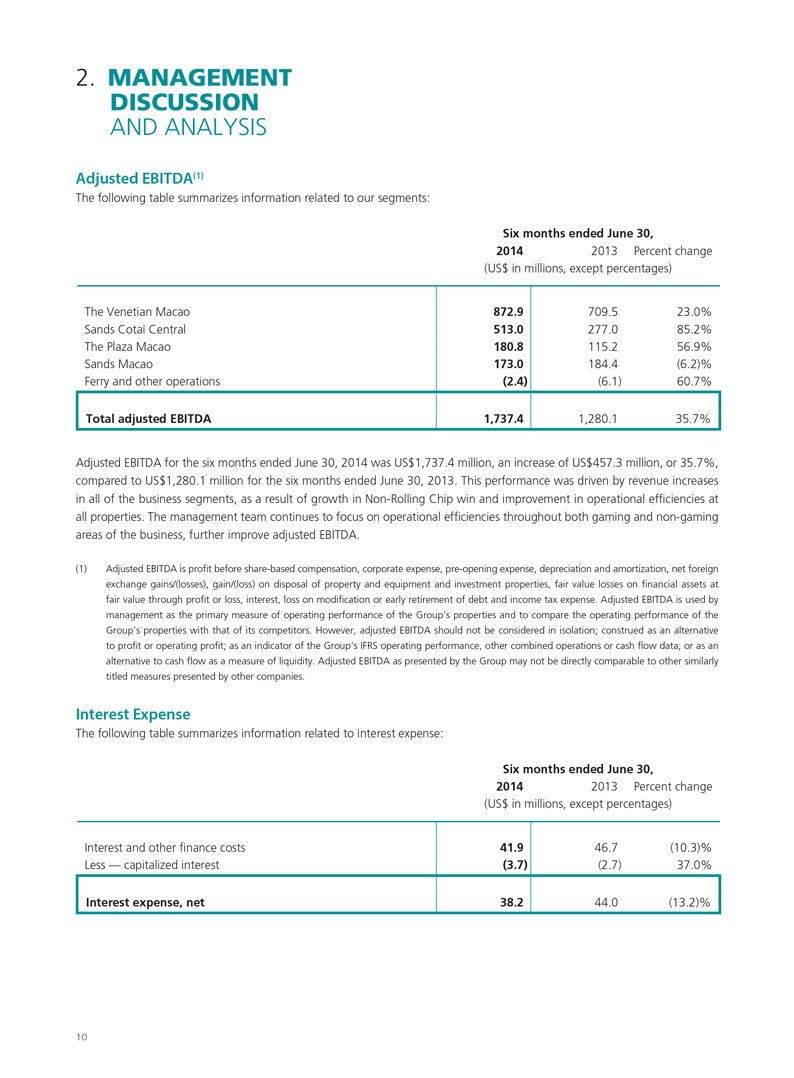
Adjusted EBITDA(1)
The following table summarizes information related to our segments:
Six months ended June 30,
2014 2013 Percent change
(US$ in millions, except percentages)
The Venetian Macao
Sands Cotai Central
The Plaza Macao
Sands Macao
Ferry and other operations
Total adjusted EBITDA
872.9
513.0
180.8
173.0
(2.4)
1,737.4
709.5
277.0
115.2
184.4
(6.1)
1,280.1
23.0%
85.2%
56.9%
(6.2)%
60.7%
35.7%
Adjusted EBITDA for the six months ended June 30, 2014 was US$1,737.4 million, an increase of US$457.3 million, or 35.7%, compared to US$1,280.1 million for the six months ended June 30, 2013. This performance was driven by revenue increases in all of the business segments, as a result of growth in Non-Rolling Chip win and improvement in operational efficiencies at all properties. The management team continues to focus on operational efficiencies throughout both gaming and non-gaming areas of the business, further improve adjusted EBITDA.
(1) Adjusted EBITDA is profit before share-based compensation, corporate expense, pre-opening expense, depreciation and amortization, net foreign exchange gains/(losses), gain/(loss) on disposal of property and equipment and investment properties, fair value losses on financial assets at fair value through profit or loss, interest, loss on modification or early retirement of debt and income tax expense. Adjusted EBITDA is used by management as the primary measure of operating performance of the Group’s properties and to compare the operating performance of the Group’s properties with that of its competitors. However, adjusted EBITDA should not be considered in isolation; construed as an alternative to profit or operating profit; as an indicator of the Group’s IFRS operating performance, other combined operations or cash flow data; or as an alternative to cash flow as a measure of liquidity. Adjusted EBITDA as presented by the Group may not be directly comparable to other similarly titled measures presented by other companies.
Interest Expense
The following table summarizes information related to interest expense:
Six months ended June 30,
2014 2013 Percent change
(US$ in millions, except percentages)
Interest and other finance costs
Less — capitalized interest
Interest expense, net
41.9
(3.7)
38.2
46.7
(2.7)
44.0
(10.3)%
37.0%
(13.2)%
10
SANDS CHINA LTD. Interim Report 2014
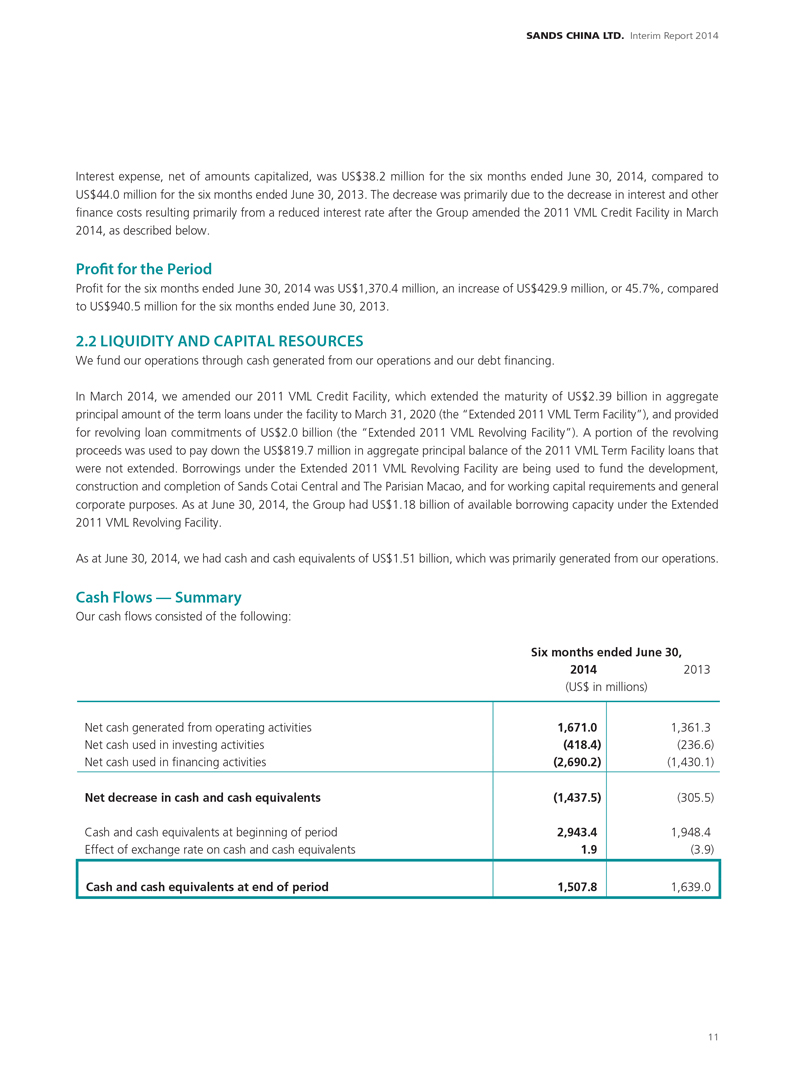
Interest expense, net of amounts capitalized, was US$38.2 million for the six months ended June 30, 2014, compared to US$44.0 million for the six months ended June 30, 2013. The decrease was primarily due to the decrease in interest and other finance costs resulting primarily from a reduced interest rate after the Group amended the 2011 VML Credit Facility in March 2014, as described below.
Profit for the Period
Profit for the six months ended June 30, 2014 was US$1,370.4 million, an increase of US$429.9 million, or 45.7%, compared to US$940.5 million for the six months ended June 30, 2013.
2.2 LIQUIDITY AND CAPITAL RESOURCES
We fund our operations through cash generated from our operations and our debt financing.
In March 2014, we amended our 2011 VML Credit Facility, which extended the maturity of US$2.39 billion in aggregate principal amount of the term loans under the facility to March 31, 2020 (the “Extended 2011 VML Term Facility”), and provided for revolving loan commitments of US$2.0 billion (the “Extended 2011 VML Revolving Facility”). A portion of the revolving proceeds was used to pay down the US$819.7 million in aggregate principal balance of the 2011 VML Term Facility loans that were not extended. Borrowings under the Extended 2011 VML Revolving Facility are being used to fund the development, construction and completion of Sands Cotai Central and The Parisian Macao, and for working capital requirements and general corporate purposes. As at June 30, 2014, the Group had US$1.18 billion of available borrowing capacity under the Extended 2011 VML Revolving Facility.
As at June 30, 2014, we had cash and cash equivalents of US$1.51 billion, which was primarily generated from our operations.
Cash Flows — Summary
Our cash flows consisted of the following:
Six months ended June 30,
2014 2013
(US$ in millions)
Net cash generated from operating activities
Net cash used in investing activities
Net cash used in financing activities
Net decrease in cash and cash equivalents
Cash and cash equivalents at beginning of period
Effect of exchange rate on cash and cash equivalents
Cash and cash equivalents at end of period
1,671.0
(418.4)
(2,690.2)
(1,437.5)
2,943.4
1.9
1,507.8
1,361.3
(236.6)
(1,430.1)
(305.5)
1,948.4
(3.9)
1,639.0
11
2. MANAGEMENT DISCUSSION
AND ANALYSIS
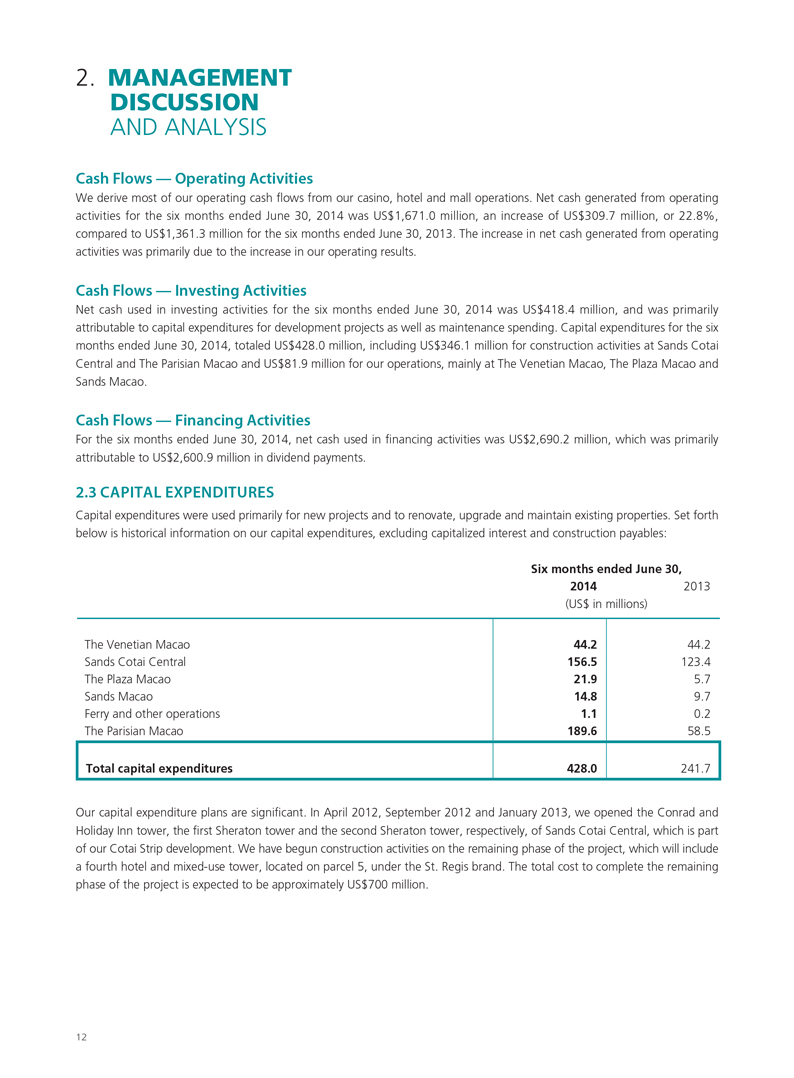
Cash Flows — Operating Activities
We derive most of our operating cash flows from our casino, hotel and mall operations. Net cash generated from operating activities for the six months ended June 30, 2014 was US$1,671.0 million, an increase of US$309.7 million, or 22.8%, compared to US$1,361.3 million for the six months ended June 30, 2013. The increase in net cash generated from operating activities was primarily due to the increase in our operating results.
Cash Flows — Investing Activities
Net cash used in investing activities for the six months ended June 30, 2014 was US$418.4 million, and was primarily attributable to capital expenditures for development projects as well as maintenance spending. Capital expenditures for the six months ended June 30, 2014, totaled US$428.0 million, including US$346.1 million for construction activities at Sands Cotai Central and The Parisian Macao and US$81.9 million for our operations, mainly at The Venetian Macao, The Plaza Macao and Sands Macao.
Cash Flows — Financing Activities
For the six months ended June 30, 2014, net cash used in financing activities was US$2,690.2 million, which was primarily attributable to US$2,600.9 million in dividend payments.
2.3 CAPITAL EXPENDITURES
Capital expenditures were used primarily for new projects and to renovate, upgrade and maintain existing properties. Set forth below is historical information on our capital expenditures, excluding capitalized interest and construction payables:
Six months ended June 30,
2014 2013
(US$ in millions)
The Venetian Macao
Sands Cotai Central
The Plaza Macao
Sands Macao
Ferry and other operations
The Parisian Macao
Total capital expenditures
44.2
156.5
21.9
14.8
1.1
189.6
428.0
44.2
123.4
5.7
9.7
0.2
58.5
241.7
Our capital expenditure plans are significant. In April 2012, September 2012 and January 2013, we opened the Conrad and Holiday Inn tower, the first Sheraton tower and the second Sheraton tower, respectively, of Sands Cotai Central, which is part of our Cotai Strip development. We have begun construction activities on the remaining phase of the project, which will include a fourth hotel and mixed-use tower, located on parcel 5, under the St. Regis brand. The total cost to complete the remaining phase of the project is expected to be approximately US$700 million.
12
SANDS CHINA LTD. Interim Report 2014
We have commenced construction activities on The Parisian Macao, our integrated resort development on Parcel 3, but stopped
in June 2014, pending receipt of certain government approvals, which management has been informed are scheduled to be
issued in October 2014. In the meantime, the Company is working to accelerate the permit approval process and, as with
projects of this nature, will continue to analyze options for both a full and phased opening of the facility in 2015. We have
capitalized costs of US$595.9 million, including land, as at June 30, 2014. The Parisian Macao is targeted to open in late 2015
and we expect the cost to design, develop and construct The Parisian Macao will be approximately US$2.7 billion, inclusive of
land premium payments.
These investment plans are preliminary and subject to change based upon the execution of our business plan, the progress of
our capital projects, market conditions and the outlook on future business conditions.
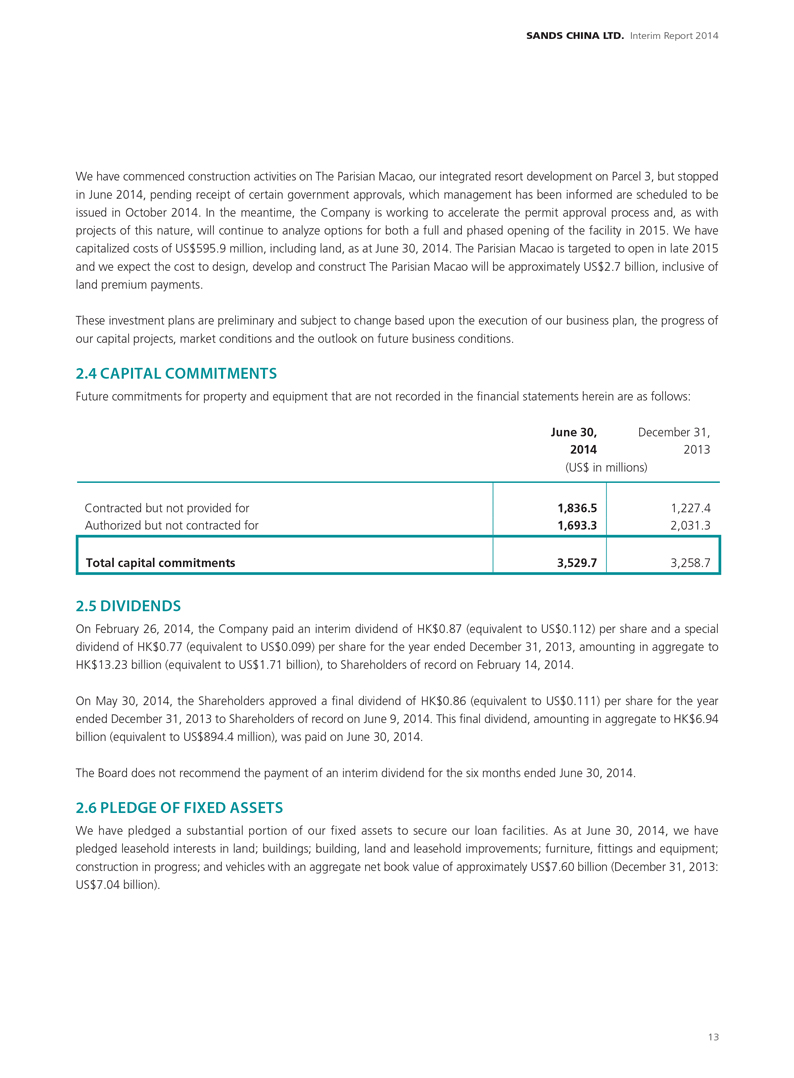
2.4 CAPITAL COMMITMENTS
Future commitments for property and equipment that are not recorded in the financial statements herein are as follows:
June 30,
December 31,
2014 2013
(US$ in millions)
Contracted but not provided for
Authorized but not contracted for
Total capital commitments
1,836.5
1,693.3
3,529.7
1,227.4
2,031.3
3,258.7
2.5 DIVIDENDS
On February 26, 2014, the Company paid an interim dividend of HK$0.87 (equivalent to US$0.112) per share and a special dividend of HK$0.77 (equivalent to US$0.099) per share for the year ended December 31, 2013, amounting in aggregate to HK$13.23 billion (equivalent to US$1.71 billion), to Shareholders of record on February 14, 2014.
On May 30, 2014, the Shareholders approved a final dividend of HK$0.86 (equivalent to US$0.111) per share for the year ended December 31, 2013 to Shareholders of record on June 9, 2014. This final dividend, amounting in aggregate to HK$6.94 billion (equivalent to US$894.4 million), was paid on June 30, 2014.
The Board does not recommend the payment of an interim dividend for the six months ended June 30, 2014.
2.6 PLEDGE OF FIXED ASSETS
We have pledged a substantial portion of our fixed assets to secure our loan facilities. As at June 30, 2014, we have pledged leasehold interests in land; buildings; building, land and leasehold improvements; furniture, fittings and equipment; construction in progress; and vehicles with an aggregate net book value of approximately US$7.60 billion (December 31, 2013: US$7.04 billion).
13
2. MANAGEMENT
DISCUSSION
AND ANALYSIS
2.7 CONTINGENT LIABILITIES AND RISK FACTORS
The Group has contingent liabilities arising in the ordinary course of business. Management has made estimates for potential
litigation costs based upon consultation with legal counsel. Actual results could differ from these estimates; however, in the
opinion of management, such litigation and claims will not have a material adverse effect on our financial condition, results of
operations or cash flows.
Under the land concession for The Parisian Macao, we are required to complete the development by April 2016. The land
concession for Sands Cotai Central contains a similar requirement, which was extended by the Macao Government in April
2014, that the development be completed by December 2016. Should we determine that we are unable to complete The
Parisian Macao or Sands Cotai Central by their respective deadlines, we would expect to apply for another extension from the
Macao Government. If we are unable to meet the current deadlines and the deadlines for either development are not extended,
we could lose our land concessions for The Parisian Macao or Sands Cotai Central, which would prohibit us from operating any
facilities developed under the respective land concessions. As a result, the Group could record a charge for all or some portion
of the US$595.9 million or US$4.37 billion in capitalized construction costs including land, as at June 30, 2014, related to The
Parisian Macao and Sands Cotai Central, respectively.
2.8 CAPITAL RISK MANAGEMENT
The Group’s primary objective when managing capital is to safeguard the Group’s ability to continue as a going concern in
order to provide returns for Shareholders and benefits for other stakeholders, by pricing products and services commensurately
with the level of risk.
The capital structure of the Group consists of debt, which includes borrowings (including current and non-current borrowings
as shown in note 15 to the condensed consolidated financial statements), cash and cash equivalents, and equity attributable to
Shareholders, comprising issued share capital and reserves.
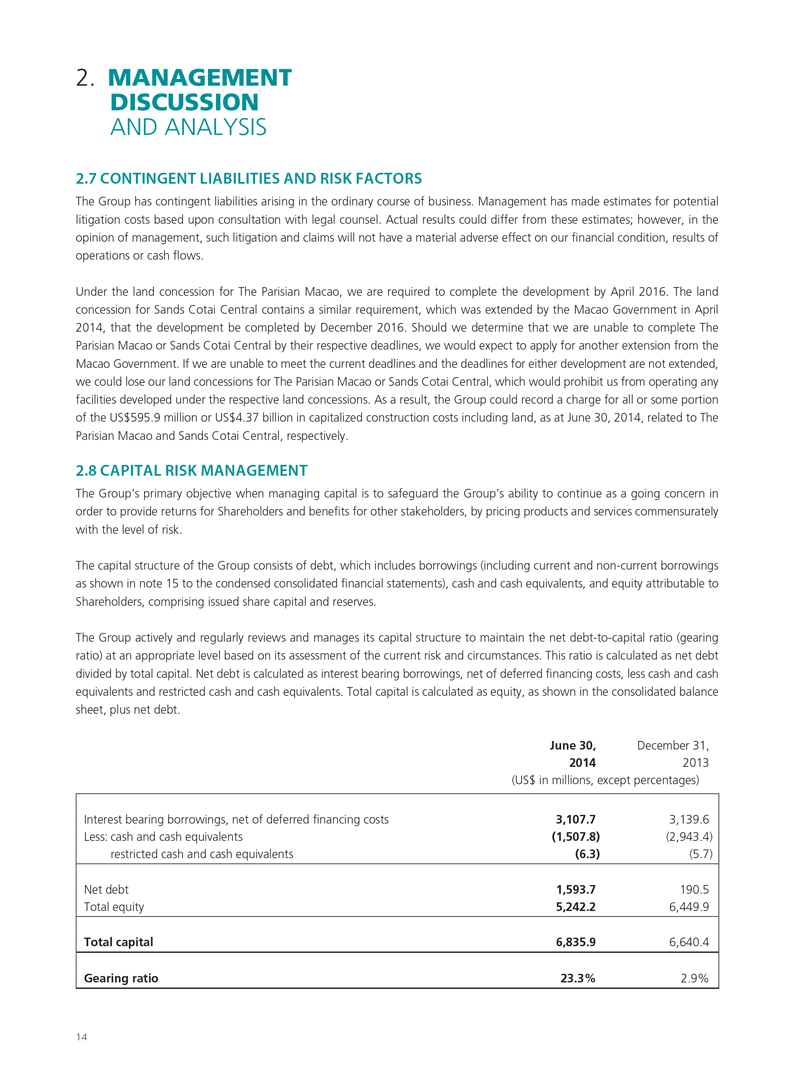
The Group actively and regularly reviews and manages its capital structure to maintain the net debt-to-capital ratio (gearing
ratio) at an appropriate level based on its assessment of the current risk and circumstances. This ratio is calculated as net debt
divided by total capital. Net debt is calculated as interest bearing borrowings, net of deferred financing costs, less cash and cash
equivalents and restricted cash and cash equivalents. Total capital is calculated as equity, as shown in the consolidated balance
sheet, plus net debt.
June 30,
December 31,
2014
2013
(US$ in millions, except percentages)
Interest bearing borrowings, net of deferred financing costs
Less: cash and cash equivalents
restricted cash and cash equivalents
Net debt
Total equity
Total capital
Gearing ratio
3,107.7
(1,507.8)
(6.3)
1,593.7
5,242.2
6,835.9
23.3%
3,139.6
(2,943.4)
(5.7)
190.5
6,449.9
6,640.4
2.9%
14
SANDS CHINA LTD. Interim Report 2014
The increase in the gearing ratio during the six months ended June 30, 2014 was primarily due to dividend payments of US$2.60 billion.
2.9 FOREIGN EXCHANGE RISK
The Group’s foreign currency transactions are mainly denominated in US$. The majority of assets and liabilities are denominated in US$, HK$ and MOP. The Group is subject to foreign exchange rate risk arising from future commercial transactions and recognized assets and liabilities that are denominated in a currency other than MOP, which is the functional currency of major operating companies within the Group. The Group currently does not have a foreign currency hedging policy.
2.10 BUSINESS REVIEW AND PROSPECTS
Our business strategy is to continue to successfully execute our Cotai Strip developments and to leverage our integrated resort business model to create Asia’s premier gaming, leisure and convention destination. The Company continues to execute on the strategies outlined in our 2013 Annual Report. These strategies have proven to be successful in the first half of 2014 and we are confident they will continue to be successful into the future.
Sands Cotai Central
Sands Cotai Central is located across the street from The Venetian Macao and The Plaza Macao. It is our largest integrated resort on Cotai. Sands Cotai Central consists of three hotel towers including 636 five-star rooms and suites under the Conrad brand, 1,224 four-star rooms and suites under the Holiday Inn brand and 3,863 rooms and suites under the Sheraton brand. In April 2012, we opened the Conrad and Holiday Inn tower, a variety of retail offerings, approximately 350,000 square feet of meeting space, several food and beverage establishments, along with the Himalaya casino and VIP gaming areas. In September 2012, we opened the first Sheraton tower featuring 1,796 rooms and suites, the Pacifica casino and additional retail, entertainment, dining and meeting facilities. In January 2013, we opened the second Sheraton tower featuring an additional 2,067 rooms and suites.
We have begun construction activities on the remaining phase of the project, which will include a fourth hotel and mixed-use tower, located on parcel 5, under the St. Regis brand. The total cost to complete the remaining phase of the project is expected to be approximately US$700 million.
The Parisian Macao
The Parisian Macao, which is currently expected to open in late 2015, is intended to include a gaming area (to be operated under our gaming subconcession), a hotel with over 3,000 rooms and suites and retail, entertainment, dining and meeting facilities. We expect the cost to design, develop and construct The Parisian Macao to be approximately US$2.7 billion, inclusive of land premium payments. We have commenced construction activities, but stopped in June 2014, pending receipt of certain government approvals, which management has been informed are scheduled to be issued in October 2014. In the meantime, the Company is working to accelerate the permit approval process and, as with projects of this nature, will continue to analyze options for both a full and phased opening of the facility in 2015. We have capitalized construction costs of US$595.9 million for The Parisian Macao, including land, as at June 30, 2014.
15

BE IMMERSED IN
LUXURY DUTY FREE SHOPPING.
SANDS CHINA LTD. Interim Report 2014
3. CORPORATE
GOVERNANCE
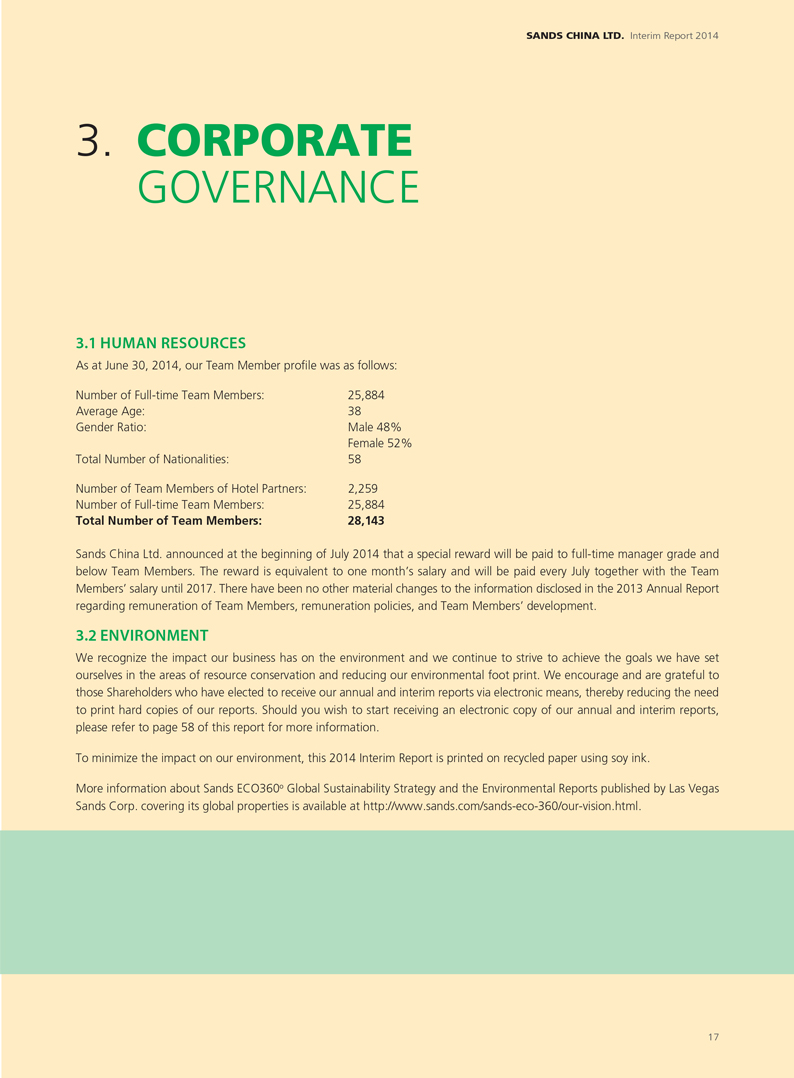
3.1 HUMAN RESOURCES
As at June 30, 2014, our Team Member profile was as follows:
Number of Full-time Team Members: Average Age: Gender Ratio:
Total Number of Nationalities:
Number of Team Members of Hotel Partners: Number of Full-time Team Members:
Total Number of Team Members:
25,884
38
Male 48%
Female 52%
58
2,259
25,884
28,143
Sands China Ltd. announced at the beginning of July 2014 that a special reward will be paid to full-time manager grade and below Team Members. The reward is equivalent to one month’s salary and will be paid every July together with the Team Members’ salary until 2017. There have been no other material changes to the information disclosed in the 2013 Annual Report regarding remuneration of Team Members, remuneration policies, and Team Members’ development.
3.2 ENVIRONMENT
We recognize the impact our business has on the environment and we continue to strive to achieve the goals we have set ourselves in the areas of resource conservation and reducing our environmental foot print. We encourage and are grateful to those Shareholders who have elected to receive our annual and interim reports via electronic means, thereby reducing the need to print hard copies of our reports. Should you wish to start receiving an electronic copy of our annual and interim reports, please refer to page 58 of this report for more information.
To minimize the impact on our environment, this 2014 Interim Report is printed on recycled paper using soy ink.
More information about Sands ECO360o Global Sustainability Strategy and the Environmental Reports published by Las Vegas Sands Corp. covering its global properties is available at http://www.sands.com/sands-eco-360/our-vision.html.
17

The Environmentally Responsible
Choice for green meetings worldwide
17.5M
kWh of Energy was saved by installing LED and other energy efficient lights, and through optimization of cooling and hearing systems
37
The number of Olymic-sized swimming pools of water were saved in 2013 through water flow controllers, low-flow shower heads and an automatic irrigation system
GREEN HOTEL AWARDS
The Venetian Macao received a Macao Green Hotel Gold Award in 2012 and the Green IIFA Award
Sands Macao received a Macao Green Hotel Silver Award in 2012
Conrad Macao has received awards for World’s Leading Green Hotel, Asia’s Leading Green Hotel and Best Green Hotel
100 Number of recycling points at the Sands China facilities are used for collection and separation of recyclable materials. Glass recycling, a food waste digester and wood chipping facilitates improved waste diversion
EURO V & EURO IV
Emission standards were followed for the shuttle buses in order to reduce air pollution. An electric Bus was tried as a Team Member Shuttle in Nov and Dec 2013
CONTRIBUTION TO COMMUNITY
59 Community activities including 9 green action events in 2013
Sands China Green Fund supported 6 green action activities in 2013 held by Macau Ecological Society
Sands China Green Fund granted scholarships to 6 students in the 2012-2013 academic year
85%
Portion of our suite lighting and other operational areas that use the latest LED and other energy saving technologies
EARTH HOUR
Earth Hour Every Month implemented at Sands China properties
15 hotels in Macao have taken our ‘l Will if You Will Challenge’ to join Earth Hour Every Month
EarthCheck
The Venetian Macao received a Bronze Benchmarked certification in 2014
SANDS CHINA LTD. Interim Report 2014
3.3 CORPORATE GOVERNANCE PRACTICES
Good corporate governance underpins the creation of Shareholder value and maintaining the highest standards of corporate governance is a core responsibility of the Board. An effective system of corporate governance requires that our Board approves strategic direction, monitors performance, oversees effective risk management and leads the creation of the right culture across the organization. It also gives our investors confidence that we are exercising our stewardship responsibilities with due skill and care.
To ensure that we adhere to high standards of corporate governance, we have developed our own corporate governance principles and guidelines that set out how corporate governance operates in practice within the Company. This is based on the policies, principles and practices set out in the Corporate Governance Code (the “Code”) contained in Appendix 14 of the Listing Rules and draws on other best practices.
The Board is of the view that throughout the six months ended June 30, 2014, save as disclosed below, the Company fully complied with all the code provisions and certain recommended best practices set out in the Code.
Code Provision E.1.2
Under code provision E.1.2 of the Code, the Chairman of the Board should attend the annual general meeting of the Company. The Chairman of the Board was absent from the Company’s annual general meeting held on May 30, 2014 due to other business commitments.
3.4 MODEL CODE FOR SECURITIES TRANSACTIONS
The Company has developed its own securities trading code for securities transactions (the “Company Code”) by the Directors and relevant employees who are likely to be in possession of unpublished inside information of the Company on terms no less exacting than the Model Code for Securities Transactions by Directors of Listed Issuers as set out in Appendix 10 of the Listing Rules (the “Model Code”). Following specific enquiry by the Company, all Directors have confirmed that they have complied with the Company Code and, therefore, with the Model Code throughout the six months ended June 30, 2014 and to the date of this Interim Report.
3.5 BOARD AND BOARD COMMITTEES COMPOSITION
Mr. Jeffrey Howard Schwartz resigned as a Non-Executive Director of the Company with effect from May 30, 2014. Mr. Irwin Abe Siegel and Mr. Lau Wong William did not offer themselves for re-election as Non-Executive Directors of the Company at the annual general meeting of the Company on May 30, 2014.
Mr. Charles Daniel Forman and Mr. Robert Glen Goldstein were elected as Non-Executive Directors of the Company at the annual general meeting held on May 30, 2014.
19
3. CORPORATE
GOVERNANCE
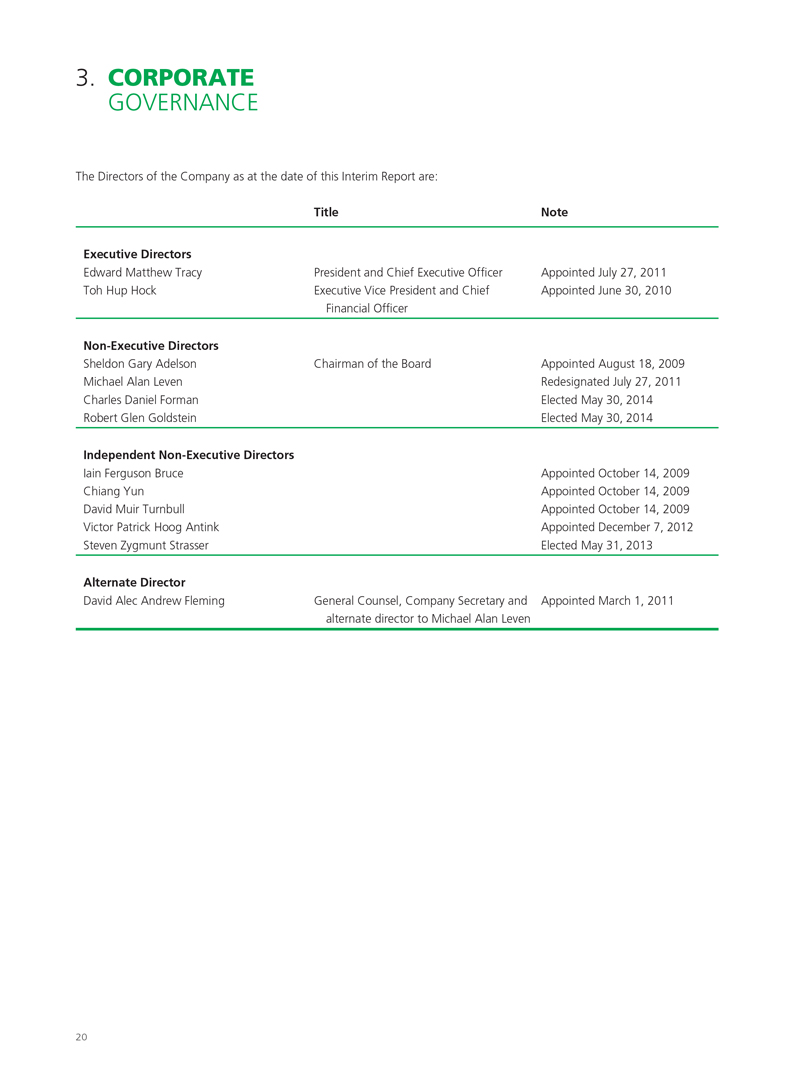
The Directors of the Company as at the date of this Interim Report are:
Executive Directors
Edward Matthew Tracy
Toh Hup Hock
Non-Executive Directors
Sheldon Gary Adelson
Michael Alan Leven
Charles Daniel Forman
Robert Glen Goldstein
Independent Non-Executive Directors
Iain Ferguson Bruce
Chiang Yun
David Muir Turnbull
Victor Patrick Hoog Antink
Steven Zygmunt Strasser
Alternate Director
David Alec Andrew Fleming
Title
President and Chief Executive Officer
Executive Vice President and Chief
Financial Officer
Chairman of the Board
General Counsel, Company Secretary and
alternate director to Michael Alan Leven
Note
Appointed July 27, 2011
Appointed June 30, 2010
Appointed August 18, 2009
Redesignated July 27, 2011
Elected May 30, 2014
Elected May 30, 2014
Appointed October 14, 2009
Appointed October 14, 2009
Appointed October 14, 2009
Appointed December 7, 2012
Elected May 31, 2013
Appointed March 1, 2011
20
SANDS CHINA LTD. Interim Report 2014
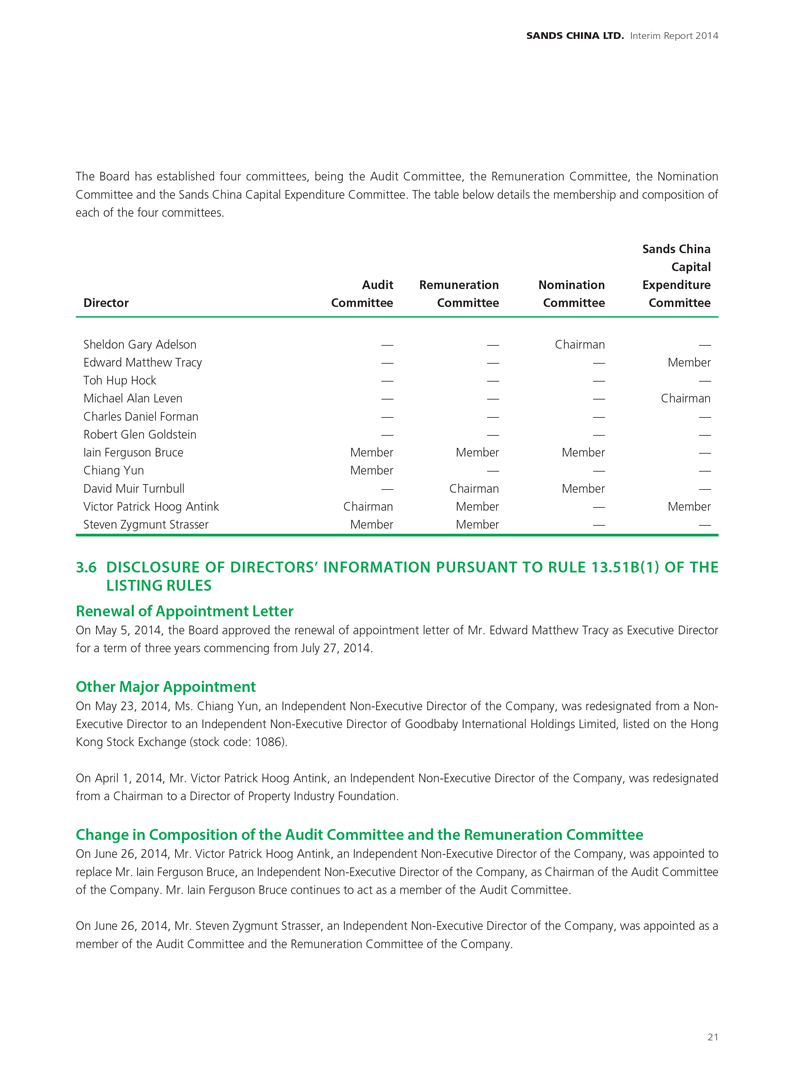
The Board has established four committees, being the Audit Committee, the Remuneration Committee, the Nomination Committee and the Sands China Capital Expenditure Committee. The table below details the membership and composition of each of the four committees.
Director
Sheldon Gary Adelson
Edward Matthew Tracy
Toh Hup Hock
Michael Alan Leven
Charles Daniel Forman
Robert Glen Goldstein
Iain Ferguson Bruce
Chiang Yun
David Muir Turnbull
Victor Patrick Hoog Antink
Steven Zygmunt Strasser
Audit
Committee
—
—
—
—
—
—
Member
Member
—
Chairman
Member
Remuneration
Committee
—
—
—
—
—
—
Member
—
Chairman
Member
Member
Nomination
Committee
Chairman
—
—
—
—
—
Member
—
Member
—
—
Sands China
Capital
Expenditure
Committee
—
Member
—
Chairman
—
—
—
—
—
Member
—
3.6 DISCLOSURE OF DIRECTORS’ INFORMATION PURSUANT TO RULE 13.51B(1) OF THE LISTING RULES
Renewal of Appointment Letter
On May 5, 2014, the Board approved the renewal of appointment letter of Mr. Edward Matthew Tracy as Executive Director for a term of three years commencing from July 27, 2014.
Other Major Appointment
On May 23, 2014, Ms. Chiang Yun, an Independent Non-Executive Director of the Company, was redesignated from a Non-Executive Director to an Independent Non-Executive Director of Goodbaby International Holdings Limited, listed on the Hong Kong Stock Exchange (stock code: 1086).
On April 1, 2014, Mr. Victor Patrick Hoog Antink, an Independent Non-Executive Director of the Company, was redesignated from a Chairman to a Director of Property Industry Foundation.
Change in Composition of the Audit Committee and the Remuneration Committee
On June 26, 2014, Mr. Victor Patrick Hoog Antink, an Independent Non-Executive Director of the Company, was appointed to replace Mr. Iain Ferguson Bruce, an Independent Non-Executive Director of the Company, as Chairman of the Audit Committee of the Company. Mr. Iain Ferguson Bruce continues to act as a member of the Audit Committee.
On June 26, 2014, Mr. Steven Zygmunt Strasser, an Independent Non-Executive Director of the Company, was appointed as a member of the Audit Committee and the Remuneration Committee of the Company.
21
3. CORPORATE
GOVERNANCE
3.7 AUDIT COMMITTEE REVIEW
The Audit Committee has reviewed the accounting policies adopted by the Group and the unaudited condensed consolidated financial statements for the six months ended June 30, 2014. All of the Audit Committee members are Independent Non-Executive Directors, with Mr. Victor Patrick Hoog Antink (Chairman of the Audit Committee) and Mr. Iain Ferguson Bruce possessing the appropriate professional qualifications and accounting and related financial management expertise.
3.8 INTERESTS OF DIRECTORS AND CHIEF EXECUTIVES
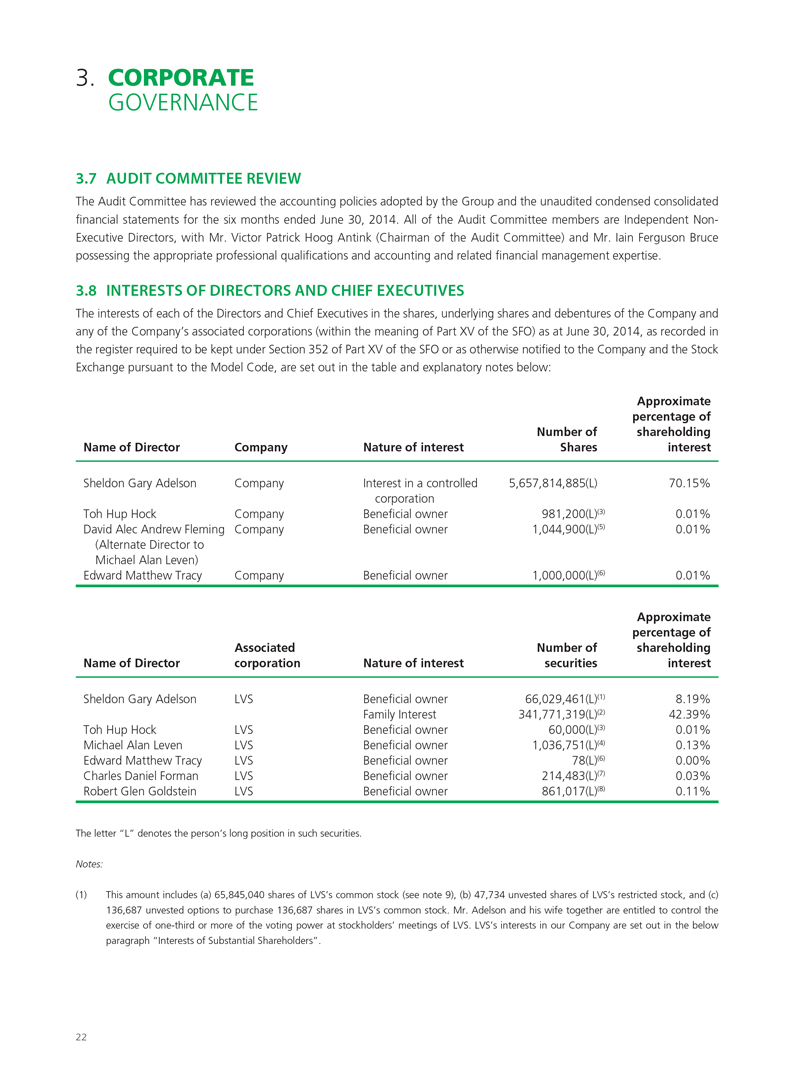
The interests of each of the Directors and Chief Executives in the shares, underlying shares and debentures of the Company and any of the Company’s associated corporations (within the meaning of Part XV of the SFO) as at June 30, 2014, as recorded in the register required to be kept under Section 352 of Part XV of the SFO or as otherwise notified to the Company and the Stock Exchange pursuant to the Model Code, are set out in the table and explanatory notes below:
Name of Director
Sheldon Gary Adelson
Toh Hup Hock
David Alec Andrew Fleming
(Alternate Director to
Michael Alan Leven)
Edward Matthew Tracy
Company
Company
Company
Company
Company
Nature of interest
Interest in a controlled
corporation
Beneficial owner
Beneficial owner
Beneficial owner
Number of
Shares
5,657,814,885(L)
981,200(L)(3)
1,044,900(L)(5)
1,000,000(L)(6)
Approximate
percentage of
shareholding
interest
70.15%
0.01%
0.01%
0.01%
Name of Director
Sheldon Gary Adelson
Toh Hup Hock
Michael Alan Leven
Edward Matthew Tracy
Charles Daniel Forman
Robert Glen Goldstein
Associated
corporation
LVS
LVS
LVS
LVS
LVS
LVS
Nature of interest
Bene?cial owner
Family Interest
Bene?cial owner
Bene?cial owner
Bene?cial owner
Bene?cial owner
Bene?cial owner
Number of
securities
66,029,461(L)(1)
341,771,319(L)(2)
60,000(L)(3)
1,036,751(L)(4)
78(L)(6)
214,483(L)(7)
861,017(L)(8)
Approximate
percentage of
shareholding
interest
8.19%
42.39%
0.01%
0.13%
0.00%
0.03%
0.11%
The letter “L” denotes the person’s long position in such securities.
Notes:
(1) This amount includes (a) 65,845,040 shares of LVS’s common stock (see note 9), (b) 47,734 unvested shares of LVS’s restricted stock, and (c) 136,687 unvested options to purchase 136,687 shares in LVS’s common stock. Mr. Adelson and his wife together are entitled to control the exercise of one-third or more of the voting power at stockholders’ meetings of LVS. LVS’s interests in our Company are set out in the below paragraph “Interests of Substantial Shareholders”.
22
SANDS CHINA LTD. Interim Report 2014
(2) This amount includes (a) 85,973,066 shares of LVS’s common stock held by Dr. Miriam Adelson, (b) 220,674,894 shares of LVS’s common stock held by trusts for the benefit of Dr. Adelson and her family members over which Dr. Adelson, as trustee, retains sole voting control, (c) 20,330,587 shares of LVS’s common stock held by a trust for the benefit of Dr. Adelson and her family members over which Dr. Adelson, as trustee, retains sole dispositive control, (d) 2,226,062 shares of LVS’s common stock held by trusts or custodial accounts for the benefit of Dr. Adelson’s family members over which Dr. Adelson, as trustee or in another fiduciary capacity, retains sole voting and dispositive control, and (e) 12,566,710 shares of LVS’s common stock held by Adfam Investment Company LLC over which Dr. Adelson, as co-manager, shares voting and dispositive control with Mr. Adelson.
(3) These amounts include (a) 538,000 shares of the Company, (b) 443,200 unvested restricted share units of the Company, and (c) 60,000 options to purchase 60,000 shares of LVS’s common stock, all of which are vested and exercisable.
(4) This amount includes (a) 726,751 shares of LVS’s common stock (see note 9), of which 207,565 shares are held by a corporation which Mr. Leven controls one-third or more of the voting power at its general meetings, or the corporation or its directors are accustomed to act in accordance with his directions, (b) 100,000 unvested LVS’s restricted stock, (c) 200,000 unvested LVS’s restricted stock units, and (d) 10,000 options to purchase 10,000 shares in LVS’s common stock, all of which are vested and exercisable.
(5) This amount includes (a) 400 shares of the Company, (b) 432,000 unvested restricted share units of the Company, and (c) 612,500 options to purchase 612,500 shares of the Company, of which 320,000 options are vested and exercisable.
(6) These amounts include (a) 1,000,000 unvested restricted share units of the Company, and (b) 78 shares of LVS’s common stock.
(7) This amount includes (a) 171,134 shares of LVS’s common stock (see note 9), and (b) 43,349 options to purchase 43,349 shares in LVS’s common stock, all of which are vested and exercisable.
(8) This amount includes (a) 75,000 shares of LVS’s common stock (see note 9), (b) 300,000 unvested LVS’s restricted stock, and (c) 486,017 options to purchase 486,017 shares in LVS’s common stock, all of which are vested and exercisable.
(9) In the annual and interim reports of the Company published prior to 2012, the Company has disclosed LVS’s common stock and LVS’s vested restricted stock separately. From the 2012 interim report onwards, the total number of LVS’s common stock includes the number of vested LVS’s restricted stock and LVS’s common stock.
None of the Directors or the Chief Executives had short positions in respect of shares, underlying shares and debentures of the Company and its associated corporations (within the meaning of Part XV of the SFO) as at June 30, 2014.
Save as disclosed above, so far as was known to the Directors, as at June 30, 2014, none of the Directors or the Chief Executives of the Company had, pursuant to Divisions 7 and 8 of Part XV of the SFO, nor were they taken or deemed to have under such provisions of the SFO, any interest or short position in any shares or underlying shares or interest in debentures of the Company or any of its associated corporations (within the meaning of Part XV of the SFO) that were required to be notified to the Company and the Stock Exchange, or any interests that were required, pursuant to Section 352 of the SFO, to be entered into the register referred to therein, or any interests that were required, pursuant to the Model Code, to be notified to the Company and the Stock Exchange.
As at June 30, 2014, save as disclosed above, none of the Directors nor the Chief Executives of the Company (including their spouses and children under 18 years of age) had any interest in, or had been granted, or exercised, any rights to subscribe for Shares (or warrants or debentures, if applicable) of the Company and its associated corporations (within the meaning of Part XV of the SFO).
23
3. CORPORATE
GOVERNANCE
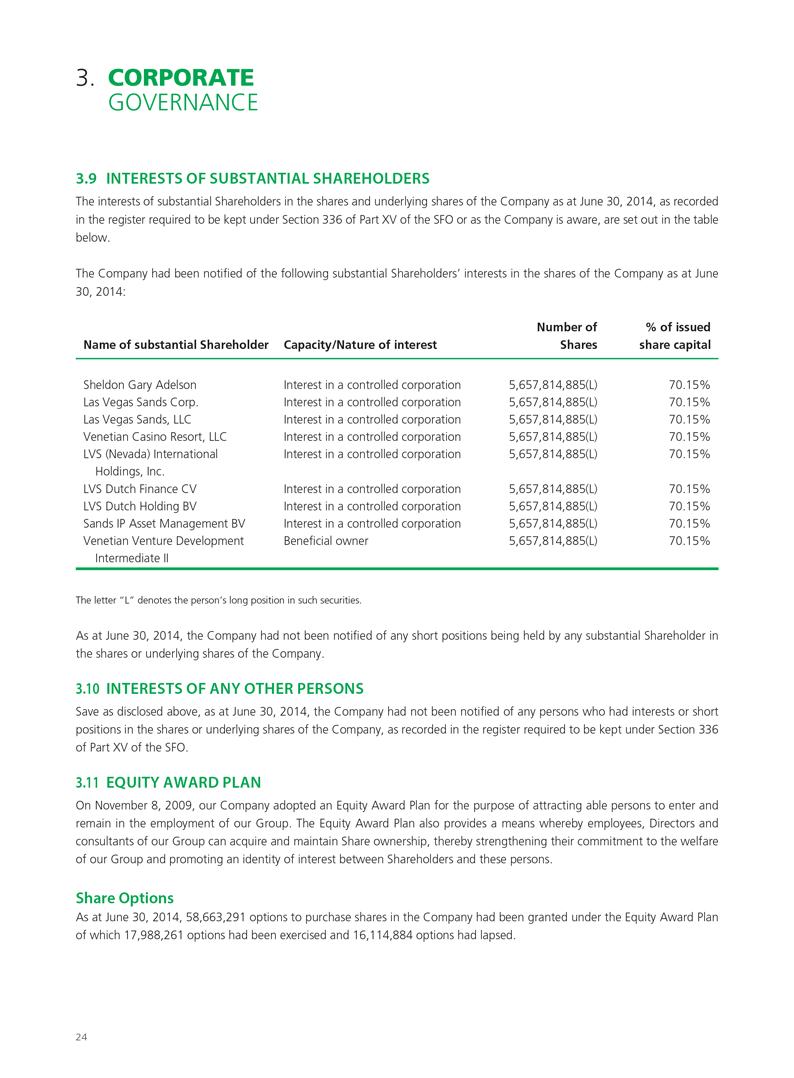
3.9 INTERESTS OF SUBSTANTIAL SHAREHOLDERS
The interests of substantial Shareholders in the shares and underlying shares of the Company as at June 30, 2014, as recorded in the register required to be kept under Section 336 of Part XV of the SFO or as the Company is aware, are set out in the table below.
The Company had been notified of the following substantial Shareholders’ interests in the shares of the Company as at June 30, 2014:
Name of substantial Shareholder
Sheldon Gary Adelson
Las Vegas Sands Corp.
Las Vegas Sands, LLC
Venetian Casino Resort, LLC
LVS (Nevada) International
Holdings, Inc.
LVS Dutch Finance CV
LVS Dutch Holding BV
Sands IP Asset Management BV
Venetian Venture Development
Intermediate II
Capacity/Nature of interest
Interest in a controlled corporation
Interest in a controlled corporation
Interest in a controlled corporation
Interest in a controlled corporation
Interest in a controlled corporation
Interest in a controlled corporation
Interest in a controlled corporation
Interest in a controlled corporation
Beneficial owner
Number of
Shares
5,657,814,885(L)
5,657,814,885(L)
5,657,814,885(L)
5,657,814,885(L)
5,657,814,885(L)
5,657,814,885(L)
5,657,814,885(L)
5,657,814,885(L)
5,657,814,885(L)
% of issued
share capital
70.15%
70.15%
70.15%
70.15%
70.15%
70.15%
70.15%
70.15%
70.15%
The letter “L” denotes the person’s long position in such securities.
As at June 30, 2014, the Company had not been notified of any short positions being held by any substantial Shareholder in the shares or underlying shares of the Company.
3.10 INTERESTS OF ANY OTHER PERSONS
Save as disclosed above, as at June 30, 2014, the Company had not been notified of any persons who had interests or short positions in the shares or underlying shares of the Company, as recorded in the register required to be kept under Section 336 of Part XV of the SFO.
3.11 EQUITY AWARD PLAN
On November 8, 2009, our Company adopted an Equity Award Plan for the purpose of attracting able persons to enter and remain in the employment of our Group. The Equity Award Plan also provides a means whereby employees, Directors and consultants of our Group can acquire and maintain Share ownership, thereby strengthening their commitment to the welfare of our Group and promoting an identity of interest between Shareholders and these persons.
Share Options
As at June 30, 2014, 58,663,291 options to purchase shares in the Company had been granted under the Equity Award Plan of which 17,988,261 options had been exercised and 16,114,884 options had lapsed.
24
SANDS CHINA LTD. Interim Report 2014
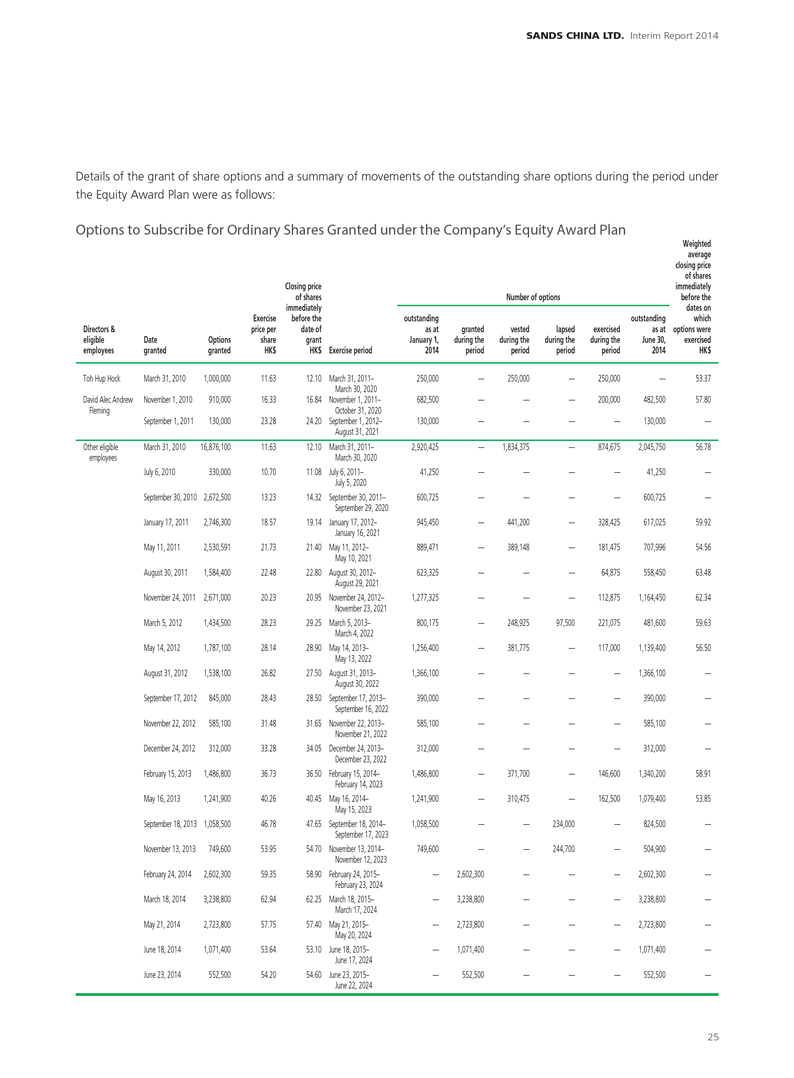
Details of the grant of share options and a summary of movements of the outstanding share options during the period under the Equity Award Plan were as follows:
Options to Subscribe for Ordinary Shares Granted under the Company’s Equity Award Plan
Directors &
eligible
employees
Toh Hup Hock
David Alec Andrew
Fleming
Other eligible
employees
Date
granted
March 31, 2010
November 1, 2010
September 1, 2011
March 31, 2010
July 6, 2010
September 30, 2010
January 17, 2011
May 11, 2011
August 30, 2011
November 24, 2011
March 5, 2012
May 14, 2012
August 31, 2012
September 17, 2012
November 22, 2012
December 24, 2012
February 15, 2013
May 16, 2013
September 18, 2013
November 13, 2013
February 24, 2014
March 18, 2014
May 21, 2014
June 18, 2014
June 23, 2014
Options
granted
1,000,000
910,000
130,000
16,876,100
330,000
2,672,500
2,746,300
2,530,591
1,584,400
2,671,000
1,434,500
1,787,100
1,538,100
845,000
585,100
312,000
1,486,800
1,241,900
1,058,500
749,600
2,602,300
3,238,800
2,723,800
1,071,400
552,500
Exercise
price per
share
HK$
11.63
16.33
23.28
11.63
10.70
13.23
18.57
21.73
22.48
20.23
28.23
28.14
26.82
28.43
31.48
33.28
36.73
40.26
46.78
53.95
59.35
62.94
57.75
53.64
54.20
Closing price
of shares
immediately
before the
date of
grant
HK$
12.10
16.84
24.20
12.10
11.08
14.32
19.14
21.40
22.80
20.95
29.25
28.90
27.50
28.50
31.65
34.05
36.50
40.45
47.65
54.70
58.90
62.25
57.40
53.10
54.60
Exercise period
March 31, 2011–
March 30, 2020
November 1, 2011–
October 31, 2020
September 1, 2012–
August 31, 2021
March 31, 2011–
March 30, 2020
July 6, 2011–
July 5, 2020
September 30, 2011–
September 29, 2020
January 17, 2012–
January 16, 2021
May 11, 2012–
May 10, 2021
August 30, 2012–
August 29, 2021
November 24, 2012–
November 23, 2021
March 5, 2013–
March 4, 2022
May 14, 2013–
May 13, 2022
August 31, 2013–
August 30, 2022
September 17, 2013–
September 16, 2022
November 22, 2013–
November 21, 2022
December 24, 2013–
December 23, 2022
February 15, 2014–
February 14, 2023
May 16, 2014–
May 15, 2023
September 18, 2014–
September 17, 2023
November 13, 2014–
November 12, 2023
February 24, 2015–
February 23, 2024
March 18, 2015–
March 17, 2024
May 21, 2015–
May 20, 2024
June 18, 2015–
June 17, 2024
June 23, 2015–
June 22, 2024
Number of options
outstanding
as at
January 1,
2014
250,000
682,500
130,000
2,920,425
41,250
600,725
945,450
889,471
623,325
1,277,325
800,175
1,256,400
1,366,100
390,000
585,100
312,000
1,486,800
1,241,900
1,058,500
749,600
—
—
—
—
—
granted
during the
period
—
—
—
—
—
—
—
—
—
—
—
—
—
—
—
—
—
—
—
—
2,602,300
3,238,800
2,723,800
1,071,400
552,500
vested
during the
period
250,000
—
—
1,834,375
—
—
441,200
389,148
—
—
248,925
381,775
—
—
—
—
371,700
310,475
—
—
—
—
—
—
—
lapsed
during the
period
—
—
—
—
—
—
—
—
—
—
97,500
—
—
—
—
—
—
—
234,000
244,700
—
—
—
—
—
exercised
during the
period
250,000
200,000
—
874,675
—
—
328,425
181,475
64,875
112,875
221,075
117,000
—
—
—
—
146,600
162,500
—
—
—
—
—
—
—
outstanding
as at
June 30,
2014
—
482,500
130,000
2,045,750
41,250
600,725
617,025
707,996
558,450
1,164,450
481,600
1,139,400
1,366,100
390,000
585,100
312,000
1,340,200
1,079,400
824,500
504,900
2,602,300
3,238,800
2,723,800
1,071,400
552,500
Weighted
average
closing price
of shares
immediately
before the
dates on
which
options were
exercised
HK$
53.37
57.80
—
56.78
—
—
59.92
54.56
63.48
62.34
59.63
56.50
—
—
—
—
58.91
53.85
—
—
—
—
—
—
—
25
3. CORPORATE
GOVERNANCE
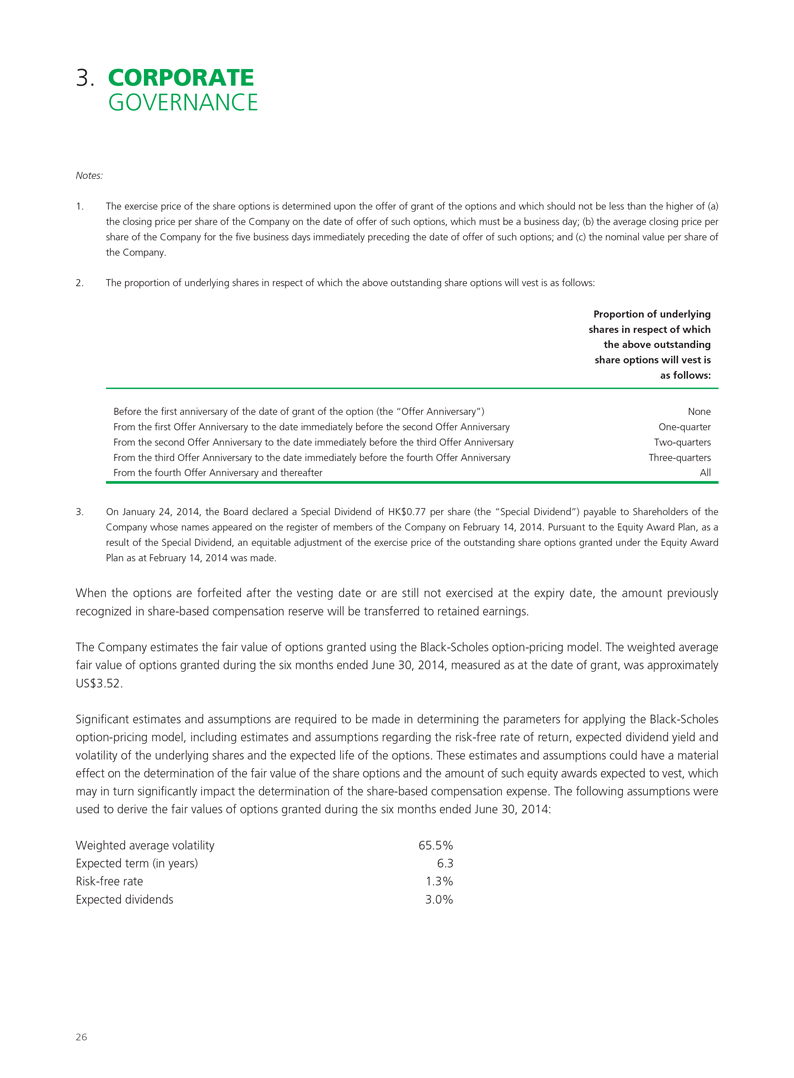
Notes:
1. The exercise price of the share options is determined upon the offer of grant of the options and which should not be less than the higher of (a) the closing price per share of the Company on the date of offer of such options, which must be a business day; (b) the average closing price per share of the Company for the five business days immediately preceding the date of offer of such options; and (c) the nominal value per share of the Company.
2. The proportion of underlying shares in respect of which the above outstanding share options will vest is as follows:
Proportion of underlying shares in respect of which the above outstanding share options will vest is as follows:
Before the first anniversary of the date of grant of the option (the “Offer Anniversary”) From the first Offer Anniversary to the date immediately before the second Offer Anniversary From the second Offer Anniversary to the date immediately before the third Offer Anniversary From the third Offer Anniversary to the date immediately before the fourth Offer Anniversary From the fourth Offer Anniversary and thereafter
None
One-quarter
Two-quarters
Three-quarters
All
3. On January 24, 2014, the Board declared a Special Dividend of HK$0.77 per share (the “Special Dividend”) payable to Shareholders of the Company whose names appeared on the register of members of the Company on February 14, 2014. Pursuant to the Equity Award Plan, as a result of the Special Dividend, an equitable adjustment of the exercise price of the outstanding share options granted under the Equity Award Plan as at February 14, 2014 was made.
When the options are forfeited after the vesting date or are still not exercised at the expiry date, the amount previously recognized in share-based compensation reserve will be transferred to retained earnings.
The Company estimates the fair value of options granted using the Black-Scholes option-pricing model. The weighted average fair value of options granted during the six months ended June 30, 2014, measured as at the date of grant, was approximately US$3.52.
Significant estimates and assumptions are required to be made in determining the parameters for applying the Black-Scholes option-pricing model, including estimates and assumptions regarding the risk-free rate of return, expected dividend yield and volatility of the underlying shares and the expected life of the options. These estimates and assumptions could have a material effect on the determination of the fair value of the share options and the amount of such equity awards expected to vest, which may in turn significantly impact the determination of the share-based compensation expense. The following assumptions were used to derive the fair values of options granted during the six months ended June 30, 2014:
Weighted average volatility Expected term (in years) Risk-free rate Expected dividends
65.5%
6.3
1.3%
3.0%
26
SANDS CHINA LTD. Interim Report 2014
Restricted Share Units
As at June 30, 2014, 2,797,600 restricted share units had been granted under the Equity Award Plan, none of which had vested or lapsed.
Save as disclosed herein, no options, restricted share units or any other share-based awards were granted under the Equity Award Plan or any share option scheme of the Group as at June 30, 2014 and no options, restricted share units or any other share-based awards were cancelled during the period.
3.12 PURCHASE, SALE OR REDEMPTION OF THE COMPANY’S LISTED SHARES
Neither the Company, nor any of its subsidiaries purchased, sold or redeemed any of the listed shares of the Company during the six months ended June 30, 2014.
27
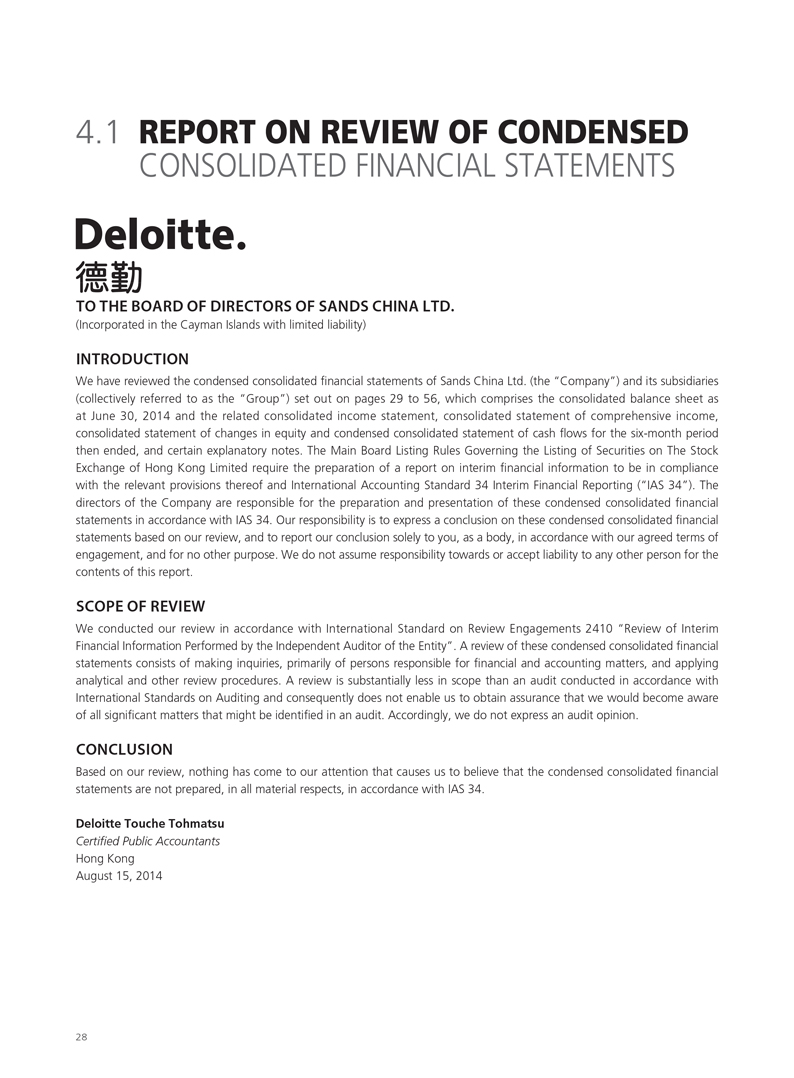
4.1 REPORT ON REVIEW OF CONDENSED
CONSOLIDATED FINANCIAL STATEMENTS
TO THE BOARD OF DIRECTORS OF SANDS CHINA LTD.
(Incorporated in the Cayman Islands with limited liability)
INTRODUCTION
We have reviewed the condensed consolidated financial statements of Sands China Ltd. (the “Company”) and its subsidiaries (collectively referred to as the “Group”) set out on pages 29 to 56, which comprises the consolidated balance sheet as at June 30, 2014 and the related consolidated income statement, consolidated statement of comprehensive income, consolidated statement of changes in equity and condensed consolidated statement of cash flows for the six-month period then ended, and certain explanatory notes. The Main Board Listing Rules Governing the Listing of Securities on The Stock Exchange of Hong Kong Limited require the preparation of a report on interim financial information to be in compliance with the relevant provisions thereof and International Accounting Standard 34 Interim Financial Reporting (“IAS 34”). The directors of the Company are responsible for the preparation and presentation of these condensed consolidated financial statements in accordance with IAS 34. Our responsibility is to express a conclusion on these condensed consolidated financial statements based on our review, and to report our conclusion solely to you, as a body, in accordance with our agreed terms of engagement, and for no other purpose. We do not assume responsibility towards or accept liability to any other person for the contents of this report.
SCOPE OF REVIEW
We conducted our review in accordance with International Standard on Review Engagements 2410 “Review of Interim Financial Information Performed by the Independent Auditor of the Entity”. A review of these condensed consolidated financial statements consists of making inquiries, primarily of persons responsible for financial and accounting matters, and applying analytical and other review procedures. A review is substantially less in scope than an audit conducted in accordance with International Standards on Auditing and consequently does not enable us to obtain assurance that we would become aware of all significant matters that might be identified in an audit. Accordingly, we do not express an audit opinion.
CONCLUSION
Based on our review, nothing has come to our attention that causes us to believe that the condensed consolidated financial statements are not prepared, in all material respects, in accordance with IAS 34.
Deloitte Touche Tohmatsu
Certified Public Accountants
Hong Kong August 15, 2014
28
SANDS CHINA LTD. Interim Report 2014
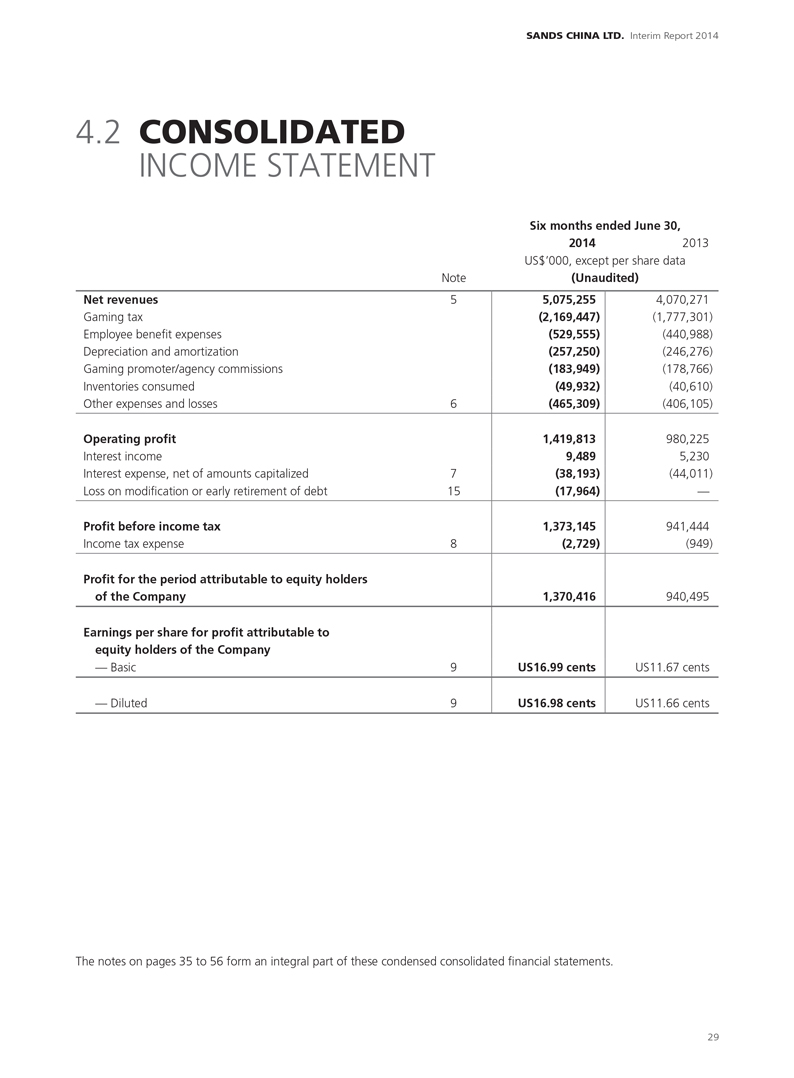
4.2 CONSOLIDATED
INCOME STATEMENT
Six months ended June 30,
2014 2013
US$’000, except per share data
(Unaudited)
Net revenues
Gaming tax
Employee benefit expenses
Depreciation and amortization
Gaming promoter/agency commissions
Inventories consumed
Other expenses and losses
Operating profit
Interest income
Interest expense, net of amounts capitalized
Loss on modification or early retirement of debt
Profit before income tax
Income tax expense
Profit for the period attributable to equity holders
of the Company
Earnings per share for profit attributable to
equity holders of the Company
— Basic
— Diluted
Note
5
6
7
15
8
9
9
5,075,255
(2,169,447)
(529,555)
(257,250)
(183,949)
(49,932)
(465,309)
1,419,813
9,489
(38,193)
(17,964)
1,373,145
(2,729)
1,370,416
US16.99 cents
US16.98 cents
4,070,271
(1,777,301)
(440,988)
(246,276)
(178,766)
(40,610)
(406,105)
980,225
5,230
(44,011)
—
941,444
(949)
940,495
US11.67 cents
US11.66 cents
The notes on pages 35 to 56 form an integral part of these condensed consolidated financial statements.
29
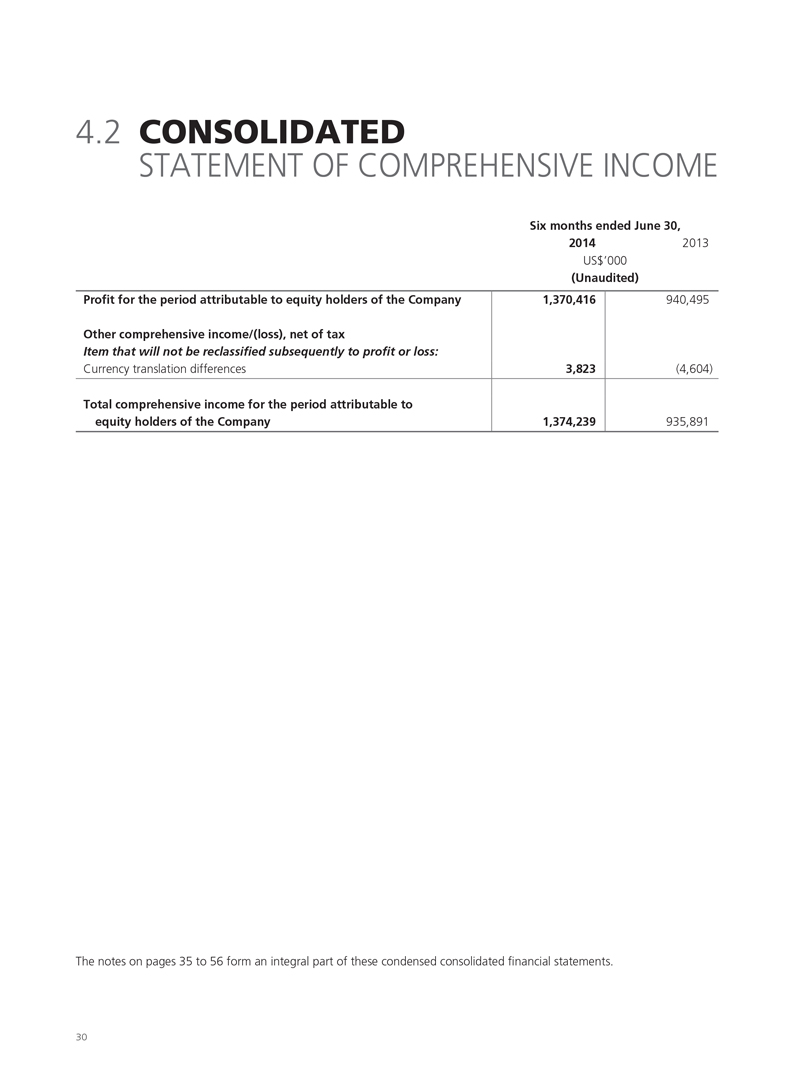
4.2 CONSOLIDATED
STATEMENT OF COMPREHENSIVE INCOME
Profit for the period attributable to equity holders of the Company
Other comprehensive income/(loss), net of tax
Item that will not be reclassified subsequently to profit or loss:
Currency translation differences
Total comprehensive income for the period attributable to
equity holders of the Company
1,370,416
3,823
1,374,239
940,495
(4,604)
935,891
Six months ended June 30,
2014
2013
US$’000
(Unaudited)
The notes on pages 35 to 56 form an integral part of these condensed consolidated financial statements.
30
SANDS CHINA LTD. Interim Report 2014
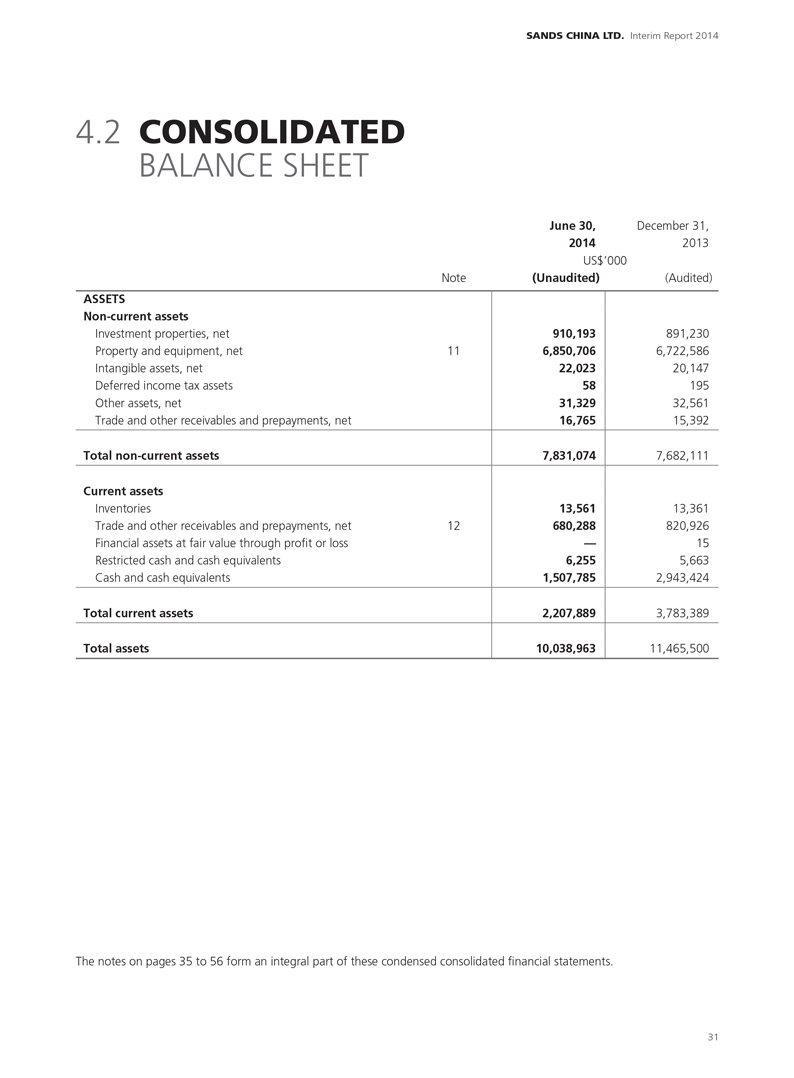
4.2 CONSOLIDATED
BALANCE SHEET
June 30, December 31,
2014 2013
US$’000
ASSETS
Non-current assets
Investment properties, net
Property and equipment, net
Intangible assets, net
Deferred income tax assets
Other assets, net
Trade and other receivables and prepayments, net
Total non-current assets
Current assets
Inventories
Trade and other receivables and prepayments, net
Financial assets at fair value through profit or loss
Restricted cash and cash equivalents
Cash and cash equivalents
Total current assets
Total assets
Note
11
12
(Unaudited)
910,193
6,850,706
22,023
58
31,329
16,765
7,831,074
13,561
680,288
—
6,255
1,507,785
2,207,889
10,038,963
(Audited)
891,230
6,722,586
20,147
195
32,561
15,392
7,682,111
13,361
820,926
15
5,663
2,943,424
3,783,389
11,465,500
The notes on pages 35 to 56 form an integral part of these condensed consolidated financial statements.
31
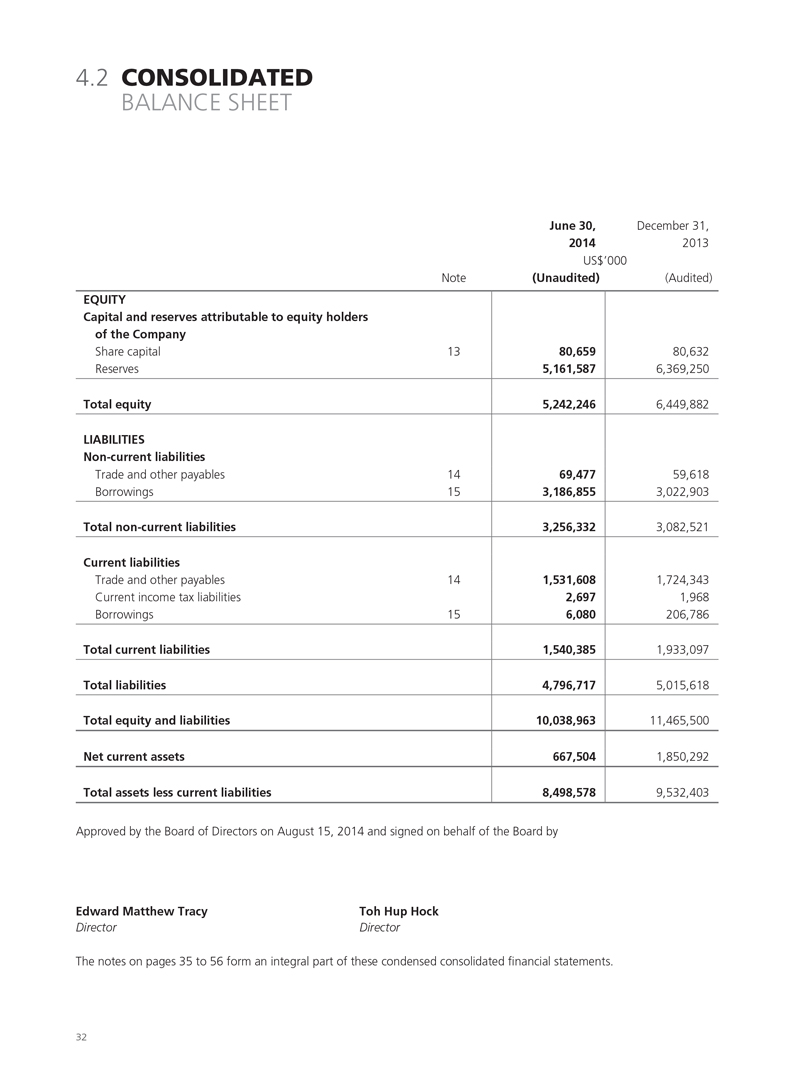
4.2 CONSOLIDATED
BALANCE SHEET
June 30, December 31,
2014 2013
US$’000
EQUITY
Capital and reserves attributable to equity holders
of the Company
Share capital
Reserves
Total equity
LIABILITIES
Non-current liabilities
Trade and other payables
Borrowings
Total non-current liabilities
Current liabilities
Trade and other payables
Current income tax liabilities
Borrowings
Total current liabilities
Total liabilities
Total equity and liabilities
Net current assets
Total assets less current liabilities
Note
13
14
15
14
15
(Unaudited)
80,659
5,161,587
5,242,246
69,477
3,186,855
3,256,332
1,531,608
2,697
6,080
1,540,385
4,796,717
10,038,963
667,504
8,498,578
(Audited)
80,632
6,369,250
6,449,882
59,618
3,022,903
3,082,521
1,724,343
1,968
206,786
1,933,097
5,015,618
11,465,500
1,850,292
9,532,403
Approved by the Board of Directors on August 15, 2014 and signed on behalf of the Board by
Edward Matthew Tracy
Director
Toh Hup Hock
Director
The notes on pages 35 to 56 form an integral part of these condensed consolidated financial statements.
32
SANDS CHINA LTD. Interim Report 2014
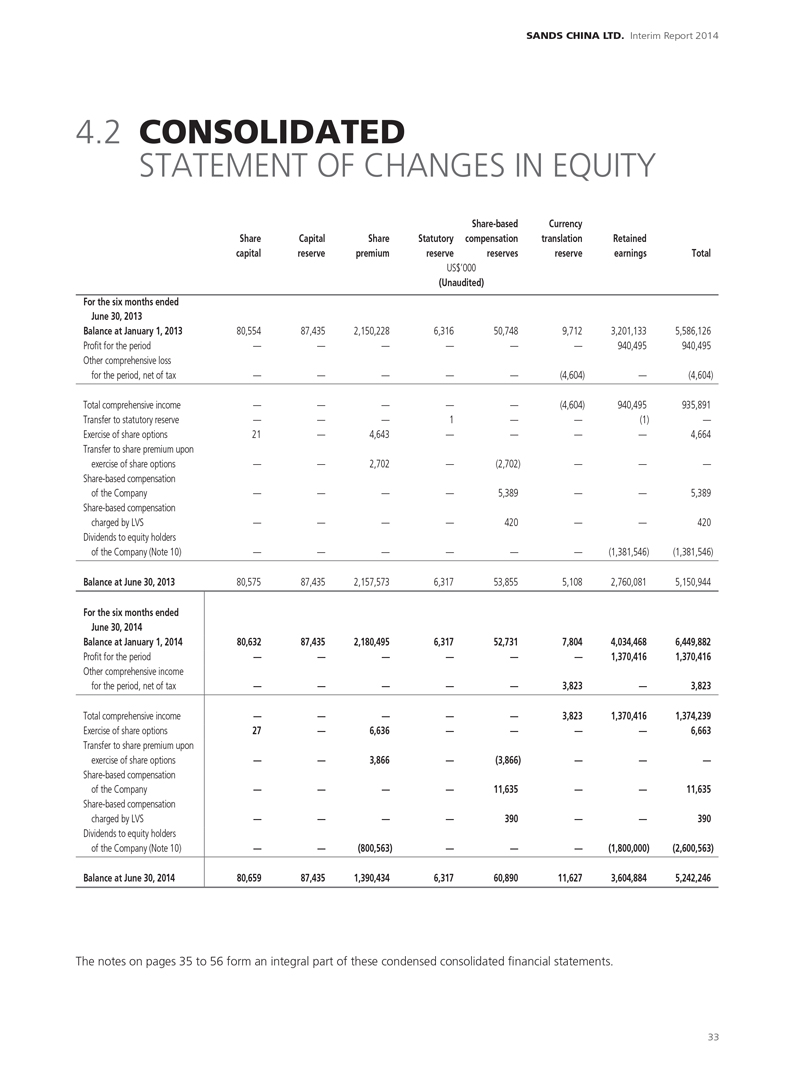
4.2 CONSOLIDATED
STATEMENT OF CHANGES IN EQUITY
For the six months ended
June 30, 2013
Balance at January 1, 2013
Profit for the period
Other comprehensive loss
for the period, net of tax
Total comprehensive income
Transfer to statutory reserve
Exercise of share options
Transfer to share premium upon
exercise of share options
Share-based compensation
of the Company
Share-based compensation
charged by LVS
Dividends to equity holders
of the Company (Note 10)
Balance at June 30, 2013
For the six months ended
June 30, 2014
Balance at January 1, 2014
Profit for the period
Other comprehensive income
for the period, net of tax
Total comprehensive income
Exercise of share options
Transfer to share premium upon
exercise of share options
Share-based compensation
of the Company
Share-based compensation
charged by LVS
Dividends to equity holders
of the Company (Note 10)
Balance at June 30, 2014
Share
capital
80,554
—
—
—
—
21
—
—
—
—
80,575
80,632
—
—
—
27
—
—
—
—
80,659
Capital
reserve
87,435
—
—
—
—
—
—
—
—
—
87,435
87,435
—
—
—
—
—
—
87,435
Share
premium
2,150,228
—
—
—
—
4,643
2,702
—
—
—
2,157,573
2,180,495
—
—
—
6,636
3,866
—
—
(800,563)
1,390,434
Statutory
reserve
6,316
—
—
—
1
—
—
—
—
—
6,317
6,317
—
—
—
—
—
6,317
Share-based
compensation
reserves
50,748
—
—
—
—
—
(2,702)
5,389
420
—
53,855
52,731
—
—
—
—
—
(3,866)
11,635
390
—
60,890
Currency
translation
reserve
9,712
—
(4,604)
(4,604)
—
—
—
—
—
—
5,108
7,804
—
3,823
3,823
—
—
—
—
—
11,627
Retained
earnings
3,201,133
940,495
—
940,495
(1)
—
—
—
—
(1,381,546)
2,760,081
4,034,468
1,370,416
—
1,370,416
—
—
—
—
(1,800,000)
3,604,884
Total
5,586,126
940,495
(4,604)
935,891
—
4,664
—
5,389
420
(1,381,546)
5,150,944
6,449,882
1,370,416
3,823
1,374,239
6,663
—
11,635
390
(2,600,563)
5,242,246
US$’000
(Unaudited)
The notes on pages 35 to 56 form an integral part of these condensed consolidated financial statements.
33
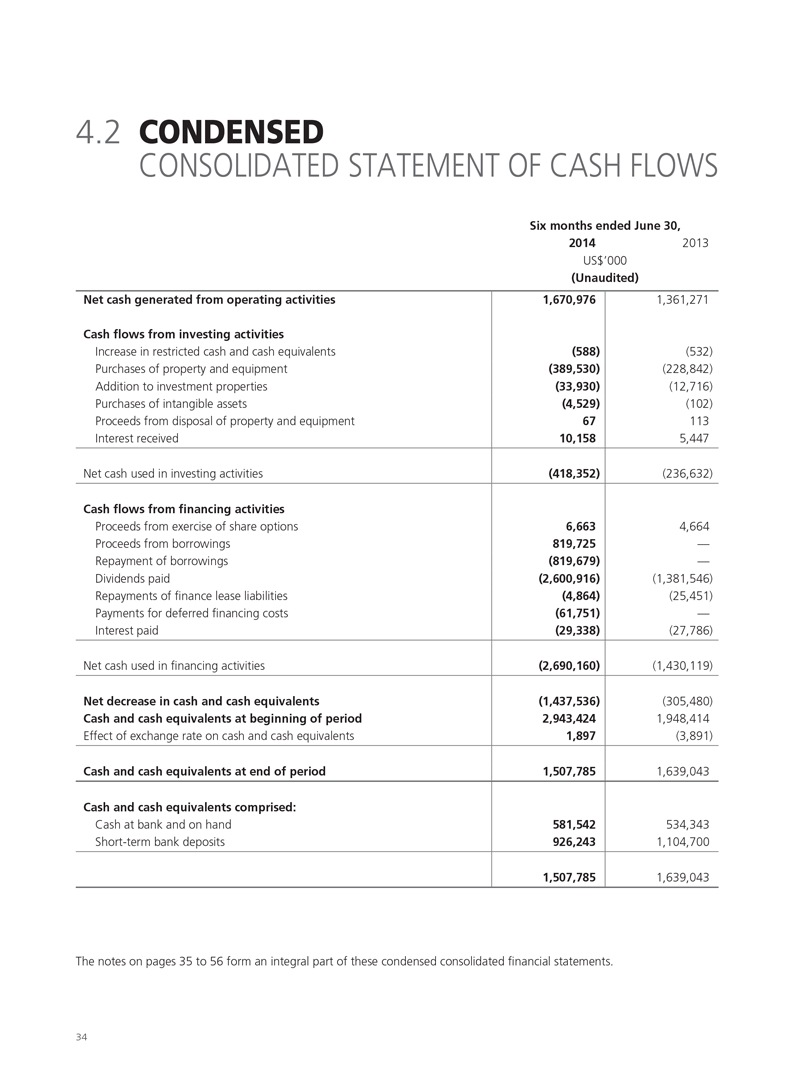
4.2 CONDENSED
CONSOLIDATED STATEMENT OF CASH FLOWS
Six months ended June 30, 2014 2013 US$’000
(Unaudited)
Net cash generated from operating activities
Cash flows from investing activities
Increase in restricted cash and cash equivalents
Purchases of property and equipment
Addition to investment properties
Purchases of intangible assets
Proceeds from disposal of property and equipment
Interest received
Net cash used in investing activities
Cash flows from financing activities
Proceeds from exercise of share options
Proceeds from borrowings
Repayment of borrowings
Dividends paid
Repayments of finance lease liabilities
Payments for deferred financing costs
Interest paid
Net cash used in financing activities
Net decrease in cash and cash equivalents
Cash and cash equivalents at beginning of period
Effect of exchange rate on cash and cash equivalents
Cash and cash equivalents at end of period
Cash and cash equivalents comprised:
Cash at bank and on hand
Short-term bank deposits
1,670,976
(588)
(389,530)
(33,930)
(4,529)
67
10,158
(418,352)
6,663
819,725
(819,679)
(2,600,916)
(4,864)
(61,751)
(29,338)
(2,690,160)
(1,437,536)
2,943,424
1,897
1,507,785
581,542
926,243
1,507,785
1,361,271
(532)
(228,842)
(12,716)
(102)
113
5,447
(236,632)
4,664
—
—
(1,381,546)
(25,451)
—
(27,786)
(1,430,119)
(305,480)
1,948,414
(3,891)
1,639,043
534,343
1,104,700
1,639,043
The notes on pages 35 to 56 form an integral part of these condensed consolidated financial statements.
34
SANDS CHINA LTD. Interim Report 2014
4.3 NOTES TO THE CONDENSED
CONSOLIDATED FINANCIAL STATEMENTS
1. GENERAL INFORMATION Principal activities
Sands China Ltd. (the “Company”) and its subsidiaries (collectively referred to as the “Group”) are principally engaged in the operation of casino games of chance or games of other forms and the development and operation of integrated resorts and other ancillary services in the Macao Special Administrative Region of the People’s Republic of China (“Macao”). The Group’s immediate holding company is Venetian Venture Development Intermediate II (“VVDI (II)”). Las Vegas Sands Corp. (“LVS”) is the Group’s ultimate holding company.
The Company was incorporated in the Cayman Islands on July 15, 2009 as an exempted company with limited liability under the Companies Law, Cap 22 (Law 3 of 1961, as consolidated and revised) of the Cayman Islands. The address of the Company’s registered office is Intertrust Corporate Services (Cayman) Limited, 190 Elgin Avenue, George Town, Grand Cayman KY1-9005, Cayman Islands. The Company’s principal place of business in Hong Kong is Level 54, Hopewell Centre, 183 Queen’s Road East, Hong Kong.
The Group owns and operates The Venetian Macao-Resort-Hotel (“The Venetian Macao”), which anchors the Cotai Strip, the Group’s master-planned development of integrated resort properties in Macao. In April 2012, September 2012 and January 2013, the Group opened the Conrad and Holiday Inn tower, the first Sheraton tower and the second Sheraton tower, respectively, of the Sands Cotai Central integrated resort, which is located across the street from The Venetian Macao and The Plaza Macao. The Group owns The Plaza Macao, which is located adjacent and connected to The Venetian Macao. The Plaza Macao is an integrated resort that includes the Four Seasons Hotel Macao, the Plaza Casino, Shoppes at Four Seasons and Paiza Mansions. The Plaza Macao will also feature an apart-hotel tower consisting of Four Seasons-serviced and -branded luxury apart-hotel units and common areas. The Group also owns and operates the Sands Macao, the first Las Vegas-style casino in Macao. The Group’s other ancillary services include ferry operations and other related operations.
The Company’s shares were listed on the Main Board of The Stock Exchange of Hong Kong Limited on November 30, 2009.
The unaudited condensed consolidated financial statements are presented in United States dollars (“US$”), unless otherwise stated. The condensed consolidated financial statements were approved and authorized for issue by the Board of Directors of the Company on August 15, 2014.
These condensed consolidated financial statements have not been audited.
Key event
In March 2014, the Group amended and restated its 2011 VML Credit Facility. Further details are given in Note 15.
2. BASIS OF PREPARATION
The condensed consolidated financial statements for the six months ended June 30, 2014 have been prepared in accordance with International Accounting Standard (“IAS”) 34 “Interim Financial Reporting” issued by the International Accounting Standards Board (“IASB”) and the applicable disclosure requirements of Appendix 16 to the Listing Rules. They should be read in conjunction with the Group’s annual financial statements for the year ended December 31, 2013, which were prepared in accordance with International Financial Reporting Standards (“IFRS”).
35
4.3 NOTES TO THE CONDENSED
CONSOLIDATED FINANCIAL STATEMENTS
3. SIGNIFICANT ACCOUNTING POLICIES
The condensed consolidated financial statements have been prepared on the historical cost basis except for certain financial assets that are measured at fair value.
Except as described below, the accounting policies adopted and methods of computation used in the preparation of the condensed consolidated financial statements for the six months ended June 30, 2014 are consistent with those adopted and as described in the Group’s annual financial statements for the year ended December 31, 2013.
During the period, there have been a number of new interpretation and amendments to standards that have come into effect, which the Group has adopted at their respective effective dates. The adoption of these new interpretation and amendments to standards had no material impact on the results of operations and financial position of the Group.
The Group has not early adopted the new or revised standards, amendments and interpretation that have been issued, but are not yet effective for the period. The Group has already commenced the assessment of the impact of the new or revised standards, amendments and interpretation to the Group, but is not yet in a position to state whether these would have a significant impact on the results of operations and financial position of the Group.
The preparation of condensed consolidated financial statements requires management to make judgments, estimates and assumptions that affect the application of accounting policies and the reported amounts of assets, liabilities, income and expenses. Actual results may differ from these estimates. In preparing these condensed consolidated financial statements, the significant judgments made by management in the process of applying the Group’s accounting policies and the key sources of estimation uncertainty were the same as those that were applied to the consolidated financial statements for the year ended December 31, 2013.
The Group’s activities expose it to a variety of financial risks: market risk, credit risk and liquidity risk. The condensed consolidated financial statements do not include all financial risk management information and disclosures required in the annual financial statements and should be read in conjunction with the Group’s annual financial statements for the year ended December 31, 2013. There have been no changes in any risk management policies since year-end 2013.
4. SEGMENT INFORMATION
Management has determined the operating segments based on the reports reviewed by a group of senior management to make strategic decisions. The Group considers the business from a property and service perspective.
The Group’s principal operating and developmental activities occur in Macao, which is the sole geographic area in which the Group is domiciled. The Group reviews the results of operations for each of its key operating segments, which are also the reportable segments: The Venetian Macao, Sands Cotai Central, The Plaza Macao, Sands Macao and ferry and other operations. The Group’s primary projects under development are The Parisian Macao, the St. Regis tower (the remaining phase of Sands Cotai Central) and the Four Seasons apart-hotel.
36
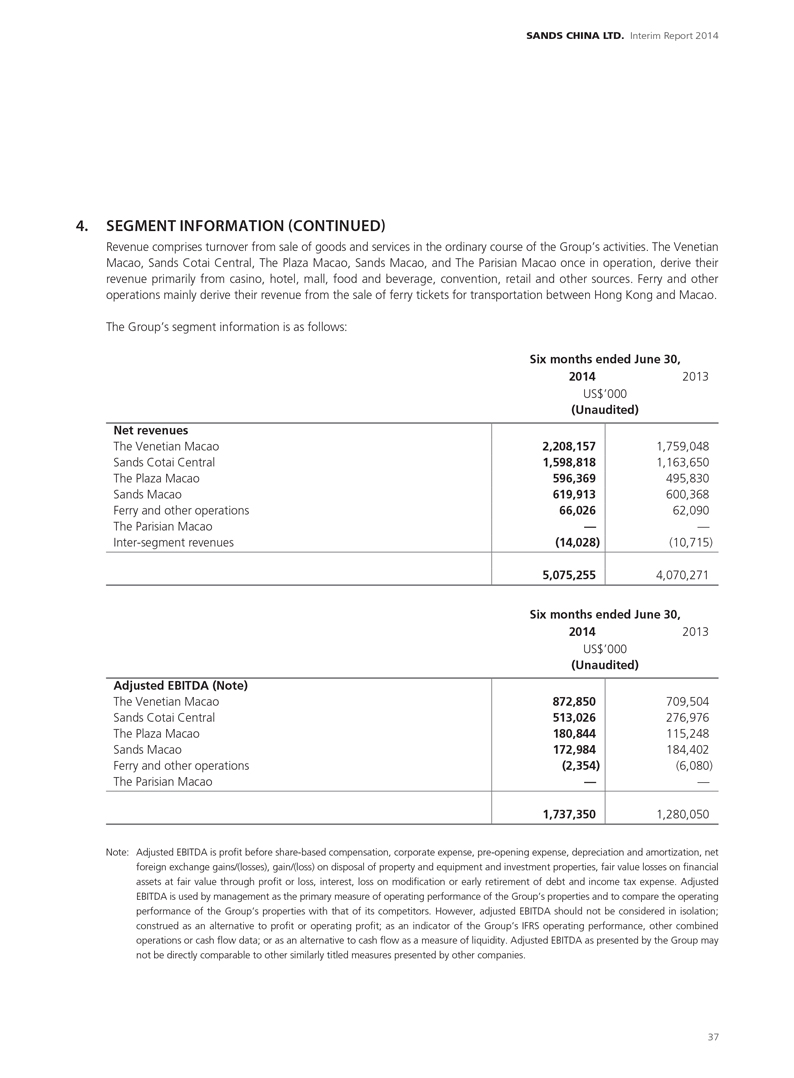
SANDS CHINA LTD. Interim Report 2014
4. SEGMENT INFORMATION (CONTINUED)
Revenue comprises turnover from sale of goods and services in the ordinary course of the Group’s activities. The Venetian Macao, Sands Cotai Central, The Plaza Macao, Sands Macao, and The Parisian Macao once in operation, derive their revenue primarily from casino, hotel, mall, food and beverage, convention, retail and other sources. Ferry and other operations mainly derive their revenue from the sale of ferry tickets for transportation between Hong Kong and Macao.
The Group’s segment information is as follows:
Six months ended June 30, 2014 2013 US$’000
(Unaudited)
Net revenues
The Venetian Macao
Sands Cotai Central
The Plaza Macao
Sands Macao
Ferry and other operations
The Parisian Macao
Inter-segment revenues
2,208,157
1,598,818
596,369
619,913
66,026
—
(14,028)
5,075,255
1,759,048
1,163,650
495,830
600,368
62,090
—
(10,715)
4,070,271
Six months ended June 30,
2014
2013
US$’000
(Unaudited)
Adjusted EBITDA (Note)
The Venetian Macao
Sands Cotai Central
The Plaza Macao
Sands Macao
Ferry and other operations
The Parisian Macao
872,850
513,026
180,844
172,984
(2,354)
—
1,737,350
709,504
276,976
115,248
184,402
(6,080)
—
1,280,050
Note: Adjusted EBITDA is profit before share-based compensation, corporate expense, pre-opening expense, depreciation and amortization, net foreign exchange gains/(losses), gain/(loss) on disposal of property and equipment and investment properties, fair value losses on financial assets at fair value through profit or loss, interest, loss on modification or early retirement of debt and income tax expense. Adjusted EBITDA is used by management as the primary measure of operating performance of the Group’s properties and to compare the operating performance of the Group’s properties with that of its competitors. However, adjusted EBITDA should not be considered in isolation; construed as an alternative to profit or operating profit; as an indicator of the Group’s IFRS operating performance, other combined operations or cash flow data; or as an alternative to cash flow as a measure of liquidity. Adjusted EBITDA as presented by the Group may not be directly comparable to other similarly titled measures presented by other companies.
37
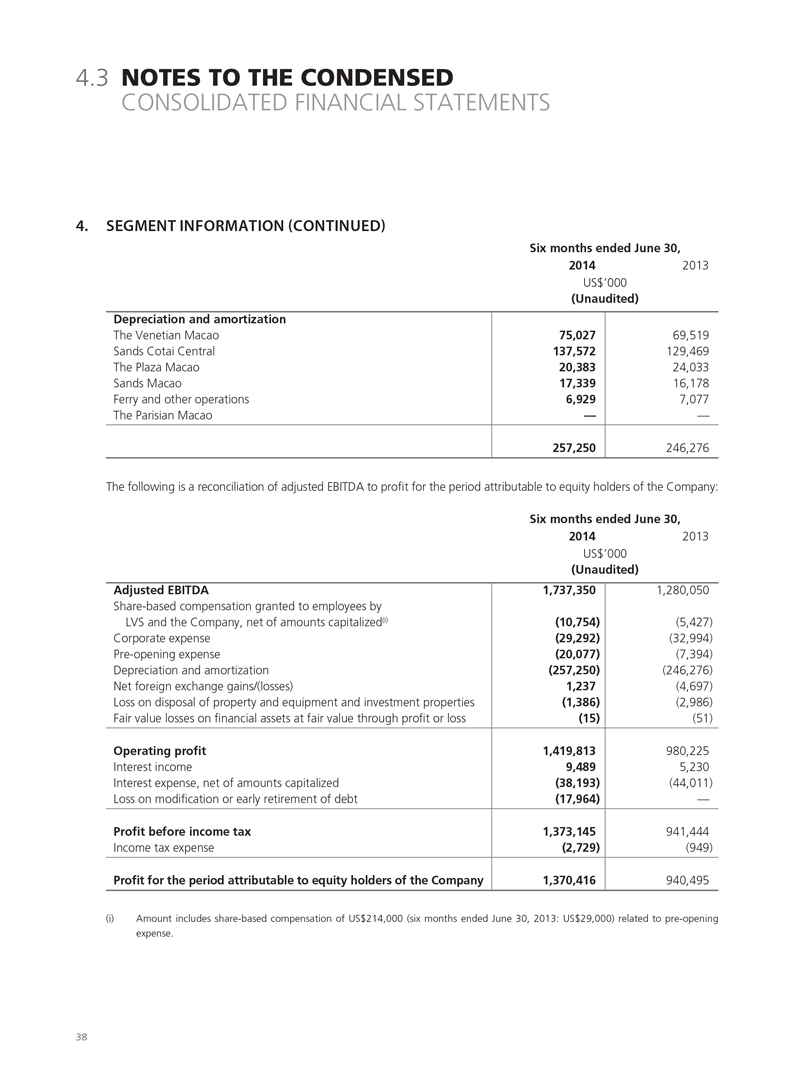
4.3 NOTES TO THE CONDENSED
CONSOLIDATED FINANCIAL STATEMENTS
4. SEGMENT INFORMATION (CONTINUED)
Six months ended June 30, 2014 2013 US$’000
(Unaudited)
Depreciation and amortization
The Venetian Macao
Sands Cotai Central
The Plaza Macao
Sands Macao
Ferry and other operations
The Parisian Macao
75,027
137,572
20,383
17,339
6,929
—
257,250
69,519
129,469
24,033
16,178
7,077
—
246,276
The following is a reconciliation of adjusted EBITDA to profit for the period attributable to equity holders of the Company:
Six months ended June 30, 2014 2013 US$’000
(Unaudited)
Adjusted EBITDA
Share-based compensation granted to employees by
LVS and the Company, net of amounts capitalized(i)
Corporate expense
Pre-opening expense
Depreciation and amortization
Net foreign exchange gains/(losses)
Loss on disposal of property and equipment and investment properties
Fair value losses on financial assets at fair value through profit or loss
Operating profit
Interest income
Interest expense, net of amounts capitalized
Loss on modification or early retirement of debt
Profit before income tax
Income tax expense
Profit for the period attributable to equity holders of the Company
1,737,350
(10,754)
(29,292)
(20,077)
(257,250)
1,237
(1,386)
(15)
1,419,813
9,489
(38,193)
(17,964)
1,373,145
(2,729)
1,370,416
1,280,050
(5,427)
(32,994)
(7,394)
(246,276)
(4,697)
(2,986)
(51)
980,225
5,230
(44,011)
—
941,444
(949)
940,495
(i) Amount includes share-based compensation of US$214,000 (six months ended June 30, 2013: US$29,000) related to pre-opening expense.
38
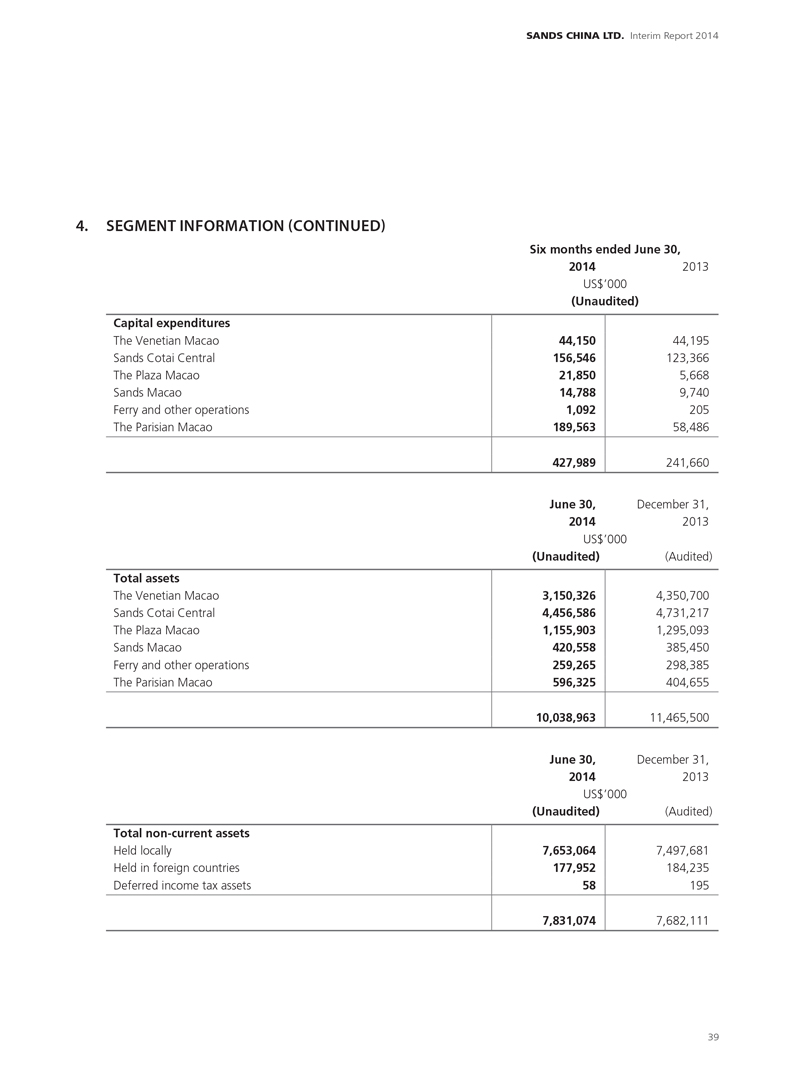
SANDS CHINA LTD. Interim Report 2014
4. SEGMENT INFORMATION (CONTINUED)
Six months ended June 30, 2014 2013 US$’000
(Unaudited)
Capital expenditures
The Venetian Macao
Sands Cotai Central
The Plaza Macao
Sands Macao
Ferry and other operations
The Parisian Macao
44,150
156,546
21,850
14,788
1,092
189,563
427,989
44,195
123,366
5,668
9,740
205
58,486
241,660
June 30,
December 31,
2014
2013
US$’000
Total assets
The Venetian Macao
Sands Cotai Central
The Plaza Macao
Sands Macao
Ferry and other operations
The Parisian Macao
(Unaudited)
3,150,326
4,456,586
1,155,903
420,558
259,265
596,325
10,038,963
(Audited)
4,350,700
4,731,217
1,295,093
385,450
298,385
404,655
11,465,500
June 30,
December 31,
2014
2013
US$’000
Total non-current assets
Held locally
Held in foreign countries
Deferred income tax assets
(Unaudited)
7,653,064
177,952
58
7,831,074
(Audited)
7,497,681
184,235
195
7,682,111
39
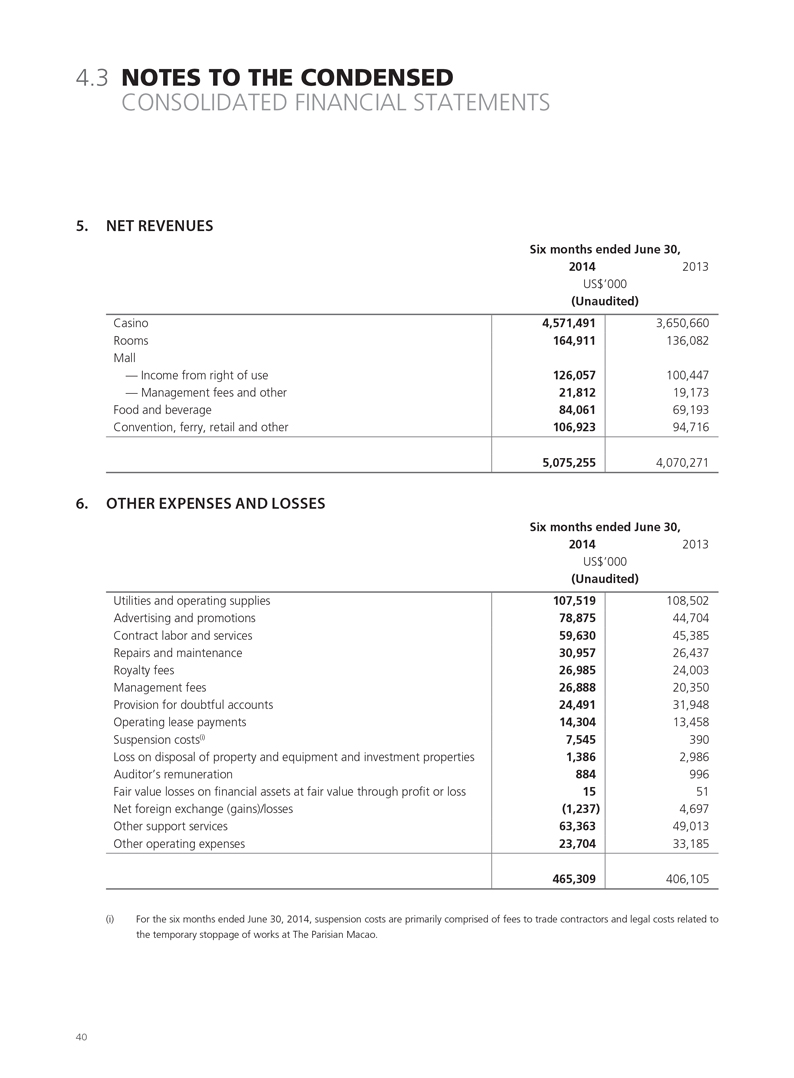
4.3 NOTES TO THE CONDENSED
CONSOLIDATED FINANCIAL STATEMENTS
5. NET REVENUES
Six months ended June 30,
2014
2013
US$’000
(Unaudited)
Casino
Rooms
Mall
— Income from right of use
— Management fees and other
Food and beverage
Convention, ferry, retail and other
4,571,491
164,911
126,057
21,812
84,061
106,923
5,075,255
3,650,660
136,082
100,447
19,173
69,193
94,716
4,070,271
6. OTHER EXPENSES AND LOSSES
Six months ended June 30,
2014
2013
US$’000
(Unaudited)
Utilities and operating supplies
Advertising and promotions
Contract labor and services
Repairs and maintenance
Royalty fees
Management fees
Provision for doubtful accounts
Operating lease payments
Suspension costs(i)
Loss on disposal of property and equipment and investment properties
Auditor’s remuneration
Fair value losses on financial assets at fair value through profit or loss
Net foreign exchange (gains)/losses
Other support services
Other operating expenses
107,519
78,875
59,630
30,957
26,985
26,888
24,491
14,304
7,545
1,386
884
15
(1,237)
63,363
23,704
465,309
108,502
44,704
45,385
26,437
24,003
20,350
31,948
13,458
390
2,986
996
51
4,697
49,013
33,185
406,105
(i) For the six months ended June 30, 2014, suspension costs are primarily comprised of fees to trade contractors and legal costs related to the temporary stoppage of works at The Parisian Macao.
40
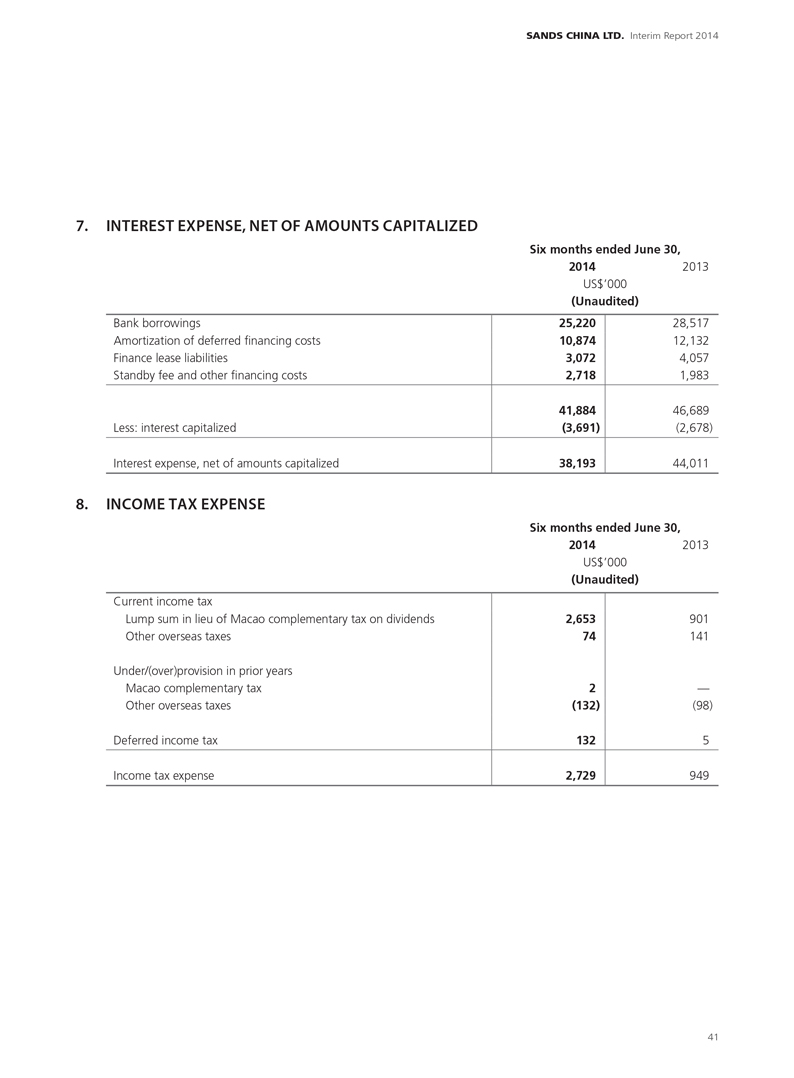
SANDS CHINA LTD. Interim Report 2014
7. INTEREST EXPENSE, NET OF AMOUNTS CAPITALIZED
Six months ended June 30, 2014 2013 US$’000
(Unaudited)
Bank borrowings
Amortization of deferred financing costs
Finance lease liabilities
Standby fee and other financing costs
Less: interest capitalized
Interest expense, net of amounts capitalized
25,220
10,874
3,072
2,718
41,884
(3,691)
38,193
28,517
12,132
4,057
1,983
46,689
(2,678)
44,011
8. INCOME TAX EXPENSE
Six months ended June 30,
2014
2013
US$’000
(Unaudited)
Current income tax
Lump sum in lieu of Macao complementary tax on dividends
Other overseas taxes
Under/(over)provision in prior years
Macao complementary tax
Other overseas taxes
Deferred income tax
Income tax expense
2,653
74
2
(132)
132
2,729
901
141
—
(98)
5
949
41
4.3 NOTES TO THE CONDENSED
CONSOLIDATED FINANCIAL STATEMENTS
8. INCOME TAX EXPENSE (CONTINUED)
The Company’s subsidiaries that carry on business in Hong Kong are subject to Hong Kong profits tax rate at 16.5% for the six months ended June 30, 2014 (six months ended June 30, 2013: same). Taxation for overseas jurisdictions is charged at the appropriate prevailing rates ruling in the respective jurisdictions. The maximum rate is 12% for Macao (six months ended June 30, 2013: same) and 25% for China (six months ended June 30, 2013: same).
Pursuant to the Despatch No. 250/2004 issued by the Chief Executive of Macao on September 30, 2004, Venetian Macau Limited (“VML”) was exempt from Macao complementary tax on its gaming activities for five years effective from the tax year 2004 to the tax year 2008. On May 21, 2008, VML was granted, pursuant to the Despatch No. 167/2008 issued by the Chief Executive of Macao, an extension of the tax exemption regarding Macao complementary tax on its gaming activities for an additional five years, effective from the tax year 2009 to the tax year 2013. On October 3, 2013, VML was granted, pursuant to the Despatch No. 320/2013 issued by the Chief Executive of Macao, an extension of the tax exemption regarding Macao complementary tax on its gaming activities for an additional five years, effective from the tax year 2014 to the tax year 2018. Regarding the other subsidiaries, during the six months ended June 30, 2014, Macao complementary tax is calculated progressively at a maximum of 12% of the estimated assessable profit (six months ended June 30, 2013: same).
VML entered into a Shareholder Dividend Tax Agreement with the Macao Government. The agreement provided for an annual payment in lieu of Macao complementary tax otherwise due by VML’s shareholders on dividend distributions to them from gaming profits, effective through the end of 2013. In May 2014, VML entered into another Shareholder Dividend Tax Agreement with Macao Government for an extension of the agreement through 2018 to correspond to the Macao complementary tax exemption on its gaming activities.
9. EARNINGS PER SHARE
Basic earnings per share is calculated by dividing the profit for the period attributable to equity holders of the Company by the weighted average number of ordinary shares in issue during the period.
Diluted earnings per share is calculated by adjusting the weighted average number of ordinary shares outstanding to assume conversion of all dilutive potential ordinary shares. For the six months ended June 30, 2014, the Company has outstanding share options and restricted share units that will potentially dilute the ordinary shares.
42
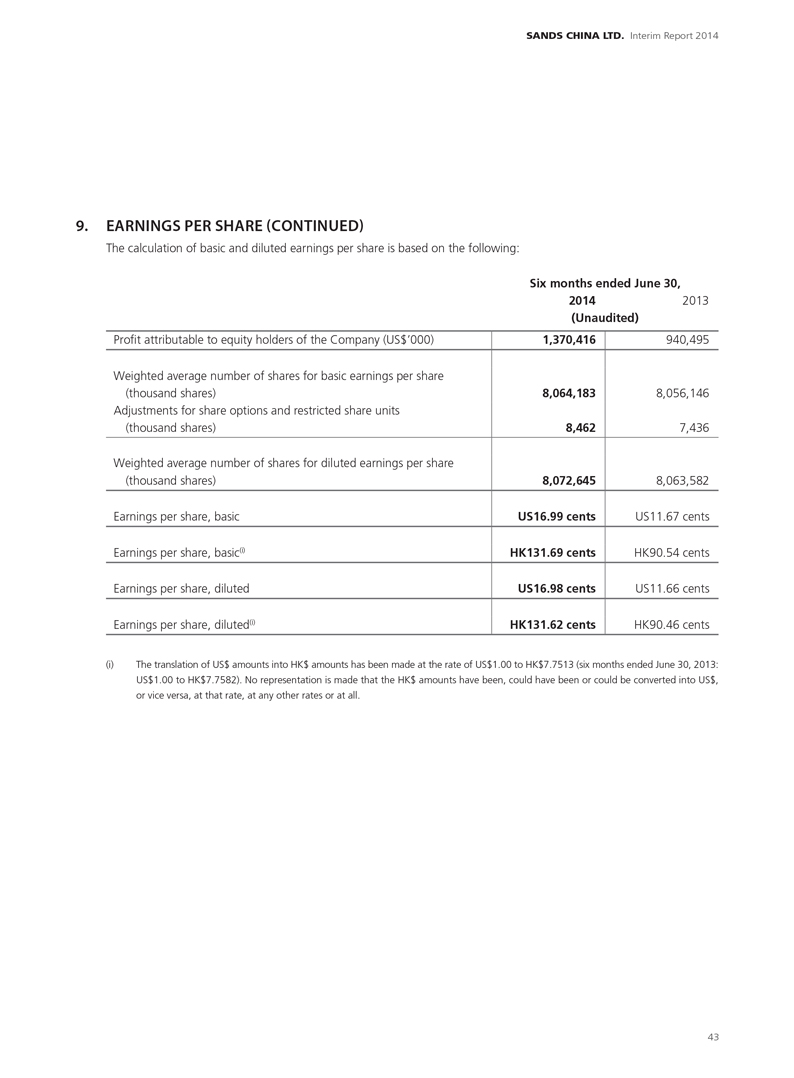
SANDS CHINA LTD. Interim Report 2014
9. EARNINGS PER SHARE (CONTINUED)
The calculation of basic and diluted earnings per share is based on the following:
Six months ended June 30, 2014 2013 (Unaudited)
Profit attributable to equity holders of the Company (US$’000)
Weighted average number of shares for basic earnings per share
(thousand shares)
Adjustments for share options and restricted share units
(thousand shares)
Weighted average number of shares for diluted earnings per share
(thousand shares)
Earnings per share, basic
Earnings per share, basic(i)
Earnings per share, diluted
Earnings per share, diluted(i)
1,370,416
8,064,183
8,462
8,072,645
US16.99 cents
HK131.69 cents
US16.98 cents
HK131.62 cents
940,495
8,056,146
7,436
8,063,582
US11.67 cents
HK90.54 cents
US11.66 cents
HK90.46 cents
(i) The translation of US$ amounts into HK$ amounts has been made at the rate of US$1.00 to HK$7.7513 (six months ended June 30, 2013: US$1.00 to HK$7.7582). No representation is made that the HK$ amounts have been, could have been or could be converted into US$, or vice versa, at that rate, at any other rates or at all.
43
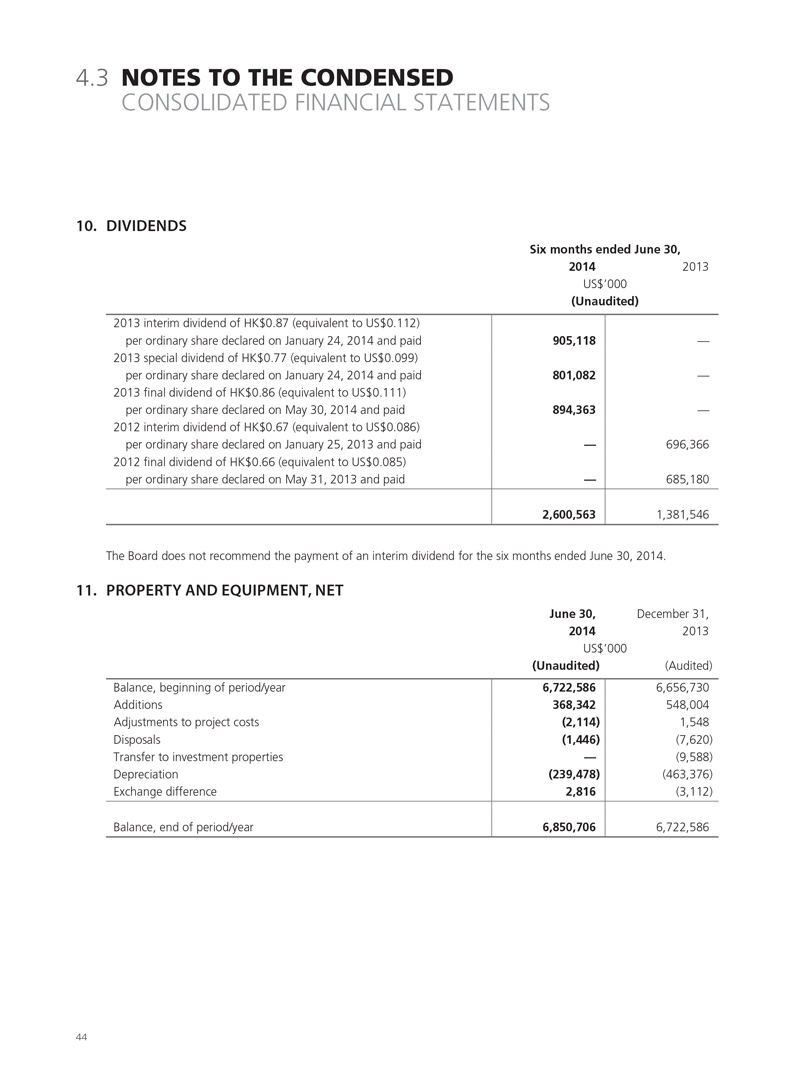
4.3 NOTES TO THE CONDENSED
CONSOLIDATED FINANCIAL STATEMENTS
10. DIVIDENDS
Six months ended June 30, 2014 2013 US$’000
(Unaudited)
2013 interim dividend of HK$0.87 (equivalent to US$0.112)
per ordinary share declared on January 24, 2014 and paid
2013 special dividend of HK$0.77 (equivalent to US$0.099)
per ordinary share declared on January 24, 2014 and paid
2013 final dividend of HK$0.86 (equivalent to US$0.111)
per ordinary share declared on May 30, 2014 and paid
2012 interim dividend of HK$0.67 (equivalent to US$0.086)
per ordinary share declared on January 25, 2013 and paid
2012 final dividend of HK$0.66 (equivalent to US$0.085)
per ordinary share declared on May 31, 2013 and paid
905,118
801,082
894,363
—
—
2,600,563
—
—
—
696,366
685,180
1,381,546
The Board does not recommend the payment of an interim dividend for the six months ended June 30, 2014.
11.
PROPERTY AND EQUIPMENT, NET
June 30,
December 31,
2014
2013
US$’000
Balance, beginning of period/year
Additions
Adjustments to project costs
Disposals
Transfer to investment properties
Depreciation
Exchange difference
Balance, end of period/year
(Unaudited)
6,722,586
368,342
(2,114)
(1,446)
—
(239,478)
2,816
6,850,706
(Audited)
6,656,730
548,004
1,548
(7,620)
(9,588)
(463,376)
(3,112)
6,722,586
44
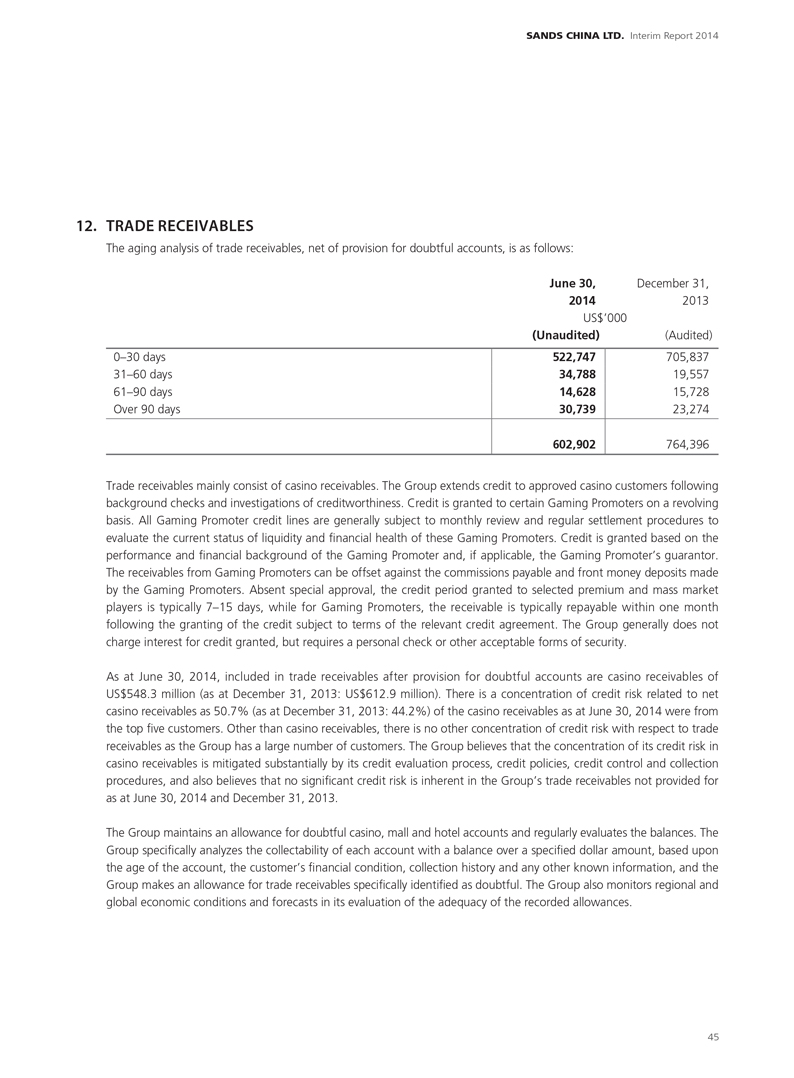
SANDS CHINA LTD. Interim Report 2014
12. TRADE RECEIVABLES
The aging analysis of trade receivables, net of provision for doubtful accounts, is as follows:
June 30, December 31,
2014 2013
US$’000
0–30 days
31–60 days
61–90 days
Over 90 days
(Unaudited)
522,747
34,788
14,628
30,739
602,902
(Audited)
705,837
19,557
15,728
23,274
764,396
Trade receivables mainly consist of casino receivables. The Group extends credit to approved casino customers following background checks and investigations of creditworthiness. Credit is granted to certain Gaming Promoters on a revolving basis. All Gaming Promoter credit lines are generally subject to monthly review and regular settlement procedures to evaluate the current status of liquidity and financial health of these Gaming Promoters. Credit is granted based on the performance and financial background of the Gaming Promoter and, if applicable, the Gaming Promoter’s guarantor. The receivables from Gaming Promoters can be offset against the commissions payable and front money deposits made by the Gaming Promoters. Absent special approval, the credit period granted to selected premium and mass market players is typically 7–15 days, while for Gaming Promoters, the receivable is typically repayable within one month following the granting of the credit subject to terms of the relevant credit agreement. The Group generally does not charge interest for credit granted, but requires a personal check or other acceptable forms of security.
As at June 30, 2014, included in trade receivables after provision for doubtful accounts are casino receivables of US$548.3 million (as at December 31, 2013: US$612.9 million). There is a concentration of credit risk related to net casino receivables as 50.7% (as at December 31, 2013: 44.2%) of the casino receivables as at June 30, 2014 were from the top five customers. Other than casino receivables, there is no other concentration of credit risk with respect to trade receivables as the Group has a large number of customers. The Group believes that the concentration of its credit risk in casino receivables is mitigated substantially by its credit evaluation process, credit policies, credit control and collection procedures, and also believes that no significant credit risk is inherent in the Group’s trade receivables not provided for as at June 30, 2014 and December 31, 2013.
The Group maintains an allowance for doubtful casino, mall and hotel accounts and regularly evaluates the balances. The Group specifically analyzes the collectability of each account with a balance over a specified dollar amount, based upon the age of the account, the customer’s financial condition, collection history and any other known information, and the Group makes an allowance for trade receivables specifically identified as doubtful. The Group also monitors regional and global economic conditions and forecasts in its evaluation of the adequacy of the recorded allowances.
45
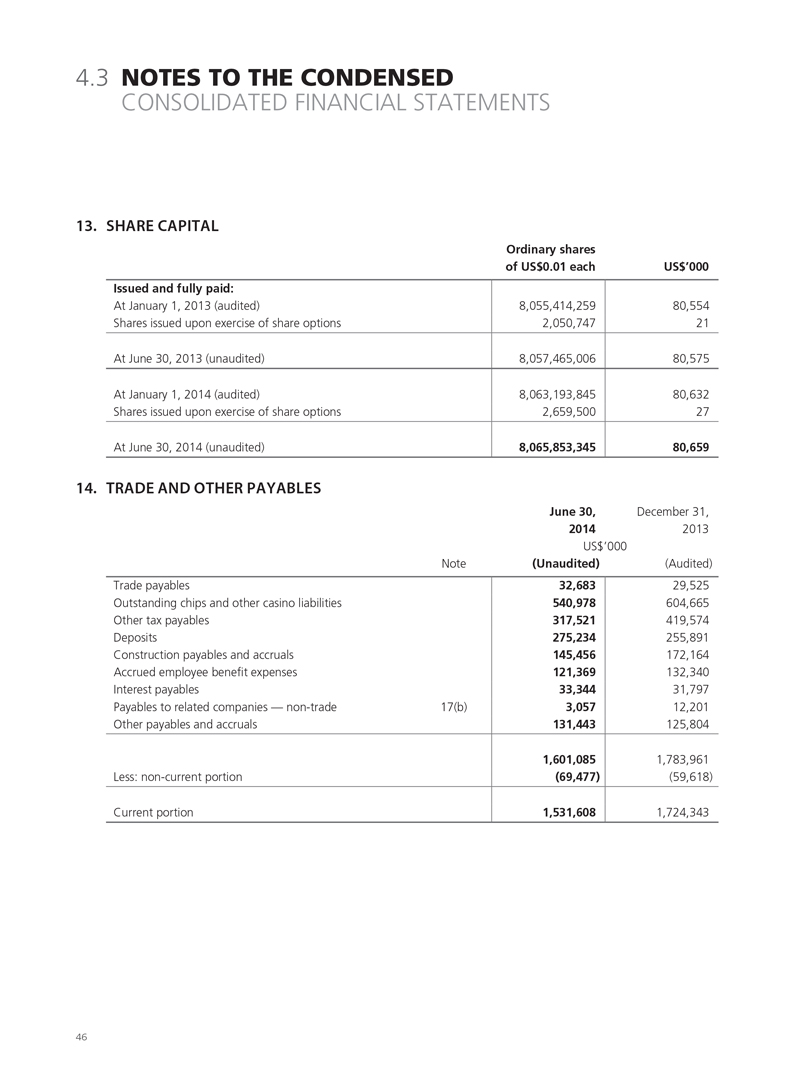
4.3 NOTES TO THE CONDENSED
CONSOLIDATED FINANCIAL STATEMENTS
13. SHARE CAPITAL
Issued and fully paid:
At January 1, 2013 (audited)
Shares issued upon exercise of share options
At June 30, 2013 (unaudited)
At January 1, 2014 (audited)
Shares issued upon exercise of share options
At June 30, 2014 (unaudited)
Ordinary shares
of US$0.01 each
8,055,414,259
2,050,747
8,057,465,006
8,063,193,845
2,659,500
8,065,853,345
US$’000
80,554
21
80,575
80,632
27
80,659
14. TRADE AND OTHER PAYABLES
June 30,
December 31,
2014
2013
US$’000
Trade payables
Outstanding chips and other casino liabilities
Other tax payables
Deposits
Construction payables and accruals
Accrued employee benefit expenses
Interest payables
Payables to related companies — non-trade
Other payables and accruals
Less: non-current portion
Current portion
Note
17(b)
(Unaudited)
32,683
540,978
317,521
275,234
145,456
121,369
33,344
3,057
131,443
1,601,085
(69,477)
1,531,608
(Audited)
29,525
604,665
419,574
255,891
172,164
132,340
31,797
12,201
125,804
1,783,961
(59,618)
1,724,343
46
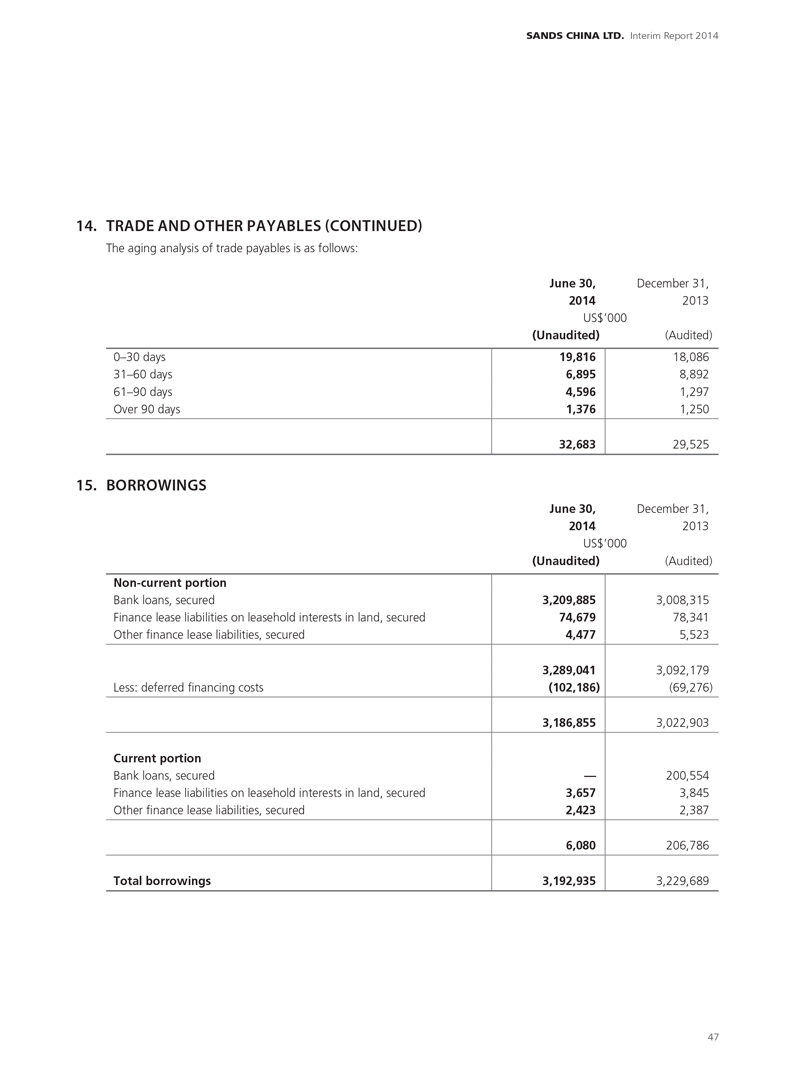
SANDS CHINA LTD. Interim Report 2014
14. TRADE AND OTHER PAYABLES (CONTINUED)
The aging analysis of trade payables is as follows:
June 30,
December 31,
2014
2013
0–30 days
31–60 days
61–90 days
Over 90 days
(Unaudited)
19,816
6,895
4,596
1,376
32,683
(Audited)
18,086
8,892
1,297
1,250
29,525
15. BORROWINGS
June 30,
December 31,
2014
2013
US$’000
Non-current portion
Bank loans, secured
Finance lease liabilities on leasehold interests in land, secured
Other finance lease liabilities, secured
Less: deferred financing costs
Current portion
Bank loans, secured
Finance lease liabilities on leasehold interests in land, secured
Other finance lease liabilities, secured
Total borrowings
(Unaudited)
3,209,885
74,679
4,477
3,289,041
(102,186)
3,186,855
—
3,657
2,423
6,080
3,192,935
(Audited)
3,008,315
78,341
5,523
3,092,179
(69,276)
3,022,903
200,554
3,845
2,387
206,786
3,229,689
47
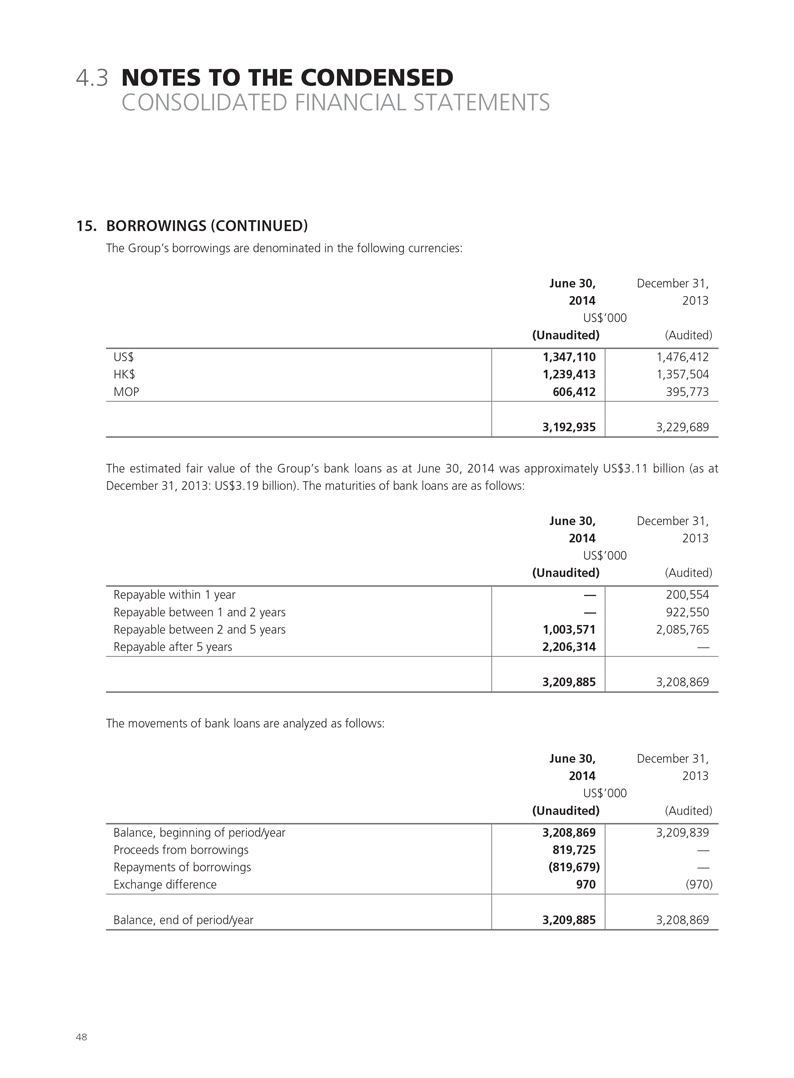
4.3 NOTES TO THE CONDENSED
CONSOLIDATED FINANCIAL STATEMENTS
15. BORROWINGS (CONTINUED)
The Group’s borrowings are denominated in the following currencies:
June 30, December 31,
2014 2013
US$’000
US$
HK$
MOP
(Unaudited)
1,347,110
1,239,413
606,412
3,192,935
(Audited)
1,476,412
1,357,504
395,773
3,229,689
The estimated fair value of the Group’s bank loans as at June 30, 2014 was approximately US$3.11 billion (as at December 31, 2013: US$3.19 billion). The maturities of bank loans are as follows:
June 30, December 31,
2014 2013
US$’000
Repayable within 1 year
Repayable between 1 and 2 years
Repayable between 2 and 5 years
Repayable after 5 years
(Unaudited)
—
—
1,003,571
2,206,314
3,209,885
(Audited)
200,554
922,550
2,085,765
—
3,208,869
The movements of bank loans are analyzed as follows:
June 30,
December 31,
2014
2013
US$’000
Balance, beginning of period/year
Proceeds from borrowings
Repayments of borrowings
Exchange difference
Balance, end of period/year
(Unaudited)
3,208,869
819,725
(819,679)
970
3,209,885
(Audited)
3,209,839
—
—
(970)
3,208,869
48
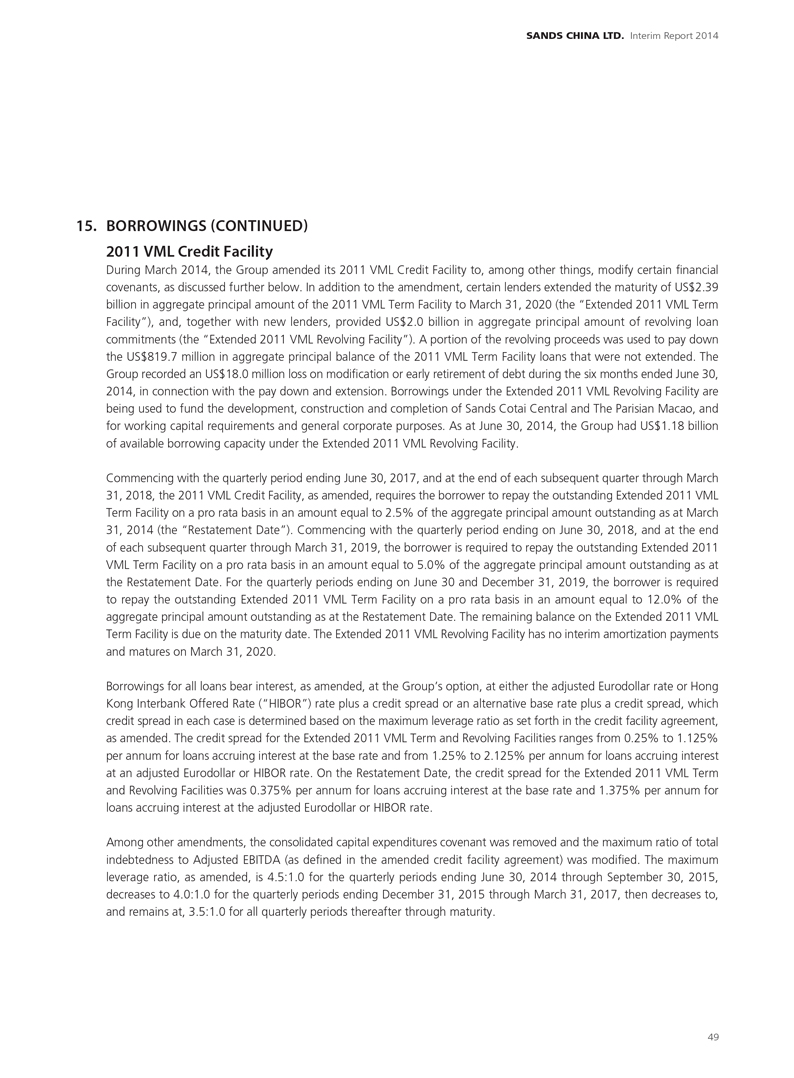
SANDS CHINA LTD. Interim Report 2014
15. BORROWINGS (CONTINUED) 2011 VML Credit Facility
During March 2014, the Group amended its 2011 VML Credit Facility to, among other things, modify certain financial covenants, as discussed further below. In addition to the amendment, certain lenders extended the maturity of US$2.39 billion in aggregate principal amount of the 2011 VML Term Facility to March 31, 2020 (the “Extended 2011 VML Term Facility”), and, together with new lenders, provided US$2.0 billion in aggregate principal amount of revolving loan commitments (the “Extended 2011 VML Revolving Facility”). A portion of the revolving proceeds was used to pay down the US$819.7 million in aggregate principal balance of the 2011 VML Term Facility loans that were not extended. The Group recorded an US$18.0 million loss on modification or early retirement of debt during the six months ended June 30, 2014, in connection with the pay down and extension. Borrowings under the Extended 2011 VML Revolving Facility are being used to fund the development, construction and completion of Sands Cotai Central and The Parisian Macao, and for working capital requirements and general corporate purposes. As at June 30, 2014, the Group had US$1.18 billion of available borrowing capacity under the Extended 2011 VML Revolving Facility.
Commencing with the quarterly period ending June 30, 2017, and at the end of each subsequent quarter through March 31, 2018, the 2011 VML Credit Facility, as amended, requires the borrower to repay the outstanding Extended 2011 VML Term Facility on a pro rata basis in an amount equal to 2.5% of the aggregate principal amount outstanding as at March 31, 2014 (the “Restatement Date”). Commencing with the quarterly period ending on June 30, 2018, and at the end of each subsequent quarter through March 31, 2019, the borrower is required to repay the outstanding Extended 2011 VML Term Facility on a pro rata basis in an amount equal to 5.0% of the aggregate principal amount outstanding as at the Restatement Date. For the quarterly periods ending on June 30 and December 31, 2019, the borrower is required to repay the outstanding Extended 2011 VML Term Facility on a pro rata basis in an amount equal to 12.0% of the aggregate principal amount outstanding as at the Restatement Date. The remaining balance on the Extended 2011 VML Term Facility is due on the maturity date. The Extended 2011 VML Revolving Facility has no interim amortization payments and matures on March 31, 2020.
Borrowings for all loans bear interest, as amended, at the Group’s option, at either the adjusted Eurodollar rate or Hong Kong Interbank Offered Rate (“HIBOR”) rate plus a credit spread or an alternative base rate plus a credit spread, which credit spread in each case is determined based on the maximum leverage ratio as set forth in the credit facility agreement, as amended. The credit spread for the Extended 2011 VML Term and Revolving Facilities ranges from 0.25% to 1.125% per annum for loans accruing interest at the base rate and from 1.25% to 2.125% per annum for loans accruing interest at an adjusted Eurodollar or HIBOR rate. On the Restatement Date, the credit spread for the Extended 2011 VML Term and Revolving Facilities was 0.375% per annum for loans accruing interest at the base rate and 1.375% per annum for loans accruing interest at the adjusted Eurodollar or HIBOR rate.
Among other amendments, the consolidated capital expenditures covenant was removed and the maximum ratio of total indebtedness to Adjusted EBITDA (as defined in the amended credit facility agreement) was modified. The maximum leverage ratio, as amended, is 4.5:1.0 for the quarterly periods ending June 30, 2014 through September 30, 2015, decreases to 4.0:1.0 for the quarterly periods ending December 31, 2015 through March 31, 2017, then decreases to, and remains at, 3.5:1.0 for all quarterly periods thereafter through maturity.
49
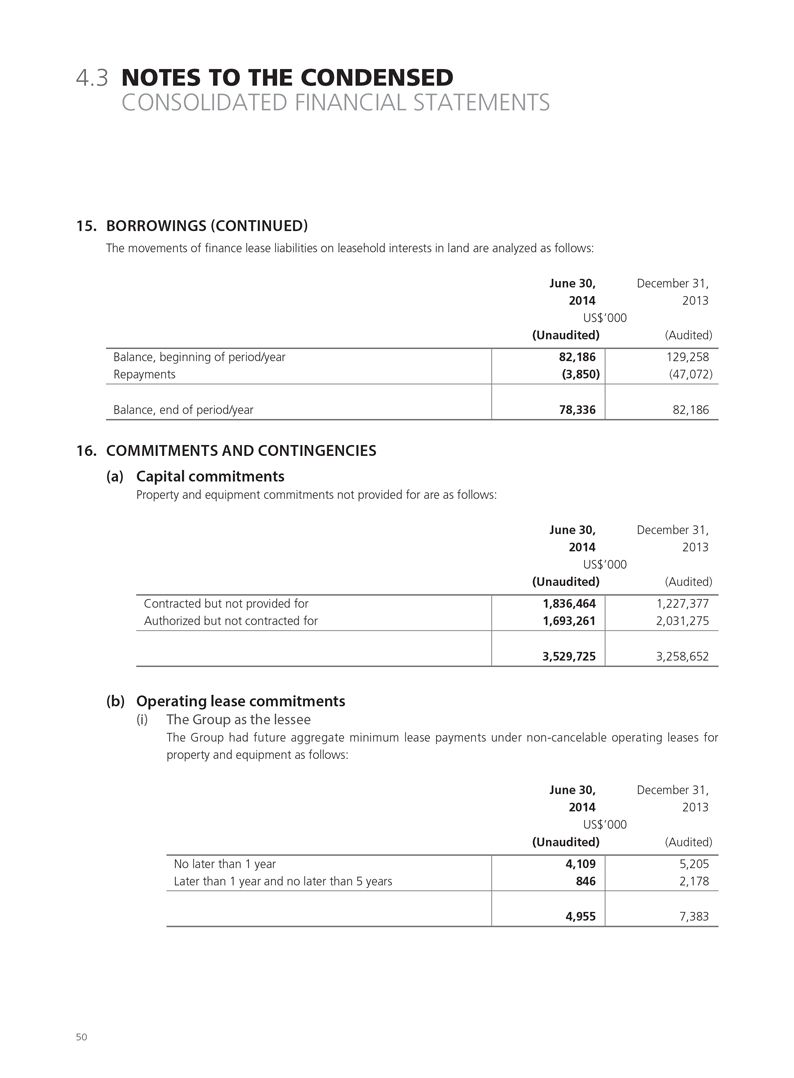
4.3 NOTES TO THE CONDENSED
CONSOLIDATED FINANCIAL STATEMENTS
15. BORROWINGS (CONTINUED)
The movements of finance lease liabilities on leasehold interests in land are analyzed as follows:
June 30,
December 31,
2014
2013
US$’000
Balance, beginning of period/year
Repayments
Balance, end of period/year
(Unaudited)
82,186
(3,850)
78,336
(Audited)
129,258
(47,072)
82,186
16. COMMITMENTS AND CONTINGENCIES (a) Capital commitments
Property and equipment commitments not provided for are as follows:
June 30,
December 31,
2014
2013
US$’000
Contracted but not provided for Authorized but not contracted for
(Unaudited)
1,836,464
1,693,261
3,529,725
(Audited)
1,227,377
2,031,275
3,258,652
(b) Operating lease commitments
(i) The Group as the lessee
The Group had future aggregate minimum lease payments under non-cancelable operating leases for property and equipment as follows:
June 30, December 31,
2014 2013
US$’000
No later than 1 year
Later than 1 year and no later than 5 years
(Unaudited)
4,109
846
4,955
(Audited)
5,205
2,178
7,383
50
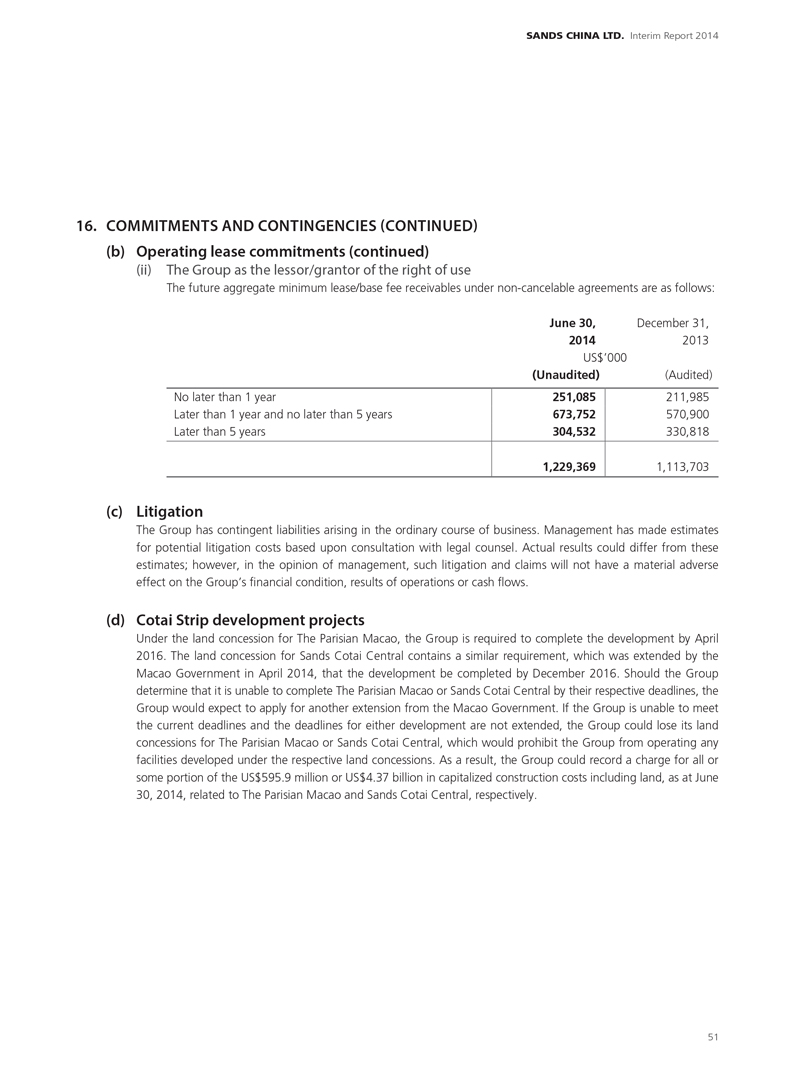
SANDS CHINA LTD. Interim Report 2014
16. COMMITMENTS AND CONTINGENCIES (CONTINUED) (b) Operating lease commitments (continued)
(ii) The Group as the lessor/grantor of the right of use
The future aggregate minimum lease/base fee receivables under non-cancelable agreements are as follows:
No later than 1 year
Later than 1 year and no later than 5 years Later than 5 years
June 30,
December 31,
2014
2013
US$’000
(Unaudited)
251,085 673,752 304,532
1,229,369
(Audited)
211,985 570,900 330,818
1,113,703
(c) Litigation
The Group has contingent liabilities arising in the ordinary course of business. Management has made estimates for potential litigation costs based upon consultation with legal counsel. Actual results could differ from these estimates; however, in the opinion of management, such litigation and claims will not have a material adverse effect on the Group’s financial condition, results of operations or cash flows.
(d) Cotai Strip development projects
Under the land concession for The Parisian Macao, the Group is required to complete the development by April 2016. The land concession for Sands Cotai Central contains a similar requirement, which was extended by the Macao Government in April 2014, that the development be completed by December 2016. Should the Group determine that it is unable to complete The Parisian Macao or Sands Cotai Central by their respective deadlines, the Group would expect to apply for another extension from the Macao Government. If the Group is unable to meet the current deadlines and the deadlines for either development are not extended, the Group could lose its land concessions for The Parisian Macao or Sands Cotai Central, which would prohibit the Group from operating any facilities developed under the respective land concessions. As a result, the Group could record a charge for all or some portion of the US$595.9 million or US$4.37 billion in capitalized construction costs including land, as at June 30, 2014, related to The Parisian Macao and Sands Cotai Central, respectively.
51
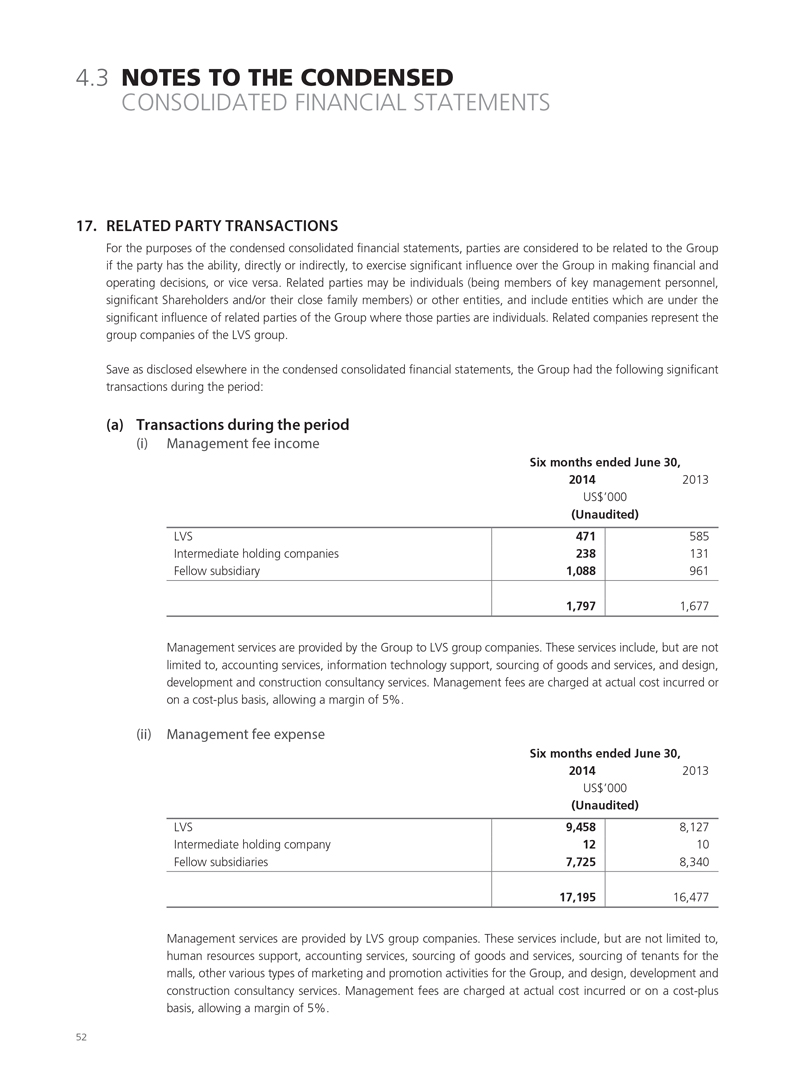
4.3 NOTES TO THE CONDENSED
CONSOLIDATED FINANCIAL STATEMENTS
17. RELATED PARTY TRANSACTIONS
For the purposes of the condensed consolidated financial statements, parties are considered to be related to the Group if the party has the ability, directly or indirectly, to exercise significant influence over the Group in making financial and operating decisions, or vice versa. Related parties may be individuals (being members of key management personnel, significant Shareholders and/or their close family members) or other entities, and include entities which are under the significant influence of related parties of the Group where those parties are individuals. Related companies represent the group companies of the LVS group.
Save as disclosed elsewhere in the condensed consolidated financial statements, the Group had the following significant transactions during the period:
(a) Transactions during the period
(i) Management fee income
Six months ended June 30, 2014 2013 US$’000
(Unaudited)
LVS
Intermediate holding companies Fellow subsidiary
471
238
1,088
1,797
585
131
961
1,677
Management services are provided by the Group to LVS group companies. These services include, but are not limited to, accounting services, information technology support, sourcing of goods and services, and design, development and construction consultancy services. Management fees are charged at actual cost incurred or on a cost-plus basis, allowing a margin of 5%.
(ii) Management fee expense
Six months ended June 30, 2014 2013 US$’000
(Unaudited)
LVS
Intermediate holding company Fellow subsidiaries
9,458
12
7,725
17,195
8,127
10
8,340
16,477
Management services are provided by LVS group companies. These services include, but are not limited to, human resources support, accounting services, sourcing of goods and services, sourcing of tenants for the malls, other various types of marketing and promotion activities for the Group, and design, development and construction consultancy services. Management fees are charged at actual cost incurred or on a cost-plus basis, allowing a margin of 5%.
52
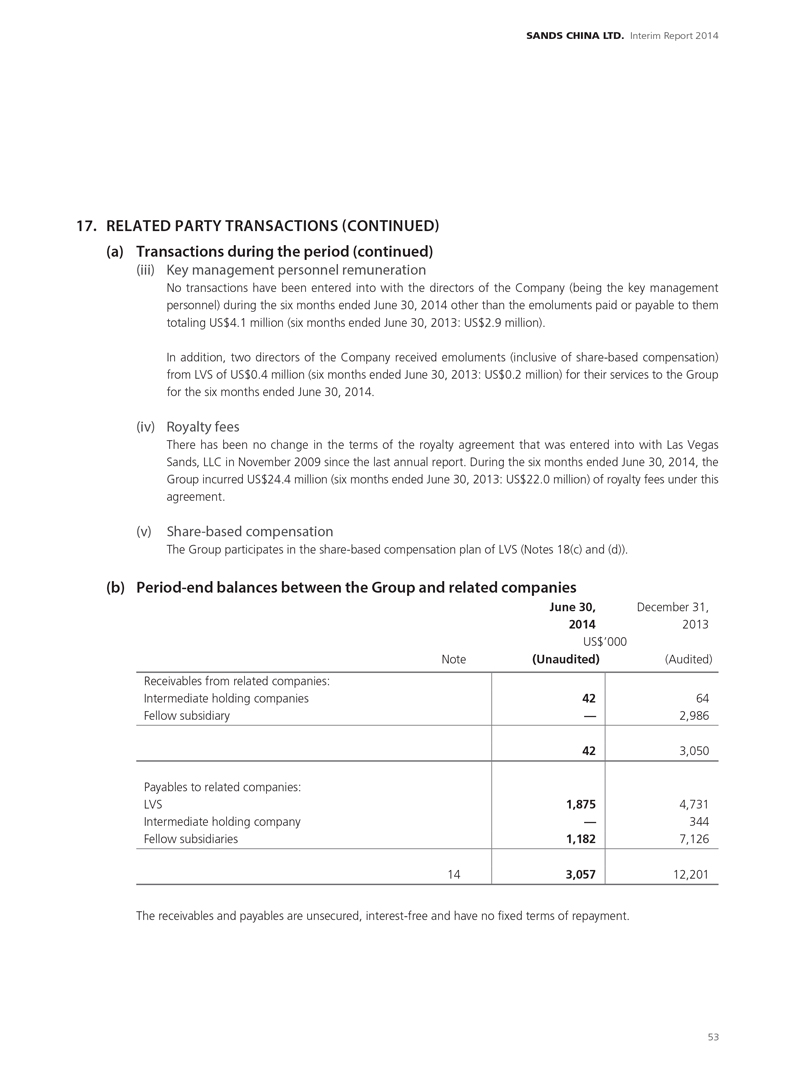
SANDS CHINA LTD. Interim Report 2014
17. RELATED PARTY TRANSACTIONS (CONTINUED) (a) Transactions during the period (continued)
(iii) Key management personnel remuneration
No transactions have been entered into with the directors of the Company (being the key management personnel) during the six months ended June 30, 2014 other than the emoluments paid or payable to them totaling US$4.1 million (six months ended June 30, 2013: US$2.9 million).
In addition, two directors of the Company received emoluments (inclusive of share-based compensation) from LVS of US$0.4 million (six months ended June 30, 2013: US$0.2 million) for their services to the Group for the six months ended June 30, 2014.
(iv) Royalty fees
There has been no change in the terms of the royalty agreement that was entered into with Las Vegas Sands, LLC in November 2009 since the last annual report. During the six months ended June 30, 2014, the Group incurred US$24.4 million (six months ended June 30, 2013: US$22.0 million) of royalty fees under this agreement.
(v) Share-based compensation
The Group participates in the share-based compensation plan of LVS (Notes 18(c) and (d)).
(b) Period-end balances between the Group and related companies
June 30, December 31,
2014 2013 US$’000
Receivables from related companies:
Intermediate holding companies
Fellow subsidiary
Payables to related companies:
LVS
Intermediate holding company
Fellow subsidiaries
Note
14
(Unaudited)
42
—
42
1,875
—
1,182
3,057
(Audited)
64
2,986
3,050
4,731
344
7,126
12,201
The receivables and payables are unsecured, interest-free and have no fixed terms of repayment.
53
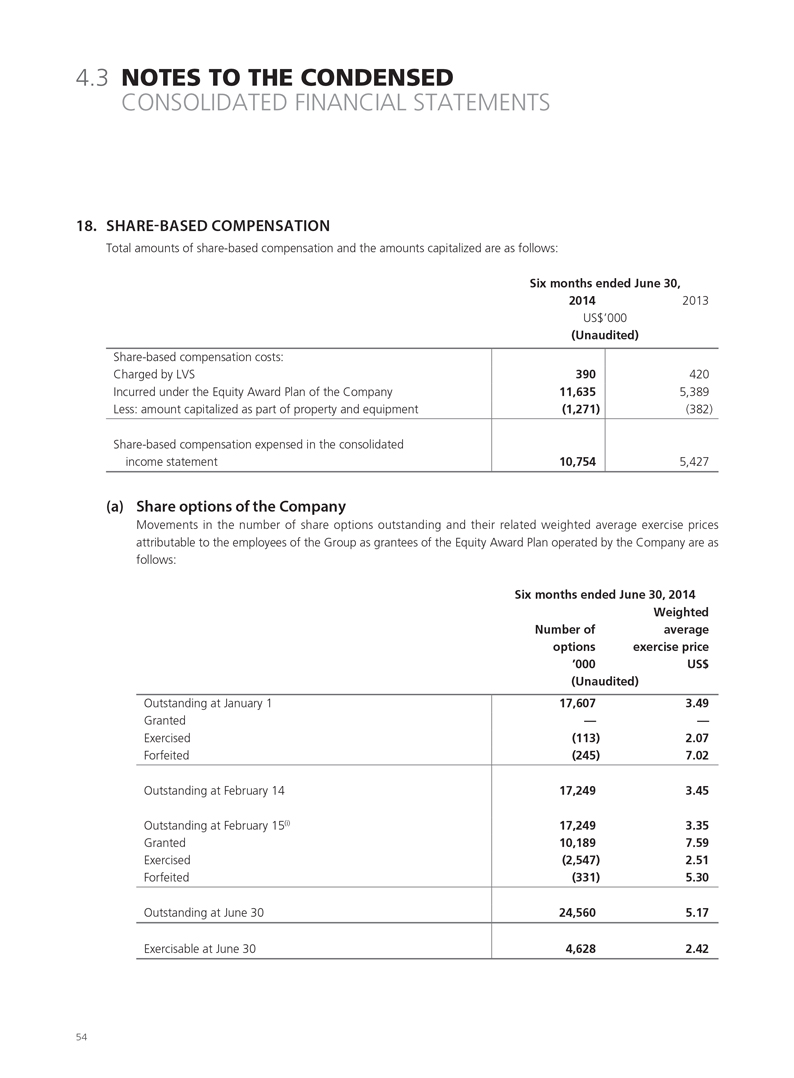
4.3 NOTES TO THE CONDENSED
CONSOLIDATED FINANCIAL STATEMENTS
18. SHARE-BASED COMPENSATION
Total amounts of share-based compensation and the amounts capitalized are as follows:
Six months ended June 30, 2014 2013 US$’000
(Unaudited)
Share-based compensation costs:
Charged by LVS
Incurred under the Equity Award Plan of the Company
Less: amount capitalized as part of property and equipment
Share-based compensation expensed in the consolidated
income statement
390
11,635
(1,271)
10,754
420
5,389
(382)
5,427
(a) Share options of the Company
Movements in the number of share options outstanding and their related weighted average exercise prices attributable to the employees of the Group as grantees of the Equity Award Plan operated by the Company are as follows:
Six months ended June 30, 2014
Outstanding at January 1 Granted Exercised Forfeited
Outstanding at February 14
Outstanding at February 15(i) Granted Exercised Forfeited
Outstanding at June 30
Exercisable at June 30
(Unaudited)
Number of
options
’000
17,607
—
(113)
(245)
17,249
17,249
10,189
(2,547)
(331)
24,560
4,628
Weighted
average
exercise price
US$
3.49
—
2.07
7.02
3.45
3.35
7.59
2.51
5.30
5.17
2.42
54
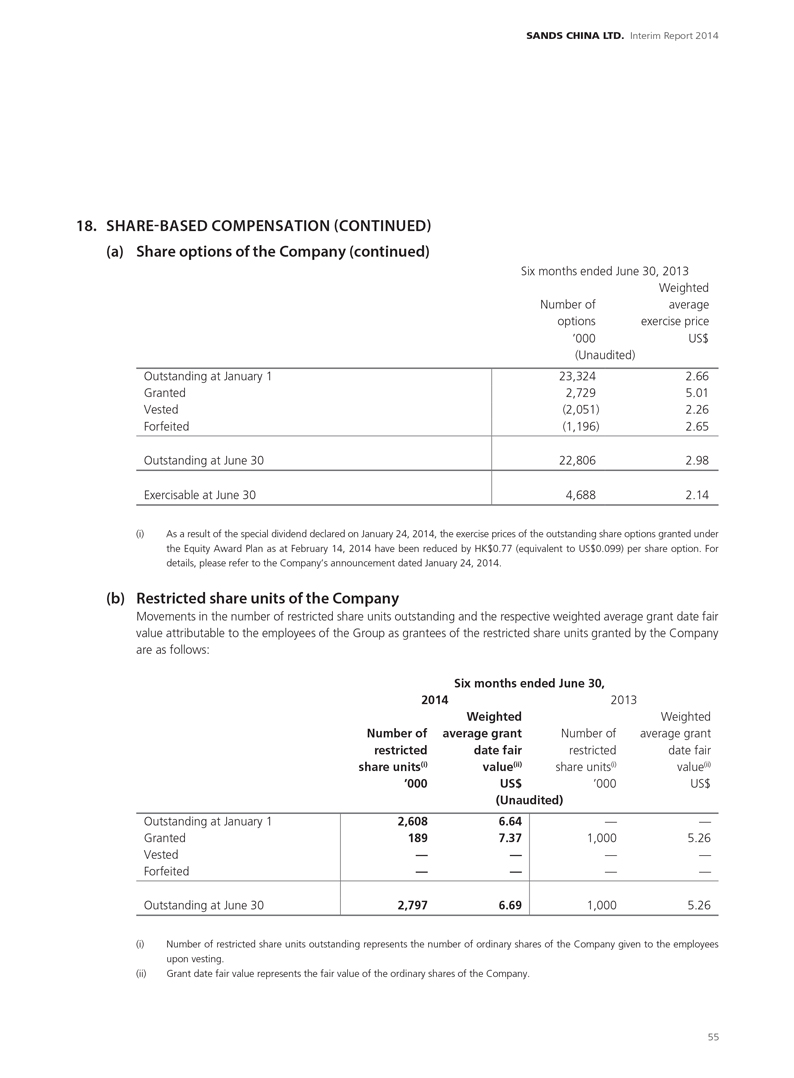
SANDS CHINA LTD. Interim Report 2014
18. SHARE-BASED COMPENSATION (CONTINUED) (a) Share options of the Company (continued)
Six months ended June 30, 2013
(Unaudited)
Outstanding at January 1
Granted
Vested
Forfeited
Outstanding at June 30
Exercisable at June 30
Number of
options
’000
23,324
2,729
(2,051)
(1,196)
22,806
4,688
Weighted
average
exercise price
US$
2.66
5.01
2.26
2.65
2.98
2.14
(i) As a result of the special dividend declared on January 24, 2014, the exercise prices of the outstanding share options granted under the Equity Award Plan as at February 14, 2014 have been reduced by HK$0.77 (equivalent to US$0.099) per share option. For details, please refer to the Company’s announcement dated January 24, 2014.
(b) Restricted share units of the Company
Movements in the number of restricted share units outstanding and the respective weighted average grant date fair value attributable to the employees of the Group as grantees of the restricted share units granted by the Company are as follows:
Six months ended June 30,
2014
2013
Outstanding at January 1
Granted
Vested
Forfeited
Outstanding at June 30
Number of
restricted
share units(i)
’000
2,608
189
—
—
2,797
Weighted
average grant
date fair
value(ii)
US$
6.64
7.37
—
—
6.69
Number of
restricted
share units(i)
’000
—
1,000
—
—
1,000
Weighted
average grant
date fair
value(ii)
US$
—
5.26
—
(unaudited)
—
5.26
(i)
Number of restricted share units outstanding represents the number of ordinary shares of the Company given to the employees
upon vesting.
(ii)
Grant date fair value represents the fair value of the ordinary shares of the Company.
55
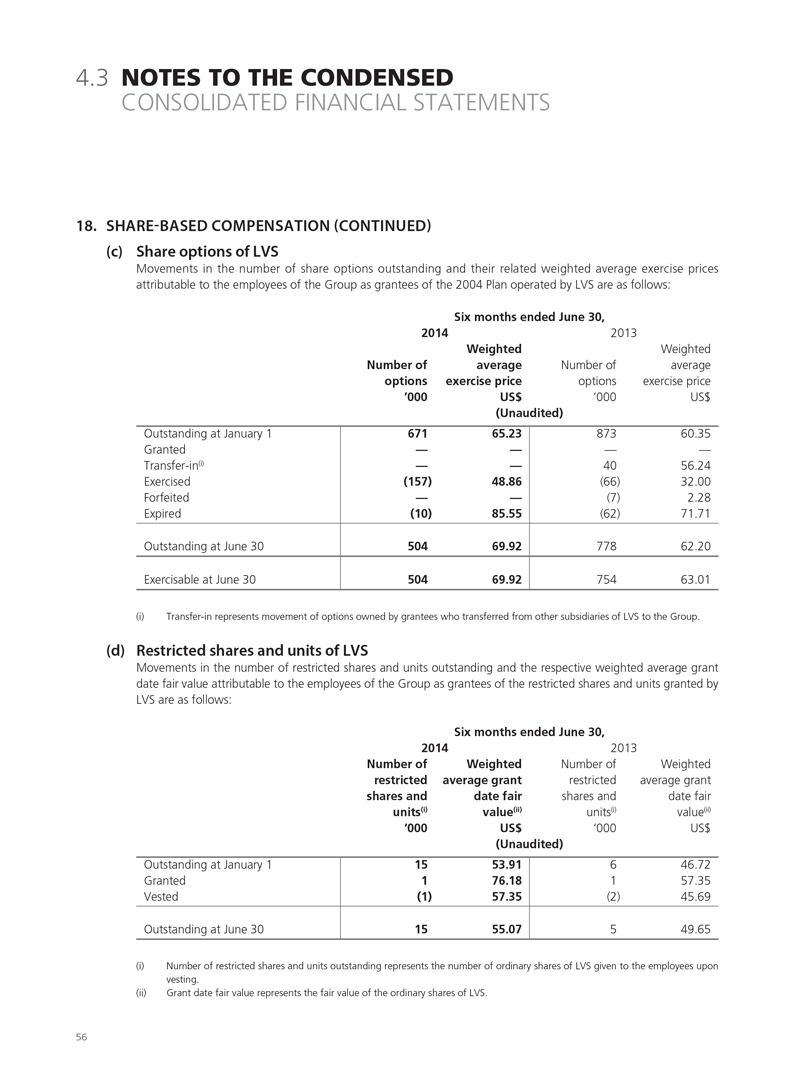
4.3 NOTES TO THE CONDENSED
CONSOLIDATED FINANCIAL STATEMENTS
18. SHARE-BASED COMPENSATION (CONTINUED) (c) Share options of LVS
Movements in the number of share options outstanding and their related weighted average exercise prices attributable to the employees of the Group as grantees of the 2004 Plan operated by LVS are as follows:
Six months ended June 30,
2014
2013
Outstanding at January 1 Granted Transfer-in(i) Exercised Forfeited Expired
Outstanding at June 30
Exercisable at June 30
Number of
options
’000
671
—
—
(157)
—
(10)
504
504
Weighted
average
exercise price
US$
65.23
—
—
48.86
—
85.55
69.92
69.92
Number of
options
’000
873
—
40
(66)
(7)
(62)
778
754
Weighted average exercise price US$
60.35 —
56.24
32.00
2.28
71.71
62.20
63.01
(Unaudited)
(i) Transfer-in represents movement of options owned by grantees who transferred from other subsidiaries of LVS to the Group.
(d) Restricted shares and units of LVS
Movements in the number of restricted shares and units outstanding and the respective weighted average grant date fair value attributable to the employees of the Group as grantees of the restricted shares and units granted by LVS are as follows:
Six months ended June 30,
2014
2013
Outstanding at January 1
Granted
Vested
Outstanding at June 30
Number of
restricted
shares and
units(i)
’000
15
1
(1)
15
Weighted
average grant
date fair
value(ii)
US$
(Unaudited)
53.91
76.18
57.35
55.07
Number of
restricted
shares and
units(i)
’000
6
1
(2)
5
Weighted
average grant
date fair
value(ii)
US$
46.72
57.35
45.69
49.65
(i) Number of restricted shares and units outstanding represents the number of ordinary shares of LVS given to the employees upon vesting.
(ii) Grant date fair value represents the fair value of the ordinary shares of LVS.
56
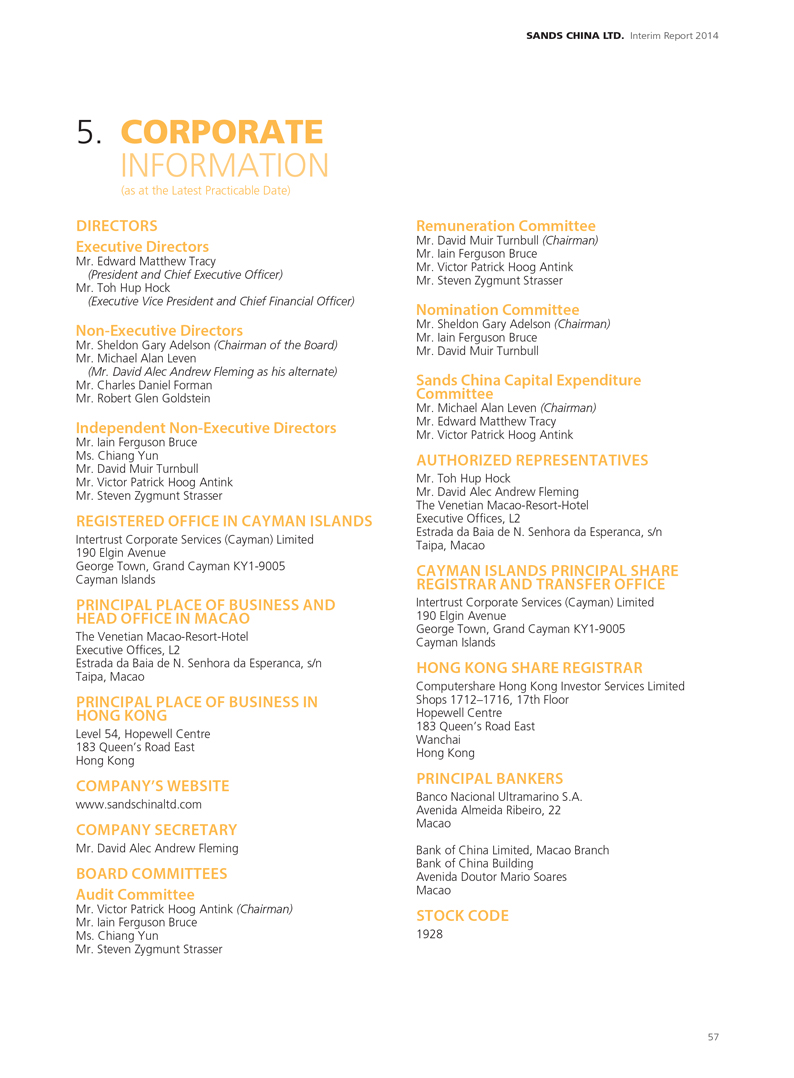
SANDS CHINA LTD. Interim Report 2014
5. CORPORATE
INFORMATION
(as at the Latest Practicable Date)
DIRECTORS
Executive Directors
Mr. Edward Matthew Tracy
(President and Chief Executive Officer)
Mr. Toh Hup Hock
(Executive Vice President and Chief Financial Officer)
Non-Executive Directors
Mr. Sheldon Gary Adelson (Chairman of the Board)
Mr. Michael Alan Leven
(Mr. David Alec Andrew Fleming as his alternate)
Mr. Charles Daniel Forman
Mr. Robert Glen Goldstein
Independent Non-Executive Directors
Mr. Iain Ferguson Bruce
Ms. Chiang Yun
Mr. David Muir Turnbull
Mr. Victor Patrick Hoog Antink
Mr. Steven Zygmunt Strasser
REGISTERED OFFICE IN CAYMAN ISLANDS
Intertrust Corporate Services (Cayman) Limited
190 Elgin Avenue
George Town, Grand Cayman KY1-9005
Cayman Islands
PRINCIPAL PLACE OF BUSINESS AND
HEAD OFFICE IN MACAO
The Venetian Macao-Resort-Hotel
Executive Offices, L2
Estrada da Baia de N. Senhora da Esperanca, s/n
Taipa, Macao
PRINCIPAL PLACE OF BUSINESS IN
HONG KONG
Level 54, Hopewell Centre
183 Queen’s Road East
Hong Kong
COMPANY’S WEBSITE
www.sandschinaltd.com
COMPANY SECRETARY
Mr. David Alec Andrew Fleming
BOARD COMMITTEES
Audit Committee
Mr. Victor Patrick Hoog Antink (Chairman)
Mr. Iain Ferguson Bruce
Ms. Chiang Yun
Mr. Steven Zygmunt Strasser
Remuneration Committee
Mr. David Muir Turnbull (Chairman) Mr. Iain Ferguson Bruce Mr. Victor Patrick Hoog Antink Mr. Steven Zygmunt Strasser
Nomination Committee
Mr. Sheldon Gary Adelson (Chairman) Mr. Iain Ferguson Bruce Mr. David Muir Turnbull
Sands China Capital Expenditure Committee
Mr. Michael Alan Leven (Chairman) Mr. Edward Matthew Tracy Mr. Victor Patrick Hoog Antink
AUTHORIZED REPRESENTATIVES
Mr. Toh Hup Hock
Mr. David Alec Andrew Fleming The Venetian Macao-Resort-Hotel Executive Offices, L2
Estrada da Baia de N. Senhora da Esperanca, s/n Taipa, Macao
CAYMAN ISLANDS PRINCIPAL SHARE REGISTRAR AND TRANSFER OFFICE
Intertrust Corporate Services (Cayman) Limited 190 Elgin Avenue George Town, Grand Cayman KY1-9005 Cayman Islands
HONG KONG SHARE REGISTRAR
Computershare Hong Kong Investor Services Limited Shops 1712–1716, 17th Floor Hopewell Centre 183 Queen’s Road East Wanchai Hong Kong
PRINCIPAL BANKERS
Banco Nacional Ultramarino S.A. Avenida Almeida Ribeiro, 22 Macao
Bank of China Limited, Macao Branch Bank of China Building Avenida Doutor Mario Soares Macao
STOCK CODE
1928
57
6. CONTACT US
INTERIM REPORT
This 2014 Interim Report is printed in English and Chinese languages and is available on our website at www.sandschinaltd.com and was posted to Shareholders.
Those Shareholders who received our 2014 Interim Report electronically and would like to receive a printed copy or vice versa may at any time change their means of receipt of the Company’s corporate communications free of charge by reasonable notice in writing to the Company c/o the Hong Kong Share Registrar by post at Computershare Hong Kong Investor Services Limited, 17M Floor, Hopewell Centre, 183 Queen’s Road East, Wanchai, Hong Kong or by email to sandschina.ecom@computershare.com.hk.
Those Shareholders who have chosen to receive this 2014 Interim Report by electronic means and who, for any reason, have difficulty in receiving or gaining access to this 2014 Interim Report, may also request to be sent a copy of this 2014 Interim Report in printed form free of charge by submitting a written request to the Company c/o the Hong Kong Share Registrar by post or by email.
HONG KONG SHARE REGISTRAR
Computershare Hong Kong Investor Services Limited
Address: Telephone: Facsimile: Email:
Shops 1712–1716, 17th Floor, Hopewell Centre, 183 Queen’s Road East, Wanchai, Hong Kong +852 2862 8628 +852 2865 0990 hkinfo@computershare.com.hk
CONTACT US
Address: Telephone: Facsimile: Email:
Level 54, Hopewell Centre, 183 Queen’s Road East, Hong Kong +853 8118 2888 +853 2888 3382 scl-enquiries@sands.com.mo
58
SANDS CHINA LTD. Interim Report 2014
7. GLOSSARY
“adjusted EBITDA”
adjusted EBITDA is profit before share-based compensation, corporate expense, pre-opening expense, depreciation and amortization, net foreign exchange gains or losses, gain or loss on disposal of property and equipment and investment properties, fair value gains or losses on financial assets at fair value through profit or loss, interest, loss on modification or early retirement of debt and income tax expense. With respect to adjusted EBITDA for each of our properties, we make allocations of the shared support expenses based on revenue attributable to each property. Adjusted EBITDA is used by management as the primary measure of operating performance of our Group’s properties and to compare the operating performance of our Group’s properties with that of its competitors. However, adjusted EBITDA should not be considered in isolation; construed as an alternative to profit or operating profit; as an indicator of our IFRS operating performance, other combined operations or cash flow data; or as an alternative to cash flow as a measure of liquidity. Adjusted EBITDA presented in the report may not be comparable to other similarly titled measures of other companies. In addition, our adjusted EBITDA presented in the report may differ from adjusted EBITDA presented by LVS for its Macao segment in its filings with the U.S. Securities and Exchange Commission
“ADR”
the average daily rate per occupied room in a given time period, calculated as room revenue divided by the number of rooms sold
“Board”
the board of directors of the Company
“cage”
a secure room within a casino with a facility that allows patrons to exchange cash for chips required to participate in gaming activities, or to exchange chips for cash
“CAGR”
compound annual growth rate
“casino(s)”
a gaming facility that provides casino games consisting of table games operated in VIP areas or mass market areas, electronic games, slot machines and other casino games
“Chief Executive”
a person who either alone or together with one or more other persons is or will be responsible under the immediate authority of the board of directors for the conduct of the business of the Company
“China” or the “PRC”
the People’s Republic of China excluding, for the purpose of this report only, Hong Kong, Macao and Taiwan, unless the context otherwise requires
“chip(s)”
tokens issued by a casino to players in exchange for cash or credit, which may be used to place bets on gaming tables, in lieu of cash
“Company,” “our,” “we,” “us,” or “Sands China”
Sands China Ltd., a company incorporated in the Cayman Islands on July 15, 2009 as an exempted company with limited liability and, except where the context otherwise requires, all of its subsidiaries, or where the context refers to the time before it became the holding company of its present subsidiaries, its present subsidiaries. When used in the context of gaming operations or the Subconcession, “we,” “us,” or “our” refers exclusively to VML
59
7. GLOSSARY
“Concessionaire(s)”
the holder(s) of a concession for the operation of casino games in the MSAR. As at the Latest Practicable Date, the Concessionaires were Galaxy, SJM and Wynn Macau
“Controlling Shareholder(s)”
has the meaning ascribed to it under the Listing Rules and, with respect to our Company, the controlling Shareholders as referred to in “Relationship with Our Controlling Shareholders” of our Prospectus
“Cotai”
the name given to the land reclamation area in the MSAR between the islands of Coloane and Taipa
“Cotai Strip”
integrated resort projects on Cotai being developed by us and inspired by the Las Vegas Strip in Las Vegas, Nevada, U.S.A. LVS has registered the Cotai Strip trademark in Hong Kong and Macao
“Cotai Strip Resorts Macao”
the name given to our integrated resorts on Cotai
“DICJ”
Gaming Inspection and Coordination Bureau (“Direcção de Inspecção e Coordenação de Jogos”) under the Secretary for Economy and Finance of the MSAR
“Director(s)”
member(s) of the board of directors of the Company
“DSEC”
the Statistics and Census Service of the MSAR
“Deloitte”
Deloitte Touche Tohmatsu
“EBITDA”
earnings before interest, taxes, depreciation and amortization
“Equity Award Plan”
the Equity Award Plan conditionally adopted by our Company on November 8, 2009
“Exchange Rate”
save as otherwise stated, amounts denominated in U.S. dollars, MOP and Hong Kong dollars have been converted, for the purposes of illustration only, in this report at:
US$1.00: HK$7.7513 US$1.00: MOP7.9839 HK$1.00: MOP1.03
“Four Seasons Hotel”
refers to the Four Seasons Hotel Macao, Cotai Strip®, which is managed and operated by FS Macau Lda., an affiliate of Four Seasons Hotels Limited
“Galaxy”
Galaxy Casino S.A. (also known as Galaxy Casino Company Limited), a company incorporated in Macao on November 30, 2001 and one of the three Concessionaires
“gaming area(s)”
a gaming facility that provides casino games consisting of table games operated in VIP areas or mass market areas, electronic games, slot machines and other casino games but has not been designated as a casino by the Macao Government
60
SANDS CHINA LTD. Interim Report 2014
“Gaming Promoter(s)”
individuals or corporations licensed by and registered with the Macao Government to promote games of fortune and chance to patrons, through the arrangement of certain services, including extension of credit (regulated by Law No. 5/2004), transportation, accommodation, dining and entertainment, whose activity is regulated by Administrative Regulation No. 6/2002
“GDP”
gross domestic product
“Global Offering”
the offer of Shares in the Company by subscription for cash at HK$10.38 on November 30, 2009 on and subject to the terms outlined in the Prospectus
“Group”
our Company and its subsidiaries and, in respect of the period before our Company became the holding company of such subsidiaries, the entities that carried on the business of the present Group at the relevant time
“HIBOR”
the Hong Kong Interbank Offered Rate
“HK$” or “HK dollars”
Hong Kong dollars, the lawful currency of Hong Kong
“Hong Kong”
the Hong Kong Special Administrative Region of the PRC
“IFRS”
International Financial Reporting Standards
“integrated resort(s)”
a resort which provides customers with a combination of hotel accommodations, casinos or gaming areas, retail and dining facilities, MICE space, entertainment venues and spas
“Latest Practicable Date”
August 22, 2014
“LIBOR”
London Interbank Offered Rate
“Listing”
the listing of the Shares on the Main Board on November 30, 2009
“Listing Date”
November 30, 2009, the date on which dealings in the Shares first commenced on the Main Board
“Listing Rules”
the Rules Governing the Listing of Securities on the Stock Exchange (as amended from time to time)
“LVS”
Las Vegas Sands Corp., a company incorporated in Nevada, U.S.A. in August 2004 and the common stock of which is listed on the New York Stock Exchange
“LVS Group”
LVS and its subsidiaries (excluding our Group)
“Macao” or “MSAR”
the Macao Special Administrative Region of the PRC
“Macao Government”
the local government of the MSAR, established on December 20, 1999 and the local administration before this date
61
7. GLOSSARY
“Main Board”
the stock exchange (excluding the option market) operated by the Stock Exchange which is independent of and operated in parallel with the Growth Enterprise Market of the Stock Exchange
“mass market player(s)”
“Melco Crown”
“MGM Grand Paradise”
“MICE”
“MOP” or “pataca(s)”
“Parcel 1”
“Parcel 2”
“Parcel 3”
“Parcels 5 and 6”
“premium player(s)”
“Prospectus”
“Reporting Period”
“RMB” or “Renminbi”
“Rolling Chip play”
“Rolling Chip volume”
Non-Rolling Chip players
Melco Crown Jogos (Macau), S.A., a private company limited by shares (“sociedade anónima”)
incorporated on May 10, 2006 under the laws of Macao and one of the three Subconcessionaires
MGM Grand Paradise, S.A. (also known as MGM Grand Paradise Limited), a private company
limited by shares (“sociedade anónima”) incorporated on June 17, 2004 under the laws of Macao
and one of the three Subconcessionaires
Meetings, Incentives, Conventions and Exhibitions, an acronym commonly used to refer to
tourism involving large groups brought together for an event or corporate meeting
Macao pataca, the lawful currency of Macao
a land parcel in Cotai totaling 291,479 square meters described under Registration No. 23225 by
the Macau Property Registry, on which The Venetian Macao has been constructed
a land parcel in Cotai totaling 53,700 square meters described under Registration No. 23223 by
the Macau Property Registry, on which The Plaza Macao has been constructed
a land parcel in Cotai totaling 60,479 square meters described under Registration No. 23224 by
the Macau Property Registry, on which The Parisian Macao is being developed
land parcels in Cotai totaling 150,134 square meters, including 44,576 square meters designated
as a tropical garden, described under Registration No. 23288 by the Macau Property Registry, on
which Sands Cotai Central has been constructed
Rolling Chip players who have a direct relationship with gaming operators and typically
participate in gaming activities in casinos or gaming areas without the use of Gaming Promoters
our Listing prospectus dated November 16, 2009, which is available from our website at
www.sandschinaltd.com
January 1, 2014 to June 30, 2014
Renminbi, the lawful currency of China
play by VIP and premium players (excludes Paiza cash players) using non-negotiable chips
casino revenue measurement, measured as the sum of all non-negotiable chips wagered and lost
by VIP and premium players (excludes Paiza cash players)
62
SANDS CHINA LTD. Interim Report 2014
“Sands Cotai Central”
“Sands Macao”
“SFO”
“Share(s)”
“Shareholder(s)”
“SJM”
“Stock Exchange”
“Subconcession” or
“Subconcession
Contract”
“Subconcessionaire(s)”
“table games”
“The Parisian Macao”
“The Plaza Macao”
Our integrated resort development on Parcels 5 and 6. On April 11, 2012, the first hotel tower
of parcel 5 opened and features 636 rooms and suites under the Conrad hotel brand and 1,224
rooms under the Holiday Inn hotel brand. The Group also opened significant gaming, MICE,
retail space and other integrated resort amenities, all of which are operated by the Group. On
September 20, 2012, the first hotel tower on parcel 6 opened and features 1,796 Sheraton-
branded hotel rooms and suites, along with additional gaming area, retail, entertainment, dining
and MICE facilities, which are operated by the Group. On January 28, 2013, the second hotel
tower on parcel 6 opened and features 2,067 additional Sheraton-branded hotel rooms and
suites. The Group has begun construction on the remaining phase of the integrated resort, which
will include a fourth hotel and mixed-use tower, located on parcel 5, under the St. Regis brand.
the Sands Macao, which includes gaming areas, a hotel tower, restaurants and a theater
the Securities and Futures Ordinance of Hong Kong (Chapter 571 of the Laws of Hong Kong) as
amended, supplemented or otherwise modified from time to time
ordinary shares in our Company with a nominal value of US$0.01 each
holder(s) of Shares
Sociedade de Jogos de Macau, S.A., a private company limited by shares (“sociedade
anónima”), incorporated on November 28, 2001 under the laws of Macao and one of the three
Concessionaires
The Stock Exchange of Hong Kong Limited
the tripartite Subconcession Contract for the operation of casino games dated December 26,
2002 among Galaxy, the Macao Government and VML
the holder(s) of a subconcession for the operation of casino games in the MSAR. As at the Latest
Practicable Date, the Subconcessionaires were VML (one of our subsidiaries), Melco Crown and
MGM Grand Paradise
typical casino games, including card games such as baccarat, blackjack and hi-lo (also known as
“sic bo”) as well as craps and roulette
an integrated resort being developed on Parcel 3, which is intended to include a gaming area,
hotel, a shopping mall and other integrated resort amenities
an integrated resort which includes (i) the Four Seasons Hotel; (ii) the Plaza Casino gaming area
operated by VML; (iii) the Paiza Mansions, Shoppes at Four Seasons, restaurants and a spa,
each of which are operated by us; and (iv) a luxury apart-hotel tower, which is anticipated to be
branded and serviced by Four Seasons; except where the context indicates otherwise
63
7. GLOSSARY
“The Venetian Macao”
“TTFT”
“United States,”
“U.S.” or “U.S.A.”
“US$” or “U.S. dollars”
“VIP player(s)”
“VIP room(s)”
“visit(s)” or “visitation(s)”
“VML”
“VOL”
“VVDIL”
“VVDI (II)”
“Wynn Macau”
The Venetian® Macao-Resort-Hotel, an integrated resort that includes casino and gaming areas,
a hotel, MICE space, Shoppes at Venetian, over 50 different restaurants and food outlets, a
15,000-seat arena and other entertainment venues
the Taipa Temporary Ferry Terminal, a ferry terminal in Taipa, Macao, which was developed and
is owned by the Macao Government. The terminal opened in October 2007 and is an interim
facility. It is expected to be replaced by a permanent ferry terminal in Taipa, which is currently
under construction by the Macao Government
the United States of America, including its territories and possessions and all areas subject to its
jurisdiction
United States dollars, the lawful currency of the United States
Rolling Chip players who play almost exclusively in dedicated VIP rooms or designated casino or
gaming areas and are sourced from Gaming Promoters
rooms or designated areas within a casino or gaming area where VIP players and premium players
gamble
with respect to visitation of our properties, the number of times a property is entered during a
fixed time period. Estimates of the number of visits to our properties is based on information
collected from digital cameras placed above every entrance in our properties which use video
signal image processor detection and include repeat visitors to our properties on a given day
our subsidiary, Venetian Macau, S.A. (also known as Venetian Macau Limited), a private company
limited by shares (“sociedade anónima”) incorporated on June 21, 2002 under the laws of
Macao, one of the three Subconcessionaires and the holder of the Subconcession
Venetian Orient Limited, a wholly owned subsidiary of the Company and owner and developer of
Sands Cotai Central
our subsidiary, Venetian Venture Development Intermediate Limited, a company incorporated in
the Cayman Islands on June 21, 2002 as an exempted company with limited liability
Venetian Venture Development Intermediate II, a company incorporated in the Cayman Islands
on January 23, 2003 as an exempted company with limited liability and an indirect, wholly owned
subsidiary of LVS and our immediate Controlling Shareholder
Wynn Resorts (Macau) S.A., a private company limited by shares (“sociedade anónima”)
incorporated on October 17, 2001 under the laws of Macao and one of the three Concessionaires
64