Intrepid Capital Fund
Intrepid Small Cap Fund
Intrepid Income Fund
Semi-Annual Report
April 1, 2023
| |
|  |
| Mark F. Travis, President/C.E.O. |
PERFORMANCE
| | Total Return as of March 31, 2023 |
| | Inception |
| | Date | Qtr. | YTD | 1 Year |
Intrepid Capital Fund – Inv. | 01/03/05 | 3.82% | 3.82% | -5.17% |
Intrepid Capital Fund – Inst. | 04/30/10 | 3.84% | 3.84% | -5.00% |
BBC Combined 1-5Yr |
| 5.22% | 5.22% | -4.38% |
S&P 500 Index |
| 7.50% | 7.50% | -7.73% |
| | |
| | Average Annualized Total Returns |
| | as of March 31, 2023 |
| | | | | Since |
| | 3 Year | 5 Year | 10 Year | Inception |
Intrepid Capital Fund – Inv. | 11.89% | 1.37% | 3.18% | 5.08% |
Intrepid Capital Fund – Inst. | 12.16% | 1.61% | 3.43% | 4.60% |
BBC Combined 1-5Yr | 10.86% | 7.55% | 7.94% | 6.68%^ |
S&P 500 Index | 18.60% | 11.19% | 12.24% | 9.14%^ |
| ^ | Since Inception returns are as of the Fund’s Investor Class inception date. Since the inception date of the Institutional Class, the annualized return of the BBC Combined 1-5Yr Index is 8.16% and S&P 500 Index is 10.87%. |
Performance data quoted represents past performance and does not guarantee future results.
Investment returns and principal value will fluctuate, and when sold, may be worth more or less than their original cost. Performance current to the most recent month-end may be lower or higher than the performance quoted and can be obtained by calling 866-996-FUND. The Fund imposes a 2% redemption fee on shares held for 30 days or less. Performance data does not reflect the redemption fee. If it had, returns would be reduced.
Per the Prospectus dated January 31, 2023, the annual operating expense (gross) for the Intrepid Capital Fund-Investor Share Class is 1.92% and for the Intrepid Capital Fund-Institutional Share Class is 1.67%. The Fund’s Advisor has contractually agreed to reduce its fees and/or reimburse expenses until January 31, 2024, such that the total operating expense for the Capital Fund-Investor Share Class is 1.40% and for the Capital Fund-Institutional Share Class is 1.15%. The Capital Fund may have
Net Expense higher than these expense caps as a result of any sales, distribution and other fees incurred under a plan adopted pursuant to Rule 12b-1 under the Investment Company Act of 1940, as amended (the “Investment Company Act”), acquired fund fees and expenses or other expenses (such as taxes, interest, brokerage commissions and extraordinary items) that are excluded from the calculation. As a result of the calculations, the Net Expense for the Capital Fund-Investor Share Class is 1.40%. The Net Expense for the Capital Fund-Institutional Share Class is 1.15%. The Net Expense Ratio represents the percentage paid by investors. Otherwise, performance shown would have been lower.
April 1, 2023
“Blessings we enjoy daily; and for the most of them, because they be
so common, most men forget to pay their praise.”
—Izaak Walton
Dear Fellow Shareholders
The author of the quote above, from the book “The Complete Angler,” wasn’t thinking about his blessings in the financial markets. Instead, he wrote those words about fishing. I too have reacquainted myself with a love of fishing from my youth. I find the distraction and focus required to be successful fishing useful after a day staring into the flashing red and green symbols on my Bloomberg screen!
The Intrepid Capital Fund successfully completed the first six month’s of the funds fiscal year ending March 31, 2023. For the first quarter of this calendar year, the Fund appreciated 3.82% which, when compounded on the 4.96% return in the fourth quarter of 2022, resulted in a non-annualized 8.97% total return over the six months since September 30, 2022. Included in these results was a dividend paid on March 31, 2023, of 22.59 cents per share.
We are now living through the experiment from several years ago that some describe as “modern monetary theory” which brought us, at one point, 18 trillion (with a T!) of negative yielding debt. Only a room full of PhD’s could come up with something like that. I mean really – am I going to deposit my monies in a bank account and “earn” negative interest rates so I will be worse off when I come back for my funds!? At one point, retailers in Germany couldn’t keep safes in stock as locals preferred a safe over their local bank! The Federal Reserve, staffed with 400 PhD’s, has now realized the error of their ways and raised the Fed Funds rate from close to zero in March of 2022 to roughly 5% now. That has now acquainted the public with a term I have used frequently in the past: duration (as a measure of interest rate risk). As well as the term “uninsured” depositors.
March of 2023 brought us the largest bank failure since the Great Financial Crisis of 2008 when depositors at Silicon Valley Bank requested $147 billion be paid back to them in two days. Regulators quickly moved to close the bank. While the bank had the highest credit quality assets in US Treasury bonds, they had significant unhedged duration risk coupled with close to 80% of deposits over the $250,000 FDIC limits.
To give you a specific example applicable to Silicon Valley Bank, if you bought a 10 years to maturity Treasury bond at a 2% yield at par (100) and due to inflationary pressures and Federal Reserve activity the current rate was now 4%, the bond you bought at par when rates were 2% is now worth 83 cents on the dollar. I am amazed that bank regulators didn’t insist that management hedge that duration risk. Well, the rest is history.
The Intrepid Capital Fund hasn’t been a bank investor since inception for the simple reason it is very hard to understand the various assets a bank holds. We know the liabilities are the deposits, which as we have seen in the example above can quickly flee. There isn’t a bank out there that could survive a “run” on their deposits. A good example of a bank run is from one of my favorite movies “It’s a Wonderful Life” where Jimmy Stewart pleads with his neighbors to keep their money in his savings and loan – arguing that Joe’s deposits are in Carl’s house, etc.
My preference is for less exciting investments in the equity markets. I am attracted to founder/managers that often have a significant ownership interest. I have observed that this type of owner/operator often runs a company void of liabilities on the balance sheet and to quote the famous race car driver Mario Andretti “to finish first, you must first finish”. These balances sheets are built to finish.
| Top Ten Holdings | | (% of Net Assets) |
| | | | |
| Verano Holdings, 10/30/2026, 14.25% | | | 4.6 | % |
| Becle SAB de CV | | | 4.5 | % |
| Civitas Resources, Inc. | | | 4.2 | % |
| FRP Holdings Inc. | | | 4.0 | % |
| Alphabet Inc – Class A | | | 3.7 | % |
| Berkshire Hathaway – Class B | | | 3.4 | % |
| The TJX Companies, Inc. | | | 3.2 | % |
| Copart, Inc. (CPRT) | | | 3.1 | % |
| Jefferies Financial Group, Inc. (JEF) | | | 3.1 | % |
| WNS Holdings Ltd. | | | 3.1 | % |
Top ten holdings are as of March 31, 2023. Fund holdings are subject to change and are not recommendations to buy or sell any security.
Two recent acquisitions fit this bill to a “T”. Garmin (GRMN) dominates the marine/avionic/fitness categories for navigation. The families that founded the firm have a combined equity stake of roughly 20%, and the company has a billion (with a B!) in cash on the balance sheet. Watsco (WSO) is run by the father/son team of Albert and AJ Nahmad. This company is the leading HVAC distributor in the country with a large portion of their revenues coming from replacement equipment. Anyone close to the beach in Florida knows that the replacement cycle can be short!
I believe we are closer to the end than the beginning of the Federal Reserves rate hikes, but that doesn’t mean we won’t have price volatility around announcements of Consumer Price Index (CPI) statistics or future Fed policy. I will continue to seek investments like the two mentioned above when volatility spikes.
Thank you for your continued support. If there is anything we can do to serve you better, please don’t hesitate to call.
All the best,
Mark F. Travis
Intrepid Capital Fund Portfolio Manager
All investments involve risk. Principal loss is possible. The Fund is subject to special risks including volatility due to investments in smaller companies, which involve additional risks such as limited liquidity and greater volatility. Investments in debt securities typically decrease in value when interest rates rise. This risk is usually greater for longer-term debt securities. Investments by the Fund in lower-rated and non-rated securities present a greater risk of loss to principal and interest than higher-rated securities. The Fund may invest in foreign securities which involve greater volatility and political, economic and currency risks and differences in accounting methods. The risks of owning ETFs generally reflect the risks of owning the underlying securities they are designed to track. ETFs also have management fees that increase their costs versus the costs of owning the underlying securities directly.
The S&P 500 Index is a broad-based, unmanaged index of 500 stocks, which is widely recognized as representative of the equity market in general. The Bloomberg US Gov/Credit 1-5Y TR Index measures the performance of U.S. dollar-denominated U.S. Treasury bonds, government-related bonds, and investment-grade U.S. corporate bonds that have a remaining maturity of greater than or equal to one year and less than five years. The Bloomberg (BBC) Combined Index consists of an unmanaged portfolio of 60% common stocks represented by the S&P 500 Index and 40% bonds represented by the Bloomberg US Government/Credit 1-5 Yr Index. You cannot invest directly in an index.
The Consumer Price Index (CPI) measures the monthly change in prices paid by U.S. consumers.
Duration is an approximate measure of the price sensitivity of a fixed-income investment to a change in interest rates, expressed as a number of years.
Basis point is a standard financial measure for interest rates. One basis point equals 1/100th of 1%.
Opinions expressed are subject to change, are not guaranteed and should not be considered investment advice or recommendations to buy or sell any security.
The Intrepid Capital Funds are distributed by Quasar Distributors, LLC.
April 1, 2023
| | | | |
|  | | |
| | Matt Parker, CFA, CPA | | Joe Van Cavage, CFA |
| Small Cap Fund | | Small Cap Fund |
| Co-Portfolio Manager | | Co-Portfolio Manager |
PERFORMANCE
| | Total Return as of March 31, 2023 |
| | Inception | | | |
| | Date | Qtr. | YTD | 1 Year |
Intrepid Small Cap Fund – Inv. | 10/03/05 | 3.94% | 3.94% | -6.94% |
Intrepid Small Cap Fund – Inst. | 11/03/09 | 4.02% | 4.02% | -6.78% |
Morningstar Small Cap Index |
| 4.90% | 4.90% | -8.84% |
| | |
| | Average Annualized Total Returns |
| | as of March 31, 2023 |
| | | | | Since |
| | 3 Year | 5 Year | 10 Year | Inception |
Intrepid Small Cap Fund – Inv. | 10.74% | 1.87% | 1.93% | 6.03% |
Intrepid Small Cap Fund – Inst. | 10.94% | 2.09% | 2.16% | 4.56% |
Morningstar Small Cap Index | 19.17% | 5.42% | 8.18% | 7.85%^ |
| ^ | Since Inception returns are as of the Fund’s Investor Class inception date. Since the inception date of the Institutional Class, the annualized return of the Morningstar Small Cap Index is 10.87%. |
Performance data quoted represents past performance and does not guarantee future results.
Investment returns and principal value will fluctuate, and when sold, may be worth more or less than their original cost. Performance current to the most recent month-end may be lower or higher than the performance quoted and can be obtained by calling 866-996-FUND. The Fund imposes a 2% redemption fee on shares held for 30 days or less. Performance data does not reflect the redemption fee. If it had, returns would be reduced.
Per the Prospectus dated January 31, 2023, the annual operating expense (gross) for the Intrepid Small Cap Fund-Investor Share Class is 1.77% and for the Intrepid Small Cap Fund-Institutional Share Class is 1.51%. The Fund’s Advisor has contractually agreed to reduce its fees and/or reimburse expenses until January 31, 2024, such that the total operating expense for the Small Cap Fund-Investor Share Class is 1.30% and the Small Cap Fund-Institutional Share Class is 1.15%. The Small Cap Fund may have Net Expense higher than these expense caps as a result of
any sales, distribution and other fees incurred under a plan adopted pursuant to Rule 12b-1 under the Investment Company Act of 1940, as amended (the “Investment Company Act”), acquired fund fees and expenses or other expenses (such as taxes, interest, brokerage commissions and extraordinary items) that are excluded from the calculation. As a result of the calculations, the Net Expense for the Small Cap Fund-Investor Share Class is 1.30%. The Net Expense for the Small Cap Fund-Institutional Share Class is 1.15%. The Net Expense Ratio represents the percentage paid by investors. Otherwise, performance shown would have been lower. As of June 6, 2022, the Intrepid Endurance Fund’s name changed to the Intrepid Small Cap Fund.
April 1, 2023
Dear Fellow Shareholders,
Similar to last quarter, small cap stocks again showed how volatile they can be during calendar Q1 2023 (the 2nd quarter of fiscal 2023).
Small caps rallied hard to start the period, rising over double digits by early February. However, the well-publicized banking crisis that emerged in early March pushed them all the way back into negative territory. From there, small caps rallied in the last few weeks to end the quarter with lightly positive returns.
The concerns about the banking system came out of left field during the quarter. We certainly did not expect it.
However, the Fund was positioned reasonably well for it, with only one traditional bank stock in the portfolio and at a very small weight. For the quarter, the Intrepid Small Cap Fund (“the Fund”) returned 3.94% versus 4.90% for the benchmark Morningstar Small Cap Index.
As a general rule, we do not invest much in the bank sector, despite it being a rather large part of the small cap market. Banks are very difficult to analyze or value with confidence and – as seen in the last few weeks – have black swan risks on both the asset and liability side of their business. In addition, it’s a competitive industry with very few companies that possess the type of durable competitive advantages we look for. That is not to say that we would never invest in them; however, under normal circumstances we would anticipate having little banking exposure.
Besides the banks stocks themselves, another difficult thing to analyze is what the economic impact from the crisis will be. Now that things have calmed down and some confidence has been restored, will the economy go right back to normal? Or will the financial system pull back on credit growth in order to keep cash available for future deposit runs, stifling the economy in the second half of the year?
These questions lead to more questions, and there are a lot of investors guessing about what happens next. If the economy does slow, will the Fed stubbornly continue to tighten? Or will they relent and lower rates? When will they decide? And at what pace will they raise or lower rates? Is quantitative easing back on the table to improve liquidity in the system?
As usual, we believe trying to answer these questions is counter-productive to our task of trying to source high quality small cap companies at attractive valuations. Instead, we often use periods of high uncertainty that drive questions like the above and thus higher volatility to source new positions that meet our investment criteria.
For instance, we added three new positions to the Fund in calendar Q1 (compared to zero new positions in calendar Q4):
| | • | Chicago Atlantic Real Estate Finance (REFI) is real-estate investment trust that focuses on providing short-term secured loans to the legal US cannabis industry. After some unsuccessful attempts to benefit from the capital-constrained cannabis industry in the past, we have decided to move up in the capital structure to take advantage of the attractive and well-covered loans that scaled lenders to the space are able to make. In addition, for a REIT the company has little leverage and a very attractive dividend (over 10%). |
| | | |
| | • | Armstrong World Industries (AWI) is the leading manufacturer of ceiling systems in the United States. Assuming that you are in an office building reading this letter – if you look at the ceiling tile above your head, there is a greater-than-50% chance that Armstrong manufactured it. As a dominant market share leader in a low growth industry that supplies a very small component of the cost of new build and remodel projects, Armstrong has demonstrated very robust pricing power even before the recent bout of high inflation. |
| | | |
| | • | Vector Group Ltd (VGR) is the fourth-largest manufacturer of cigarettes in the US, specializing in the discount and deep discount categories. From a decades-old legal settlement that awarded them favorable tax treatment, the company has a structural cost advantage versus its peers that management exploits by launching new brands that undercut competition in order to gain market share. After establishing distribution and customer loyalty with the new brand, Vector implements the typical tobacco playbook by raising prices which sheds some market share but drives significant incremental profitability that more than compensates for the lost share. We believe the company is entering one of its profit harvesting periods today, which is an especially attractive time given that many consumers are trading down to the discount cigarette category. |
The three largest contributors to the Fund’s performance for the quarter were Civitas Resources (CIVI), Becle Sab de CV (CUERVO MM) and WNS Holdings (WNS). The three largest detractors to performance were Franklin Covey (FC), Silicom (SILC) and Conduent (CNDT). We believe the selloff in each of these stocks was mostly due to temporary challenges and investor frustration surrounding earnings, but have not changed our favorable view of their long-term fundamentals.
Despite the three new holdings, positioning remains largely the same today as when we began the quarter. The top positions in the Fund continue to possess what we believe is the best combination of business quality and valuation. In addition, we continue to emphasize financial strength – only one of the top seven holdings has net debt. While the banking crisis has caused longer-term interest rates to fall dramatically over the last month, we still value balance sheet strength and liquidity as an important risk mitigator in the volatile small cap market.
| Top Ten Holdings | | (% of Net Assets) |
| | | | |
| Civitas Resources, Inc. | | | 5.7 | % |
| WNS Holdings Ltd | | | 5.3 | % |
| Becle SAB de CV | | | 5.3 | % |
| Silicom Ltd. | | | 5.1 | % |
| FRP Holdings, Inc. | | | 5.1 | % |
| Skechers USA Inc. – Class A | | | 4.9 | % |
| Fabrinet | | | 4.7 | % |
| Valvoline Inc. | | | 4.3 | % |
| Franklin Covey Co. | | | 4.3 | % |
| Chicago Atlantic Real Estate Finance | | | 4.2 | % |
Top ten holdings are as of March 31, 2023. Fund holdings are subject to change and are not recommendations to buy or sell any security.
With that said, two of the three new names described above (Armstrong World Industries and Vector Group) do have some debt. It’s an important point to mention – we are not afraid of debt, we just want to make sure that our holdings that have debt:
| | • | Have stable, consistent operations to support the debt |
| | | |
| | • | Have ample liquidity and no near-term debt maturities |
| | | |
| | • | Are priced adequately for the higher risk |
While we are not going full-throttle into highly levered small cap opportunities, it is not terribly surprising that – given the elevated volatility in the credit markets – we have found more opportunities in companies with debt recently. For instance Armstrong World trades at the lowest valuation it ever has since the spin-off of its flooring business in 2016. And at approximately 10x earnings, we believe Vector Group’s potential for attractive near-term earnings growth (and high dividend) are being ignored. We believe both of these opportunities exist partially because of the companies’ not-quite-pristine balance sheets.
We will continue to remain flexible and try to take advantage of what the market offers, with the goal of generating attractive risk-adjusted returns in what is often a volatile small cap market.
Thank you for your investment.
 |  |
| | |
| Matt Parker, CFA, CPA | Joe Van Cavage, CFA |
| Intrepid Small Cap Fund | Intrepid Small Cap Fund |
| Co-Portfolio Manager | Co-Portfolio Manager |
Past performance is not a guarantee of future results.
Mutual Fund investing involves risk. Principal loss is possible. The Fund is subject to special risks including volatility due to investments in smaller companies, which involve additional risks such as limited liquidity and greater volatility. The Fund may invest in foreign securities which involve greater volatility and political, economic and currency risks and differences in accounting methods. The risks of owning ETFs generally reflect the risks of owning the underlying securities they are designed to track. ETFs also have management fees that increase their costs versus the costs of owning the underlying securities directly.
The Morningstar Small Cap Index tracks the performance of U.S. small-cap stocks that fall between 90th and 97th percentile in market capitalization of the investable universe. You cannot invest directly in an index.
Opinions expressed are subject to change, are not guaranteed and should not be considered investment advice or recommendations to buy or sell any security.
The Intrepid Capital Funds are distributed by Quasar Distributors, LLC.
April 1, 2023
| | | | |
| | | |
| | Mark F. Travis, President/C.E.O. | | Hunter Hayes, CFA |
| Income Fund Co-Portfolio Manager | | Income Fund Co-Portfolio Manager |
PERFORMANCE
| | Total Return as of March 31, 2023 |
| | Inception | | | |
| | Date | Qtr. | YTD | 1 Year |
Intrepid Income Fund – Inst.^ | 08/16/10 | 1.70% | 1.70% | -1.67% |
Bloomberg USGov/Cred 1-5Y | | 1.82% | 1.82% | -0.33% |
Bloomberg US Agg Bond Index | | 2.96% | 2.96% | -4.78% |
ICE BofAML US Corporate Index | | 3.45% | 3.45% | -5.19% |
ICE BofAML High Yield Index | | 3.72% | 3.72% | -3.56% |
| | |
| | Average Annualized Total Returns |
| | as of March 31, 2023 |
| | | | | Since |
| | 3 Year | 5 Year | 10 Year | Inception |
Intrepid Income Fund – Inst.^ | 8.08% | 4.46% | 3.40% | 3.86% |
Bloomberg USGov/Cred 1-5Y | -0.79% | 1.32% | 1.13% | 1.33% |
Bloomberg US Agg Bond Index | -2.77% | 0.91% | 1.36% | 1.94% |
ICE BofAML US Corporate Index | -0.28% | 1.67% | 2.35% | 3.20% |
ICE BofAML High Yield Index | 5.84% | 3.05% | 4.03% | 5.46% |
| ^ | Institutional Class shares of the Intrepid Income Fund commenced operations on August 16, 2010. Performance shown prior to August 16, 2010 (Since Inception) reflects the performance of Investor Class shares, which commenced operations on July 2, 2007, and includes expenses that are not applicable to and are higher than those of Institutional Class shares. |
Effective January 31, 2014, the Investor Class shares of the Fund were closed, and any outstanding Investor Class shares were converted into Institutional Class shares.
Performance data quoted represents past performance and does not guarantee future results.
Investment returns and principal value will fluctuate, and when sold, may be worth more or less than their original cost. Performance current to the most recent month-end may be lower or higher than the performance quoted and can be obtained by calling 866-996-FUND. The Fund imposes a 2% redemption fee on shares held for 30 days or less. Performance data does not reflect the redemption fee. If it had, returns would be reduced.
Per the Prospectus dated January 31, 2023, the annual operating expense (gross) for the Intrepid Income Fund-Institutional Share Class is 0.98%. The Fund’s Advisor has contractually agreed to reduce its fees and/or reimburse expenses until January 31, 2024 such that total operating expense for the Income Fund-Institutional Share Class is 0.90%. The Income Fund may have Net Expense higher than the expense cap as a result of any sales, distribution and other fees incurred under a plan adopted pursuant to Rule 12b-1 under the Investment Company Act of 1940, as amended (the “Investment Company Act”), acquired fund fees and expenses or other expenses (such as taxes, interest, brokerage commissions and extraordinary items) that are excluded from the calculation. As a result of the calculations, the Net Expense for the Income Fund-Institutional Class is 0.91%. The Net Expense Ratio represents the percentage paid by investors. Otherwise, performance shown would have been lower.
30-Day Subsidized SEC Yield: 11.31%; 30-Day Unsubsidized SEC Yield: 11.24%
April 1, 2023
Dear Fellow Shareholders,
Despite the steady drumbeat of higher rates and fears of a recession, the first three months of 2023 shined favorably upon credit markets. We continue to be reluctantly optimistic about certain pockets of high yield credit, especially on the front-end of the curve, but we are also taking advantage of “three-foot putts” that continue to pop up, specifically in short-dated, investment grade credit.
| Top Ten Holdings | | (% of Net Assets) |
| | | | |
| Trulieve Cannabis Corp., 10/06/2026, 8.00% | | | 4.2 | % |
| Turning Point Brands, Inc., 02/15/2026, 5.625% | | | 3.5 | % |
| American Tower Corp., 06/15/2023, 3.00% | | | 3.3 | % |
| Abercrombie & Fitch Management Co., | | | | |
| 07/15/2025, 8.75% | | | 3.0 | % |
| Fiserv, Inc., 10/01/2023, 3.80% | | | 3.0 | % |
| Shryne Group, Inc., 05/26/2026, 16.00% | | | 3.0 | % |
| VCP23, LLC., 04/30/2024, 7.00% | | | 2.8 | % |
| Starwood Property Trust, Inc., | | | | |
| 04/01/2023, 4.375% | | | 2.7 | % |
| Verano Holdings Corp., 10/30/2026, 14.25% | | | 2.6 | % |
| AFC Gamma, Inc., 05/01/2027, 5.75% | | | 2.5 | % |
Top ten holdings are as of March 31, 2023. Fund holdings are subject to change and are not recommendations to buy or sell any security.
During March, for instance, when markets became dislocated on the back of a slew of bank failures, many investors unloaded higher-quality positions to prepare for potential redemptions and/or runs on capital. Why unload higher quality positions? Because these positions are often more liquid and usually incur a lower mark-down to liquidate in times of distress. Regardless of the reasons, we were keen to purchase high quality securities at double-digit money market yields as the drama unfolded, and the Intrepid Income Fund (the “Fund”) ended the first calendar quarter of 2023 with 22.1% of the portfolio in investment grade bonds.
We view this short-dated, investment grade sleeve as a ballast for the portfolio that will allow us to continue redeploying capital into a choppy, but attractive, high yield bond environment. We continue to look for robust, core credit positions issued by companies that we believe have the liquidity and cash flow profile to weather a recession and/or absorb the impact of higher rates.
It is interesting to compare this fixed income environment, which we view as attractive on a risk-adjusted basis, to the environment of 18 months ago, which we viewed as extremely unattractive. There is an old saying in credit that there are “no bad bonds, just bad prices” that we think rings true against this backdrop. Although we expect default rates to tick up, and for there to be more carnage as the higher cost of capital permeates its way through the system, we also believe that there are plenty of opportunities out there that compensate one for those risks. In other words, we are fine with the choppier economic environment given the significantly enhanced yield we can receive.
Another encouraging sign for lenders is the pick-up of new issue supply that priced in the first quarter. Despite considerable volatility, $45 billion and $404 billion of new issues were brought to market in the high yield and investment grade markets, respectively, according to CreditSights. These new issues carry significantly better rates and terms for lenders than we have seen in quite some time, and we participated in several deals. Although there continues to be gamesmanship by companies around tapping credit markets, many have recognized that we are in a new paradigm, and taken advantage of the credit window being open. We expect the new issue window to be a source of ideas for us now that things have shifted to more of a lender-friendly market, and we are taking an active role in refinancing discussions with many of our borrowers.

As the chart shows, we have taken advantage of the market dislocations to enhance our yield profile, but we have also kept our duration low relative to indices. We admit that we have no superior insight into the path of interest rates from here, but we do feel good about the credits we are underwriting. We expect our performance to be more volatile than it has been historically given our higher yield profile, and we will continue to deploy capital into this higher yielding environment for as long as the market gives us attractive risk-adjusted opportunities.
Shifting to performance, the Fund returned 1.70% in the first calendar quarter. The High Yield Index increased 3.72% over the same period. The Bloomberg Barclays U.S. Gov/Credit 1-5Y TR Index gained 1.82% and the Bloomberg Barclays US Aggregate Bond Index gained 2.96% during the quarter.
The Fund’s top contributors for the quarter were Cimpress 7.0% Unsecured Notes due 6/15/2026, Abercrombie & Fitch 8.75% Secured Notes due 7/15/2025, and Vista Outdoor Inc. 4.5% Unsecured Notes due 3/15/2029.
The Fund’s top detractors during the quarter were Atento 8.0% Secured Notes due 2/10/2026, QVCN 4.85% Secured Notes due 4/01/2024, and Trulieve 8.0% Secured Notes due 10/06/2026.
As always, we encourage investors to reach out for additional commentary on our positioning and strategy.
We remain sanguine about the prospects for short duration high yield despite the turbulence that may lie ahead for risk markets. Careful credit analysis will be the differentiator. The yield-to-worst for the Fund at the end of the first calendar quarter was 13.68% with a modified duration of 1.97 years.
Thank you for your investment.
Sincerely,
 |  |
| | |
| Hunter Hayes | Mark F. Travis, President |
| Intrepid Income Fund | Intrepid Income Fund |
| Co-Portfolio Manager | Co-Portfolio Manager |
Mutual Fund investing involves risk.
All investments involve risk. Principal loss is possible. Investments in debt securities typically decrease in value when interest rates rise. The risk is generally greater for longer term debt securities. Investments by the Fund in lower-rated and non-rated securities present a greater risk of loss to principal and interest than higher rated securities. The Fund may invest in foreign securities which involve greater volatility and political, economic and currency risks and differences in accounting methods.
The ICE BofAML US High Yield Index tracks the performance of US dollar denominated below investment grade corporate debt publicly issued in the US domestic market. Qualifying securities must have
a below investment grade rating (based on an average of Moody’s, S&P and Fitch), at least 18 months to final maturity at the time of issuance, at least one year remaining term to final maturity as of the rebalancing date, a fixed coupon schedule and a minimum amount outstanding of $250 million. Bloomberg Barclays Capital U.S. Aggregate Bond Index is an index representing about 8,200 fixed income securities. To be included in the index, bonds must be rated investment grade by Moody’s and S&P. ICE BofAML U.S. Corporate Index is an unmanaged index of U.S. dollar denominated investment grade corporate debt securities publicly issued in the U.S. domestic market with at least one-year remaining term to final maturity. The Bloomberg Barclays US Gov/Credit 1-5Y TR Index measures the performance of U.S. dollar-denominated U.S. Treasury bonds, government-related bonds, and investment-grade U.S. corporate bonds that have a remaining maturity of greater than or equal to one year and less than five years.
Bond ratings are grades given to bonds that indicate their credit quality as determined by private independent rating services such as Standard & Poor’s, Moody’s and Fitch. These firms evaluate a bond issuer’s financial strength, or its ability to pay a bond’s principal and interest in a timely fashion. Ratings are expressed as letters ranging from ‘AAA’, which is the highest grade, to ‘D’, which is the lowest grade. In limited situations when the rating agency has not issued a formal rating, the rating agency will classify the security as nonrated.
A high-yield bond is a high paying bond with lower credit rating than investment-grade corporate bonds, Treasury bonds and municipal bonds. Bonds in high yield indices tend to be less liquid and more volatile than U.S. Treasuries. Corporate bonds come with significant credit risks and, although sometimes secured by collateral, do not have any guarantee of principal repayment. U.S. Treasury Bonds are long-term government debt securities with a maturity of more than 10 years. They are guaranteed as to the timely payment of principal and interest and are backed by the full faith and credit of the U.S. Government. Investment Grade (IG) is a bond with credit rating of BBB or higher by Standard & Poor’s or Baa3 or higher by Moody’s.
Duration is an approximate measure of the price sensitivity of a fixed-income investment to a change in interest rates, expressed as a number of years. Call is an option contract that gives the holder the right to buy a certain quantity of an underlying security from the writer of the option, at a specified price up to a specified date.
Yield-to-worst is a measure of the lowest possible yield that can be received on a bond that fully operates within the terms of its contract without defaulting. It is a type of yield that is referenced when a bond has provisions that would allow the issuer to close it out before it matures.
Free cash flow, or cash flow, represents the cash a company generates after accounting for cash outflows to support operations and maintain its capital assets.
Opinions expressed are subject to change, are not guaranteed and should not be considered investment advice or recommendations to buy or sell any security.
The Intrepid Capital Funds are distributed by Quasar Distributors, LLC.
| EXPENSE EXAMPLE |
| March 31, 2023 (Unaudited) |
As a shareholder of the Intrepid Capital Management Funds Trust (the “Funds”), you incur ongoing costs, including management fees; distribution and/or service fees; and other expenses incurred by the Funds. This example is intended to help you understand your ongoing costs (in dollars) of investing in the Funds and to compare costs with the ongoing costs of investing in other mutual funds.
The example is based on an investment of $1,000 invested at the beginning of the period and held the entire period of October 1, 2022 through March 31, 2023.
Actual Expenses
The first line of the following table provides information about actual account values and actual expenses. Although the Funds charge no sales load or transaction fees, you will be assessed fees for outgoing wire transfers, returned checks or stop payment orders at prevailing rates charged by U.S. Bank Global Fund Services, the Funds’ transfer agent. If you request a redemption be made by wire transfer, currently a $15.00 fee is charged by the Funds’ transfer agent. To the extent that a Fund invests in shares of other investment companies as part of its investment strategy, you will indirectly bear your proportionate share of any fees and expenses charged by the underlying funds in which the Fund invests in addition to the expenses of the Fund. Actual expenses of the underlying funds are expected to vary among the various underlying funds. These expenses are not included in the following example. The example includes, but is not limited to, management fees, shareholder servicing fees, distribution fees, fund accounting, custody and transfer agent fees. However, the example below does not include portfolio trading commissions and related expenses, interest expense and other extraordinary expenses as determined under generally accepted accounting principles. You may use the information in this line, together with the amount you invested, to estimate the expenses that you paid over the period. Simply divide your account value by $1,000 (for example, an $8,600 account value divided by $1,000 = 8.6), then multiply the result by the number in the first line under the heading entitled “Expenses Paid During Period” to estimate the expenses you paid on your account during this period.
Hypothetical Example for Comparison Purposes
The second line of the following table provides information about hypothetical account values and hypothetical expenses based on the Funds’ actual expense ratio and an assumed rate of return of 5% per year before expenses, which is not the Funds’ actual return. The hypothetical account values and expenses may not be used to estimate the actual ending account balance or expenses you paid for the period. You may use this information to compare the ongoing costs of investing in the Funds and other funds. To do so, compare this 5% hypothetical example with the 5% hypothetical examples that appear in the shareholder reports of the other funds.
| EXPENSE EXAMPLE (continued) |
| March 31, 2023 (Unaudited) |
Please note that the expenses shown in the table are meant to highlight your ongoing costs only and do not reflect any transactional costs, such as sales charges (loads), redemption fees, or exchange fees. Therefore, the second line of the table is useful in comparing ongoing costs only, and will not help you determine the relative costs of owning different funds. In addition, if these transactional costs were included, your costs would have been higher.
INTREPID CAPITAL FUND – INVESTOR CLASS
| | | | Expenses Paid |
| | Beginning | Ending | During Period* |
| | Account Value | Account Value | October 1, 2022 - |
| | October 1, 2022 | March 31, 2023 | March 31, 2023 |
| Actual | $1,000.00 | $1,089.70 | $6.77 |
| Hypothetical (5% return | | | |
| before expenses) | 1,000.00 | 1,018.45 | 6.54 |
| * | Expenses are equal to the Fund’s annualized expense ratio of 1.30%, multiplied by the average account value over the period, multiplied by 182/365 to reflect the period. |
INTREPID CAPITAL FUND – INSTITUTIONAL CLASS
| | | | Expenses Paid |
| | Beginning | Ending | During Period* |
| | Account Value | Account Value | October 1, 2022 - |
| | October 1, 2022 | March 31, 2023 | March 31, 2023 |
| Actual | $1,000.00 | $1,090.70 | $5.99 |
| Hypothetical (5% return | | | |
| before expenses) | 1,000.00 | 1,019.20 | 5.79 |
| * | Expenses are equal to the Fund’s annualized expense ratio of 1.15%, multiplied by the average account value over the period, multiplied by 182/365 to reflect the period. |
INTREPID SMALL CAP FUND – INVESTOR CLASS
| | | | Expenses Paid |
| | Beginning | Ending | During Period* |
| | Account Value | Account Value | October 1, 2022 - |
| | October 1, 2022 | March 31, 2023 | March 31, 2023 |
| Actual | $1,000.00 | $1,125.10 | $6.89 |
| Hypothetical (5% return | | | |
| before expenses) | 1,000.00 | 1,018.45 | 6.54 |
| * | Expenses are equal to the Fund’s annualized expense ratio of 1.30%, multiplied by the average account value over the period, multiplied by 182/365 to reflect the period. |
| EXPENSE EXAMPLE (continued) |
| March 31, 2023 (Unaudited) |
INTREPID SMALL CAP FUND – INSTITUTIONAL CLASS
| | | | Expenses Paid |
| | Beginning | Ending | During Period* |
| | Account Value | Account Value | October 1, 2022 - |
| | October 1, 2022 | March 31, 2023 | March 31, 2023 |
| Actual | $1,000.00 | $1,126.10 | $6.10 |
| Hypothetical (5% return | | | |
| before expenses) | 1,000.00 | 1,019.20 | 5.79 |
| * | Expenses are equal to the Fund’s annualized expense ratio of 1.15%, multiplied by the average account value over the period, multiplied by 182/365 to reflect the period. |
INTREPID INCOME FUND
| | | | Expenses Paid |
| | Beginning | Ending | During Period* |
| | Account Value | Account Value | October 1, 2022 - |
| | October 1, 2022 | March 31, 2023 | March 31, 2023 |
| Actual | $1,000.00 | $1,034.10 | $4.56 |
| Hypothetical (5% return | | | |
| before expenses) | 1,000.00 | 1,020.44 | 4.53 |
| * | Expenses are equal to the Fund’s annualized expense ratio of 0.90%, multiplied by the average account value over the period, multiplied by 182/365 to reflect the period. |
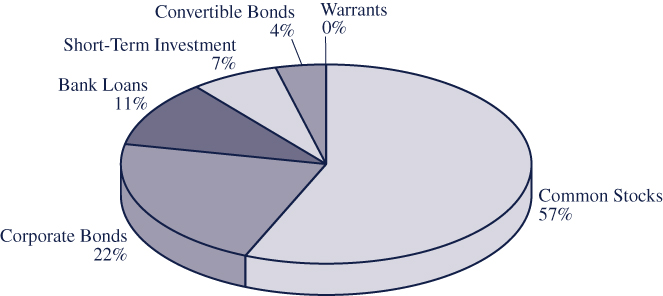
| ALLOCATION OF PORTFOLIO HOLDINGS (as a % of total net assets) |
| March 31, 2023 (Unaudited) |
INTREPID CAPITAL FUND
| | Components of Portfolio Holdings | | | |
| | Common Stocks | | $ | 24,453,552 | |
| | Corporate Bonds | | | 9,517,026 | |
| | Bank Loans | | | 4,856,106 | |
| | Short-Term Investment | | | 2,896,634 | |
| | Convertible Bonds | | | 1,544,194 | |
| | Warrants | | | 71,760 | |
| | | | $ | 42,814,317 | |
| * | Cash, cash equivalents and other assets less liabilities are equal to (1%). |
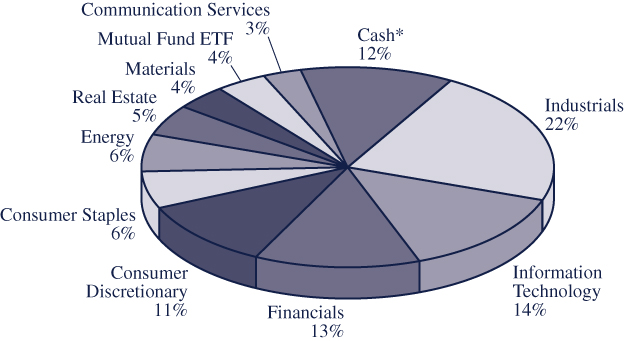
| ALLOCATION OF PORTFOLIO HOLDINGS (as a % of total net assets) |
| March 31, 2023 (Unaudited) |
INTREPID SMALL CAP FUND
| | Components of Portfolio Holdings | | | |
| | Industrials | | $ | 11,406,765 | |
| | Information Technology | | | 7,282,362 | |
| | Financials | | | 7,060,828 | |
| | Consumer Discretionary | | | 5,805,718 | |
| | Consumer Staples | | | 3,314,897 | |
| | Energy | | | 3,021,106 | |
| | Real Estate | | | 2,696,108 | |
| | Materials | | | 2,277,354 | |
| | Mutual Fund ETF | | | 2,061,254 | |
| | Communication Services | | | 1,673,233 | |
| | Cash* | | | 6,392,867 | |
| | | | $ | 52,992,492 | |
* | Cash, cash equivalents and other assets less liabilities. |
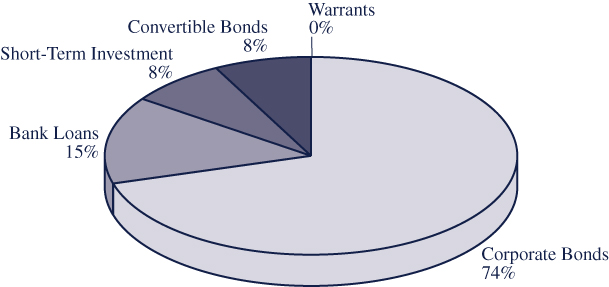
| ALLOCATION OF PORTFOLIO HOLDINGS (as a % of total net assets) |
| March 31, 2023 (Unaudited) |
INTREPID INCOME FUND
| | Components of Portfolio Holdings | | | |
| | Corporate Bonds | | $ | 221,791,224 | |
| | Bank Loans | | | 44,987,518 | |
| | Short-Term Investment | | | 25,207,359 | |
| | Convertible Bonds | | | 24,909,246 | |
| | Warrants | | | 17,185 | |
| | | | $ | 300,328,600 | |
| * | Cash, cash equivalents and other assets less liabilities are equal to (5%). |
| SCHEDULE OF INVESTMENTS |
| March 31, 2023 (Unaudited) |
| BANK LOANS - 11.34% | | Principal Amount | | | Value | |
| Health Care - 11.34% | | | | | | |
| Gage Growth Corp. 13.750%, 11/01/2024 (a) | | $ | 1,003,838 | | | $ | 995,506 | |
| Shryne Group, Inc. 7.500%, 05/26/2026 (a)(b) | | | 1,000,000 | | | | 984,200 | |
| VCP23 LLC 7.000%, 04/30/2024 (a)(b) | | | 1,000,000 | | | | 930,000 | |
| Verano Holdings Corp. 12.750%, 10/30/2026 (a) | | | 2,000,000 | | | | 1,946,400 | |
| TOTAL BANK LOANS (Cost $4,922,868) | | | | | | | 4,856,106 | |
| | | | | | | | | |
| COMMON STOCKS - 57.12% | | Shares | | | | | |
| Capital Goods - 5.53% | | | | | | | | |
| Acuity Brands, Inc. | | | 6,816 | | | | 1,245,488 | |
| Watsco, Inc. | | | 3,521 | | | | 1,120,241 | |
| | | | | | | | 2,365,729 | |
| | | | | | | | | |
| Commercial & Professional Services - 3.06% | | | | | | | | |
| Copart, Inc. (c) | | | 17,426 | | | | 1,310,609 | |
| | | | | | | | | |
| Consumer Durables & Apparel - 8.06% | | | | | | | | |
| Carter’s, Inc. | | | 16,717 | | | | 1,202,287 | |
| Garmin Ltd. (d) | | | 10,898 | | | | 1,099,826 | |
| Levi Strauss & Co. - Class A | | | 63,000 | | | | 1,148,490 | |
| | | | | | | | 3,450,603 | |
| | | | | | | | | |
| Diversified Financials - 6.39% | | | | | | | | |
| Berkshire Hathaway, Inc. - Class B (c) | | | 4,615 | | | | 1,424,974 | |
| Jefferies Financial Group, Inc. | | | 41,253 | | | | 1,309,370 | |
| | | | | | | | 2,734,344 | |
| | | | | | | | | |
| Energy - 4.11% | | | | | | | | |
| Civitas Resources, Inc. | | | 25,761 | | | | 1,760,507 | |
| | | | | | | | | |
| Food, Beverage & Tobacco - 4.44% | | | | | | | | |
| Becle SAB de CV (d) | | | 730,215 | | | | 1,900,099 | |
| | | | | | | | | |
| Health Care Equipment & Services - 2.02% | | | | | | | | |
| CVS Health Corp. | | | 11,673 | | | | 867,421 | |
| | | | | | | | | |
| Media & Entertainment - 6.37% | | | | | | | | |
| Alphabet, Inc. - Class A (c) | | | 14,928 | | | | 1,548,481 | |
| Take-Two Interactive Software, Inc. (c) | | | 9,872 | | | | 1,177,730 | |
| | | | | | | | 2,726,211 | |
See notes to financial statements.
| SCHEDULE OF INVESTMENTS (continued) |
| March 31, 2023 (Unaudited) |
| COMMON STOCKS - 57.12% (continued) | | Shares | | | Value | |
| Real Estate - 3.98% | | | | | | |
| FRP Holdings, Inc. (c) | | | 29,429 | | | $ | 1,703,351 | |
| | | | | | | | | |
| Retailing - 5.35% | | | | | | | | |
| Dollar General Corp. | | | 4,448 | | | | 936,126 | |
| The TJX Companies, Inc. | | | 17,307 | | | | 1,356,176 | |
| | | | | | | | 2,292,302 | |
| | | | | | | | | |
| Software & Services - 7.81% | | | | | | | | |
| Accenture PLC - Class A (d) | | | 3,453 | | | | 986,902 | |
| Dropbox, Inc. - Class A (c) | | | 49,233 | | | | 1,064,417 | |
| WNS Holdings Ltd. - ADR (c)(d) | | | 13,857 | | | | 1,291,057 | |
| | | | | | | | 3,342,376 | |
| TOTAL COMMON STOCKS (Cost $17,960,591 | | | | | | | 24,453,552 | |
| | | | | | | | | |
| CONVERTIBLE BONDS - 3.61% | | Principal Amount | | | | | |
| Diversified Financials - 1.16% | | | | | | | | |
| WisdomTree, Inc. | | | | | | | | |
| 5.750%, 08/15/2028 (e) | | $ | 500,000 | | | | 497,250 | |
| | | | | | | | | |
| Financial Services - 2.45% | | | | | | | | |
| EZCORP, Inc. | | | | | | | | |
| 2.875%, 07/01/2024 | | | 56,000 | | | | 59,783 | |
| 3.750%, 12/15/2029 (e) | | | 1,000,000 | | | | 987,161 | |
| | | | | | | | 1,046,944 | |
| TOTAL CONVERTIBLE BONDS | | | | | | | | |
| (Cost $1,560,148) | | | | | | | 1,544,194 | |
| | | | | | | | | |
| CORPORATE BONDS - 22.23% | | | | | | | | |
| Broadcasting (except Internet) - 2.08% | | | | | | | | |
| DISH DBS Corp. | | | | | | | | |
| 5.875%, 11/15/2024 | | | 1,000,000 | | | | 891,140 | |
| | | | | | | | | |
| Consumer Durables & Apparel - 2.64% | | | | | | | | |
| Vista Outdoor, Inc. | | | | | | | | |
| 4.500%, 03/15/2029 (e) | | | 1,400,000 | | | | 1,131,718 | |
See notes to financial statements.
| SCHEDULE OF INVESTMENTS (continued) |
| March 31, 2023 (Unaudited) |
| CORPORATE BONDS - 22.23% (continued) | | Principal Amount | | | Value | |
| Consumer Services - 1.97% | | | | | | |
| Nathan’s Famous, Inc. | | | | | | |
| 6.625%, 11/01/2025 (e) | | $ | 845,000 | | | $ | 842,811 | |
| | | | | | | | | |
| Financial Services - 0.15% | | | | | | | | |
| Oppenheimer Holdings, Inc. | | | | | | | | |
| 5.500%, 10/01/2025 | | | 66,000 | | | | 63,332 | |
| | | | | | | | | |
| Food, Beverage & Tobacco - 2.25% | | | | | | | | |
| Turning Point Brands, Inc. | | | | | | | | |
| 5.625%, 02/15/2026 (e) | | | 1,064,000 | | | | 964,807 | |
| | | | | | | | | |
| Materials - 2.23% | | | | | | | | |
| Vedanta Resources Finance II PLC | | | | | | | | |
| 8.000%, 04/23/2023 (d)(e) | | | 1,000,000 | | | | 953,500 | |
| | | | | | | | | |
| Nonstore Retailers - 1.87% | | | | | | | | |
| QVC, Inc. | | | | | | | | |
| 4.850%, 04/01/2024 | | | 1,000,000 | | | | 801,270 | |
| | | | | | | | | |
| Pharmaceuticals, Biotechnology & Life Sciences - 3.69% | | | | | | | | |
| Celgene Corp. | | | | | | | | |
| 3.900%, 02/20/2028 | | | 23,000 | | | | 21,957 | |
| Trulieve Cannabis Corp. | | | | | | | | |
| 9.750%, 06/18/2024 (d) | | | 1,005,000 | | | | 956,140 | |
| 8.000%, 10/06/2026 (d) | | | 750,000 | | | | 602,201 | |
| | | | | | | | 1,580,298 | |
| | | | | | | | | |
| Securities, Commodity Contracts, and Other | | | | | | | | |
| Financial Investments and Related Activities - 3.12% | | | | | | | | |
| Atento Luxco 1 SA | | | | | | | | |
| 8.000%, 02/10/2026 (d)(e) | | | 2,325,000 | | | | 732,375 | |
| 20.000%, 03/10/2025 (d)(e) | | | 642,000 | | | | 601,875 | |
| | | | | | | | 1,334,250 | |
| | | | | | | | | |
| Utilities - 2.23% | | | | | | | | |
| IEA Energy Services LLC | | | | | | | | |
| 6.625%, 08/15/2029 (e) | | | 1,000,000 | | | | 953,900 | |
| TOTAL CORPORATE BONDS | | | | | | | | |
| (Cost $10,801,338) | | | | | | | 9,517,026 | |
See notes to financial statements.
| SCHEDULE OF INVESTMENTS (continued) |
| March 31, 2023 (Unaudited) |
| WARRANTS - 0.17% | | Shares | | | Value | |
| Health Care - 0.16% | | | | | | |
| Cansortium Warrants | | | | | | |
| Expiration: 04/29/2025, | | | | | | |
| Exercise Price $1.20 (b)(c) | | | 250,000 | | | $ | 37,500 | |
| Green Thumb Industries, Inc. | | | | | | | | |
| Expiration: 10/15/2026, | | | | | | | | |
| Exercise Price $30.00 (b)(c) | | | 7,328 | | | | 32,976 | |
| | | | | | | | 70,476 | |
| Securities, Commodity Contracts, and Other | | | | | | | | |
| Financial Investments and Related Activities - 0.01% | | | | | | | | |
| Atento Warrants 2025 | | | | | | | | |
| Expiration: 02/13/2026, | | | | | | | | |
| Exercise Price $3.78 (b)(c) | | | 128,400 | | | | 1,284 | |
| TOTAL WARRANTS (Cost $0) | | | | | | | 71,760 | |
| | | | | | | | | |
| SHORT-TERM INVESTMENT - 6.76% | | | | | | | | |
| Money Market Fund - 6.76% | | | | | | | | |
| STIT - Treasury Portfolio - | | | | | | | | |
| Institutional Class, 4.72% (f) | | | 2,896,634 | | | | 2,896,634 | |
| TOTAL SHORT-TERM INVESTMENT | | | | | | | | |
| (Cost $2,896,634) | | | | | | | 2,896,634 | |
| Total Investments (Cost $38,141,580) - 101.23% | | | | | | | 43,339,272 | |
| Liabilities in Excess of Other Assets - (1.23%) | | | | | | | (524,955 | ) |
| TOTAL NET ASSETS - 100.00% | | | | | | $ | 42,814,317 | |
ADR - American Depository Receipt
Percentages are stated as a percent of net assets.
| (a) | The rate listed is a fixed rate. |
| (b) | Security is fair valued using fair value methodologies established by the Fund’s investment adviser, and is deemed a Level 3 security. See Footnote 2. The aggregate value of fair valued securities as of March 31, 2023 was $1,985,960, which represented 4.64% of net assets. |
| (c) | Non-income producing security. |
| (d) | Foreign Issued Security. |
| (e) | Securities purchases pursuant to Rule 144A of the Securities Act of 1933, as amended, and may be sold only to dealers in that program or other “qualified institutional buyers.” As of March 31, 2023, the value of these investments was $7,665,397, or 17.90% of total net assets. |
| (f) | Rate listed is the 7-day effective yield. |
See notes to financial statements.
| SCHEDULE OF INVESTMENTS |
| March 31, 2023 (Unaudited) |
| COMMON STOCKS - 79.84% | | Shares | | | Value | |
| Banks - 1.21% | | | | | | |
| Hilltop Holdings, Inc. | | | 21,633 | | | $ | 641,851 | |
| | | | | | | | | |
| Capital Goods - 9.36% | | | | | | | | |
| Acuity Brands, Inc. | | | 8,097 | | | | 1,479,565 | |
| Armstrong World Industries, Inc. | | | 19,078 | | | | 1,359,117 | |
| Park Aerospace Corp. | | | 157,694 | | | | 2,120,984 | |
| | | | | | | | 4,959,666 | |
| | | | | | | | | |
| Commercial & Professional Services - 6.82% | | | | | | | | |
| Conduent, Inc. (a) | | | 391,528 | | | | 1,342,941 | |
| Franklin Covey Co. (a) | | | 59,102 | | | | 2,273,654 | |
| | | | | | | | 3,616,595 | |
| | | | | | | | | |
| Consumer Durables & Apparel - 10.96% | | | | | | | | |
| Carter’s, Inc. | | | 23,820 | | | | 1,713,134 | |
| LGI Homes, Inc. (a) | | | 13,206 | | | | 1,505,880 | |
| Skechers USA, Inc. - Class A (a) | | | 54,434 | | | | 2,586,704 | |
| | | | | | | | 5,805,718 | |
| | | | | | | | | |
| Diversified Financials - 5.91% | | | | | | | | |
| Cboe Global Markets, Inc. | | | 11,649 | | | | 1,563,762 | |
| Jefferies Financial Group, Inc. | | | 49,435 | | | | 1,569,067 | |
| | | | | | | | 3,132,829 | |
| | | | | | | | | |
| Energy - 5.70% | | | | | | | | |
| Civitas Resources, Inc. | | | 44,207 | | | | 3,021,107 | |
| | | | | | | | | |
| Financial Services - 2.00% | | | | | | | | |
| Pagseguro Digital Ltd. - Class A (a)(b) | | | 123,482 | | | | 1,058,241 | |
| | | | | | | | | |
| Food, Beverage & Tobacco - 6.25% | | | | | | | | |
| Becle SAB de CV (b) | | | 1,071,395 | | | | 2,787,886 | |
| Vector Group Ltd. | | | 43,881 | | | | 527,011 | |
| | | | | | | | 3,314,897 | |
| | | | | | | | | |
| Materials - 4.30% | | | | | | | | |
| Valvoline, Inc. | | | 65,179 | | | | 2,277,354 | |
| | | | | | | | | |
| Media & Entertainment - 3.16% | | | | | | | | |
| IAC, Inc. (a) | | | 32,427 | | | | 1,673,233 | |
See notes to financial statements.
| SCHEDULE OF INVESTMENTS (continued) |
| March 31, 2023 (Unaudited) |
| COMMON STOCKS - 79.84% (continued) | | Shares | | | Value | |
| Real Estate - 5.09% | | | | | | |
| FRP Holdings, Inc. (a) | | | 46,581 | | | $ | 2,696,108 | |
| | | | | | | | | |
| Software & Services - 9.35% | | | | | | | | |
| Dropbox, Inc. - Class A (a) | | | 98,255 | | | | 2,124,273 | |
| WNS Holdings Ltd. - ADR (a)(b) | | | 30,380 | | | | 2,830,505 | |
| | | | | | | | 4,954,778 | |
| | | | | | | | | |
| Technology Hardware & Equipment - 9.73% | | | | | | | | |
| Fabrinet (a)(b) | | | 20,670 | | | | 2,454,769 | |
| Silicom Ltd. (a)(b) | | | 72,127 | | | | 2,703,320 | |
| | | | | | | | 5,158,089 | |
| TOTAL COMMON STOCKS (Cost $34,169,933) | | | | | | | 42,310,466 | |
| | | | | | | | | |
| EXCHANGE-TRADED FUND - 3.89% | | | | | | | | |
| Materials - 3.89% | | | | | | | | |
| IShares Gold Trust | | | 55,158 | | | | 2,061,254 | |
| TOTAL EXCHANGE-TRADED FUND | | | | | | | | |
| (Cost 1,411,681) | | | | | | | 2,061,254 | |
| | | | | | | | | |
| REAL ESTATE INVESTMENT TRUST (REIT) - 4.21% | | | | | | | | |
| Real Estate - 4.21% | | | | | | | | |
| Chicago Atlantic Real Estate Finance, Inc. | | | 164,908 | | | | 2,227,907 | |
| TOTAL REIT (Cost 2,500,006) | | | | | | | 2,227,907 | |
| Total Investments (Cost 38,081,618) - 87.94% | | | | | | | 46,599,627 | |
| Other Assets in Excess of Liabilities - 12.06% | | | | | | | 6,392,865 | |
| TOTAL NET ASSETS - 100.00% | | | | | | $ | 52,992,492 | |
ADR - American Depository Receipt
Percentages are stated as a percent of net assets.
| (a) | Non-income producing security. |
| (b) | Foreign Issued Security. |
See notes to financial statements.
| SCHEDULE OF INVESTMENTS |
| March 31, 2023 (Unaudited) |
| BANK LOANS - 14.98% | | Principal Amount | | | Value | |
| Health Care - 13.25% | | | | | | |
| Devi Holdings, Inc. | | | | | | |
| 11.750%, 05/08/2024 (a)(b) | | $ | 7,312,089 | | | $ | 7,260,905 | |
| 8.000%, 04/08/2024 (a)(b) | | | 1,037,856 | | | | 1,037,856 | |
| Gage Growth Corp. 13.750%, 11/01/2024 (a) | | | 6,524,949 | | | | 6,470,792 | |
| Shryne Group, Inc. 7.500%, 05/26/2026 (a)(b) | | | 9,000,000 | | | | 8,857,800 | |
| Vcp23 LLC 7.000%, 04/30/2024 (a)(b) | | | 9,000,000 | | | | 8,370,000 | |
| Verano Holdings Corp. 12.750%, 10/30/2026 (a) | | | 8,000,000 | | | | 7,785,600 | |
| | | | | | | | 39,782,953 | |
| | | | | | | | | |
| Capital Goods - 1.73% | | | | | | | | |
| Tutor Perini Corp. 9.608% | | | | | | | | |
| (1 Month LIBOR USD + 0.9608%), | | | | | | | | |
| 05/31/2023 (c) | | | 5,568,226 | | | | 5,204,565 | |
| TOTAL BANK LOANS (Cost $45,592,269) | | | | | | | 44,987,518 | |
| | | | | | | | | |
| CONVERTIBLE BONDS - 8.29% | | | | | | | | |
| Capital Goods - 0.35% | | | | | | | | |
| Lightning eMotors, Inc. | | | | | | | | |
| 7.500%, 05/15/2024 (d) | | | 1,900,000 | | | | 1,054,500 | |
| | | | | | | | | |
| Diversified Financials - 4.00% | | | | | | | | |
| Starwood Property Trust, Inc. | | | | | | | | |
| 4.375%, 04/01/2023 | | | 8,000,000 | | | | 8,038,895 | |
| WisdomTree, Inc. | | | | | | | | |
| 5.750%, 08/15/2028 (d) | | | 4,000,000 | | | | 3,978,000 | |
| | | | | | | | 12,016,895 | |
| | | | | | | | | |
| Financial Services - 1.07% | | | | | | | | |
| EZCORP, Inc. | | | | | | | | |
| 3.750%, 12/15/2029 (d) | | | 3,250,000 | | | | 3,208,272 | |
| | | | | | | | | |
| Media & Entertainment - 1.65% | | | | | | | | |
| WildBrain Ltd. | | | | | | | | |
| 5.875%, 09/30/2024 (b)(e) | | | 7,000,000 | | | | 4,959,305 | |
| | | | | | | | | |
| Real Estate Management & Development - 1.22% | | | | | | | | |
| DigitalBridge Group, Inc. | | | | | | | | |
| 5.000%, 04/15/2023 | | | 3,652,000 | | | | 3,670,274 | |
| TOTAL CONVERTIBLE BONDS | | | | | | | | |
| (Cost $25,846,586) | | | | | | | 24,909,246 | |
See notes to financial statements.
| SCHEDULE OF INVESTMENTS (continued) |
| March 31, 2023 (Unaudited) |
| CORPORATE BONDS - 73.85% | | Principal Amount | | | Value | |
| Capital Goods - 2.44% | | | | | | |
| Carlisle Companies, Inc. | | | | | | |
| 0.550%, 09/01/2023 | | $ | 7,500,000 | | | $ | 7,337,572 | |
| | | | | | | | | |
| Clothing and Clothing Accessories Stores - 3.02% | | | | | | | | |
| Abercrombie & Fitch Management Co. | | | | | | | | |
| 8.750%, 07/15/2025 (d) | | | 9,000,000 | | | | 9,077,658 | |
| | | | | | | | | |
| Commercial & Professional Services - 2.94% | | | | | | | | |
| Cimpress PLC | | | | | | | | |
| 7.000%, 06/15/2026 (e) | | | 7,100,000 | | | | 5,808,262 | |
| ProSomnus, Inc. | | | | | | | | |
| 9.000%, 12/06/2025 (b) | | | 3,391,961 | | | | 3,025,629 | |
| | | | | | | | 8,833,891 | |
| | | | | | | | | |
| Consumer Durables & Apparel - 2.48% | | | | | | | | |
| LGI Homes, Inc. | | | | | | | | |
| 4.000%, 07/15/2029 (d) | | | 2,400,000 | | | | 1,952,376 | |
| Vista Outdoor, Inc. | | | | | | | | |
| 4.500%, 03/15/2029 (d) | | | 6,795,000 | | | | 5,492,874 | |
| | | | | | | | 7,445,250 | |
| | | | | | | | | |
| Consumer Discretionary - 0.95% | | | | | | | | |
| Evergreen Acqco 1 LP | | | | | | | | |
| 9.750%, 04/26/2028 (d) | | | 3,000,000 | | | | 2,853,075 | |
| | | | | | | | | |
| Consumer Services - 2.98% | | | | | | | | |
| Brinker International, Inc. | | | | | | | | |
| 5.000%, 10/01/2024 (d) | | | 7,000,000 | | | | 6,874,630 | |
| Nathan’s Famous, Inc. | | | | | | | | |
| 6.625%, 11/01/2025 (d) | | | 2,079,000 | | | | 2,073,616 | |
| | | | | | | | 8,948,246 | |
| | | | | | | | | |
| Data Processing, Hosting and Related Services - 1.84% | | | | | | | | |
| Conduent Business Services LLC | | | | | | | | |
| 6.000%, 11/01/2029 (d) | | | 7,000,000 | | | | 5,529,254 | |
See notes to financial statements.
| SCHEDULE OF INVESTMENTS (continued) |
| March 31, 2023 (Unaudited) |
| CORPORATE BONDS - 73.85% (continued) | | Principal Amount | | | Value | |
| Diversified Financials - 4.20% | | | | | | |
| AFC Gamma, Inc. | | | | | | |
| 5.750%, 05/01/2027 (d) | | $ | 10,000,000 | | | $ | 7,600,000 | |
| Enceladus Development Venture III LLC | | | | | | | | |
| 10.000%, 11/15/2023 (d) | | | 5,000,000 | | | | 5,012,500 | |
| | | | | | | | 12,612,500 | |
| | | | | | | | | |
| Energy - 9.50% | | | | | | | | |
| Bristow Group, Inc. | | | | | | | | |
| 6.875%, 03/01/2028 (d) | | | 7,550,000 | | | | 7,033,513 | |
| Citgo Holding, Inc. | | | | | | | | |
| 9.250%, 08/01/2024 (d) | | | 7,500,000 | | | | 7,521,150 | |
| Energy Transfer LP | | | | | | | | |
| 5.875%, 01/15/2024 | | | 269,000 | | | | 268,330 | |
| Kinder Morgan, Inc. | | | | | | | | |
| 5.625%, 11/15/2023 (d) | | | 7,345,000 | | | | 7,339,992 | |
| W&T Offshore, Inc. | | | | | | | | |
| 11.750%, 02/01/2026 (d) | | | 6,496,000 | | | | 6,371,674 | |
| | | | | | | | 28,534,659 | |
| | | | | | | | | |
| Financial Services - 4.62% | | | | | | | | |
| Fiserv, Inc. | | | | | | | | |
| 3.800%, 10/01/2023 | | | 9,000,000 | | | | 8,918,019 | |
| AIG Global Funding | | | | | | | | |
| 0.800%, 07/07/2023 (d) | | | 5,000,000 | | | | 4,940,737 | |
| | | | | | | | 13,858,756 | |
| | | | | | | | | |
| Food, Beverage & Tobacco - 5.21% | | | | | | | | |
| Turning Point Brands, Inc. | | | | | | | | |
| 5.625%, 02/15/2026 (d) | | | 11,610,000 | | | | 10,527,638 | |
| Vector Group Ltd. | | | | | | | | |
| 10.500%, 11/01/2026 (d) | | | 5,100,000 | | | | 5,130,473 | |
| | | | | | | | 15,658,111 | |
| | | | | | | | | |
| Materials - 3.40% | | | | | | | | |
| Warrior Met Coal, Inc. | | | | | | | | |
| 7.875%, 12/01/2028 (d) | | | 3,500,000 | | | | 3,523,206 | |
| Vedanta Resources Finance II PLC | | | | | | | | |
| 8.000%, 04/23/2023 (d)(e) | | | 7,000,000 | | | | 6,674,500 | |
| | | | | | | | 10,197,706 | |
See notes to financial statements.
| SCHEDULE OF INVESTMENTS (continued) |
| March 31, 2023 (Unaudited) |
| CORPORATE BONDS - 73.85% (continued) | | Principal Amount | | | Value | |
| Media & Entertainment - 1.43% | | | | | | |
| Rackspace Technology Global, Inc. | | | | | | |
| 5.375%, 12/01/2028 (d) | | $ | 11,316,000 | | | $ | 4,287,783 | |
| | | | | | | | | |
| Mining (except Oil and Gas) - 1.85% | | | | | | | | |
| Alliance Resource Operating Partners LP | | | | | | | | |
| 7.500%, 05/01/2025 (d) | | | 5,600,000 | | | | 5,569,944 | |
| | | | | | | | | |
| Nonstore Retailers - 2.18% | | | | | | | | |
| QVC, Inc. | | | | | | | | |
| 4.850%, 04/01/2024 | | | 8,155,000 | | | | 6,534,357 | |
| | | | | | | | | |
| Personal and Laundry Services - 2.03% | | | | | | | | |
| ANGI Group LLC | | | | | | | | |
| 3.875%, 08/15/2028 (d) | | | 8,000,000 | | | | 6,087,551 | |
| | | | | | | | | |
| Pharmaceuticals, Biotechnology & Life Sciences - 5.60% | | | | | | | | |
| Trulieve Cannabis Corp. | | | | | | | | |
| 9.750%, 06/18/2024 (e) | | | 4,798,000 | | | | 4,564,738 | |
| 8.000%, 10/06/2026 (e) | | | 15,250,000 | | | | 12,244,745 | |
| | | | | | | | 16,809,483 | |
| | | | | | | | | |
| Primary Metal Manufacturing - 0.77% | | | | | | | | |
| TMS International Corp. | | | | | | | | |
| 6.250%, 04/15/2029 (d) | | | 3,000,000 | | | | 2,316,394 | |
| | | | | | | | | |
| Real Estate - 3.26% | | | | | | | | |
| American Tower Corp. | | | | | | | | |
| 3.000%, 06/15/2023 | | | 9,829,000 | | | | 9,773,563 | |
| | | | | | | | | |
| Repair and Maintenance - 2.52% | | | | | | | | |
| WASH Multifamily Acquisition, Inc. | | | | | | | | |
| 5.750%, 04/15/2026 (d) | | | 8,000,000 | | | | 7,578,880 | |
| | | | | | | | | |
| Securities, Commodity Contracts, and Other | | | | | | | | |
| Financial Investments and Related Activities - 3.91% | | | | | | | | |
| Atento Luxco 1 SA | | | | | | | | |
| 8.000%, 02/10/2026 (d)(e) | | | 18,026,000 | | | | 5,678,190 | |
| 20.000%, 03/10/2025 (d)(e) | | | 6,481,000 | | | | 6,075,938 | |
| | | | | | | | 11,754,128 | |
See notes to financial statements.
| SCHEDULE OF INVESTMENTS (continued) |
| March 31, 2023 (Unaudited) |
| CORPORATE BONDS - 73.85% (continued) | | Principal Amount | | | Value | |
| Support Activities for Mining - 1.03% | | | | | | |
| Earthstone Energy Holdings LLC | | | | | | |
| 8.000%, 04/15/2027 (d) | | $ | 3,194,000 | | | $ | 3,102,373 | |
| | | | | | | | | |
| Telecommunication Services - 3.42% | | | | | | | | |
| Cincinnati Bell Telephone Co. LLC | | | | | | | | |
| 6.300%, 12/01/2028 | | | 3,253,000 | | | | 2,706,691 | |
| Linkem SpA | | | | | | | | |
| 8.452% (3 Month EURIBOR + 6.250%), | | | | | | | | |
| 08/09/2023 (c)(d)(e) | | | 7,000,000 | | | | 7,572,553 | |
| | | | | | | | 10,279,244 | |
| | | | | | | | | |
| Utilities - 2.27% | | | | | | | | |
| IEA Energy Services LLC | | | | | | | | |
| 6.625%, 08/15/2029 (d) | | | 7,140,000 | | | | 6,810,846 | |
| TOTAL CORPORATE BONDS | | | | | | | | |
| (Cost $239,497,402) | | | | | | | 221,791,224 | |
| | | | | | | | | |
| WARRANTS - 0.1% | | | | | | | | |
| Securities, Commodity Contracts, and Other | | | | | | | | |
| Financial Investments and Related Activities - 0.1% | | | | | | | | |
| Atento Luxco 1 SA | | | | | | | | |
| Expiration: 02/13/2026, | | | | | | | | |
| Exercise Price: $3.78 (b)(f) | | | 1,296,200 | | | | 12,962 | |
| | | | | | | | | |
| Health Care Equipment & Services - 0.00% | | | | | | | | |
| Prosomnus, Inc. | | | | | | | | |
| Expiration: 11/30/2027, Exercise Price: $11.50 (f) | | | 33,919 | | | | 4,223 | |
| TOTAL WARRANTS (Cost $0) | | | | | | | 17,185 | |
See notes to financial statements.
| SCHEDULE OF INVESTMENTS (continued) |
| March 31, 2023 (Unaudited) |
| SHORT-TERM INVESTMENT - 8.39% | | Shares | | | Value | |
| Money Market Fund - 8.39% | | | | | | |
| STIT - Treasury Portfolio - | | | | | | |
| Institutional Class, 4.72% (g) | | | 25,207,359 | | | $ | 25,207,359 | |
| TOTAL SHORT TERM INVESTMENT | | | | | | | | |
| (Cost $25,207,359) | | | | | | | 25,207,359 | |
| Total Investments (Cost $336,143,616) - 105.52% | | | | | | | 316,912,532 | |
| Liabilities in Excess of Other Assets - (5.52%) | | | | | | | (16,583,932 | ) |
| TOTAL NET ASSETS - 100.00% | | | | | | $ | 300,328,600 | |
Percentages are stated as a percent of net assets.
| (a) | The rate listed is a fixed rate. |
| (b) | Security is fair valued using fair value methodologies established by the Fund’s investment adviser, and is deemed a Level 3 security. See Footnote 2. The aggregate value of fair valued securities as of March 31, 2023 was $33,524,457 which represented 11.16% of net assets. |
| (c) | Rates for variable rate securities will typically have interest rates that redetermine periodically by reference to a base lending rate plus a spread. Variable rate securities that reference EURIBOR may be subject to a credit spread adjustment, particularly to legacy LIBOR bank loans or lines of credit that have transitioned to EURIBOR as the base lending rate. |
| (d) | Securities purchases pursuant to Rule 144A of the Securities Act of 1933, as amended, and may be sold only to dealers in that program or other “qualified institutional buyers.” As of March 31, 2023, the value of these investments was $168,850,090, or 56.22% of total net assets. |
| (e) | Foreign Issued Security. |
| (f) | Non-income producing security. |
| (g) | Rate listed is the 7-day effective yield. |
See notes to financial statements.
| SCHEDULE OF OPEN FORWARD CURRENCY CONTRACTS |
| March 31, 2023 (Unaudited) |
| | | | | Amount of | | | | Amount of | | | | |
| | | | | Currency to | | | | Currency to | | | | |
| | Forward
| Currency
| | be Received | | Currency
| | be Delivered | | | Unrealized
| |
| Counterparty | Settlement | to be | | in Local | | to be | | in Local | | | Appreciation | |
of Contracts | Date | Received | | Currency | | Delivered | | Currency | | | (Depreciation) | |
State Street Bank | 10/3/23 | USD | | | 5,344,071 | | CAD | | | 7,205,625 | | | $ | (3,461 | ) |
State Street Bank | 4/20/23 | USD | | | 7,637,140 | | EUR | | | 7,035,933 | | | | (1,840 | ) |
| | | | | | | | | | | | | | $ | (5,301 | ) |
See notes to financial statements.
| STATEMENTS OF ASSETS AND LIABILITIES |
| March 31, 2023 (Unaudited) |
| | | Intrepid | | | Intrepid | | | Intrepid | |
| | | Capital Fund | | | Small Cap Fund | | | Income Fund | |
| ASSETS: | | | | | | | | | |
Investments, at value(1) | | $ | 43,339,272 | | | $ | 46,599,627 | | | $ | 316,912,532 | |
Foreign currency, at value(2) | | | — | | | | — | | | | 150,363 | |
| Receivable for investment securities purchased | | | — | | | | 518,431 | | | | 639,484 | |
| Income receivable | | | 376,304 | | | | 254,913 | | | | 5,369,896 | |
| Receivable for fund shares sold | | | 7,702 | | | | 372 | | | | 1,029,487 | |
| Cash | | | — | | | | 5,676,472 | | | | 807,870 | |
| Other assets | | | 35,355 | | | | 37,310 | | | | 93,796 | |
| Total assets | | | 43,758,633 | | | | 53,087,126 | | | | 325,003,428 | |
| LIABILITIES: | | | | | | | | | | | | |
| Payable for fund shares redeemed | | | 159,401 | | | | 13,033 | | | | 1,238,928 | |
| Payable for investment securities purchased | | | 664,688 | | | | — | | | | 22,980,115 | |
| Depreciation on forward currency contracts | | | — | | | | — | | | | 5,301 | |
| Payable for foreign currencies purchased | | | — | | | | — | | | | 332 | |
| Payable to Investment Adviser | | | 13,237 | | | | 19,406 | | | | 183,679 | |
| Payable to Custodian | | | — | | | | — | | | | 4,414 | |
| Distribution payable | | | 41,345 | | | | — | | | | 179,898 | |
| Accrued distribution fees | | | 6,602 | | | | 6,448 | | | | — | |
| Other expenses payable | | | 59,043 | | | | 55,747 | | | | 82,161 | |
| Total liabilities | | | 944,316 | | | | 94,634 | | | | 24,674,828 | |
| Total net assets | | $ | 42,814,317 | | | $ | 52,992,492 | | | $ | 300,328,600 | |
| NET ASSETS CONSIST OF: | | | | | | | | | | | | |
| Capital stock | | $ | 57,655,369 | | | $ | 49,363,153 | | | $ | 332,681,886 | |
| Total distributable earnings | | | (14,841,052 | ) | | | 3,629,337 | | | | (32,353,286 | ) |
| Total net assets | | $ | 42,814,317 | | | $ | 52,992,492 | | | $ | 300,328,600 | |
| Investor Class | | | | | | | | | | | | |
| Net assets | | $ | 13,387,446 | | | $ | 29,437,930 | | | $ | — | |
| Shares outstanding | | | 1,269,880 | | | | 1,959,992 | | | | — | |
| Institutional Class | | | | | | | | | | | | |
| Net assets | | | 29,426,871 | | | | 23,554,562 | | | | 300,328,600 | |
| Shares outstanding | | | 2,778,634 | | | | 1,516,160 | | | | 34,545,948 | |
| Total shares outstanding (unlimited | | | | | | | | | | | | |
| shares of no par value authorized) | | | 4,048,514 | | | | 3,476,152 | | | | 34,545,948 | |
| Investor Class Net asset value, offering | | | | | | | | | | | | |
and redemption price per share(3) | | $ | 10.54 | | | $ | 15.02 | | | $ | — | |
| Institutional Class Net asset value, offering | | | | | | | | | | | | |
and redemption price per share(3) | | $ | 10.59 | | | $ | 15.54 | | | $ | 8.69 | |
| (1) | Cost of Investments | | $ | 38,141,580 | | | $ | 38,081,618 | | | $ | 336,143,616 | |
| (2) | Cost of Foreign Securities | | | | | | | | | | $ | 150,262 | |
(3) | If applicable, redemption price per share may be reduced by a 2.00% redemption fee for shares redeemed within 30 days of purchase. |
See notes to financial statements.
| STATEMENTS OF OPERATIONS |
| For the Six Months Ended March 31, 2023 (Unaudited) |
| | | Intrepid | | | Intrepid | | | Intrepid | |
| | | Capital Fund | | | Small Cap Fund | | | Income Fund | |
| INVESTMENT INCOME: | | | | | | | | | |
| Dividend income | | $ | 240,434 | | | $ | 632,627 | | | $ | 3,723 | |
| Interest income | | | 938,463 | | | | — | | | | 15,087,468 | |
| Total investment income | | | 1,178,897 | | | | 632,627 | | | | 15,091,191 | |
| Advisory fees (See Note 3) | | | 221,206 | | | | 278,245 | | | | 1,120,381 | |
| Administration fees | | | 35,620 | | | | 37,700 | | | | 120,405 | |
| Fund accounting fees | | | 30,929 | | | | 30,561 | | | | 47,115 | |
| Shareholder servicing fees and expenses | | | 26,526 | | | | 30,561 | | | | 52,821 | |
| Audit fees | | | 22,108 | | | | 22,558 | | | | 22,288 | |
| Federal and state registration | | | 20,836 | | | | 18,106 | | | | 19,464 | |
| Legal fees | | | 11,080 | | | | 10,536 | | | | 9,904 | |
| Distribution (12b-1) fees - | | | | | | | | | | | | |
| Investor Class Only (See Note 4) | | | 10,564 | | | | 38,311 | | | | — | |
| Custody fees | | | 4,818 | | | | 3,935 | | | | 10,831 | |
| Trustees fees and expenses | | | 4,360 | | | | 5,722 | | | | 26,602 | |
| Miscellaneous | | | 3,640 | | | | 2,724 | | | | 6,856 | |
| Reports to shareholders | | | 3,192 | | | | 1,910 | | | | 3,850 | |
| Insurance | | | 1,272 | | | | 1,634 | | | | 7,536 | |
| Interest fees | | | 320 | | | | — | | | | 4,966 | |
| Total expenses before Adviser waiver | | | 396,471 | | | | 482,503 | | | | 1,453,019 | |
| Expenses waived by Adviser (See Note 3) | | | (131,200 | ) | | | (139,535 | ) | | | (103,596 | ) |
| Total net expenses | | | 265,271 | | | | 342,968 | | | | 1,349,423 | |
| Net investment income | | | 913,626 | | | | 289,659 | | | | 13,741,768 | |
| NET REALIZED AND UNREALIZED | | | | | | | | | | | | |
| GAIN (LOSS) ON INVESTMENTS: | | | | | | | | | | | | |
| Net realized gain (loss) on: | | | | | | | | | | | | |
| Investments and foreign currency translation | | | 197,242 | | | | 14,241 | | | | (4,063,158 | ) |
| Forward currency contracts | | | — | | | | — | | | | (399,400 | ) |
| Net change in unrealized | | | | | | | | | | | | |
| appreciation (depreciation) on: | | | | | | | | | | | | |
| Investments and foreign currency translation | | | 2,700,000 | | | | (17,248,718 | ) | | | 1,189,416 | |
| Forward currency contracts | | | — | | | | (124,502 | ) | | | (491,130 | ) |
| Net realized and unrealized gain (loss) | | | 2,897,242 | | | | (17,358,979 | ) | | | (3,764,267 | ) |
| Net increase in net assets | | | | | | | | | | | | |
| resulting from operations | | $ | 3,810,868 | | | $ | (17,069,320 | ) | | $ | 9,997,496 | |
See notes to financial statements.
| |
| STATEMENTS OF CHANGES IN NET ASSETS |
| | | Period Ended | | | | |
| | | March 31, 2023 | | | Year Ended | |
| | | (Unaudited) | | | September 30, 2022 | |
| OPERATIONS: | | | | | | |
| Net investment income | | $ | 913,626 | | | $ | 1,179,544 | |
| Net realized gain on investments | | | | | | | | |
| and foreign currency translation | | | 197,242 | | | | 3,552,127 | |
| Net change in unrealized | | | | | | | | |
| appreciation (depreciation) | | | 2,700,000 | | | | (11,339,181 | ) |
| Net increase (decrease) in assets | | | | | | | | |
| resulting from operations | | | 3,810,868 | | | | (6,607,510 | ) |
| | | | | | | | | |
| DISTRIBUTIONS TO SHAREHOLDERS: | | | | | | | | |
| Net dividends and distributions | | | | | | | | |
| to shareholders - Investor Class | | | | | | | | |
| Ordinary Income | | | (281,615 | ) | | | (360,288 | ) |
| Return of Capital | | | — | | | | (36,668 | ) |
| Net dividends and distributions | | | | | | | | |
| to shareholders - Institutional Class | | | | | | | | |
| Ordinary Income | | | (628,922 | ) | | | (708,787 | ) |
| Return of Capital | | | — | | | | (70,119 | ) |
| Total dividends and distributions | | | (910,537 | ) | | | (1,175,862 | ) |
| | | | | | | | | |
| CAPITAL SHARE TRANSACTIONS: | | | | | | | | |
| Proceeds from shares sold - Investor Class | | | 70,260 | | | | 262,827 | |
| Proceeds from shares sold - Institutional Class | | | 1,554,544 | | | | 2,349,529 | |
| Proceeds from shares issued to holders in | | | | | | | | |
| reinvestment of dividends - Investor Class | | | 263,780 | | | | 372,130 | |
| Proceeds from shares issued to holders in | | | | | | | | |
| reinvestment of dividends - Institutional Class | | | 605,411 | | | | 739,073 | |
Cost of shares redeemed - Investor Class(1) | | | (2,145,825 | ) | | | (3,526,981 | ) |
Cost of shares redeemed - Institutional Class(2) | | | (3,761,092 | ) | | | (4,167,595 | ) |
| Net decrease in net assets | | | | | | | | |
| from capital share transactions | | | (3,412,922 | ) | | | (3,971,017 | ) |
| | | | | | | | | |
| TOTAL DECREASE IN NET ASSETS | | | (512,591 | ) | | | (11,754,389 | ) |
| | | | | | | | | |
| NET ASSETS: | | | | | | | | |
| Beginning of period | | | 43,326,908 | | | | 55,081,297 | |
| End of period | | $ | 42,814,317 | | | $ | 43,326,908 | |
(1) | Net of redemption fees of $0 and $0, respectively. |
(2) | Net of redemption fees of $0 and $0, respectively. |
See notes to financial statements.
| |
| STATEMENTS OF CHANGES IN NET ASSETS (continued) |
| | | Period Ended | | | | |
| | | March 31, 2023 | | | Year Ended | |
| | | (Unaudited) | | | September 30, 2022 | |
OPERATIONS: | | | | | | |
| Net investment income(loss) | | $ | 289,659 | | | $ | (22,011 | ) |
| Net realized gain on investments | | | | | | | | |
| and foreign currency translation | | | 14,241 | | | | 597,644 | |
| Net change in unrealized | | | | | | | | |
| appreciation(depreciation) | | | 6,299,613 | | | | (17,373,220 | ) |
| Net increase(decrease) in assets | | | | | | | | |
| resulting from operations | | | 6,603,513 | | | | (16,797,587 | ) |
| | | | | | | | | |
| DISTRIBUTIONS TO SHAREHOLDERS: | | | | | | | | |
| Net dividends and distributions | | | | | | | | |
| to shareholders - Investor Class | | | — | | | | — | |
| Net dividends and distributions | | | | | | | | |
| to shareholders - Institutional Class | | | — | | | | — | |
| Total dividends and distributions | | | — | | | | — | |
| | | | | | | | | |
| CAPITAL SHARE TRANSACTIONS: | | | | | | | | |
| Proceeds from shares sold - Investor Class | | | 221,478 | | | | 1,529,282 | |
| Proceeds from shares sold - Institutional Class | | | 335,278 | | | | 1,476,712 | |
| Proceeds from shares issued to holders in | | | | | | | | |
| reinvestment of dividends - Investor Class | | | — | | | | — | |
| Proceeds from shares issued to holders in | | | | | | | | |
| reinvestment of dividends - Institutional Class | | | — | | | | — | |
Cost of shares redeemed - Investor Class(1) | | | (4,285,156 | ) | | | (5,541,363 | ) |
Cost of shares redeemed - Institutional Class(2) | | | (3,074,358 | ) | | | (6,003,444 | ) |
| Net decrease in net assets | | | | | | | | |
| from capital share transactions | | | (6,802,758 | ) | | | (8,538,813 | ) |
| | | | | | | | | |
| TOTAL DECREASE IN NET ASSETS | | | (199,245 | ) | | | (25,336,400 | ) |
| | | | | | | | | |
| NET ASSETS: | | | | | | | | |
| Beginning of period | | | 53,191,737 | | | | 78,528,137 | |
| End of period | | $ | 52,992,492 | | | $ | 53,191,737 | |
(1) | Net of redemption fees of $0 and $0, respectively. |
(2) | Net of redemption fees of $0 and $20, respectively. |
See notes to financial statements.
| |
| STATEMENTS OF CHANGES IN NET ASSETS (continued) |
| | | Period Ended | | | | |
| | | March 31, 2023 | | | Year Ended | |
| | | (Unaudited) | | | September 30, 2022 | |
| OPERATIONS: | | | | | | |
| Net investment income | | $ | 13,741,768 | | | $ | 20,023,004 | |
| Net realized loss on investments | | | | | | | | |
| and foreign currency translation | | | (4,462,558 | ) | | | (7,538,128 | ) |
| Net change in unrealized | | | | | | | | |
| appreciation (depreciation) | | | 698,286 | | | | (25,195,341 | ) |
| Net increase (decrease) in assets | | | | | | | | |
| resulting from operations | | | 9,977,496 | | | | (12,710,465 | ) |
| | | | | | | | | |
| DISTRIBUTIONS TO SHAREHOLDERS: | | | | | | | | |
| Net dividends and distributions to shareholders | | | (13,871,527 | ) | | | (19,979,452 | ) |
| Total dividends and distributions | | | (13,871,527 | ) | | | (19,979,452 | ) |
| | | | | | | | | |
| CAPITAL SHARE TRANSACTIONS: | | | | | | | | |
| Proceeds from shares sold | | | 90,923,421 | | | | 241,036,090 | |
| Proceeds from shares issued to holders | | | | | | | | |
| in reinvestment of dividends | | | 13,040,738 | | | | 18,528,930 | |
Cost of shares redeemed(1) | | | (76,582,750 | ) | | | (215,132,841 | ) |
| Net increase in net assets | | | | | | | | |
| from capital share transactions | | | 27,381,409 | | | | 44,432,179 | |
| | | | | | | | | |
| TOTAL INCREASE IN NET ASSETS | | | 23,487,378 | | | | 11,742,262 | |
| | | | | | | | | |
| NET ASSETS: | | | | | | | | |
| Beginning of period | | | 276,841,222 | | | | 265,212,060 | |
| End of period | | $ | 300,328,600 | | | $ | 276,841,222 | |
(1) | Net of redemption fees of $5,359 and $37,966, respectively. |
See notes to financial statements.
| Intrepid Capital Fund – Investor Class |
Per share data for a share of capital stock outstanding for the entire period and selected information for the period are as follows:
| | | Period Ended | | |
| |
| | | March 31, | | | Year Ended September 30,
| |
| | | 2023 | | | 2022 | | | 2021 | | | 2020 | | | 2019 | | | 2018 | |
| | | (Unaudited) | | | | | | | | | | | | | | | | |
| NET ASSET VALUE: | | | | | | | | | | | | | | | | | | |
| Beginning of period | | $ | 9.88 | | | $ | 11.69 | | | $ | 9.58 | | | $ | 10.28 | | | $ | 11.64 | | | $ | 11.92 | |
| OPERATIONS: | | | | | | | | | | | | | | | | | | | | | | | | |
Net investment income(1)(2) | | | 0.21 | | | | 0.25 | | | | 0.16 | | | | 0.11 | | | | 0.24 | | | | 0.19 | |
| Net realized and unrealized | | | | | | | | | | | | | | | | | | | | | | | | |
| gain (loss) on | | | | | | | | | | | | | | | | | | | | | | | | |
| investment securities | | | 0.68 | | | | (1.80 | ) | | | 2.16 | | | | (0.31 | ) | | | (1.21 | ) | | | (0.04 | ) |
Total from operations(3) | | | 0.89 | | | | (1.55 | ) | | | 2.32 | | | | (0.20 | ) | | | (0.97 | ) | | | 0.15 | |
| LESS DISTRIBUTIONS: | | | | | | | | | | | | | | | | | | | | | | | | |
| From net investment income | | | (0.23 | ) | | | (0.24 | ) | | | (0.16 | ) | | | (0.50 | ) | | | (0.20 | ) | | | (0.19 | ) |
| From return of capital | | | — | | | | (0.02 | ) | | | (0.05 | ) | | | — | | | | — | | | | — | |
| From net realized gains | | | — | | | | — | | | | — | | | | — | | | | (0.19 | ) | | | (0.24 | ) |
| Total distributions | | | (0.23 | ) | | | (0.26 | ) | | | (0.21 | ) | | | (0.50 | ) | | | (0.39 | ) | | | (0.43 | ) |
| NET ASSET VALUE: | | | | | | | | | | | | | | | | | | | | | | | | |
End of period | | $ | 10.54 | | | $ | 9.88 | | | $ | 11.69 | | | $ | 9.58 | | | $ | 10.28 | | | $ | 11.64 | |
Total return | | | 8.97 | %(4) | | | -13.39 | % | | | 24.30 | % | | | -1.88 | % | | | -8.26 | % | | | 1.24 | % |
Net assets at end of period | | | | | | | | | | | | | | | | | | | | | | | | |
(000s omitted) | | $ | 13,387 | | | $ | 14,244 | | | $ | 19,764 | | | $ | 20,038 | | | $ | 34,291 | | | $ | 64,198 | |
| RATIO OF EXPENSES TO | | | | | | | | | | | | | | | | | | | | | | | | |
| AVERAGE NET ASSETS: | | | | | | | | | | | | | | | | | | | | | | | | |
| Before expense | | | | | | | | | | | | | | | | | | | | | | | | |
| reimbursement/recoupment | | | 1.89 | %(5) | | | 1.92 | % | | | 1.82 | % | | | 1.69 | % | | | 1.53 | % | | | 1.46 | % |
| After expense | | | | | | | | | | | | | | | | | | | | | | | | |
| reimbursement/recoupment | | | 1.30 | %(5) | | | 1.40 | % | | | 1.40 | % | | | 1.40 | % | | | 1.40 | % | | | 1.40 | % |
| RATIO OF NET INVESTMENT | | | | | | | | | | | | | | | | | | | | | | | | |
| INCOME TO AVERAGE NET ASSETS: | | | | | | | | | | | | | | | | | | | | | | | | |
| Before expense | | | | | | | | | | | | | | | | | | | | | | | | |
| reimbursement/recoupment | | | 3.42 | %(5) | | | 1.65 | % | | | 1.05 | % | | | 0.91 | % | | | 1.43 | % | | | 1.20 | % |
| After expense | | | | | | | | | | | | | | | | | | | | | | | | |
| reimbursement/recoupment | | | 4.01 | %(5) | | | 2.17 | % | | | 1.46 | % | | | 1.20 | % | | | 1.56 | % | | | 1.26 | % |
Portfolio turnover rate | | | 38 | %(4) | | | 36 | % | | | 17 | % | | | 60 | % | | | 54 | % | | | 46 | % |
(1) | Net investment income per share is calculated using the ending accumulated net investment income balances prior to consideration or adjustment for permanent book-to-tax differences for the years ended September 30, 2019, and 2018. |
(2) | Net investment income per share is calculated using the average shares outstanding method for the years ended September 30, 2022, 2021, and 2020, and for the six months ended March 31, 2023. |
(3) | Total from investment operations per share includes redemption fees of less than $0.01 per share for each of the five years ended September 30, 2022, 2021, 2020, 2019, and 2018. |
(4) | Not Annualized. |
(5) | Annualized. |
See notes to financial statements.
| Intrepid Capital Fund – Institutional Class |
| |
| FINANCIAL HIGHLIGHTS (continued) |
Per share data for a share of capital stock outstanding for the entire period and selected information for the period are as follows:
| | | Period Ended | | |
| |
| | | March 31, | | | Year Ended September 30, | |
| | | 2023 | | | 2022 | | | 2021 | | | 2020 | | | 2019 | | | 2018 | |
| | | (Unaudited) | | | | | | | | | | | | | | | | |
| NET ASSET VALUE: | | | | | | | | | | | | | | | | | | |
| Beginning of period | | $ | 9.92 | | | $ | 11.72 | | | $ | 9.59 | | | $ | 10.29 | | | $ | 11.65 | | | $ | 11.92 | |
| OPERATIONS: | | | | | | | | | | | | | | | | | | | | | | | | |
Net investment income(1)(2) | | | 0.22 | | | | 0.27 | | | | 0.19 | | | | 0.14 | | | | 0.22 | | | | 0.18 | |
| Net realized and unrealized | | | | | | | | | | | | | | | | | | | | | | | | |
| gain (loss) on | | | | | | | | | | | | | | | | | | | | | | | | |
| investment securities | | | 0.68 | | | | (1.80 | ) | | | 2.17 | | | | (0.32 | ) | | | (1.16 | ) | | | (0.00 | )(4) |
Total from operations(3) | | | 0.90 | | | | (1.53 | ) | | | 2.36 | | | | (0.18 | ) | | | (0.94 | ) | | | 0.18 | |
| LESS DISTRIBUTIONS: | | | | | | | | | | | | | | | | | | | | | | | | |
| From net investment income | | | (0.23 | ) | | | (0.24 | ) | | | (0.16 | ) | | | (0.52 | ) | | | (0.23 | ) | | | (0.21 | ) |
| From return of capital | | | — | | | | (0.03 | ) | | | (0.07 | ) | | | — | | | | — | | | | — | |
| From net realized gains | | | — | | | | — | | | | — | | | | — | | | | (0.19 | ) | | | (0.24 | ) |
| Total distributions | | | (0.23 | ) | | | (0.27 | ) | | | (0.23 | ) | | | (0.52 | ) | | | (0.42 | ) | | | (0.45 | ) |
| NET ASSET VALUE: | | | | | | | | | | | | | | | | | | | | | | | | |
End of period | | $ | 10.59 | | | $ | 9.92 | | | $ | 11.72 | | | $ | 9.59 | | | $ | 10.29 | | | $ | 11.65 | |
Total return | | | 9.07 | %(5) | | | -13.23 | % | | | 24.72 | % | | | -1.67 | % | | | -8.07 | % | | | 1.52 | % |
Net assets at end of period | | | | | | | | | | | | | | | | | | | | | | | | |
(000s omitted) | | $ | 29,427 | | | $ | 29,083 | | | $ | 35,318 | | | $ | 44,189 | | | $ | 84,874 | | | $ | 256,969 | |
| RATIO OF EXPENSES TO | | | | | | | | | | | | | | | | | | | | | | | | |
| AVERAGE NET ASSETS: | | | | | | | | | | | | | | | | | | | | | | | | |
| Before expense | | | | | | | | | | | | | | | | | | | | | | | | |
| reimbursement/recoupment | | | 1.75 | %(6) | | | 1.67 | % | | | 1.57 | % | | | 1.44 | % | | | 1.28 | % | | | 1.21 | % |
| After expense | | | | | | | | | | | | | | | | | | | | | | | | |
| reimbursement/recoupment | | | 1.15 | %(6) | | | 1.15 | % | | | 1.15 | % | | | 1.15 | % | | | 1.15 | % | | | 1.15 | % |
| RATIO OF NET INVESTMENT | | | | | | | | | | | | | | | | | | | | | | | | |
| INCOME TO AVERAGE NET ASSETS: | | | | | | | | | | | | | | | | | | | | | | | | |
| Before expense | | | | | | | | | | | | | | | | | | | | | | | | |
| reimbursement/recoupment | | | 3.59 | %(6) | | | 1.91 | % | | | 1.29 | % | | | 1.17 | % | | | 1.71 | % | | | 1.46 | % |
| After expense | | | | | | | | | | | | | | | | | | | | | | | | |
| reimbursement/recoupment | | | 4.19 | %(6) | | | 2.43 | % | | | 1.71 | % | | | 1.46 | % | | | 1.84 | % | | | 1.52 | % |
Portfolio turnover rate | | | 38 | %(5) | | | 36 | % | | | 17 | % | | | 60 | % | | | 54 | % | | | 46 | % |
(1) | Net investment income per share is calculated using the ending accumulated net investment income balances prior to consideration or adjustment for permanent book-to-tax differences for the years ended September 30, 2019, and 2018. |
(2) | Net investment income per share is calculated using the average shares outstanding method for the years ended September 30, 2022, 2021, and 2020, and for the six months ended March 31, 2023. |
(3) | Total from investment operations per share includes redemption fees of less than $0.01 per share for each of the five years ended September 30, 2022, 2021, 2020, 2019, and 2018. |
(4) | The amount represents less than $0.01 per share. |
(5) | Not Annualized. |
(6) | Annualized. |
See notes to financial statements.
| Intrepid Small Cap Fund – Investor Class |
| |
| FINANCIAL HIGHLIGHTS (continued) |
Per share data for a share of capital stock outstanding for the entire period and selected information for the period are as follows:
| | | Period Ended | | |
| |
| | | March 31, | | | Year Ended September 30, | |
| | | 2023 | | | 2022 | | | 2021 | | | 2020 | | | 2019 | | | 2018 | |
| | | (Unaudited) | | | | | | | | | | | | | | | | |
| NET ASSET VALUE: | | | | | | | | | | | | | | | | | | |
| Beginning of period | | $ | 13.35 | | | $ | 17.51 | | | $ | 14.09 | | | $ | 13.56 | | | $ | 13.89 | | | $ | 14.46 | |
| OPERATIONS: | | | | | | | | | | | | | | | | | | | | | | | | |
| Net investment | | | | | | | | | | | | | | | | | | | | | | | | |
income (loss)(1) | | | 0.07 | | | | (0.02 | ) | | | (0.18 | ) | | | (0.07 | ) | | | 0.08 | | | | 0.04 | |
| Net realized and unrealized | | | | | | | | | | | | | | | | | | | | | | | | |
| gain (loss) on | | | | | | | | | | | | | | | | | | | | | | | | |
| investment securities | | | 1.60 | | | | (4.14 | ) | | | 3.60 | | | | 0.71 | | | | (0.34 | ) | | | (0.10 | ) |
Total from operations(2) | | | 1.67 | | | | (4.16 | ) | | | 3.42 | | | | 0.64 | | | | (0.26 | ) | | | (0.06 | ) |
| LESS DISTRIBUTIONS: | | | | | | | | | | | | | | | | | | | | | | | | |
| From net investment income | | | — | | | | — | | | | — | | | | (0.11 | ) | | | (0.07 | ) | | | (0.01 | ) |
| From net realized gains | | | — | | | | — | | | | — | | | | — | | | | — | | | | (0.50 | ) |
| Total distributions | | | — | | | | — | | | | 0.00 | | | | (0.11 | ) | | | (0.07 | ) | | | (0.51 | ) |
| NET ASSET VALUE: | | | | | | | | | | | | | | | | | | | | | | | | |
End of period | | $ | 15.02 | | | $ | 13.35 | | | $ | 17.51 | | | $ | 14.09 | | | $ | 13.56 | | | $ | 13.89 | |
Total return | | | 12.51 | %(4) | | | -23.76 | % | | | 24.27 | % | | | 4.72 | % | | | -1.85 | % | | | -0.49 | % |
Net assets at end of | | | | | | | | | | | | | | | | | | | | | | | | |
period (000s omitted) | | $ | 29,438 | | | $ | 29,850 | | | $ | 43,458 | | | $ | 38,376 | | | $ | 51,076 | | | $ | 75,405 | |
| RATIO OF EXPENSES TO | | | | | | | | | | | | | | | | | | | | | | | | |
| AVERAGE NET ASSETS: | | | | | | | | | | | | | | | | | | | | | | | | |
| Before expense | | | | | | | | | | | | | | | | | | | | | | | | |
| reimbursement/recoupment | | | 1.85 | %(5) | | | 1.77 | % | | | 1.73 | % | | | 1.73 | % | | | 1.55 | % | | | 1.48 | % |
| After expense | | | | | | | | | | | | | | | | | | | | | | | | |
| reimbursement/recoupment | | | 1.30 | %(5) | | | 1.30 | % | | | 1.31 | %(3) | | | 1.40 | % | | | 1.38 | % | | | 1.37 | % |
| RATIO OF NET INVESTMENT | | | | | | | | | | | | | | | | | | | | | | | | |
| INCOME (LOSS) TO | | | | | | | | | | | | | | | | | | | | | | | | |
| AVERAGE NET ASSETS: | | | | | | | | | | | | | | | | | | | | | | | | |
| Before expense | | | | | | | | | | | | | | | | | | | | | | | | |
| reimbursement/recoupment | | | 0.43 | %(5) | | | (0.57 | )% | | | (1.44 | )% | | | (0.87 | )% | | | 0.41 | % | | | 0.14 | % |
| After expense | | | | | | | | | | | | | | | | | | | | | | | | |
| reimbursement/recoupment | | | 0.98 | %(5) | | | (0.10 | )% | | | (1.04 | )% | | | (0.54 | )% | | | 0.58 | % | | | 0.25 | % |
Portfolio turnover rate | | | 28 | %(4) | | | 66 | % | | | 81 | % | | | 105 | % | | | 59 | % | | | 44 | % |
(1) | Net investment income (loss) per share is calculated using the average shares outstanding method for the years ended September 30, 2022, 2021, 2020, 2019 and 2018 and for the six months ended March 31, 2023. |
(2) | Total from investment operations per share includes redemption fees of less than $0.01 per share for each of the five years ended September 30, 2022, 2021, 2020, 2019, and 2018. |
(3) | Expense waiver of 1.30% was implemented on January 22, 2021. |
(4) | Not Annualized. |
(5) | Annualized. |
See notes to financial statements.
| Intrepid Small Cap Fund – Institutional Class |
| |
| FINANCIAL HIGHLIGHTS (continued) |
Per share data for a share of capital stock outstanding for the entire period and selected information for the period are as follows:
| | | Period Ended | | | | | | | | | | | | | | | | |
| | | March 31, | | | Year Ended September 30, | |
| | | 2023 | | | 2022 | | | 2021 | | | 2020 | | | 2019 | | | 2018 | |
| | | (Unaudited) | | | | | | | | | | | | | | | | |
| NET ASSET VALUE: | | | | | | | | | | | | | | | | | | |
| Beginning of period | | $ | 13.79 | | | $ | 18.07 | | | $ | 14.52 | | | $ | 13.94 | | | $ | 14.25 | | | $ | 14.81 | |
| OPERATIONS: | | | | | | | | | | | | | | | | | | | | | | | | |
| Net investment | | | | | | | | | | | | | | | | | | | | | | | | |
income gain (loss)(1)(2) | | | 0.09 | | | | 0.01 | | | | (0.16 | ) | | | (0.04 | ) | | | 0.11 | | | | 0.19 | |
| Net realized and unrealized | | | | | | | | | | | | | | | | | | | | | | | | |
| gain (loss) on | | | | | | | | | | | | | | | | | | | | | | | | |
| investment securities | | | 1.66 | | | | (4.29 | ) | | | 3.71 | | | | 0.74 | | | | (0.34 | ) | | | (0.23 | ) |
Total from operations(3) | | | 1.75 | | | | (4.28 | ) | | | 3.55 | | | | 0.70 | | | | (0.23 | ) | | | (0.04 | ) |
| LESS DISTRIBUTIONS: | | | | | | | | | | | | | | | | | | | | | | | | |
| From net investment income | | | — | | | | — | | | | — | | | | (0.12 | ) | | | (0.08 | ) | | | (0.02 | ) |
| From net realized gains | | | — | | | | — | | | | — | | | | — | | | | — | | | | (0.50 | ) |
| Total distributions | | | 0.00 | | | | 0.00 | | | | 0.00 | | | | (0.12 | ) | | | (0.08 | ) | | | (0.52 | ) |
| NET ASSET VALUE: | | | | | | | | | | | | | | | | | | | | | | | | |
End of period | | $ | 15.54 | | | $ | 13.79 | | | $ | 18.07 | | | $ | 14.52 | | | $ | 13.94 | | | $ | 14.25 | |
Total return | | | 12.61 | %(4) | | | -23.63 | % | | | 24.45 | % | | | 5.02 | % | | | -1.61 | % | | | -0.34 | % |
Net assets at end of | | | | | | | | | | | | | | | | | | | | | | | | |
period (000s omitted) | | $ | 23,555 | | | $ | 23,342 | | | $ | 35,070 | | | $ | 19,879 | | | $ | 30,516 | | | $ | 48,117 | |
| RATIO OF EXPENSES TO | | | | | | | | | | | | | | | | | | | | | | | | |
| AVERAGE NET ASSETS: | | | | | | | | | | | | | | | | | | | | | | | | |
| Before expense | | | | | | | | | | | | | | | | | | | | | | | | |
| reimbursement/recoupment | | | 1.60 | %(5) | | | 1.51 | % | | | 1.51 | % | | | 1.48 | % | | | 1.32 | % | | | 1.26 | % |
| After expense | | | | | | | | | | | | | | | | | | | | | | | | |
| reimbursement/recoupment | | | 1.15 | %(5) | | | 1.15 | % | | | 1.15 | % | | | 1.15 | % | | | 1.15 | % | | | 1.15 | % |
| RATIO OF NET INVESTMENT | | | | | | | | | | | | | | | | | | | | | | | | |
| INCOME (LOSS) TO | | | | | | | | | | | | | | | | | | | | | | | | |
| AVERAGE NET ASSETS: | | | | | | | | | | | | | | | | | | | | | | | | |
| Before expense | | | | | | | | | | | | | | | | | | | | | | | | |
| reimbursement/recoupment | | | 0.67 | %(5) | | | (0.31 | )% | | | (1.23 | )% | | | (0.60 | )% | | | 0.64 | % | | | 0.37 | % |
| After expense | | | | | | | | | | | | | | | | | | | | | | | | |
| reimbursement/recoupment | | | 1.12 | %(5) | | | 0.05 | % | | | (0.87 | )% | | | (0.27 | )% | | | 0.81 | % | | | 0.48 | % |
Portfolio turnover rate | | | 28 | %(4) | | | 66 | % | | | 81 | % | | | 105 | % | | | 59 | % | | | 44 | % |
(1) | Net investment income (loss) per share is calculated using the ending accumulated net investment income (loss) balances prior to consideration or adjustment for permanent book-to-tax differences for the years ended September 30, 2018. |
(2) | Net investment income (loss) per share is calculated using the average shares outstanding method for each of the years ended September 30, 2022, 2021, 2020, and 2019 and for the six months ended March 31, 2023. |
(3) | Total from investment operations per share includes redemption fees of less than $0.01 for each of the five years ended September 30, 2022, 2021, 2020, 2019, and 2018. |
(4) | Not Annualized. |
(5) | Annualized. |
See notes to financial statements.
| Intrepid Income Fund – Institutional Class |
| |
| FINANCIAL HIGHLIGHTS (continued) |
Per share data for a share of capital stock outstanding for the entire period and selected information for the period are as follows:
| | | Period Ended | | | | | | | | | | | | | | | | |
| | | March 31, | | | Year Ended September 30, | |
| | | 2023 | | | 2022 | | | 2021 | | | 2020 | | | 2019 | | | 2018 | |
| | | (Unaudited) | | | | | | | | | | | | | | | | |
| NET ASSET VALUE: | | | | | | | | | | | | | | | | | | |
| Beginning of period | | $ | 8.81 | | | $ | 9.78 | | | $ | 8.93 | | | $ | 9.17 | | | $ | 9.21 | | | $ | 9.29 | |
| OPERATIONS: | | | | | | | | | | | | | | | | | | | | | | | | |
Net investment income(1)(2) | | | 0.41 | | | | 0.64 | | | | 0.61 | | | | 0.47 | | | | 0.32 | | | | 0.27 | |
| Net realized and unrealized | | | | | | | | | | | | | | | | | | | | | | | | |
| gain (loss) on | | | | | | | | | | | | | | | | | | | | | | | | |
| investment securities | | | (0.12 | ) | | | (0.97 | ) | | | 0.84 | | | | (0.27 | ) | | | (0.04 | ) | | | (0.08 | ) |
Total from operations(3) | | | 0.29 | | | | (0.33 | ) | | | 1.45 | | | | 0.20 | | | | 0.28 | | | | 0.19 | |
| LESS DISTRIBUTIONS: | | | | | | | | | | | | | | | | | | | | | | | | |
| From net investment income | | | (0.41 | ) | | | (0.65 | ) | | | (0.60 | ) | | | (0.44 | ) | | | (0.32 | ) | | | (0.27 | ) |
| From net realized gains | | | — | | | | — | | | | — | | | | — | | | | — | | | | — | |
| Total distributions | | | (0.41 | ) | | | (0.65 | ) | | | (0.60 | ) | | | (0.44 | ) | | | (0.32 | ) | | | (0.27 | ) |
| NET ASSET VALUE: | | | | | | | | | | | | | | | | | | | | | | | | |
End of period | | $ | 8.69 | | | $ | 8.80 | | | $ | 9.78 | | | $ | 8.93 | | | $ | 9.17 | | | $ | 9.21 | |
Total return | | | 3.41 | %(4) | | | -3.59 | % | | | 16.62 | % | | | 2.27 | % | | | 3.07 | % | | | 2.05 | % |
Net assets at end of | | | | | | | | | | | | | | | | | | | | | | | | |
period (000s omitted) | | $ | 300,329 | | | $ | 276,841 | | | $ | 265,212 | | | $ | 95,196 | | | $ | 58,672 | | | $ | 74,620 | |
| RATIO OF EXPENSES | | | | | | | | | | | | | | | | | | | | | | | | |
| TO AVERAGE NET ASSETS: | | | | | | | | | | | | | | | | | | | | | | | | |
| Before expense | | | | | | | | | | | | | | | | | | | | | | | | |
| reimbursement/recoupment | | | 0.97 | %(5) | | | 0.98 | % | | | 1.04 | % | | | 1.17 | % | | | 1.09 | % | | | 1.03 | % |
| After expense | | | | | | | | | | | | | | | | | | | | | | | | |
| reimbursement/recoupment | | | 0.90 | %(5) | | | 0.91 | % | | | 0.91 | % | | | 0.91 | % | | | 0.90 | % | | | 0.90 | % |
| RATIO OF NET INVESTMENT | | | | | | | | | | | | | | | | | | | | | | | �� | |
| INCOME TO AVERAGE NET ASSETS: | | | | | | | | | | | | | | | | | | | | | | | | |
| Before expense | | | | | | | | | | | | | | | | | | | | | | | | |
| reimbursement/recoupment | | | 9.14 | %(5) | | | 6.68 | % | | | 6.25 | % | | | 4.99 | % | | | 3.13 | % | | | 2.70 | % |
| After expense | | | | | | | | | | | | | | | | | | | | | | | | |
| reimbursement/recoupment | | | 9.20 | %(5) | | | 6.75 | % | | | 6.38 | % | | | 5.25 | % | | | 3.32 | % | | | 2.83 | % |
Portfolio turnover rate | | | 74 | %(4) | | | 146 | % | | | 94 | % | | | 144 | % | | | 104 | % | | | 52 | % |
(1) | Net investment income per share is calculated using the ending accumulated net investment income balances prior to consideration or adjustment for permanent book-to-tax differences for the years ended September 30, 2019, and 2018. |
(2) | Net investment income per share is calculated using the average shares outstanding method for the years ended September 30, 2022, 2021, and 2020, and for the six months ended March 31, 2023. |
(3) | Total from investment operations per share includes redemption fees of less than $0.01 per share for the years ended September 30, 2022, 2021, 2020, 2019 and 2018 and for the six months ended March 31, 2023. |
(4) | Not Annualized. |
(5) | Annualized. |
See notes to financial statements.
| NOTES TO FINANCIAL STATEMENTS |
| March 31, 2023 (Unaudited) |
Intrepid Capital Management Funds Trust (the “Trust”) was organized as a Delaware Statutory Trust on August 27, 2004 and is registered under the Investment Company Act of 1940, as amended (the “1940 Act”), as an open-end management investment company issuing shares in series, each series representing a distinct portfolio with its own investment objectives and policies. At September 30, 2022, the Trust consisted of three series (the “Funds”): Intrepid Capital Fund, Intrepid Small Cap Fund, and Intrepid Income Fund. The Intrepid Capital Fund’s Investor Class commenced operations on January 3, 2005, the Intrepid Capital Fund’s Institutional Class commenced operations on April 30, 2010, the Intrepid Small Cap Fund’s Investor Class commenced operations on October 3, 2005, the Intrepid Small Cap Fund’s Institutional Class commenced operations on November 3, 2009, the Intrepid Income Fund’s Investor Class commenced operations on July 2, 2009 and ceased operations on January 31, 2014. Effective as of the close of business on January 31, 2014 all Investor Class shares of the Intrepid Income Fund were converted into Institutional Class shares. The Intrepid Income Fund’s Institutional Class commenced operations on August 16, 2010. Effective as of June 6, 2022, the Intrepid Endurance Fund changed its name to the Intrepid Small Cap Fund.
| 2. | SUMMARY OF SIGNIFICANT ACCOUNTING POLICIES |
The following is a summary of significant accounting policies consistently followed by the Funds in the preparation of their financial statements. These policies are in conformity with accounting principles generally accepted in the United States (“GAAP”). The Funds are investment companies and, accordingly, follow the investment company accounting and reporting guidance of the Financial Accounting Standards Board Accounting Standards Codification Topic 946, Investment Companies.
Valuation of Securities
The Trust has adopted authoritative fair valuation accounting standards which establish an authoritative definition of fair value and set out a hierarchy for measuring fair value. These standards require additional disclosures about the various inputs and valuation techniques used to develop the measurements of fair value and a discussion in changes in valuation techniques and related inputs during the period. These inputs are summarized in the three broad levels listed below.
| • Level 1 - | Quoted prices in active markets for identical securities. |
| | |
| • Level 2 - | Other significant observable inputs (including quoted prices for similar securities, interest rates, prepayment speeds, credit risk, etc.). |
| | |
| • Level 3 - | Significant unobservable inputs (including the Fund’s own assumptions in determining the fair value of investments). |
| NOTES TO FINANCIAL STATEMENTS (continued) |
| March 31, 2023 (Unaudited) |
Equity investments, including common stocks, foreign issued common stocks, exchange-traded funds, closed end mutual funds, real estate investments trusts and certain preferred securities, which are traded on an exchange (other than The NASDAQ OMX Group, Inc., referred to as “NASDAQ”) are valued at the last sale price reported by the exchange on which the securities are primarily traded on the day of valuation. Securities that are traded on NASDAQ under one of its three listing tiers, NASDAQ Global Market, NASDAQ Global Select Market and NASDAQ Capital Market, are valued at the NASDAQ Official Closing Price. If there are no sales on a given day for securities traded on an exchange, the latest mean quotation will be used. If there is no Nasdaq Official Closing Price for a Nasdaq-listed security or sale price available for an over-the-counter security, the latest mean quotations from Nasdaq will be used. When using the market quotations or closing price provided by the pricing service and when the market is considered active, the security will be classified as a Level 1 security. When using the latest mean quotation, the security will be classified as Level 2.
Investment in mutual funds, including money market funds, are generally priced at the ending net asset value (NAV) provided by the service agent of the funds and will be classified as Level 1 securities.
Debt securities, such as corporate bonds, convertible bonds, senior loans, and U.S. government agency issues for which market quotations are not readily available may be valued based on information supplied by independent pricing services using matrix pricing formulas and/or independent broker bid quotations. Debt securities with remaining maturities of 60 days or less may be valued on an amortized cost basis to the extent it is equivalent to fair value, which involves valuing an instrument at its cost and thereafter assuming a constant amortization to maturity of any discount or premium, regardless of the impact of fluctuating rates on the fair value of the instrument. Amortized cost will not be used if it does not approximate fair value, due to credit or other impairments of the issuer. These securities will generally be classified as Level 2 securities. Warrants for which the underlying security is registered and equities which are subject to a required holding period, but have a comparable public issue, are valued in good faith by the Adviser pursuant to fair value methodologies established by the Adviser in its capacity as the valuation designee under Rule 2a-5 of the 1940 Act. These securities will generally be classified as Level 2 securities. If the warrant is exchange traded and the official closing price of the exchange is used, these instruments are classified as Level 1 securities.
Forward currency contracts derive their value from the underlying currency prices. These are valued by a pricing service using pricing models. The models use inputs that are observed from active markets, such as exchange rates. These contracts are classified as Level 2.
| NOTES TO FINANCIAL STATEMENTS (continued) |
| March 31, 2023 (Unaudited) |
Pursuant to the requirements of Rule 2a-5, the Board designated the Adviser as its valuation designee to perform fair value determinations. Any securities or other assets for which market quotations are not readily available are valued at fair value as determined in good faith by the Adviser pursuant to fair value methodologies established by the Adviser, and will be classified as Level 3 assets.
The inputs of methodology used for valuing securities may not be an indication of the risk associated with investing in those securities.
As of March 31, 2023, the Funds’ assets and liabilities carried at fair value were classified as follows:
| Intrepid Capital Fund | | | | | | | | | | | | |
| | | | | | | | | | | | | |
| Description | | Level 1 | | | Level 2 | | | Level 3 | | | Total | |
| Assets | | | | | | | | | | | | |
| Total Bank Loans* | | | | | | | | | | | | |
| Health Care | | $ | — | | | $ | 2,941,906 | | | $ | 1,914,200 | | | $ | 4,856,106 | |
| Total Bank Loans | | | — | | | | 2,941,906 | | | | 1,914,200 | | | | 4,856,106 | |
| Total Common Stocks* | | | 24,453,552 | | | | — | | | | — | | | | 24,453,552 | |
| Total Convertible Bonds* | | | — | | | | 1,544,194 | | | | — | | | | 1,544,194 | |
| Total Corporate Bonds* | | | — | | | | 9,517,026 | | | | — | | | | 9,517,026 | |
| Total Warrants* | | | — | | | | — | | | | 71,760 | | | | 71,760 | |
| Money Market Fund* | | | 2,896,634 | | | | — | | | | — | | | | 2,896,634 | |
| Total Assets | | $ | 27,350,186 | | | $ | 14,003,126 | | | $ | 1,985,960 | | | $ | 43,339,272 | |
| | | | | | | | | | | | | | | | | |
| Intrepid Small Cap Fund | | | | | | | | | | | | | | | | |
| | | | | | | | | | | | | |
| Description | | Level 1 | | | Level 2 | | | Level 3 | | | Total | |
| Assets | | | | | | | | | | | | | | | | |
| Total Common Stocks* | | $ | 42,310,466 | | | $ | — | | | $ | — | | | $ | 42,310,466 | |
| Total Exchange- | | | | | | | | | | | | | | | | |
| Traded Fund* | | | 2,061,254 | | | | — | | | | — | | | | 2,061,254 | |
| Total Real Estate | | | | | | | | | | | | | | | | |
| Investment Trust (REIT)* | | | 2,227,907 | | | | — | | | | — | | | | 2,227,907 | |
| Total Assets | | $ | 46,599,627 | | | $ | — | | | $ | — | | | $ | 46,599,627 | |
| NOTES TO FINANCIAL STATEMENTS (continued) |
| March 31, 2023 (Unaudited) |
| Intrepid Income Fund | | | | | | | | | | | | |
| | | | | | | | | | | | | |
| Description | | Level 1 | | | Level 2 | | | Level 3 | | | Total | |
| Assets | | | | | | | | | | | | |
| Total Bank Loans* | | | | | | | | | | | | |
| Capital Goods | | $ | — | | | $ | 5,204,565 | | | $ | — | | | $ | 5,204,565 | |
| Health Care | | | — | | | | 14,256,392 | | | | 25,526,561 | | | | 39,782,953 | |
| Total Bank Loans | | | — | | | | 19,460,957 | | | | 25,526,561 | | | | 44,987,518 | |
| Total Convertible Bonds* | | | | | | | | | | | | | | | | |
| Capital Goods | | | — | | | | 1,054,500 | | | | — | | | | 1,054,500 | |
| Diversified Financials | | | — | | | | 12,016,895 | | | | — | | | | 12,016,895 | |
| Financial Services | | | — | | | | 3,208,272 | | | | — | | | | 3,208,272 | |
| Media and Entertainment | | | — | | | | — | | | | 4,959,305 | | | | 4,959,305 | |
| Real Estate Management | | | | | | | | | | | | | | | | |
| & Development | | | — | | | | 3,670,274 | | | | — | | | | 3,670,274 | |
| Total Convertible Bonds | | | — | | | | 19,949,941 | | | | 4,959,305 | | | | 24,909,246 | |
| Total Corporate Bonds* | | | | | | | | | | | | | | | | |
| Capital Goods | | | — | | | | 7,337,572 | | | | — | | | | 7,337,572 | |
| Clothing and Clothing | | | | | | | | | | | | | | | | |
| Accessories Stores | | | — | | | | 9,077,658 | | | | — | | | | 9,077,658 | |
| Commercial & | | | | | | | | | | | | | | | | |
| Professional Services | | | — | | | | 5,808,262 | | | | 3,025,629 | | | | 8,833,891 | |
| Consumer Durables | | | | | | | | | | | | | | | | |
| & Apparel | | | — | | | | 7,445,250 | | | | — | | | | 7,445,250 | |
| Consumer Discretionary | | | — | | | | 2,853,075 | | | | — | | | | 2,853,075 | |
| Consumer Services | | | — | | | | 8,948,245 | | | | — | | | | 8,948,245 | |
| Data Processing, Hosting, | | | | | | | | | | | | | | | | |
| and Related Services | | | — | | | | 5,529,254 | | | | — | | | | 5,529,254 | |
| Diversified Financials | | | — | | | | 12,612,500 | | | | — | | | | 12,612,500 | |
| Energy | | | — | | | | 28,534,659 | | | | — | | | | 28,534,659 | |
| Financial Services | | | — | | | | 13,858,756 | | | | — | | | | 13,858,756 | |
| Food, Beverage & Tobacco | | | — | | | | 15,658,111 | | | | — | | | | 15,658,111 | |
| Materials | | | — | | | | 10,197,706 | | | | — | | | | 10,197,706 | |
| Media & Entertainment | | | — | | | | 4,287,783 | | | | — | | | | 4,287,783 | |
| Mining (except Oil | | | | | | | | | | | | | | | | |
| and Gas) | | | — | | | | 5,569,944 | | | | — | | | | 5,569,944 | |
| Nonstore Retailers | | | — | | | | 6,534,357 | | | | — | | | | 6,534,357 | |
| Personal and | | | | | | | | | | | | | | | | |
| Laundry Services | | | — | | | | 6,087,551 | | | | — | | | | 6,087,551 | |
| Pharmaceuticals, | | | | | | | | | | | | | | | | |
| Biotechnology & | | | | | | | | | | | | | | | | |
| Life Sciences | | | — | | | | 16,809,483 | | | | — | | | | 16,809,483 | |
| Primary Metal | | | | | | | | | | | | | | | | |
| Manufacturing | | | — | | | | 2,316,394 | | | | — | | | | 2,316,394 | |
| Real Estate | | | — | | | | 9,773,563 | | | | — | | | | 9,773,563 | |
| NOTES TO FINANCIAL STATEMENTS (continued) |
| March 31, 2023 (Unaudited) |
| Intrepid Income Fund (continued) | | | | | | | | | | | | |
| | | | | | | | | | | | | |
| Description | | Level 1 | | | Level 2 | | | Level 3 | | | Total | |
| Assets (continued) | | | | | | | | | | | | |
| Total Corporate | | | | | | | | | | | | |
| Bonds* (continued) | | | | | | | | | | | | |
| Repair and Maintenance | | $ | — | | | $ | 7,578,880 | | | $ | — | | | $ | 7,578,880 | |
| Securities, Commodity | | | | | | | | | | | | | | | | |
| Contracts, and Other | | | | | | | | | | | | | | | | |
| Financial Investments | | | | | | | | | | | | | | | | |
| and Related Activities | | | — | | | | 11,754,128 | | | | — | | | | 11,754,128 | |
| Support Activities | | | | | | | | | | | | | | | | |
| for Mining | | | — | | | | 3,102,373 | | | | — | | | | 3,102,373 | |
| Telecommunication | | | | | | | | | | | | | | | | |
| Services | | | — | | | | 10,279,245 | | | | — | | | | 10,279,245 | |
| Utilities | | | — | | | | 6,810,846 | | | | — | | | | 6,810,846 | |
| Total Corporate Bonds | | | — | | | | 218,765,595 | | | | 3,025,629 | | | | 221,791,224 | |
| Warrants* | | | | | | | | | | | | | | | | |
| Health Care Equipment | | | | | | | | | | | | | | | | |
| & Services | | | — | | | | 4,223 | | | | 12,962 | | | | 17,185 | |
| Total Warrants | | | — | | | | 4,223 | | | | 12,962 | | | | 17,185 | |
| Money Market Fund* | | | 25,207,359 | | | | — | | | | — | | | | 25,207,359 | |
| Total Assets | | $ | 25,207,359 | | | $ | 258,180,717 | | | $ | 33,524,457 | | | $ | 316,912,533 | |
| Unrealized Depreciation | | | | | | | | | | | | | | | | |
| on Forward Currency | | | | | | | | | | | | | | | | |
| Contracts | | | — | | | | (5,301 | ) | | | — | | | | (5,301 | ) |
| Total Liabilities | | $ | — | | | $ | (5,301 | ) | | $ | — | | | $ | (5,301 | ) |
| * | For further information regarding security characteristics, please see the Schedule of Investments. |
Below is a reconciliation that details the activity of securities in Level 3 during the current fiscal period.
| | | Intrepid | | | Intrepid | |
| | | Capital Fund | | | Income Fund | |
| Beginning Balance – October 1, 2022 | | $ | 1,946,013 | | | $ | 24,614,250 | |
| Purchases | | | — | | | | 4,037,857 | |
| Sales | | | — | | | | (702,904 | ) |
| Realized gains | | �� | — | | | | 689,451 | |
| Realized losses | | | — | | | | (28,110 | ) |
| Change in unrealized appreciation | | | 39,947 | | | | (45,391 | ) |
| Net Transfers Into Level 3 | | | — | | | | 4,959,304 | |
| Net Transfers Out of Level 3 | | | — | | | | — | |
| Ending Balance – March 31, 2023 | | $ | 1,985,960 | | | $ | 33,524,457 | |
As of March 31, 2023, the change in unrealized appreciation on the positions still held in the Intrepid Capital Fund was $39,947, and was $221,823 for the Intrepid Income Fund.
| NOTES TO FINANCIAL STATEMENTS (continued) |
| March 31, 2023 (Unaudited) |
The transfer out of Level 3 into Level 2 in the Intrepid Capital Fund and the Intrepid Income Fund were due to the Funds’ pricing agent providing a value for a bank loan that was previously being fair valued in accordance with procedures approved by the Board of Trustees. The transfer into Level 3 out of Level 2 in the Intrepid Capital Fund is due to the Fund’s pricing agent not providing a value for warrants that they were previously able to provide.
The following table presents additional information about valuation methodologies and inputs used for investments that are measured at fair value and categorized within Level 3.
| | Type of | | Fair Value at | Valuation | Unobservable | |
Fund | Security | Industry | 9/30/2022 | Techniques | Inputs | Range |
| | | | | | Unpublished | |
Intrepid | | | | Broker | Independent | |
Capital Fund | Warrant | Health Care | 31,250 | Quote | Broker Quote | $0.13 |
| | | | | | | |
| | | | | | Unpublished | |
Intrepid | | | | Broker | Independent | |
Capital Fund | Warrant | Health Care | 4,763 | Quote | Broker Quote | $0.65 |
| | | | | | | |
| | | | | | Unpublished | |
Intrepid | Bank | | | Broker | Independent | |
Capital Fund | Loan | Health Care | 930,000 | Quote | Broker Quote | $93.00 |
| | | | | | | |
| | | Household | | | Unpublished | |
Intrepid | Bank | and Personal | | Broker | Independent | |
Capital Fund | Loan | Products | 980,000 | Quote | Broker Quote | $98.00 |
| | | | | | | |
| | | | | | Unpublished | |
Intrepid | Bank | | | Broker | Independent | |
Income Fund | Loan | Health Care | 8,370,000 | Quote | Broker Quote | $93.00 |
| | | | | | | |
| | | | | | Unpublished | |
Intrepid | Bank | | | Broker | Independent | |
Income Fund | Loan | Health Care | 8,820,000 | Quote | Broker Quote | $98.00 |
| | | | | | | |
| | | | | | Unpublished | |
Intrepid | Bank | | | Broker | Independent | |
Income Fund | Loan | Health Care | 7,424,250 | Quote | Broker Quote | $98.99 |
The significant unobservable inputs used in the fair value measurement of the bank loans in the Intrepid Capital Fund and Intrepid Income Fund is an unpublished independent broker quote. The price quote is provided by the loan’s underwriter who maintains an active market in the loan and has knowledge of existing and prospective holders. The significant unobservable inputs used in the fair value measurement of the warrants in the Intrepid Capital Fund is an unpublished independent broker quote. The price quote is provided by the warrant’s underwriter who maintains an active market in the warrant and has knowledge of existing and prospective holders.
| NOTES TO FINANCIAL STATEMENTS (continued) |
| March 31, 2023 (Unaudited) |
Derivative Instruments and Hedging Activities
The Funds’ adviser may use derivative instruments, such as forward currency contracts, as a means to manage exposure to different types of risk, including market risk and exchange rate risk, and to gain exposure to underlying securities. During the period ended March 31, 2023, the Intrepid Income Fund held derivative instruments.
Forward Currency Contracts
The Intrepid Income Fund used forward currency contracts during the period for the purpose of hedging exposures to non-U.S. dollar denominated assets. In general the use of these contracts may reduce the overall risk level in a fund, but may also lower fund performance. The use of these contracts does not create leverage in the Fund, but does expose the Fund to counterparty credit risk. When the contract is settled, the Fund records a realized gain or loss equal to the difference between the value of the contract at the time it was opened and the value at the time it settled.
Effect of Forward Currency Contracts on the Statement of Operations for the Period Ended March 31, 2023
| | Change in unrealized | Realized loss |
| | depreciation on | on forward |
| | forward currency contracts | currency contracts |
| Intrepid Income Fund | $(491,130) | $(399,400) |
The average monthly notional amounts of forward currency contracts during the period ended March 31, 2023 were as follows:
| | | Intrepid | | | Intrepid | | | Intrepid | |
| | | Capital Fund | | | Small Cap Fund | | | Income Fund | |
| Long Positions | | | | | | | | | |
| Forward currency contracts | | $ | — | | | $ | — | | | $ | 63,156 | |
| | | | | | | | | | | | | |
| | | Intrepid | | | Intrepid | | | Intrepid | |
| | | Capital Fund | | | Small Cap Fund | | | Income Fund | |
| Short Positions | | | | | | | | | | | | |
| Forward currency contracts | | $ | — | | | $ | — | | | $ | 14,176,836 | |
Long position forward currency contracts are received and settled in foreign currency. Short position forward currency contracts are received and settled in U.S. dollar.
| NOTES TO FINANCIAL STATEMENTS (continued) |
| March 31, 2023 (Unaudited) |
At March 31, 2023, Intrepid Capital Management Funds Trust is invested in derivative contracts in the Income Fund, which is reflected in the Statements of Assets and Liabilities, as follows:
|
|
|
|
| Derivative Assets |
| Derivative Liability |
|
| | | | | | Statement of | | | | Statement of | | | |
| | | | | Derivative | Assets and | | Fair Value | | Assets and | | Fair Value | |
Fund | | Risk | Type | Liabilities Location | | Amount | | Liabilities Location | | Amount | |
Intrepid | | Currency | Forward | Unrealized | | | | Unrealized | | | |
| Income | | | foreign | appreciation on | | | | depreciation on | | | |
| Fund | | | currency | foreign forward | | | | foreign forward | | | |
| | | | | exchange | currency contracts | | $ | — | | currency contracts | | $ | 5,301 | |
| | | | | | | | $ | — | | | | $ | 5,301 | |
Offsetting on the Statement of Assets and Liabilities
For financial reporting purposes, the Fund offsets financial assets and financial liabilities that are subject to master netting arrangements or similar agreements within appreciation on forward currency contracts and depreciation on forward currency contracts on the Statements of Assets and Liabilities.
As of March 31, 2023, the gross amount of derivative liabilities for the Intrepid Income Fund was $5,301 of which $0 was offset on the Statement of Assets and Liabilities resulting in $5,301 presented as net derivative liabilities on the Statement of Assets and Liabilities.
Derivative Risk
The risks of using the types of derivatives in which the Funds may engage include the risk that movements in the value of the derivative may not fully offset or complement instruments currently held in the Funds in the manner intended by the Funds’ adviser; the risk that the counterparty to a derivative contract may fail to comply with their obligations to the Fund; the risk that the derivative may not possess a liquid secondary market at a time when the Fund would look to disengage the position; the risk that additional capital from the Fund may be called upon to fulfill the conditions of the derivative contract; and the risk that the cost of the derivative contracts may reduce the overall returns experienced by the Funds.
Use of Estimates
The preparation of financial statements in conformity with GAAP requires management to make estimates and assumptions that affect the reported amounts of assets and liabilities and disclosure of contingent assets and liabilities at the date of the financial statements and the reported amounts of revenues and expenses during the reporting period. Actual results could differ from those estimates.
| NOTES TO FINANCIAL STATEMENTS (continued) |
| March 31, 2023 (Unaudited) |
Indemnification
In the normal course of business the Funds enter into contracts that contain general indemnification clauses. The Funds’ maximum exposure under these arrangements is unknown, as this would involve future claims against the Funds that have not yet occurred. Based on experience, the Funds expect the risk of loss to be remote.
Foreign Currency Transactions
The books and records are maintained in U.S. dollars. Foreign currency denominated transactions (i.e. market value of investment securities, assets and liabilities, purchases and sales of investment securities, and income and expenses) are translated into U.S. dollars at the current rate of exchange. The Funds do not isolate that portion of the results of operations resulting from changes in foreign exchange rates on investments from the fluctuations arising from changes in market prices of securities held. Such fluctuations are reflected in net realized and unrealized gain or loss on investments and foreign currency translation.
The value of a Fund’s foreign investments may be significantly affected by changes in currency exchange rates and the Fund may incur costs in converting securities denominated in foreign currencies to U.S. dollars. Dividends and interest on foreign securities may be subject to foreign withholding taxes, which would reduce the Fund’s income without providing a tax credit for the Fund’s shareholders.
Securities Transactions and Investment Income
The Funds record security transactions based on trade date. Dividend income is recognized on the ex-dividend date, and interest income is recognized on an accrual basis. Discounts and premiums on securities purchased are amortized over the lives of the respective securities using the effective yield method. Withholding taxes on foreign dividends have been provided for in accordance with the Funds’ understanding of the applicable country’s tax rules and rates. Net realized gains or losses are determined using the identified cost method.
Distribution to Shareholder Policy
Dividends from net investment income, if any, are declared and paid at least monthly or quarterly, for Intrepid Income Fund and Intrepid Capital Fund, respectively and annually for Intrepid Small Cap Fund. Distributions of net realized capital gains, if any, are declared and paid at least annually.
Federal Income Taxes
The Funds comply with, and intend to continue to comply with, the requirements of Subchapter M of the Internal Revenue Code necessary to qualify as a regulated investment company and to make the requisite distributions of income and capital gains to its shareholders sufficient to relieve it from Federal income taxes.
| NOTES TO FINANCIAL STATEMENTS (continued) |
| March 31, 2023 (Unaudited) |
Allocation of Income, Expenses, and Gains/Losses
Income, expenses (other than those deemed to be attributable to a specific share class), and gains and losses of each Fund are allocated to each class of shares based upon the ratio of net assets represented by each class as a percentage of the net assets of that Fund. Expenses deemed directly attributable to a specific class of shares are charged against the operations of such class. Most Fund expenses are allocated by class based on relative net assets.
Subsequent Events Evaluation
In preparing these financial statements, the Trust has evaluated events and transactions for potential recognition or disclosure resulting from subsequent events after the Statements of Assets and Liabilities date of March 31, 2023 through the date the financial statements were issued. This evaluation did not result in any subsequent events that necessitated disclosure and/or adjustments except as stated below.
The Trust has entered into investment advisory agreements (collectively, “Agreement”) with Intrepid Capital Management, Inc. (the “Adviser”), with whom certain officers and Trustees of the Trust are affiliated, to furnish investment advisory services to the Funds. Under the terms of the Agreement, the Trust, on behalf of the Funds, compensates the Adviser for its management services on the Intrepid Capital Fund at the annual rate of 1.00% on the first $500 million of average daily net assets and 0.80% on each of the Fund’s average daily net assets in excess of $500 million, on the Intrepid Small Cap Fund at an annual rate of 1.00% of average daily net assets, and on Intrepid Income Fund at the annual rate of 0.75% of average daily net assets.
For the Intrepid Capital Fund, the Adviser agreed to waive its management fee and/or reimburse other expenses in both the Investor Share Class and Institutional Share Class, including organization expenses, to the extent necessary to ensure that operating expenses did not exceed 1.15%. The Investor Share Class may have a Net Expense ratio higher than these expense caps as a result of any sales, distribution and other fees incurred under a plan adopted pursuant to Rule 12b-1 under the Investment Company Act of 1940, as amended (the “Investment Company Act”), acquired fund fees and expenses or other expenses (such as taxes, interest, brokerage commissions and extraordinary items) that are excluded from the calculation. For the Intrepid Small Cap Fund, the Adviser agreed to waive its management fee and/or reimburse other expenses in both the Investor Share Class and Institutional Share Class, including organization expenses, to the extent necessary to ensure that the operating expenses did not exceed 1.05% of the Fund’s average daily net assets for the Investor Class shares of the Fund, and do not exceed 1.15% of the average daily net assets for the Institutional Class shares. The Investor Share Class may have a Net Expense ratio
| NOTES TO FINANCIAL STATEMENTS (continued) |
| March 31, 2023 (Unaudited) |
higher than these expense caps as a result of any sales, distribution and other fees incurred under a plan adopted pursuant to Rule 12b-1 under the Investment Company Act of 1940, as amended, acquired fund fees and expenses or other expenses (such as taxes, interest, brokerage commissions and extraordinary items) are excluded from the calculation. For the Intrepid Income Fund, the Adviser agreed to waive its management fee and/or reimburse other expenses of the Fund, including organization expenses, to the extent necessary to ensure that the Fund’s operating expenses did not exceed 0.90% of average daily net assets. The Fund may have Total Annual Fund Operating Expenses after Fee Waiver and/or Expense Reimbursement higher than these expense caps as a result of acquired fund fees and expenses or other expenses (such as taxes, interest, brokerage commissions and extraordinary items) that are excluded from the calculation. Any such waivers or reimbursements for the Funds are subject to later adjustment to allow the Adviser to recoup amounts waived or reimbursed to the extent actual fees and expenses on a monthly basis during the fiscal year are less than the respective expense cap limitations, provided, however, that the Adviser shall only be entitled to recoup such amounts for a period of three years from the month such amount was waived or reimbursed. Waived/reimbursed expenses subject to potential recovery by year of expiration are as follows:
| | | Year of Expiration | |
| | | 2024 | | | 2025 | | | 2026 | |
| Intrepid Capital Fund | | $ | 245,687 | | | $ | 261,924 | | | $ | 131,200 | |
| Intrepid Small Cap Fund | | | 307,461 | | | | 281,135 | | | | 139,535 | |
| Intrepid Income Fund | | | 190,174 | | | | 243,006 | | | | 103,596 | |
The Trust, on behalf of the Funds, has adopted a distribution plan pursuant to Rule 12b-1 under the 1940 Act (the “12b-1 Plan”), which provides that the Funds may reimburse the Funds’ distributor or others at an annual rate of up to 0.25% of the average daily net assets of the Investor Class of the Capital Fund and the Small Cap Fund.
Quasar Distributors, LLC serves as distributor to the Funds.
| 5. | INVESTMENT TRANSACTIONS |
The aggregate purchases and sales of securities (excluding short-term securities) by the Funds for the period ended March 31, 2023 were as follows:
| | | Non-U.S. Government | | | U.S. Government | |
| | | Purchases | | | Sales | | | Purchases | | | Sales | |
| Intrepid Capital Fund | | $ | 15,144,286 | | | $ | 15,478,751 | | | $ | — | | | $ | — | |
| Intrepid Small Cap Fund | | | 13,651,004 | | | | 18,692,096 | | | | — | | | | — | |
| Intrepid Income Fund | | | 178,657,337 | | | | 182,716,316 | | | | — | | | | — | |
Intrepid Funds
| NOTES TO FINANCIAL STATEMENTS (continued) |
| March 31, 2023 (Unaudited) |
| 6. | CAPITAL SHARE TRANSACTIONS |
| Intrepid Capital Fund – Investor Class | | | | | | |
| | | Period Ended | | | Year Ended | |
| | | March 31, 2023 | | | September 30, 2022 | |
| Shares sold | | | 6,612 | | | | 23,195 | |
| Shares issued to holders in | | | | | | | | |
| reinvestment of dividends | | | 25,027 | | | | 34,404 | |
| Shares redeemed | | | (203,029 | ) | | | (306,830 | ) |
| Net decrease in shares | | | (171,390 | ) | | | 249,231 | |
| Shares outstanding: | | | | | | | | |
| Beginning of period | | | 1,441,271 | | | | 1,690,502 | |
| End of period | | | 1,269,880 | | | | 1,441,271 | |
| | | | | | | | | |
| Intrepid Capital Fund – Institutional Class | | | | | | | | |
| | | Period Ended | | | Year Ended | |
| | | March 31, 2023 | | | September 30, 2022 | |
| Shares sold | | | 146,872 | | | | 209,880 | |
| Shares issued to holders in | | | | | | | | |
| reinvestment of dividends | | | 57,168 | | | | 68,900 | |
| Shares redeemed | | | (356,200 | ) | | | (362,600 | ) |
| Net decrease in shares | | | (152,160 | ) | | | (83,820 | ) |
| Shares outstanding: | | | | | | | | |
| Beginning of period | | | 2,930,793 | | | | 3,014,613 | |
| End of period | | | 2,778,633 | | | | 2,930,793 | |
| | | | | | | | | |
| Intrepid Small Cap Fund – Investor Class | | | | | | | | |
| | | Period Ended | | | Year Ended | |
| | | March 31, 2023 | | | September 30, 2022 | |
| Shares sold | | | 14,709 | | | | 94,229 | |
| Shares redeemed | | | (291,356 | ) | | | (340,119 | ) |
| Net decrease in shares | | | (276,647 | ) | | | (245,890 | ) |
| Shares outstanding: | | | | | | | | |
| Beginning of period | | | 2,236,638 | | | | 2,482,528 | |
| End of period | | | 959,991 | | | | 2,236,638 | |
| NOTES TO FINANCIAL STATEMENTS (continued) |
| March 31, 2023 (Unaudited) |
| Intrepid Small Cap Fund – Institutional Class | | | | | | |
| | | Period Ended | | | Year Ended | |
| | | March 31, 2023 | | | September 30, 2022 | |
| Shares sold | | | 21,537 | | | | 91,295 | |
| Shares redeemed | | | (197,460 | ) | | | (340,337 | ) |
| Net increase (decrease) in shares | | | (175,923 | ) | | | (249,042 | ) |
| Shares outstanding: | | | | | | | | |
| Beginning of period | | | 1,692,084 | | | | 1,941,126 | |
| End of period | | | 1,516,161 | | | | 1,692,084 | |
| | | | | | | | | |
| Intrepid Income Fund | | | | | | | | |
| | | Period Ended | | | Year Ended | |
| | | March 31, 2023 | | | September 30, 2022 | |
| Shares sold | | | 10,292,640 | | | | 25,317,061 | |
| Shares issued to holders in | | | | | | | | |
| reinvestment of dividends | | | 1,481,149 | | | | 1,977,974 | |
| Shares redeemed | | | (8,663,673 | ) | | | (22,929,052 | ) |
| Net increase in shares | | | 3,110,116 | | | | 4,365,983 | |
| Shares outstanding: | | | | | | | | |
| Beginning of period | | | 31,478,633 | | | | 27,112,650 | |
| End of period | | | 34,588,749 | | | | 31,478,633 | |
| 7. | FEDERAL INCOME TAX INFORMATION |
The tax components of distributions paid during the fiscal years ended September 30, 2022 and 2021 are as follows:
| | | | September 30, 2022 | | | September 30, 2021 | |
| | | | | | | Return | | | Long-Term | | | | | | Return | | | Long-Term | |
| | | | Ordinary | | | of | | | Capital | | | Ordinary | | | of | | | Capital | |
| | | | Income | | | Capital | | | Gains | | | Income | | | Capital | | | Gains | |
| | Intrepid | | | | | | | | | | | | | | | | | | |
| | Capital | | | | | | | | | | | | | | | | | | |
| | Fund | | $ | 1,069,075 | | | $ | 106,787 | | | $ | — | | | $ | 900,059 | | | $ | 242,677 | | | $ | — | |
| | Intrepid | | | | | | | | | | | | | | | | | | | | | | | | |
| | Small Cap | | | | | | | | | | | | | | | | | | | | | | | | |
| | Fund | | | — | | | | — | | | | — | | | | — | | | | — | | | | — | |
| | Intrepid | | | | | | | | | | | | | | | | | | | | | | | | |
| | Income | | | | | | | | | | | | | | | | | | | | | | | | |
| | Fund | | | 19,979,452 | | | | — | | | | — | | | | 8,804,931 | | | | — | | | | — | |
Additionally, U.S. generally accepted accounting principles require that certain components of net assets relating to permanent differences be reclassified between
| NOTES TO FINANCIAL STATEMENTS (continued) |
| March 31, 2023 (Unaudited) |
financial and tax reporting. These reclassifications have no effect on net assets or net asset value per share. For the year ended September 30, 2022, the following table shows the reclassifications made:
| | | | Undistributed | | | Accumulated | | | | |
| | | | Net Investment | | | Net Realized | | | Paid-in | |
| | | | Income (Losses) | | | Gains (Losses) | | | Capital | |
| | Intrepid Capital Fund | | $ | (177,057 | ) | | $ | 282,910 | | | $ | (105,853 | ) |
| | Intrepid Small Cap Fund | | | 638,011 | | | | 179,248 | | | | (817,259 | ) |
| | Intrepid Income Fund | | | 149,372 | | | | (149,372 | ) | | | — | |
These reclassifications primarily relate to adjustments with differing book and tax methods of accounting for the usage of investment losses and currency adjustments.
As of September 30, 2022, the components of accumulated earnings (losses) for income tax purposes were as follows:
| | | Intrepid | | | Intrepid | |
| | | Capital Fund | | | Small Cap Fund | |
| Cost of investments | | $ | 41,096,779 | | | $ | 48,996,343 | |
| Unrealized appreciation | | | 5,141,511 | | | | 7,240,321 | |
| Unrealized depreciation | | | (2,859,974 | ) | | | (5,209,503 | ) |
| Net unrealized appreciation | | | 2,281,537 | | | | 2,030,818 | |
| Undistributed ordinary income | | | — | | | | — | |
| Undistributed long-term capital gain | | | — | | | | — | |
| Distributable income | | | — | | | | — | |
| Other accumulated loss | | | (20,022,920 | ) | | | (5,004,992 | ) |
| Total accumulated gain (loss) | | $ | (17,741,383 | ) | | $ | (2,974,174 | ) |
| | | | | | | | | |
| | | Intrepid | | | | | |
| | | Income Fund | | | | | |
| Cost of investments | | $ | 284,993,329 | | | | | |
| Unrealized appreciation | | | 836,142 | | | | | |
| Unrealized depreciation | | | (22,483,961 | ) | | | | |
| Net unrealized appreciation | | | (21,647,819 | ) | | | | |
| Undistributed ordinary income | | | 216,046 | | | | | |
| Undistributed long-term capital gain | | | — | | | | | |
| Distributable income | | | 216,046 | | | | | |
| Other accumulated loss | | | (7,027,482 | ) | | | | |
| Total accumulated gain | | $ | (28,459,255 | ) | | | | |
The difference between book-basis and tax-basis unrealized appreciation is attributable primarily to the tax deferral of losses on wash sales.
| NOTES TO FINANCIAL STATEMENTS (continued) |
| March 31, 2023 (Unaudited) |
At September 30, 2022, the Intrepid Capital Fund has short-term tax basis capital losses of $15,721,516 and long-term tax basis capital losses of $4,296,048 which may be carried forward to offset future capital gains. To the extent that the Intrepid Capital Fund may realize future net capital gains, those gains will be offset by any of its unused capital loss carryforwards. These losses do not expire.
During the 2022 fiscal year, Intrepid Capital Fund utilized $4,427,850 of long-term capital loss carryover.
At September 30, 2022, the Intrepid Small Cap Fund has short-term unlimited tax basis capital losses of $4,685,092, and short-term limited tax basis capital losses of $273,000 which may be carried forward to offset future capital gains. To the extent that the Intrepid Small Cap Fund may realize future net capital gains, those gains will be offset by any of its unused capital loss carryforwards. These losses do not expire. The Intrepid Small Cap Fund had late year ordinary losses of $46,092, which the Fund will elect to defer to the first day of its next tax year.
During the 2022 fiscal year, Intrepid Small Cap Fund utilized $1,932,334 of long-term capital loss carryover.
At September 30, 2022, the Intrepid Income Fund had short-term tax basis capital losses of $6,995,616 which may be carried forward to offset future capital gains. To the extent that the Intrepid Income Fund may realize future net capital gains, those gains will be offset by any of its unused capital loss carryforwards. These losses do not expire.
During the 2022 fiscal year, Intrepid Income Fund utilized $1,023,151 of long-term capital loss carryover.
There is no tax liability resulting from unrecognized tax benefits relating to uncertain income tax positions taken or expected to be taken on the tax returns for the fiscal year-end September 30, 2022, or for any other tax years which are open for exam. As of September 30, 2022, the Intrepid Capital Fund, the Intrepid Small Cap Fund and the Intrepid Income Fund’s open tax years include the tax years ended September 30, 2019 through 2022. The Trust is also not aware of any tax positions for which it is reasonably possible that the total amounts of unrecognized tax benefits will significantly change in the next year. The Funds recognize interest and penalties, if any, related to unrecognized tax benefits as income tax expense in the Statement of Operations. During the year, the Funds did not incur any interest or penalties, nor were any accrued as of September 30, 2022.
The Intrepid Capital Management Funds Trust has a $20,000,000 secured, umbrella 364-day line of credit, for temporary emergency purposes, including the meeting of redemption requests that otherwise might require the untimely disposition
| NOTES TO FINANCIAL STATEMENTS (continued) |
| March 31, 2023 (Unaudited) |
of securities. The average interest rate as of March 31, 2023 was 7.46%. During the period ended March 31, 2023, the Intrepid Income Fund’s maximum borrowing was $6,843,000 and average borrowing was $130,104, while the Intrepid Capital Fund’s maximum borrowing was $275,000 and average borrowing was $7,928. The Intrepid Small Cap Fund did not use the line. There were no loans outstanding as of the period ended March 31, 2023.
| 9. | LIQUIDITY RISK MANAGEMENT PROGRAM |
Consistent with Rule 22e-4 under the Investment Company Act of 1940, the Fund has established a liquidity risk management program to manage “liquidity risk” (the “LRMP”). “Liquidity Risk” is defined as the risk that the Fund could not meet requests to redeem shares issued by a Fund without significant dilution of remaining investors’ interest in the Fund. The LRMP is overseen by the Program Administrator, a committee comprised of representatives of the Fund’s investment adviser and officers of the Fund. The Fund’s Board of Directors has approved the designation of the Program Administrator to oversee the LRMP.
On February 21, 2023, the Trustees reviewed and considered a written report prepared by the Program Administrator that addressed the operation of the LRMP and assessed the LRMP’s adequacy and effectiveness of implementation for the most recent annual period (the “Review Period”). During the period covered by the report, it was determined that: (1) the LRMP continues to be reasonably designed to effectively assess and manage the Funds’ Liquidity Risk; and (2) the LRMP has been adequately and effectively implemented with respect to the Fund during the reporting period. Following the Trustees’ review and discussion, they determined that they believe the disclosures in the report, taken as a whole, provide the information necessary for the Trustees to effectively asses the LRMP and its implementation during the Review Period, and that they are comfortable with the report’s conclusion that the LRMP is reasonably designed to assess and manage the Funds’ liquidity risk and complies with the requirements of Rule 22e-4, and that the LRMP has operated as intended during the Review Period.
| ADDITIONAL INFORMATION |
| March 31, 2023 (Unaudited) |
Investment Advisory Agreement Disclosure
On November 22, 2022, the Board of Trustees of Intrepid Capital Management Funds Trust (the “Trustees”) approved the continuation of the investment advisory agreements for the Intrepid Capital Fund, the Intrepid Endurance Fund and the Intrepid Income Fund (each a “Fund” and, collectively, the “Funds”) with the investment adviser to the Funds, Intrepid Capital Management, Inc. (the “Adviser”). As part of the process of approving the continuation of the advisory agreements, the Trustees reviewed the fiduciary duties of the Trustees with respect to approving the advisory agreements and the relevant factors for the Trustees to consider, and the members of the Board of Trustees who are not deemed “interested persons” (as that term is defined by the Investment Company Act of 1940) of the Funds (the “Independent Trustees”) met in executive session to discuss the renewal of the advisory agreements.
In advance of the meetings, the Adviser sent detailed information to the Trustees to assist them in their evaluation of the investment advisory agreements. This information included, but was not limited to, a memorandum from Fund counsel that summarized the legal standards applicable to the Trustees’ consideration of the advisory agreements; detailed comparative information relating to the Funds’ management fees and other expenses of the Funds; information regarding fees paid and other payments; information on the Adviser’s profitability; information about brokerage commissions; detailed comparative information relating to the Funds’ performance; information about sales and redemptions of the Funds; information about the Funds’ compliance program; and other information the Trustees believed was useful in evaluating the approval of advisory agreements.
All of the factors discussed by the Trustees were considered as a whole, and were considered separately by the Independent Trustees, meeting in executive session. The factors were viewed in their totality by the Trustees, with no single factor being the principal or decisive factor in the Trustees’ determination of whether to approve the continuation of the investment advisory agreements. The Trustees recognized that the management and fee arrangements for the Funds are the result of years of review and discussion between the Independent Trustees and the Adviser, that certain aspects of such arrangements may receive greater scrutiny in some years than in others and that the Trustees’ conclusions may be based, in part, on their consideration of these same arrangements and information received during the course of the year and in prior years. Prior to approving the continuation of the investment advisory agreements, the Trustees and the Independent Trustees in executive session considered, among other items:
| | • | The nature and quality of the investment advisory services provided by the Adviser. |
| ADDITIONAL INFORMATION (continued) |
| March 31, 2023 (Unaudited) |
| | • | A comparison of the fees and expenses of the Funds to other similar funds. |
| | | |
| | • | A comparison of the fee structures of other accounts managed by the Adviser. |
| | | |
| | • | Whether economies of scale are recognized by the Funds. |
| | | |
| | • | The costs and profitability of the Funds to the Adviser. |
| | | |
| | • | The performance of the Funds. |
| | | |
| | • | The other benefits to the Adviser from serving as investment adviser to the Funds (in addition to the advisory fee). |
The material considerations and determinations of the Board of Trustees, including all of the Independent Trustees, are as follows:
Nature and Quality of Investment Advisory Services
The Trustees noted that the Adviser supervises the investment portfolios of the Funds, directing the day-to-day management of the Funds’ portfolios, including the purchase and sale of investment securities, and they concluded that the Adviser expends substantial resources to provide this supervision. The Trustees then discussed with management the nature of the investment process employed by the portfolio managers of the Funds, which is highly research intensive, and requires that the Adviser expend substantial resources to determine the portfolio of the Funds.
Management noted that in employing its strategy, the Adviser conducts extensive research on target companies, including telephonic and onsite interviews with management, competitors, analysts and others. The Trustees then discussed staffing at the Adviser, and concluded that the Adviser has sufficient staffing to conduct the research needed to meet the investment objectives of the Funds.
The Trustees also considered the background and experience of the Adviser’s senior management and expertise of, and the level of attention given to the Funds by, investment personnel of the Adviser, and determined that the personnel servicing the Funds are well qualified. In addition, the Trustees deliberated on the quality of the material service providers to the Funds, who provide administrative and distribution services on behalf of the Funds and are overseen by the Adviser, and the overall reputation and capabilities of the Adviser, noting that they believe the service providers are respected in the industry and provide valuable services to the Funds.
Based on the Trustees’ review, the Trustees believe that the Adviser provides high quality services to the Funds. The Trustees also determined that they were satisfied with the nature, extent and quality of the investment advisory services provided to the Funds by the Adviser, and that the nature and extent of the services provided by the Adviser are appropriate to assure that each Fund’s operations are conducted in compliance with applicable laws, rules and regulations.
| ADDITIONAL INFORMATION (continued) |
| March 31, 2023 (Unaudited) |
Comparative Fees and Expenses
The Trustees then discussed with management the variables, in addition to the management fees, such as administrative and transaction fees that impact costs to the shareholders of the Funds, noting that as discussed, managing the Funds is resource intensive. Management reviewed with the Trustees the comparison of the Funds’ expense ratios to other similar funds. As part of the discussion with management, the Trustees ensured that they understood and were comfortable with the criteria used to determine the mutual funds that make up the peer universes for purposes of their review.
While the Funds had higher than average fees and expenses, the Trustees believe this was due to the resource intensive nature of the Funds’ investment strategies and the lower average net assets under management of the Funds when compared to the peer groups. The Trustees concluded that the expense ratios of the Funds are within a reasonable range of comparable mutual funds, and that the Funds’ fees are reasonable.
Comparison of Fee Structures of Other Accounts
The Trustees then inquired of management regarding the distinction between the services performed by the Adviser for separate accounts or private investment companies and those performed by the Adviser for the Funds. The Adviser noted that the management of the Funds involves more comprehensive and substantive duties than the management of separate accounts or private investment companies. Specifically, the Adviser noted the following:
| | • | The Adviser provides tailored investment advisory services to the Funds in order to accommodate the cash flow volatility presented by the purchases and redemptions of shareholders. |
| | | |
| | • | With regard to the Funds, the Adviser attempts to serve the needs of thousands of accounts, ranging from direct accounts holding a few thousand dollars to the large omnibus accounts of intermediaries who in turn service thousands of large and small accounts. |
| | | |
| | • | The Adviser maintains a robust shareholder communication effort for the Funds to reach shareholders through direct contact, through intermediaries, or via the financial press. |
| | | |
| | • | The Adviser coordinates with the Funds’ Chief Compliance Officer and other service providers to insure compliance with regulatory regimens imposed by Federal law and the Internal Revenue Code. |
| | | |
| | • | Separate accounts or private investment companies do not require the same level of services and oversight, nor do they present the same compliance risk. |
| ADDITIONAL INFORMATION (continued) |
| March 31, 2023 (Unaudited) |
The Trustees concluded that the services performed by the Adviser for the Funds require a higher level of service and oversight than the services performed by the Adviser for separate accounts or private investment companies, and that the services performed by the Adviser for the Funds require a higher level of compliance resources from the Adviser. Based on this determination, the Trustees believe that the differential in advisory fees between the Funds and the separate accounts and private investment companies is reasonable, and concluded that the fee rates charged to the Funds in comparison to those charged to the Adviser’s other clients are reasonable.
Performance
The Trustees noted that at each quarterly meeting, the Trustees review reports comparing the investment performance of the Funds to various indices. Based on the information provided at this meeting and the information and quarterly discussions regarding the Funds’ investment performance, the Trustees believe that the Adviser manages the Funds in a manner that is materially consistent with their stated investment objective and style.
The Trustees reviewed the Adviser’s quality of investment management, management history and ability to successfully market the Funds. The Trustees noted that while the Funds have underperformed, the investment strategies of the Funds are designed to provide lower risk, which means it is expected that the Funds will underperform on a comparative basis during periods of market outperformance, but that investors should be protected in case of a downturn in the market.
The Trustees concluded that the performance of the Funds, adjusting for risk, has been satisfactory on a relative basis and on an absolute basis. They continue to believe that the Adviser’s discipline should lead to more favorable results in the long-term, and concluded that renewal of the existing advisory agreement was in the best interest of the Funds’ shareholders.
Costs and Profitability
The Trustees considered the cost of services provided and the profits realized by the Adviser, by reviewing reports provided by the Funds’ administrator that compared the Funds’ investment advisory fees to those of other comparable mutual funds. The Trustees also considered the Funds’ overall expense ratios compared to peer group funds and the Adviser’s willingness to waive a portion of its advisory fees to keep the overall expenses of the Funds lower.
The Trustees discussed the Adviser’s profitability, as presented, and the impact of the intermediary service fees on the profitability. The Trustees also considered the resources and revenues that the Adviser has put into managing and distributing the Funds, and concluded that the level of profitability realized by the Adviser from its
| ADDITIONAL INFORMATION (continued) |
| March 31, 2023 (Unaudited) |
provision of services to the Funds is reasonable, and that the overall expense ratios and investment advisory fees were fair and within a reasonable range of industry averages.
Economies of Scale
The Trustees then discussed with management whether economies of scale are recognized by the Funds. They noted that as Fund assets grow, certain fixed costs are spread over the larger asset base, which may lead to some economies of scale. On the other hand, the Trustees noted that many of the Funds’ expenses are subject to diseconomies of scale. For example, the intermediary service fees generally increase as the Funds’ assets grow. Given the size of the Funds and the reimbursements being made by the Adviser, the Trustees determined that the existing fee schedules were acceptable.
Fall-Out Benefits
The Trustees then considered other benefits to the Adviser from serving as adviser to the Funds (in addition to the advisory fee). The Trustees noted that the Adviser derives ancillary benefits from its association with the Funds in the form of proprietary and third party research products and services received from broker dealers that execute portfolio trades for the Funds. The Trustees determined such products and services have been used for legitimate purposes relating to the Funds by providing assistance in the investment decision-making process. The Trustees concluded that the other benefits realized by the Adviser from its relationship with the Funds were reasonable.
Conclusion
After reviewing the materials and management’s presentation, as well as other information regularly provided at the Board’s quarterly meetings throughout the year regarding the quality of services provided by the Adviser, the performance of the Funds, expense information, regulatory compliance issues, trading information and related matters and other factors deemed relevant by the Trustees, the Trustees, including all of the Independent Trustees, approved the continuation of the investment advisory agreements.
The Trustees noted that all of the factors above were considered by them as a whole, and separately by the Independent Trustee meeting in executive session. The factors were viewed in their totality by the Trustees, with no single factor being the principal or decisive factor in their determination of whether to approve the continuation of the investment advisory.
| ADDITIONAL INFORMATION (continued) |
| March 31, 2023 (Unaudited) |
Shareholder Notification of Federal Tax Status
The Intrepid Capital Fund and Intrepid Small Cap Fund and Intrepid Income Fund designated $—, $— and $—, respectively, of total distributions paid during the fiscal year ended September 30, 2022 as net capital gain distributions eligible for long-term capital gain rates for individual shareholders.
The Intrepid Capital Fund, Intrepid Small Cap Fund and Intrepid Income Fund designated 27.98%, 0.00% and 3.73%, respectively, of their ordinary income distributions for the year ended September 30, 2022 as qualified dividend income under the Jobs & Growth Tax Relief Reconciliation Act of 2003.
For the year ended September 30, 2022, 24.96%, 0.00% and 3.73% of Intrepid Capital Fund, Intrepid Small Cap Fund and Intrepid Income Fund dividends paid from net ordinary income, respectively, qualify for the dividends received deduction available to corporate shareholders.
The Intrepid Capital Fund, Intrepid Small Cap Fund and Intrepid Income Fund designated 84.53%, 0.00% and 97.62%, respectively, of their ordinary income distributions for the fiscal year as interest-related dividends under Internal Revenue Code Section 871(k)(1)(c).
The Intrepid Capital Fund, Intrepid Small Cap Fund and Intrepid Income Fund designated 0.00%, 0.00% and 0.00%, respectively, of their ordinary income distributions as short-term capitalization distributions under Internal Revenue Code Section 871(k)(2)(c).
Availability of Quarterly Portfolio Holdings Schedules
The Funds are required to file their complete schedule of portfolio holdings with the SEC for the first and third quarters of each fiscal year as an exhibit to its reports on Form N-PORT. Once filed, the Funds’ Form N-PORT is available without charge, upon request on the SEC’s website (http://www.sec.gov) and is available by calling 1.866.996.3863.
Proxy Voting Policies and Procedures and Proxy Voting Record (Unaudited)
A description of the policies and procedures that the Funds use to determine how to vote proxies relating to portfolio securities is available without charge, upon request, by calling 1.866.996.3863 and on the SEC’s website (http://www.sec.gov).
The Funds are required to file how they voted proxies related to portfolio securities during the most recent 12-month period ended June 30. Once filed, the information is available without charge, upon request, by calling 1.866.996.3863 and on the SEC’s website (http://www.sec.gov).
PRIVACY POLICY
Intrepid Capital Management Funds Trust
We collect the following nonpublic personal information about you:
| | • | information we receive from you on or in applications or other forms, correspondence, or conversations, including, but not limited to, your name, address, phone number, social security number, assets, income and date of birth; and |
| | | |
| | • | information about your transactions with us, our affiliates, or others, including, but not limited to, your account number and balance, payment history parties to transactions, cost basis information, and other financial information. |
We do not disclose any nonpublic personal information about our current or former shareholders to nonaffiliated third parties, except as permitted by law. For example, we are permitted by law to disclose all of the information we collect, as described above, to our transfer agent to process your transactions. Furthermore, we restrict access to your nonpublic personal information to those persons who require such information to provide products or services to you. We maintain physical, electronic and procedural safeguards that comply with federal standards to guard your nonpublic personal information.
In the event that you hold shares of the fund(s) through a financial intermediary, including, but not limited to, a broker-dealer, bank or trust company, the privacy policy of your financial intermediary would govern how your nonpublic personal information would be shared with nonaffiliated third parties.
Board of Trustees
Edward Vandergriff
Mark Travis
Peter Osterman, Jr.
John J. Broaddus
Investment Adviser
Intrepid Capital Management, Inc.
1400 Marsh Landing Parkway, Suite 106
Jacksonville Beach, FL 32250
Independent Registered Public Accounting Firm
Deloitte & Touche LLP
111 South Wacker Drive
Chicago, IL 60606
Legal Counsel
Foley & Lardner LLP
777 East Wisconsin Avenue
Milwaukee, WI 53202
Custodian
U.S. Bank, N.A.
1555 North RiverCenter Drive, Suite 302
Milwaukee, WI 53212
Distributor
Quasar Distributors, LLC
111 East Kilbourn Avenue, Suite 2200
Milwaukee, WI 53202
Administrator, Transfer Agent
and Dividend Disbursing Agent
U.S. Bancorp Fund Services, LLC,
doing business as U.S. Bank Global Fund Services
615 East Michigan Street
Milwaukee, WI 53202
Shareholder/Investor Information
1.866.996.3863
www.intrepidcapitalfunds.com
INTRPSEMI-0323
Item 2. Code of Ethics.
Not applicable for semi-annual reports.
Item 3. Audit Committee Financial Expert.
Not applicable for semi-annual reports.
Item 4. Principal Accountant Fees and Services.
Not applicable for semi-annual reports.
Item 5. Audit Committee of Listed Registrants.
Not applicable to registrants who are not listed issuers (as defined in Rule 10A-3 under the Securities Exchange Act of 1934).
Item 6. Investments.
| (a) | Schedule of Investments is included as part of the report to shareholders filed under Item 1 of this Form. |
Item 7. Disclosure of Proxy Voting Policies and Procedures for Closed-End Management Investment Companies.
Not applicable to open-end investment companies.
Item 8. Portfolio Managers of Closed-End Management Investment Companies.
Not applicable to open-end investment companies.
Item 9. Purchases of Equity Securities by Closed‑End Management Investment Company and Affiliated Purchasers.
Not applicable to open-end investment companies.
Item 10. Submission of Matters to a Vote of Security Holders.
There have been no material changes to the procedures by which shareholders may recommend nominees to the registrant’s board of trustees.
Item 11. Controls and Procedures.
| (a) | The Registrant’s President and Treasurer have reviewed the Registrant's disclosure controls and procedures (as defined in Rule 30a-3(c) under the Investment Company Act of 1940 (the “Act”)) as of a date within 90 days of the filing of this report, as required by Rule 30a-3(b) under the Act and Rules 13a-15(b) or 15d‑15(b) under the Securities Exchange Act of 1934. Based on their review, such officers have concluded that the disclosure controls and procedures are effective in ensuring that information required to be disclosed in this report is appropriately recorded, processed, summarized and reported and made known to them by others within the Registrant and by the Registrant’s service provider. |
| (b) | There were no changes in the Registrant's internal control over financial reporting (as defined in Rule 30a-3(d) under the Act) that occurred during the period covered by this report that have materially affected, or are reasonably likely to materially affect, the Registrant's internal control over financial reporting. |
Item 12. Disclosure of Securities Lending Activities for Closed-End Management Investment Companies
Not applicable to open-end investment companies.
Item 13. Exhibits.
| (a) | (1) Any code of ethics or amendment thereto, that is the subject of the disclosure required by Item 2, to the extent that the registrant intends to satisfy Item 2 requirements through filing an exhibit. 1) Not Applicable. |
(3) Any written solicitation to purchase securities under Rule 23c‑1 under the Act sent or given during the period covered by the report by or on behalf of the registrant to 10 or more persons. Not applicable to open-end investment companies.
(4) Change in the registrant’s independent public accountant. There was no change in the registrant’s independent public accountant for the period covered by this report.
SIGNATURES
Pursuant to the requirements of the Securities Exchange Act of 1934 and the Investment Company Act of 1940, the registrant has duly caused this report to be signed on its behalf by the undersigned, thereunto duly authorized.
(Registrant) Intrepid Capital Management Funds Trust
By (Signature and Title)* /s/Mark F. Travis
Mark F. Travis, President
Date June 5, 2023
Pursuant to the requirements of the Securities Exchange Act of 1934 and the Investment Company Act of 1940, this report has been signed below by the following persons on behalf of the registrant and in the capacities and on the dates indicated.
By (Signature and Title)* /s/Mark F. Travis
Mark F. Travis, President
Date June 5, 2023
By (Signature and Title)* /s/Timothy A. Page
Timothy A. Page, Treasurer
Date June 5, 2023
* Print the name and title of each signing officer under his or her signature