Exhibit 99.1
Link to searchable text of slide shown above
Link to searchable text of slide shown above
Link to searchable text of slide shown above
Link to searchable text of slide shown above

Link to searchable text of slide shown above
Link to searchable text of slide shown above

Link to searchable text of slide shown above
Link to searchable text of slide shown above
Link to searchable text of slide shown above
Link to searchable text of slide shown above
Link to searchable text of slide shown above
Link to searchable text of slide shown above
Link to searchable text of slide shown above
Link to searchable text of slide shown above
Link to searchable text of slide shown above
Link to searchable text of slide shown above
Link to searchable text of slide shown above
Link to searchable text of slide shown above
Link to searchable text of slide shown above
Link to searchable text of slide shown above
Searchable text section of graphics shown above
Yale Club Presentation
New York, NY
May 12, 2005
FORWARD-LOOKING STATEMENTS AND RECONCILIATION OF NON-GAAP MEASURES
Statements in this presentation which are not statements of historical fact are “forward-looking statements” within the “safe harbor” provision of the Private Securities Litigation Reform Act of 1995. These forward-looking statements are based on the information available to, and the expectations and assumptions deemed reasonable by, Foundation Coal Holdings, Inc. at the time this presentation was made. Although Foundation Coal Holdings, Inc. believes that the assumptions underlying such statements are reasonable, it can give no assurance that they will be attained. Factors that could cause actual results to differ materially from expectations include the risks detailed under the section “Risk Factors” in the company’s Form 10-K filed with the Securities and Exchange Commission.
Also, this presentation contains certain financial measures, such as EBITDA. As required by Securities and Exchange Commission Regulation G, reconciliations of these measures to figures reported in Foundation Coal’s consolidated financial statements are provided in the company’s annual and quarterly earnings releases.
[LOGO]
2
COMPANY OVERVIEW
• 5th largest coal producer in the United States
• Operations in the four major coal regions: PRB, NAPP, CAPP, Illinois Basin
• 1.8 billion tons of proven and probable reserves
• Diverse coal qualities: compliance; low sulfur; high Btu, mid sulfur; and metallurgical coal
• Independent subsidiary since 1999
3
KEY INVESTMENT HIGHLIGHTS
• Strong, sustainable coal market
• Large, diversified producer with presence in key U.S. supply regions
• Highly productive operations
• Positioned for significant revenue growth
• Attractive internal and external growth prospects
• Strong earnings and cash flow profile
• Experienced management focused on shareholder value
• Industry leading margins driven by low cost structure
4
STRONG AND SUSTAINABLE COAL MARKET
[CHART]
• Declining inventories at U.S. utilities
• Strengthening gas prices
• Decline in eastern U.S. coal production
• New coal-based generating capacity
• Strong economic outlook
• International demand growth
5
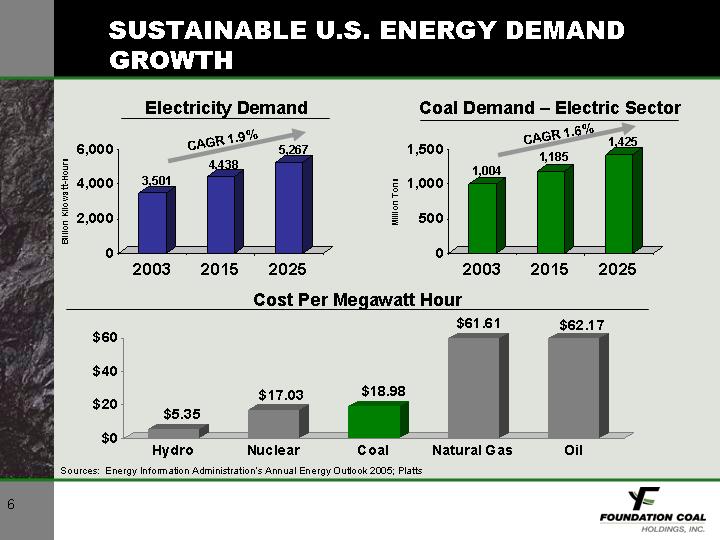
SUSTAINABLE U.S. ENERGY DEMAND GROWTH
Electricity Demand
[CHART]
Coal Demand – Electric Sector
[CHART]
Cost Per Megawatt Hour
[CHART]
Sources: Energy Information Administration’s Annual Energy Outlook 2005; Platts
6
CHANGING REGIONAL COAL SUPPLY DYNAMICS
Key Growth Drivers
• Declining production of low-sulfur CAPP coal
• Limited infrastructure for coal imports
• SO2 control technology additions
• Increasing demand for PRB and NAPP coal due to availability and competitiveness
• Highly productive mines in NAPP and PRB
Coal Production by Major Supply Region
[CHART]
Sources: Platts COALdat, Platts Analytics
7
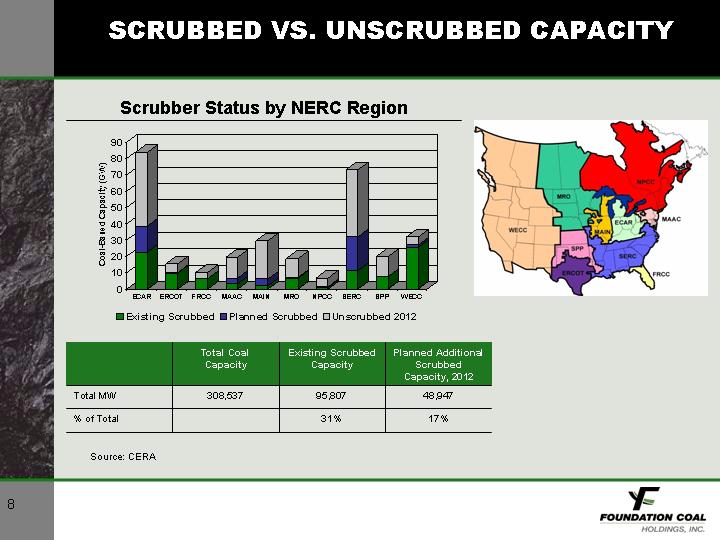
SCRUBBED VS. UNSCRUBBED CAPACITY
Scrubber Status by NERC Region
[CHART]
[GRAPHIC]
| | Total Coal
Capacity | | Existing Scrubbed
Capacity | | Planned Additional
Scrubbed
Capacity, 2012 | |
Total MW | | 308,537 | | 95,807 | | 48,947 | |
% of Total | | | | 31 | % | 17 | % |
Source: CERA
8
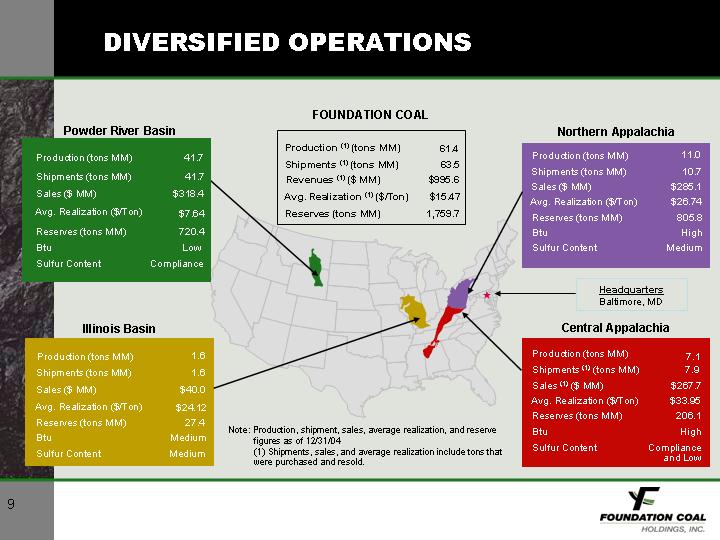
DIVERSIFIED OPERATIONS
FOUNDATION COAL
Production (1) (tons MM) | | 61.4 | |
Shipments (1) (tons MM) | | 63.5 | |
Revenues (1) ($ MM) | | $ | 995.6 | |
Avg. Realization (1) ($/Ton) | | $ | 15.47 | |
Reserves (tons MM) | | 1,759.7 | |
[GRAPHIC]
Powder River Basin
Production (tons MM) | | 41.7 | |
Shipments (tons MM) | | 41.7 | |
Sales ($ MM) | | $ | 318.4 | |
Avg. Realization ($/Ton) | | $ | 7.64 | |
Reserves (tons MM) | | 720.4 | |
Btu | | Low | |
Sulfur Content | | Compliance | |
Illinois Basin
Production (tons MM) | | 1.6 | |
Shipments (tons MM) | | 1.6 | |
Sales ($ MM) | | $ | 40.0 | |
Avg. Realization ($/Ton) | | $ | 24.12 | |
Reserves (tons MM) | | 27.4 | |
Btu | | Medium | |
Sulfur Content | | Medium | |
Northern Appalachia
Production (tons MM) | | 11.0 | |
Shipments (tons MM) | | 10.7 | |
Sales ($ MM) | | $ | 285.1 | |
Avg. Realization ($/Ton) | | $ | 26.74 | |
Reserves (tons MM) | | 805.8 | |
Btu | | High | |
Sulfur Content | | Medium | |
Central Appalachia
Production (tons MM) | | 7.1 | |
Shipments (1) (tons MM) | | 7.9 | |
Sales (1) ($ MM) | | $ | 267.7 | |
Avg. Realization ($/Ton) | | $ | 33.95 | |
Reserves (tons MM) | | 206.1 | |
Btu | | High | |
Sulfur Content | | Compliance
and Low | |
Note: Production, shipment, sales, average realization, and reserve figures as of 12/31/04
(1) Shipments, sales, and average realization include tons that were purchased and resold.
9
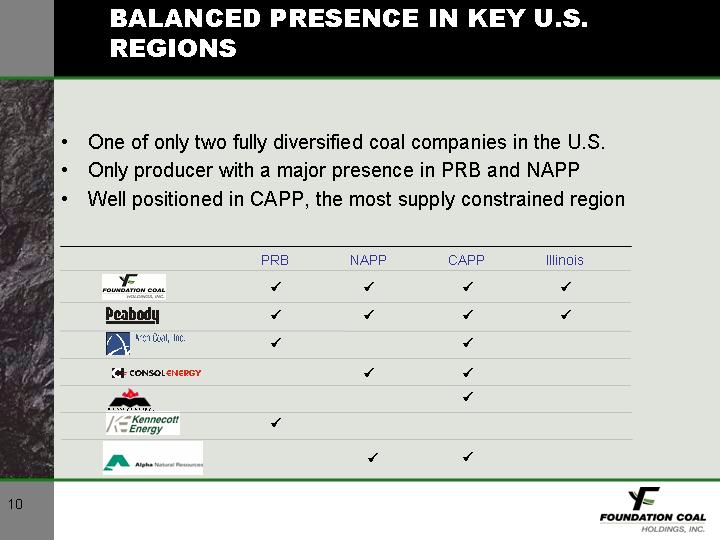
BALANCED PRESENCE IN KEY U.S. REGIONS
• One of only two fully diversified coal companies in the U.S.
• Only producer with a major presence in PRB and NAPP
• Well positioned in CAPP, the most supply constrained region
| | PRB | | NAPP | | CAPP | | Illinois | |
[LOGO] | | ý | | ý | | ý | | ý | |
[LOGO] | | ý | | ý | | ý | | ý | |
[LOGO] | | ý | | | | ý | | | |
[LOGO] | | | | ý | | ý | | | |
[LOGO] | | | | | | ý | | | |
[LOGO] | | ý | | | | | | | |
[LOGO] | | | | ý | | ý | | | |
10
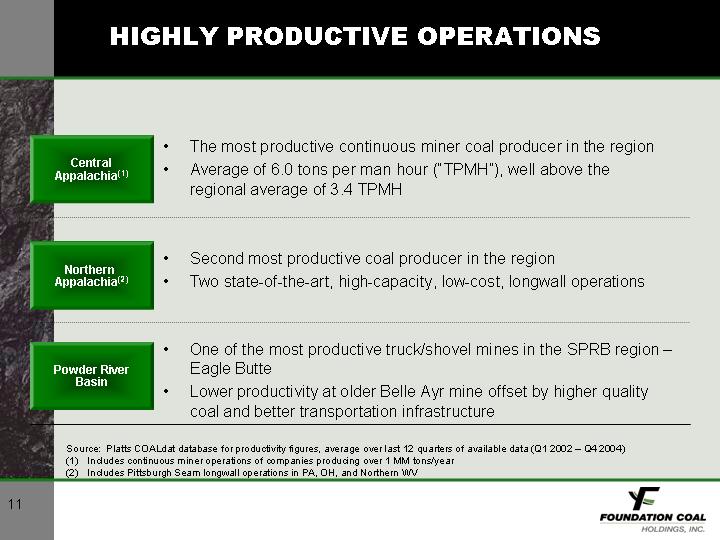
HIGHLY PRODUCTIVE OPERATIONS
Central
Appalachia(1) | | • The most productive continuous miner coal producer in the region |
| • Average of 6.0 tons per man hour (“TPMH”), well above the regional average of 3.4 TPMH |
| | |
Northern
Appalachia(2) | | • Second most productive coal producer in the region |
| • Two state-of-the-art, high-capacity, low-cost, longwall operations |
| | |
Powder River
Basin | | • One of the most productive truck/shovel mines in the SPRB region – Eagle Butte |
| • Lower productivity at older Belle Ayr mine offset by higher quality coal and better transportation infrastructure |
Source: Platts COALdat database for productivity figures, average over last 12 quarters of available data (Q1 2002 – Q4 2004)
(1) Includes continuous miner operations of companies producing over 1 MM tons/year
(2) Includes Pittsburgh Seam longwall operations in PA, OH, and Northern WV
11
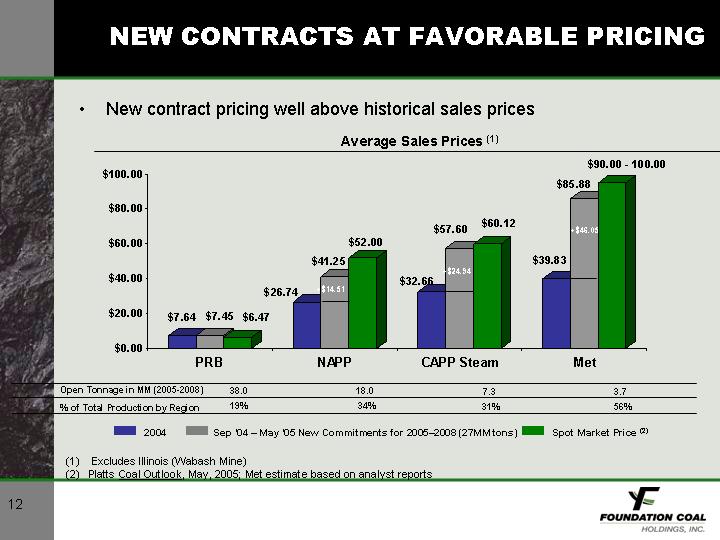
NEW CONTRACTS AT FAVORABLE PRICING
• New contract pricing well above historical sales prices
Average Sales Prices (1)
[CHART]
Open Tonnage in MM (2005-2008) | | 38.0 | | 18.0 | | 7.3 | | 3.7 | |
% of Total Production by Region | | 19 | % | 34 | % | 31 | % | 56 | % |
(1) Excludes Illinois (Wabash Mine)
(2) Platts Coal Outlook, May, 2005; Met estimate based on analyst reports
12
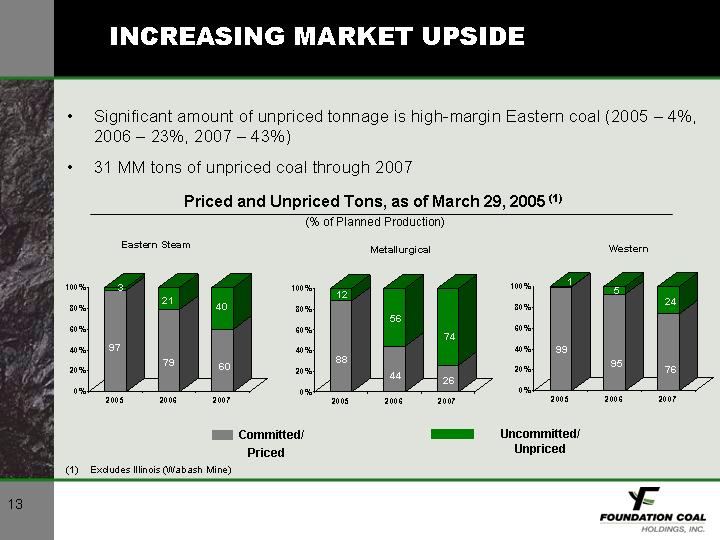
INCREASING MARKET UPSIDE
• Significant amount of unpriced tonnage is high-margin Eastern coal (2005 – 4%, 2006 – 23%, 2007 – 43%)
• 31 MM tons of unpriced coal through 2007
Priced and Unpriced Tons, as of March 29, 2005 (1)
(% of Planned Production)
Eastern Steam
[CHART]
Metallurgical
[CHART]
Western
[CHART]
(1) Excludes Illinois (Wabash Mine)
13
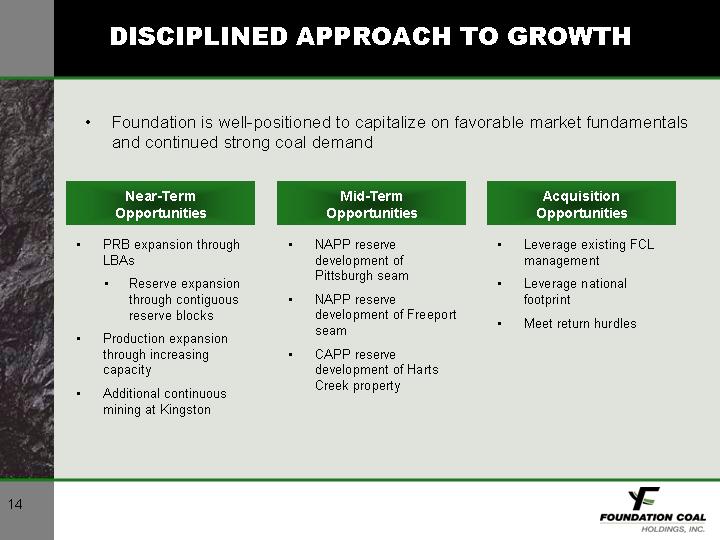
DISCIPLINED APPROACH TO GROWTH
• Foundation is well-positioned to capitalize on favorable market fundamentals and continued strong coal demand
Near-Term
Opportunities | | Mid-Term
Opportunities | | Acquisition
Opportunities | |
| | | | | |
• PRB expansion through LBAs | | • NAPP reserve development of Pittsburgh seam | | • Leverage existing FCL management | |
| | | | | |
• Reserve expansion through contiguous reserve blocks | | • NAPP reserve development of Freeport seam | | • Leverage national footprint | |
| | | | | |
• Production expansion through increasing capacity | | • CAPP reserve development of Harts Creek property | | • Meet return hurdles | |
| | | | | |
• Additional continuous mining at Kingston | | | | | |
14
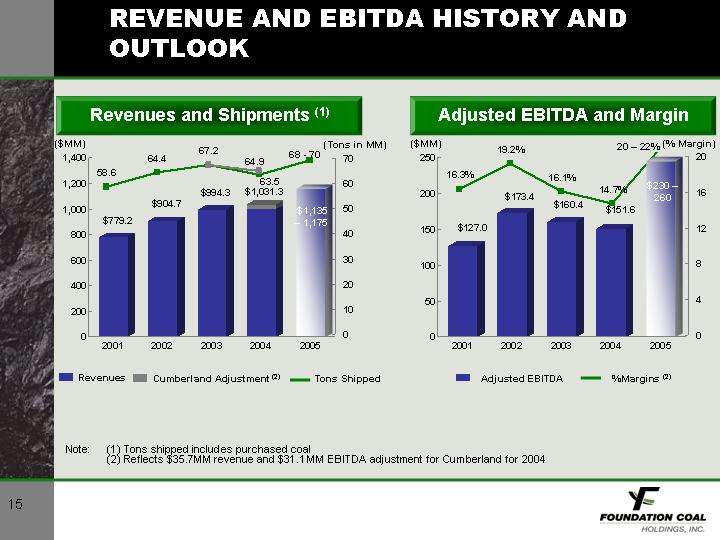
REVENUE AND EBITDA HISTORY AND OUTLOOK
Revenues and Shipments (1)
[CHART]
Adjusted EBITDA and Margin
[CHART]
Note: (1) Tons shipped includes purchased coal
(2) Reflects $35.7MM revenue and $31.1MM EBITDA adjustment for Cumberland for 2004
15
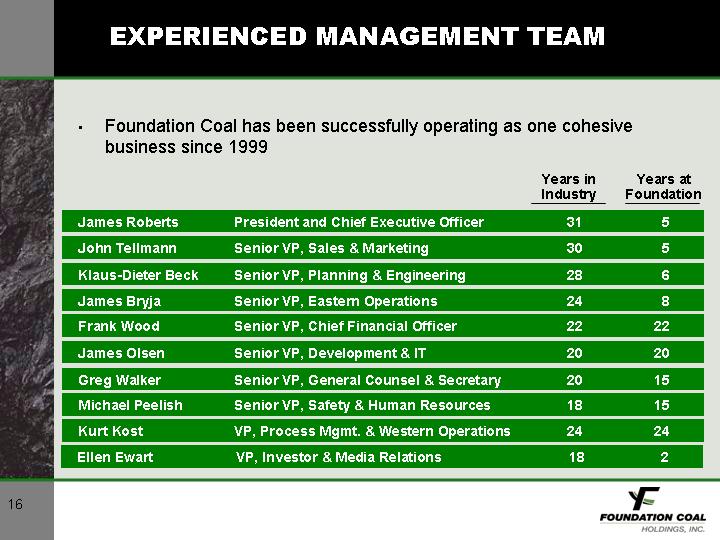
EXPERIENCED MANAGEMENT TEAM
• Foundation Coal has been successfully operating as one cohesive business since 1999
| | | | Years in
Industry | | Years at
Foundation | |
| | | | | | | |
James Roberts | | President and Chief Executive Officer | | 31 | | 5 | | |
John Tellmann | | Senior VP, Sales & Marketing | | 30 | | 5 | | |
Klaus-Dieter Beck | | Senior VP, Planning & Engineering | | 28 | | 6 | | |
James Bryja | | Senior VP, Eastern Operations | | 24 | | 8 | | |
Frank Wood | | Senior VP, Chief Financial Officer | | 22 | | 22 | | |
James Olsen | | Senior VP, Development & IT | | 20 | | 20 | | |
Greg Walker | | Senior VP, General Counsel & Secretary | | 20 | | 15 | | |
Michael Peelish | | Senior VP, Safety & Human Resources | | 18 | | 15 | | |
Kurt Kost | | VP, Process Mgmt. & Western Operations | | 24 | | 24 | | |
Ellen Ewart | | VP, Investor & Media Relations | | 18 | | 2 | | |
16
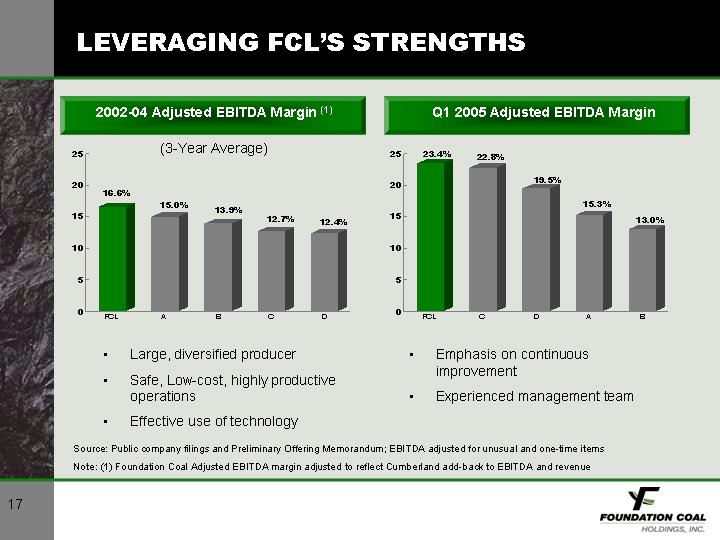
LEVERAGING FCL’S STRENGTHS
2002-04 Adjusted EBITDA Margin (1)
(3-Year Average)
[CHART]
Q1 2005 Adjusted EBITDA Margin
[CHART]
• Large, diversified producer
• Safe, Low-cost, highly productive operations
• Effective use of technology
• Emphasis on continuous improvement
• Experienced management team
Source: Public company filings and Preliminary Offering Memorandum; EBITDA adjusted for unusual and one-time items
Note: (1) Foundation Coal Adjusted EBITDA margin adjusted to reflect Cumberland add-back to EBITDA and revenue
17
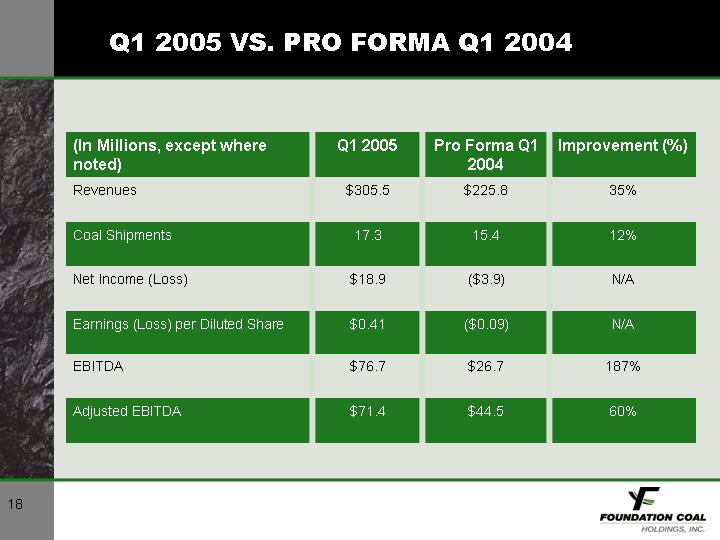
Q1 2005 VS. PRO FORMA Q1 2004
(In Millions, except where
noted) | | Q1 2005 | | Pro Forma Q1
2004 | | Improvement (%) | |
Revenues | | $ | 305.5 | | $ | 225.8 | | 35 | % |
| | | | | | | |
Coal Shipments | | 17.3 | | 15.4 | | 12 | % |
| | | | | | | |
Net Income (Loss) | | $ | 18.9 | | $ | (3.9 | ) | N/A | |
| | | | | | | |
Earnings (Loss) per Diluted Share | | $ | 0.41 | | $ | (0.09 | ) | N/A | |
| | | | | | | |
EBITDA | | $ | 76.7 | | $ | 26.7 | | 187 | % |
| | | | | | | |
Adjusted EBITDA | | $ | 71.4 | | $ | 44.5 | | 60 | % |
18
STRATEGY FOR SUCCESS: EXECUTE BUSINESS PLAN
• Maintain safe, low-cost operations
• Seek synergistic, accretive acquisitions
• Achieve organic growth through intelligent management of existing reserve base
• Take advantage of strong market dynamics
• Maintain strong balance sheet fundamentals
19