Searchable text section of graphics shown above
[LOGO]
[LOGO]
Morgan Stanley Basic Materials
Conference
New York, NY
February 22, 2006
FORWARD-LOOKING STATEMENTS AND RECONCILIATION OF NON-GAAP MEASURES
Statements in this presentation which are not statements of historical fact are “forward-looking statements” within the “safe harbor” provision of the Private Securities Litigation Reform Act of 1995. These forward-looking statements are based on the information available to, and the expectations and assumptions deemed reasonable by, Foundation Coal Holdings, Inc. at the time this presentation was made. Although Foundation Coal Holdings, Inc. believes that the assumptions underlying such statements are reasonable, it can give no assurance that they will be attained. Factors that could cause actual results to differ materially from expectations include the risks detailed under the section “Risk Factors” in the company’s Form 10-K filed with the Securities and Exchange Commission.
Also, this presentation contains certain financial measures, such as EBITDA. As required by Securities and Exchange Commission Regulation G, reconciliations of these measures to figures reported in Foundation Coal’s consolidated financial statements are provided in the company’s annual and quarterly earnings releases.
2
WHY INVEST IN FCL?
• Major diversified producer with presence in key U.S. supply regions
• High capacity, large scale operations
• Positioned for significant revenue growth
• Attractive internal and external growth prospects
• Industry leading margins driven by low cost structure
• Strong earnings and cash flow profile
• Strong, sustainable coal market fundamentals
• Experienced management focused on shareholder value
• Proven business plan for success
3
SUCCESSFUL BUSINESS STRATEGY
• Maintain commitment to operational excellence as a low-cost producer
• Continue to focus on excellence in safety and environmental stewardship
• Continue to manage risk through regional, operational, and market diversity
• Prudently expand production and reserve base
• Capitalize on favorable industry dynamics
• Maintain strong balance sheet fundamentals
4
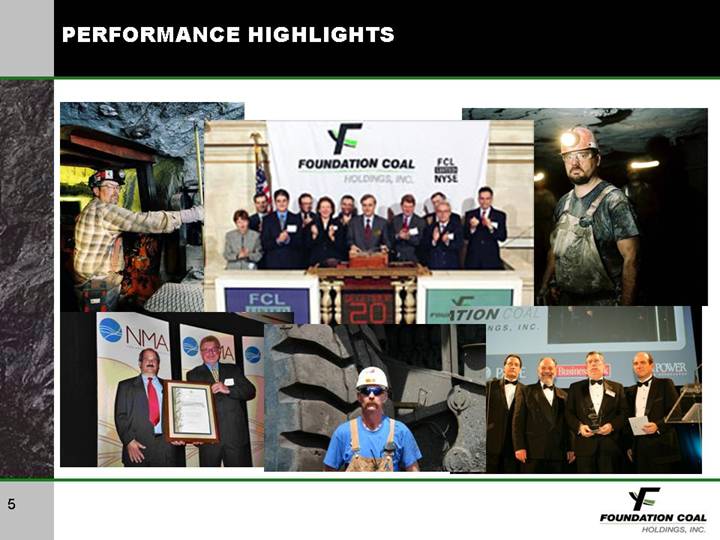
PERFORMANCE HIGHLIGHTS
[GRAPHIC]
5
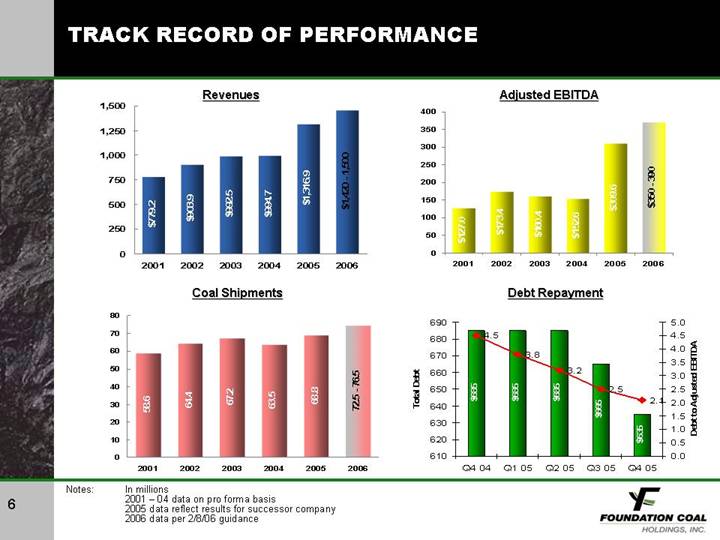
TRACK RECORD OF PERFORMANCE
Revenues | | Adjusted EBITDA |
| | |
[CHART] | | [CHART] |
| | |
Coal Shipments | | Debt Repayment |
| | |
[CHART] | | [CHART] |
Notes: In millions
2001 – 04 data on pro forma basis
2005 data reflect results for successor company
2006 data per 2/8/06 guidance
6
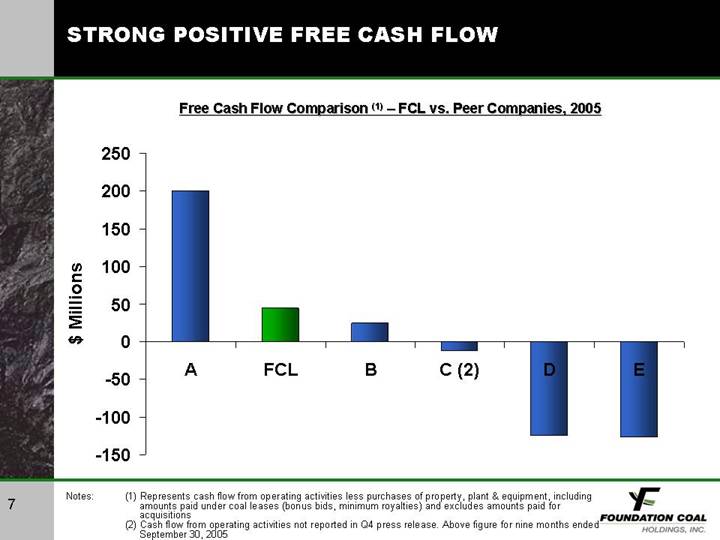
STRONG POSITIVE FREE CASH FLOW
Free Cash Flow Comparison (1) – FCL vs. Peer Companies, 2005
[CHART]
Notes: | | (1) Represents cash flow from operating activities less purchases of property, plant & equipment, including amounts paid under coal leases (bonus bids, minimum royalties) and excludes amounts paid for acquisitions |
| | (2) Cash flow from operating activities not reported in Q4 press release. Above figure for nine months ended September 30, 2005 |
7
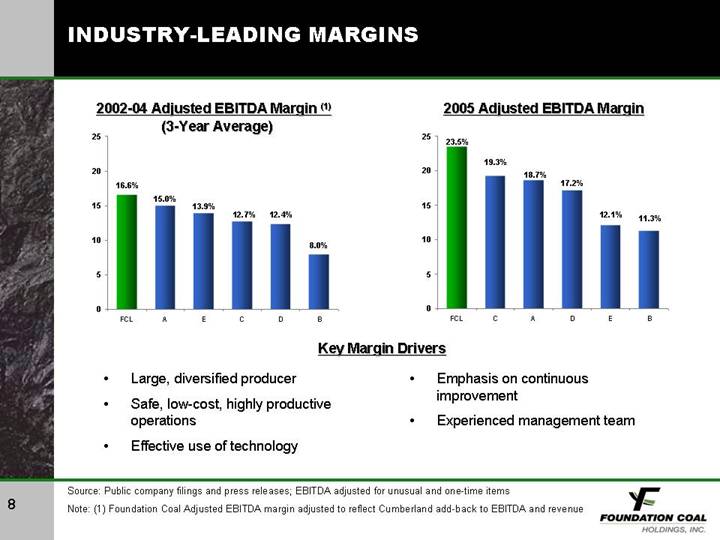
INDUSTRY-LEADING MARGINS
2002-04 Adjusted EBITDA Margin (1) | | 2005 Adjusted EBITDA Margin |
(3-Year Average) | | |
| | |
[CHART] | | [CHART] |
Key Margin Drivers
• Large, diversified producer
• Safe, low-cost, highly productive operations
• Effective use of technology
• Emphasis on continuous improvement
• Experienced management team
Source: Public company filings and press releases; EBITDA adjusted for unusual and one-time items
Note: (1) Foundation Coal Adjusted EBITDA margin adjusted to reflect Cumberland add-back to EBITDA and revenue
8
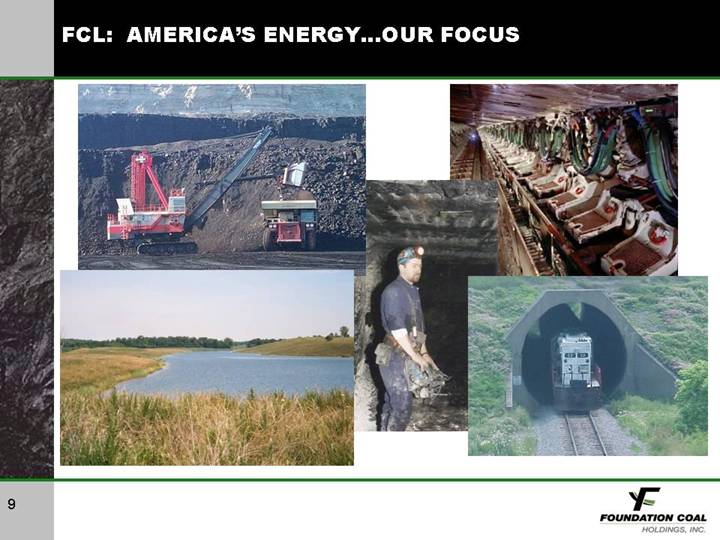
FCL: AMERICA’S ENERGY…OUR FOCUS
[GRAPHIC]
9
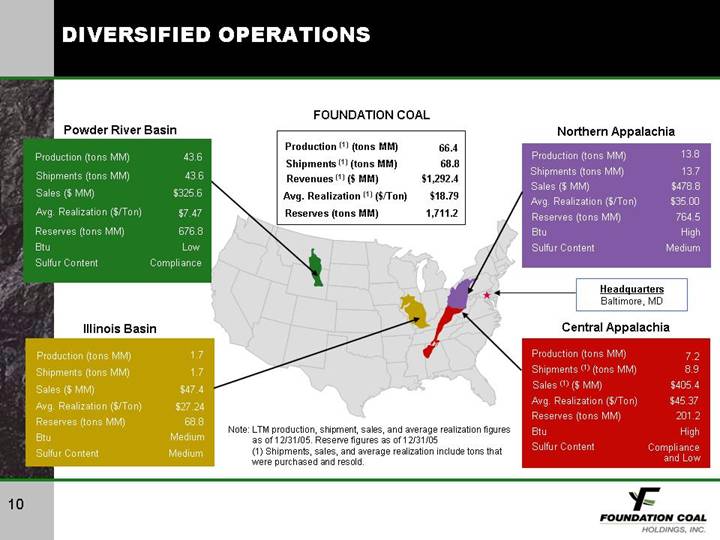
DIVERSIFIED OPERATIONS
[GRAPHIC]
FOUNDATION COAL
Production (1) (tons MM) | | 66.4 | |
Shipments (1) (tons MM) | | 68.8 | |
Revenues (1) ($ MM) | | $ | 1,292.4 | |
Avg. Realization (1) ($/Ton) | | $ | 18.79 | |
Reserves (tons MM) | | 1,711.2 | |
Powder River Basin
Production (tons MM) | | 43.6 | |
Shipments (tons MM) | | 43.6 | |
Sales ($ MM) | | $ | 325.6 | |
Avg. Realization ($/Ton) | | $ | 7.47 | |
Reserves (tons MM) | | 676.8 | |
Btu | | Low | |
Sulfur Content | | Compliance | |
Northern Appalachia
Production (tons MM) | | 13.8 | |
Shipments (tons MM) | | 13.7 | |
Sales ($ MM) | | $ | 478.8 | |
Avg. Realization ($/Ton) | | $ | 35.00 | |
Reserves (tons MM) | | 764.5 | |
Btu | | High | |
Sulfur Content | | Medium | |
Headquarters
Baltimore, MD
Central Appalachia
Production (tons MM) | | 7.2 | |
Shipments (1) (tons MM) | | 8.9 | |
Sales (1) ($ MM) | | $ | 405.4 | |
Avg. Realization ($/Ton) | | $ | 45.37 | |
Reserves (tons MM) | | 201.2 | |
Btu | | High | |
Sulfur Content | | Compliance
and Low | |
Illinois Basin
Production (tons MM) | | 1.7 | |
Shipments (tons MM) | | 1.7 | |
Sales ($ MM) | | $ | 47.4 | |
Avg. Realization ($/Ton) | | $ | 27.24 | |
Reserves (tons MM) | | 68.8 | |
Btu | | Medium | |
Sulfur Content | | Medium | |
Note: LTM production, shipment, sales, and average realization figures as of 12/31/05. Reserve figures as of 12/31/05
(1) Shipments, sales, and average realization include tons that were purchased and resold.
10
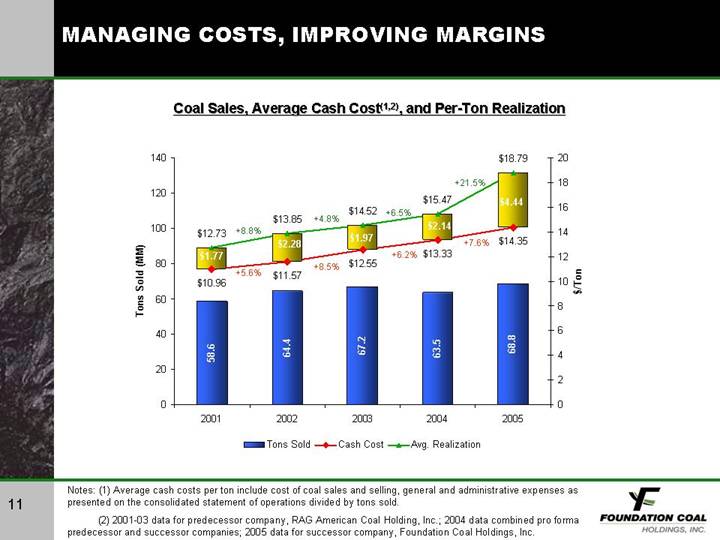
MANAGING COSTS, IMPROVING MARGINS
Coal Sales, Average Cash Cost(1), (2), and Per-Ton Realization
[CHART]
Notes: (1) Average cash costs per ton include cost of coal sales and selling, general and administrative expenses as presented on the consolidated statement of operations divided by tons sold.
(2) 2001-03 data for predecessor company, RAG American Coal Holding, Inc.; 2004 data combined pro forma predecessor and successor companies; 2005 data for successor company, Foundation Coal Holdings, Inc.
11
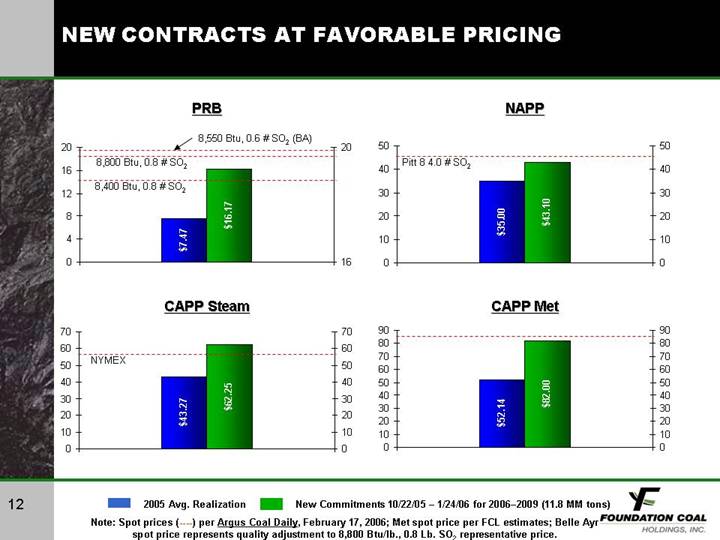
NEW CONTRACTS AT FAVORABLE PRICING
PRB | | NAPP |
| | |
[CHART] | | [CHART] |
| | |
CAPP Steam | | CAPP Met |
| | |
[CHART] | | [CHART] |
Note: Spot prices (----) per Argus Coal Daily, February 17, 2006; Met spot price per FCL estimates; Belle Ayr spot price represents quality adjustment to 8,800 Btu/lb., 0.8 Lb. SO2 representative price.
12
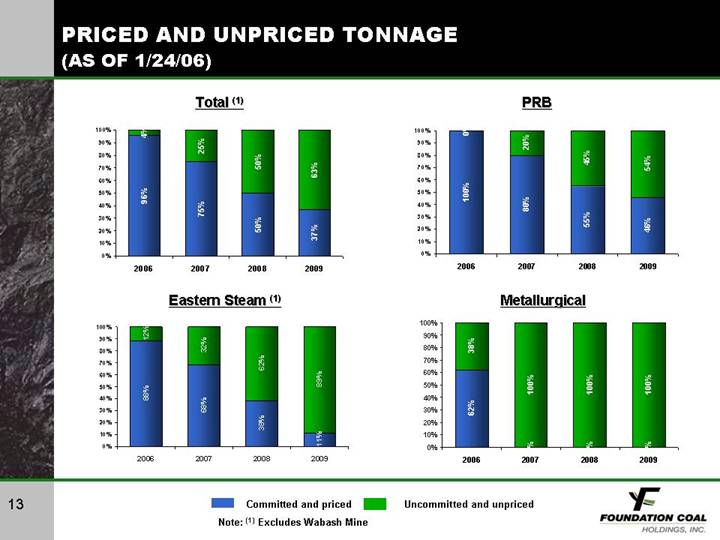
PRICED AND UNPRICED TONNAGE
(AS OF 1/24/06)
Total (1) | | PRB |
| | |
[CHART] | | [CHART] |
| | |
Eastern Steam (1) | | Metallurgical |
| | |
[CHART] | | [CHART] |
Note: (1) Excludes Wabash Mine
13
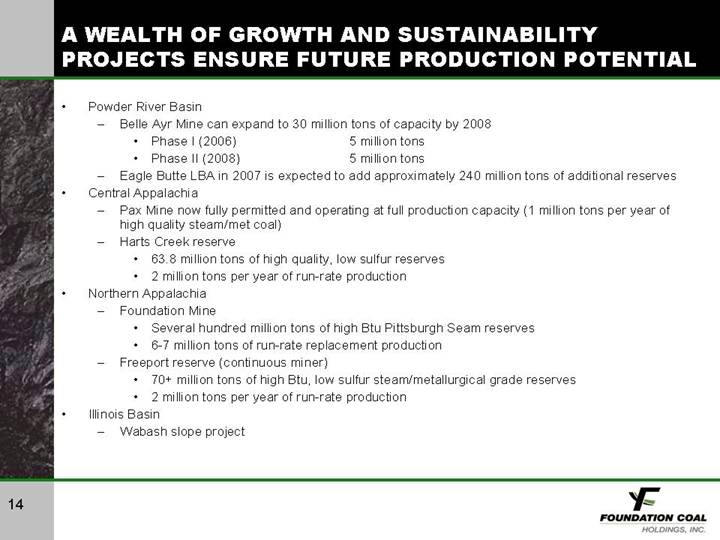
A WEALTH OF GROWTH AND SUSTAINABILITY PROJECTS ENSURE FUTURE PRODUCTION POTENTIAL
• Powder River Basin
• Belle Ayr Mine can expand to 30 million tons of capacity by 2008
• Phase I (2006) 5 million tons
• Phase II (2008) 5 million tons
• Eagle Butte LBA in 2007 is expected to add approximately 240 million tons of additional reserves
• Central Appalachia
• Pax Mine now fully permitted and operating at full production capacity (1 million tons per year of high quality steam/met coal)
• Harts Creek reserve
• 63.8 million tons of high quality, low sulfur reserves
• 2 million tons per year of run-rate production
• Northern Appalachia
• Foundation Mine
• Several hundred million tons of high Btu Pittsburgh Seam reserves
• 6-7 million tons of run-rate replacement production
• Freeport reserve (continuous miner)
• 70+ million tons of high Btu, low sulfur steam/metallurgical grade reserves
• 2 million tons per year of run-rate production
• Illinois Basin
• Wabash slope project
14
ENERGY INDUSTRY OVERVIEW
[GRAPHIC]
15
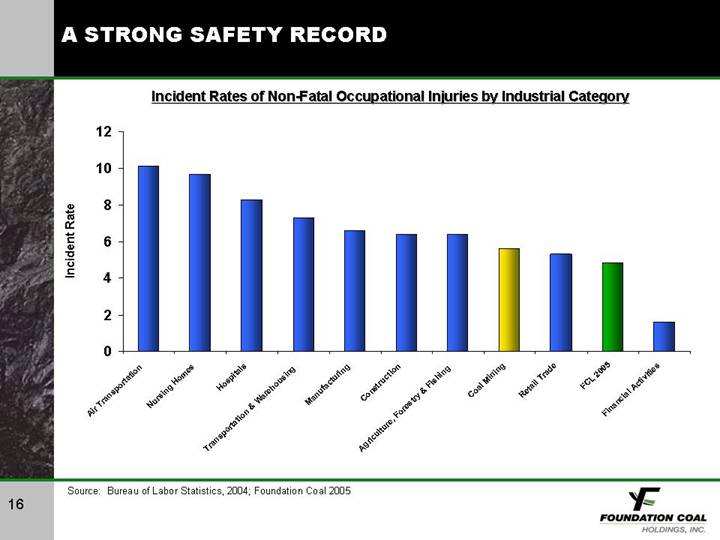
A STRONG SAFETY RECORD
Incident Rates of Non-Fatal Occupational Injuries by Industrial Category
[CHART]
Source: Bureau of Labor Statistics, 2004; Foundation Coal 2005
16
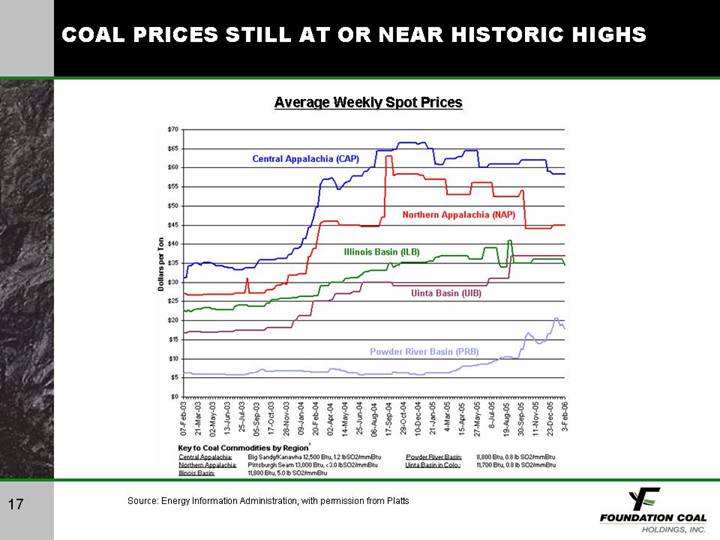
COAL PRICES STILL AT OR NEAR HISTORIC HIGHS
Average Weekly Spot Prices
[CHART]
Source: Energy Information Administration, with permission from Platts
17
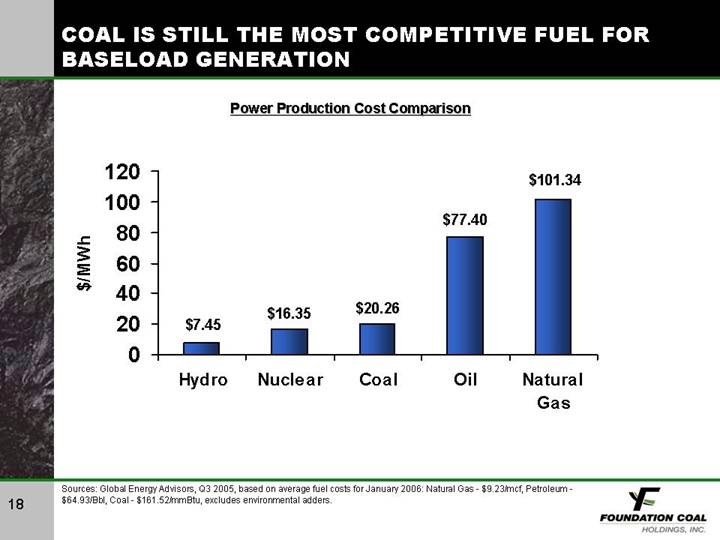
COAL IS STILL THE MOST COMPETITIVE FUEL FOR BASELOAD GENERATION
Power Production Cost Comparison
[CHART]
Sources: Global Energy Advisors, Q3 2005, based on average fuel costs for January 2006: Natural Gas - $9.23/mcf, Petroleum - $64.93/Bbl, Coal - $161.52/mmBtu, excludes environmental adders.
18
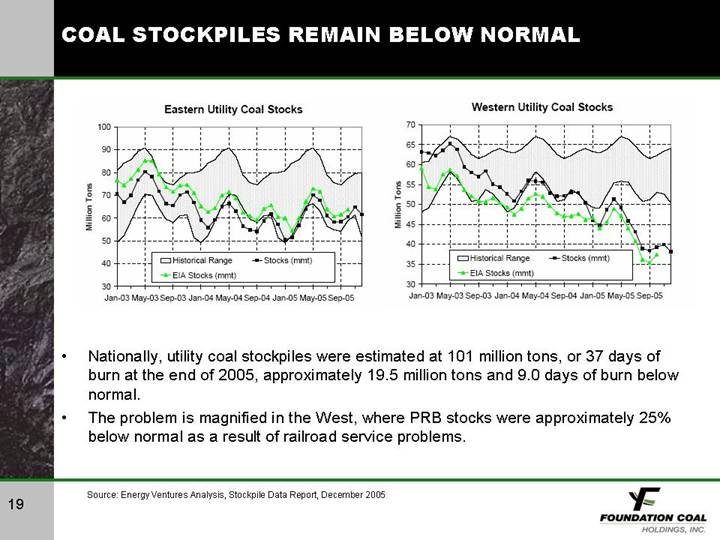
COAL STOCKPILES REMAIN BELOW NORMAL
Eastern Utility Coal Stocks | | Western Utility Coal Stocks |
| | |
[CHART] | | [CHART] |
• Nationally, utility coal stockpiles were estimated at 101 million tons, or 37 days of burn at the end of 2005, approximately 19.5 million tons and 9.0 days of burn below normal.
• The problem is magnified in the West, where PRB stocks were approximately 25% below normal as a result of railroad service problems.
Source: Energy Ventures Analysis, Stockpile Data Report, December 2005
19
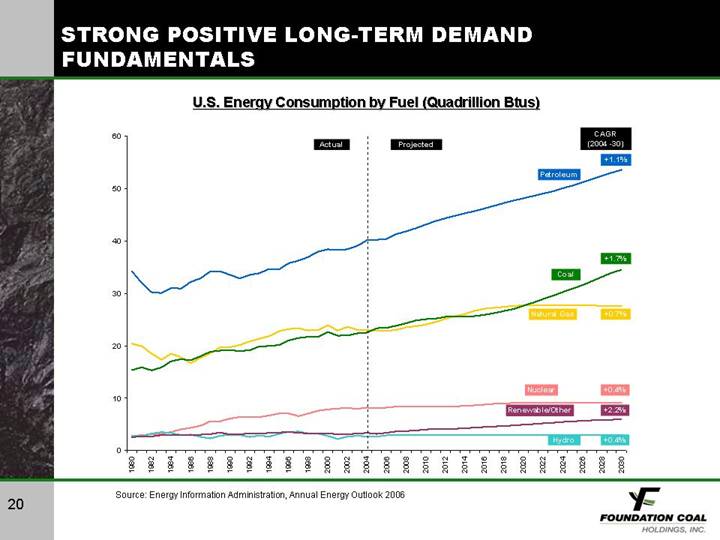
STRONG POSITIVE LONG-TERM DEMAND FUNDAMENTALS
U.S. Energy Consumption by Fuel (Quadrillion Btus)
[CHART]
Source: Energy Information Administration, Annual Energy Outlook 2006
20
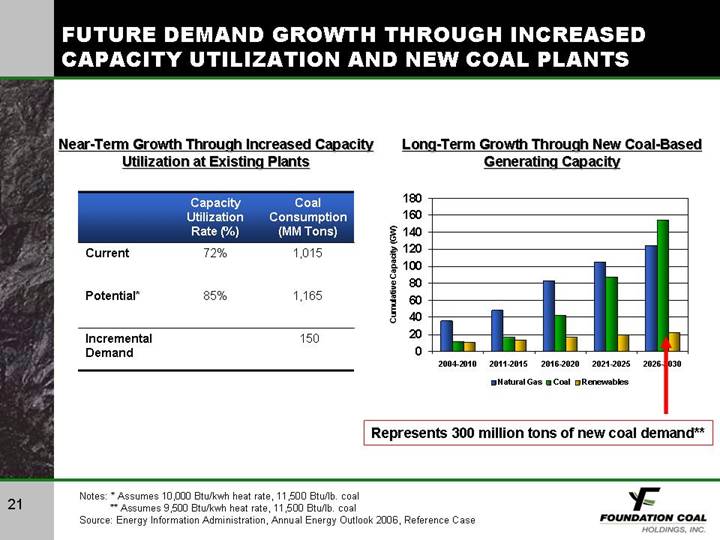
FUTURE DEMAND GROWTH THROUGH INCREASED CAPACITY UTILIZATION AND NEW COAL PLANTS
Near-Term Growth Through Increased Capacity Utilization at Existing Plants
| | Capacity | | Coal | |
| | Utilization | | Consumption | |
| | Rate (%) | | (MM Tons) | |
Current | | 72 | % | 1,015 | |
| | | | | |
Potential* | | 85 | % | 1,165 | |
| | | | | |
Incremental Demand | | | | 150 | |
Long-Term Growth Through New Coal-Based Generating Capacity
[CHART]
Represents 300 million tons of new coal demand**
Notes: * Assumes 10,000 Btu/kwh heat rate, 11,500 Btu/lb. coal
** Assumes 9,500 Btu/kwh heat rate, 11,500 Btu/lb. coal
Source: Energy Information Administration, Annual Energy Outlook 2006, Reference Case
21
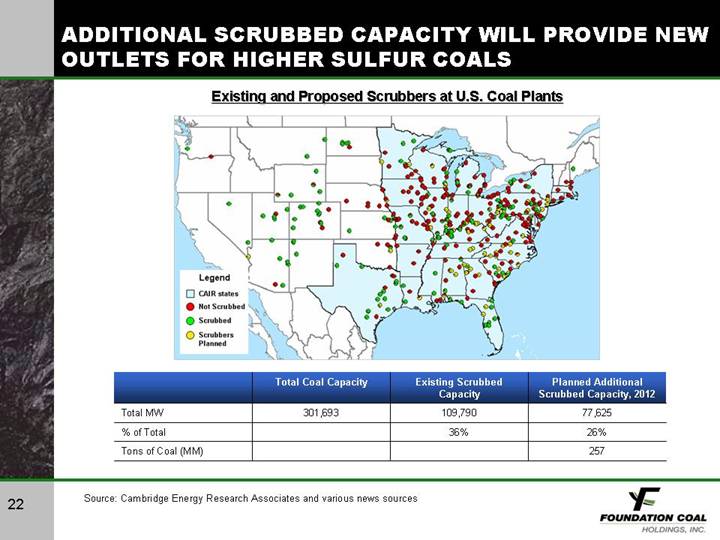
ADDITIONAL SCRUBBED CAPACITY WILL PROVIDE NEW OUTLETS FOR HIGHER SULFUR COALS
Existing and Proposed Scrubbers at U.S. Coal Plants
[GRAPHIC]
| | | | Existing Scrubbed | | Planned Additional | |
| | Total Coal Capacity | | Capacity | | Scrubbed Capacity, 2012 | |
Total MW | | 301,693 | | 109,790 | | 77,625 | |
% of Total | | | | 36 | % | 26 | % |
Tons of Coal (MM) | | | | | | 257 | |
Source: Cambridge Energy Research Associates and various news sources
22
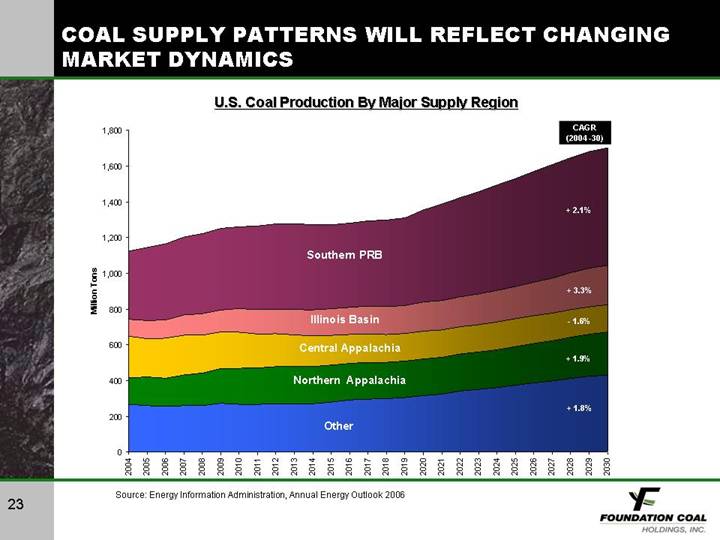
COAL SUPPLY PATTERNS WILL REFLECT CHANGING MARKET DYNAMICS
U.S. Coal Production By Major Supply Region
[CHART]
Source: Energy Information Administration, Annual Energy Outlook 2006
23
SUMMARY
• Successful business strategy
• Proven record of performance
• Well-balanced contract position
• Still favorable short-term market fundamentals
• Excellent long-term outlook
Æ Solid company, favorable sector
24