UNITED STATES
SECURITIES AND EXCHANGE COMMISSION
Washington, D.C. 20549
FORM 10-Q
(Mark One)
| x | QUARTERLY REPORT PURSUANT TO SECTION 13 OR 15(d) OF THE SECURITIES EXCHANGE ACT OF 1934 |
For the Quarterly Period Ended June 30, 2009
or
| ¨ | TRANSITION REPORT PURSUANT TO SECTION 13 OR 15(d) OF THE SECURITIES EXCHANGE ACT OF 1934 |
For the Transition Period From to
Commission File Number 001-32331
ALPHA NATURAL RESOURCES, INC.
(Exact Name of Registrant as Specified in Its Charter)
| | |
| Delaware | | 42-1638663 |
(State or Other Jurisdiction of Incorporation or Organization) | | (I.R.S. Employer Identification No.) |
| | |
One Alpha Place, P.O. Box 2345 Abingdon, Virginia | | 24212 |
| (Address of Principal Executive Offices) | | (Zip Code) |
Registrant’s telephone number, including area code (276) 619-4410
Foundation Coal Holdings, Inc.
999 Corporate Boulevard, Suite 300
Linthicum Heights, Maryland 21090
(Former name, former address and former fiscal year, if changed since last report)
Indicate by check mark whether the Registrant (1) has filed all reports required to be filed by Section 13 or 15(d) of the Securities Exchange Act of 1934 during the preceding 12 months (or for such shorter period that the registrant was required to file such reports), and (2) has been subject to such filing requirements for the past 90 days. Yes x No ¨
Indicate by check mark whether the Registrant has submitted electronically and posted on its corporate Web site, if any, every Interactive Data File required to be submitted and posted pursuant to Rule 405 of Regulation S-T (§ 232.405 of this chapter) during the preceding 12 months (or for such shorter period that the registrant was required to submit and post such files). Yes ¨ No ¨
Indicate by check mark whether the registrant is a large accelerated filer, an accelerated filer, a non-accelerated filer or a smaller reporting company. See definition of “accelerated filer”, “large accelerated filer” and “smaller reporting company” in Rule 12b-2 of the Exchange Act. (Check one):
Large accelerated filer x Accelerated filer ¨ Non-accelerated filer ¨ Smaller reporting company ¨
Indicate by check mark whether the registrant is a shell company (as defined in Rule 12b-2 of the Exchange
Act). Yes ¨ No x
There were 44,697,795 shares of common stock outstanding on July 30, 2009.
TABLE OF CONTENTS
2
PART I – FINANCIAL INFORMATION
Unless the context otherwise indicates, as used in this Form 10-Q the terms “we,” “our,” “us” and similar terms refer to Alpha Natural Resources, Inc. (formerly Foundation Coal Holdings, Inc.) and its consolidated subsidiaries.
| ITEM 1. | FINANCIAL STATEMENTS. |
Alpha Natural Resources, Inc. and Subsidiaries
Consolidated Balance Sheets
(Dollars in thousands, except per share data)
| | | | | | |
| | | June 30,
2009 | | December 31,
2008 |
| | | (Unaudited) | | |
| | |
| ASSETS | | | | | | |
Current assets: | | | | | | |
Cash | | $ | 30,896 | | $ | 42,326 |
Trade accounts receivable | | | 114,073 | | | 135,354 |
Inventories, net | | | 93,595 | | | 56,508 |
Deferred income taxes | | | 29,255 | | | 29,302 |
Prepaid expenses | | | 25,943 | | | 28,517 |
Other current assets | | | 5,620 | | | 5,676 |
| | | | | | |
Total current assets | | | 299,382 | | | 297,683 |
Owned surface lands | | | 55,103 | | | 51,802 |
Plant, equipment and mine development costs, net | | | 698,716 | | | 685,609 |
Owned and leased mineral rights, net | | | 892,007 | | | 888,514 |
Coal supply agreements, net | | | 5,122 | | | 6,910 |
Other noncurrent assets | | | 37,511 | | | 37,590 |
| | | | | | |
Total assets | | $ | 1,987,841 | | $ | 1,968,108 |
| | | | | | |
| | |
| LIABILITIES | | | | | | |
| | |
Current liabilities: | | | | | | |
Current portion of long-term debt | | $ | 33,500 | | $ | 16,750 |
Trade accounts payable | | | 43,272 | | | 52,595 |
Accrued expenses and other current liabilities | | | 170,876 | | | 202,752 |
| | | | | | |
Total current liabilities | | | 247,648 | | | 272,097 |
Long-term debt | | | 566,285 | | | 583,035 |
Deferred income taxes | | | 5,056 | | | - |
Coal supply agreements, net | | | 2,627 | | | 4,268 |
Postretirement benefits | | | 543,553 | | | 533,166 |
Other noncurrent liabilities | | | 363,749 | | | 351,181 |
| | | | | | |
Total liabilities | | | 1,728,918 | | | 1,743,747 |
| | | | | | |
| | |
Commitments and contingencies (Note 16) | | | | | | |
| | |
| STOCKHOLDERS’ EQUITY | | | | | | |
| | |
Common stock, $0.01 par value; 100.0 million shares authorized, 47.2 million shares issued and 44.7 million shares outstanding at June 30, 2009; 47.0 million shares issued and 44.5 million shares outstanding at December 31, 2008 | | | 472 | | | 470 |
Additional paid-in capital | | | 319,186 | | | 316,567 |
Retained earnings | | | 111,065 | | | 89,329 |
Accumulated other comprehensive loss | | | (81,784) | | | (93,378) |
Treasury stock, at cost: 2.5 million shares at June 30, 2009; 2.5 million shares at December 31, 2008 | | | (90,016) | | | (88,627) |
| | | | | | |
Total stockholders’ equity | | | 258,923 | | | 224,361 |
| | | | | | |
Total liabilities and stockholders’ equity | | $ | 1,987,841 | | $ | 1,968,108 |
| | | | | | |
The accompanying notes are an integral part of these consolidated financial statements.
3
Alpha Natural Resources, Inc. and Subsidiaries
Consolidated Statements of Operations and Comprehensive Income (Loss)
(Unaudited, dollars in thousands, except per share data)
| | | | | | |
| | | Three Months Ended
June 30, |
| | | 2009 | | 2008 |
Revenues: | | | | | | |
Coal sales | | $ | 398,999 | | $ | 404,780 |
Other revenue | | | 5,661 | | | 7,157 |
| | | | | | |
Total revenues | | | 404,660 | | | 411,937 |
Costs and expenses: | | | | | | |
Cost of coal sales (excludes depreciation, depletion and amortization) | | | 279,452 | | | 330,226 |
Selling, general and administrative expenses (excludes depreciation, depletion and amortization) | | | 21,249 | | | 17,423 |
Accretion on asset retirement obligations | | | 2,949 | | | 2,899 |
Depreciation, depletion and amortization | | | 52,114 | | | 51,505 |
Amortization of coal supply agreements | | | 172 | | | 1,197 |
| | | | | | |
Income from operations | | | 48,724 | | | 8,687 |
Other income (expense): | | | | | | |
Interest expense | | | (9,046) | | | (11,366) |
Interest income | | | 18 | | | 248 |
| | | | | | |
Income (loss) before income tax expense and equity in losses of affiliates | | | 39,696 | | | (2,431) |
Income tax expense | | | (8,841) | | | (1,115) |
Equity in losses of affiliates | | | (199) | | | (881) |
| | | | | | |
Net income (loss) | | | 30,656 | | | (4,427) |
Other comprehensive income (loss): | | | | | | |
Adjustments to unrecognized gains and losses and amortization of employee benefit plan costs, net of tax expense of $1,201 in 2009 and tax benefit of $19 in 2008 | | | 4,157 | | | (29) |
Unrealized gain on financial swaps, net of tax expense of $451 in 2009 and $328 in 2008 | | | 1,807 | | | 493 |
Reclassification of unrealized loss on financial swaps, net of tax expense of $1,067 into cost of coal sales | | | 4,266 | | | - |
| | | | | | |
Comprehensive income (loss) | | $ | 40,886 | | $ | (3,963) |
| | | | | | |
Basic earnings (loss) per common share | | $ | 0.69 | | $ | (0.10) |
Diluted earnings (loss) per common share | | $ | 0.67 | | $ | (0.10) |
Weighted-average shares-basic | | | 44,675,617 | | | 45,397,449 |
Weighted-average shares-diluted | | | 45,480,914 | | | 45,397,449 |
Dividends declared per share | | $ | 0.05 | | $ | 0.05 |
The accompanying notes are an integral part of these consolidated financial statements.
4
Alpha Natural Resources, Inc. and Subsidiaries
Consolidated Statements of Operations and Comprehensive Income
(Unaudited, dollars in thousands, except per share data)
| | | | | | |
| | | Six Months Ended
June 30, |
| | | 2009 | | 2008 |
Revenues: | | | | | | |
Coal sales | | $ | 794,323 | | $ | 811,726 |
Other revenue | | | 15,506 | | | 12,515 |
| | | | | | |
Total revenues | | | 809,829 | | | 824,241 |
Costs and expenses: | | | | | | |
Cost of coal sales (excludes depreciation, depletion and amortization) | | | 612,020 | | | 645,699 |
Selling, general and administrative expenses (excludes depreciation, depletion and amortization) | | | 38,705 | | | 37,214 |
Accretion on asset retirement obligations | | | 5,906 | | | 5,456 |
Depreciation, depletion and amortization | | | 101,631 | | | 104,770 |
Amortization of coal supply agreements | | | 147 | | | 1,322 |
| | | | | | |
Income from operations | | | 51,420 | | | 29,780 |
Other income (expense): | | | | | | |
Interest expense | | | (18,196) | | | (24,280) |
Interest income | | | 165 | | | 691 |
| | | | | | |
Income before income tax expense and equity in losses of affiliates | | | 33,389 | | | 6,191 |
Income tax expense | | | (6,738) | | | (3,382) |
Equity in losses of affiliates | | | (448) | | | (1,066) |
| | | | | | |
Net income | | | 26,203 | | | 1,743 |
Other comprehensive income: | | | | | | |
Adjustments to unrecognized gains and losses and amortization of employee benefit plan costs, net of tax expense of $801 in 2009 and $39 in 2008 | | | 2,901 | | | 584 |
Unrealized (loss) gain on financial swaps, net of tax benefit of $122 in 2009 and tax expense of $711 in 2008 | | | (486) | | | 1,070 |
Reclassification of unrealized loss on financial swaps, net of tax expense of $2,295 into cost of coal sales | | | 9,179 | | | - |
| | | | | | |
Comprehensive income | | $ | 37,797 | | $ | 3,397 |
| | | | | | |
Basic earnings per common share | | $ | 0.59 | | $ | 0.04 |
Diluted earnings per common share | | $ | 0.58 | | $ | 0.04 |
Weighted-average shares-basic | | | 44,629,105 | | | 45,195,592 |
Weighted-average shares-diluted | | | 45,389,552 | | | 46,337,810 |
Dividends declared per share | | $ | 0.10 | | $ | 0.10 |
The accompanying notes are an integral part of these consolidated financial statements.
5
Alpha Natural Resources, Inc. and Subsidiaries
Consolidated Statements of Cash Flows
(Unaudited, dollars in thousands)
| | | | | | |
| | | Six Months Ended
June 30, |
| | | 2009 | | 2008 |
Operating activities: | | | | | | |
Net income | | $ | 26,203 | | $ | 1,743 |
Adjustments to reconcile net income to net cash provided by operating activities: | | | | | | |
Accretion on asset retirement obligations | | | 5,906 | | | 5,456 |
Depreciation, depletion and amortization | | | 101,778 | | | 106,092 |
Amortization of deferred financing costs | | | 937 | | | 911 |
Gain on sale of assets | | | (131) | | | (112) |
Non-cash stock compensation | | | 4,062 | | | 8,062 |
Excess tax benefit from stock-based awards | | | - | | | (5,542) |
Deferred income taxes | | | 629 | | | 146 |
Asset retirement obligation payments | | | (1,362) | | | (582) |
Equity in losses of affiliates | | | 448 | | | 1,066 |
Unrealized mark-to-market gain on derivative instruments | | | (6,116) | | | - |
Other | | | 208 | | | 227 |
Changes in operating assets and liabilities: | | | | | | |
Trade accounts receivable | | | 21,281 | | | (8,913) |
Inventories, net | | | (36,955) | | | 1,789 |
Prepaid expenses and other current assets | | | 3,387 | | | 13,403 |
Other noncurrent assets | | | (5) | | | (168) |
Trade accounts payable | | | (9,323) | | | 7,561 |
Accrued expenses and other current liabilities | | | (5,936) | | | (10,417) |
Noncurrent liabilities | | | 19,350 | | | 11,059 |
| | | | | | |
Net cash provided by operating activities | | | 124,361 | | | 131,781 |
| | | | | | |
Investing activities: | | | | | | |
Purchases of plant, equipment and mine development costs | | | (93,953) | | | (66,661) |
Acquisition of mineral rights under federal lease | | | (36,108) | | | (36,108) |
Purchases of equity-method investments | | | - | | | (10,070) |
Proceeds from disposition of plant and equipment | | | 125 | | | 324 |
| | | | | | |
Net cash used in investing activities | | | (129,936) | | | (112,515) |
| | | | | | |
Financing activities: | | | | | | |
Payment of cash dividends | | | (4,467) | | | (4,530) |
Proceeds from issuance of common stock | | | - | | | 3,436 |
Excess tax benefit from stock-based awards | | | - | | | 5,542 |
Proceeds from revolving credit facility | | | 10,000 | | | - |
Principal repayment of revolving credit facility | | | (10,000) | | | - |
Other | | | (1,388) | | | (2,073) |
| | | | | | |
Net cash (used in) provided by financing activities | | | (5,855) | | | 2,375 |
| | | | | | |
Net (decrease) increase in cash and cash equivalents | | | (11,430) | | | 21,641 |
Cash and cash equivalents at beginning of period | | | 42,326 | | | 50,071 |
| | | | | | |
Cash and cash equivalents at end of period | | $ | 30,896 | | $ | 71,712 |
| | | | | | |
Supplemental cash flow information: | | | | | | |
Cash paid for interest | | $ | 15,102 | | $ | 20,867 |
Cash paid for income taxes, net of refunds | | $ | 9,004 | | $ | 7,861 |
The accompanying notes are an integral part of these consolidated financial statements.
6
Alpha Natural Resources, Inc. and Subsidiaries
Notes to Consolidated Financial Statements
(Unaudited, dollars in thousands)
| (1) | Basis of Presentation of Consolidated Financial Statements |
The accompanying interim consolidated financial statements of Alpha Natural Resources, Inc. and Subsidiaries (formerly Foundation Coal Holdings, Inc. and herein referred to as the “Company”) are unaudited and prepared in accordance with the rules and regulations of the United States Securities and Exchange Commission (“SEC”) for Form 10-Q. Such rules and regulations allow the omission of certain information and footnote disclosures normally included in financial statements prepared in accordance with accounting principles generally accepted in the United States of America as long as the statements are not misleading. In the opinion of management, these interim consolidated financial statements reflect all normal and recurring adjustments necessary for a fair presentation of the results for the periods presented. These interim consolidated financial statements reflect the financial position as of June 30, 2009 and results of operations for the three and six months ended June 30, 2009 of Foundation Coal Holdings, Inc. prior to the merger with Alpha Natural Resources, Inc., more fully described in Note 20. These interim consolidated financial statements should be read in conjunction with the consolidated financial statements of Foundation Coal Holdings, Inc. included in its Annual Report on Form 10-K for the twelve months ended December 31, 2008, filed March 2, 2009.
The Company’s consolidated financial statements have been prepared in accordance with accounting principles generally accepted in the United States of America. The preparation of the Company’s consolidated financial statements requires management to make estimates and assumptions that affect the reported amounts of assets and liabilities at the date of the consolidated financial statements and the reported amounts of revenues and expenses during the reporting period. The more significant areas requiring the use of management estimates and assumptions relate to coal reserves that are the basis for future cash flow estimates and units-of-production depreciation, depletion and amortization calculations; environmental and reclamation obligations; asset impairments; postemployment, postretirement and other employee benefit liabilities; valuation allowances for deferred income taxes; income tax provision calculations; reserves for contingencies and litigation; and the fair value and accounting treatment of certain financial instruments. Management bases its estimates on historical experience and on various other assumptions that are believed to be reasonable under the circumstances. Accordingly, actual results may differ from these estimates. In addition, different assumptions or conditions could reasonably be expected to yield different results.
The operating results for the three and six months ended June 30, 2009 may not necessarily be indicative of the results to be expected in any other quarter or for the twelve months ended December 31, 2009.
| (2) | Recent Accounting Pronouncements |
In July 2009, the Financial Accounting Standards Board (“FASB”) issued Statement of Financial Accounting Standards (“SFAS”) No. 168,The FASB Accounting Standards Codification and the Hierarchy of Generally Accepted Accounting Principles (“SFAS No. 168”). This Statement replaces SFAS No. 162, The Hierarchy of Generally Accepted Accounting Principles (“SFAS No. 162”). This Statement establishes theFASB Accounting Standards CodificationTM (“Codification”) as the source of authoritative accounting principles recognized by the FASB to be applied by nongovernmental entities in the preparation of financial statements in conformity with Generally Accepted Accounting Principles (“GAAP”). Rules and interpretive releases of the SEC under authority of federal securities laws are also sources of authoritative GAAP for SEC registrants. This Statement is effective for financial statements issued for interim and annual periods ending after September 15, 2009. The implementation will have no impact on the Company’s consolidated financial statements. The standard requires new disclosures in the Company’s notes to the consolidated financial statements.
In May 2009, the FASB issued SFAS No. 165,Subsequent Events (“SFAS No. 165”). This Statement sets forth the period after the balance sheet date during which management evaluates events or transactions that may occur for potential recognition or disclosure in the financial statements. The Statement also describes the circumstances under which an entity recognizes events or transactions occurring after the balance sheet date in its financial statements and the disclosures that an entity makes about events or transactions that occur after the balance sheet date. This Statement is effective for financial statements issued for interim and annual periods ending after June 15, 2009. The implementation had no material impact on the Company’s consolidated financial statements. The standard requires disclosure in the Company’s notes to the consolidated financial statements. See Note 20 for required disclosures.
In April 2009, the FASB issued FASB Staff Position (“FSP”) Financial Accounting Standard (“FAS”) No. 107-1 and Accounting Principles Board (“APB”) Opinion No. 28-1Interim Disclosures about Fair Value of Financial Instruments (“FSP FAS No. 107-1 and APB No. 28-1”). FSP FAS No. 107-1 and APB No. 28-1 require fair value disclosures in both interim and annual financial statements in order to provide more timely information about the effects of current market conditions on financial instruments. FSP FAS No. 107-1 and APB No. 28-1 are effective for interim and annual periods ending after June 15, 2009. The Company adopted these standards on April 1, 2009. The implementation had no impact on the Company’s consolidated financial
7
Alpha Natural Resources, Inc. and Subsidiaries
Notes to Consolidated Financial Statements—(Continued)
(Unaudited, dollars in thousands)
statements. The standards require additional disclosure in the Company’s notes to the consolidated financial statements. See Note 17 for the required disclosures.
In December 2008, the FASB issued FSP No. 132(R)-1Employers’ Disclosures about Postretirement Benefit Plan Assets (“FSP FAS No. 132(R)-1”). This FSP amends SFAS No. 132 (revised 2003),Employers’ Disclosures about Pension and Other Postretirement Benefits, to provide guidance on an employer’s disclosures about plan assets of a defined benefit pension or other postretirement plan. The additional disclosure requirements under this FSP include expanded disclosures about an entity’s investment policies and strategies, the categories of plan assets, and concentrations of credit risk and fair value measurements of plan assets. FSP No. FAS 132(R)-1 will be effective for fiscal years ending after December 15, 2009. The implementation of this standard will have no impact on the amounts recorded in the Company’s consolidated financial statements. The Company will include the additional disclosures in the notes to the Company’s consolidated financial statements for the year ending December 31, 2009.
In June 2008, the FASB issued FSP Emerging Issues Task Force 03-6-1,Determining Whether Instruments Granted in Share-Based Payment Transactions Are Participating Securities (“FSP No. 03-6-1”). This FSP provides that unvested share-based payment awards that contain nonforfeitable rights to dividends or dividend equivalents, whether paid or unpaid, are participating securities and shall be included in the computation of both basic and diluted earnings per share. FSP No. 03-6-1 is effective for fiscal years beginning after December 15, 2008 and interim periods within those years. All prior year EPS data presented is required to be adjusted retrospectively. The Company adopted FSP No. 03-6-1 on January 1, 2009 and the implementation of this standard did not have a material impact on the Company’s consolidated financial statements.
In March 2008, the FASB issued SFAS No. 161, “Disclosures about Derivative Instruments and Hedging Activities – an amendment of FASB Statement No. 133” (“SFAS No. 161”). This standard amends and expands the disclosure requirements of SFAS No. 133 and establishes, among other things, the disclosure requirements for derivative instruments and for hedging activities. SFAS No. 161 is effective for fiscal years beginning after November 15, 2008. The Company adopted the provisions of SFAS No. 161 on January 1, 2009. The implementation did not have an impact on the amounts recorded in the Company’s consolidated financial statements. The standard required additional disclosures in the notes to the Company’s consolidated financial statements. See Note 19 for SFAS No. 161 information and disclosures.
In December 2007, the FASB issued SFAS No. 160,Noncontrolling Interests in Consolidated Financial Statements (“SFAS No. 160”). This standard outlines the accounting and reporting for ownership interest in a subsidiary held by parties other than the parent. SFAS No. 160 is effective for fiscal years beginning after December 15, 2008. The Company adopted the provisions of SFAS No. 160 on January 1, 2009 and the implementation did not have an impact on its consolidated financial statements.
In December 2007, the FASB issued SFAS No. 141(R),Business Combinations (“SFAS No. 141(R)”). This standard establishes principles and requirements for how an acquirer recognizes and measures in its financial statements the identifiable assets acquired, the liabilities assumed, any non-controlling interest in the acquiree and the goodwill acquired. This statement also establishes disclosure requirements which will enable users to evaluate the nature and financial effects of the business combination. SFAS No. 141(R) is effective for acquisitions for which the acquisition date is on or after the beginning of the first annual reporting period beginning on or after December 15, 2008. SFAS No. 141(R) changes the accounting after the acquisition date for reductions in valuation allowances established in purchase price allocation related to an acquired entity’s deferred assets; including those relating to acquisitions prior to the adoption of SFAS No. 141(R). Effective from the date of adoption of SFAS No. 141(R), the effects of reductions in valuation allowances established in purchase accounting that are outside of the measurement period are reported as adjustments to income tax expense. The Company adopted the provisions of SFAS No. 141(R) on January 1, 2009. The implementation did not have an impact on the Company’s consolidated financial statements.
In September 2006, the FASB issued SFAS No. 157,Fair Value Measurements (“SFAS No. 157”). This standard defines fair value, establishes a framework for measuring fair value in generally accepted accounting principles and expands disclosures about fair value measurements. SFAS No. 157 clarifies how to measure fair value as required or permitted under other accounting pronouncements but does not require any new fair value measurements. SFAS No. 157 was originally effective for financial statements issued for fiscal years beginning after November 15, 2007, and interim periods within those fiscal years. On February 12, 2008, the FASB issued FSP No. 157-2,Effective Date of FASB Statement No. 157 (“FSP No. 157-2”). FSP No. 157-2 was effective upon issuance and delayed the effective date of SFAS No. 157 for nonfinancial assets and nonfinancial liabilities, except for items that are recognized or disclosed at fair value in the financial statements on a recurring basis or at least once a year, to fiscal years beginning after November 15, 2008. The Company adopted the provisions of SFAS No. 157 on January 1, 2008 and the Company had no required fair value measurements for non-financial assets and liabilities in the second quarter of 2009 and no required additional disclosures upon adoption.
SFAS No. 157 establishes a fair value hierarchy that prioritizes the inputs to valuation techniques used to measure fair value. Inputs are either observable or unobservable and refer broadly to the assumptions that are used in pricing assets or liabilities.
8
Alpha Natural Resources, Inc. and Subsidiaries
Notes to Consolidated Financial Statements—(Continued)
(Unaudited, dollars in thousands)
Observable inputs are reflective of market data and unobservable inputs reflect the entity’s own assumptions about pricing assets or liabilities. As defined below, the fair value hierarchy gives the highest priority to unadjusted quoted prices in active markets for identical assets or liabilities (Level 1) and the lowest priority to unobservable inputs (Level 3). The three levels of the fair value hierarchy under SFAS No. 157 are further described as follows:
| | |
Level 1 | | Unadjusted quoted prices in active markets that are accessible at the measurement date for identical, unrestricted assets or liabilities; |
| |
Level 2 | | Quoted prices for identical or similar assets or liabilities in markets that are not active, or inputs that are observable, either directly or indirectly, for substantially the full term of the asset or liability, or by market-corroborated inputs; |
| |
Level 3 | | Unobservable inputs for the assets or liabilities in which the fair value measurement is supported by little or no market activity but reflects the best information available to the reporting entity and may include the entity’s own data. |
These levels are not necessarily an indication of the risk or liquidity associated with the financial assets or liabilities disclosed.
The following table sets forth the Company’s financial assets and liabilities measured at fair value by level within the fair value hierarchy at June 30, 2009. As required by SFAS No. 157, assets and liabilities are classified in their entirety based on the lowest level of input that is significant to the fair value measurement.
| | | | | | | |
| | | Level 1 | | Level 2 | | Level 3 |
Derivative instruments | | — | | $ | 11,969 | | — |
The Company’s derivative instruments are reported at fair value, which are derived using valuation models commonly used for derivatives. Where possible, the Company verifies the values produced by such models to market prices. Valuation models require a variety of inputs, including contractual terms, market fixed prices, inputs from forward price yield curves, notional quantities, measures of volatility and correlations of such inputs. The inputs in such valuation models do not involve significant management judgment. Fair value measurement of such instruments is typically classified within Level 2 of the fair value hierarchy.
In October 2008, the FASB issued FSP FAS No. 157-3, Determining the Fair Value of a Financial Asset When the Market for That Asset Is Not Active(“FSP No. 157-3”). FSP No. 157-3 clarifies the application of SFAS No. 157 in determining the fair value of a financial asset when the market for that financial asset is not active. FSP No. 157-3 became effective upon issuance, including interim periods for which financial statements have not been issued. The Company adopted FSP No. 157-3 upon issuance.
In April 2009, the FASB issued FSP FAS No. 157-4, “Determining Fair Value When the Volume and Level of Activity for the Asset or Liability Have Significantly Decreased and Identifying Transactions That Are Not Orderly” (“FSP No. 157-4”). FSP No. 157-4 provides additional guidance on factors to consider in estimating fair value when there has been a significant decrease in market activity for a financial asset. FSP No. 157-4 is effective for interim and annual periods ending after June 15, 2009. The Company adopted FSP No. 157-4 on April 1, 2009 and the implementation of this standard did not have an impact on the Company’s consolidated financial statements.
Inventories consisted of the following:
| | | | | | |
| | | June 30,
2009 | | December 31,
2008 |
Saleable coal | | $ | 56,053 | | $ | 21,013 |
Raw coal | | | 6,947 | | | 4,839 |
Materials and supplies | | | 38,956 | | | 38,764 |
| | | | | | |
| | | 101,956 | | | 64,616 |
Less materials and supplies reserve for obsolescence | | | (8,361) | | | (8,108) |
| | | | | | |
| | $ | 93,595 | | $ | 56,508 |
| | | | | | |
Saleable coal represents coal stockpiles ready for shipment to a customer. Raw coal represents coal that requires further processing prior to shipment.
9
Alpha Natural Resources, Inc. and Subsidiaries
Notes to Consolidated Financial Statements—(Continued)
(Unaudited, dollars in thousands)
Prepaid expenses consisted of the following:
| | | | | | |
| | | June 30,
2009 | | December 31,
2008 |
Prepaid royalties | | $ | 1,315 | | $ | 1,551 |
Prepaid longwall move expenses | | | 9,924 | | | 6,487 |
Prepaid SO2 emission allowances | | | - | | | 544 |
Prepaid taxes | | | 9,204 | | | 9,071 |
Prepaid insurance | | | 2,724 | | | 9,291 |
Other | | | 2,776 | | | 1,573 |
| | | | | | |
| | $ | 25,943 | | $ | 28,517 |
| | | | | | |
| (5) | Plant, Equipment, Mine Development Costs and Owned and Leased Mineral Rights |
Plant, equipment, mine development costs and owned and leased mineral rights consisted of the following:
| | | | | | |
| | | June 30,
2009 | | December 31,
2008 |
Owned and leased mineral rights | | | | | | |
Owned and leased mineral rights | | $ | 1,327,434 | | $ | 1,291,326 |
Less accumulated depletion | | | (435,427) | | | (402,812) |
| | | | | | |
| | $ | 892,007 | | $ | 888,514 |
| | | | | | |
Plant, equipment and mine development costs | | | | | | |
Plant, equipment and asset retirement costs | | $ | 1,082,780 | | $ | 1,030,016 |
Mine development costs | | | 89,291 | | | 70,922 |
Internal use software | | | 38,358 | | | 38,082 |
Coalbed methane equipment and development costs | | | 31,926 | | | 23,520 |
| | | | | | |
| | | 1,242,355 | | | 1,162,540 |
| | | | | | |
Less accumulated depreciation and amortization: | | | | | | |
Plant, equipment and asset retirement costs | | | (506,804) | | | (448,819) |
Mine development costs | | | (11,291) | | | (8,179) |
Internal use software | | | (16,783) | | | (14,164) |
Coalbed methane equipment and development costs | | | (8,761) | | | (5,769) |
| | | | | | |
| | | (543,639) | | | (476,931) |
| | | | | | |
| | $ | 698,716 | | $ | 685,609 |
| | | | | | |
In the first quarter of 2008 an indirect wholly owned subsidiary of the Company, was the successful bidder on a new federal coal lease adjacent to the western boundary of the Eagle Butte mine located north of Gillette, Wyoming. The Company’s lease bonus bid was $180,540, payable in five equal annual installments of $36,108. The Company made the first two payments of $36,108 during the first quarter of 2008 and the second quarter of 2009. These payments were both capitalized as a component ofOwned and leased mineral rights, netin the Consolidated Balance Sheets. Subsequent payments will be capitalized when paid. The lease became effective on May 1, 2008, and the three remaining annual installments will be paid on the anniversary dates of the lease. This federal coal lease contains an estimated 224.0 million tons of proven and probable coal reserves.
10
Alpha Natural Resources, Inc. and Subsidiaries
Notes to Consolidated Financial Statements—(Continued)
(Unaudited, dollars in thousands)
| (6) | Other Noncurrent Assets |
Other noncurrent assets consisted of the following:
| | | | | | |
| | | June 30,
2009 | | December 31,
2008 |
Unamortized deferred financing costs | | $ | 7,251 | | $ | 8,188 |
Advance mining royalties | | | 1,927 | | | 1,848 |
Equity-method investments | | | 8,775 | | | 9,232 |
Deferred income taxes, net | | | 16,325 | | | 16,307 |
Derivative swap agreements(1) | | | 1,359 | | | - |
Other | | | 1,874 | | | 2,015 |
| | | | | | |
| | $ | 37,511 | | $ | 37,590 |
| | | | | | |
During the three months ended March 31, 2008, the Company acquired a 49% interest in the common stock of Target Drilling Inc. (“Target”), a privately-held contract drilling company, for $9,246. The Company has the ability to exercise significant influence over, but not control the operating activities of Target, and accordingly uses the equity method of accounting in accordance with APB Opinion No. 18,The Equity Method of Accounting for Investments in Common Stock. The Company records its proportionate share of earnings or losses of Target in its Consolidated Statements of Operations and Comprehensive (Loss) Income under the captionEquity in losses of affiliates. The Company adjusts the carrying amount of its investment in Target for its share of earnings or losses of Target accordingly.
The Company performed a fair value analysis of the net tangible and intangible assets of Target in order to account for the difference in the cost of its investment and its underlying equity in the net assets that were reflected on the books of Target on the date of acquisition. The Company assigned its proportionate share of the difference between the historical cost of the identifiable tangible and intangible assets recorded on the books of Target and their respective fair values based on the fair value analysis. The differences assigned to the identifiable tangible and intangible assets, other than equity-method goodwill, are being amortized over their respective useful lives as a component ofEquity in losses of affiliates. The differences assigned consisted of tangible assets of $2,315, intangible assets of $1,955 (excluding equity-method goodwill), equity-method goodwill of $3,826 and a deferred tax liability of $1,779.
| (7) | Accrued Expenses and Other Current Liabilities |
Accrued expenses and other current liabilities consisted of the following:
| | | | | | |
| | | June 30,
2009 | | December 31,
2008 |
Wages and employee benefits | | $ | 33,235 | | $ | 40,850 |
Postretirement benefits other than pension | | | 24,440 | | | 24,429 |
Interest | | | 9,011 | | | 9,011 |
Royalties | | | 7,265 | | | 7,635 |
Taxes, other than income taxes | | | 41,605 | | | 39,256 |
Asset retirement obligations(1) | | | 4,126 | | | 5,595 |
Workers’ compensation | | | 9,040 | | | 8,930 |
Accrued capital expenditures | | | 9,354 | | | 18,893 |
Accrued derivatives(2) | | | 14,020 | | | 28,877 |
Other | | | 18,780 | | | 19,276 |
| | | | | | |
| | $ | 170,876 | | $ | 202,752 |
| | | | | | |
11
Alpha Natural Resources, Inc. and Subsidiaries
Notes to Consolidated Financial Statements—(Continued)
(Unaudited, dollars in thousands)
| (8) | Other Noncurrent Liabilities |
Other noncurrent liabilities consisted of the following:
| | | | | | |
| | | June 30,
2009 | | December 31,
2008 |
Postemployment benefits | | $ | 4,869 | | $ | 4,931 |
Pension benefits | | | 120,498 | | | 115,990 |
Workers’ compensation | | | 24,294 | | | 23,396 |
Black lung reserves | | | 22,101 | | | 20,806 |
Contract settlement accrual | | | 2,441 | | | 4,555 |
Asset retirement obligations(1) | | | 172,899 | | | 165,779 |
Deferred production tax | | | 12,220 | | | 11,393 |
Deferred credits and other | | | 4,427 | | | 4,331 |
| | | | | | |
| | $ | 363,749 | | $ | 351,181 |
| | | | | | |
| (9) | Accumulated Other Comprehensive Loss |
Components of accumulated other comprehensive loss, net of tax, consisted of the following:
| | | | | | |
| | | June 30,
2009 | | December 31,
2008 |
Defined benefit pension, postretirement and other Company sponsored plans | | $ | (75,196) | | $ | (78,097) |
Unrealized losses on cash flow hedges | | | (6,588) | | | (15,281) |
| | | | | | |
Total | | $ | (81,784) | | $ | (93,378) |
| | | | | | |
| (10) | Pension, Other Postretirement Benefit Plans and Pneumoconiosis |
Components of Net Periodic Pension Costs
The components of net periodic benefit costs are as follows:
| | | | | | | | | | | | |
| | | Three Months Ended
June 30, | | Six Months Ended
June 30, |
| | | 2009 | | 2008 | | 2009 | | 2008 |
Service cost | | $ | 1,908 | | $ | 1,822 | | $ | 3,858 | | $ | 3,397 |
Interest cost | | | 3,623 | | | 3,611 | | | 7,228 | | | 6,729 |
Expected return on plan assets | | | (2,428) | | | (3,298) | | | (4,878) | | | (6,631) |
Amortization of: | | | | | | | | | | | | |
Prior service cost | | | 43 | | | (2) | | | 86 | | | (5) |
Actuarial losses | | | 1,712 | | | 194 | | | 3,414 | | | 232 |
| | | | | | | | | | | | |
Net expense | | $ | 4,858 | | $ | 2,327 | | $ | 9,708 | | $ | 3,722 |
| | | | | | | | | | | | |
12
Alpha Natural Resources, Inc. and Subsidiaries
Notes to Consolidated Financial Statements—(Continued)
(Unaudited, dollars in thousands)
Components of Net Periodic Other Postretirement Benefit Plans Costs
The components of net periodic benefit costs are as follows:
| | | | | | | | | | | | |
| | | Three Months Ended
June 30, | | Six Months Ended
June 30, |
| | | 2009 | | 2008 | | 2009 | | 2008 |
Service cost | | $ | 1,576 | | $ | 2,018 | | $ | 3,831 | | $ | 3,943 |
Interest cost | | | 7,566 | | | 7,407 | | | 16,024 | | | 15,932 |
| | | | | | | | | | | | |
Net expense | | $ | 9,142 | | $ | 9,425 | | $ | 19,855 | | $ | 19,875 |
| | | | | | | | | | | | |
|
The Company’s postretirement medical and life insurance plans are unfunded. |
|
| Components of Pneumoconiosis Costs |
|
The components of net periodic benefit costs are as follows: |
| | |
| | | Three Months Ended
June 30, | | Six Months Ended
June 30, |
| | | 2009 | | 2008 | | 2009 | | 2008 |
Service cost | | $ | 281 | | $ | 249 | | $ | 561 | | $ | 542 |
Interest cost | | | 421 | | | 519 | | | 843 | | | 872 |
Expected return on plan assets | | | (55) | | | (108) | | | (109) | | | (215) |
Amortization of actuarial losses | | | 158 | | | 301 | | | 315 | | | 315 |
| | | | | | | | | | | | |
Net expense | | $ | 805 | | $ | 961 | | $ | 1,610 | | $ | 1,514 |
| | | | | | | | | | | | |
| (11) | Stock-Based Compensation |
On July 30, 2004, the Company’s Board of Directors adopted the Foundation Coal Holdings, Inc. 2004 Stock Incentive Plan (the “Plan”), which is designed to assist the Company in recruiting and retaining key employees, directors and consultants. The Plan, which was amended and restated effective on May 22, 2009 upon shareholder approval, permits the Company to grant its key employees, directors and consultants nonqualified stock options (“options”), stock appreciation rights, restricted stock or other stock-based awards. The awards under the Plan may be granted at a fair value or exercise price of no less than 100% of the fair market value of the Company’s common stock on the date of grant. The Plan is currently authorized for the issuance of awards for up to 5,978,483 shares of common stock. On July 31, 2009, the Company’s Board of Directors adopted the Alpha Natural Resources, Inc. (formerly Foundation Coal Holdings, Inc.) amended and restated 2004 Stock Incentive Plan.
At June 30, 2009, the Company had three types of stock-based awards outstanding: restricted stock units, restricted stock and options. Total compensation expense related to stock-based awards recognized inSelling, general and administrative expenses for the three months ended June 30, 2009 was $936, consisting of $726, $202 and $8 for restricted stock units, restricted stock and options, respectively. Total compensation expense related to stock-based awards recognized inCost of coal sales for the three months ended June 30, 2009 was $377 for restricted stock units. Compensation expense related to stock-based awards recognized inSelling, general and administrative expenses for the three months ended June 30, 2008 was $1,479, consisting of $1,270, $143 and $66 for restricted stock units, restricted stock and options, respectively. Compensation expense related to stock-based awards recognized inCost of coal sales for the three months ended June 30, 2008 was $449 for restricted stock units. Total compensation expense related to stock-based awards recognized inSelling, general and administrative expenses for the six months ended June 30, 2009 was $3,131, consisting of $2,383, $731 and $17 for restricted stock units, restricted stock and options, respectively. Total compensation expense related to stock-based awards recognized inCost of coal sales for the six months ended June 30, 2009 was $931 for restricted stock units. Compensation expense related to stock-based awards recognized inSelling, general and administrative expenses for the six months ended June 30, 2008 was $6,370, consisting of $3,402, $287 and $2,681 for restricted stock units, restricted stock and options, respectively. Compensation expense related to stock-based awards recognized inCost of coal sales for the six months ended June 30, 2008 was $1,692 for restricted stock units.
13
Alpha Natural Resources, Inc. and Subsidiaries
Notes to Consolidated Financial Statements—(Continued)
(Unaudited, dollars in thousands)
During the first quarter of 2008, the Company modified the vesting conditions for certain of its outstanding stock-based awards. As a result, the Company remeasured the affected stock-based awards in accordance with SFAS No. 123 (revised 2004),Share-Based Payment, and recognized additional compensation expense of approximately $2,372 and $172 inSelling, general and administrative expensesand Cost of coal sales, respectively,during the six months ended June 30, 2008.
| (12) | Asset Retirement Obligations |
The Company’s mining activities are subject to various federal and state laws and regulations governing the protection of the environment. These laws and regulations are continually changing and are generally becoming more restrictive. The Company conducts its operations to protect the public health and environment and believes its operations are in material compliance with all applicable laws and regulations. The Company has made, and expects to make in the future, expenditures to comply with such laws and regulations, but cannot predict the exact amount of such future expenditures. Estimated future reclamation costs are based principally on estimated costs to achieve compliance with legal and regulatory requirements.
The following table describes all changes to the Company’s asset retirement obligation liability from December 31, 2008 through June 30, 2009:
| | | |
Asset retirement obligations, December 31, 2008 | | $ | 171,374 |
Accretion expense | | | 5,906 |
Revisions in estimated cash flows and liabilities incurred | | | 1,107 |
Liabilities settled | | | (1,362) |
| | | |
Asset retirement obligations, June 30, 2009 | | $ | 177,025 |
| | | |
The current portions of the asset retirement obligation liabilities of $4,126 and $5,595 at June 30, 2009 and December 31, 2008, respectively, are included inAccrued expenses and other current liabilities. See Note 7. The noncurrent portions of the Company’s asset retirement obligation liabilities of $172,899 and $165,779 at June 30, 2009 and December 31, 2008, respectively, are included inOther noncurrent liabilities. See Note 8. There were no assets that were legally restricted for purposes of settling asset retirement obligations at June 30, 2009 or December 31, 2008. At June 30, 2009, regulatory obligations, such as reclamation obligations, for asset retirements are secured by surety bonds in the amount of $289,181. These surety bonds are partially collateralized by letters of credit issued by the Company.
| (13) | Stockholders’ Equity, Earnings (Loss) Per Common Share and Common Share Repurchases |
Stockholders’ Equity
During the six months ended June 30, 2009, the Company declared and paid cash dividends of $4,467.
Earnings (Loss) Per Common Share
The following table provides a reconciliation of weighted-average shares outstanding used in the basic and diluted earnings (loss) per common share computations for the periods presented:
| | | | | | | | |
| | | Three Months Ended
June 30, | | Six Months Ended
June 30, |
| | | 2009 | | 2008 | | 2009 | | 2008 |
Weighted average common shares outstanding-basic | | 44,675,617 | | 45,397,449 | | 44,629,105 | | 45,195,592 |
Dilutive impact of stock options | | 553,564 | | - | | 503,106 | | 921,575 |
Dilutive impact of restricted stock plans | | 251,733 | | - | | 257,341 | | 220,643 |
| | | | | | | | |
Weighted average common shares outstanding-diluted | | 45,480,914 | | 45,397,449 | | 45,389,552 | | 46,337,810 |
| | | | | | | | |
In the six months ended June 30, 2009, 11,495 restricted stock units that could have potentially diluted basic earnings per common share were not included in the computation of diluted earnings per common share because to do so would have been anti-dilutive.
14
Alpha Natural Resources, Inc. and Subsidiaries
Notes to Consolidated Financial Statements—(Continued)
(Unaudited, dollars in thousands)
Common Share Repurchases
In July 2006, the Board of Directors authorized a stock repurchase program (the “Repurchase Program”), authorizing the Company to repurchase shares of its common stock. The Company may repurchase its common stock from time to time, as determined by authorized officers of the Company. In September 2008, the Board of Directors authorized a $100,000 increase to the Repurchase Program, up to an aggregate amount of $200,000. Repurchases of common shares in a cumulative amount over $100,000 are subject to a maximum leverage ratio test of pro-forma net debt to adjusted EBITDA of less than 2.25 to 1.00 under the Senior Secured Credit Facility. During the six months ended June 30, 2009, the Company did not purchase any shares under the Repurchase Program. At June 30, 2009, $113,587 of funds remained under the Repurchase Program. During the six months ended June 30, 2009, the Company issued 227,450 shares of common stock to employees upon vesting of restricted stock units. The Company repurchased 85,480 common shares withheld from employees to satisfy the employees’ minimum statutory tax withholdings upon vesting.
The Company produces primarily steam coal from surface and deep mines for sale to utility and industrial customers, which is distributed by rail, barge and/or truck. The Company operates only in the United States with mines in three of the major coal basins. The Company has four reportable business segments: Northern Appalachia, consisting of two underground mines in southwestern Pennsylvania; Central Appalachia, consisting of six underground mines and two surface mines in southern West Virginia; the Powder River Basin, consisting of two surface mines in Wyoming; and the Company’s Other segment. On January 30, 2009, three of the six underground mines and an associated preparation plant in Central Appalachia were idled. Other includes an idled underground mine in Illinois; expenses associated with closed mines; Dry Systems Technologies; revenues from royalties and sales of coalbed methane; coal trade activities; selling, general and administrative expenses not charged out to the Powder River Basin, Northern Appalachia or Central Appalachia mines and the elimination of intercompany transactions. The Company evaluates the performance of its segments based on income (loss) from operations.
Segment results for the three months ended June 30, 2009 are as follows:
| | | | | | | | | | | | | | | |
| | | Powder River
Basin | | Northern
Appalachia | | Central
Appalachia | | Other | | Consolidated |
Total revenues(1) | | $ | 129,630 | | $ | 179,682 | | $ | 83,333 | | $ | 12,015 | | $ | 404,660 |
Income (loss) from operations | | | 5,255 | | | 59,896 | | | 3,620 | | | (20,047) | | | 48,724 |
Equity in earnings (losses) of affiliates | | | 9 | | | (208) | | | - | | | - | | | (199) |
Depreciation, depletion and amortization | | | 11,565 | | | 26,245 | | | 12,778 | | | 1,526 | | | 52,114 |
Amortization of coal supply agreements | | | 405 | | | - | | | (280) | | | 47 | | | 172 |
Capital expenditures | | | 5,479 | | | 27,935 | | | 5,661 | | | 20 | | | 39,095 |
Acquisition of mineral rights under federal lease | | | 36,108 | | | - | | | - | | | - | | | 36,108 |
Equity-method investments at June 30, 2009 | | | 1,025 | | | 7,750 | | | | | | | | | 8,775 |
Total assets at June 30, 2009 | | $ | 528,651 | | $ | 941,241 | | $ | 383,088 | | $ | 134,861 | | $ | 1,987,841 |
| | (1) | For the three months ended June 30, 2009, total revenues included revenues related to coal shipped to customers outside of the U.S. of $14,800, $16,698 and $5,006 for the Northern Appalachia, Central Appalachia and Other segments, respectively. All contracts are denominated in U.S. dollars. |
15
Alpha Natural Resources, Inc. and Subsidiaries
Notes to Consolidated Financial Statements—(Continued)
(Unaudited, dollars in thousands)
Segment results for the three months ended June 30, 2008 are as follows:
| | | | | | | | | | | | | | | |
| | | Powder River
Basin | | Northern
Appalachia | | Central
Appalachia | | Other | | Consolidated |
Total revenues(1) | | $ | 117,184 | | $ | 157,571 | | $ | 125,420 | | $ | 11,762 | | $ | 411,937 |
Income (loss) from operations | | | 6,365 | | | 12,770 | | | 7,460 | | | (17,908) | | | 8,687 |
Equity in losses of affiliate | | | - | | | (881) | | | - | | | - | | | (881) |
Depreciation, depletion and amortization | | | 11,356 | | | 21,633 | | | 16,737 | | | 1,779 | | | 51,505 |
Amortization of coal supply agreements | | | 1,285 | | | (9) | | | (740) | | | 661 | | | 1,197 |
Capital expenditures | | | 3,541 | | | 19,629 | | | 7,810 | | | 429 | | | 31,409 |
Equity-method investments at December 31, 2008 | | | 1,021 | | | 8,211 | | | - | | | - | | | 9,232 |
Total assets at December 31, 2008 | | $ | 495,332 | | $ | 919,360 | | $ | 394,823 | | $ | 158,593 | | $ | 1,968,108 |
| | (1) | For the three months ended June 30, 2008, total revenues included revenues related to coal shipped to customers outside of the U.S. of $16,260, $16,003 and $5,004 for the Northern Appalachia, Central Appalachia and Other segments, respectively. All contracts are denominated in U.S. dollars. |
Segment results for the six months ended June 30, 2009 are as follows:
| | | | | | | | | | | | | | | |
| | | Powder River
Basin | | Northern
Appalachia | | Central
Appalachia | | Other | | Consolidated |
Total revenues(1) | | $ | 270,394 | | $ | 322,305 | | $ | 193,611 | | $ | 23,519 | | $ | 809,829 |
Income (loss) from operations | | | 17,000 | | | 66,077 | | | 7,677 | | | (39,334) | | | 51,420 |
Equity in earnings (losses) of affiliates | | | 13 | | | (461) | | | - | | | - | | | (448) |
Depreciation, depletion and amortization | | | 23,424 | | | 48,866 | | | 26,287 | | | 3,054 | | | 101,631 |
Amortization of coal supply agreements | | | 796 | | | - | | | (767) | | | 118 | | | 147 |
Capital expenditures | | | 17,005 | | | 63,714 | | | 12,930 | | | 304 | | | 93,953 |
Acquisition of mineral rights under federal lease | | | 36,108 | | | - | | | - | | | - | | | 36,108 |
Equity-method investments at June 30, 2009 | | | 1,025 | | | 7,750 | | | | | | | | | 8,775 |
Total assets at June 30, 2009 | | $ | 528,651 | | $ | 941,241 | | $ | 383,088 | | $ | 134,861 | | $ | 1,987,841 |
| | (1) | For the six months ended June 30, 2009, total revenues included revenues related to coal shipped to customers outside of the U.S. of $19,123, $22,358 and $5,006 for the Northern Appalachia, Central Appalachia and Other segments, respectively. All contracts are denominated in U.S. dollars. |
Segment results for the six months ended June 30, 2008 are as follows:
| | | | | | | | | | | | | | | |
| | | Powder River
Basin | | Northern
Appalachia | | Central
Appalachia | | Other | | Consolidated |
Total revenues(1) | | $ | 245,321 | | $ | 333,726 | | $ | 228,110 | | $ | 17,084 | | $ | 824,241 |
Income (loss) from operations | | | 19,120 | | | 46,910 | | | 4,759 | | | (41,009) | | | 29,780 |
Equity in losses of affiliate | | | - | | | (1,066) | | | - | | | - | | | (1,066) |
Depreciation, depletion and amortization | | | 23,112 | | | 43,765 | | | 33,868 | | | 4,025 | | | 104,770 |
Amortization of coal supply agreements | | | 2,424 | | | (85) | | | (1,807) | | | 790 | | | 1,322 |
Capital expenditures | | | 6,385 | | | 48,245 | | | 11,224 | | | 807 | | | 66,661 |
Acquisition of mineral rights under federal lease | | | 36,108 | | | - | | | - | | | - | | | 36,108 |
Equity-method investments at December 31, 2008 | | | 1,021 | | | 8,211 | | | - | | | - | | | 9,232 |
Total assets at December 31, 2008 | | $ | 495,332 | | $ | 919,360 | | $ | 394,823 | | $ | 158,593 | | $ | 1,968,108 |
| | (1) | For the six months ended June 30, 2008, total revenues included revenues related to coal shipped to customers outside of the U.S. of $31,995, $26,188 and $5,004 for the Northern Appalachia, Central Appalachia and Other segments, respectively. All contracts are denominated in U.S. dollars. |
16
Alpha Natural Resources, Inc. and Subsidiaries
Notes to Consolidated Financial Statements—(Continued)
(Unaudited, dollars in thousands)
Other revenue consisted of the following:
| | | | | | | | | | | | |
| | | Three Months Ended
June 30, | | Six Months Ended
June 30, |
| | | 2009 | | 2008 | | 2009 | | 2008 |
Royalty income | | $ | 2,045 | | $ | 2,167 | | $ | 4,910 | | $ | 3,492 |
Coalbed methane | | | 1,189 | | | 2,982 | | | 2,737 | | | 4,730 |
Dry Systems Technologies equipment and filter sales | | | 1,961 | | | 2,031 | | | 4,101 | | | 3,679 |
Other | | | 466 | | | (23) | | | 3,758 | | | 614 |
| | | | | | | | | | | | |
Total other revenue | | $ | 5,661 | | $ | 7,157 | | $ | 15,506 | | $ | 12,515 |
| | | | | | | | | | | | |
| (16) | Commitments and Contingencies |
General
The Company follows SFAS No. 5,Accounting for Contingencies, in determining its accruals and disclosures with respect to loss contingencies. Accordingly, estimated losses from loss contingencies and legal expenses associated with the contingency are accrued by a charge to income when information available indicates that it is probable that an asset has been impaired or a liability has been incurred and the amount of the loss can be reasonably estimated. If a loss contingency is not probable or reasonably estimable, disclosure of the loss contingency is made in the consolidated financial statements when it is at least reasonably possible that a loss will be incurred and the loss is material.
Commitments
On February 20, 2008, the Company was determined to be the successful bidder on a federal coal lease by the Bureau of Land Management, a unit of the United States Department of the Interior. The bid was accepted as submitted in the amount of $180,540 for an approximate 1,428 acre tract of federal land. The lease became effective on May 1, 2008. This lease is subject to the deferred bonus payment provisions of the Code of Federal Regulations and, as such, the Company remits the bonus payment in five equal installments, the first of which was submitted with the bid as a deposit on the lease in February 2008 and the second was submitted in May 2009. The remaining three annual installments of $36,108 each are due on the anniversary dates of the lease.
See Note 12 regarding our Asset Retirement Obligations.
Guarantees
Neweagle Industries, Inc., Neweagle Coal Sales Corp., Laurel Creek Co., Inc. and Rockspring Development, Inc. (collectively, “Sellers”) are indirect wholly owned subsidiaries of the Company. The Sellers sell coal to Birchwood Power Partners, L.P. (“Birchwood”) under a Coal Supply Agreement dated July 22, 1993 (“Birchwood Contract”). Laurel Creek Co., Inc. and Rockspring Development, Inc. were parties to the Birchwood Contract since its inception, at which time those entities were not affiliated with Neweagle Industries, Inc., Neweagle Coal Sales Corp. or the Company. Effective January 31, 1994, the Birchwood Contract was assigned to Neweagle Industries, Inc. and Neweagle Coal Sales Corp. by AgipCoal Holding USA, Inc. and AgipCoal Sales USA, Inc., which at the time were affiliates of Arch Coal, Inc. Despite this assignment, Arch Coal, Inc. (“Arch”) and its affiliates have separate contractual obligations to provide coal to Birchwood if Sellers fail to perform. Pursuant to an Agreement & Release dated September 30, 1997, the Company agreed to defend, indemnify and hold harmless Arch and its subsidiaries from and against any claims arising out of any failure of Sellers to perform under the Birchwood Contract. By acknowledgement dated February 16, 2005, the Company and Arch acknowledged the continuing validity and effect of said Agreement & Release.
In the normal course of business, the Company is a party to guarantees and financial instruments with off-balance sheet risk, such as bank letters of credit, performance or surety bonds and other guarantees and indemnities related to the obligations of affiliated entities, which are not reflected in the accompanying Consolidated Balance Sheets. Management does not expect any material losses to result from these guarantees and other off-balance sheet instruments.
17
Alpha Natural Resources, Inc. and Subsidiaries
Notes to Consolidated Financial Statements—(Continued)
(Unaudited, dollars in thousands)
Contingencies
Extensive regulation of the impacts of mining on the environment and of maintaining workplace safety, and related litigation, has had or may have a significant effect on the Company’s costs of production and results of operations. Further regulations, legislation or litigation in these areas may also cause the Company’s sales or profitability to decline by increasing costs or by hindering the Company’s ability to continue mining at existing operations or to permit new operations.
Legal Proceedings
The Company is involved in various claims and other legal actions arising in the ordinary course of business. In the opinion of management, the ultimate disposition of these matters will not have a material adverse effect on the Company’s consolidated financial position, consolidated results of operations or consolidated cash flows.
Letters of Credit
At June 30, 2009, the Company had $177,033 of letters of credit outstanding under its revolving credit facility. Of this amount, $118,563 is being used to partially collateralize the surety bonds securing the Company’s regulatory obligations for asset retirements. See Note 12.
| (17) | Fair Value of Financial Instruments |
The estimated fair values of financial instruments under SFAS No. 107,Disclosures About Fair Value of Financial Instruments,are determined based on relevant market information. These estimates involve uncertainty and cannot be determined with precision. The following methods and assumptions are used to estimate the fair value of each class of financial instrument.
Trade accounts receivable, trade accounts payable, accrued expenses and other current liabilities:The carrying amounts approximate fair value because of the short maturity of these instruments.
Long-term debt:The fair value of long-term debt is estimated based on a current market rate of interest offered to the Company for debt of similar maturities.
The estimated fair values of financial instruments are as follows at:
| | | | | | | | | | | | |
| | | June 30,
2009 | | December 31,
2008 |
| | | Carrying
Values | | Fair
Values | | Carrying
Values | | Fair
Values |
Long-term debt | | $ | 599,785 | | $ | 590,568 | | $ | 599,785 | | $ | 551,098 |
For the three months ended June 30, 2009, the income tax expense of $8,841 represents an effective rate of 22% on pre-tax income of $39,696, compared to an income tax expense of $1,115, or an effective rate of 46% on a pre-tax loss of $2,431 for the three months ended June 30, 2008. The effective rate for the three months ended June 30, 2009 is based on forecasted annual results for 2009.
For the six months ended June 30, 2009, the income tax expense of $6,738 represents an effective rate of 20% on pre-tax income of $33,389, compared to an income tax expense of $3,382, or an effective rate of 55% on pre-tax income of $6,191 for the six months ended June 30, 2008. The effective rate for the six months ended June 30, 2009 is comprised of two elements: (a) a $7,280 expense or 22% effective rate based on forecasted annual income results for 2009; offset by (b) a discrete tax benefit of $542 or 2% primarily related to state bonus depreciation estimates and adjustments related to prior year tax return amendments. Absent the discrete items, the forecasted annual effective rate of 22% for 2009 increased from the 2008 effective rate of 7% due primarily to the expected impact of permanent differences for the excess depletion deduction and a change in the estimated impact of valuation allowances required between years on AMT credits due to the forecasted earnings increase between 2008 and 2009. Changes to the effective rate during interim periods occur as the Company reconsiders its forecast of full-year pretax income based upon its most recent experience. These changes in estimates are reflected in the effective tax rate in the period in which the information becomes available to the Company.
18
Alpha Natural Resources, Inc. and Subsidiaries
Notes to Consolidated Financial Statements—(Continued)
(Unaudited, dollars in thousands)
Derivative instruments and hedging activities are accounted for in accordance with SFAS No. 133,Accounting for Derivative Instruments and Hedging Activity(“SFAS No. 133”) (as amended by SFAS No. 138,Accounting for Certain Derivative Instruments and Certain Hedging Activitiesand SFAS No. 161). SFAS No. 133 and SFAS No. 161 establish accounting and disclosure standards for derivative instruments and hedging activities and require that entities recognize all derivatives as either assets or liabilities in the statement of financial position and measure those instruments at fair value.
On the date a derivative instrument is entered into, the Company generally designates a qualifying derivative instrument as either a hedge of the fair value of a recognized asset or liability or of an unrecognized firm commitment (“fair value hedge”), or a hedge of the variability of cash flows to be received or paid related to a recognized asset or liability or forecasted transaction (cash flow hedge).
For derivative instruments that do not meet the qualifications to be designated as cash flow hedges, changes in fair value are recorded in current period earnings or losses. For derivative instruments that meet the qualifications and have been designated as cash flow hedges, the effective portion of the changes in fair value are recorded inAccumulated other comprehensive income (loss)and any portion that is ineffective is recorded in current period earnings or losses. Amounts recorded inAccumulated other comprehensive income (loss) are reclassified to earnings or losses in the period the underlying hedged transaction affects earnings or when the underlying hedged transaction is no longer probable of occurring. For derivative instruments that have been designated as fair value hedges, changes in the fair value of the derivative instrument and changes in the fair value of the related hedged asset or liability or unrecognized firm commitment are recorded in current period earnings or losses.
Forward Contracts
The Company manages price risk for coal sales through the use of long-term coal supply agreements. The Company evaluates each of its coal sales and coal purchase forward contracts under SFAS No. 133 to determine whether they meet the definition of a derivative and if so, whether they qualify for the normal purchase normal sale (“NPNS”) exception prescribed by SFAS No. 133. The majority of the Company’s forward contracts do qualify for the NPNS exception based on management’s intent and ability to physically deliver or take physical delivery of the coal. Contracts that qualify as derivatives and do not qualify for the NPNS exception are accounted for at fair value. Those contracts that qualify as derivatives have not been designated as cash flow hedges and accordingly, the Company includes the unrealized gains and losses in current period earnings or losses.
Swap Agreements
The Company uses diesel fuel and explosives in its production process and incurs significant expenses for the purchase of these commodities. Diesel fuel and explosive expenses represented approximately 8% of total cash costs for the six months ended June 30, 2009 and 2008. The Company is subject to the risk of price volatility for these commodities and as a part of its risk management strategy, the Company enters into swap agreements with financial institutions to mitigate the risk of price volatility for both diesel fuel and explosives. The terms of our swap agreements allows the Company to pay a fixed price and receive a floating price, which provides a fixed price per unit for the volume of purchases being hedged. As of June 30, 2009, the Company had swap agreements outstanding to hedge the variable cash flows related to 61%, 58% and 6% of anticipated diesel fuel usage for the remainder of 2009 and for calendar years 2010 and 2011, respectively. The average fixed price per swap for diesel fuel hedges is $3.08 per gallon, $1.88 per gallon and $1.97 per gallon for calendar years 2009, 2010 and 2011, respectively. As of June 30, 2009, the Company had swap agreements outstanding to hedge the variable cash flows related to approximately 72% and 45% of anticipated explosive usage for the remainder of 2009 and for calendar year 2010, respectively. All cash flows associated with derivative instruments are classified as operating cash flows in the Consolidated Statements of Cash Flows for the six months ended June 30, 2009 and 2008. The following table presents the fair values and location within the Consolidated Balance Sheets of the Company’s derivative instruments:
19
Alpha Natural Resources, Inc. and Subsidiaries
Notes to Consolidated Financial Statements—(Continued)
(Unaudited, dollars in thousands)
| | | | | | | | |
| | | Asset Derivatives (1) | | |
Derivatives not designated as cash flow hedging instruments: | | June 30,
2009 | | December 31,
2008 | |
| | | | | | | |
Commodity swaps | | $ | 2,295 | | $ | - | |
| | | Liability Derivatives (2) | |
Derivatives designated as cash flow hedging instruments: | | June 30,
2009 | | December 31,
2008 | |
| | | | | | | |
| | | | | | | |
Commodity swaps | | $ | 12,342 | | $ | 23,828 | |
| | | | | | | |
Derivatives not designated as cash flow hedging instruments: | | | | | | | |
| | | | | | | |
Commodity swaps | | $ | - | | $ | 1,150 | |
Forward contracts | | | 1,808 | | | 3,899 | |
Coal options | | | 114 | | | - | |
| | | | | | | |
Total | | $ | 1,922 | | $ | 5,049 | |
| | | | | | | |
Total liability derivatives | | $ | 14,264 | | $ | 28,877 | |
| | | | | | | |
Total derivatives | | $ | 11,969 | | $ | 28,877 | |
| | | | | | | |
| (1) | Amounts included in Other current assets and Other noncurrent assets. See Note 6. |
| (2) | Amounts included in Accrued expenses and other current liabilities, and Other noncurrent liabilities. See Note 7 and Note 8. |
20
Alpha Natural Resources, Inc. and Subsidiaries
Notes to Consolidated Financial Statements—(Continued)
(Unaudited, dollars in thousands)
The following table presents the gains and losses from derivative instruments for the six months ended June 30, 2009 and 2008 and their location within the Consolidated Financial Statements:
| | | | | | | | | | | | | | | | | | | | |
Derivatives designated as cash flow hedging instruments: | | Gain (loss)
reclassified from
Accumulated
other comprehensive
loss into Net income (1) | | Loss recorded in
Net income related
to derivative in
effectiveness(1) | | Gain (loss)
recorded in
Accumulated other
other comprehensive
income | | |
| | 2009 | | 2008 | | 2009 | | 2008 | | 2009 | | 2008 | |
| | | | | | | | | | | | | | | | | | | |
Commodity swaps | | $ | (9,179) | | $ | 264 | | $ | (38) | | $ | - | | $ | (486) | | $ | 1,070 | |
| | | | | | | | | | | | | | | | | | | |
| | | | | | | | | | | | | | | | | | | |
Total | | $ | (9,179) | | $ | 264 | | $ | (38) | | $ | - | | $ | (486) | | $ | 1,070 | |
| | | | | | | | | | | | | | | | | | | |
| | |
Derivatives not designated as cash flow hedging instruments: | | Gain recorded in
Net income for
derivatives not
designated
as cash flow hedging
instruments | | |
| | 2009 | | 2008 | |
| | | | | | | |
Commodity swaps(1) | | $ | 3,445 | | $ | 1,062 | |
Forward contracts(2) | | | 2,091 | | | - | |
Coal options(2) | | | 618 | | | - | |
| | | | | | | |
| | | | | | | |
| | $ | 6,154 | | $ | 1,062 | |
| | | | | | | |
| | (1) | Amounts included in Cost of coal sales. |
| | (2) | Amounts included in Other revenue. |
Unrealized losses recorded inAccumulated other comprehensive lossare reclassified to income or loss as the financial swaps settle and the Company purchases the underlying diesel fuel and explosives that are being hedged. During the next twelve months, the Company expects to reclassify approximately $5,375, net of tax, for diesel fuel hedges and approximately $1,394, net of tax, for explosive hedges. The following table summarizes the changes toAccumulated other comprehensive incomerelated to hedging activities during the six months ended June 30, 2009:
| | | | | | | | | | |
Balance
December 31,
2008 | | Net amounts
reclassified to
earnings | | Net change
associated with
current period
hedging
transactions | | Balance
June 30,
2009 |
| $ | (15,281) | | $ | 9,179 | | $ | (486) | | $ | (6,588) |
21
Alpha Natural Resources, Inc. and Subsidiaries
Notes to Consolidated Financial Statements—(Continued)
(Unaudited, dollars in thousands)
Merger with Alpha Natural Resources, Inc.
On July 31, 2009, Alpha Natural Resources, Inc. (“Old Alpha”) merged (the “Merger”) with and into Foundation Coal Holdings, Inc. (“Foundation”), with Foundation continuing as the surviving corporation under the name Alpha Natural Resources, Inc. We refer to the surviving corporation as “New Alpha.”
As of the effective time of the Merger (the “Effective Time”), each issued and outstanding share of common stock, par value $0.01, of Foundation, and other outstanding equity-based awards other than any shares owned by Old Alpha, were converted into the right to receive 1.0840 shares of common stock, par value $0.01, of New Alpha, and each issued and outstanding share of common stock, par value $0.01, of Old Alpha, other than any shares owned by Foundation, automatically became one share of common stock of New Alpha. Immediately after the Effective Time, Old Alpha’s stockholders owned approximately 59% of New Alpha common stock and Foundation’s stockholders owned approximately 41% of New Alpha common stock.
The Merger will be accounted for as a business combination under SFAS 141(R). For financial accounting purposes, the Merger is treated as a “reverse acquisition” and Old Alpha is treated as the accounting acquirer. Accordingly, Old Alpha’s financial statements will become the financial statements of New Alpha and New Alpha’s future periodic filings will reflect Old Alpha’s historical financial condition and results of operations shown for comparative purposes. For the three and six month periods ended June 30, 2009, Foundation incurred merger-related costs of approximately $4,800, which are included inSelling, general, and administrative expenses.
Also at the Effective Time, the Board of Directors of New Alpha was comprised of ten members, six of which were members of Old Alpha’s board and four were members of the Foundation board. The headquarters of New Alpha is in Abingdon, Virginia.
7.25% Senior Notes Due August 1, 2014
On July 30, 2004, Foundation’s subsidiary, Foundation PA Coal Company, LLC (“Foundation PA”), issued $300,000 aggregate principal amount of 7.25% Notes that mature on August 1, 2014 (the “2014 Notes”). As of June 30, 2009 $298,285 remained outstanding. The 2014 Notes were guaranteed on a senior unsecured basis by Foundation Coal Corporation (“FCC”), an indirect parent of Foundation PA, and certain of its subsidiaries. As a result of the Merger, Foundation PA and FCC became subsidiaries of New Alpha.
On August 1, 2009, in connection with the Merger, Foundation PA, New Alpha and certain of its subsidiaries (which were also former subsidiaries of Old Alpha) (the “New Subsidiaries”) executed a supplemental indenture (the “Third Supplemental Indenture”), which supplements the indenture dated as of July 30, 2004 as supplemented, governing the 2014 Notes.
Pursuant to the Third Supplemental Indenture, New Alpha assumed the obligations of FCC in respect of the 2014 Notes and, along with the New Subsidiaries, became obligated as guarantors on the indenture governing the 2014 Notes. On August 1, 2009, in connection with the Merger, FCC merged with and into New Alpha.
Credit Agreement
On July 31, 2009, following the Merger and upon satisfaction of the requisite conditions, an amendment dated as of May 22, 2009 (“Amendment No. 1”) to the Senior Secured Credit Facility (“Credit Agreement”), dated as of July 30, 2004, became effective. Under the Credit Agreement, Foundation had a $500,000 revolving credit line and a $335,000 term loan with $301,500 outstanding as of June 30, 2009. Repayment of outstanding indebtedness owed under the credit facility includes quarterly amortization of the term loan beginning in the third quarter of 2009 with both the term loan and revolving credit line maturing July 7, 2011. Pursuant to Amendment No. 1, New Alpha and certain of its subsidiaries became obligated as guarantors under the Credit Agreement. Amendment No. 1 also provides for an increase in the interest rate to 3.25 percentage points over the London interbank offered rate (“LIBOR”) from 1.25 percentage points over LIBOR, subject, in the case of revolving loans, to adjustment based on leverage ratios. Upon Amendment No. 1 becoming effective, limitations on annual capital expenditure amounts were eliminated and the amount of incremental credit facilities that may be incurred under the Credit Agreement were increased from $100,000 to $200,000 of which $150,000 was utilized to increase the revolving credit line to $650,000.
22
Alpha Natural Resources, Inc. and Subsidiaries
Notes to Consolidated Financial Statements—(Continued)
(Unaudited, dollars in thousands)
Asset Exchange
On July 16, 2009, the Company completed an asset exchange with various subsidiaries of Massey Energy Company. In the transaction which was designed to optimize the reserve bases of both companies, the Company created a contiguous reserve in the Harts Creek/Atenville area through the acquisition of approximately 19 million tons of coal, increasing the total coal reserve block to more than 120 million tons. In exchange, the Company conveyed to Massey approximately 23 million tons of coal reserves and the operating assets of the Laurel Creek Mining Complex in Central Appalachia, including a coal processing plant, a permitted impoundment, permitted surface reserves, three idled underground mines, and related mining equipment.
The Company has evaluated subsequent events through August 7, 2009, the date the financial statements were issued.
| (21) | Supplemental Guarantor and Non-Guarantor Financial Information |
On July 30, 2004, the Company’s indirect wholly owned subsidiary, Foundation PA Coal Company, LLC (the “Issuer” or “Non-Guarantor Subsidiary”), issued $300,000 aggregate principal amount of 7.25% Notes that mature on August 1, 2014. In accordance with the indenture governing the 2014 Notes, the Guarantor Subsidiaries are each of the direct and indirect wholly owned subsidiaries of FCC, other than the Issuer. The Guarantor Subsidiaries have fully and unconditionally guaranteed the 2014 Notes, jointly and severally, on a senior unsecured basis. See Note 20 for developments relating to the Merger.
Presented below are condensed consolidating financial statements as of June 30, 2009 and for the three and six month periods then ended based on the guarantor structure that was in place at that time. Separate consolidated financial statements and other disclosures concerning the Guarantor Subsidiaries are not presented because management believes that such information is not material to holders of the Notes.
23
Alpha Natural Resources, Inc. and Subsidiaries
Notes to Consolidated Financial Statements—(Continued)
(Unaudited, dollars in thousands)
Supplemental Condensed Consolidating Balance Sheet
June 30, 2009
| | | | | | | | | | | | | | | | | | | | | |
| | | Guarantor
FCC | | Issuer
Subsidiary | | Guarantor
Subsidiaries | | Eliminations | | FCC
Consolidated | | Other Non-
Guarantor
Entities | | Total
Consolidated |
| Assets | | | | | | | | | | | | | | | | | | | | | |
Current assets: | | | | | | | | | | | | | | | | | | | | | |
Cash | | $ | 30,822 | | $ | - | | $ | 74 | | $ | - | | $ | 30,896 | | $ | - | | $ | 30,896 |
Trade accounts receivable | | | - | | | - | | | 114,073 | | | - | | | 114,073 | | | - | | | 114,073 |
Inventories, net | | | - | | | - | | | 93,595 | | | - | | | 93,595 | | | - | | | 93,595 |
Deferred income taxes | | | 13,280 | | | 898 | | | 15,077 | | | - | | | 29,255 | | | - | | | 29,255 |
Prepaid expenses | | | 7,442 | | | 883 | | | 17,229 | | | - | | | 25,554 | | | 389 | | | 25,943 |
Other current assets | | | 762 | | | 905 | | | 3,953 | | | - | | | 5,620 | | | - | | | 5,620 |
| | | | | | | | | | | | | | | | | | | | | |
Total current assets | | | 52,306 | | | 2,686 | | | 244,001 | | | - | | | 298,993 | | | 389 | | | 299,382 |
Owned surface lands | | | - | | | - | | | 55,103 | | | - | | | 55,103 | | | - | | | 55,103 |
Plant, equipment and mine development costs, net | | | 21,557 | | | - | | | 677,159 | | | - | | | 698,716 | | | - | | | 698,716 |
Owned and leased mineral rights, net | | | - | | | - | | | 892,007 | | | - | | | 892,007 | | | - | | | 892,007 |
Coal supply agreements, net | | | (367) | | | - | | | 5,489 | | | - | | | 5,122 | | | - | | | 5,122 |
Other noncurrent assets | | | 710,273 | | | 1,159,461 | | | 956,872 | | | (2,789,095) | | | 37,511 | | | - | | | 37,511 |
| | | | | | | | | | | | | | | | | | | | | |
Total assets | | $ | 783,769 | | $ | 1,162,147 | | $ | 2,830,631 | | $ | (2,789,095) | | $ | 1,987,452 | | $ | 389 | | $ | 1,987,841 |
| | | | | | | | | | | | | | | | | | | | | |
| Liabilities | | | | | | | | | | | | | | | | | | | | | |
Current liabilities: | | | | | | | | | | | | | | | | | | | | | |
Current portion of long-term debt | | $ | - | | $ | 33,500 | | $ | - | | $ | - | | $ | 33,500 | | $ | - | | $ | 33,500 |
Trade accounts payable | | | 1,505 | | | - | | | 41,735 | | | - | | | 43,240 | | | 32 | | | 43,272 |
Accrued expenses and other current liabilities | | | 4,062 | | | 9,216 | | | 155,966 | | | - | | | 169,244 | | | 1,632 | | | 170,876 |
| | | | | | | | | | | | | | | | | | | | | |
Total current liabilities | | | 5,567 | | | 42,716 | | | 197,701 | | | - | | | 245,984 | | | 1,664 | | | 247,648 |
Long-term debt | | | - | | | 566,285 | | | - | | | - | | | 566,285 | | | - | | | 566,285 |
Deferred income taxes | | | (155,584) | | | 687 | | | 160,590 | | | - | | | 5,693 | | | (637) | | | 5,056 |
Coal supply agreements, net | | | - | | | - | | | 2,627 | | | - | | | 2,627 | | | - | | | 2,627 |
Postretirement benefits | | | 28,971 | | | - | | | 514,582 | | | - | | | 543,553 | | | - | | | 543,553 |
Other noncurrent liabilities | | | 645,254 | | | 287,978 | | | 727,630 | | | (1,297,113) | | | 363,749 | | | - | | | 363,749 |
| | | | | | | | | | | | | | | | | | | | | |
Total liabilities | | | 524,208 | | | 897,666 | | | 1,603,130 | | | (1,297,113) | | | 1,727,891 | | | 1,027 | | | 1,728,918 |
| Stockholder Equity | | | | | | | | | | | | | | | | | | | | | |
Stockholder equity | | | 259,561 | | | 264,481 | | | 1,227,501 | | | (1,491,982) | | | 259,561 | | | (638) | | | 258,923 |
| | | | | | | | | | | | | | | | | | | | | |
Total liabilities and stockholder equity | | $ | 783,769 | | $ | 1,162,147 | | $ | 2,830,631 | | $ | (2,789,095) | | $ | 1,987,452 | | $ | 389 | | $ | 1,987,841 |
| | | | | | | | | | | | | | | | | | | | | |
24
Alpha Natural Resources, Inc. and Subsidiaries
Notes to Consolidated Financial Statements—(Continued)
(Unaudited, dollars in thousands)
Supplemental Condensed Consolidating Balance Sheet
December 31, 2008
| | | | | | | | | | | | | | | | | | | | | |
| | | Guarantor
FCC | | Issuer
Subsidiary | | Guarantor
Subsidiaries | | Eliminations | | FCC
Consolidated | | Other Non-
Guarantor
Entities | | Total
Consolidated |
| Assets | | | | | | | | | | | | | | | | | | | | | |
Current assets: | | | | | | | | | | | | | | | | | | | | | |
Cash | | $ | 42,254 | | $ | - | | $ | 72 | | $ | - | | $ | 42,326 | | $ | - | | $ | 42,326 |
Trade accounts receivable | | | - | | | - | | | 135,354 | | | - | | | 135,354 | | | - | | | 135,354 |
Inventories, net | | | - | | | - | | | 56,508 | | | - | | | 56,508 | | | - | | | 56,508 |
Deferred income taxes | | | 13,280 | | | 946 | | | 15,076 | | | - | | | 29,302 | | | - | | | 29,302 |
Prepaid expenses | | | 6,729 | | | 735 | | | 20,676 | | | - | | | 28,140 | | | 377 | | | 28,517 |
Other current assets | | | 804 | | | 905 | | | 3,967 | | | - | | | 5,676 | | | - | | | 5,676 |
| | | | | | | | | | | | | | | | | | | | | |
Total current assets | | | 63,067 | | | 2,586 | | | 231,653 | | | - | | | 297,306 | | | 377 | | | 297,683 |
Owned surface lands | | | - | | | - | | | 51,802 | | | - | | | 51,802 | | | - | | | 51,802 |
Plant, equipment and mine development costs, net | | | 23,994 | | | - | | | 661,615 | | | - | | | 685,609 | | | - | | | 685,609 |
Owned and leased mineral rights, net | | | - | | | - | | | 888,514 | | | - | | | 888,514 | | | - | | | 888,514 |
Coal supply agreements, net | | | (505) | | | - | | | 7,415 | | | - | | | 6,910 | | | - | | | 6,910 |
Other noncurrent assets | | | 617,513 | | | 1,088,469 | | | 909,841 | | | (2,578,233) | | | 37,590 | | | - | | | 37,590 |
| | | | | | | | | | | | | | | | | | | | | |
Total assets | | $ | 704,069 | | $ | 1,091,055 | | $ | 2,750,840 | | $ | (2,578,233) | | $ | 1,967,731 | | $ | 377 | | $ | 1,968,108 |
| | | | | | | | | | | | | | | | | | | | | |
| Liabilities | | | | | | | | | | | | | | | | | | | | | |
Current liabilities: | | | | | | | | | | | | | | | | | | | | | |
Current portion of long-term debt | | $ | - | | $ | 16,750 | | $ | - | | $ | - | | $ | 16,750 | | $ | - | | $ | 16,750 |
Trade accounts payable | | | 2,545 | | | - | | | 50,041 | | | - | | | 52,586 | | | 9 | | | 52,595 |
Accrued expenses and other current liabilities | | | 6,863 | | | 9,221 | | | 187,221 | | | - | | | 203,305 | | | (553) | | | 202,752 |
| | | | | | | | | | | | | | | | | | | | | |
Total current liabilities | | | 9,408 | | | 25,971 | | | 237,262 | | | - | | | 272,641 | | | (544) | | | 272,097 |
Long-term debt | | | - | | | 583,035 | | | - | | | - | | | 583,035 | | | - | | | 583,035 |
Deferred income taxes | | | (161,108) | | | 687 | | | 160,590 | | | - | | | 169 | | | (169) | | | - |
Coal supply agreements, net | | | - | | | - | | | 4,268 | | | - | | | 4,268 | | | - | | | 4,268 |
Postretirement benefits | | | 1,191 | | | - | | | 531,975 | | | - | | | 533,166 | | | - | | | 533,166 |
Other noncurrent liabilities | | | 631,307 | | | 251,702 | | | 706,554 | | | (1,238,382) | | | 351,181 | | | - | | | 351,181 |
| | | | | | | | | | | | | | | | | | | | | |
Total liabilities | | | 480,798 | | | 861,395 | | | 1,640,649 | | | (1,238,382) | | | 1,744,460 | | | (713) | | | 1,743,747 |
| Stockholder Equity | | | | | | | | | | | | | | | | | | | | | |
Stockholder equity | | | 223,271 | | | 229,660 | | | 1,110,191 | | | (1,339,851) | | | 223,271 | | | 1,090 | | | 224,361 |
| | | | | | | | | | | | | | | | | | | | | |
Total liabilities and stockholder equity | | $ | 704,069 | | $ | 1,091,055 | | $ | 2,750,840 | | $ | (2,578,233) | | $ | 1,967,731 | | $ | 377 | | $ | 1,968,108 |
| | | | | | | | | | | | | | | | | | | | | |
25
Alpha Natural Resources, Inc. and Subsidiaries
Notes to Consolidated Financial Statements—(Continued)
(Unaudited, dollars in thousands)
Supplemental Condensed Consolidating Statement of Operations
For the Three Months Ended June 30, 2009
| | | | | | | | | | | | | | | | | | | | | |
| | | Guarantor
FCC | | Issuer
Subsidiary | | Guarantor
Subsidiaries | | Eliminations | | FCC
Consolidated | | Other Non-
Guarantor
Entities | | Total
Consolidated |
Total revenues | | $ | - | | $ | - | | $ | 404,660 | | $ | - | | $ | 404,660 | | $ | - | | $ | 404,660 |
Costs and expenses: | | | | | | | | | | | | | | | | | | | | | |
Cost of coal sales (excludes depreciation, depletion and amortization) | | | - | | | 245 | | | 279,207 | | | - | | | 279,452 | | | - | | | 279,452 |
Selling, general and administrative expenses (excludes depreciation, depletion and amortization) | | | 9,333 | | | - | | | 6,643 | | | - | | | 15,976 | | | 5,273 | | | 21,249 |
Accretion on asset retirement obligations | | | - | | | - | | | 2,949 | | | - | | | 2,949 | | | - | | | 2,949 |
Depreciation, depletion and amortization | | | 1,223 | | | - | | | 50,891 | | | - | | | 52,114 | | | - | | | 52,114 |
Amortization of coal supply agreements | | | (69) | | | - | | | 241 | | | - | | | 172 | | | - | | | 172 |
| | | | | | | | | | | | | | | | | | | | | |
(Loss) income from operations | | | (10,487) | | | (245) | | | 64,729 | | | - | | | 53,997 | | | (5,273) | | | 48,724 |
Other income (expense): | | | | | | | | | | | | | | | | | | - | | | |
Interest expense | | | (2,297) | | | (6,542) | | | (207) | | | - | | | (9,046) | | | - | | | (9,046) |
Interest income | | | 1 | | | - | | | 17 | | | - | | | 18 | | | - | | | 18 |
| | | | | | | | | | | | | | | | | | | | | |
(Loss) income before income tax expense, equity in (losses) earnings of affiliates and equity in earnings of investments in Issuer and Guarantor Subsidiaries | | | (12,783) | | | (6,787) | | | 64,539 | | | - | | | 44,969 | | | (5,273) | | | 39,696 |
Income tax expense | | | (9,180) | | | (16) | | | (571) | | | - | | | (9,767) | | | 926 | | | (8,841) |
Equity in (losses) earnings of affiliates | | | - | | | (208) | | | 9 | | | - | | | (199) | | | - | | | (199) |
Equity in earnings of investments in Issuer and Guarantor Subsidiaries | | | 56,966 | | | 56,040 | | | - | | | (113,006) | | | - | | | - | | | - |
| | | | | | | | | | | | | | | | | | | | | |
Net income | | $ | 35,003 | | $ | 49,029 | | $ | 63,977 | | $ | (113,006) | | $ | 35,003 | | $ | (4,347) | | $ | 30,656 |
| | | | | | | | | | | | | | | | | | | | | |
26
Alpha Natural Resources, Inc. and Subsidiaries
Notes to Consolidated Financial Statements—(Continued)
(Unaudited, dollars in thousands)
Supplemental Condensed Consolidating Statement of Operations
For the Three Months Ended June 30, 2008
| | | | | | | | | | | | | | | | | | | | | |
| | | Guarantor
FCC | | Issuer
Subsidiary | | Guarantor
Subsidiaries | | Eliminations | | FCC
Consolidated | | Other Non-
Guarantor
Entities | | Total
Consolidated |
Total revenues | | $ | 212 | | $ | - | | $ | 411,725 | | $ | - | | $ | 411,937 | | $ | - | | $ | 411,937 |
Costs and expenses: | | | | | | | | | | | | | | | | | | | | | |
Cost of coal sales (excludes depreciation, depletion and amortization) | | | - | | | 624 | | | 329,602 | | | - | | | 330,226 | | | - | | | 330,226 |
Selling, general and administrative expenses (excludes depreciation, depletion and amortization) | | | 11,139 | | | - | | | 5,793 | | | - | | | 16,932 | | | 491 | | | 17,423 |
Accretion on asset retirement obligations | | | - | | | - | | | 2,899 | | | - | | | 2,899 | | | - | | | 2,899 |
Depreciation, depletion and amortization | | | 1,399 | | | - | | | 50,106 | | | - | | | 51,505 | | | - | | | 51,505 |
Amortization of coal supply agreements | | | (85) | | | - | | | 1,282 | | | - | | | 1,197 | | | - | | | 1,197 |
| | | | | | | | | | | | | | | | | | | | | |
(Loss) income from operations | | | (12,241) | | | (624) | | | 22,043 | | | - | | | 9,178 | | | (491) | | | 8,687 |
Other income (expense): | | | | | | | | | | | | | | | | | | - | | | |
Interest expense | | | (4,314) | | | (6,851) | | | (201) | | | - | | | (11,366) | | | - | | | (11,366) |
Interest income | | | 222 | | | - | | | 26 | | | - | | | 248 | | | - | | | 248 |
| | | | | | | | | | | | | | | | | | | | | |
(Loss) income before income tax (expense) benefit, equity in losses of affiliate and equity in earnings of investments in Issuer and Guarantor Subsidiaries | | | (16,333) | | | (7,475) | | | 21,868 | | | - | | | (1,940) | | | (491) | | | (2,431) |
Income tax (expense) benefit | | | (2,634) | | | 553 | | | 932 | | | - | | | (1,149) | | | 34 | | | (1,115) |
Equity in losses of affiliate | | | - | | | (881) | | | - | | | | | | (881) | | | - | | | (881) |
Equity in earnings of investments in Issuer and Guarantor Subsidiaries | | | 14,997 | | | 12,817 | | | - | | | (27,814) | | | - | | | - | | | - |
| | | | | | | | | | | | | | | | | | | | | |
Net (loss) income | | $ | (3,970) | | $ | 5,014 | | $ | 22,800 | | $ | (27,814) | | $ | (3,970) | | $ | (457) | | $ | (4,427) |
| | | | | | | | | | | | | | | | | | | | | |
27
Alpha Natural Resources, Inc. and Subsidiaries
Notes to Consolidated Financial Statements—(Continued)
(Unaudited, dollars in thousands)
Supplemental Condensed Consolidating Statement of Operations
For the Six Months Ended June 30, 2009
| | | | | | | | | | | | | | | | | | | | | |
| | | Guarantor
FCC | | Issuer
Subsidiary | | Guarantor
Subsidiaries | | Eliminations | | FCC
Consolidated | | Other Non-
Guarantor
Entities | | Total
Consolidated |
Total revenues | | $ | - | | $ | - | | $ | 809,829 | | $ | - | | $ | 809,829 | | $ | - | | $ | 809,829 |
Costs and expenses: | | | | | | | | | | | | | | | | | | | | | |
Cost of coal sales (excludes depreciation, depletion and amortization) | | | - | | | 461 | | | 611,559 | | | - | | | 612,020 | | | - | | | 612,020 |
Selling, general and administrative expenses (excludes depreciation, depletion and amortization) | | | 19,148 | | | - | | | 13,448 | | | - | | | 32,596 | | | 6,109 | | | 38,705 |
Accretion on asset retirement obligations | | | - | | | - | | | 5,906 | | | - | | | 5,906 | | | - | | | 5,906 |
Depreciation, depletion and amortization | | | 2,438 | | | - | | | 99,193 | | | - | | | 101,631 | | | - | | | 101,631 |
Amortization of coal supply agreements | | | (138) | | | - | | | 285 | | | - | | | 147 | | | - | | | 147 |
| | | | | | | | | | | | | | | | | | | | | |
(Loss) income from operations | | | (21,448) | | | (461) | | | 79,438 | | | - | | | 57,529 | | | (6,109) | | | 51,420 |
Other income (expense): | | | | | | | | | | | | | | | | | | - | | | |
Interest expense | | | (4,524) | | | (13,010) | | | (662) | | | - | | | (18,196) | | | - | | | (18,196) |
Interest income | | | 23 | | | - | | | 142 | | | - | | | 165 | | | - | | | 165 |
| | | | | | | | | | | | | | | | | | | | | |
(Loss) income before income tax expense, equity in (losses) earnings of affiliates and equity in earnings of investments in Issuer and Guarantor Subsidiaries | | | (25,949) | | | (13,471) | | | 78,918 | | | - | | | 39,498 | | | (6,109) | | | 33,389 |
Income tax expense | | | (7,336) | | | (24) | | | (479) | | | - | | | (7,839) | | | 1,101 | | | (6,738) |
Equity in (losses) earnings of affiliates | | | - | | | (461) | | | 13 | | | - | | | (448) | | | - | | | (448) |
Equity in earnings of investments in Issuer and Guarantor Subsidiaries | | | 64,496 | | | 59,354 | | | - | | | (123,850) | | | - | | | - | | | - |
| | | | | | | | | | | | | | | | | | | | | |
Net income | | $ | 31,211 | | $ | 45,398 | | $ | 78,452 | | $ | (123,850) | | $ | 31,211 | | $ | (5,008) | | $ | 26,203 |
| | | | | | | | | | | | | | | | | | | | | |
28
Alpha Natural Resources, Inc. and Subsidiaries
Notes to Consolidated Financial Statements—(Continued)
(Unaudited, dollars in thousands)
Supplemental Condensed Consolidating Statement of Operations
For the Six Months Ended June 30, 2008
| | | | | | | | | | | | | | | | | | | | | |
| | | Guarantor
FCC | | Issuer
Subsidiary | | Guarantor
Subsidiaries | | Eliminations | | FCC
Consolidated | | Other Non-
Guarantor
Entities | | Total
Consolidated |
Total revenues | | $ | 10 | | $ | - | | $ | 824,231 | | $ | - | | $ | 824,241 | | $ | - | | $ | 824,241 |
Costs and expenses: | | | | | | | | | | | | | | | | | | | | | |
Cost of coal sales (excludes depreciation, depletion and amortization) | | | - | | | 864 | | | 644,835 | | | - | | | 645,699 | | | - | | | 645,699 |
Selling, general and administrative expenses (excludes depreciation, depletion and amortization) | | | 24,373 | | | - | | | 11,898 | | | - | | | 36,271 | | | 943 | | | 37,214 |
Accretion on asset retirement obligations | | | - | | | - | | | 5,456 | | | - | | | 5,456 | | | - | | | 5,456 |
Depreciation, depletion and amortization | | | 2,822 | | | - | | | 101,948 | | | - | | | 104,770 | | | - | | | 104,770 |
Amortization of coal supply agreements | | | (169) | | | - | | | 1,491 | | | - | | | 1,322 | | | - | | | 1,322 |
| | | | | | | | | | | | | | | | | | | | | |
(Loss) income from operations | | | (27,016) | | | (864) | | | 58,603 | | | - | | | 30,723 | | | (943) | | | 29,780 |
Other income (expense): | | | | | | | | | | | | | | | | | | - | | | |
Interest expense | | | (11,077) | | | (12,923) | | | (280) | | | - | | | (24,280) | | | - | | | (24,280) |
Interest income | | | 639 | | | - | | | 52 | | | - | | | 691 | | | - | | | 691 |
| | | | | | | | | | | | | | | | | | | | | |
(Loss) income before income tax (expense) benefit, equity in losses of affiliate and equity in earnings of investments in Issuer and Guarantor Subsidiaries | | | (37,454) | | | (13,787) | | | 58,375 | | | - | | | 7,134 | | | (943) | | | 6,191 |
Income tax (expense) benefit | | | (4,590) | | | 525 | | | 562 | | | - | | | (3,503) | | | 121 | | | (3,382) |
Equity in losses of affiliate | | | - | | | (1,066) | | | - | | | | | | (1,066) | | | - | | | (1,066) |
Equity in earnings of investments in Issuer and Guarantor Subsidiaries | | | 44,609 | | | 45,309 | | | - | | | (89,918) | | | - | | | - | | | - |
| | | | | | | | | | | | | | | | | | | | | |
Net income | | $ | 2,565 | | $ | 30,981 | | $ | 58,937 | | $ | (89,918) | | $ | 2,565 | | $ | (822) | | $ | 1,743 |
| | | | | | | | | | | | | | | | | | | | | |
29
Alpha Natural Resources, Inc. and Subsidiaries
Notes to Consolidated Financial Statements—(Continued)
(Unaudited, dollars in thousands)
Supplemental Condensed Consolidating Statement of Cash Flow
Six Months Ended June 30, 2009
| | | | | | | | | | | | | | | | | | |
| | | Guarantor
FCC | | Issuer
Subsidiary | | Guarantor
Subsidiaries | | FCC
Consolidated | | Other Non-
Guarantor
Entities | | Total
Consolidated |
Net cash (used in) provided by operating activities | | $ | (3,027) | | $ | - | | $ | 129,938 | | $ | 126,911 | | $ | (2,550) | | $ | 124,361 |
| | | | | | | | | | | | | | | | | | |
Investing activities: | | | | | | | | | | | | | | | | | | |
Purchases of property, plant, equipment and mine development costs | | | - | | | - | | | (93,953) | | | (93,953) | | | - | | | (93,953) |
Acquisition of mineral rights under federal lease | | | - | | | - | | | (36,108) | | | (36,108) | | | - | | | (36,108) |
Proceeds from disposition of property, plant and equipment | | | - | | | - | | | 125 | | | 125 | | | - | | | 125 |
| | | | | | | | | | | | | | | | | | |
Net cash used in investing activities | | | - | | | - | | | (129,936) | | | (129,936) | | | - | | | (129,936) |
| | | | | | | | | | | | | | | | | | |
Financing activities: | | | | | | | | | | | | | | | | | | |
Payment of cash dividends | | | - | | | - | | | - | | | - | | | (4,467) | | | (4,467) |
Payment of cash dividends to Foundation Coal Holdings, Inc. | | | (4,467) | | | - | | | - | | | (4,467) | | | 4,467 | | | - |
Proceeds from revolving credit facility | | | - | | | 10,000 | | | - | | | 10,000 | | | - | | | 10,000 |
Principal repayment of revolving credit facility | | | - | | | (10,000) | | | - | | | (10,000) | | | - | | | (10,000) |
Return of capital to Foundation Coal Holdings, Inc. | | | (3,938) | | | - | | | - | | | (3,938) | | | 3,938 | | | - |
Other | | | - | | | - | | | - | | | - | | | (1,388) | | | (1,388) |
| | | | | | | | | | | | | | | | | | |
Net cash used in financing activities | | | (8,405) | | | - | | | - | | | (8,405) | | | 2,550 | | | (5,855) |
| | | | | | | | | | | | | | | | | | |
Net (decrease) increase in cash | | | (11,432) | | | - | | | 2 | | | (11,430) | | | - | | | (11,430) |
Cash at beginning of period | | | 42,254 | | | - | | | 72 | | | 42,326 | | | - | | | 42,326 |
| | | | | | | | | | | | | | | | | | |
Cash at end of period | | $ | 30,822 | | $ | - | | $ | 74 | | $ | 30,896 | | $ | - | | $ | 30,896 |
| | | | | | | | | | | | | | | | | | |
30
Alpha Natural Resources, Inc. and Subsidiaries
Notes to Consolidated Financial Statements—(Continued)
(Unaudited, dollars in thousands)
Supplemental Condensed Consolidating Statement of Cash Flow
Six Months Ended June 30, 2008
| | | | | | | | | | | | | | | | | | |
| | | Guarantor
FCC | | Issuer
Subsidiary | | Guarantor
Subsidiaries | | FCC
Consolidated | | Other Non-
Guarantor
Entities | | Total
Consolidated |
Net cash provided by operating activities | | $ | 29,797 | | $ | - | | $ | 102,638 | | $ | 132,435 | | $ | (654) | | $ | 131,781 |
| | | | | | | | | | | | | | | | | | |
Investing activities: | | | | | | | | | | | | | | | | | | |
Purchases of property, plant, equipment and mine development costs | | | (630) | | | - | | | (66,031) | | | (66,661) | | | - | | | (66,661) |
Acquisition of mineral rights under federal lease | | | - | | | - | | | (36,108) | | | (36,108) | | | - | | | (36,108) |
Purchases of equity-method investments | | | - | | | (9,246) | | | (824) | | | (10,070) | | | | | | (10,070) |
Proceeds from disposition of property, plant and equipment | | | - | | | - | | | 324 | | | 324 | | | - | | | 324 |
| | | | | | | | | | | | | | | | | | |
Net cash used in investing activities | | | (630) | | | (9,246) | | | (102,639) | | | (112,515) | | | - | | | (112,515) |
| | | | | | | | | | | | | | | | | | |
Financing activities: | | | | | | | | | | | | | | | | | | |
Payment of cash dividends | | | - | | | - | | | - | | | - | | | (4,530) | | | (4,530) |
Payment of cash dividends to Foundation Coal Holdings, Inc. | | | (4,530) | | | - | | | - | | | (4,530) | | | 4,530 | | | - |
Proceeds from issuance of common stock | | | - | | | - | | | - | | | - | | | 3,436 | | | 3,436 |
Capital contributions from Foundation Coal Holdings, Inc. | | | 3,436 | | | - | | | - | | | 3,436 | | | (3,436) | | | - |
Excess tax benefit from stock-based awards | | | 5,542 | | | - | | | - | | | 5,542 | | | - | | | 5,542 |
Return of capital to Foundation Coal Holdings, Inc. | | | (2,728) | | | - | | | - | | | (2,728) | | | 2,728 | | | - |
Capital contributions to Issuer subsidiary | | | (9,246) | | | - | | | - | | | (9,246) | | | 9,246 | | | - |
Capital contributions from Guarantor | | | - | | | 9,246 | | | - | | | 9,246 | | | (9,246) | | | - |
Other | | | - | | | - | | | - | | | - | | | (2,073) | | | (2,073) |
| | | | | | | | | | | | | | | | | | |
Net cash (used in) provided by financing activities | | | (7,526) | | | 9,246 | | | - | | | 1,720 | | | 655 | | | 2,375 |
| | | | | | | | | | | | | | | | | | |
Net increase (decrease) in cash and cash equivalents | | | 21,641 | | | - | | | (1) | | | 21,640 | | | 1 | | | 21,641 |
Cash and cash equivalents at beginning of period | | | 49,993 | | | - | | | 71 | | | 50,064 | | | 7 | | | 50,071 |
| | | | | | | | | | | | | | | | | | |
Cash and cash equivalents at end of period | | $ | 71,634 | | $ | - | | $ | 70 | | $ | 71,704 | | $ | 8 | | $ | 71,712 |
| | | | | | | | | | | | | | | | | | |
31
ITEM 2. MANAGEMENT’S DISCUSSION AND ANALYSIS OF FINANCIAL CONDITION AND RESULTS OF OPERATIONS.
On May 11, 2009, Alpha Natural Resources, Inc. (“Old Alpha”) and Foundation Coal Holdings, Inc. (“Foundation”) executed an agreement and plan of merger (the “Merger Agreement”) pursuant to which Alpha was to be merged (the “Merger”) with and into Foundation, with Foundation continuing as the surviving corporation of the Merger under the name Alpha Natural Resources, Inc. (“New Alpha”). On July 31, 2009, the Merger was completed.
Unless we have indicated otherwise, or the context otherwise requires, references in this report to “Foundation,” “the Company,” “we,” “us” and “our” or similar terms are to Foundation Coal Holdings, Inc. and its consolidated subsidiaries prior to the Merger with Old Alpha.
You should read the following discussion and analysis in conjunction with our financial statements and related notes included elsewhere in this report, our Annual Report on Form 10-K for the year ended December 31, 2008.
Special Note Regarding Forward-Looking Statements
This Form 10-Q contains forward-looking statements that are not statements of historical fact and may involve a number of risks and uncertainties. These statements relate to analyses and other information that are based on forecasts of future results and estimates of amounts not yet determinable. These statements may also relate to our future prospects, developments and business strategies.
We have used the words “anticipate,” “believe,” “could,” “estimate,” “expect,” “intend,” “may,” “plan,” “predict,” “project” and similar terms and phrases, including references to assumptions, in this Form 10-Q to identify forward-looking statements. These forward-looking statements are made based on expectations and beliefs concerning future events affecting us and are subject to uncertainties and factors relating to our operations and business environment, all of which are difficult to predict and many of which are beyond our control, that could cause our actual results to differ materially from those matters expressed in or implied by these forward-looking statements. The following factors are among those that may cause actual results to differ materially from our forward-looking statements:
| | • | | market demand for coal, electricity and steel; |
| | • | | future economic or capital market conditions; |
| | • | | weather conditions or catastrophic weather-related damage; |
| | • | | our ability to produce coal at existing and planned future operations; |
| | • | | the consummation of financing, acquisition or disposition transactions and the effect thereof on our business; |
| | • | | our plans and objectives for future operations and expansion or consolidation; |
| | • | | our relationships with, and other conditions affecting, our customers; |
| | • | | timing of reductions or increases in customer coal inventories; |
| | • | | long-term coal supply arrangements; |
| | • | | environmental laws, including those directly affecting our coal mining and production, and those affecting our customers’ coal usage; |
| | • | | railroad, barge, trucking and other transportation performance and costs; |
| | • | | our assumptions concerning economically recoverable coal reserve estimates; |
| | • | | regulatory and court decisions; |
| | • | | future legislation and changes in regulations or governmental policies or changes in interpretations thereof; |
| | • | | changes in postretirement benefit and pension obligations; |
| | • | | our liquidity, results of operations and financial condition; |
| | • | | disruptions in delivery or changes in pricing from third party vendors of goods and services which are necessary for our operations, such as fuel, steel products, explosives and tires; |
| | • | | other factors, including the other factors discussed in Part I, Item 1A, “Risk Factors,” of this report and of our annual report on Form 10-K for the year ended December 31, 2008. |
32
| | • | | the global financial crisis and tightening in the credit markets could adversely affect our business and financial results as global demand for coal in the short-term is uncertain and may lead to reduced coal prices, creating challenges to producers in the industry. |
You should keep in mind that any forward-looking statement made by us in this Form 10-Q or elsewhere speaks only as of the date on which we make it. New risks and uncertainties come up from time to time, and it is impossible for us to predict these events or how they may affect us. We have no duty to, and do not intend to, update or revise the forward-looking statements in this Form 10-Q after the date of this Form 10-Q, except as may be required by law. In light of these risks and uncertainties, you should keep in mind that circumstances described in any forward-looking statement made in this Form 10-Q or elsewhere might not occur.
Merger Between the Company and Alpha Natural Resources, Inc.
On July 31, 2009, Alpha Natural Resources, Inc. (“Old Alpha”) merged (the “Merger”) with and into Foundation Coal Holdings, Inc. (“Foundation”), with Foundation continuing as the surviving corporation under the name Alpha Natural Resources, Inc. We refer to the surviving corporation as “New Alpha.”
As of the effective time of the Merger (the “Effective Time”), each issued and outstanding share of common stock, par value $0.01, of Foundation, and other outstanding equity-based awards other than any shares owned by Old Alpha, were converted into the right to receive 1.0840 shares of common stock, par value $0.01, of New Alpha, and each issued and outstanding share of common stock, par value $0.01, of Old Alpha, other than any shares owned by Foundation, automatically became one share of common stock of New Alpha. Immediately after the Effective Time, Old Alpha’s stockholders owned approximately 59% of New Alpha common stock and Foundation’s stockholders owned approximately 41% of New Alpha common stock.
The Merger will be accounted for as a business combination under Statement of Financial Accounting Standards (“SFAS”) No. 141(R),Business Combinations (“SFAS No. 141(R)”). For financial accounting purposes, the Merger is treated as a “reverse acquisition” and Old Alpha is treated as the accounting acquirer. Accordingly, Old Alpha’s financial statements will become the financial statements of New Alpha and New Alpha’s future periodic filings will reflect Old Alpha’s historical financial condition and results of operations shown for comparative purposes. The results of operations contained in this ITEM 2 are the results of operations for Foundation prior to the merger with Old Alpha.
Also at the Effective Time, the Board of Directors of New Alpha was comprised of ten members, six of which were members of Old Alpha’s board and four were members of the Foundation board. The headquarters of New Alpha is in Abingdon, Virginia.
Overview
Based on annual production volumes, we are the fourth largest coal producer in the United States, currently operating nine individual coal mines. Our mining operations are located in southwest Pennsylvania, southern West Virginia and the southern Powder River Basin region of Wyoming. Four of our operations are surface mines, two of our operations are underground mines using highly efficient longwall mining technology and the remaining three operations are “room-and-pillar” underground mines that utilize continuous miners. In addition to mining coal, we also purchase coal from other producers for resale or for the purpose of blending it with our own production.
For the three months ended June 30, 2009, we sold 16.4 million tons of coal, including 16.2 million tons that were produced and processed at our operations. For the comparable period in 2008, we sold 17.0 million tons of coal, including 16.5 million tons that were produced and processed at our operations. For the six months ended June 30, 2009, we sold 33.6 million tons of coal, including 33.0 million tons that were produced and processed at our operations. For the comparable period in 2008, we sold 35.4 million tons of coal, including 34.5 million tons that were produced and processed at our operations. As of December 31, 2008, we had approximately 1.7 billion tons of proven and probable coal reserves.
We are primarily a supplier of steam coal to U.S. utilities for use in generating electricity. We also sell steam coal to industrial plants. Steam coal sales accounted for approximately 99% and 98% of our coal sales volume for the three month periods ended June 30, 2009 and 2008, respectively, representing approximately 95% and 91% of our coal sales revenue for the three months ended June 30, 2009 and 2008, respectively. For the six months ended June 30, 2009 and 2008, steam coal sales accounted for approximately 99% and 98% of our coal sales volume, respectively, representing approximately 95% and 91% or our coal sales revenue in the six month periods ended June 30, 2009 and 2008, respectively. We sell metallurgical coal to steel producers where it is used to make coke for steel production. Metallurgical coal accounted for approximately 1% and 2% of our coal sales volume for the three month periods ended June 30, 2009 and 2008, respectively, representing approximately 5% and 9% of our coal sales revenue for the three month periods ended June 30, 2009 and 2008, respectively. Metallurgical coal accounted for approximately 1% and 2% of our coal sales volume for the six month periods ended June 30, 2009 and 2008, respectively, representing approximately 5% and 9% of our coal sales revenue in the six month periods ended June 30, 2009 and 2008, respectively.
33
While the majority of our revenues are derived from the sale of coal, we also realize revenues from coal production royalties, override royalty payments from a coal supply agreement now fulfilled by another producer, fees to transload coal through our Rivereagle facility on the Big Sandy river and revenues from the sale of coalbed methane, natural gas and Dry Systems Technologies equipment and filters.
Results of Operations
Three Months Ended June 30, 2009 Compared to Three Months Ended June 30, 2008
Coal sales realization per ton sold represents revenue realized on each ton of coal sold. It is calculated by dividing coal sales revenues by tons sold.
Revenues
| | | | | | | | | | | |
| | | Three Months Ended
June 30, | | Increase (Decrease) |
| | | 2009 | | 2008 | | Amount | | Percent |
| | | (Unaudited, in thousands, except per ton data) |
Coal sales | | $ | 398,999 | | $ | 404,780 | | $ | (5,781) | | (1)% |
Other revenue | | | 5,661 | | | 7,157 | | | (1,496) | | (21)% |
| | | | | | | | | | | |
Total revenues | | $ | 404,660 | | $ | 411,937 | | $ | (7,277) | | (2)% |
| | | | | | | | | | | |
Tons sold | | | 16,440 | | | 16,993 | | | (553) | | (3)% |
Coal sales realization per ton sold | | $ | 24.27 | | $ | 23.82 | | $ | 0.45 | | 2 % |
Coal sales revenues for the three months ended June 30, 2009 decreased by $5.8 million, or 1% compared to coal sales revenues for the three months ended June 30, 2008. Coal sales realization per ton increased 2% period-over-period, while tons sold decreased by 3% period-over-period. Consolidated coal sales realization per ton for the three months ended June 30, 2009 reflected increased prices per ton sold in three of our operating segments, consisting of a 19% increase in Central Appalachia, a 18% increase in Northern Appalachia and a 7% increase in the Powder River Basin.
Coal sales revenues in Central Appalachia for the three months ended June 30, 2009 decreased $37.7 million, or 30% compared to coal sales revenues for the three months ended June 30, 2008, primarily as a result of lower coal sales volumes, partially offset by higher coal sales realization per ton. Coal sales realization per ton increased 19% period-over-period as a result of increased pricing per ton sold. Coal sales volumes decreased 0.8 million tons, or 42%, and production decreased 0.6 million tons, or 35%, in the three months ended June 30, 2009 compared to the prior year period.
Coal sales revenues in Northern Appalachia for the three months ended June 30, 2009 increased by $20.9 million, or 13% compared to coal sales revenues for the three months ended June 30, 2008, primarily due to higher coal sales realization per ton, partially offset by lower coal sales volumes. Coal sales volumes in Northern Appalachia decreased by 0.1 million tons, or 4% period-over-period, while coal sales realization per ton increased 18% period-over-period due to increased pricing per ton sold. Coal sales volumes at the Emerald mine decreased 0.3 million tons, or 19% compared to the prior year period, and production increased 0.5 million tons, or 40% compared to the prior year period. Coal sales volumes at the Cumberland mine increased 0.2 million tons, or 8% compared to the prior year period, and production increased 0.2 million tons, or 11% compared to the prior year.
Coal sales revenues in the Powder River Basin for the three months ended June 30, 2009 increased $12.5 million, or 11%, compared to coal sales revenues for the three months ended June 30, 2008, as a result of higher coal sales volumes and higher coal sales realization per ton. Coal sales realization per ton increased 7% period-over-period as a result of increased pricing per ton sold. Coal sales volumes increased 0.4 million tons, or 4%, in the three months ended June 30, 2009 compared to the prior year period. Production and shipments increased 7% and 1% period-over-period at the Eagle Butte and Belle Ayr mines, respectively.
Coal sales revenues from our coal trading group decreased $1.6 million in the three months ended June 30, 2009 compared to the three months ended June 30, 2008 as a result of lower coal sales volumes that resulted in physical delivery.
Other revenues for the three months ended June 30, 2009 decreased by $1.5 million (21%) compared to the three months ended June 30, 2008. The decrease was due to: (a) decreased coalbed methane revenues ($1.8 million); (b) decreased royalty revenue ($0.1 million); and (c) decreased revenues from the sale of equipment by Dry Systems Technologies ($0.1 million); partially offset by (d) higher other miscellaneous revenues ($0.5 million).
34
Costs and Expenses
| | | | | | | | | | | |
| | | Three Months Ended
June 30, | | Increase (Decrease) |
| | | 2009 | | 2008 | | Amount | | Percent |
| | | (Unaudited, in thousands) |
Cost of coal sales (excludes depreciation, depletion and amortization) | | $ | 279,452 | | $ | 330,226 | | $ | (50,774) | | (15)% |
Selling, general and administrative expenses
(excludes depreciation, depletion and amortization) | | | 21,249 | | | 17,423 | | | 3,826 | | 22 % |
Accretion on asset retirement obligations | | | 2,949 | | | 2,899 | | | 50 | | 2 % |
Depreciation, depletion and amortization | | | 52,114 | | | 51,505 | | | 609 | | 1 % |
Amortization of coal supply agreements | | | 172 | | | 1,197 | | | (1,025) | | (86)% |
| | | | | | | | | | | |
Total costs and expenses | | $ | 355,936 | | $ | 403,250 | | $ | (47,314) | | (12)% |
| | | | | | | | | | | |
Cost of coal sales. Cost of coal sales decreased $50.8 million for the three months ended June 30, 2009 compared to the three months ended June 30, 2008, primarily due to: (a) decreased inventory charges to expense related to an overall lower ratio of tons sold vs. tons produced in the three months ended June 30, 2009 compared to the prior year period ($29.6 million); (b) decreased purchased coal costs as a result of lower tons purchased for physical delivery ($17.5 million); (c) decreased other miscellaneous expenses ($9.9 million); (d) decreased transportation and loading expenses ($4.5 million); partially offset by (e) increased labor and benefit costs ($7.6 million); and (f) higher repair, maintenance and operating supply costs, including diesel fuel ($3.1 million). Cost of coal sales per ton was $17.00 for the three months ended June 30, 2009 compared to $19.43 per ton for the three months ended June 30, 2008.
Selling, general and administrative expenses. Selling, general and administrative expenses for the three months ended June 30, 2009 increased $3.8 million compared to the three months ended June 30, 2008. Period-over-period increases were due to: (a) merger-related expenses ($4.8 million); partially offset by (b) lower employee compensation and benefit related expenses due primarily to lower stock-based compensation ($0.7 million); and (c) lower miscellaneous other expenses ($0.3 million).
Accretion on asset retirement obligations.Accretion on asset retirement obligations is a result of accounting for asset retirement obligations under SFAS No. 143,Accounting for Asset Retirement Obligations. Accretion represents the increase in the asset retirement liability to reflect the change in the liability for the passage of time because the initial liability is recorded at present value. Higher accretion expense in 2009 was due to increased asset retirement obligation estimates for the comparable periods.
Depreciation, depletion and amortization. Depreciation, depletion and amortization includes depreciation of plant and equipment, cost depletion of amounts assigned to owned and leased mineral rights and amortization of mine development costs, internal use software and leasehold improvements. Depreciation, depletion and amortization expense increased $0.6 million for the three months ended June 30, 2009 compared to the three months ended June 30, 2008, primarily due to higher depreciation and amortization partially offset by lower cost depletion. Cost depletion decreased by $0.5 million due to decreased production in Central Appalachia period-over-period. Depreciation and amortization increased by $1.1 million in the three months ended June 30, 2009 compared to the prior year period mainly due to depreciation and amortization associated with capital additions to plant, equipment and mine development costs during the twelve months ended June 30, 2009.
Coal supply agreement amortization. Application of purchase accounting in 2004 resulted in the recognition of a significant liability for below market priced coal supply agreements as well as a significant asset for above market priced coal supply agreements, both in relation to market prices at the date of acquisition of mining assets by the Company in 2004. Coal supply agreement amortization expense decreased $1.0 million for the three months ended June 30, 2009 compared to the three months ended June 30, 2008, primarily due to a decrease in amortization of the asset for above market coal supply agreements of $1.5 million that was partially offset by a decrease in the credit to amortization expense from below market liability contracts of $0.5 million. As shipments on coal supply agreements valued in purchase accounting are completed, the period-over-period impact of the amortization on both the asset and liability balances will continue to diminish until approximately 2010 when shipments associated with these coal supply agreements are estimated to be complete.
35
Segment Analysis
Utilizing data published by Argus Media, the following graph sets forth representative steam coal prices in various U.S. markets. The prices are not necessarily representative of the coal prices actually obtained by the Company. Changes in coal prices have an impact over time on the Company’s average sales realization per ton and, ultimately, its consolidated financial results.
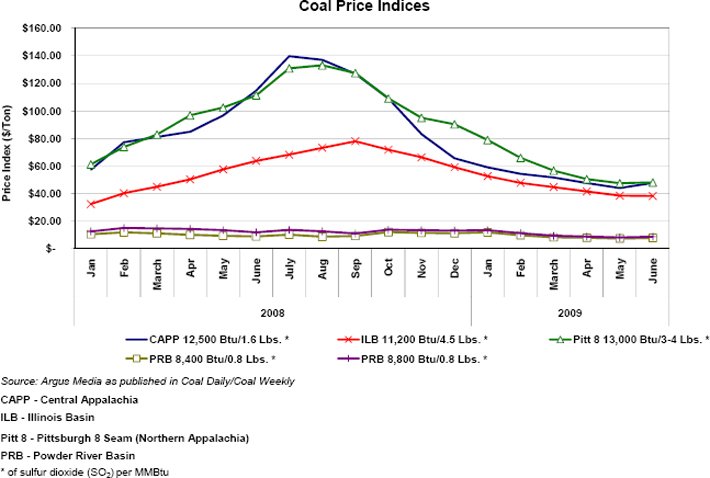
36
The price of coal is influenced by many factors that vary by region. Such factors include, but are not limited to: (1) coal quality, which includes energy (heat content), sulfur, ash, volatile matter and moisture content; (2) transportation costs; (3) regional supply and demand; (4) available competitive fuel sources such as natural gas, nuclear or hydro; and (5) production costs, which vary by mine type, available technology and equipment utilization, productivity, geological conditions, and mine operating expenses.
The energy content or heat value of coal is a significant factor influencing coal prices as higher energy coal is more desirable to consumers and typically commands a higher price in the market. The heat value of coal is commonly measured in British thermal units or the amount of heat needed to raise the temperature of one pound of water by one degree Fahrenheit. Coal from the Eastern and Midwest regions of the United States tends to have a higher heat value than coal found in the Western United States.
Prices for our Powder River Basin coal, with its lower energy content, lower production cost and often greater distance to travel to the consumer, typically sells at a lower price than Northern and Central Appalachian coal that has a higher energy content and is often located closer to the end user. Illinois Basin coal generally has lower energy content and higher sulfur than Northern and Central Appalachian coal, but it has higher energy content than Powder River Basin coal.
| | | | | | | | | | | |
| | | Three Months Ended
June 30, | | Increase (Decrease) |
| | | 2009 | | 2008 | | Tons/$ | | Percent |
| | | (Unaudited, in thousands, except coal sales realization per ton and cost of coal sales per ton) |
Powder River Basin | | | | | | | | | | | |
Tons sold | | | 11,993 | | | 11,575 | | | 418 | | 4 % |
Coal sales realization per ton | | $ | 10.74 | | $ | 10.05 | | $ | 0.69 | | 7 % |
Total revenues | | $ | 129,630 | | $ | 117,184 | | $ | 12,446 | | 11 % |
Cost of coal sales per ton(1) | | $ | 9.07 | | $ | 8.18 | | $ | 0.89 | | 11 % |
Income from operations | | $ | 5,255 | | $ | 6,365 | | $ | (1,110) | | (17)% |
Northern Appalachia | | | | | | | | | | | |
Tons sold | | | 3,311 | | | 3,450 | | | (139) | | (4)% |
Coal sales realization per ton | | $ | 53.51 | | $ | 45.30 | | $ | 8.21 | | 18 % |
Total revenues | | $ | 179,682 | | $ | 157,571 | | $ | 22,111 | | 14 % |
Cost of coal sales per ton(1) | | $ | 27.65 | | $ | 35.26 | | $ | (7.61) | | (22)% |
Income from operations | | $ | 59,896 | | $ | 12,770 | | $ | 47,126 | | 369 % |
Central Appalachia | | | | | | | | | | | |
Tons sold | | | 1,080 | | | 1,849 | | | (769) | | (42)% |
Coal sales realization per ton | | $ | 80.22 | | $ | 67.24 | | $ | 12.98 | | 19 % |
Total revenues | | $ | 83,333 | | $ | 125,420 | | $ | (42,087) | | (34)% |
Cost of coal sales per ton(1) | | $ | 60.75 | | $ | 54.37 | | $ | 6.38 | | 12 % |
Income from operations | | $ | 3,620 | | $ | 7,460 | | $ | (3,840) | | (51)% |
| (1) | Excludes selling, general and administrative expenses; depreciation, depletion and amortization and accretion expense. |
Powder River Basin—Income from operations decreased $1.1 million period-over-period due to increased operating costs of $13.5 million, partially offset by increased revenues of $12.4 million. As explained in the revenue section above, the increased revenues resulted from a 7% increase in coal sales realization per ton and a 4% increase in coal sales volumes. Coal sales volumes in the Powder River Basin increased 0.4 million tons period-over-period. Production and shipments increased 7% and 1% period-over-period at the Eagle Butte and Belle Ayr mines, respectively.
Operating costs increased $13.5 million for the three months ended June 30, 2009 compared to the three months ended June 30, 2008, reflecting higher period-over-period cost of sales of $14.1 million and an increase in other miscellaneous expenses of $0.1 million, partially offset by a decrease in depreciation, depletion and amortization costs of $0.7 million.
The $14.1 million increase in cost of sales referred to above resulted from an increase in cash production costs ($17.3 million) partially offset by decreased other expenses ($3.2 million). The $17.3 million period-over-period increase in cash production costs were primarily in the following areas: (a) higher supply and service costs primarily consisting of operating supply costs, repair and maintenance expenses, rent, explosives, diesel fuel and outside services ($9.9 million); (b) increased royalty costs due to mining a higher amount of coal that is subject to federal royalties and higher coal sales revenues ($2.0 million); (c) higher labor and employee
37
benefits ($2.7 million); (d) increased tax-related expenses ($2.6 million); and (e) $0.1 million increase in miscellaneous expenses. Cost of coal sales per ton increased 11% period-over-period.
Lower total depreciation, depletion and amortization costs of $0.7 million related primarily to a period-over-period $0.9 million decrease in expense associated with the amortization of coal supply agreements as shipments on a number of coal supply agreements valued in purchase accounting were completed, partially offset by increased depletion expense of $0.1 million primarily related to higher production period-over-period at the Eagle Butte mine and increased depreciation expense of $0.1 million.
Northern Appalachia—Income from operations increased by $47.1 million period-over-period due to increased revenues of $22.1 million and decreased operating costs of $25.0 million. As explained in the revenue section above, the increase in revenues resulted from an 18% period-over-period increase in coal sales realization per ton, partially offset by lower coal sales volumes. Coal sales volumes at the Cumberland mine increased 0.2 million tons, or 8% compared to the prior year period and production increased 0.2 million tons, or 11% compared to the prior year period. Coal sales volumes at the Emerald mine decreased 0.3 million tons, or 19% compared to the prior year period and production increased 0.5 million tons, or 40% compared to the prior year period.
Operating costs decreased $25.0 million for the three months ended June 30, 2009 compared to the three months ended June 30, 2008, reflecting lower period-over-period cost of sales of $30.1 million, partially offset by increases in depreciation, depletion and amortization costs of $4.6 million and increased other expenses of $0.5 million.
The $30.1 million period-over-period decrease in cost of sales referred to above was the result of decreased inventory charges to expense related to an overall lower ratio of tons sold vs. tons produced ($22.2 million), decreased purchased coal expense ($16.4 million) and decreased miscellaneous other costs ($0.2 million); partially offset by increased cash production costs ($8.7 million). The $8.7 million increase in cash production costs were primarily incurred in the following areas: (a) higher labor and employee benefit costs ($5.8 million); and (b) higher supply and service costs primarily consisting of operating supply costs from increased prices for and usage of roof bolts and miner bits, increased water handling requirements, repairs and maintenance costs due to the timing of rebuilding longwall and other mining equipment, outside services, rent, utilities and other miscellaneous operating costs ($5.6 million); partially offset by (c) decreased longwall move expenses ($1.9 million); and (d) decreased miscellaneous expenses ($0.8 million). Cost of coal sales per ton decreased by 22% period-over-period.
Higher total depreciation, depletion and amortization costs of $4.6 million related primarily to higher plant and equipment depreciation ($2.0 million) related to assets placed into service during the prior twelve months and higher depletion expense ($2.6 million) as a result of increased production at both mines.
Central Appalachia—Income from operations decreased by $3.8 million period-over-period due to decreased revenues of $42.1 million partially offset by decreased operating costs of $38.3 million. As explained in the revenue section above, the decrease in revenues resulted from a 42% decrease in coal sales volumes, partially offset by an increase in coal sales realization per ton. Coal sales volumes decreased 0.8 million tons and production decreased 0.6 million tons, or 35% in the three months ended June 30, 2009 compared to the prior year period. The decrease in coal sales volumes and production in Central Appalachia was due primarily to the idling of the Laurel Creek mining complex due to certain business conditions in late January 2009, planned decreases in production levels for the balance of the year at the Kingston and Pax mines due to the softening demand for coal and a contract dispute with a certain customer relating to their refusal to take delivery of contracted metallurgical coal shipments that was settled in the later part of the three months ended June 30, 2009.
Operating costs decreased $38.3 million for the three months ended June 30, 2009 compared to the three months ended June 30, 2008, reflecting lower period-over-period cost of sales of $34.9 million, decreases in depreciation, depletion and amortization costs of $3.5 million, partially offset by $0.1 million increase in miscellaneous costs.
The $34.9 million period-over-period decrease in cost of sales referred to above was the result of: (a) decreased cash production costs ($22.2 million); (b) decreased inventory charges to expense related to a lower ratio of tons sold vs. tons produced in the three months ended June 30, 2009 compared to the prior year period ($7.5 million); (c) decreased other expenses ($2.7 million); and (d) decreased purchased coal expense ($2.5 million). The $22.2 million decrease in cash production costs primarily related to: (a) decreased operating, supply, outside services, and transportation and loading costs ($17.0 million); (b) decreased tax-related expenses ($2.3 million); (c) decreased royalty expenses ($1.7 million); and (d) decreased labor and employee benefits expenses ($1.2 million). Cost of coal sales per ton increased by 12% period-over-period.
The $3.5 million decrease in total depreciation, depletion and amortization consisted of: (a) lower depletion expense of $3.2 million related to decreased production period-over-period; (b) lower plant and equipment depreciation of $0.7 million; partially offset by (c) a decreased credit to expense for amortization of coal supply agreements of $0.4 million primarily due to lower shipments on a number of below market coal supply agreements valued as liabilities in purchase accounting.
Other—Includes the Company’s Illinois Basin operation, including the idled Wabash mine, which ceased operations in the second quarter of 2007; expenses associated with closed mines; Dry Systems Technologies; coal trading operations; selling, general and administrative expenses not charged out to the Powder River Basin, Northern Appalachia or Central Appalachia mines and intercompany eliminations. During the three months ended June 30, 2009, the Other segment reported a loss from operations of $20.0
38
million compared to a loss from operations of $17.9 million in the three months ended June 30, 2008. The increased period-over-period loss from operations of $2.1 million in 2009 was primarily due to higher selling, general and administrative expenses.
Interest Expense, Net
| | | | | | | | | | | |
| | | Three Months Ended
June 30, | | Increase (Decrease) |
| | | 2009 | | 2008 | | Amount | | Percent |
| | | (Unaudited, in thousands) |
Interest expense-debt related | | $ | (6,960) | | $ | (9,250) | | $ | (2,290) | | (25)% |
Interest expense-amortization of deferred financing costs | | | (470) | | | (457) | | | 13 | | 3 % |
Interest expense-surety bond and letter of credit fees | | | (1,616) | | | (1,538) | | | 78 | | 5 % |
Interest expense-other | | | - | | | (121) | | | (121) | | (100)% |
| | | | | | | | | | | |
Total interest expense | | | (9,046) | | | (11,366) | | | (2,320) | | (20)% |
Interest income | | | 18 | | | 248 | | | (230) | | (93)% |
| | | | | | | | | | | |
Interest expense, net | | $ | (9,028) | | $ | (11,118) | | $ | (2,090) | | (19)% |
| | | | | | | | | | | |
Interest expense, net for the three months ended June 30, 2009 decreased compared to the three months ended June 30, 2008 primarily due to decreased interest expense related to the Senior Secured Credit Facility as a result of lower variable interest rates on the outstanding balance of our term loan. Income Tax Expense |
| | | Three Months Ended
June 30, | | Change |
| | | 2009 | | 2008 | | Amount | | Percent |
| | | (Unaudited, in thousands) |
Income tax expense | | $ | 8,841 | | $ | 1,115 | | $ | 7,726 | | 693 % |
For the three months ended June 30, 2009, the income tax expense of $8.8 million represents an effective rate of 22% on pre-tax income of $39.7 million, compared to an income tax expense of $1.1 million, or an effective rate of 46% on a pre-tax loss of $2.4 million for the three months ended June 30, 2008. The effective rate for the three months ended June 30, 2009 is based on forecasted annual results for 2009.
39
Results of Operations
Six Months Ended June 30, 2009 Compared to Six Months Ended June 30, 2008
Coal sales realization per ton sold represents revenue realized on each ton of coal sold. It is calculated by dividing coal sales revenues by tons sold.
Revenues
| | | | | | | | | | | |
| | | Six Months Ended
June 30, | | Increase (Decrease) |
| | | 2009 | | 2008 | | Amount | | Percent |
| | | (Unaudited, in thousands, except per ton data) |
Coal sales | | $ | 794,323 | | $ | 811,726 | | $ | (17,403) | | (2)% |
Other revenue | | | 15,506 | | | 12,515 | | | 2,991 | | 24 % |
| | | | | | | | | | | |
Total revenues | | $ | 809,829 | | $ | 824,241 | | $ | (14,412) | | (2)% |
| | | | | | | | | | | |
Tons sold | | | 33,609 | | | 35,444 | | | (1,835) | | (5)% |
Coal sales realization per ton | | $ | 23.63 | | $ | 22.90 | | $ | 0.73 | | 3 % |
Coal sales revenues for the six months ended June 30, 2009 decreased by $17.4 million, or 2% compared to coal sales revenues for the six months ended June 30, 2008. Coal sales realization per ton increased 3% period-over-period, while tons sold decreased by 5% period-over-period. Consolidated coal sales realization per ton for the six months ended June 30, 2009 reflected increased prices per ton sold in three of our operating segments, consisting of a 30% increase in Central Appalachia, a 20% increase in Northern Appalachia and a 6% increase in the Powder River Basin.
Coal sales revenues in Central Appalachia for the six months ended June 30, 2009 decreased $30.1 million, or 13% compared to coal sales revenues for the six months ended June 30, 2008, primarily as a result of lower coal sales volumes, partially offset by higher coal sales realization per ton. Coal sales realization per ton increased 30% period-over-period as a result of increased pricing per ton sold. Coal sales volumes decreased 1.2 million tons, or 33%, and production decreased 0.9 million tons, or 26%, in the six months ended June 30, 2009 compared to the prior year period.
Coal sales revenues in Northern Appalachia for the six months ended June 30, 2009 decreased by $15.5 million, or 5% compared to coal sales revenues for the six months ended June 30, 2008, primarily due to lower coal sales volumes, partially offset by higher coal sales realization per ton. Coal sales volumes in Northern Appalachia decreased by 1.5 million tons, or 21% period-over-period, while coal sales realization per ton increased 20% period-over-period due to increased pricing per ton sold. Coal sales volumes at the Cumberland mine decreased 0.3 million tons, or 8% compared to the prior year period, and production decreased 0.2 million tons, or 5% compared to the prior year period. Coal sales volumes at the Emerald mine decreased 1.2 million tons, or 33% compared to the prior year period, and production decreased 0.2 million tons, or 8% compared to the prior year period.
Coal sales revenues in the Powder River Basin for the six months ended June 30, 2009 increased $24.7 million, or 10%, compared to coal sales revenues for the six months ended June 30, 2008 as a result of higher coal sales volumes and higher coal sales realization per ton. Coal sales realization per ton increased 6% period-over-period as a result of increased pricing per ton sold. Coal sales volumes increased 0.9 million tons, or 4%, in the six months ended June 30, 2009 compared to the prior year period. Production and shipments increased 9% period-over-period at Eagle Butte while production and shipments at Belle Ayr was relatively unchanged period-over-period.
Coal sales revenues from our coal trading group increased $3.5 million in the six months ended June 30, 2009 compared to the six months ended June 30, 2008 as a result of increased coal sales volumes that resulted in physical delivery.
Other revenues for the six months ended June 30, 2009 increased by $3.0 million (24%) compared to the six months ended June 30, 2008. The increase was due to: (a) higher other miscellaneous revenues ($3.2 million); (b) increased royalty revenue ($1.4 million); and (c) increased revenues from the sale of equipment and filters by Dry Systems Technologies ($0.4 million); partially offset by (d) decreased coalbed methane revenues ($2.0 million).
40
Costs and Expenses
| | | | | | | | | | | |
| | | Six Months Ended
June 30, | | Increase (Decrease) |
| | | 2009 | | 2008 | | Amount | | Percent |
| | | (Unaudited, in thousands) |
Cost of coal sales (excludes depreciation, depletion and amortization) | | $ | 612,020 | | $ | 645,699 | | $ | (33,679) | | (5)% |
Selling, general and administrative expenses (excludes depreciation, depletion and amortization) | | | 38,705 | | | 37,214 | | | 1,491 | | 4 % |
Accretion on asset retirement obligations | | | 5,906 | | | 5,456 | | | 450 | | 8 % |
Depreciation, depletion and amortization | | | 101,631 | | | 104,770 | | | (3,139) | | (3)% |
Amortization of coal supply agreements | | | 147 | | | 1,322 | | | (1,175) | | (89)% |
| | | | | | | | | | | |
Total costs and expenses | | $ | 758,409 | | $ | 794,461 | | $ | (36,052) | | (5)% |
| | | | | | | | | | | |
Cost of coal sales. Cost of coal sales decreased $33.7 million for the six months ended June 30, 2009 compared to the six months ended June 30, 2008, primarily due to: (a) decreased inventory charges to expense related to an overall lower ratio of tons sold vs. tons produced in the six months ended June 30, 2009 compared to the prior year period ($40.4 million); (b) decreased purchased coal costs as a result of lower tons purchased for physical delivery ($13.5 million); (c) decreased transportation and loading expenses ($11.0 million); (d) decreased longwall move expenses ($7.1 million); and (e) decreased other miscellaneous expenses ($0.6 million); partially offset by (f) increased labor and benefit costs ($20.4 million); (g) higher repair, maintenance and operating supply costs, including diesel fuel ($14.2 million); and (h) increased royalty expenses ($4.3 million). Cost of coal sales per ton was $18.21 for the six months ended June 30, 2009 compared to $18.22 per ton for the six months ended June 30, 2008.
Selling, general and administrative expenses. Selling, general and administrative expenses for the six months ended June 30, 2009 increased $1.5 million compared to the six months ended June 30, 2008. Period-over-period increases were due to: (a) merger-related expenses ($4.8 million); and (b) miscellaneous corporate overhead expenses ($0.7 million); partially offset by (c) lower employee compensation and benefit related expenses due primarily to lower stock-based compensation ($3.2 million); and (d) lower consulting fees ($0.8 million).
Accretion on asset retirement obligations.Accretion on asset retirement obligations is a result of accounting for asset retirement obligations under SFAS No. 143,Accounting for Asset Retirement Obligations. Accretion represents the increase in the asset retirement liability to reflect the change in the liability for the passage of time because the initial liability is recorded at present value. Higher accretion expense in 2009 was due to increased asset retirement obligation estimates for the comparable periods.
Depreciation, depletion and amortization. Depreciation, depletion and amortization includes depreciation of plant and equipment, cost depletion of amounts assigned to owned and leased mineral rights and amortization of mine development costs, internal use software and leasehold improvements. Depreciation, depletion and amortization expense decreased $3.1 million for the six months ended June 30, 2009 compared to the six months ended June 30, 2008, primarily due to lower cost depletion partially offset by higher depreciation and amortization. Cost depletion decreased by $5.2 million due to decreased production in Northern and Central Appalachia period-over-period. Depreciation and amortization increased by $2.1 million in the six months ended June 30, 2009 compared to the prior year period mainly due to depreciation and amortization associated with capital additions to plant, equipment and mine development costs during the twelve months ended June 30, 2009.
Coal supply agreement amortization. Application of purchase accounting in 2004 resulted in the recognition of a significant liability for below market priced coal supply agreements as well as a significant asset for above market priced coal supply agreements, both in relation to market prices at the date of acquisition of mining assets by the Company in 2004. Coal supply agreement amortization expense decreased $1.2 million for the six months ended June 30, 2009 compared to the six months ended June 30, 2008, primarily due to a decrease in amortization of the asset for above market coal supply agreements of $2.5 million that was partially offset by a decrease in the credit to amortization expense from below market liability contracts of $1.3 million. As shipments on coal supply agreements valued in purchase accounting are completed, the period-over-period impact of the amortization on both the asset and liability balances will continue to diminish until approximately 2010 when shipments associated with these coal supply agreements are estimated to be complete.
41
| | | | | | | | | | | |
| | | Six Months Ended
June 30, | | Increase (Decrease) |
| | | 2009 | | 2008 | | Tons/$ | | Percent |
| | | (Unaudited, in thousands, except coal sales realization per ton and cost of coal sales per ton) |
Powder River Basin | | | | | | | | | | | |
Tons sold | | | 25,067 | | | 24,178 | | | 889 | | 4 % |
Coal sales realization per ton | | $ | 10.70 | | $ | 10.07 | | $ | 0.63 | | 6 % |
Total revenues | | $ | 270,394 | | $ | 245,321 | | $ | 25,073 | | 10 % |
Cost of coal sales per ton(1) | | $ | 8.85 | | $ | 8.01 | | $ | 0.84 | | 10 % |
Income from operations | | $ | 17,000 | | $ | 19,120 | | $ | (2,120) | | (11)% |
| | | | |
Northern Appalachia | | | | | | | | | | | |
Tons sold | | | 5,977 | | | 7,522 | | | (1,545) | | (21)% |
Coal sales realization per ton | | $ | 52.83 | | $ | 44.04 | | $ | 8.79 | | 20 % |
Total revenues | | $ | 322,305 | | $ | 333,726 | | $ | (11,421) | | (3)% |
Cost of coal sales per ton(1) | | $ | 34.00 | | $ | 31.90 | | $ | 2.10 | | 7 % |
Income from operations | | $ | 66,077 | | $ | 46,910 | | $ | 19,167 | | 41 % |
| | | | |
Central Appalachia | | | | | | | | | | | |
Tons sold | | | 2,394 | | | 3,599 | | | (1,205) | | (33)% |
Coal sales realization per ton | | $ | 81.77 | | $ | 62.77 | | $ | 19.00 | | 30 % |
Total revenues | | $ | 193,611 | | $ | 228,110 | | $ | (34,499) | | (15)% |
Cost of coal sales per ton(1) | | $ | 65.65 | | $ | 52.36 | | $ | 13.29 | | 25 % |
Income from operations | | $ | 7,677 | | $ | 4,759 | | $ | 2,918 | | 61 % |
| (1) | Excludes selling, general and administrative expenses; depreciation, depletion and amortization and accretion expense. |
Powder River Basin—Income from operations decreased $2.1 million period-over-period due to increased operating costs of $27.2 million, partially offset by increased revenues of $25.1 million. As explained in the revenue section above, the increase in revenues resulted from a 6% increase in coal sales realization per ton and a 4% increase in coal sales volumes. Coal sales volumes in the Powder River Basin increased 0.9 million tons period-over-period. Production and shipments increased 9% period-over-period at Eagle Butte while production and shipments at Belle Ayr was relatively unchanged period-over-period.
Operating costs increased $27.2 million for the six months ended June 30, 2009 compared to the six months ended June 30, 2008, reflecting higher period-over-period cost of sales of $28.2 million and an increase in other miscellaneous expenses of $0.3 million, partially offset by a decrease in depreciation, depletion and amortization costs of $1.3 million.
The $28.2 million increase in cost of sales referred to above resulted from an increase in cash production costs ($32.6 million) partially offset by decreased other expenses ($4.4 million). The $32.6 million period-over-period increase in cash production costs were primarily in the following areas: (a) higher supply and service costs primarily consisting of operating supply costs, repair and maintenance expenses, rent, explosives, diesel fuel and outside services ($16.2 million); (b) increased tax-related expenses ($5.8 million); (c) higher labor and employee benefits ($5.5 million); and (d) increased royalty costs due to mining a higher amount of coal that is subject to federal royalties and higher coal sales revenues ($5.1 million). Cost of coal sales per ton increased 10% period-over-period.
Lower total depreciation, depletion and amortization costs of $1.3 million related primarily to a period-over-period $1.6 million decrease in expense associated with the amortization of coal supply agreements as shipments on a number of coal supply agreements valued in purchase accounting were completed, partially offset by increased depletion expense ($0.3 million) related to higher production period-over-period at the Eagle Butte mine.
Northern Appalachia—Income from operations increased by $19.2 million period-over-period due to decreased operating costs of $30.6 million, partially offset by decreased revenues of $11.4 million. As explained in the revenue section above, the decrease in revenues resulted from a 21% period-over-period decrease in tons sold. Coal sales volumes at the Cumberland mine decreased 0.3 million tons, or 8% compared to the prior year period, and production decreased 0.2 million tons, or 5% compared to the prior year period. Coal sales volumes at the Emerald mine decreased 1.2 million tons, or 33% compared to the prior year period, and production decreased 0.2 million tons, or 8% compared to the prior year period.
42
Operating costs decreased $30.6 million for the six months ended June 30, 2009 compared to the six months ended June 30, 2008, reflecting lower period-over-period cost of sales of $36.7 million, partially offset by increases in depreciation, depletion and amortization costs of $5.2 million and increased other expenses of $0.9 million.
The $36.7 million period-over-period decrease in cost of sales referred to above was the result of decreased purchased coal expense ($29.3 million); decreased inventory charges to expense related to an overall lower ratio of tons sold vs. tons produced ($22.3 million); and decreased other expenses ($0.3 million); partially offset by increased cash production costs ($15.2 million). The $15.2 million increase in cash production costs were primarily incurred in the following areas: (a) higher supply and service costs primarily consisting of operating supply costs from increased prices for and usage of roof bolts and miner bits, increased water handling requirements, repairs and maintenance costs due to the timing of rebuilding longwall and other mining equipment, outside services, rent, utilities and other miscellaneous operating costs ($17.0 million); and (b) higher labor and employee benefit costs ($10.3 million); partially offset by (c) decreased longwall move expenses ($7.1 million); (d) decreased tax-related expenses ($0.6 million); (e) decreased transportation and loading expenses ($3.0 million); and (f) decreased miscellaneous expenses ($1.4 million). Cost of coal sales per ton increased by 7% period-over-period.
Higher total depreciation, depletion and amortization costs of $5.2 million related primarily to: (a) higher plant and equipment depreciation ($5.0 million); (b) a period-over-period decrease in the credit to expense associated with the amortization of below market liability coal supply agreements valued in purchase accounting ($0.1 million); and (c) increased depletion expense ($0.1 million).
Central Appalachia—Income from operations increased by $2.9 million period-over-period due to decreased operating costs of $37.4 million and decreased revenues of $34.5 million. As explained in the revenue section above, the decrease in revenues resulted from a decrease in coal sales volumes, partially offset by a 30% increase in coal sales realization per ton. Coal sales volumes decreased 1.2 million tons, or 33% and production decreased 0.9 million tons, or 26% in the six months ended June 30, 2009 compared to the prior year period. The decrease in coal sales volumes and production in Central Appalachia was due primarily to the idling of the Laurel Creek mining complex due to certain business conditions in late January 2009, planned decreases in production levels for the balance of the year at the Kingston and Pax mines due to softening demand for coal and a contract dispute with a certain customer relating to their refusal to take delivery of contracted metallurgical coal shipments that was settled in the later part of the three months ended June 30, 2009.
Operating costs decreased $37.4 million for the six months ended June 30, 2009 compared to the six months ended June 30, 2008, reflecting lower period-over-period cost of sales of $31.2 million; decreases in depreciation, depletion and amortization costs of $6.5 million; partially offset by increased miscellaneous expenses of $0.3 million.
The $31.2 million period-over-period decrease in cost of sales referred to above was the result of: (a) decreased cash production costs ($22.3 million); (b) decreased inventory charges to expense related to a lower ratio of tons sold vs. tons produced in the six months ended June 30, 2009 compared to the prior year period ($18.0 million); partially offset by (c) increased purchased coal expense ($8.6 million); and (d) increased other expenses ($0.5 million). The $22.3 million decrease in cash production costs primarily related to: (a) decreased operating, supply, outside services, and transportation and loading costs ($22.0 million); (b) decreased royalty expenses ($0.9 million); (c) decreased tax-related expenses ($2.0 million); and (d) decreased miscellaneous expenses ($1.8 million); partially offset by (d) increased labor and employee benefits ($4.4 million). Cost of coal sales per ton increased by 25% period-over-period.
The $6.5 million decrease in total depreciation, depletion and amortization consisted of: (a) lower depletion expense of $5.6 million related to decreased production period-over-period and (b) lower plant and equipment depreciation of $2.0 million; partially offset by (c) a lower credit to expense for amortization of coal supply agreements of $1.1 million primarily due to lower shipments on a number of below market coal supply agreements valued as liabilities in purchase accounting.
Other—Includes the Company’s Illinois Basin operation, including the idled Wabash mine, which ceased operations in the second quarter of 2007; expenses associated with closed mines; Dry Systems Technologies; coal trading operations; selling, general and administrative expenses not charged out to the Powder River Basin, Northern Appalachia or Central Appalachia mines and intercompany eliminations. During the six months ended June 30, 2009, the Other segment reported a loss from operations of $39.3 million compared to a loss from operations of $41.0 million in the six months ended June 30, 2008. The decreased period-over-period loss from operations of $1.7 million was primarily due to increased revenues from our coal trading operations and Dry Systems Technologies and lower depreciation and amortization expenses.
43
Interest Expense, Net
| | | | | | | | | | | |
| | | Six Months Ended
June 30, | | Increase (Decrease) |
| | | 2009 | | 2008 | | Amount | | Percent |
| | | (Unaudited, in thousands) |
Interest expense-debt related | | $ | (13,918) | | $ | (19,870) | | $ | (5,952) | | (30)% |
Interest expense-amortization of deferred financing costs | | | (937) | | | (911) | | | 26 | | 3 % |
Interest expense-surety bond and letter of credit fees | | | (3,263) | | | (3,175) | | | 88 | | 3 % |
Interest expense-other | | | (78) | | | (324) | | | (246) | | (76)% |
| | | | | | | | | | | |
Total interest expense | | | (18,196) | | | (24,280) | | | (6,084) | | (25)% |
Interest income | | | 165 | | | 691 | | | (526) | | (76)% |
| | | | | | | | | | | |
Interest expense, net | | $ | (18,031) | | $ | (23,589) | | $ | (5,558) | | (24)% |
| | | | | | | | | | | |
Interest expense, net for the six months ended June 30, 2009 decreased compared to the six months ended June 30, 2008 primarily due to decreased interest expense related to the Senior Secured Credit Facility as a result of lower variable interest rates on the outstanding balance of our term loan.
Income Tax Expense
| | | | | | | | | | | |
| | | Six Months Ended
June 30, | | Increase |
| | | 2009 | | 2008 | | Amount | | Percent |
| | | (Unaudited, in thousands) |
Income tax expense | | $ | 6,738 | | $ | 3,382 | | $ | 3,356 | | 99 % |
For the six months ended June 30, 2009, the income tax expense of $6.7 million represents an effective rate of 20% on the pre-tax income of $33.4 million, compared to an income tax expense of $3.4 million, or an effective rate of 55% on pre-tax income of $6.2 million for the six months ended June 30, 2008. The effective rate for the six months ended June 30, 2009 is comprised of two elements: (a) a $7.3 million expense or 22% effective rate based on forecasted annual income results for 2009; offset by (b) a discrete tax benefit of $0.6 million or 2% primarily related to state bonus depreciation estimates and adjustments related to prior year tax return amendments. Absent the discrete items, the forecasted annual effective rate of 22% for 2009 increased from the 2008 effective rate of 7% due primarily to the expected impact of permanent differences for the excess depletion deduction and a change in the estimated impact of valuation allowances required between years on AMT credits due to the forecasted earnings increase between 2008 and 2009. Changes to the effective rate during interim periods occur as the Company reconsiders its forecast of full-year pretax income based upon its most recent experience. These changes in estimates are reflected in the effective tax rate in the period in which the information becomes available to the Company.
44
Expected Coal Shipments
For 2009 through 2011, the Company expects average per ton sales realization, coal shipments and the percent of committed and priced tons to be as follows:
| | | | | | |
| | | 2009 | | 2010 | | 2011 |
Average per Ton Sales Realization on Committed and Priced | | | | | | |
Coal Shipments1 | | | | | | |
West | | $10.50 | | $11.14 | | $12.28 |
East2 | | $62.41 | | $72.21 | | $80.28 |
Coal Shipments (MM Tons)3 | | 68.5 - 71.5 | | 70.0 - 74.0 | | 70.0 - 74.0 |
West | | 52.0 - 54.0 | | 52.0 - 55.0 | | 52.0 - 55.0 |
East | | 16.5 - 17.5 | | 18.0 - 19.0 | | 18.0 - 19.0 |
Committed and Priced (%)2,4 | | 100% | | 81% | | 53% |
West | | 100% | | 91% | | 61% |
East | | 98% | | 53% | | 29% |
| (1) | Based on committed and priced coal shipments as of July 16, 2009. |
| (2) | In 2010, committed and priced Eastern tons exclude approximately 1.0 million tons of steam coal subject to collared pricing with an average pricing range of $75 to $84 per ton, as well as legacy contracts covering approximately 0.5 million tons of steam coal subject to indexed pricing anticipated to range from $60 to $90 per ton. |
| (3) | Coal shipments for the East and consolidated coal shipments exclude traded coal, and include approximately 0.5 million tons of purchased coal in each of 2009, 2010 and 2011. |
| (4) | As of July 16, 2009, compared to the midpoint of shipment guidance range. |
As of July 16, 2009, we had commitments for approximately 100% of our planned 2009 production. As of July 16, 2009, uncommitted and unpriced tonnage was 19%, and 47% of planned shipments in 2010, and 2011, respectively.
Based on its committed and priced planned shipments as of July 16, 2009, the Company expects its committed and priced tonnage from its Eastern mines, encompassing Northern Appalachia and Central Appalachia, to realize $62.41, $72.21 and $80.28 per ton in 2009, 2010 and 2011, respectively. The Company also expects its committed and priced tonnage from the Powder River Basin to realize $10.50, $11.14 and $12.28 per ton in 2009, 2010 and 2011, respectively. These expected per ton average realizations include forecasted sulfur dioxide and btu premiums based on contract terms, projected coal qualities and historical realized premiums.
Liquidity and Capital Resources
Sources and Uses of Cash
Our primary sources of cash have been from sales of our coal production and, to a much lesser extent, sales of purchased coal to customers, and miscellaneous revenues.
Our primary uses of cash have been our cash production costs, capital expenditures, interest costs, income tax payments, cash payments for employee benefit obligations such as defined benefit pensions and retiree health care benefits, cash outlays related to post mining asset retirement obligations and support of working capital requirements. Our ability to service debt and acquire new productive assets for use in our operations has been and will be dependent upon our ability to generate cash from our operations. We generally fund all of our capital expenditure requirements with cash generated from operations. Historically, we have not engaged in financing assets such as through operating leases.
The following is a summary of cash provided by or used in each of the indicated categories of activities during the six months ended June 30, 2009 and 2008, respectively.
45
| | | | | | | | | | | |
| | | Six Months Ended
June 30, | | Increase (Decrease) |
| | | 2009 | | 2008 | | Amount | | Percent |
| | | (Unaudited, in thousands) | | | | |
Cash provided by (used in): | | | | | | | | | | | |
Operating activities | | $ | 124,361 | | $ | 131,781 | | $ | (7,420) | | (6)% |
Investing activities | | | (129,936) | | | (112,515) | | | (17,421) | | (15)% |
Financing activities-proceeds from stock option exercises and excess tax benefit from stock-based awards | | | - | | | 8,978 | | | (8,978) | | (100)% |
Financing activities-dividends on common stock | | | (4,467) | | | (4,530) | | | 63 | | 1 % |
Financing activities-other | | | (1,388) | | | (2,073) | | | 685 | | 33 % |
| | | | | | | | | | | |
Net (decrease) increase in cash and cash equivalents | | $ | (11,430) | | $ | 21,641 | | $ | (33,071) | | (153)% |
| | | | | | | | | | | |
Cash provided by operating activities decreased $7.4 million for the six months ended June 30, 2009 compared to the six months ended June 30, 2008, primarily due to a $22.5 million decrease in cash flows from working capital changes and a $9.4 million decrease in non-cash add-backs to net income, partially offset by a $24.5 million increase in net income period-over-period. Working capital changes consist primarily of trade accounts receivable, inventory, prepaid expenses and other current and non-current assets, trade accounts payable, accrued expenses and other current and non-current liabilities.
Cash used in investing activities increased $17.4 million in the six months ended June 30, 2009 compared to the six months ended June 30, 2008, due primarily to: a $27.5 million year-over-year increase in capital expenditures, net of proceeds from disposals, partially offset by $10.1 million in purchases of equity-method investments during 2008. Capital expenditures in the six months ended June 30, 2009 totaled $94.0 million which consisted of (a) $68.3 million for plant and equipment costs; (b) $14.0 million for mine development costs; (c) $8.5 million for coalbed methane equipment and development costs; and (d) $3.2 million for land acquisition costs. Capital expenditures in the six months ended June 30, 2008 totaled $66.7 million which consisted of (a) $48.6 million for plant and equipment costs; (b) $8.9 million for mine development costs; (c) $5.5 million for land acquisition costs; and (d) $3.7 million for coalbed methane equipment and development costs.
Cash used in financing activities of $5.9 million during the six months ended June 30, 2009 consisted of (a) $1.4 million for the repurchase of common shares withheld from employees to satisfy employees’ minimum statutory tax withholding upon vesting of restricted stock units and (b) payment of cash dividends of $4.5 million ($0.05 per share paid in March and June 2009). Cash provided by financing activities of $2.4 million during the six months ended June 30, 2008 consisted of (a) $2.1 million for the repurchase of common shares withheld from employees to satisfy employees’ minimum statutory tax withholding upon vesting of restricted stock units; (b) payment of cash dividends of $4.5 million ($0.05 per share paid in March and June 2008); and (c) cash proceeds from the exercise of nonqualified stock options and excess tax benefits from stock-based awards ($9.0 million).
Liquidity and Long-Term Debt
Our primary source of liquidity will continue to be cash from sales of our coal production and to a much lesser extent, sales of purchased coal to customers. We have borrowing availability under our revolving credit facility, subject to certain conditions.
Based on our current levels of operations, we believe that remaining cash on hand, cash flow from operations and available borrowings under the revolving credit portion of our Senior Secured Credit Facility will enable us to meet our working capital, capital expenditure, debt service and other funding requirements for at least the next twelve months.
As of June 30, 2009, we have outstanding $599.8 million in aggregate indebtedness, with an additional $323.0 million of available borrowings under our revolving credit facility after giving effect to $177.0 million of letters of credit outstanding as of June 30, 2009. Our future liquidity requirements will be significant due to debt service requirements and projected capital expenditures. Our ability to service our debt (interest and principal), acquire new productive assets or businesses, develop new mines and expand or enhance existing operations is dependent upon our ability to continue to generate cash in excess of our anticipated uses of cash. We expect to service our debt, pay dividends and fund most of our capital expenditure requirements with cash generated from operations.
On July 31, 2009, following the Merger and upon satisfaction of the requisite conditions, an amendment dated as of May 22, 2009 (“Amendment No. 1”) to the Senior Secured Credit Facility (“Credit Agreement”), dated as of July 30, 2004, became effective. Under the Credit Agreement, Foundation had a $500.0 million revolving credit line and a $335.0 million term loan with $301.5 million outstanding as of June 30, 2009. Repayment of outstanding indebtedness owed under the credit facility includes quarterly amortization of the term loan beginning in the third quarter of 2009 with both the term loan and revolving credit line maturing July 7, 2011. Pursuant to Amendment No. 1, New Alpha and certain of its subsidiaries became obligated as guarantors under the Credit
46
Agreement. Amendment No. 1 also provides for an increase in the interest rate to 3.25 percentage points over the London interbank offered rate (“LIBOR”) from 1.25 percentage points over LIBOR, subject, in the case of revolving loans, to adjustment based on leverage ratios. Upon Amendment No. 1 becoming effective, limitations on annual capital expenditure amounts were eliminated and the amount of incremental credit facilities that may be incurred under the Credit Agreement were increased from $100.0 million to $200.0 million of which $150.0 million was utilized to increase the revolving credit line to $650.0 million.
On July 30, 2004, Foundation’s subsidiary, Foundation PA Coal Company, LLC (“Foundation PA”), issued $300.0 million aggregate principal amount of 7.25% Notes that mature on August 1, 2014 (the “2014 Notes”). As of June 30, 2009 $298.3 million remained outstanding. The 2014 Notes were guaranteed on a senior unsecured basis by Foundation Coal Corporation (“FCC”), an indirect parent of Foundation PA, and certain of its subsidiaries. As a result of the Merger, Foundation PA and FCC became subsidiaries of New Alpha.
On August 1, 2009, in connection with the Merger, Foundation PA, New Alpha and certain of its subsidiaries (which were also former subsidiaries of Old Alpha) (the “New Subsidiaries”) executed a supplemental indenture (the “Third Supplemental Indenture”), which supplements the indenture dated as of July 30, 2004 as supplemented, governing the 2014 Notes.
Pursuant to the Third Supplemental Indenture, New Alpha assumed the obligations of FCC in respect of the 2014 Notes and, along with the New Subsidiaries, became obligated as guarantors on the indenture governing the 2014 Notes. On August 1, 2009, in connection with the Merger, FCC merged with and into New Alpha.
Our liquidity has historically been impacted by events initiated by the Company and will be impacted by future planned and possible unplanned events. Examples of known trends, planned and completed events which required liquidity include, but are not limited to: (a) the voluntarily prepayment during 2006 and 2007 of $33.5 million of the Company’s outstanding principal balance on the term loan facility for which scheduled payments were due in periods from 2007 to 2009; the Company is required to resume quarterly principal payments of $8.4 million beginning September 2009; (b) paying quarterly dividends to stockholders and the expectation that our Board may continue to declare quarterly dividends in future periods; (c) we have recently increased our reserve position by obtaining mining rights to federal coal reserves adjoining our current operations in Wyoming through the Lease By Application (“LBA”) process and plan to attempt to do so in the future; (d) the repurchase of common shares in accordance with our established program; and (e) capital expenditures made for the purpose of both sustaining and expanding operations.
Near-term, 2009 liquidity requirements will be impacted by planned capital expenditures which include: (a) capital expenditures during calendar year 2009 of which $150.0 million to $165.0 million is to maintain production and replace mining equipment; (b) $40.0 million to $45.0 million is expected to be directed toward improvements in productivity and selective expansions of production; and (c) we expect to contribute approximately $30.0 million to our defined benefit retirement plans and to pay approximately $26.0 million of retiree health care benefits, gross of Medicare Part D subsidies, in calendar year 2009. In the foreseeable future, we expect to require similar levels of liquidity to fund LBA installment payments, capital expenditures, defined benefit plan obligations, other contractual commitments, and operational and general working capital requirements.
With respect to global economic events, there continues to be uncertainty in the financial markets and this uncertainty brings potential liquidity risks to the Company. Such risks include additional declines in our stock value, less availability and higher costs of additional credit, potential counterparty defaults and further commercial bank failures. Although the majority of the financial institutions in our bank credit facility appear to be strong, there are no assurances of their continued existence. However, we have no current indication that any such uncertainties would impact our current credit facility. The credit worthiness of our customers is constantly monitored by the Company. We believe that our current group of customers are sound and represent no abnormal business risk.
We sponsor pension plans in the United States for salaried and non-union hourly employees. For these plans, the Pension Protection Act of 2006 (“Pension Act”) requires a funding target of 100% of the present value of accrued benefits. The Pension Act includes a funding target phase-in provision that establishes a funding target of 92% in 2008, 94% in 2009, 96% in 2010 and 100% thereafter for defined benefit pension plans. Generally, any such plan with a funding ratio of less than 80% will be deemed at risk and will be subject to additional funding requirements under the Pension Act. Annual funding contributions to the plans are made as recommended by consulting actuaries based upon the ERISA funding standards. Plan assets consist of equity and fixed income funds, real estate funds, private equity funds and alternative investment funds. The Company is required to measure plan assets and benefit obligations as of the date of the Company’s fiscal year-end statement of financial position and recognize the overfunded or underfunded status of a defined benefit pension and other postretirement plans (other than a multi-employer plan) as an asset or liability in its statement of financial position and recognize changes in that funded status in the year in which the changes occur through other comprehensive (loss) income. The recent economic environment and continued uncertainty in the equity markets have caused investment income and the value of investment assets held in our pension trust to decline. These investment assets have not yet recovered from the loss in value experienced in the fourth fiscal quarter of 2008. As a result, we may be required to increase the amount of cash contributions into the pension trust in order to comply with the funding requirements of the Pension Act. We currently expect to make contributions in 2009 of approximately $30.0 million to maintain at least an 80% funding ratio.
47
Financial Swaps
The Company is subject to the risk of price volatility for certain of the materials and supplies used in production, such as diesel fuel and explosives. As a part of its risk management strategy, the Company enters into swap agreements with financial institutions to mitigate the risk of price volatility for both diesel fuel and explosives. At June 30, 2009, liabilities related to the fair value of swaps that are expected to settle in the next twelve months were $11.3 million.
Other
As a regular part of our business, we review opportunities for, and engage in discussions and negotiations concerning, the acquisition of coal mining assets, including LBA bids to procure federal coal, and acquisitions of, or combinations with, coal mining companies. When we believe that these opportunities are consistent with our growth plans and our acquisition criteria, we will make bids or proposals and/or enter into letters of intent and other similar agreements, which may be binding or nonbinding, that are customarily subject to a variety of conditions and usually permit us to terminate the discussions and any related agreements if, among other things, we are not satisfied with the results of our due diligence investigation. Any acquisition opportunities we pursue could materially affect our liquidity and capital resources and may require us to incur indebtedness, seek equity capital or both. There can be no assurance that such additional indebtedness and/or equity capital will be available on terms acceptable to us, if at all.
On February 20, 2008, an affiliate of the Company successfully bid on a new federal coal lease which contains an estimated 224.0 million tons of proven and probable coal reserves. The lease bonus bid was $180.5 million to be paid in five equal annual installments of $36.1 million. The first installment was paid February 2008 and the second installment was paid May 2009. The lease became effective on May 1, 2008. The three remaining annual installments of $36.1 million each are due on the anniversary dates of the lease.
On July 18, 2006, the Board of Directors authorized a stock repurchase program (the “Repurchase Program”), authorizing the Company to repurchase shares of its common stock. The Company may repurchase its common stock from time to time as determined by authorized officers of the Company. In September 2008, the Board of Directors authorized a $100.0 million increase to the Repurchase Program, up to an aggregate amount of $200.0 million. During the six months ended June 30, 2009 and 2008, the Company did not repurchase any shares pursuant to the Repurchase Program. At June 30, 2009, there was $113.6 million available for future repurchases under the Repurchase Program. Of the amount available for future repurchases, $100.0 million is subject to our meeting a maximum leverage ratio test of pro-forma net debt to adjusted earnings before interest, taxes, depreciation and amortization (“EBITDA”) of less than 2.25 to 1.00 under our Senior Secured Credit Facility. The ratio test must be met at the time of each applicable share repurchase.
Covenant Compliance
Our indirect wholly owned subsidiary, FCC is required to comply with certain financial covenants which are considered material terms of the Senior Secured Credit Facility and the indenture governing FCC’s outstanding 7.25% Senior Notes. Information about the financial covenants is material to an investor’s understanding of FCC’s financial condition and liquidity. The breach of covenants in the Senior Secured Credit Facility that are tied to ratios based on Adjusted EBITDA, as defined below, could result in a default under the Senior Secured Credit Facility and the lenders could elect to declare all amounts borrowed due and payable. Any such acceleration would also result in a default under our indenture. Additionally, under the Senior Secured Credit Facility and indenture, FCC’s ability to engage in activities such as incurring additional indebtedness, making investments and paying dividends is also tied to ratios based on Adjusted EBITDA.
48
Covenants and required levels as defined by the July 7, 2006 Senior Secured Credit Facility and the indenture governing the outstanding 7.25% Senior Notes are:
| | | | |
| | | Actual
Covenant Levels;
Period Ended
June 30, 2009 | | Required
Covenant Levels;
January 1, 2009
and Thereafter |
Senior Secured Credit Facility | | | | |
Minimum Adjusted EBITDA to cash interest ratio | | 8.6x | | 2.5x |
Maximum total debt less unrestricted cash to Adjusted EBITDA ratio | | 1.7x | | 3.5x |
Indenture | | | | |
Minimum Adjusted EBITDA to fixed charge ratio required to incur additional debt pursuant to ratio provisions | | 8.6x | | 2.0x |
Adjusted EBITDA is defined as EBITDA further adjusted to exclude non-recurring items, non-cash items and other adjustments permitted in calculating covenant compliance under the indenture and the Senior Secured Credit Facility. EBITDA, a measure used by management to evaluate its ongoing operations for internal planning and forecasting purposes, is defined as net income (loss) from operations plus interest expense, net of interest income, income tax expense (benefit), depreciation and amortization and charges for early extinguishment of debt. EBITDA is not a financial measure recognized under United States generally accepted accounting principles and does not purport to be an alternative to net income as a measure of operating performance or to cash flows from operating activities as a measure of liquidity. The amounts shown for EBITDA as presented may differ from amounts calculated and may not be comparable to other similarly titled measures used by other companies.
As of June 30, 2009, FCC was in compliance with all required financial covenants of the Senior Secured Credit Facility. The calculations shown below are based on the results of operations of FCC in accordance with the Senior Secured Credit Facility.
49
| | | | | | | | | | | | |
| | | | | Deduct: | | Add: | | |
| | | | |
| | | Twelve Months
Ended
December 31,
2008 | | Six Months
Ended
June 30,
2008 | | Six Months
Ended
June 30,
2009 | | Twelve Months
Ended
June 30,
2009 |
EBITDA(1) | | $ | 280,104 | | $ | 135,749 | | $ | 158,859 | | $ | 303,214 |
Non-cash charges(2) | | | 35,970 | | | 15,103 | | | 517 | | | 21,384 |
Extraordinary or non-recurring items(3) | | | 1,713 | | | 773 | | | 1,153 | | | 2,093 |
Other adjustments(4) | | | 1,272 | | | 486 | | | 833 | | | 1,619 |
| | | | | | | | | | | | |
Adjusted EBITDA | | $ | 319,059 | | $ | 152,111 | | $ | 161,362 | | $ | 328,310 |
| | | | | | | | | | | | |
| | | | |
(1) EBITDA is calculated in the table below: | | | | | | | | |
| | | | |
| | | | | Deduct: | | Add: | | |
| | | | |
| | | Twelve Months
Ended
December 31,
2008 | | Six Months
Ended
June 30,
2008 | | Six Months
Ended
June 30,
2009 | | Twelve Months
Ended
June 30,
2009 |
Net income | | $ | 13,434 | | $ | 2,565 | | $ | 31,211 | | $ | 42,080 |
Interest expense | | | 46,960 | | | 24,280 | | | 18,196 | | | 40,876 |
Interest income | | | (992) | | | (691) | | | (165) | | | (466) |
Income tax expense | | | 7,168 | | | 3,503 | | | 7,839 | | | 11,504 |
Depreciation, depletion and amortization | | | 212,166 | | | 104,770 | | | 101,631 | | | 209,027 |
Amortization of coal supply agreements | | | 1,368 | | | 1,322 | | | 147 | | | 193 |
| | | | | | | | | | | | |
EBITDA | | $ | 280,104 | | $ | 135,749 | | $ | 158,859 | | $ | 303,214 |
| | | | | | | | | | | | |
|
(2) We are required to adjust EBITDA, as defined above, for the following non-cash charges: |
| | | | |
| | | | | Deduct: | | Add: | | |
| | | | |
| | | Twelve Months
Ended
December 31,
2008 | | Six Months
Ended
June 30,
2008 | | Six Months
Ended
June 30,
2009 | | Twelve Months
Ended
June 30,
2009 |
Accretion on asset retirement obligations | | $ | 11,429 | | $ | 5,456 | | $ | 5,906 | | $ | 11,879 |
Stock-based compensation expense(a) | | | 13,043 | | | 7,776 | | | 3,332 | | | 8,599 |
Write-down of long-lived assets | | | 292 | | | - | | | - | | | 292 |
Other(b) | | | 11,206 | | | 1,871 | | | (8,721) | | | 614 |
| | | | | | | | | | | | |
Total | | $ | 35,970 | | $ | 15,103 | | $ | 517 | | $ | 21,384 |
| | | | | | | | | | | | |
| | (a) | Amount represents compensation expense attributable to restricted stock units and stock options. |
| | (b) | For the twelve months ended June 30, 2009, amount primarily represents noncash charges related to our derivative instruments. |
50
| (3) | We are also required by the credit agreement to adjust EBITDA, as defined above, for the following extraordinary or non-recurring expense: |
| | | | | | | | | | | | |
| | | | | Deduct: | | Add: | | |
| | | | |
| | | Twelve Months
Ended
December 31,
2008 | | Six Months
Ended
June 30,
2008 | | Six Months
Ended
June 30,
2009 | | Twelve Months
Ended
June 30,
2009 |
Litigation/arbitration/contract settlements, net(a) | | $ | 2,358 | | $ | 790 | | $ | (344) | | $ | 1,224 |
Other | | | (645) | | | (17) | | | 1,497 | | | 869 |
| | | | | | | | | | | | |
Total | | $ | 1,713 | | $ | 773 | | $ | 1,153 | | $ | 2,093 |
| | | | | | | | | | | | |
(a) For the twelve months ended December 31, 2008, amount primarily represents a litigation settlement of $1.5 million.
| (4) | We are also required to make adjustments to EBITDA for items such as incremental insurance costs and franchise taxes not included in income tax expense. |
Cash interest for the twelve months ended June 30, 2009 is calculated as follows:
| | | |
| | | (Unaudited)
(In thousands) |
Pro forma cash interest expense for the twelve months ended December 31, 2008(a) | | $ | 43,690 |
Add: Interest expense for the six months ended June 30, 2009 | | | 18,196 |
Less: Amortization of deferred financing costs for the six months ended June 30, 2009 | | | 937 |
Less: Cash interest income for the six months ended June 30, 2009 | | | 165 |
Less: Other non-cash interest expense for the six months ended June 30, 2009 | | | 64 |
Less: Pro forma cash interest expense for the six months ended June 30, 2008(a) | | | 22,357 |
| | | |
| | $ | 38,363 |
| | | |
(a) As defined by FCC’s bank credit agreement.
In future periods, adjustments to EBITDA that could be used to calculate compliance with the debt covenants are: (a) accretion on asset retirement obligations; (b) certain non-cash expenses or charges arising as a result of the application of purchase accounting in acquisitions; (c) business optimization expenses or other restructuring charges; (d) non-cash impairment charges resulting from the application of SFAS No. 142,Goodwill and Other Intangible Assets, or SFAS No. 144,Accounting for the Impairment or Disposal of Long-Lived Assets; (e) amortization of intangibles pursuant to SFAS No. 141(R); and (f) any long-term incentive plan accruals or any non-cash compensation expense realized from grants of stock appreciation or similar rights, stock options or other rights to officers, directors and employees.
51
Contractual Obligations
The following is a summary of our significant future contractual obligations by year as of June 30, 2009:
| | | | | | | | | | | | | | | |
| | | 2009 | | 2010-2011 | | 2012-2013 | | After 2013 | | Total |
| | | (Unaudited, in thousands) |
| | | | | |
Long-term debt | | $ | 16,750 | | $ | 284,750 | | $ | - | | $ | 298,285 | | $ | 599,785 |
Estimated cash interest on long-term debt | | | 15,139 | | | 54,902 | | | 43,251 | | | 21,626 | | | 134,918 |
Estimated cash payments for asset retirement obligations | | | 4,233 | | | 12,389 | | | 2,628 | | | 235,181 | | | 254,431 |
Purchase commitments | | | 104,645 | | | 60,119 | | | - | | | - | | | 164,764 |
Federal coal lease | | | - | | | 72,216 | | | 36,108 | | | - | | | 108,324 |
Operating leases | | | 1,934 | | | 2,988 | | | 1,477 | | | 2,115 | | | 8,514 |
| | | | | | | | | | | | | | | |
Total | | $ | 142,701 | | $ | 487,364 | | $ | 83,464 | | $ | 557,207 | | $ | 1,270,736 |
| | | | | | | | | | | | | | | |
We expect to use cash flows provided by operating activities to invest in the range of $190.0 million to $210.0 million in capital expenditures during calendar year 2009 of which $150.0 million to $165.0 million is to maintain production and replace mining equipment. The additional $40.0 million to $45.0 million is expected to be directed toward improvements in productivity and selective expansions of production. Approximately $57.0 million of the 2009 capital expenditures are included in purchase commitments shown above. The remaining 2009 purchase commitments consist of $14.7 million for purchased coal in normal quantities for delivery to customers and $32.9 million pertaining to forward contracts to purchase explosives and diesel fuel in normal quantities for use at our surface mines. We expect to contribute approximately $30.0 million to our defined benefit retirement plans and to pay approximately $26.0 million of retiree health care benefits, gross of Medicare Part D subsidies, in calendar year 2009. We also expect to incur approximately $6.8 million per year for surety bond premiums and letters of credit fees. We believe that cash balances plus cash generated by operations will be sufficient to meet these obligations plus fund requirements for working capital and capital expenditures without incurring additional borrowings. However, if additional borrowings are needed, the Company would plan to utilize amounts available under its revolving credit facility.
Off-Balance Sheet Arrangements
In the normal course of business, we are a party to certain off-balance sheet arrangements. These arrangements include guarantees, indemnifications and financial instruments with off-balance sheet risk, such as bank letters of credit and performance or surety bonds. Liabilities related to these arrangements are not reflected in our Consolidated Balance Sheets. However, the underlying obligations that they secure, such as asset retirement obligations, self-insured workers’ compensation liabilities, royalty obligations and certain retiree medical obligations, are reflected in our Consolidated Balance Sheets.
We are required to provide financial assurance in order to perform the post-mining reclamation required by our mining permits, pay our federal production royalties, pay workers’ compensation claims under self-insured workers’ compensation laws in various states, pay federal black lung benefits, pay retiree health care benefits to certain retired UMWA employees and perform certain other obligations.
In order to provide the required financial assurance, we generally use surety bonds for post-mining reclamation and royalty payment obligations and bank letters of credit for self-insured workers’ compensation obligations and UMWA retiree health care obligations. Federal black lung benefits are paid from a dedicated trust fund to which future contributions will be required. Bank letters of credit are also used to collateralize a portion of the surety bonds.
We had outstanding surety bonds with a total face amount of $314.6 million as of June 30, 2009, of which $289.2 million secured reclamation obligations; $15.7 million secured coal lease obligations; $7.1 million secured self-insured workers’ compensation obligations; and $2.6 million for other miscellaneous obligations. In addition, we had $177.0 million of letters of credit in place for the following purposes: $43.2 million for workers’ compensation, including collateral for workers’ compensation bonds; $8.4 million for UMWA retiree health care obligations; $118.6 million for collateral for reclamation surety bonds; and $6.8 million for other miscellaneous obligations. In the last few years, the market terms under which surety bonds can be obtained have generally become less favorable to all mining companies. In the event that additional surety bonds become unavailable, we would seek to secure our obligations with letters of credit, cash deposits or other suitable forms of collateral.
Certain Trends and Uncertainties
Our long-term outlook for the coal markets in the U.S. remains positive. The Energy Information Administration (“EIA”) in its Annual Energy Outlook—2009 forecasts that coal-fired electrical generation will increase by an average annual growth rate of 1.5% through 2015. In the first half of 2009, however, the EIA estimates that electric power generation from coal decreased 9.5% compared
52
to the same period last year as overall U.S. demand for electricity declined dramatically and competing fuels became competitively priced. Long-term demand for coal and coal-based electricity generation in the U.S. will likely be driven by various factors such as the rebounding economy, increasing population, increasing demand to power residential electronics and plug-in hybrid electric vehicles, public demands for affordable electricity, relatively high prices for the alternative fossil fuels of gas and oil for electricity generation, the inability for renewable energy sources such as wind and solar to become the base load source of electric power, geopolitical risks associated with importing large quantities of oil and natural gas resources, increasing demand for coal outside the U.S. resulting in increased exports of abundant steam coal located within the United States. Despite the recent downturn to the U.S. and global economies, the International Monetary Fund’s April 2009 World Economic Outlook forecasts U.S. average annual GDP to grow between 1.7% and 3.2% from 2010 through 2014.
According to the Ventyx Velocity Suite, a database used by the U.S. Department of Energy to track new coal-fired power plants, there are 14,802 megawatts of new coal-fired electrical generation under construction in the United States. There are an additional 1,482 megawatts near construction and 3,620 megawatts of new coal-fired electrical generating capacity permitted and expected to be constructed. This new capacity will increase the annual coal consumption for electrical generation by an estimated sixty-five million tons, much of which is expected to be supplied from the Powder River Basin in Wyoming. Approximately 29,483 megawatts of additional coal-fired electrical generation has been announced and is in the early stages of permitting and development.
During 2008 coal exports from the U.S. increased significantly in response to strong worldwide demand for coal. The largest increases in international coal demand are from the rapidly growing and industrializing economies of China and India. Export volumes for 2008 increased by approximately 40% from the previous year to roughly 84 million tons, levels last seen over a decade ago. Although demand for US export coal has declined in the first half of 2009, the EIA expects volumes to remain higher than 2007 levels due to the number of committed tons under contract. Through the first five months of 2009, US coal exports are down approximately 36%. According to the EIA’s 2009 International Energy Outlook (IEO), global primary energy demand will grow by 33% between 2010 and 2030, with coal demand rising most in absolute terms and fossil fuels accounting for most of the increase in demand between now and 2030. China and India have contributed more than half the increase in global demand for energy, and over 80% for coal, since 2000. The IEO estimates these two growing economies will contribute more than 50% of the increase in global energy demand and nearly 80% of the increase in global coal demand through 2030. The IEO has reached a general conclusion that dependence on coal for power rises strongly in countries with emerging economies and relatively large coal reserves, while it stagnates in the more developed nations and nations with smaller coal reserves.
Ultimately, the global demand for and use of coal may be limited by any global treaties which place restrictions on carbon dioxide emissions. As part of the United Nations Framework Convention on Climate Change, representatives from 187 nations met in Bali, Indonesia in December 2007 to discuss a program to limit greenhouse gas emissions after 2012. The United States participated in the conference. The convention adopted what is called the “Bali Action Plan.” The Bali Action Plan contains non-binding commitments, but concludes that “deep cuts in global emissions will be required” and provides a timetable for two years of talks to shape the first formal addendum to the 1992 United Nations Framework Convention on Climate Change treaty since the Kyoto Protocol. The ultimate outcome of the Bali Action Plan, and any treaty or other arrangement ultimately adopted by the United States or other countries, may have a material adverse impact on the global demand for and supply of coal. This is particularly true if cost effective technology for the capture and storage of carbon dioxide is not sufficiently developed.
Proposed coal-fired electric generating facilities that do not include technologies to capture and store carbon dioxide are facing increasing opposition from environmental groups as well as state and local governments who are concerned with global climate change and uncertain financial impacts of potential greenhouse gas regulations. Coal-fired generating plants incorporating carbon dioxide capture and storage technologies will be more expensive to build than conventional pulverized coal generating plants and the technologies are still in the developmental stages. This dynamic, coupled with the weakened short-term economic outlook, may cause power generating companies to cut back on plans to build coal-fired plants in the near term. Nevertheless, the desire to attain US energy independence suggests the construction of new coal-fired generating facilities is likely to remain a viable option. This desire, coupled with heightened interest in coal gasification and coal liquefaction, is a potential indicator of increasing demand for coal in the United States.
Based on weekly production reporting through June 30, 2009 from the EIA, first half year-over-year Appalachian production has declined by approximately 7.1% due to decreasing coal demand. Compared to the first half of 2008, Western coal production had decreased by approximately 5.9% in the first half of 2009. In Central Appalachia, delays with respect to permits to construct valley fills at surface mines are likely to slow the permitting process for surface mining in that region with resultant uncertainties for producers. Average spot market prices for June 2009 for Central Appalachian and Northern Appalachian coals decreased by roughly 59% and 61%, respectively, compared to the same month one year earlier. Average spot market prices for the month of June for Powder River Basin coal are down approximately 26% from the previous year, with the basin offering the least expensive fossil fuel on a dollar per Btu basis. Long-term, the delicate balance of coal supply and increasing coal demand is expected to result in strong, but volatile fundamentals for the U.S. coal industry.
53
Our revenues depend on the price at which we are able to sell our coal. The current pricing environment for U.S. steam coal production has fallen significantly below the high levels seen during the spring and summer of 2008. Prices for high quality metallurgical coal, used to manufacture coke for steelmaking, have deteriorated in response to decreased worldwide demand for steel.
The worldwide economic slowdown and the current volatility and uncertainty in the credit markets have had an impact on the demand for and price of coal. Weakening global energy fundamentals, including the decline in demand and prices for both natural gas and crude oil have driven spot prices of coal lower in the marketplace. Steel manufacturers have shut-in capacity due to the lack of near-term visibility around demand for steel for construction, automobile manufacturing and other down-stream products. Steel manufacturers appear to have largely completed destocking their current inventories in a move which may signal a rebound for metallurgical coal in the second of half of 2009. The low price of natural gas is creating further competitive pressure on the demand for steam coal. A protracted economic slowdown could slacken demand for metallurgical and steam coals and could negatively influence pricing in the near-term. Longer-term, coal industry fundamentals remain intact. Coal has been the fastest growing fossil fuel for five consecutive years, and significant additional growth is expected worldwide. The seaborne coal market has grown to nearly 1 billion tons annually, and U.S. exports will be needed to meet worldwide demand. In addition, the idling of coal mines due to weakened market conditions and high costs, and the resulting decrease in production, particularly in Central Appalachia, should help to reduce excessive supply levels. These factors should lead to a tighter market for coal, both globally and in the United States, in the coming years.
Our results of operations are dependent upon the prices we obtain for our coal as well as our ability to improve productivity and control costs. We spend more than $600 million per year to procure goods and services in support of our business activities, excluding capital expenditures. Principal goods and services include maintenance and repair parts and services, electricity, fuel, roof control and support items, explosives, tires, conveyance structure, ventilation supplies and lubricants. We use suppliers and service contractors for a significant portion of our equipment rebuilds and repairs both on- and off-site, as well as for construction and reclamation activities and to support internal computer systems.
The Company’s management continues to aggressively control costs and strives to improve operating performance to mitigate external cost pressures. As with most of our competitors, we are experiencing volatility in operating costs related to fuel, explosives, steel, tires, contract services and healthcare and have taken measures to mitigate the increases in these costs at all operations. Each of our regional mining operations has developed their own supplier bases consistent with local needs. We have a centralized sourcing group for major supplier contract negotiation and administration, for the negotiation and purchase of major capital goods, and to support the business units. The supplier base has been relatively stable for many years, but there has been some consolidation. We are not dependent on any one supplier in any region. We promote competition between suppliers and seek to develop relationships with those suppliers whose focus is on lowering our costs. We seek suppliers who identify and concentrate on implementing continuous improvement opportunities within their area of expertise. To the extent upward pressure on costs exceeds our ability to realize sales increases, or if we experience unanticipated operating or transportation difficulties, our operating margins would be negatively impacted. Employee labor costs have historically increased primarily due to the demands associated with attracting and retaining a workforce, however recent stability in the marketplace has helped ease this situation. We may also continue to experience difficult geologic conditions, delays in obtaining permits, labor shortages, unforeseen equipment problems and shortages of critical materials such as tires and explosives that may result in adverse cost increases and limit our ability to produce at forecasted levels.
Recent Accounting Pronouncements
See Note 2 to the Consolidated Financial Statements in ITEM I.
| ITEM 3. | QUANTITATIVE AND QUALITATIVE DISCLOSURES ABOUT MARKET RISK. |
Price Risk
We manage our price risk for coal sales through the use of long-term coal supply agreements. As of July 16, 2009, we had sales commitments for approximately 100% of planned shipments for 2009. Uncommitted and unpriced tonnage was 19% and 47% for 2010 and 2011, respectively.
We have exposure to price risk for supplies that are used directly or indirectly in the normal course of production such as diesel fuel, steel and other items such as explosives. We manage our risk for these items through strategic sourcing contracts in normal quantities with our suppliers and may use derivative instruments from time to time, primarily swap contracts with financial institutions, for a certain percentage of our monthly requirements. Swap agreements essentially fix the price paid for our diesel fuel and explosives by requiring us to pay a fixed price and receive a floating price. The discussion below presents the sensitivity of the market value of our financial instruments to selected changes in market rates and commodity prices. The range of changes reflects our view of changes that are reasonably possible over a one-year period. Market values are the present value of projected future cash flows based on the market rates and prices chosen.
54
We expect to use approximately 26,000 tons and 48,000 tons of explosives for the remainder of 2009 and in 2010, respectively. As of June 30, 2009, through our derivative swap contracts, we have fixed prices for approximately 72% and 45% of our expected explosive needs for 2009 and 2010, respectively. At June 30, 2009, a $1.00 per MMBTU decrease in the price of natural gas would result in a $1.0 million increase in our expense resulting from natural gas derivatives, which would be offset by a decrease in the cost of our physical explosive purchases.
We expect to use approximately 10,700,000 gallons and 21,200,000 gallons of diesel fuel for the remainder of 2009 and in 2010, respectively. As of June 30, 2009, through our derivative swap contracts and physical forward contracts, we have fixed prices for approximately 84% and 58% of our expected diesel fuel needs for 2009 and 2010, respectively. The average fixed price per swap for diesel fuel hedges is $3.31 per gallon and $1.88 per gallon for calendar years 2009 and 2010, respectively. At June 30, 2009, a $5.00 per barrel decrease in the price of oil would result in a $0.8 million increase in our expense resulting from oil derivatives, which would be offset by a decrease in the cost of our physical diesel purchases.
Credit Risk
Our credit risk is primarily with electric power generators and, to a lesser extent, steel producers. Most electric power generators to whom we sell have investment grade credit ratings. Our policy is to independently evaluate each customer’s creditworthiness prior to entering into transactions and to constantly monitor outstanding accounts receivable against established credit limits. When appropriate (as determined by our credit management function), we have taken steps to reduce our credit exposure to customers that do not meet our credit standards or whose credit has deteriorated. These steps include obtaining letters of credit or cash collateral, requiring prepayments for shipments or establishing customer trust accounts held for our benefit in the event of a failure to pay.
Interest Rate Risk
Our objectives in managing exposure to interest rate changes are to limit the impact of interest rate changes on earnings and cash flows and to lower overall borrowing costs. We have exposure to changes in interest rates through our bank term loan and our revolving credit facility. To achieve risk mitigation objectives, we have in the past managed our interest rate exposure through the use of interest rate swaps.
The weighted average interest rate on the outstanding principal of our Senior Secured Credit Facility was 1.72% as of June 30, 2009. A hypothetical 1% increase in interest rates would have increased our interest expense approximately $1.5 million for the six months ended June 30, 2009. As we continue to monitor the interest rate environment in concert with our risk mitigation objectives, consideration is being given to future interest rate risk reduction strategies.
| ITEM 4. | CONTROLS AND PROCEDURES. |
Evaluation of Disclosure Controls and Procedures
We maintain disclosure controls and procedures and internal controls designed to ensure that information required to be disclosed in our filings under the Securities Exchange Act of 1934 (the “Act”), as amended, is recorded, processed, evaluated, summarized and reported accurately within the time periods specified in the Securities and Exchange Commission’s rules and forms. In designing and evaluating the disclosure controls and procedures, our management recognized that any controls and procedures, no matter how well designed and operated, can provide only reasonable assurance of achieving the desired control objectives and management necessarily was required to apply its judgment in evaluating the cost-benefit relationship of possible controls and procedures.
As of the end of the period covered by this report, an evaluation was performed under the supervision and with the participation of our management, including the Chief Executive Officer and Chief Financial Officer, of the effectiveness of the design and operation of our disclosure controls and procedures pursuant to Exchange Act Rule 13a-15(e) and 15d-15(e). Based upon that evaluation, the Chief Executive Officer and Chief Financial Officer concluded that the Company’s disclosure controls and procedures are effective and are designed to (a) ensure that information required to be disclosed by us in reports we file or submit under the Act are recorded, processed, summarized and reported within the time periods specified in the Securities and Exchange Commission’s rules and forms; and (b) ensure that information required to be disclosed by us in reports filed or submitted under the Act is accumulated and communicated to our management, including our Chief Executive Officer and Chief Financial Officer, as appropriate to allow timely decisions regarding required disclosure.
55
Changes in Internal Control over Financial Reporting
There has been no change in the Company’s internal control over financial reporting during the most recent fiscal quarter that has materially affected, or that is reasonably likely to materially affect the Company’s internal control over financial reporting.
PART II—OTHER INFORMATION
| ITEM 1. | LEGAL PROCEEDINGS. |
Information required by this Item is contained in Note 16, PART I, ITEM 1 entitled “Commitments and Contingencies” contained elsewhere in this Quarterly Report on Form 10-Q and is incorporated herein by reference.
In addition to the other information set forth in this report, you should carefully consider the factors discussed in Part I, Item 1A, “Risk Factors,” in our Annual Report on Form 10-K for the year ended December 31, 2008 and in our Joint Proxy Statement/Prospectus on Form S-4 dated June 22, 2009, together with the cautionary statement under the caption “Cautionary Note Regarding Forward Looking Statements” in “Management’s Discussion and Analysis of Financial Condition and Results of Operations” of this report and the additional risks set forth below. These described risks are not the only risks we face. Additional risks and uncertainties not currently known to us or that we currently deem to be immaterial also may materially adversely affect our business, financial condition and/or operating results.
New Alpha may fail to realize the cost savings estimated as a result of the merger.
The success of the merger will depend, in part, on New Alpha’s ability to realize the anticipated synergies, business opportunities and growth prospects from combining the businesses of Alpha and Foundation. New Alpha may never realize these anticipated synergies, business opportunities and growth prospects. Integrating operations will be complex and will require significant efforts and expenditures on the part of both Old Alpha and Foundation. Personnel might leave or be terminated because of the merger. Management of New Alpha might have its attention diverted while trying to integrate operations. In addition, New Alpha might experience increased competition that limits its ability to expand its business, it might not be able to capitalize on expected business opportunities, including retaining current customers, assumptions underlying estimates of expected cost savings may be inaccurate or general industry and business conditions might deteriorate. If these factors limit New Alpha’s ability to integrate the operations of Alpha and Foundation successfully or on a timely basis, the expectations of future results of operations, including certain cost savings and synergies expected to result from the merger, might not be met.
In addition, it is possible that the integration process could result in the loss of key employees, the disruption of each company’s ongoing businesses or inconsistencies in standards, controls, information technology systems, procedures and policies, any of which could adversely affect New Alpha’s ability to maintain relationships with clients, employees or other third parties or New Alpha’s ability to achieve the anticipated benefits of the merger or could reduce New Alpha’s earnings.
The market price of New Alpha common stock after the transaction might be affected by factors different from, or in addition to, those affecting the market prices of Alpha and Foundation common stock prior to the merger.
The businesses of Alpha and Foundation differed and, accordingly, the results of operations of New Alpha and the market price of New Alpha common stock may be affected by factors different from those that affected the independent results of operations of each of Alpha and Foundation.
New Alpha may not pay dividends in the foreseeable future, and you may have to rely on increases in the trading price of New Alpha common stock for returns on your investment.
Foundation stockholders historically received quarterly dividends from Foundation, while Alpha stockholders did not historically receive any regularly paid dividends. The payment of dividends by New Alpha will be subject to the determination of its board of directors. Decisions regarding whether to pay dividends and the amount of any dividends to be paid will be based on compliance with the Delaware General Corporate Law, compliance with agreements governing New Alpha’s indebtedness, earnings, cash requirements, results of operations, cash flows and financial condition and other factors that the New Alpha board of directors may consider to be important. As such, New Alpha may not pay any regular dividends in the foreseeable future should its board of directors so determine, in which case former Foundation stockholders who become stockholders of New Alpha would no longer be able to rely on receiving regular dividend payments and they (and former Alpha stockholders) would have to rely on increases in the trading price of New Alpha common stock for any return on their investment.
56
Uncertainties underlie Alpha’s expectation that, relative to Alpha on a stand-alone basis, the merger will be accretive to New Alpha’s earnings per share, when calculated on a GAAP basis, for fiscal year 2010.
It cannot be assured that, relative to Alpha on a stand-alone basis, the merger will be accretive to earnings per share under generally accepted accounting principles in the United States, or GAAP, when calculated for fiscal year 2010. In addition to the uncertainties that underlie any financial forecast, the merger will be accounted for as an acquisition under Statement of Financial Accounting Standards No. 141 (revised 2007), “Business Combinations,” or “SFAS 141(R)”, which was effective for Alpha on January 1, 2009. SFAS 141(R) changes the methodologies for calculating acquisition price to the date the merger closes and for determining fair values. Until the acquisition price is known, Alpha can only estimate the allocation of this acquisition price to the net assets acquired and the effect of this allocation on future results. That estimate could materially change.
| ITEM 2. | UNREGISTERED SALES OF EQUITY SECURITIES AND USE OF PROCEEDS. |
Issuer purchase of equity securities(1)
| | | | | | | | | | |
| | | Total Number of
Shares Purchased | | Average Price Paid
per Share | | Total Number of
Shares Purchased as
Part of Publicly
Announced Share
Repurchase
Program | | Approximate Dollar
Value of Shares that
May Yet Be
Purchased Under
the Program (000’s
omitted) |
April 1, 2009 through April 30, 2009 | | 518 | | $ | 14.35 | | - | | $ | 113,587 |
May 1, 2009 through May 31, 2009 | | 3,936 | | $ | 29.80 | | - | | $ | 113,587 |
June 1, 2009 through June 30, 2009 | | 528 | | $ | 28.50 | | - | | $ | 113,587 |
| | | | | | | | | | |
| | 4,982 | | $ | 28.06 | | - | | $ | 113,587 |
| | | | | | | | | | |
(1)These are shares that were purchased by the Company from employees to satisfy minimum statutory tax withholding upon vesting of restricted stock units.
| ITEM 3. | DEFAULTS UPON SENIOR SECURITIES. |
| ITEM 4. | SUBMISSION OF MATTERS TO A VOTE OF SECURITY HOLDERS. |
On May 13, 2009, Foundation held its annual meeting of stockholders and five proposals were considered. Four such proposals were approved by the stockholders and one such proposal was rejected by the stockholders.
The first proposal was to elect eight nominees to the Board of Directors. The following is a separate tabulation with respect to the vote for each nominee.
57
| | | | |
Nominee: | | For | | Withheld |
James F. Roberts | | 36,044,963 | | 6,867,361 |
William J. Crowley, Jr. | | 36,167,133 | | 6,745,191 |
David I. Foley | | 30,189,428 | | 12,722,896 |
P. Michael Giftos | | 36,163,575 | | 6,748,749 |
Kurt D. Kost | | 36,199,539 | | 6,712,785 |
Alex T. Krueger | | 30,173,118 | | 12,739,206 |
Joel Richards, III | | 30,205,340 | | 12,706,984 |
Robert C. Scharp | | 36,164,445 | | 6,747,879 |
Thomas V. Shockley, III | | 30,204,583 | | 12,707,741 |
The second proposal was to ratify the approval of Ernst & Young LLP as Foundation’s Independent Registered Public Accounting Firm for the fiscal year ending December 31, 2009.
Shares of Common Stock:FOR:42,880,801AGAINST: 25,976ABSTAINED: 5,547
| ITEM 5. | OTHER INFORMATION. |
The exhibits to this report are listed in the Exhibit Index.
58
SIGNATURES
Pursuant to the requirements of the Securities Exchange Act of 1934, the registrant has duly caused this report to be signed on its behalf by the undersigned thereunto duly authorized.
| | | | |
Date: August 7, 2009 | | ALPHA NATURAL RESOURCES, INC. |
| | (Registrant) |
| |
/s/KEVINS.CRUTCHFIELD | | |
| Kevin S. Crutchfield | | | | |
Chief Executive Officer (Principal Executive Officer) | | | | |
| |
/s/FRANKJ.WOOD | | |
| Frank J. Wood | | | | |
Executive Vice President and Chief Financial Officer (Principal Financial and Accounting Officer) | | | | |
59
EXHIBIT INDEX
| | |
Exhibit
No. | | Description of Exhibit |
| 2.1 | | Agreement and Plan of Merger, dated as of May 11, 2009, by and among Alpha Natural Resources, Inc. (SEC File No. 1-32423) and Foundation Coal Holdings, Inc. (Incorporated by reference to Exhibit 2.1 of the Current Report on Form 8-K of Foundation Coal Holdings, Inc., filed on June 22, 2009). |
| |
| 3.1 | | Amended and Restated Certificate of Incorporation of New Alpha (Incorporated by reference to Exhibit 3.1 of the Current Report on Form 8-K filed by Alpha Natural Resources, Inc. on August 5, 2009). |
| |
| 3.2 | | Amended and Restated Bylaws of New Alpha (Incorporated by reference to Exhibit 3.1 of the Current Report on Form 8-K filed by Alpha Natural Resources, Inc. on August 5, 2009). |
| |
| 4.1 | | Indenture, dated as of April 7, 2008, between Alpha Natural Resources, Inc. (SEC File No. 1-32423) and Union Bank of California, N.A., as Trustee (Incorporated by reference to Exhibit 4.1 to the Current Report on Form 8-K of Alpha Natural Resources, Inc. (SEC File No. 1-32423) filed on April 9, 2008). |
| |
| 4.2 | | Supplemental Indenture No. 1 dated as of April 7, 2008, between Alpha Natural Resources, Inc. (SEC File No. 1-32423) and Union Bank of California, N.A., as Trustee (Incorporated by reference to Exhibit 4.3 to the Current Report on Form 8-K of Alpha Natural Resources, Inc. (SEC File No. 1-32423) filed on April 9, 2008). |
| |
| 4.3 | | Form of 2.375% Convertible Senior Note due 2015 (Incorporated by reference to Exhibit 4.4 to the Current Report on Form 8-K (SEC File No. 1-32423) of Alpha Natural Resources, Inc. (SEC File No. 1-32423) filed on April 9, 2008). |
| |
| 4.4 | | Supplemental Indenture No. 2 dated as of July 31, 2009, between Alpha Natural Resources, Inc. and Union Bank of California, N.A., as Trustee (Incorporated by reference to Exhibit 4.4 of the Current Report on Form 8-K filed by Alpha Natural Resources, Inc. on August 5, 2009). |
| |
| 4.5 | | Subordinated Indenture dated as of April 7, 2008, between Alpha Natural Resources, Inc. and Union Bank of California, N.A. as Trustee (Incorporated by reference to Exhibit 4.2 to the Current Report on Form 8-K of Alpha Natural Resources, Inc. (SEC File No. 1-32423) filed on April 9, 2008). |
| |
| *4.6 | | Supplemental Indenture No. 1 dated as of July 31, 2009, between Alpha Natural Resources, Inc. and Union Bank, N.A., as Trustee. |
| |
| 4.7 | | Senior Notes Indenture dated as of July 30, 2004, among Foundation PA Coal Company (nka Foundation PA Coal Company, LLC), the Guarantors named therein and The Bank of New York, as Trustee, (Incorporated by reference to Exhibit 10.4 to the Registration Statement on Form S-1/A (SEC File No. 333-118427) of Foundation Coal Holdings, Inc. filed on December 7, 2004). |
| |
| 4.8 | | Supplemental Indenture dated as of September 6, 2005 among Foundation Mining LP, a subsidiary of Foundation Coal Corporation, Foundation PA Coal Company, LLC and The Bank of New York, as Trustee (Incorporated by reference to Exhibit 10.12 to the Quarterly Report on Form 10-Q of Foundation Coal Holdings, Inc. filed on November 14, 2005). |
| |
| 4.9 | | Supplemental Indenture dated as of October 5, 2007 among Foundation PA Coal Terminal, LLC, a subsidiary of Foundation Coal Corporation, Foundation PA Coal Company, LLC and The Bank of New York, as Trustee (Incorporated by reference to Exhibit 4.3.2 to the Quarterly Report on Form 10-Q of Foundation Coal Holdings, Inc. filed on November 9, 2007). |
| |
| 4.10 | | Third Supplemental Indenture dated as of August 1, 2009 among Foundation PA Coal Company, LLC, Alpha Natural Resources, Inc., certain New Alpha subsidiaries and The Bank of New York, as Trustee (Incorporated by reference to Exhibit 4.8 of the Current Report on Form 8-K filed by Alpha Natural Resources, Inc. on August 5, 2009). |
| |
| 10.1 | | Amendment No. 1 to Credit Agreement, dated as of May 22, 2009, by and among Foundation Coal Holdings, Inc., Foundation Coal Corporation, Foundation PA Coal Company, LLC, Citicorp North America, Inc. as administrative agent and lender and the other lenders party thereto (Incorporated by reference to Exhibit 10.1 to the Current Report on Form 8-K of Foundation Coal Holdings, Inc. filed on May 27, 2009). |
60
| | |
Exhibit
No. | | Description of Exhibit |
| *31.1 | | Certification of periodic report by the Company’s Chief Executive Officer pursuant to Rule 13a-14(a) under the Securities Exchange Act of 1934, as amended pursuant to Section 3.02 of the Sarbanes Oxley Act of 2002. |
| |
| *31.2 | | Certification of periodic report by the Company’s Chief Financial Officer pursuant to Rule 13a-14(a) under the Securities Exchange Act of 1934, as amended pursuant to Section 3.02 of the Sarbanes Oxley Act of 2002. |
| |
| *32.1 | | Certification of periodic report by the Company’s Chief Executive Officer pursuant to 18 U.S.C. Section 1350, adopted pursuant to Section 906 of the Sarbanes Oxley Act of 2002. |
| |
| *32.2 | | Certification of periodic report by the Company’s Chief Executive Officer pursuant to 18 U.S.C. Section 1350, adopted pursuant to Section 906 of the Sarbanes Oxley Act of 2002. |
61