 MHI Hospitality Corporation Follow-On Offering of Common Stock July 2010 Issuer Free Writing Prospectus Filed Pursuant to Rule 433 Registration No. 333-167519 July 21, 2010 FREE WRITING PROSPECTUS |
 2 Forward-Looking Statements Free Writing Prospectus Statement MHI Hospitality Corp. (the “Company,” “we,” “us” and “our”) has filed a registration statement (including a preliminary prospectus) with the Securities and Exchange Commission (“SEC”) for the offering to which this presentation relates. Before you invest, you should read the preliminary prospectus in that registration statement and other documents the Company has filed with the SEC for more complete information about the Company and this offering. You may get these documents for free by visiting the SEC website at www.sec.gov. Alternatively, the Company, any underwriter or any dealer participating in the offering will arrange to send you the preliminary prospectus if you request it by contacting Stifel, Nicolaus and Company, Inc. Attn: Equity Syndicate, One South St., Baltimore, MD 21202, (443) 224-1433 or Janney Montgomery Scott, 60 State Street, 35 Floor, Boston, MA 02109, (617) 557-2971. The preliminary prospectus This presentation may contain statistics and other data that may have been obtained from or compiled from information made available by third-party service providers. While we believe these sources to be reliable, accuracy and completeness of the information cannot be guaranteed. All property photographs included in this presentation are from our existing portfolio. As with all investments there are inherent risks. Please obtain and review all financial and other publicly available materials before investing. Unless otherwise noted herein, all the financial information contained in this presentation is presented as of March 31, 2010. This presentation contains forward-looking statements. You can identify forward-looking statements by the use of forward-looking terminology such as “believes,” “expects,” “may,” “will,” “would,” “could,” “should,” “seeks,” “intends,” “plans,” “projects,” “estimates,” “anticipates” “predicts,” or “potential” or the negative of these words and phrases or similar words or phrases. You can also identify forward-looking statements by discussions of strategy, plans or intentions. Statements regarding the following subjects may be impacted by a number of risks and uncertainties which may cause our actual results, performance or achievements to be materially different from any future results, performances or achievements expressed or implied by the forward-looking statements: (i) our use of the proceeds of this offering; (ii) the competitive environment in which we operate; (iii) our ability to maintain or increase our rental rates and occupancy rates; (iv) our ability to oversee our portfolio; (v) our ability to successfully engage in strategic acquisitions and investments; (vi) our ability to successfully expand into new markets; (vii) the effect of general market, economic and political conditions, including the recent economic slowdown and dislocation in the global credit markets; (viii) the availability and cost of capital; (ix) changes in interest rates; (x) the magnitude, sustainability and timing of an anticipated recovery in the hospitality industry and in the markets in which we operate; (xi) the amount and yield of any additional investments; (xii) our ability to generate sufficient cash flows to satisfy our debt service obligations and to make distributions; (xiii) our ability to maintain adequate insurance coverage; (xiv) the terms of government regulations that affect us and interpretations of those regulations, including changes in tax laws and regulations affecting REITs, changes in real estate and zoning laws and increases in real property tax rates; (xv) our ability to maintain our qualification as a REIT; and (xvi) other subjects referenced in our preliminary prospectus, including those set forth under the heading “Risk Factors” in our preliminary prospectus. The forward-looking statements contained in this presentation reflect our beliefs, assumptions and expectations of our future performance, taking into account all information currently available to us. These beliefs, assumptions and expectations are subject to risks and uncertainties and can change as a result of many possible events or factors, not all of which are known to us. If a change occurs, our business, financial condition, liquidity and results of operations may vary materially from those expressed in our forward-looking statements. You should carefully consider these risks before you make an investment decision with respect to our common stock. For more information regarding risks that may cause our actual results to differ materially from any forward-looking statements, see our preliminary prospectus under the heading “Risk Factors.” We disclaim any obligation to publicly update or revise any forward-looking statements to reflect changes in underlying assumptions or factors, new information, future events or other changes. www.sec.gov/ is also available at the following: http:// Archives/edgar/data/1301236/000119312510139726/0001193125-10-139726-index.htm . th |
 3 Offering Summary $3.50 – $4.00 (pre 1-for-X reverse stock split) (1) Offering Price Range TBD Expected Pricing Stifel Nicolaus, Janney Montgomery Scott Joint Bookrunners Repay outstanding indebtedness, fund planned capital improvements and fund potential acquisition opportunities Use of Proceeds 3.5% – 4.0% payable in Q4 2010, with potential increases in the next calendar year; to be paid out of Cash Available for Distribution (“CAD”) Anticipated Post-Offering Dividend Yield / Timing 90 days Lock-up Period 15% / TBD shares Overallotment Option TBD Shares Offered Approximately $110 million Offering Size Follow-On Offering (100% primary shares) Structure MHI Hospitality Corp. (NASDAQ: “MDH”) Issuer (1) All share data presented on a pre-reverse split basis |
 4 Gross Offering Proceeds (1) $125,000 Repay Existing Line of Credit $75,198 Repay Jacksonville Crowne Plaza Loan 18,000 Raleigh Holiday Inn PIP Capital Expenditures 2,500 Transaction Expenses 8,625 Operating Reserve / Working Capital 10,677 Future Acquisitions 10,000 Total Sources $125,000 Total Uses $125,000 Transaction Sources and Uses ($ in thousands) Sources Uses (1) Assumes exercise of the underwriters’ overallotment option |
 5 Investment Highlights - Why Invest with MHI? Experienced and Invested Management Team High-Quality Portfolio With Significant Unrealized Value Current Yield via Post-Offering Reinstatement of Dividend Focused Investment Strategy to Capitalize on Compelling Market Opportunity Attractive Stock Entry Point Recapitalized Balance Sheet to Enable Future Growth |
 6 Investment Highlights - Why Invest with MHI? Experienced and Invested Management Team High-Quality Portfolio With Significant Unrealized Value Current Yield via Post-Offering Reinstatement of Dividend Focused Investment Strategy to Capitalize on Compelling Market Opportunity Attractive Stock Entry Point Recapitalized Balance Sheet to Enable Future Growth |
 7 Experienced Management Team Andrew M. Sims Chairman, President & Chief Executive Officer William J. Zaiser Executive Vice President, Chief Financial Officer, Treasurer & Secretary David R. Folsom Executive Vice President & Chief Operating Officer Chairman, President and CEO since the Company’s inception in August 2004 President of MHI Hotels Services from 1995 until August 2004 after serving for seven years as VP of Finance and Development Over 30 years of experience operating, developing and owning hotel properties Currently serves on the board of MHI Hotel Services, LLC Former member of the Hilton Advisory Board EVP, CFO, Treasurer & Secretary since the Company’s inception in August 2004 Served as VP of Accounting at MHI Hotels Services from 1990 until 2004 Certified Public Accountant EVP and COO since January 2006 Formerly the Vice President of Paragon Real Estate, an early stage real estate venture focusing on distressed multifamily assets Served in the Real Estate Securities and Debt Capital Markets Groups as an investment banker with BB&T Capital Markets from 2001 to 2005 Extensive relationships with owners / franchisors of full- service, upper-upscale and upscale hotel brands 80+ years of combined experience in the lodging industry, capital markets and core geographic markets Aligned with shareholders’ interests via 28.2% insider ownership of all current shares and units outstanding Numerous industry awards for completed hotel renovations, operating efficiency and guest services |
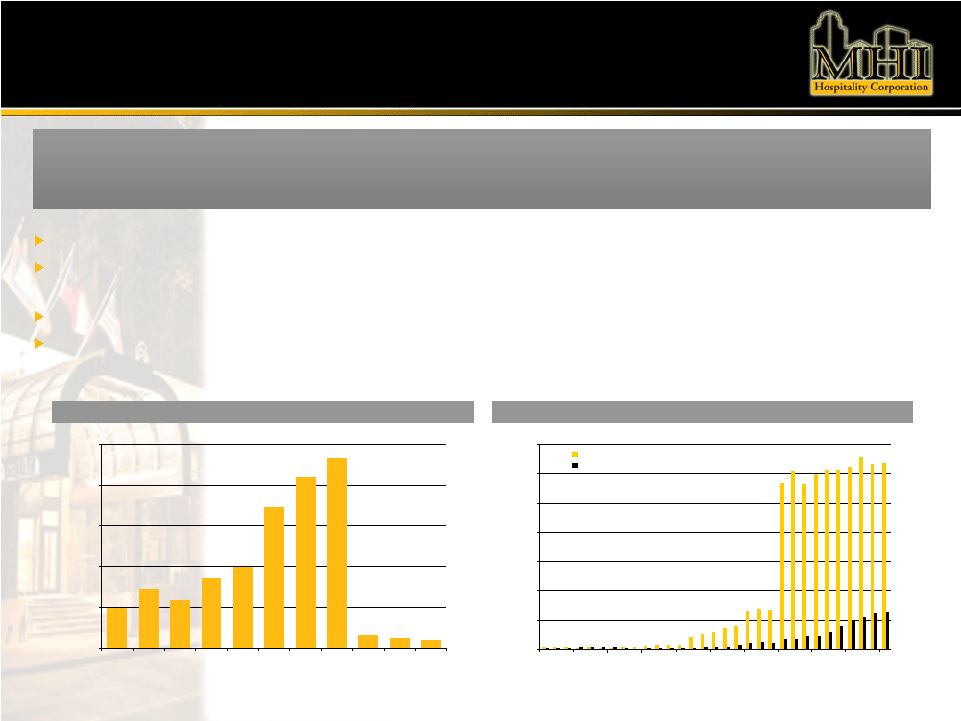
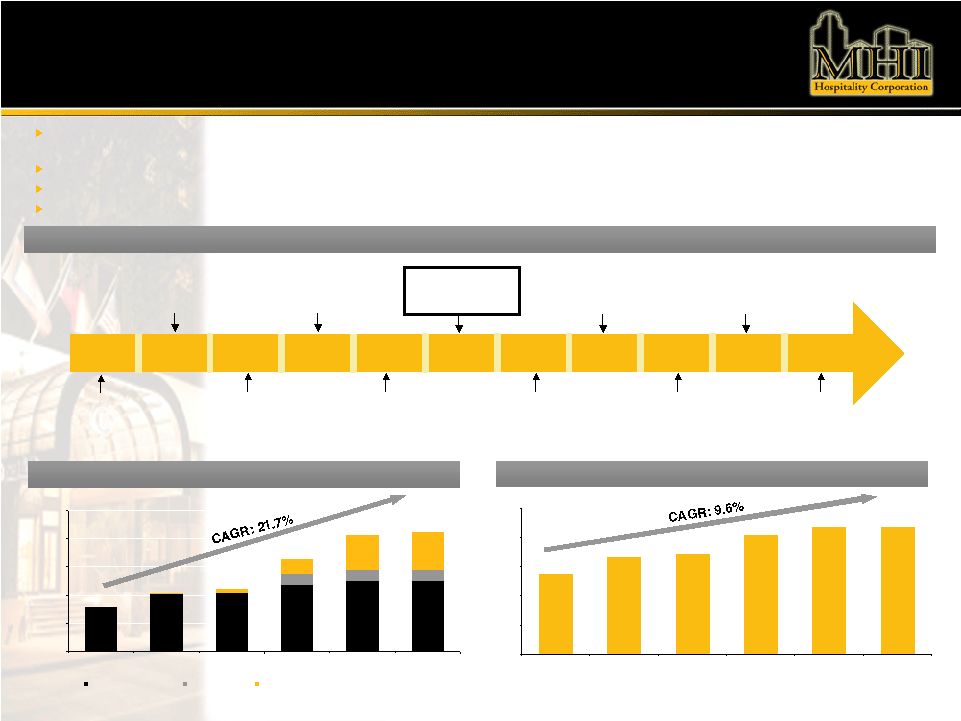 8 $0 $50,000 $100,000 $150,000 $200,000 $250,000 2004 2005 2006 2007 2008 2009 Initial Costs/Purchase Price Pro Rata JV Asset Subsequent Non-recurring Capital Expenditure Improvements Company History & Growth MHI’s predecessor entities and management company have operated continuously in the lodging industry from 1957 to 2004 when MHI completed its IPO. MHI has utilized the diverse expertise of its professionals to capitalize on market cycles and grow to its current form today Acquired five hotels since 2004 at a total acquisition cost of approximately $125 million Since its initial public offering in December 2004, MHI has nearly doubled the number of rooms under its control Primary driver of growth in real estate assets has been investments in redevelopments in anticipation of the upcoming lodging recovery Growth in Real Estate Assets ($) $79,331 $103,245 $111,493 $163,995 $206,552 $211,479 ($ in thousands) Note: Hollywood, FL JV asset is shown at pro rata portion of initial cost 1957 1981- 1985 1990- 1995 1995- 1996 Edgar Sims begins operations of predecessor company with the purchase of a 12-room motel 2009 2008 2007 2006 2005 2004 1998 Multi-unit operations began with acquisition of additional hotel properties; Andrew Sims joins MHI Portfolio repositioned with the sale of limited service hotels; traded up to full service upscale hotels 20+ management assignments for financial institutions Sourced offshore capital from Malaysia investor Initial Public Offering and the acquisition of six initial hotels Acquisition of Crowne Plaza Jacksonville Riverfront Acquisition of Sheraton Louisville Riverside and disposition of Holiday Inn Downtown Williamsburg Acquisition of Crowne Plaza Hollywood as a JV with the Carlyle Group and Crowne Plaza Tampa Westshore Acquisition of Crowne Plaza Hampton Marina Successful completion of $3.4 million Rights Offering 1,383 1,673 1,723 2,049 2,191 2,188 0 500 1,000 1,500 2,000 2,500 2004 2005 2006 2007 2008 2009 Growth in Number of Rooms Note: Includes pro rata number of rooms for Hollywood, FL JV asset (1) Decrease resulting from renovations of Wilmington and Savannah Hotels (1) Corporate Highlights |
 9 Investment Highlights - Why Invest with MHI? Experienced and Invested Management Team High-Quality Portfolio With Significant Unrealized Value Current Yield via Post-Offering Reinstatement of Dividend Focused Investment Strategy to Capitalize on Compelling Market Opportunity Attractive Stock Entry Point Recapitalized Balance Sheet to Enable Future Growth |
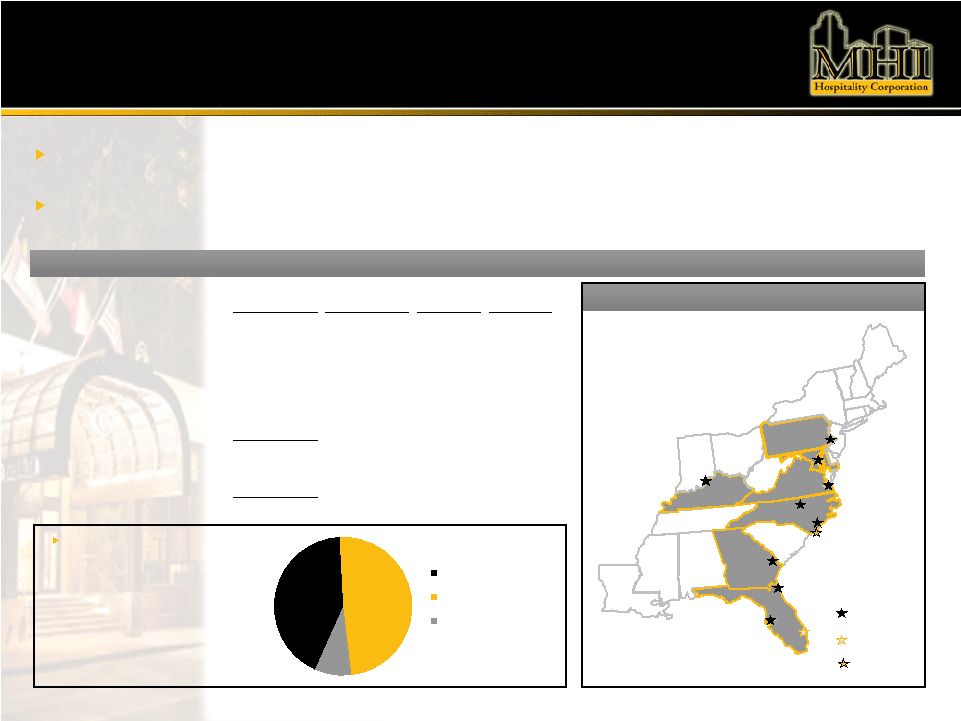 10 High-Quality, Well-Positioned Portfolio AL FL SC TN KY IN OH NC PA ME VA NY CT WV MD NJ VT NH MA DE RI GA LA MS Wholly owned Resort Lease JV Property Portfolio Summary Portfolio of 10 high-quality, primarily upper-upscale and upscale, full-service hotels concentrated in growth markets of the Mid-Atlantic and Southern U.S. 92.0% of rooms in MHI’s current wholly-owned portfolio were renovated to exceed brand standards in the last four years and thus have minimal upcoming capital requirements (% by room count) Portfolio STR Chain Scales (1 ) : Portfolio Geography (1) Includes rebranding of the Holiday Inn Brownstone to Doubletree 42.5% 48.9% 8.6% Upper Upscale Upscale Midscale Year of Year Built/ Location Acquisition Renovated Wholly-Owned Properties Hilton Philadelphia Airport 331 Philadelphia, PA 2004 1972 / 2005 Hilton Wilmington Riverside 272 Wilmington, NC 2004 1970 / 2007 Hilton Savannah DeSoto 246 Savannah, GA 2004 1968 / 2008 Sheraton Louisville Riverside 180 Jeffersonville, IN 2006 1972 / 2008 Crowne Plaza Jacksonville Riverfront 292 Jacksonville, FL 2005 1970 / 2006 Crowne Plaza Tampa Westshore 222 Tampa, FL 2007 1973 / 2008 Crowne Plaza Hampton Marina 173 Hampton, VA 2008 1988 / 2008 Holiday Inn Laurel West 207 Laurel, MD 2004 1985 / 2005 Holiday Inn Brownstone 187 Raleigh, NC 2004 1971 / 2011E Total Rooms in Wholly-Owned Portfolio 2,110 Joint Venture Property Crowne Plaza Hollywood Beach Resort 311 Hollywood, FL 2007 1972 / 2007 Total Rooms 2,421 Number of Rooms |
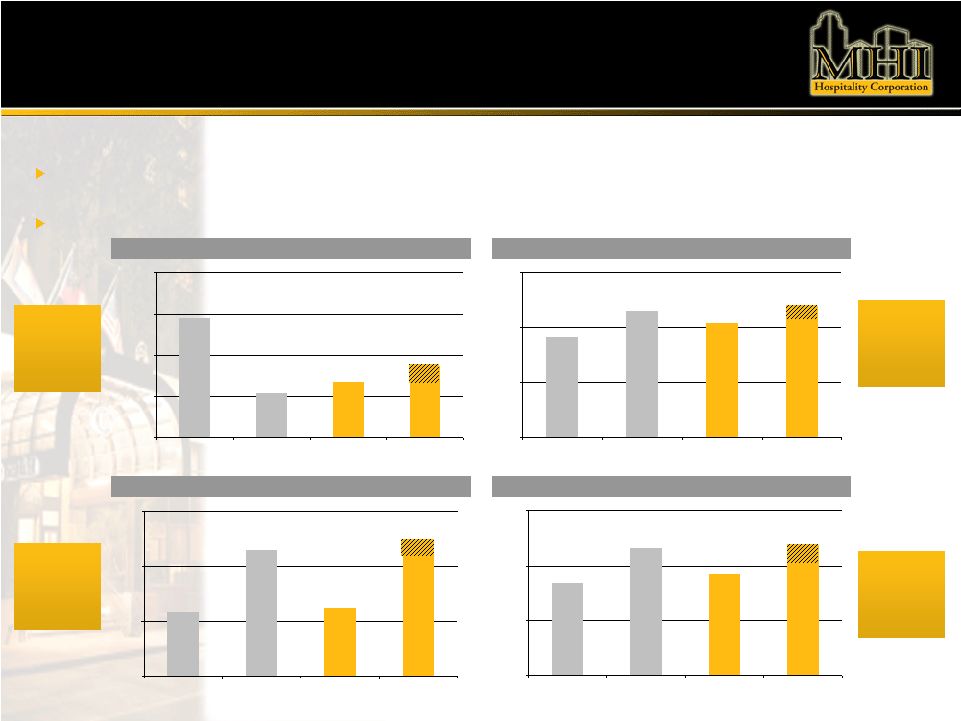 11 $108.29 $109.39 $111.00 $115.62 $104.00 $108.00 $112.00 $116.00 $120.00 Q1 '09 Q1 '10 FY '09E FY '10E 66.1% 61.7% 68.0% 56.7% 20.0% 40.0% 60.0% 80.0% Q1 '09 Q1 '10 FY '09E FY '10E 33.3% 33.9% 28.5% 26.9% 10.0% 20.0% 30.0% 40.0% Q1 '09 Q1 '10 FY '09E FY '10E Portfolio Operating Trends MHI’s portfolio is poised for growth as the benefit of recent renovations and repositioning is yet to be fully realized in hotel operating results In addition, further portfolio upside potential should result from overall market condition improvement RevPAR GOP Margin Occupancy Average Daily Rate Solid Core Operating Fundamentals ADR Declines are Decelerating RevPAR Trending Positive Occupancy has Stabilized Margins Improving Substantially $109.00 66.0% 31.8% Note: Shading indicates applicable MHI guidance range; All data includes Hollywood, FL property $73.77 $67.50 $75.00 $66.96 $60.00 $66.00 $72.00 $78.00 Q1 '09 Q1 '10 FY '09E FY '10E $73.00 |
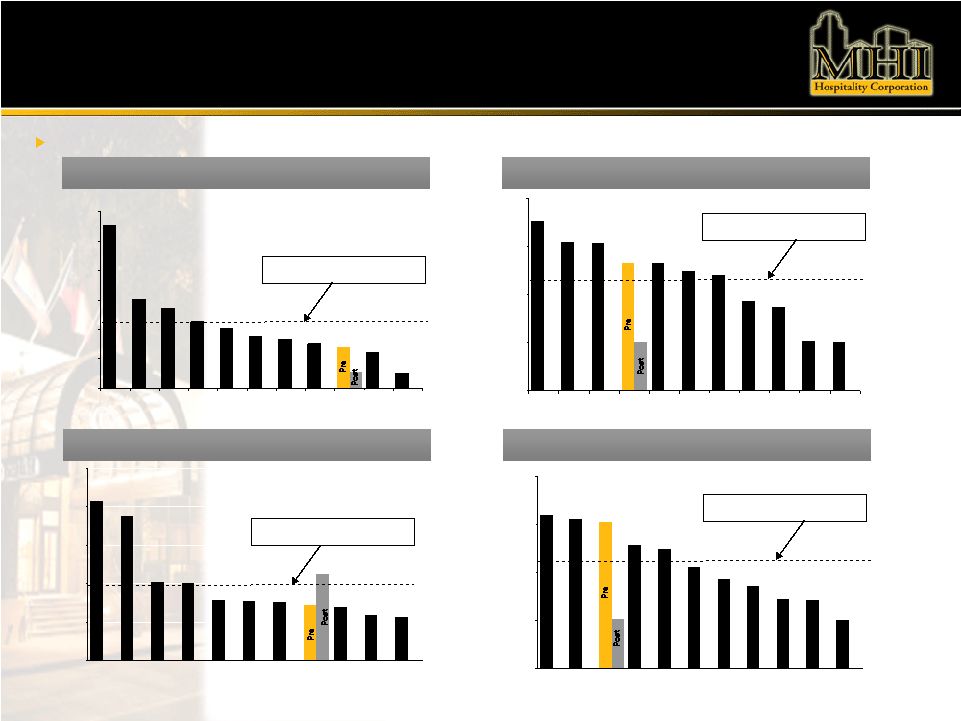
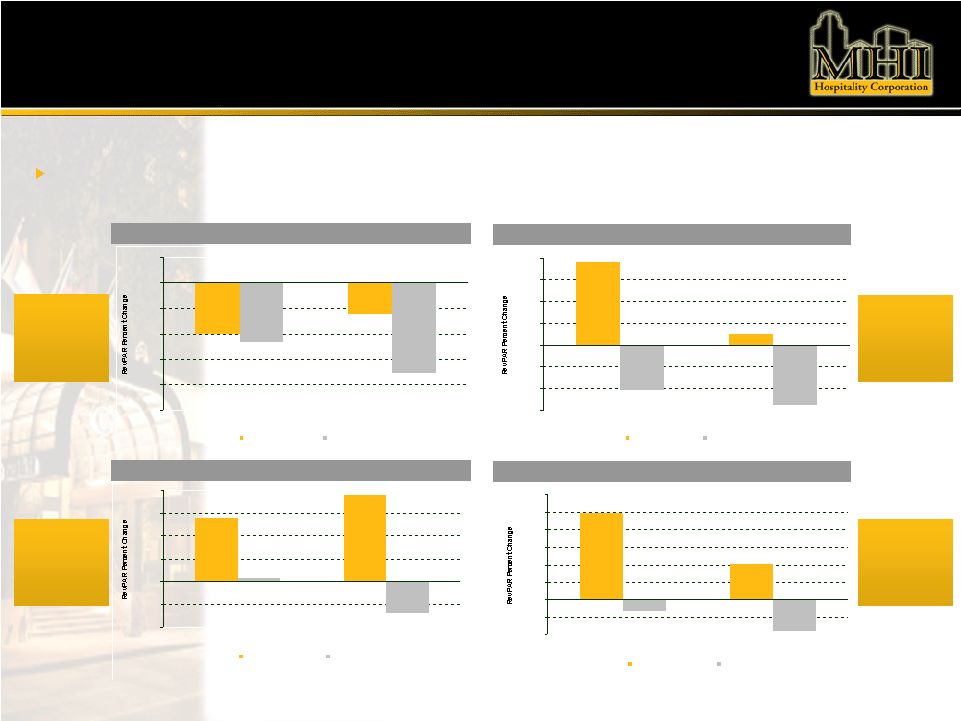 12 (10%) (5%) 0% 5% 10% 15% 20% 25% 30% Year to Date Running 12 Month Crowne Plaza Hollywood Competitive Set Portfolio Operating Trends (25%) (20%) (15%) (10%) (5%) 0% 5% Year to Date Running 12 Month Hilton Wilmington Competitive Set (15%) (10%) (5%) 0% 5% 10% 15% 20% Year to Date Running 12 Month Hilton Savannah Competitive Set (20%) (10%) 0% 10% 20% 30% 40% Year to Date Running 12 Month Sheraton Louisville Competitive Set MHI’s portfolio is strategically positioned to outperform its competitive set on a RevPAR basis in MHI’s markets Louisville, KY Hollywood, FL Savannah, GA Wilmington, NC Competitive Market Outperformance Source: Smith Travel Research as of 3/31/10 Note: Markets displayed above each contain a recently renovated MHI property Capturing share in a down market Starwood Tiffany Crystal Trophy Award - #1 ranked Sheraton Outperforming the market - significant RevPAR growth post-renovation Significant market penetration and RevPAR growth |
 13 Investment Highlights - Why Invest with MHI? Experienced and Invested Management Team High-Quality Portfolio With Significant Unrealized Value Current Yield via Post-Offering Reinstatement of Dividend Focused Investment Strategy to Capitalize on Compelling Market Opportunity Attractive Stock Entry Point Recapitalized Balance Sheet to Enable Future Growth |
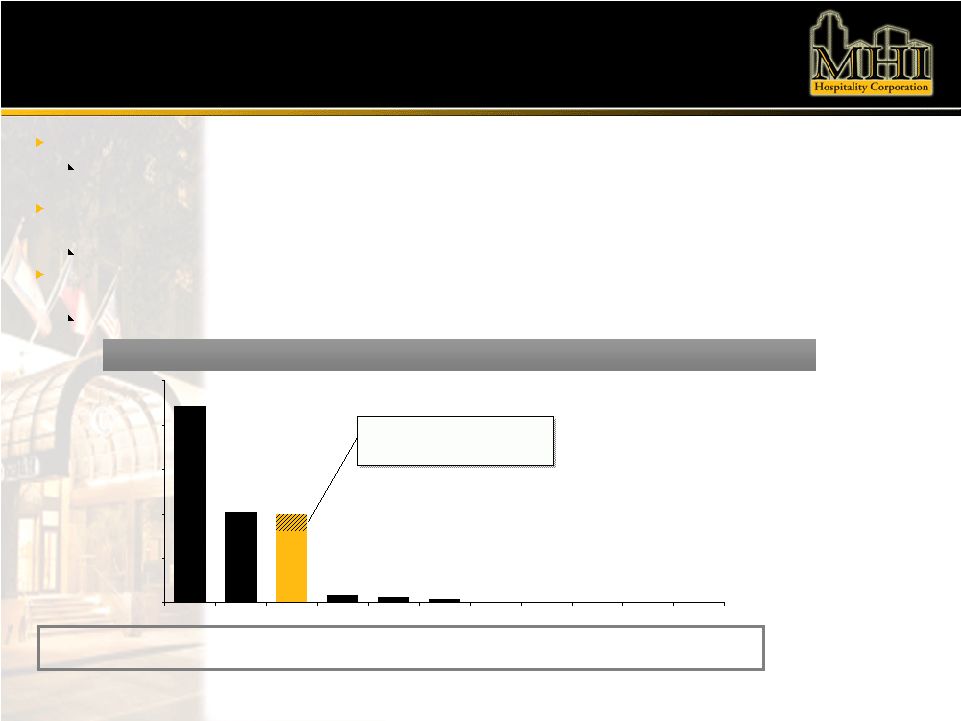
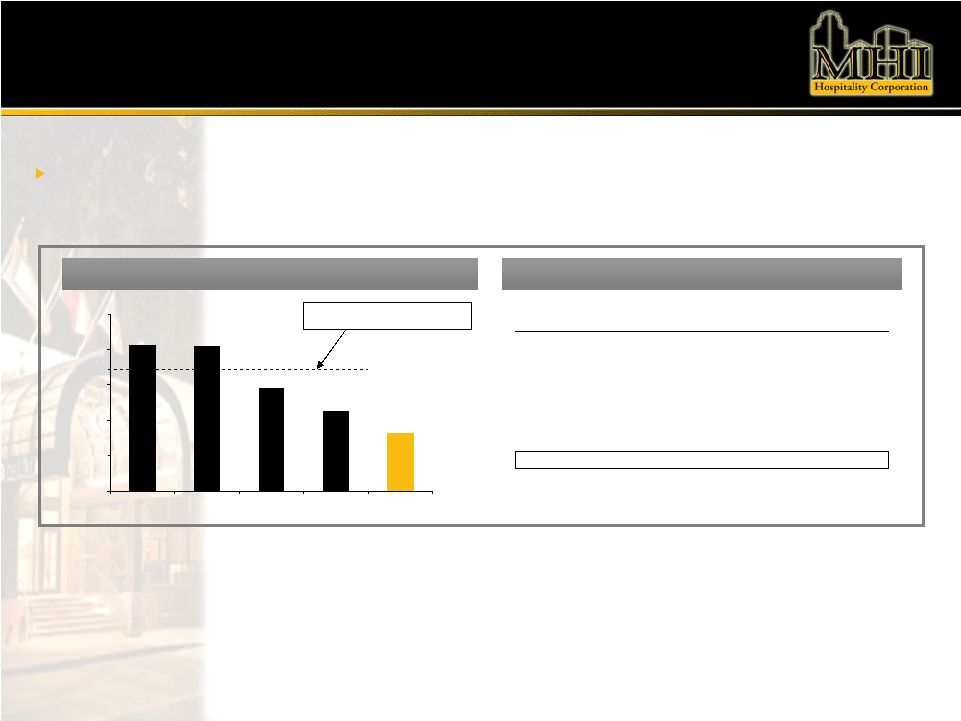 14 $207.2 $204.2 $145.9 $112.8 $82.4 $0.0 $50.0 $100.0 $150.0 $200.0 $250.0 SHO DRH HT FCH MDH Attractive Stock Entry Point Enterprise Value per Key – Public Valuation Recent Transactions – Private Valuation Public and Private Valuation Comparison Based on public and private market metrics, MHI’s current enterprise value per key of $82.4K implies a significant discount to underlying value Property Date Acquired Price / Key Hilton Checkers 4/29/2010 $208.2 Courtyard Anaheim 4/29/2010 208.2 Homewood Suites Portfolio 4/26/2010 90.4 Hyatt Regency Boston 3/18/2010 224.9 Holiday Inn Express Times Square 2/10/2010 262.9 Hampton Inn Times Square 1/11/2010 295.1 Candlewood Suites Times Square 1/11/2010 295.2 Average $226.4 ($ in thousands) ($ in thousands) Peer Average: $167.5 Source: SNL Financial as of 7/20/10 Note: MDH stock price equals $2.35 |
 15 1.7x 1.5x 1.4x 1.3x 1.3x 1.2x 1.2x 1.2x 0.9x 0.8x 0.6x 0.0x 0.2x 0.4x 0.6x 0.8x 1.0x 1.2x 1.4x 1.6x 1.8x LHO BEE SHO DRH HST HPT AHT HT FCH MDH SPPR Attractive Stock Entry Point MHI’s stock price is currently trading well below its peers on a trailing ADR Value Index (1) multiple basis This index adjusts for the quality of assets on a revenue basis, thus allowing for comparison between all brands across the chain scale ADR Value Index Source: SNL Financial as of 7/15/2010 Note: MDH stock price equals $2.37 (1) ADR Value Index = (Enterprise Value per Key / 1000) / 2009 ADR Peer Average: 1.2x MHI’s Implied Stock Price At the average ADR Value Index of 1.2x, MHI’s Enterprise Value per Key is approximately $132K, implying an underlying stock price of $9.57 (pre-reverse split) ADR Value Index Implied Offering Price Discount ($3.50 - $4.00) 1.0x $ 110.3 $ 6.05 (44%) - (36%) 1.1x 121.1 7.81 (56%) - (50%) 1.2x 131.8 9.57 (64%) - (59%) 1.3x 142.5 11.32 (70%) - (65%) 1.4x 153.2 13.08 (74%) - (70%) Note: MHI 2009 ADR = $107.21 (wholly-owned properties only) (1) Excludes rooms in unconsolidated joint venture Implied Enterprise Value / Key ($K) (1) Implied Stock Price |
 16 Investment Highlights - Why Invest with MHI? Experienced and Invested Management Team High-Quality Portfolio With Significant Unrealized Value Current Yield via Post-Offering Reinstatement of Dividend Focused Investment Strategy to Capitalize on Compelling Market Opportunity Attractive Stock Entry Point Recapitalized Balance Sheet to Enable Future Growth |
 17 8.9% 4.0% 0.4% 0.3% 4.1% 0.2% 0.0% 2.0% 4.0% 6.0% 8.0% 10.0% HPT HT MDH DRH HST LHO AHT FCH BEE SHO SPPR Reinstated Dividend From its IPO in late 2004 until December 2008, MHI paid a consistent quarterly dividend of $0.17 per quarter MHI amended its dividend policy in December 2008 and subsequently suspended its dividend, subject to minimum REIT requirements, in the interest of capital preservation amidst the onset of the current economic environment Application of the proceeds from the offering to pay down outstanding balance under the current credit facility will remove certain restrictions on paying a dividend Assuming completion of the offering, MHI intends to reinstate a quarterly dividend payable in Q4 2010 Targeted dividend yield of 3.5 to 4.0% with potential increases in the next calendar year; subject to Board approval and repayment of the credit facility Targeted dividend to be paid from CAD Source: SNL Financial as of 7/15/2010 Note: MDH CAD payout ratio assumes an offering at a stock price of $3.75, the mid-point of a $3.50 to $4.00 offer price range (pre-reverse split) Lodging REITs - Current Dividend Yield 3.5% 2010E FFO Payout Ratio: 3.5 – 4.0% Targeted Dividend Yield Range 57.5% 58.8% 50.0- 60.0% 6.1% 6.1% 3.4% N/A N/A N/A N/A N/A |
 18 Investment Highlights - Why Invest with MHI? Experienced and Invested Management Team High-Quality Portfolio With Significant Unrealized Value Current Yield via Post-Offering Reinstatement of Dividend Focused Investment Strategy to Capitalize on Compelling Market Opportunity Attractive Stock Entry Point Recapitalized Balance Sheet to Enable Future Growth |
 19 Pre Post Debt / Total Market Cap 75.9% 25.5% Debt / LTM EBITDA 10.6x 4.1x LTM EBITDA / Interest Expense 1.4x 2.3x Floating Rate / Total Debt 58.2% 22.9% Average Fixed Interest Rate 6.7% 6.1% Average Floating Interest Rate L + 3.0% L + 2.8% 25.5% 74.5% Pro Forma Capital Structure Note: Assumes all available extension options are exercised prior to maturity MHI’s use of proceeds will significantly delever the firm’s balance sheet and improve the firm’s credit statistics while enhancing free cash flow and liquidity condition Once the current credit facility is repaid, MHI plans to put in place a new facility with an estimated $30-40 million of capacity 24.1% 75.9% Debt Overview $0 $25,000,000 $50,000,000 $75,000,000 $100,000,000 2010 2011 2012 2013 2014 2015 Thereafter Credit Facility Mortgage Debt Other Loans Debt Maturity Schedule Post-Offering Capitalization Common Equity $173.3mm (1) Debt $59.2mm (2) Pre-Offering Capitalization Common Equity $48.3mm (1) Debt $152.4mm To be repaid with offering proceeds (1) Assumes market equity value at $3.75 stock price, the mid-point of a $3.50 to $4.00 offer price range (pre-reverse split). Post-offering capitalization assumes exercise of the underwriters’ overallotment option (2) Assumes repayment of $75,197,858 in debt outstanding on the Company’s credit facility and the $18,000,000 outstanding mortgage on the Crowne Plaza Jacksonville Riverfront |
 20 79.7% 77.8% 75.9% 64.3% 62.3% 52.8% 46.4% 43.1% 36.3% 36.0% 25.2% 25.5% 0.0% 25.0% 50.0% 75.0% 100.0% SPPR AHT MDH FCH BEE SHO HT HPT DRH HST LHO $276.5 $151.5 $136.7 $113.3 $88.5 $81.9 $74.9 $69.7 $60.3 $24.9 $27.1 $102.8 $0.0 $50.0 $100.0 $150.0 $200.0 $250.0 $300.0 BEE SHO AHT LHO FCH HST DRH HT MDH HPT SPPR 4.2x 3.8x 2.1x 2.0x 1.6x 1.6x 1.5x 1.4x 1.4x 1.2x 1.1x 2.3x 0.0x 1.0x 2.0x 3.0x 4.0x 5.0x LHO HPT DRH HST HT SPPR AHT MDH SHO FCH BEE 14.1x 12.4x 12.3x 10.6x 10.6x 9.9x 9.6x 7.4x 6.9x 4.1x 4.0x 4.1x 0.0x 4.0x 8.0x 12.0x 16.0x BEE AHT FCH MDH SPPR SHO HT DRH HST LHO HPT Pro Forma Capital Structure vs Peers Source: SNL Financial as of 7/15/2010 Note: MDH share price equals $2.37 Outstanding Debt + Pfd. Per Key Outstanding Debt / LTM EBITDA LTM EBITDA / Interest Expense Debt / Total Market Capitalization Peer Average: 9.3x Peer Average: $107.4 Peer Average: 2.0x Peer Average: 54.5% ($ in thousands) Post-offering, MHI’s leverage levels will compare favorably to its lodging REIT peer group Note: Total market capitalization assumes book value of debt plus preferred (as of 3/31/10) plus equity market cap assuming a $3.75 stock price Note: Outstanding debt, preferred and keys as of 3/31/10 Note: Outstanding debt and LTM EBITDA as of 3/31/10 Note: LTM EBITDA and interest expense as of 3/31/10 |
 21 Investment Highlights - Why Invest with MHI? Experienced and Invested Management Team High-Quality Portfolio With Significant Unrealized Value Current Yield via Post-Offering Reinstatement of Dividend Focused Investment Strategy to Capitalize on Compelling Market Opportunity Attractive Stock Entry Point Recapitalized Balance Sheet to Enable Future Growth |
 22 MHI Investment Strategy The acquisition of fully- stabilized/performing properties in MHI’s target markets Lack of availability of credit as a result of the recent economic downturn has led to an increase in attractive investment opportunities Stabilized/Performing Property Acquisition Opportunities Underperforming but structurally sound hotel that requires moderate renovation to re- establish the hotel in its market Shallow-Turn Opportunities Hotel that is closed or functionally obsolete Requires a restructuring of both operations and physical plant of the hotel Renovation of the building, furniture, fixtures and equipment Deep-Turn Opportunities Upbranding Opportunities Properties that can be upgraded physically and enhanced operationally to qualify for higher quality franchise brands Strategy can be executed in concert with a shallow or deep- turn opportunity Underperforming Property Acquisition Opportunities Historically, our investment strategy focused on the acquisition of underperforming hotel properties Purchased at significant discounts to replacement cost Candidates for renovation, upbranding and repositioning Current market conditions are expected to present opportunities to augment our historical strategy and acquire well-positioned, performing hotel properties at attractive prices Current “Buyers’ Market” Historic (2004-2008) “Sellers’ Market” |
 23 MHI Investment Strategy We intend to grow through acquisitions of full-service, upper-upscale and upscale hotel properties located in the growth markets of the Mid-Atlantic and Southern United States Our focus is on markets with significant barriers to entry and assets located in proximity to multiple demand generators Our acquisition opportunities are sourced through our management team’s extensive network of industry, corporate and institutional relationships We differentiate ourselves from most public REITs by targeting growing primary MSAs in the Mid-Atlantic and Southern U.S. that are typically deemed secondary or tertiary markets nationally Our competitors tend to focus on top-10 urban full-service and top-25 select-service markets. Alternatively, we believe opportunities will arise in our identified target markets We intend to deploy capital through different mechanisms which will allow us to acquire properties at a low basis through: Direct Purchase Opportunities – Used for traditional acquisitions Distressed Debt Opportunities – Mainly loan-to-own strategy Joint Venture / Mezzanine Lending opportunities – Utilized for deep-turn acquisitions Disciplined Acquisitive Growth Focus Off-Market Sourcing Differentiation Versatility |
 24 0.0% 2.0% 4.0% 6.0% 8.0% 10.0% 12.0% 14.0% Jan08 Apr08 Jul08 Oct08 Jan09 Apr09 Jul09 Oct09 Jan10 Apr10 Jul10 90+ Day Foreclosure Compelling Market Opportunity Since 2008, the U.S. lodging industry has experienced a substantial decline in operating fundamentals Operating fundamentals deterioration, combined with lack of available debt capital alternatives, has led to substantial distress for lodging property owners Valuations for hotel properties have fallen significantly since 2007 As lodging asset owners are forced to undertake distressed sales, MHI believes it will be well positioned to purchase assets at compelling prices Distressed Hotel Owners Limited Debt Capital Availability Expectations for Improving Fundamentals Compelling Investment Opportunities + + = Source: Commercial Mortgage Alert, March 31, 2010 Note: Includes U.S. agency and non-agency issuance U.S. Domestic CMBS Issuance by Year $48.2 $72.1 $58.9 $85.8 $99.5 $173.4 $210.1 $233.4 $15.8 $11.7 $9.8 $0.0 $50.0 $100.0 $150.0 $200.0 $250.0 2000 2001 2002 2003 2004 2005 2006 2007 2008 2009 2010YTD ($ in billions) Source: Bloomberg as of 7/20/10 U.S. Hospitality CMBS Delinquencies |
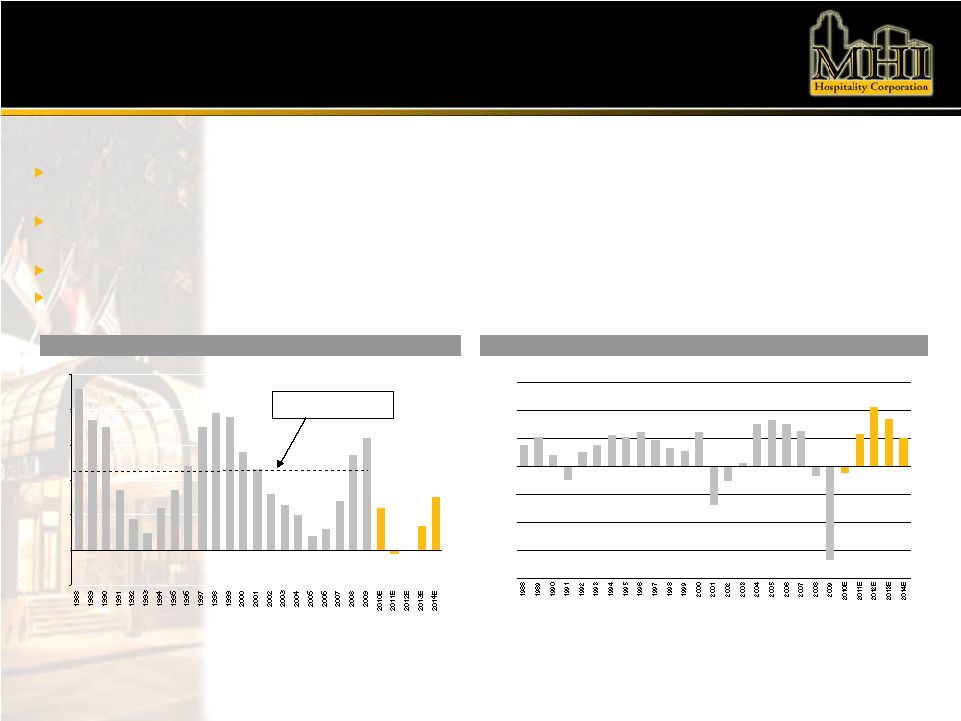 25 Compelling Market Opportunity Recent and projected industry metrics have given rise to predictions that the lodging industry will begin a strong-comeback post Labor Day Very limited construction supply coming online will allow current owners to ramp up ADRs over the next 12-18 months Financing is becoming more available on conservative but reasonable terms Smith Travel Research currently forecasts that 2011 will be the first year for annual RevPAR growth since 2007 (2.4%) 2.5% 5.3% 6.1% 2.7% 6.1% (6.9%) (2.6%) 0.5% 7.6% 7.6% 6.2% (1.7%) (16.7%) (1.1%) 5.8% 10.5% 5.2% 2.1% 5.0% 8.4% 8.3% 4.7% 3.3% 5.6% 3.7% 3.8% (20.0%) (15.0%) (10.0%) (5.0%) 0.0% 5.0% 10.0% 15.0% U.S. Annual RevPAR Change Source: Smith Travel Research Improving Fundamentals U.S. Annual Hotel Room Supply Growth Source: Smith Travel Research 4.6% 3.7% 3.5% 1.7% 0.9% 0.5% 1.2% 1.7% 2.4% 3.5% 3.9% 2.8% 2.3% 1.6% 1.3% 1.0% 0.4% 0.6% 1.4% 2.7% 3.2% 1.2% (0.1%) 0.0% 0.7% 1.5% 3.8% (1.0%) 0.0% 1.0% 2.0% 3.0% 4.0% 5.0% Average: 2.2% |
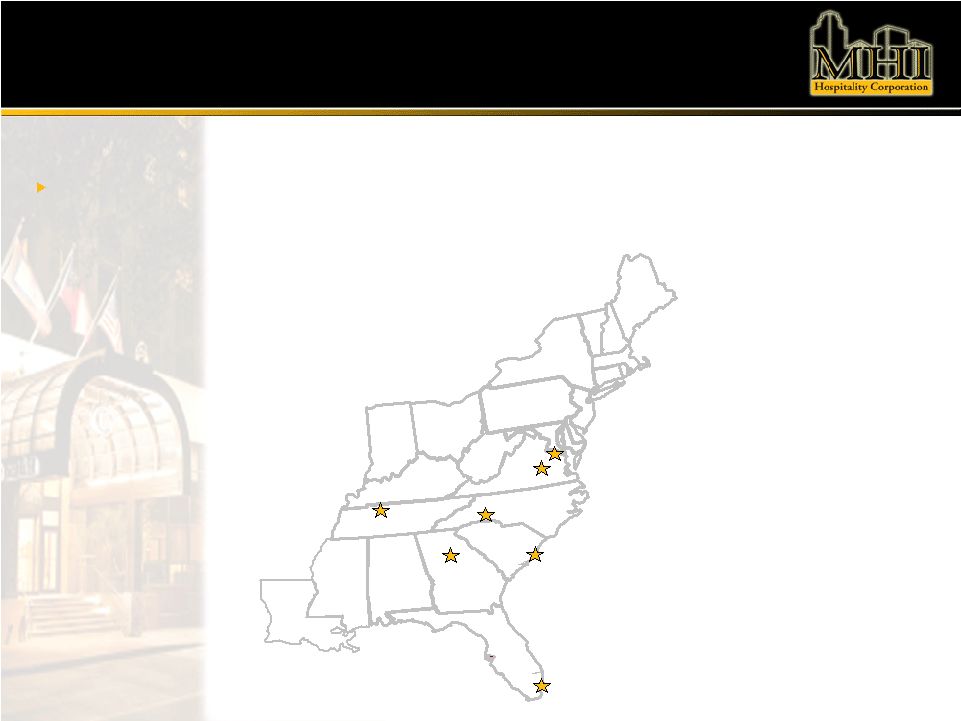 26 Compelling Market Opportunity Potential Acquisition Markets Potential acquisitions are focused on Mid-Atlantic and Southern markets including Washington, DC, Miami, FL, Atlanta, GA, Charlotte, NC, Charleston, SC, Nashville, TN and Richmond, VA Miami Charleston Charlotte Atlanta AL FL SC TN KY IN OH NC PA ME VA NY CT WV MD NJ VT NH MA DE RI GA LA MS Richmond Nashville Washington, DC |
 27 Investment Highlights Experienced and Invested Management Team High-Quality Portfolio With Significant Unrealized Value Current Yield via Post-Offering Reinstatement of Dividend Focused Investment Strategy to Capitalize on Compelling Market Opportunity Attractive Stock Entry Point Recapitalized Balance Sheet to Enable Future Growth |