MANAGEMENT DISCUSSION & ANALYSIS
For the period ended January 31, 2017
Directors and Officers as at March 16, 2017:
Directors:
| Gary Arca |
| Robert Eadie |
| Jordan Estra |
| David R. Gunning |
| Tanya Lutzke |
| Cory Kent |
| Ken Sumanik |
| Federico Villaseñor |
Officers:
| Executive Chairman, Chief Executive Officer & President – Robert Eadie |
| Chief Financial Officer – Gary Arca |
| Chief Operating Officer– Dave Gunning |
| Corporate Secretary –Cory Kent |
Contact Name: Gary Arca
Contact e-mail address: garca@starcore.com
TSX Symbol: SAM
| 1 |
Form 51-102-F1
STARCORE INTERNATIONAL MINES LTD.
MANAGEMENT DISCUSSION & ANALYSIS
For the period ended January 31, 2017
| 1. | Date of This Report |
This MD&A is prepared as of March 16, 2017.
This Management Discussion and Analysis (“MD&A”) should be read in conjunction with the unaudited condensed interim consolidated financial statements of Starcore International Mines Ltd. (“Starcore”, or the “Company”) for the period ended January 31, 2017.
Monetary amounts throughout this MD&A are shown in thousands of Canadian dollars, unless otherwise stated.
This MD&A includes certain statements that may be deemed “forward-looking statements”. Such statements and information include without limitation: statements regarding timing and amounts of capital expenditures and other assumptions; estimates of future reserves, resources, mineral production and sales; estimates of mine life; estimates of future mining costs, cash costs, minesite costs, Altiplano plant costs and other expenses; estimates of future capital expenditures and other cash needs, and expectations as to the funding thereof; statements and information as to the projected development of certain ore deposits, including estimates of exploration, development and production and other capital costs, and estimates of the timing of such exploration, development and production or decisions with respect to such exploration, development and production; estimates of reserves and resources, and statements and information regarding anticipated future exploration; the anticipated timing of events with respect to the Company’s minesite and; statements and information regarding the sufficiency of the Company’s cash resources. Such statements and information reflect the Company’s views as at the date of this document and are subject to certain risks, uncertainties and assumptions, and undue reliance should not be placed on such statements and information. Many factors, known and unknown could cause the actual results to be materially different from those expressed or implied by such forward looking statements and information. Such risks include, but are not limited to: the volatility of prices of gold and other metals; uncertainty of mineral reserves, mineral resources, mineral grades and mineral recovery estimates; uncertainty of future production, capital expenditures, and other costs; currency fluctuations; financing of additional capital requirements; cost of exploration and development programs; mining risks, risks associated with foreign operations; risks related to title issues; governmental and environmental regulation; and the volatility of the Company’s stock price. Investors are cautioned that any such statements are not guarantees of future performance and that actual results or developments may differ materially from those projected in the forward-looking statements.
| 2 |
| 2. | Overall Performance |
Description of Business
Starcore is engaged in exploring, extracting and processing gold and silver through its wholly-owned subsidiaries, Compañia Minera Peña de Bernal, S.A. de C.V. (“Bernal”), which owns the San Martin mine in Queretaro, Mexico and Altiplano GoldSilver S.A. de C.V (“Altiplano”), which owns the gold and silver processing plant in Matehuala, Mexico. The Company is a public reporting issuer on the Toronto Stock Exchange (“TSX”). The Company is also engaged in acquiring mining related operating assets and exploration assets in North America directly and through corporate acquisitions. The Company has interests in properties which are exclusively located in Mexico, USA and Canada.
Financial Highlights for period ending January 31, 2017
| · | Cash and short-term investments on hand is $4.7 million at January 31, 2017 compared to $10 million at April 30, 2016; |
| · | Gold and silver sales of $6.2 million for the three months ended January 31, 2017 compared to $7.0 million for the three months ended January 31, 2016, a decrease of 11%; |
| · | Loss from mining operations of $0.5 million for the three months ended January 31, 2017 compared to earnings of $0.7 million for the three months ended January 31, 2016; |
| · | Equivalent gold production of 11,794 ounces in period ended January 31, 2017 compared to production of 13,215 ounces in period ended January 31, 2016, a decrease of 11%; |
| · | Altiplano production of 65 ounces of gold and 20,470 ounces of silver in its first quarter of operations; |
| · | Mine operating cash cost is US$924/EqOz for the period ended January 31, 2017 compared to cost of US$846/EqOz for the period ended January 31, 2016; |
| · | All-in sustaining costs of US$1,171/EqOz for the period ended January 31, 2017 compared to costs of US$930/EqOz for the period ended January 31, 2016; |
| · | EBITDA(1) of $3,123 for the nine months ended January 31, 2017 compared to $4,499 for the nine months ended January 31, 2016. |
| Reconciliation of Net income to EBITDA | ||
| For the nine-month period ending January 31, | 2017 | 2016 |
| Net Income (loss) | $ (873) | $ 706 |
| Income tax recovery | (538) | (1,445) |
| Interest | 442 | 252 |
| Depreciation and depletion | 4,092 | 4,953 |
| EBITDA | $ 3,123 | $ 4,466 |
| EBITDA MARGIN(2) | 15.3% | 21.2% |
| (1) | EBITDA (“Earnings before Interest, Taxes, Depreciation and Amortization”) is a non-GAAP financial performance measure with no standard definition under IFRS. It is therefore possible that this measure could not be comparable with a similar measure of another Corporation. The Corporation uses this non-GAAP measure which can also be helpful to investors as it provides a result which can be compared with the Corporation market share price. |
| (2) | EBITDA MARGIN is a measurement of a company’s operating profitability calculated as EBITDA divided by total revenue. EBITDA MARGINis a non-GAAP financial performance measure with no standard definition under IFRS. It is therefore possible that this measure could not be comparable with a similar measure of another Corporation. The Corporation uses this non-GAAP measure which can also be helpful to investors as it provides a result which can be compared with the Corporation market share price. |
| 3 |
| 3. | Selected Annual Information |
The highlights of financial data for the Company for the three most recently completed financial years are as follows:
April 30, 2016 (9 months ended) | July 31, 2015 (year ended) | July 31, 2014 (year ended) | |||
| Revenues | $ 20,326 | $ 28,405 | $ 33,136 | ||
| Cost of Sales | (18,807) | (27,760) | (24,548) | ||
| Earnings from mining operations | 1,519 | 645 | 8,588 | ||
| Administrative Expenses | (3,963) | (2,355) | (3,557) | ||
| Income tax (expense) recovery | 2,639 | 1,920 | (2,066) | ||
| Total earnings | |||||
| (i) Total earnings | $ 195 | $ 210 | $ 2,965 | ||
| (ii) Earnings per share – basic | $ 0.00 | $ 0.00 | $ 0.02 | ||
| (iii) Earnings per share – diluted | $ 0.00 | $ 0.00 | $ 0.02 | ||
| Total assets | $ 78,907 | $ 69,197 | $ 65,094 | ||
| Total long-term liabilities | $ 13,324 | $ 15,141 | $ 14,295 | ||
| 4. | Results of Operations |
Discussion of Acquisitions, Operations and Financial Condition
The following should be read in conjunction with the unaudited condensed interim consolidated financial statements of the Company and notes attached thereto for the period ended January 31, 2017.
4.1San Martín Mine, Queretaro, Mexico
Reserves
The San Martin Mine, located approximately 50km east of the City of Queretaro, State of Queretaro, Mexico, consists of mining concessions covering 12,992 hectares and includes seven underground mining units and four units under exploration, as well as an additional property, San Pedrito, located 50 km west of San Martin. Luismin (now “Goldcorp Mexico”) operated the mine from 1993 to January, 2007 when it was purchased by Starcore. Starcore expects to continue to operate the mine over an expected mine life of at least 5 years based on the current expected conversion of known resources, and exploration is able to maintain approximately two years proven and probable reserves replacing those mined with new reserves, such that the total resource remains relatively constant from year to year. The Company’s last Resource estimate was filed on SEDAR “RESERVES AND RESOURCES IN THE SAN MARTIN MINE, MEXICO AS OF JULY 31, 2014”, dated October 6, 2014, prepared by Joseph Campbell, P. Eng. (the “Technical Report”), which is also available on the Company website www.starcore.com .
Production
The following table is a summary of mine production statistics for the San Martin mine for the three and nine month periods ended January 31, 2017 and for the previous nine month period ended April 30, 2016.
| 4 |
| Actual results for: | Unit of measure | 3 months ended January 31, 2017 | 9 months ended January 31, 2017 | 9 months ended April 30, 2016 |
| Mine production of gold in dore | thousand ounces | 3.0 | 11.1 | 12.3 |
| Mine production of silver in dore | thousand ounces | 15.5 | 51.9 | 70.2 |
| Total mine production – equivalent ounces | thousand ounces | 3.2 | 11.8 | 13.2 |
| Silver to Gold equivalency ratio | 70.7 | 70.4 | 76.2 | |
| Mine Gold grade | grams/tonne | 1.91 | 2.02 | 1.96 |
| Mine Silver grade | grams/tonne | 14.7 | 16.9 | 18.4 |
| Mine Gold recovery | percent | 70.7% | 81.3% | 84.9% |
| Mine Silver recovery | percent | 47.1% | 45.7% | 51.7% |
| Milled | thousands of tonnes | 69.7 | 209.3 | 229.6 |
| Mine development, preparation and exploration | meters | 1,223 | 4,117 | 4,079 |
| Mine operating cash cost per tonne milled | US dollars/tonne | 51 | 52 | 49 |
| Mine operating cash cost per equivalent ounce | US dollars/ounces | 1,105 | 924 | 846 |
| Number of employees and contractors at minesite |
| 319 | 319 |
299 |
During the quarter ended January 31, 2017, the mill operated at a rate of approximately 758 milled tonnes/calendar day. Gold and silver grades during the period ending January 31, 2017 was 1.91 g/t and 14.7 g/t, respectively, compared to prior comparable period grades of 1.99 g/t and 20.9 g/t. Overall equivalent gold production from the mine during the quarter ending January 31, 2017 of 3,237 ounces was lower than the previous comparable period production of 4,544 due to a lower overall production tonnage of 69,703 tonnes compared to 77,501 tonnes in prior comparable period coupled with lower ore grade.
Production cash costs of the mine for the current period ending January 31, 2017 were US$1,105/EqOz. This was higher than the prior comparable period ending January 31, 2016 amount of US$786/EqOz and higher than the prior year average of US$846/EqOz. The increase over the prior year is due to lower production overall as cash costs have remained stable.
Operating cash costs of US$51/t during the current period ending January 31, 2017 were higher than US$46/t during the prior period ending January 31, 2016. The costs were higher when compared to prior year of US$49/t due to increased stope development costs combined with higher input costs such as fuel, chemicals and labour. The mine plan has been developed to ensure the mine is properly developed and mined so as to ensure a constant supply of ore in accordance with currently planned production capacity and ore grades. Changes to the plan that may involve increased production and capital investment are continually being assessed by management. Currently, the Company is continuing underground exploration in order to identify higher grade ore zones and has allocated an adequate budget to support year-long exploration, exceeding 18,000 metres of underground exploration drilling for the 2017 calendar year compared to 12,000 metres in the prior year.
In addition to this, Altiplano secured the purchase of approximately 3.9 tonnes of granulated carbon which was processed at the new CIL/ADR plant at the San Martin Mine in Queretaro. This carbon was processed to produce approximately 185.4 ounces of gold and 342.2 ounces of silver which was sold directly by the mine operations in Q3, but which is in addition to the mine production results reported above.
| 5 |
During the quarter ended January 31, 2017, the Company incurred approximately US$369 in mine capital expenditures, which includes mine development drifting and drilling, machinery and equipment leases and purchases, and construction and tailings dam remediation, compared to US$343 in the prior comparable period ending January 31, 2016.
4.2 Property Activity
San Martin properties – Queretaro, Mexico
The San Martin mine properties are comprised of mining concessions covering 12,992 hectares, excluding the San Pedrito property located approximately 50km west of the San Martin mine. In addition to the ongoing mine exploration and development that is currently being performed in development of the mine, management is continually assessing the potential for further exploration and development of the San Martin properties and continually modifying the exploration budget accordingly.
The mine operates three underground drill rigs to provide information to assist with mine planning in addition to exploration, with the intent of increasing the reserves and resources on the property, and the Company has achieved budgeted targets of approximately 12,000 metres of underground exploration drilling in calendar 2016.
David Gunning, P.Eng., a director of the Company and Chief Operating Officer, is the Company’s qualified person under NI 43-101, and has reviewed and approved the scientific and technical disclosure on the San Martin Mine disclosed in this MD&A.
San Pedrito
The Company entered into a Binding Agreement (“Agreement”) to sell the San Pedrito Property located in Queretaro, Mexico. The sale is expected to net the Company approximately USD $7 Million. The Agreement requires the buyer to deposit 50 million Mexican Pesos (“MP”) (approximately USD $2.5 million), which has been received in trust and may only be released pending various confirmations, including compliance with state and municipal regulations and evidence that the property is in good standing.
The agreement is subject to a 50 million MP penalty clause in case of non-performance that will be effective if either the purchaser does not pay the owed amount when all the conditions have been met or if the Company does not wish to continue with the sale. Upon receipt of the required confirmations, the agreement provides for the subject conditions to be removed and the balance of funds to be paid immediately to the Company. The Company has not recorded the sale or deposit in the Financial Statement operating results due to the pending conditions precedent.
The San Pedrito property was part of Starcore’s original acquisition in 2007, when the Company acquired the San Martin Mine from Goldcorp for USD $26 million.
Acquisition of Cortez Gold Corp.
On August 5, 2015, the Company acquired Cortez Gold Corp. (“Cortez”) (TSXV: CUT) in an all-share transaction completed pursuant to a court approved Plan of Arrangement under the Business Corporations Act (British Columbia) (the “Arrangement”). Under the terms of the acquisition, each CUT shareholder received three Starcore common shares for every one CUT common share held by CUT shareholders (the “Exchange Ratio”). Cortez was a Vancouver-based junior resource company that owns the Altiplano gold and silver processing plant in Matehuala, Mexico and has a director and officer in common with the Company.
Pursuant to the Arrangement, the former Cortez shareholders hold 7,166,888 common shares of Starcore, representing 15.87%, of the 45,153,599 outstanding common shares of Starcore after issue of shares pursuant to the Arrangement. In addition, each holder of the outstanding common share purchase warrants of CUT
| 6 |
may receive such number of replacement warrants of Starcore based upon the Exchange Ratio and at the exercise price adjusted based upon the Exchange Ratio.
The Company valued the 7,166,888 shares at the fair market value on date of issue of $0.42 per share, for total consideration of $3,010, which was accounted for as acquisition of assets allocated based on their relative fair values on the closing date. The purchase price was allocated based on management’s best estimates and assumptions, after taking into account all relevant information available. As a result, apart from working capital allocations, $6,094 was allocated to plant, machinery and equipment.
Altiplano Goldsilver Processing Plant, Matehuala, Mexico
Altiplano has title to 20 hectares of land in Matehuala, S.L.P., Mexico, and to the buildings and equipment located thereon (the “Processing Plant”).
Located within a historic mining district in an area that is home to numerous medium-sized mining operations, the Altiplano Plant is designed to employ a cleaner and more economical treatment production process that will enable the facility to offer lower processing rates than those currently available to concentrate producers in the area.
The construction of the Processing Plant was completed in 2015 the Company announced that as of February 15, 2016, the Altiplano plant poured its first doré bar, weighing in at 21.131 kg.
The Company’s management determined the commencement of commercial production to be on November 1, 2016. In making this judgement, management assessed various sources of information including but not limited to operation management expertise, projected cash flow and determining sustainable level of production inputs available.
As a result, prior to commencement of commercial production, all of the pre-operational costs and any test production revenue were capitalized to Plant costs until the facility was of sufficient operational status with the ability to function as management intended.
During the current period ending January 31, 2017, sales of metals from the Altiplano Facility approximated 65 ounces of gold and 20,470 ounces of silver sold at average prices in the period of US$1,219 and US$16.94 per ounce, respectively.
| 7 |
Creston Moly
On February 19, 2015, the Company closed the transaction to acquire all of the shares of Creston Moly from Deloitte Restructuring Inc. in its capacity as trustee in bankruptcy of Mercator Minerals Ltd. at a purchase price of CDN $2 Million.
In June, 2011, Mercator Minerals Ltd. (“Mercator”), a TSX listed company, acquired Creston Moly in a cash and shares deal valuing Creston Moly at approximately $194 million. At that time, the Board of Directors of Creston Moly, after receiving the recommendation of its special committee and consultation with its financial and legal advisors, unanimously supported the arrangement whereby Mercator would acquire all of the issued and outstanding common shares of Creston.
BMO Capital Markets, financial advisor to Creston Moly and its Board, provided a fairness opinion to the effect that the consideration (of $194 million) was fair, from a financial point of view, to the shareholders of Creston Moly.1 Creston shareholders voted in favour of the acquisition. The most significant asset in this acquisition was the El Creston project in Sonora, Mexico which had been advanced to a completed Preliminary Economic Assessment ("PEA").
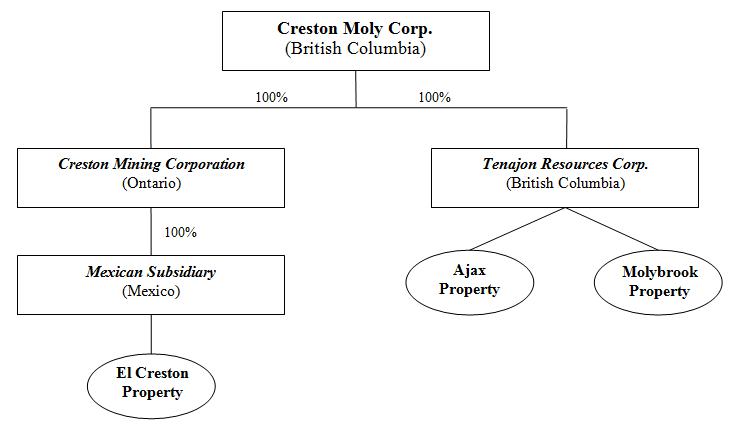
On September 5, 2014, pursuant to theBankruptcy and Insolvency Act (Canada), Mercator and Creston Moly were deemed to have filed assignments in bankruptcy. Creston Moly is a British Columbia company that owns, through its subsidiaries, a 100% interest in the following properties:
| · | The El Creston Project in Sonora, Mexico; |
| · | The Ajax Project in British Columbia; and |
| · | The Molybrook Project in Newfoundland. |
| 8 |
El Creston Project, Sonora, Mexico:2The El Creston molybdenum property is located in the State of Sonora, Mexico, 175 kilometres south of the US Border and 145 kilometers northeast of the city of Hermosillo. In 2010, a Preliminary Economic Assessment (“PEA”) was prepared on the project by an independent consulting firm. The result of this study indicated that the El Creston molybdenum-copper deposit had a US $561.9million net present value after tax (using an 8% discount rate). The internal rate of return (after tax) was calculated to be 22.3% and a capital cost payback was calculated to be four years.
Other highlights of the report include:
| · | Large moly-copper deposit in a mining-friendly jurisdiction. Total Measured and Indicated Resources of 215 million tonnes grading 0.071% Mo and 0.06% Cu, containing 336 Mlbs Mo and 281 Mlbs Cu. Mineral resources that are not mineral reserves do not have demonstrated economic viability; |
| · | Initial Capital cost:US$655.9million with payback of 4 years, based on metal prices of $15/lb Mo and $2.60/lb Cu. Metal recoveries were estimated at 88% for Mo and 84% for Cu; |
| · | Low Operating Cost: operating cost of $US4.12/lb Mo, net of copper credits, 0.84:1 waste to ore strip ratio within an optimized pit containing an additional 7.6 million tonnes of Inferred Resources responsible for $20M of the NPV; |
| · | Excellent infrastructure: Road accessible with a 230kV power grid within 50 km; |
| · | Apart from the PEA,recommendations have been made to test known mineralization below the current pit-limiting “Creston Fault” where results such as drill hole EC08-54 returned 241.4m at 0.083% Mo and 0.059% Cu to a depth of 495m in the Red Hill Deep zone. |
David Gunning, P.Eng., a director of the Company and Chief Operating Officer, is the Company’s qualified person under NI 43-101, and has reviewed and approved the scientific and technical disclosure on the El Creston Project disclosed in this report.
Ajax, British Columbia, Canada3
Ajax Molybdenum Property is comprised of 11,718 hectares and is located 13 km north of Alice Arm, British Columbia. The Ajax Property, one of North America's largest undeveloped molybdenum deposits occupying a surface area of approximately 600 by 650 metres, is a world class primary molybdenum property in the advanced stage of exploration.
Molybrook, Newfoundland, Canada4
Creston’s Molybrook molybdenum property located on the south coast of Newfoundland is centred 2.5 km from the outport of Grey River less than 4 kilometres from a deep water, ice free navigable fjord. The property hosts a 3 km long trend in which at least three zones of at surface molybdenum mineralization occur:
| 9 |
Molybrook, Wolf and Chimney Pond. To date, almost all exploration has been completed on the Molybrook Zone where a large porphyry molybdenum deposit has been outlined.
The Company owns 100% of the 44 mineral claims of the Moly Brook molybdenum property, located 2.5 km from the Hamlet of Grey River on the southern coast of Newfoundland, pursuant to the acquisition of Creston Moly Corp. The Moly Brook property is subject to a 2% net smelter royalty (“NSR”), of which 1.5% can be purchased by the Company for $1.5 million.
During the year ending April 30, 2016, the Company reduced its claims to focus on the core project and to reduce its holding costs.
American Consolidated Minerals Corp.
On November 20, 2014, the Company announced the approval of the proposed acquisition of American Consolidated Minerals Corp (“AJC”) pursuant to a plan of arrangement (the “Transaction”) by the AJC shareholders.
The Transaction was completed on December 1, 2014 upon the satisfaction of all of the conditions set out in the arrangement agreement entered into by AJC and the Company on October 1, 2014, including approval by the Supreme Court of British Columbia.
Pursuant to the acquisition of AJC, the Company has acquired the right to 3 properties as follows:
Sierra Rosario,Sinaloa, Mexico
Pursuant to the acquisition of AJC, the Company acquired a 50% interest in two claims over the 500-hectare Sierra Rosario Property, located in the state of Sinaloa, Mexico.
During the year ended July 31, 2015, the Company acquired the remaining 50% interest from the optionor for $25 and a 1% NSR over the entire property.
Toiyabe, Nevada, USA
Pursuant to the acquisition of AJC, the Company has acquired the right to a 100% undivided interest, subject to a 3% NSR, in 165 mining claims located in Lander County, Nevada, United States of America (“Toiyabe”) from MinQuest.
Consideration to be paid for the interest is US$900 and the Company must incur total exploration expenditures of US$1,025 (US$1,025 incurred) on the property, by the fifth anniversary of the “New Effective Date” as agreed by MinQuest. The New Effective Date shall be the earlier of October 15, 2018 or the date the Company enters into a joint venture agreement over Toiyabe or the date that the Company completes a bankable feasibility study on the property.
The optionor has also granted the Company the right to purchase up to one-half of the NSR (or 1.5%) on the basis of US$2 million per each 1% of the royalty.
During the period ending October 31, 2016, the Company completed Phase 1 drilling on the Toiyabe property. A total of 3,011 meters of RC/core were drilled in 15 holes. Shallow RC drill holes have identified a possible extension of the near-surface resource and the first deep core hole has identified high-grade gold mineralization (1.5 m of 12.9 g/t Au) at depth.
Reverse Circulation (RC) drilling, including two pre-collar holes, consisted of fifteen holes for a total footage of 2,537 meters. Core drilling totalled 474 meters in two holes. A summary of assay results received to date are shown below. A map of drill hole locations can be found on the Company website https://www.starcore.com .
| 10 |
| Toiyabe Project 2016 Phase 1 Initial Assay Results | |||||||
| Hole ID | AZIMUTH | INCL | T DEPTH (m) | FROM (m) TO (m) | THICKNESS (meters) | Au g/t | |
| T-1601 | NA | -90 | 140.2 | 77.7 | 112.8 | 35.1 | 0.31 |
| T-1601C | NA | -90 | 390.4 | 269.1 | 294.1 | 40.2 | 1.30 |
| includes | 255.4 | 258.5 | 3 | 7.70 | |||
| includes | 255.4 | 256.9 | 1.5 | 12.90 | |||
| T-1602 | NA | -90 | 134.1 | 67.1 | 80.8 | 13.7 | 0.16 |
| T-1607 | NA | -90 | 196.6 | 13.7 | 16.8 | 3 | 1.90 |
| T-1608 | NA | -90 | 208.8 | 120.4 | 123.4 | 3 | 0.16 |
| 132.6 | 138.7 | 6.1 | 0.32 | ||||
| 146.3 | 164.6 | 18.3 | 0.46 | ||||
| 179.8 | 192.0 | 12.2 | 0.13 | ||||
| T-1609 | 45 | -60 | 91.4 | 32.0 | 33.5 | 1.5 | 0.88 |
| T-1611 | NA | -90 | 213.3 | NSV | |||
| T-1612 | NA | -90 | 342.9 | 193.5 | 201.2 | 7.6 | 0.11 |
| T-1613 | NA | -90 | 315.5 | 76.2 | 89.9 | 13.7 | 0.27 |
| T-1615 | 45 | -45 | 163.1 | 82.3 | 89.9 | 7.6 | 0.23 |
| 99.1 | 103.6 | 4.6 | 0.24 | ||||
| T1616 | 45 | -45 | 152.4 | 41.1 | 48.8 | 7.6 | 0.13 |
| 36.6 | 76.2 | 39.6 | 0.15 | ||||
| T-1618 | 45 | -45 | 91.4 | 7.6 | 12.2 | 4.6 | 0.28 |
| 82.3 | 83.8 | 1.5 | 0.82 | ||||
| T-1619 | 45 | -45 | 121.9 | 38.1 | 44.2 | 6.1 | 1.07 |
| T-1620 | 45 | -45 | 121.9 | 108.2 | 114.3 | 6.1 | 0.16 |
| T-1621 | 45 | -45 | 121.9 | 68.6 | 74.7 | 6.1 | 1.08 |
| T-1622 | 45 | -45 | 121.9 | 50.3 | 53.3 | 3 | 3.10 |
Assays from T-1601C, the first deep core hole, show a broad mineralized zone from 254 to 294 meters (40 m) which averages 1.3 g/t Au. This zone includes 3 meters of 7.7 g/t Au (255.4-258.4 m) or 1.5 meters of 12.9 g/t Au (255’4-256.9 m). The mineralized intervals coincide closely with highly altered breccia within broad fault zones.
The RC program targeted a combination of resistivity high anomalies as well as offsets and extensions to mineralization associated with the Courtney fault zones. A near-surface NI43-101 resource of 173,562 contained ounces of gold was published in 2009. Fifteen of the initially proposed RC holes were completed for a total drilling footage of 2,537 meters. Seven of the fifteen RC holes were lost short of targeted horizons. Even with these drilling limitations, fourteen of the fifteen RC holes encountered anomalous gold values as shown in the table above.
All RC drilling samples are collected in 1.5 meter intervals, logged and securely shipped to ALS Chemex Labs Inc. in Reno, Nevada to be analyzed for gold and silver by fire assay. A second sample split is kept on site for possible re-testing or future metallurgy. Standards and blanks are included with the sample submittals and numerous repeat assays conducted. The core is logged, sample intervals marked on the core either in 1.5 meter lengths or geologic/structural breaks, sawed and half core assayed the same as the RC procedure mentioned above.
Richard Kern, Certified Professional Geologist (#11494) is the Qualified Person who has prepared and reviewed the technical information on the Toiyabe property in accordance with NI 43-101 reporting standards.
| 11 |
Lone Ranch, Washington, USA
Pursuant to the acquisition of AJC, the Company has acquired the right to a 100% undivided interest, subject to a 3% NSR in 73 mining claims located in Ferry County, Washington State, United States of America (“Lone Ranch”) from MinQuest Inc. (“MinQuest”).
Consideration to be paid for the interest is US$360, and the Company must incur total exploration expenditures of US$1,225 ($175 incurred) on the property, by the third anniversary of the “New Effective Date” as agreed by MinQuest. The New Effective Date shall be the earlier of October 15, 2018 or the date the Company enters into a joint venture agreement over the property or the date that the Company completes a bankable feasibility study on the property.
The optionor has also granted the Company the right to purchase up to one-half of the NSR (or 1.5%) on the basis of US$1.5 million per each 1% of the royalty. If the Company does not incur the exploration expenditures as specified, the unpaid portions may be paid to the optionor to maintain the option.
| 4.3 | Results of Operations |
The Company recorded a loss for the nine month period ended January 31, 2017 of $873 compared with earnings of $706 for the comparative period ended January 31, 2016. The details of the Company’s operating results and related revenues and expenses are as follows:
| For the nine month period ended January 31, | 2017 | 2016 | Variance |
| Revenues | |||
| Mined ore | $ 19,657 | $ 21,024 | $ (1,367) |
| Purchase concentrate | 756 | - | 756 |
| Total Revenue | 20,413 | 21,024 | (611) |
| Cost of Sales | |||
| Mined ore | (13,736) | (14,658) | 922 |
| Purchase concentrate | (663) | - | (663) |
| Depreciation and depletion | (4,092) | (4,953) | 861 |
| Total Cost of Sales | (18,491) | (19,611) | 1,120 |
| Earnings from mining operations | 1,922 | 1,413 | 509 |
| Financing costs (net) | (434) | (181) | (253) |
| Foreign exchange gain | 489 | 1,278 | (789) |
| Professional and consulting fees | (472) | (665) | 193 |
| Management fees and salaries | (1,320) | (1,026) | (294) |
| Office and administration | (1,292) | (1,224) | (68) |
| Shareholder relations | (146) | (106) | (40) |
| Transfer agent and regulatory fees | (158) | (228) | 70 |
| Loss before taxes | (1,411) | (739) | (672) |
| Income tax recovery | |||
| Current | - | 47 | (47) |
| Deferred | 538 | 1,398 | (860) |
| Earnings for the period | $ (873) | $ 706 | $ (1,579) |
| 12 |
Overall, total revenue decreased by $611 compared to the prior period due mainly to lower metal production. Cost of sales decreased in the current period due to lower tonnage processed and lower overall mine development costs.
Sales of metals for the period ended January 31, 2017 approximated 11,490 ounces of gold and 57,635 ounces of silver sold at average prices in the period of US$1,267 and US$18.08 per ounce, respectively. Sales in the comparative period ended January 31, 2016 were approximately 13,352 ounces of gold and 82,991 ounces of silver, sold at a lower average price of US$1,126 and US$15.01 per ounce, respectively.
The total cost of sales above includes non-cash expenses for depreciation and depletion of $4,092 compared to $4,953 in the comparable period last period, which is calculated based on the units of production from the mine over the expected mine production as a denominator. This calculation is based solely on the San Martin mine proven and probable reserves and a percentage of inferred resources in accordance with the Company’s policy of recognizing the value of expected Resources which will be converted to Proven and Probable Reserves, as assessed by management.
For the period ended January 31, 2017, the Company produced $1,922 in earnings from mine operations compared to earnings from mining operations of $1,413 for the period ended January 31, 2016. This increase was due in part to higher metal prices.
Cost of sales decreased to $18,491 in the current period ending January 31, 2017 compared to $19,611 in the prior comparable period ending January 31, 2016. Mined ore costs decreased in the current period due mainly to lower production tonnage and weakening Mexican pesos against the strengthening USD and CAD, which converted into Canadian Dollar (“CDN”) at $1.3030 in the current period compared to $1.2549 at April 30, 2016, thereby lowering the mining and operational costs which are incurred mainly in Mexican pesos.
Other Items
Changes in other items for the period ended January 31, 2017, resulted in the following significant changes from the period ended January 31, 2016:
| · | Financing costs during the period increased to $253 due to the additional $4,500 in debt that was raised by the Company to finance the Altiplano project and to acquire additional inventory; |
| · | Foreign exchange gain decreased by $789 for the period ending January 31, 2017. The decrease relates primarily due to the substantial increase in the foreign exchange gain in the prior comparable period. In the current period ending January 31, 2017, the Company incurred a gain of $489 due to the weakening of the Mexican pesos and Canadian dollar in relation to the US dollar which is the functional currency of the mining operations. |
| · | Professional and consulting fees decreased by $193 to $472 due to lower fees charged in relations to legal, tax and audit fees in the prior comparative period. |
| · | Management fees and salaries increased by $294 to $1,320 due the issuance of Deferred Share Units & Restricted Share Units. The Company expensed $286 in the current period based on the value of these units. |
| · | Deferred Income Tax Recovery decreased by $860 due to the Company recognizing its ability to use a lower balance relating to non-capital loss carry forwards in the current and future years. |
| 13 |
Sustaining Costs
In conjunction with a non-GAAP initiative being undertaken within the gold mining industry, the Company has adopted an “all-in sustaining cash cost” non-GAAP performance measure that the Company believes more fully defines the total costs associated with producing gold; however, this performance measure has no standardized meaning. As the measure seeks to reflect the full cost of equivalent gold production from current operations, new project capital is not included in the calculation. Accordingly, it is intended to provide additional information and should not be considered in isolation or as a substitute for measures of performance prepared in accordance with GAAP. The Company reports this measure on a sales basis:
(In Canadian Dollars unless indicated) |
Sustaining Costs (in 000’s) |
Sustaining Costs Per Ounce (in $/oz) | ||
| For the period ended January 31, | 2017 | 2016 | 2017 | 2016 |
| Total cost of sales cash costs1 | $ 13,736 | $ 14,658 | $ 1,116 | $ 988 |
| Total corporate and administration cash costs2 & 3 | 3,396 | 3,235 | 276 | 180 |
| Foreign exchange gain | (489) | (1,278) | (40) | (76) |
| Reclamation and closure accretion | 52 | 59 | 4 | 4 |
| Sustaining capital expenditures and exploration3 | 2,234 | 2,392 | 181 | 168 |
| All-in sustaining cash costs | 18,928 | 19,066 | 1,537 | 1,264 |
| Foreign exchange adjustment | (4,509) | (4,528) | (366) | (334) |
| All-in sustaining USD cash costs | $ 14,419 | $ 14,538 | $ 1,171 | $ 930 |
| Total equivalent ounces sold | 12,312 | 14,452 | ||
1 Excludes non-cash depletion of $4,092 (January 31, 2016: $4,953) and financing charges of $442 (January 31, 2016: $252) for the period ended January 31, 2017.
2 Includes non-cash share-based compensation of $286 for the period ending January 31, 2017 (January 31, 2016: $Nil).
3 Certain capital expenditures costs that are non-sustaining costs have been excluded in accordance with AISC guidelines.
Cash Flows
Cash flows generated from operating activities were $370 during the period ended January 31, 2017, compared to an inflow of $2,539 for the comparative period ended January 31, 2016. Cash flows from operating activities were determined by removing non-cash expenses from the earnings and adjusting for non-cash working capital amounts. Cash spent on financing activities resulted in an outflow of $360 (January 31, 2016 - $4,959). Cash used for investing activities resulted in an outflow of $598 due to investment in mining interest, plant and equipment of $2,302, investment in exploration and evaluation assets of $1,870 and inflow sale of short term investment of $3,535. Overall cash decreased during the period ended January 31, 2017 by $588.
Investor Relations Activities
During the period ended January 31, 2017, the Company responded directly to investor inquiries.
Financings, Principal Purposes & Milestones
During the period ended January 31, 2017, the Company did not have any financings.
| 14 |
5.Summary of Quarterly Results
The following is a summary of the Company’s financial results for the eight most recently completed quarters:
Q3 31-Jan-17 | Q2 31-Oct-16 | Q1 31-Jul-16 | Q3 30-Apr-16 | |
| Total Revenue | $ 6,164 | $ 7,061 | $ 7,188 | $ 5,668 |
| Earnings (loss) from mining operations | $ (495) | $ 1,269 | $ 1,148 | $ (287) |
Earnings (loss) for period | $ (1,546) | $ 187 | $ 486 | $ (283) |
Per share – basic | $ (0.03) | $ 0.00 | $ 0.01 | $ (0.01) |
Per share – diluted | $ (0.03) | $ 0.00 | $ 0.01 | $ (0.01) |
Q2 31-Jan-16 | Q1 31-Oct-15 | Q4 31-Jul-15 | Q3 30-Apr-15 | |
| Total Revenue | $ 6,954 | $ 7,704 | $ 6,366 | $ 7,227 |
| Earnings (loss) from mining operations | $ 670 | $ 1,136 | $ (393) | $ 374 |
Earnings (loss) for period | $ 240 | $ 562 | $ (96) | $ (484) |
Per share – basic | $ 0.00 | $ 0.01 | $ (0.00) | $ (0.01) |
Per share – diluted | $ 0.00 | $ 0.01 | $ (0.00) | $ (0.01) |
Discussion
The Company reports loss of $1,546 for the quarter compared to earnings of $240 in the comparative quarter ended January 31, 2016. Revenue from mining operations decreased in this quarter to $6,164 from the comparative quarter of $6,954 as a result of lower metal production. For more detailed discussion on the quarterly production results and financial results for the quarter ended January 31, 2017, please refer toSections 4.1 and 4.3 under “Results of Operations”.
6.Liquidity and Commitments
The Company expects to continue to receive income and cash flows from the mining operations at San Martin (section 4.1). Management expects that this will result in sufficient working capital and liquidity for the Company for the next twelve months.
As at January 31, 2017, the Company had the following commitments:
| a) | As at January 31, 2017, the Company has shared lease commitments for office space of approximately $144 per year, expiring at various dates up to April 2020, which includes minimum lease payments and estimated taxes, but excluded operating costs, taxes and utilities, to expiry. |
| b) | As at January 31, 2017, the Company has a land lease agreement commitment with respect to the land at the mine site, for $132 per year until December 2017. The Company also has ongoing commitments on the exploration and evaluation assets of approximately $220 per year. |
| c) | As at January 31, 2017, the Company has management contracts to officers and directors totaling $840 per year, payable monthly, expiring in January 2020. |
| 15 |
| Obligations due within twelve months of January 31: | 2017 | 2018-2020 | 2021 and beyond |
| Trade and other payables | $ 2,205 | $ - | $ - |
| Loan payable | 6,119 | - | - |
| Rehabilitation and closure cost provision | - | - | 903 |
7.Capital Resources
The capital resources of the Company are the mining interests, plant and equipment, with an amortized historical cost of $52,918 as at January 31, 2017. The Company is committed to further expenditures of capital required to maintain and to further develop the San Martin mine which management believes will be funded directly from the operating cash flows of the mine.
8.Off Balance Sheet Arrangements
The Company has no off balance sheet transactions.
9.Transactions with Related Parties
There were no other material reportable related party transactions.
10.Third Quarter
Due to mine operating activity of the San Martin mine discussed throughout this MD&A and as detailed in Section 4.1, the operations and activities are similar to previous quarters which are discussed inSection 4.3 – Results of Operations.
11.Proposed Transactions
San Pedrito
The Company entered into a Binding Agreement (“Agreement”) to sell the San Pedrito Property located in Queretaro, Mexico. The sale is expected to net the Company approximately USD $7 Million. The Agreement requires the buyer to deposit 50 million Mexican Pesos (“MP”) (approximately USD $2.8 million), which has been received in trust and may only be released pending various confirmations, including compliance with state and municipal regulations and evidence that the property is in good standing.
The agreement is subject to a 50 million MP penalty clause in case of non-performance that will be effective if either the purchaser does not pay the owed amount when all the conditions have been met or if the Company does not wish to continue with the sale. Upon receipt of the required confirmations, the agreement provides for the subject conditions to be removed and the balance of funds to be paid immediately to the Company. The Company has not recorded the sale or deposit in these Financial Statements due to the pending conditions precedent.
12.Critical Accounting Estimates
The Company makes estimates and assumptions about the future that affect the reported amounts of assets and liabilities. Estimates and judgements are continually evaluated based on historical experience and other factors, including expectations of future events that are believed to be reasonable under the circumstances. In the future, actual experience may differ from these estimates and assumptions.
The effect of a change in accounting estimate is recognized prospectively by including it in the Company’s profit or loss in the period of the change, if it affects that period only, or in the period of the change and future periods, if the change affects both.
| 16 |
Information about critical judgements in applying accounting policies that have the most significant risk of causing material adjustment to the carrying amounts of assets and liabilities recognized in the consolidated financial statements within the current financial period are discussed below:
| a) | Economic Recoverability and Profitability of Future Economic Benefits of Mining Interests |
Management has determined that mining interests, evaluation, development and related costs incurred which have been capitalized are economically recoverable. Management uses several criteria in its assessments of economic recoverability and probability of future economic benefit including geologic and metallurgic information, history of conversion of mineral deposits to proven and probable reserves, scoping and feasibility studies, accessible facilities, existing permits and life of mine plans.
b)Rehabilitation Provisions
Rehabilitation provisions have been created based on the Company’s internal estimates. Assumptions, based on the current economic environment, have been made which management believes are a reasonable basis upon which to estimate the future liability. These estimates take into account any material changes to the assumptions that occur when reviewed regularly by management. Estimates are reviewed annually and are based on current regulatory requirements. Significant changes in estimates of contamination, restoration standards and techniques will result in changes to provisions from period to period. Actual rehabilitation costs will ultimately depend on future market prices for the rehabilitation costs, which will reflect the market condition at the time of the rehabilitation costs are actually incurred. The final cost of the currently recognized rehabilitation provision may be higher or lower than currently provided for.
The inflation rate applied to estimated future rehabilitation and closure costs is 3.5% and the discount rate currently applied in the calculation of the net present value of the provision is 8%
c)Impairments
The Company assesses its mining interest, plant and equipment assets annually to determine whether any indication of impairment exists. Where an indicator of impairment exists, a formal estimate of the recoverable amount is made, which is considered to be the higher of the fair value less costs to sell and value in use. These assessments require the use of estimates and assumptions such as long-term commodity prices, discount rates, future capital requirements, exploration potential and operating performance.
d)Income Taxes
Significant judgment is required in determining the provision for income taxes. There are many transactions and calculations undertaken during the ordinary course of business for which the ultimate tax determination is uncertain. The company recognizes liabilities and contingencies for anticipated tax audit issues based on the Company’s current understanding of tax law. For matters where it is probable that an adjustment will be made, the Company records its best estimate of the tax liability including the related interest and penalties in the current tax provision. Management believes they have adequately provided for the probable outcome of these matters; however, the final outcome may result in a materially different outcome than the amount included in the tax liabilities.
In addition, the Company recognizes deferred tax assets relating to tax losses carried forward to the extent there are sufficient taxable temporary differences (deferred tax liabilities) relating to the same taxation authority and the same taxable entity against which the unused tax losses can be utilized. However, utilization of the tax losses also depends on the ability of the taxable entity to satisfy certain tests at the time the losses are recuperated.
| 17 |
e)Share-Based Payment Transactions
The Company measures the cost of equity-settled transactions with employees, and some with non-employees, by reference to the fair value of the equity instruments at the date at which they are granted. Estimating fair value for share-based payment transactions requires determining the most appropriate valuation model, which is dependent on the terms and conditions of the grant. This estimate also requires determining the most appropriate inputs to the valuation model including the expected life of the share option, volatility and dividend yield and making assumptions about them.
f)Mineral Reserves and Mineral Resource Estimates
Mineral reserves are estimates of the amount of ore that can be economically and legally extracted from the Company’s mining properties. The Company estimates its mineral reserve and mineral resources based on information compiled by Qualified Persons as defined by Canadian Securities Administrators National Instrument 43-101 Standards for Disclosure of Mineral Projects. Such information includes geological data on the size, depth and shape of the mineral deposit, and requires complex geological judgments to interpret the data. The estimation of recoverable reserves is based upon factors such as estimates of commodity prices, future capital requirements, and production costs along with geological assumptions and judgments made in estimating the size and grade that comprise the mineral reserves. Changes in the mining reserve or mineral resource estimates may impact the carrying value of mineral properties and deferred development costs, property, plant and equipment, provision for site reclamation and closure, recognition of deferred income tax assets and depreciation and amortization charges.
g)Units of production depletion
Estimated recoverable reserves are used in determining the depreciation of mine specific assets. This results in depreciation charges proportional to the depletion of the anticipated remaining life of mine production. Each item’s life, which is assessed annually, has regard to both its physical life limitations and to present assessments of economically recoverable reserves of the mine property at which the asset is located. These calculations require the use of estimates and assumption, including the amount of recoverable reserves and estimate of future capital expenditure. Changes are accounted for prospectively.
13.Changes in Accounting Policies
N/A
14.Financial and Other Instruments
All significant financial assets, financial liabilities and equity instruments of the Company are either recognized or disclosed in the audited consolidated financial statements together with other information relevant for making a reasonable assessment of future cash flows, interest rate risk and credit risk. Where practicable the fair values of financial assets and financial liabilities have been determined and disclosed; otherwise only available information pertinent to fair value has been disclosed.
In the normal course of business, the Company’s assets, liabilities and forecasted transactions are impacted by various market risks, including currency risks associated with inventory, revenues, cost of sales, capital expenditures, interest earned on cash and the interest rate risk associated with floating rate debt.
| 18 |
Currency risk is the risk to the Company's earnings that arises from fluctuations of foreign exchange rates and the degree of volatility of these rates. The primary currency the Company exposed to is the United States dollar which is also the functional currency of the San Martin Mine. The Company does not use derivative instruments to reduce its exposure to foreign currency risk. At January 31, 2017 the Company had the following financial assets and liabilities denominated in CDN and denominated in Mexican Pesos:
| In ‘000 of | CDN Dollars | Mexican Pesos (MP) |
| Cash and cash equivalents | $ 294 | 4,571 |
| Long term liabilities | $ 938 | 83,997 |
| Other working capital amounts – net | $ (4,579) | - |
At January 31, 2017, US dollar amounts were converted at a rate of $1.3030 Canadian dollars to $1 US dollar and MP were converted at a rate of MP20.84 to $1 US Dollar.
15.Other
| 15.1 | Disclosure of Outstanding Share Capital as at March 14, 2017 |
| Number | Book Value | |
| Common Shares | 49,146,851 | $ 50,605 |
The following is a summary of changes in options from January 31, 2017 to March 14, 2017:
| Grant | Expiry | During the Period | Closing, | |||||||||
| Date | Date | Exercise | Opening | Cancelled/ | Vested and | |||||||
| mm/dd/yy | mm/dd/yy | Price | Balance | Granted | Exercised | Forfeited | Closing | Exercisable | ||||
| 04/13/12 | 04/13/17 | $1.48 | 50,000 | - | - | - | 50,000 | 50,000 | ||||
| 08/22/13 | 08/22/18 | $1.00 | 200,000 | - | - | - | 200,000 | 200,000 | ||||
| 08/22/13 | 08/22/18 | $0.80 | 50,000 | - | - | - | 50,000 | 50,000 | ||||
| 09/06/13 | 09/06/18 | $0.92 | 50,000 | - | - | - | 50,000 | 50,000 | ||||
| 09/12/13 | 09/12/18 | $1.00 | 50,000 | - | - | - | 50,000 | 50,000 | ||||
| 01/15/14 | 01/15/19 | $0.88 | 998,750 | - | - | - | 998,750 | 998,750 | ||||
| 1,398,750 | - | - | - | 1,398,750 | 1,398,750 | |||||||
| Weighted Average Exercise Price | $0.92 | - | - | - | $0.92 | $0.92 | ||||||
| 15.2 | Disclosure Controls and Procedures |
The Company’s management, with the participation of its Chief Executive Officer and Chief Financial Officer, has evaluated the effectiveness of the Company’s disclosure controls and procedures. Based upon the results of that evaluation, the Company’s Chief Executive Officer and Chief Financial Officer have concluded that, as of the end of the period covered by this report, the Company’s disclosure controls and procedures were effective to provide reasonable assurance that the information required to be disclosed by the Company in reports it files is recorded, processed, summarized and reported, within the appropriate time periods and forms.
| 19 |
Internal Controls Over Financial Reporting
The Company’s management, with the participation of its Chief Executive Officer and Chief Financial Officer, are responsible for establishing and maintaining adequate internal control over financial reporting. Under the supervision of the Chief Financial Officer, the Company’s internal control over financial reporting is a process designed to provide reasonable assurance regarding the reliability of financial reporting and the preparation of consolidated financial statements for external purposes in accordance with IFRS. The Company’s controls include policies and procedures that:
| · | pertain to the maintenance of records that, in reasonable detail, accurately and fairly reflect the transactions and dispositions of the assets of the Company; |
| · | provide reasonable assurance that transactions are recorded as necessary to permit preparation of consolidated financial statements in accordance with IFRS; and |
| · | provide reasonable assurance regarding prevention or timely detection of unauthorized acquisition, use or disposition of the Company’s assets that could have a material effect on the annual consolidated financial statements or interim financial statements. |
There has been no change in the Company’s internal control over financial reporting during the Company’s period ended January 31, 2017 that has materially affected, or is reasonably likely to materially affect, the Company’s internal control over financial reporting.
Limitations of Controls and Procedures
The Company’s management, including the Chief Executive Officer and Chief Financial Officer, believe that any disclosure controls and procedures or internal controls over financial reporting, no matter how well conceived and operated, can provide only reasonable, not absolute, assurance that the objectives of the control system are met. Further, the design of a control system must reflect the fact that there are resource constraints, and the benefits of controls must be considered relative to their costs. Because of the inherent limitations in all control systems, they cannot provide absolute assurance that all control issues and instances of fraud, if any, within the Company have been prevented or detected. These inherent limitations include the realities that judgments in decision-making can be faulty, and that breakdowns can occur because of simple error or mistake. Additionally, controls can be circumvented by the individual acts of some persons, by collusion of two or more people, or by unauthorized override of the control. The design of any systems of controls also is based in part upon certain assumptions about the likelihood of future events, and there can be no assurance that any design will succeed in achieving its stated goals under all potential future conditions. Accordingly, because of the inherent limitations in a cost effective control system, misstatements due to error or fraud may occur and not be detected.
1The information in this report relating to the acquisition of Creston Moly by Mercator has been drawn from documents filedunder the Creston Moly Corp. issuer profile on SEDAR, more specifically: Creston’s Management Information Circular dated May 9, 2011 and filed on SEDAR on May 16, 2011, and Creston’s news release of June 6, 2011 as filed on SEDAR on June 7, 2011.
2The technical information in this news release relating to the El Creston Project is based on the technical report entitled “Preliminary Economic Assessment, El Creston Project, Opodepe, Sonora, Mexico”, dated December 16, 2010, filed under the Creston Moly Corp. issuer profile on SEDAR.. Information regarding the effective date of the mineral resources, key assumptions, parameters and methods used to estimate the mineral resources, and known risks that materially affect the mineral resources can be found in the technical report.
3Technical information in this report relating to the Ajax Project is based on the NI 43-101 Resource Estimate Press Release entitled “Tenajon Announces 75% Increase in Indicated Molybdenum Resources at Ajax Project”, dated May 15, 2008 and the technical report entitled “Update of Resource Estimation, Ajax Property, Alice Arm, British Columbia”, dated April 18, 2007, both of which are filed under the Tenajon Resources Corp. issuer profile on SEDAR.
4Technical information in this report relating to the Moly Brook property is based on the technical report entitled “Technical Report, Moly Brook Property, Grey River Area, Newfoundland, Canada”, dated June 15, 2009, filed under the Tenajon Resources Corp. issuer profile on SEDAR.