| | |
| 
Independent Technical Report for the El Creston Molybdenum Project, Sonora, Mexico | |
| Prepared for Starcore International Mines Ltd. |
| 
| | |
| Prepared by 
SRK Consulting (Canada) Inc. CAPR002049 September 2022 |
| | |
| Independent Technical Report for the El Creston Molybdenum Project, Sonora, Mexico |
| September 2022 |
| Prepared for | Prepared by |
| Starcore International Mines Ltd. Suite #750 – 580 Hornby Street Vancouver, BC V6C 3B6 Canada | Dr. Gilles Arseneau, P. Geo. Associate Consultant SRK Consulting (Canada) Inc. Suite #2200 – 1066 West Hastings Street Vancouver, BC V6E 3X2 Canada |
| Tel:+1 604 602 4935 Web:www.starcore.com | Tel:+1 604 681 4196 Web: www.srk.com |
| Project No:CAPR002049 File Name:Starcore_ElCreston_ResourceUpdate_Report_CAPR002049_20221113_SRK.docx |
| Copyright © SRK Consulting (Canada) Inc., 2022 
|
GA / CAEStarcore_ElCreston_ResourceUpdate_Report_CAPR002049_20221113_SRK.docxSeptember 2022
SRK Consulting
El Creston Moly Property NI 43-101 Resource UpdatePage 1
Important Notice
This report was prepared as a National Instrument 43-101 Technical Report for Starcore International Mines Ltd. (“Starcore” or the “Company”) by SRK Consulting (Canada) Inc. (“SRK”). The quality of information, conclusions, and estimates contained herein is consistent with the level of effort involved in SRK’s services, based on i) information available at the time of preparation, ii) data supplied by outside sources, and iii) the assumptions, conditions, and qualifications set forth in this report. This report is intended for use by Starcore subject to the terms and conditions of its contract with SRK and relevant securities legislation. The contract permits Starcore to file this report as a Technical Report with Canadian securities regulatory authorities pursuant to National Instrument 43-101, Standards of Disclosure for Mineral Projects. Except for the purposes legislated under provincial securities law, any other uses of this report by any third party are at that party’s sole risk. The responsibility for this disclosure remains with Starcore. The user of this document should ensure that this is the most recent Technical Report for the property as it is not valid if a new Technical Report has been issued.
© Copyright
This report is protected by copyright vested in SRK Consulting (Canada) Inc. It may not be reproduced or transmitted in any form or by any means whatsoever to any person without the written permission of the copyright holder, other than in accordance with stock exchange and other regulatory authority requirements.
GA / CAEStarcore_ElCreston_ResourceUpdate_Report_CAPR002049_20221113_SRK.docxSeptember 2022
SRK Consulting
El Creston Moly Property NI 43-101 Resource UpdatePage 2
Introduction
In June of 2022, Starcore International Mines Ltd. commissioned SRK Consulting (Canada) Inc. to prepare a technical report for the El Creston Project. This technical report documents a mineral resource statement for the El Creston Project prepared by Dr. Gilles Arseneau, Qualified Person and associate consultant with SRK. It was prepared following the guidelines of the Canadian Securities Administrators’ National Instrument 43-101 and Form 43-101F1.
Property Description and Ownership
The El Creston Project is located in north-central Sonora State in north-western Mexico. The property is about 145 kilometres (“km”) by road north-northeast of Hermosillo, the capital of Sonora State, 5 km southwest of the village of Opodepe. Access from Hermosillo is via Highway 15 north from Hermosillo 70 km to Carbo junction. From the junction, a paved road is followed east for 52 km to Rayon, then north along a well-maintained gravel road for 21 km to the junction with a secondary unpaved road crossing the San Miguel River 5 km south of Opodepe that leads to the Creston Project. The approximate center of the mineral resources described in Section 14 is 29°53’N latitude and 110°39’W longitude.
Electric power and water are available at Opodepe, however a 45 km long power line coming from the west, will likely be required to provide power to any future development at the El Creston property, as Opodepe does not have the capacity for a large industrial site. Discussions with the owners of water rights in the vicinity of the project will be necessary to support any future mining operation.
The property is comprised of nine concessions covering approximately 11,363 hectares (“ha”) wholly owned by Exploraciones Global, S.A. de C.V., a Mexican subsidiary of Starcore. All concessions are subject to a 3% net smelter return (“NSR”). There are no known environmental liabilities to which the project is currently subjected.
Geology and Mineralization
Regionally, the area is part of the Basin and Range Province which is an extensional terrain of fault-bounded ranges and intervening valleys in the western United States that extends southward from Nevada and Utah southwards into the states of Sonora and Chihuahua, Mexico. In northern Mexico, this province is bifurcated by the Sierra Madre Occidental, a north-northwest-trending mountain range about 1,200 km long and 200 km to 300 km wide that forms the spine of northern Mexico. The Creston property lies in the western or Sonoran portion of the Basin and Range Province, close to the western flank of the Sierra Madre Occidental.
The predominant lithologies known at El Creston include metamorphic rocks of Precambrian and perhaps Paleozoic age, intrusions of various compositions, dikes, and breccias of Paleozoic and Tertiary age, and Recent conglomerate, talus, and landslide deposits.
GA / CAEStarcore_ElCreston_ResourceUpdate_Report_CAPR002049_20221113_SRK.docxSeptember 2022
SRK Consulting
El Creston Moly Property NI 43-101 Resource UpdatePage 3
Phyllites, quartzite, gneisses, and metavolcanic rocks were intruded by the Creston granite, which has a weakly developed gneissic texture. The Creston granite has been altered and mineralized, hosting most of the presently defined molybdenum (“Mo”) mineralization in the Main deposit, the older metamorphic rocks intruded by the Creston granite are only locally altered and mineralized.
There are two principal styles of mineralization at the Main deposit: predominantly subvertical quartz-molybdenite-pyrite veinlets hosted by the Creston granite and molybdenite-pyrite within the quartz matrix of magmatic-hydrothermal breccia of the East Breccia body, which cuts the Creston granite. While minor amounts of chalcopyrite accompany the molybdenite mineralization, more significant quantities of copper (“Cu”) occur as chalcocite replacements of pyrite within secondary enrichment blankets that parallel present-day topography. Some chalcocite also occurs below the enrichment blankets, primarily along permeable structural zones such as the Ordoñez fault zone.
The currently defined mineralized area occupies a zone about 1,600 metres (“m”) in an east-west direction, a maximum of 1,200 m in a north-south direction, and 550 m vertically. The Creston and Ordoñez faults terminate the bulk of the molybdenum mineralization at depth, although some mineralization has been intersected in drillholes below the Creston fault at the Red Hill zone to the south. Mineralization at El Creston includes both molybdenum and copper minerals.
Exploration Status
The property has been explored extensively in the past. Starcore has not carried out any recent exploration on the property but has announced a $500,000 US Dollars (“US$”) exploration program for the El Creston Project. The program is to include geological and magnetometry surveys.
Mineral Resource Estimate
The mineral resource model prepared by the QP considers 181 core holes and three reverse circulation holes, Creston Moly Corporation drilled 156 holes during the period of 2007 to 2011, 28 holes were drilled by AMAX between 1974-1975. The resource estimation work was completed by Dr. Gilles Arseneau, P. Geo. (APEGBC #23474) an appropriate “independent Qualified Person” as this term is defined in National Instrument 43-101.
The mineral resources have been estimated in conformity with generally accepted CIM “Estimation of Mineral Resource and Mineral Reserves Best Practices” guidelines and are reported in accordance with the Canadian Securities Administrators’ National Instrument 43-101.
GEOVIA GEMs™ Version 6.8.4 was used to construct the geological solids, prepare assay data for geostatistical analysis, construct the block model, estimate metal grades and tabulate mineral resources. Sage2001 was used to model the variography of copper and molybdenum.
The oxide surface was modelled from a hard boundary between the dominantly oxidized zone near surface and the sulphide mineralization below using a 30% molybdenum oxide limit. A wireframe was used to model the molybdenum mineralization with the Creston granite and the
GA / CAEStarcore_ElCreston_ResourceUpdate_Report_CAPR002049_20221113_SRK.docxSeptember 2022
SRK Consulting
El Creston Moly Property NI 43-101 Resource UpdatePage 4
copper mineralization was modelled into high-grade and low-grade domains based on statistical analysis of the assay data.
Assay data were capped prior to modelling based on statistical analysis. Molybdenum values were capped at 0.70% Mo and copper values in the higher-grade zone were capped at 1.0% Cu and 0.45% Cu in the low-grade copper zone. All assays were composited to 3.0 m length within the modelled domains.
Grades were estimated by ordinary kriging inside 10 m by 10 m by 12 m blocks. To determine the quantities of material offering “reasonable prospects for eventual economic extraction” by an open pit, the QP used a pit optimizer and reasonable mining assumptions to evaluate the proportions of the block model (Measured, Indicated and Inferred blocks) that could be “reasonably expected” to be mined from an open pit.
The optimization parameters were based on experience and benchmarking against similar projects. Blocks within the resource shell were classified as Measured if they were populated using more than eleven samples at an average distance of less than 80 m and where the probability of the grade exceeding cut-off was more than 90%. Blocks were considered Indicated if they were populated by more than eight samples at an average distance of less than 100 m. All other estimated blocks were classed as Inferred. Based on the above parameters, the QP estimated that the El Creston deposit contained 56.3 million tonnes (“Mt”) grading 0.076% Mo and 0.04% Cu in the Measured category, and 142.2 Mt grading 0.067% Mo and 0.08% Cu classified as Indicated mineral resources. There are no blocks classified as Inferred mineral resource within the Whittle optimized pit shell (Table 1.1).
Table 1.1: Mineral Resource Statement at 0.045% Molybdenum Equivalent*, El Creston Molybdenum Project, Sonora Mexico, SRK Consulting, 30 September 2022
| | | | | | | | |
Category | Quantity | Grade | Metal |
Mo | Cu | Mo | Cu |
(Mt) | (%) | (%) | (Mlb) | (Mlb) |
Open Pit** |
Measured | 56.3 | 0.076 | 0.04 | 94.3 | 49.7 |
Indicated | 142.2 | 0.067 | 0.08 | 210.0 | 250.8 |
Measured Plus Indicated | 198.5 | 0.069 | 0.07 | 304.4 | 300.5 |
Inferred |
Notes:
| * | Mineral resources are reported in relation to a conceptual pit shell. Mineral resources are not mineral reserves and do not have demonstrated economic viability. All figures are rounded to reflect the relative accuracy of the estimate. All composites have been capped where appropriate. |
| ** | Open pit mineral resources are reported at a cut-off grade of 0.045% Mo EQ. Cut-off grades are based on a price of US$9.93 per lb of molybdenum and US$3.50 for copper, recoveries of 88% for molybdenum and 84% for copper were applied. |
GA / CAEStarcore_ElCreston_ResourceUpdate_Report_CAPR002049_20221113_SRK.docxSeptember 2022
SRK Consulting
El Creston Moly Property NI 43-101 Resource UpdatePage 5
Conclusion and Recommendations
The El Creston Molybdenum Project is an advanced staged exploration property located in Sonora State, Mexico.
The molybdenite mineralization occurs as finely disseminated subhedral crystals 0.1 millimetres (“mm”) to 0.8 mm across, embedded in a pervasive, fine-grained quartz-sericite matrix, and as coarsely crystalline molybdenite along the margins of quartz veins.
The QP believes that the widely spaced drill sampling is suitably adequate to represent the disseminated and veinlet molybdenum mineralization.
While some molybdenum grades do occur below the Creston fault, the grade estimates were limited to the zone between the oxide boundary and the Creston fault.
The QP recommends that Starcore continue to explore the El Creston Project. Specifically, a US$500,000 exploration surface exploration program is recommended.
GA / CAEStarcore_ElCreston_ResourceUpdate_Report_CAPR002049_20221113_SRK.docxSeptember 2022
SRK Consulting
El Creston Moly Property NI 43-101 Resource UpdatePage 6
Table of Contents
GA / CAEStarcore_ElCreston_ResourceUpdate_Report_CAPR002049_20221113_SRK.docxSeptember 2022
SRK Consulting
El Creston Moly Property NI 43-101 Resource UpdatePage 7
GA / CAEStarcore_ElCreston_ResourceUpdate_Report_CAPR002049_20221113_SRK.docxSeptember 2022
SRK Consulting
El Creston Moly Property NI 43-101 Resource UpdatePage 8
GA / CAEStarcore_ElCreston_ResourceUpdate_Report_CAPR002049_20221113_SRK.docxSeptember 2022
SRK Consulting
El Creston Moly Property NI 43-101 Resource UpdatePage 9
List of Tables
Table 1.1: Mineral Resource Statement at 0.045% Molybdenum Equivalent*, El Creston Molybdenum Project, Sonora Mexico, SRK Consulting, 30 September 20224
Table 2.1: List of Abbreviations14
Table 4.1: Mineral Tenure Information18
Table 6.1: Summary of Historical Exploration Work Prior to Creston Moly Corporation23
Table 6.2: Summary of Drilling and Underground Development by Company and Year24
Table 6.3: Selection of Historic Non-NI 43-101 Resource Estimates24
Table 6.4: 2008 P&E and 2008 MDA Historical Resource Estimates Summary25
Table 6.5: El Creston Mineral Resource Estimate (SRK, 2011)26
Table 10.1: Summary of All Drilling at El Creston39
Table 10.2: Significant Drillhole Intersections used in the Mineral Resource Estimate43
Table 10.3: Number of Drillholes Eliminated from the Resource Estimation Database46
Table 11.1: QA/QC Samples Inserted by Creston Moly from 2007 to 201150
Table 11.2: Standard Reference Material Used by Creston Moly54
Table 12.1: Assay Results for Verification Samples Collected by the QP on the El Creston Project58
Table 13.1: Grindability Results62
Table 13.2: G&T Preliminary Locked Cycle Test Results62
Table 14.1: Drillholes Used for El Creston Resource Estimation64
Table 14.2: Comparison of Density Values for Fresh and Oxide Material68
Table 14.3 Sample Length Descriptive Statistics71
Table 14.4: Resource Block Model Extent74
Table 14.5: Variogram Parameters Used for Ordinary Kriging Estimation75
Table 14.6: Estimation Parameters75
Table 14.7: Assumptions Considered for Conceptual Open Pit Optimization.81
Table 14.8: Mineral Resource Statement at 0.045% Molybdenum Equivalent*, El Creston Molybdenum Project, Sonora Mexico, SRK Consulting, 30 September 202282
Table 14.9: Measured Quantities and Grade Estimates Within the Resource Shell*, El Creston Molybdenum Project at Various Cut-off Grades83
Table 14.10: Indicated Quantities and Grade Estimates Within the Resource Shell*, El Creston Molybdenum Project at Various Cut-off Grade83
Table 14.11: Comparison of Economic Parameters used for the 2011 and 2022 Resource Estimates84
GA / CAEStarcore_ElCreston_ResourceUpdate_Report_CAPR002049_20221113_SRK.docxSeptember 2022
SRK Consulting
El Creston Moly Property NI 43-101 Resource UpdatePage 10
Table 14.12 : Comparison of 2022 and 2011 Mineral Resource Statements85
Table 17.1: Mineral Resource Statement at 0.045% Molybdenum Equivalent*, El Creston Molybdenum Project, Sonora Mexico, SRK Consulting, 04 September 202290
Table 18.1: Estimated Cost for the Exploration Program Proposed for the El Creston Project91
List of Figures
Figure 4.1: Project Location Map17
Figure 4.2: Land Tenure Map18
Figure 4.3: El Creston Deposit with Mineral Claims and Surface Rights Ownership19
Figure 5.1: General Physiography of the El Creston Area22
Figure 7.1: Regional Geological Setting27
Figure 7.2: Example of Coarse Crystalline Molybdenite Along Quartz Vein34
Figure 7.3: Molybdenite Mineralization Within East Breccia35
Figure 10.1: Planview Showing Distribution of Pre-Creston Moly Drillholes41
Figure 10.2: Planview Showing the Distribution of Drillholes Drilled by Creston Moly42
Figure 11.1: Total Molybdenum Reject Duplicates51
Figure 11.2: Copper Reject Duplicates52
Figure 11.3: 2008-2011 Total Molybdenum Umpire Assay Duplicates Compared53
Figure 11.4: Molybdenum Standard Reference Material Performance55
Figure 14.1: Probability Plot of Total Mo (%) showing Grade Populations67
Figure 14.2: Cumulative Probability Plot, Molybdenum (in sulphide) Assays69
Figure 14.3: HGZ, Cumulative Probability Plot, Total Copper Assays70
Figure 14.4 Assay Length Histogram71
Figure 14.5: Molybdenum Composite De-Clustered Histogram and Statistics72
Figure 14.6: Copper Composite De-Clustered Histogram and Statistics72
Figure 14.7: Molybdenum Directional Variograms73
Figure 14.8: Copper Directional Variograms73
Figure 14.9: Comparison of Molybdenum Estimates with Assay Averages within the Blocks77
Figure 14.10: Comparison of HGZ Copper Estimates With Assay Averages Within the Blocks77
Figure 14.11: Comparison of LGZ Copper Estimates With Assay Averages Within the Blocks78
Figure 14.12: Molybdenum Composites Compared to Block Estimates78
GA / CAEStarcore_ElCreston_ResourceUpdate_Report_CAPR002049_20221113_SRK.docxSeptember 2022
SRK Consulting
El Creston Moly Property NI 43-101 Resource UpdatePage 11
Figure 14.13: HGZ Copper Composites Compared to Block Estimates79
Figure 14.14: LGZ Copper Composites Compared to Block Estimates79
Figure 14.15: Grade Tonnage Curves for the El Creston Molybdenum Project84
Figure 14.16: Comparison of 2011 and 2022 Resource Shells85
GA / CAEStarcore_ElCreston_ResourceUpdate_Report_CAPR002049_20221113_SRK.docxSeptember 2022
SRK Consulting
El Creston Moly Property NI 43-101 Resource UpdatePage 12
2 | Introduction and Terms of Reference |
The El Creston Molybdenum Project is an advanced staged exploration property located in Sonora State, Mexico. It is located approximately 100 km north of the city of Hermosillo, capital of Sonora. Starcore International Mines Ltd. acquired a 100% interest in the Project in February 2015 through the acquisition of all the shares of Creston Moly as part of the bankruptcy of Mercator Minerals Ltd. (“Mercator”).
In June of 2022, Starcore commissioned SRK Consulting (Canada) Inc. to prepare a technical report for the El Creston Project. The services were rendered between July and September of 2022 leading to the preparation of the mineral resource statement reported herein.
This technical report documents a mineral resource statement for the El Creston Project prepared by SRK. It was prepared following the guidelines of the Canadian Securities Administrators’ National Instrument 43-101 and Form 43-101F1. The mineral resource statement reported herein was prepared in conformity with generally accepted CIM “Estimation of Mineral Resources and Mineral Reserves Best Practice Guidelines.”
The scope of work, as defined in a letter of engagement executed in June 2022 between Starcore International Mines Ltd. and SRK includes the construction of a mineral resource model for the stockwork molybdenum mineralization delineated by drilling on the El Creston Project and the preparation of an independent technical report in compliance with National Instrument 43-101 and Form 43-101F1 guidelines. This work typically involves the assessment of the following aspects of this project:
| • | Topography, landscape, access; |
| • | Regional and local geology; |
| • | Audit of exploration work carried out on the Project; |
| • | Mineral resource estimation and validation; |
| • | Preparation of a mineral resource statement; and |
| • | Recommendations for additional work. |
GA / CAEStarcore_ElCreston_ResourceUpdate_Report_CAPR002049_20221113_SRK.docxSeptember 2022
SRK Consulting
El Creston Moly Property NI 43-101 Resource UpdatePage 13
The mineral resource statement reported herein is a collaborative effort between Starcore and SRK personnel. The exploration database was compiled and maintained by Mercator, the previous owners of the Project, and made available to SRK as part of an earlier technical report prepared by SRK in 2011 for Creston Moly Corporation. The Project database was audited and validated by Dr. Arseneau, the QP of this technical report. The geological model and outlines for the molybdenum mineralization were constructed by the QP using GEOVIA GEMs™ Version 6.8.4. In the opinion of the QP, the geological model is a reasonable representation of the distribution of the targeted mineralization at the current level of sampling. The geostatistical analysis, variography and grade models were completed by the QP.
The mineral resource statement reported herein was prepared in conformity with generally accepted CIM “Exploration Best Practices” and “Estimation of Mineral Resource and Mineral Reserves Best Practices” guidelines. This technical report was prepared following the guidelines of the Canadian Securities Administrators National Instrument 43-101 and Form 43-101F1.
The technical report was assembled in Vancouver, Canada during the month of August 2022.
This report is based on information collected by the QP during the site visits. The author has relied extensively on information in the technical report prepared by SRK for Creston in 2011 (SRK, 2011) and with discussions with Starcore technical personnel. The principal sources of information used to compile this report comprised of digital data and some published information relevant to the operation area and the region in general.
Assay data was mostly provided by independent, internationally recognized laboratories and standards used included a combination of standard samples provided by an independent company.
In summary, the following key digital data were provided:
| • | Drillhole database containing collar location, downhole survey, assay and geology data. |
| • | A 3-dimensional (“3-D”) model of the topography. |
| • | All original assay and survey certificates. |
| • | Quality control procedures and results. |
| • | Internal and external quality control data. |
| • | Representative geological cross-sections. |
GA / CAEStarcore_ElCreston_ResourceUpdate_Report_CAPR002049_20221113_SRK.docxSeptember 2022
SRK Consulting
El Creston Moly Property NI 43-101 Resource UpdatePage 14
The QP has made all reasonable enquiries to establish the completeness and authenticity of the information provided and identified, and a final draft of this report was provided to Starcore.
2.4 | Qualifications of SRK and SRK Team |
The SRK Group comprises over 1,600 professionals, offering expertise in a wide range of resource engineering disciplines. The SRK Group’s independence is ensured by the fact that it holds no equity in any project and that its ownership rests solely with its staff. This fact permits SRK to provide its clients with conflict-free and objective recommendations on crucial judgment issues. SRK has a demonstrated track record in undertaking independent assessments of mineral resources and mineral reserves, project evaluations and audits, technical reports and independent feasibility evaluations to bankable standards on behalf of exploration and mining companies and financial institutions worldwide. The SRK Group has also worked with a large number of major international mining companies and their projects, providing mining industry consultancy service inputs.
The resource evaluation work and the compilation of this technical report was completed by Dr. Gilles Arseneau, P. Geo. (APEGBC, 23474). By virtue of his education, membership to a recognized professional association and relevant work experience, Dr. Arseneau is an “independent Qualified Person (“IQP”)” as this term is defined by National Instrument 43-101.
Chris Elliott, FAusIMM, a Principal Consultant with SRK, reviewed drafts of this technical report prior to their delivery to Starcore as per SRK internal quality management procedures.
In accordance with National Instrument 43-101 guidelines, Dr. Arseneau visited the El Creston Project on 12 to 15 September 2022 accompanied with Salvador Garcia of Starcore. Dr. Arseneau also visited the Project between 03 to 06 August 2010 when the drill program was underway.
The purpose of the site visits was to review the digitalization of the exploration database and validation procedures, review exploration procedures, define geological modelling procedures, examine drill core, interview Project personnel and to collect all relevant information for the preparation of a mineral resource model and the compilation of a technical report.
The site visits were also aimed at investigating the geological and structural controls on the distribution of the molybdenum mineralization to aid the construction of three-dimensional mineralization domains.
The QP was given full access to relevant data and conducted interviews of Mercator and Starcore personnel to obtain information on the past exploration work, to understand procedures used to collect, record, store and analyze historical and current exploration data.
GA / CAEStarcore_ElCreston_ResourceUpdate_Report_CAPR002049_20221113_SRK.docxSeptember 2022
SRK Consulting
El Creston Moly Property NI 43-101 Resource UpdatePage 15
The QP would like to acknowledge the support and collaboration provided by Starcore personnel for this assignment. Their collaboration was greatly appreciated and instrumental to the success of this Project.
The QP’s opinion contained herein and effective 30 September 2022, is based on information collected by the QP and SRK throughout the course of the QP’s investigations, which in turn reflect various technical and economic conditions at the time of writing. Given the nature of the mining business, these conditions can change significantly over relatively short periods of time. Consequently, actual results may be significantly more or less favourable.
This report may include technical information that requires subsequent calculations to derive sub-totals, totals and weighted averages. Such calculations inherently involve a degree of rounding and consequently introduce a margin of error. Where these occur, the QP does not consider them to be material.
The QP and SRK are not insider, associates, or affiliates of Starcore, and neither SRK nor any affiliate have acted as advisors to Starcore, its subsidiaries or its affiliates in connection with this Project. The results of the technical review by the QP and SRK are not dependent on any prior agreements concerning the conclusions to be reached, nor are there any undisclosed understandings concerning any future business dealings.
A listing of abbreviations used in this report is provided in Table 2.1 below.
Table 2.1: List of Abbreviations
| |
Name | Abbreviation |
±3 Standard Deviation | ±3δ |
Association of Professional Engineers and Geoscientists in British Columbia | APEGBC |
ALS Chemex Labs, Ltd. | ALS |
AMAX Corporation Ltd. | AMAX |
Bad Quality | BQ |
Canadian Institute of Mining, Metallurgy and Petroleum | CIM |
Canadian National Instrument 43-101 | NI 43-101 |
Centimetre(s) | cm |
Creston Granite | CG |
Degree(s), Degrees Celsius | °, °C |
Diamond Drilling | DDH |
Energy & Metal Consensus Forecasts | EMCF |
Environmental Impact Statement | EIS |
Exploraciones Global, S.A. de C.V. | Global |
Exploration Preventive Report | PR |
G&T Metallurgical Services Ltd | G&T |
General and Administration | G&A |
GA / CAEStarcore_ElCreston_ResourceUpdate_Report_CAPR002049_20221113_SRK.docxSeptember 2022
SRK Consulting
El Creston Moly Property NI 43-101 Resource UpdatePage 16
| |
Name | Abbreviation |
Grams per Metric Tonne | g/t |
Hectare(s) | ha |
High Quality | HQ |
High-Grade Zone-Supergene | HGZ |
Hour(s) | h |
Hydrothermal Breccia | HBx |
Inductively Coupled Plasma Atomic Emission Spectroscopy | ICP-AES |
Inductively Coupled Plasma Mass Spectrometry | ICP-MS |
JDS Energy & Mining Inc. | JDS |
Kilogram(s) | kg |
Kilometre(s) | km |
Kilowatt Hour per Tonne | kwh/t |
Lead | Pb |
Litre(s) | L |
Lower Grade Zone-Primary | LGZ |
MDA Engineering Inc. | MDA |
Million Year(s) | Ma |
Meter(s) | m |
Micron(s) | µ |
Millimetre(s) | mm |
Million (million tonnes, million ounces, million years, million pounds) | M (Mt, Moz, Ma, Mlb) |
Ministry of Environment and Natural Resources | SEMARNAT |
Molybdenum | Mo |
Molybdenum Disulfide | OxMo |
Molybdenum Oxide | MoS2 |
Net Smelter Return | NSR |
No Quality | NQ |
Not Available/Applicable | N/A |
Original Kriging | OK |
Ounce (troy)/Ounces per Year | oz, oz/y |
P&E Engineering Co. | P&E |
Parts per Million | ppm |
Percent(age) | % |
Potential of Hydrogen | pH |
Pound(s) | lb |
Power of Two | ID2 |
Preliminary Economic Assessment | PEA |
Professional Geologist | P. Geo |
Qualified Person(s) | QP(s) |
Quality Assurance and Quality Control | QA/QC |
Reverse Circulation | RC |
Silver | Ag |
Skyline Assayers & Laboratories | Skyline |
Sodium Hydrosulfide | NaHS |
Sodium Isopropyl Xanthate | SIPX |
Square Centimeter(s) | cm3 |
SRK Consulting (Canada) Inc. | SRK |
Starcore International Mines Ltd. | Starcore |
System for Electronic Document Analysis and Retrieval | SEDAR (www.sedar.com) |
Three-Dimensional | 3-D |
Tonne (metric), Tonnes per Day, Tonnes per Hour | t, t/d, t/h |
United States Dollar(s) | USD, US$ |
GA / CAEStarcore_ElCreston_ResourceUpdate_Report_CAPR002049_20221113_SRK.docxSeptember 2022
SRK Consulting
El Creston Moly Property NI 43-101 Resource UpdatePage 17
| |
Name | Abbreviation |
Universal Transverse Mercator | UTM |
Zinc | Zn |
3 | Reliance on Other Experts |
The QP has not performed an independent verification of the land title and tenure information as summarized in Section 4 of this report. The QP did not verify the legality of any underlying agreement(s) that may exist concerning the permits or other agreement(s) between third parties but have relied on Jose Enrique Rodrigues del Bosque (RB abogados) as expressed in a legal opinion provided to Creston Mining Corporation (a Starcore subsidiary) on 3 October 2022. The reliance applies solely to the legal status of the rights disclosed in Section 4.1 below.
The QP was informed by Starcore that there are no known litigations potentially affecting the El Creston Project.
GA / CAEStarcore_ElCreston_ResourceUpdate_Report_CAPR002049_20221113_SRK.docxSeptember 2022
SRK Consulting
El Creston Moly Property NI 43-101 Resource UpdatePage 18
4 | Property Description and Location |
The El Creston Project is located in the north-central part of the state of Sonora in north-western Mexico. The property is about 145 km by road north-northeast of Hermosillo, the capital of Sonora, and 5 km southwest of the village of Opodepe (Figure 4.1). The approximate center of the mineral resources described in Section 14 is 29°53’N latitude and 110°39’W longitude.
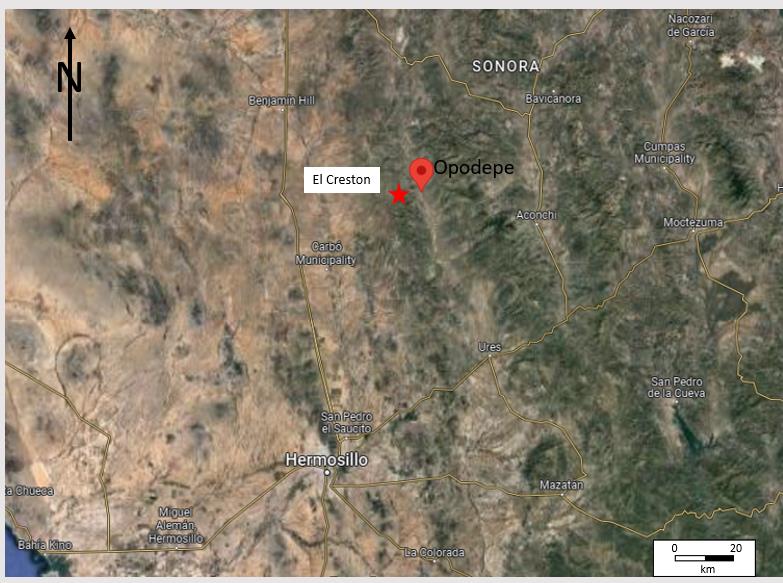
Source: Google Earth™ (2022)
Figure 4.1: Project Location Map
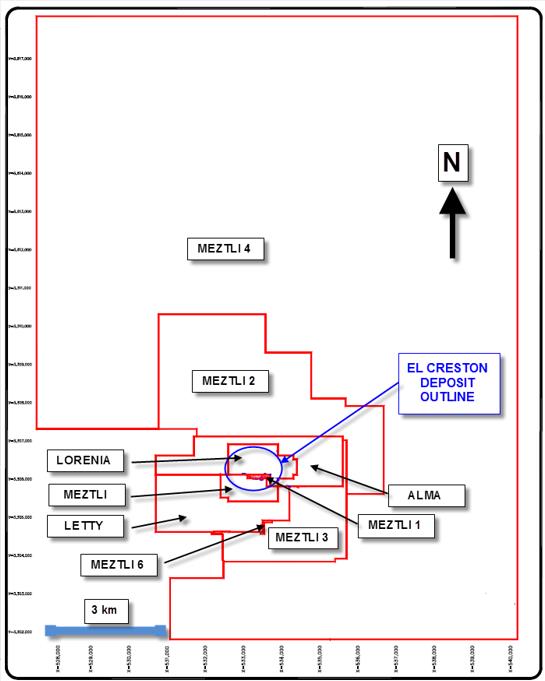
The El Creston property is comprised of nine concessions covering approximately 11,363 ha (Table 4.1 and Figure 4.2). Exploraciones Global, S.A. de C.V. (“Global”), the owner of the concessions, is a wholly owned Mexican subsidiary of Starcore. All concessions are subject to a 3% NSR.
GA / CAEStarcore_ElCreston_ResourceUpdate_Report_CAPR002049_20221113_SRK.docxSeptember 2022
SRK Consulting
El Creston Moly Property NI 43-101 Resource UpdatePage 19
Table 4.1: Mineral Tenure Information
| | | | |
Concession | Date Granted | Expiry Date | Title No | Area (ha) |
Meztli | 16 April 2003 | 15 April 2053 | 219813 | 89.00 |
Meztli-1 | 16 July 2003 | 15 July 2005 | 220332 | 8.00 |
Lorenia | 25 June 2004 | 24 June 2053 | 222321 | 138.00 |
Letty | 15 October 2004 | 14 October 2054 | 223111 | 391.51 |
Alma | 13 August 2004 | 12 August 2054 | 222700 | 359.00 |
Meztli-2 | 30 September 2005 | 29 September 2055 | 225638 | 1,455.98 |
Meztli-3 | 18 January 2008 | 17 January 2058 | 231151 | 457.06 |
Meztli-4 | 12 May 2014 | 7 September 2057 | 243807 | 8,465.04 |
Meztli-6 | 4 July 2007 | 3 July 2057 | 229984 | 0.0032 |
Total | | | | 11,363.59 |
Source: Starcore (2022)
Figure 4.2: Land Tenure Map
GA / CAEStarcore_ElCreston_ResourceUpdate_Report_CAPR002049_20221113_SRK.docxSeptember 2022
SRK Consulting
El Creston Moly Property NI 43-101 Resource UpdatePage 20
Early in 2008, Global acquired surface rights to 1,200 ha from the Ejido of Opodepe by means of a purchase agreement finalized in early 2008 (Creston Moly Corp., 2008). These surface rights cover the main deposit and the surrounding area. In 2010, a certain member of the Ejido sued the Company claiming that the process for purchasing the surface rights had not been done correctly (done after the Ejido got the payment for the surface rights). The court agreed with the members of the Ejido. The Ejido never returned the cash but, as it stands, the Company does not have the surface rights to Parcels 38 and 39 which covers most of the Creston deposit (Figure 4.3). For the Project to go forward the Company will have to negotiate a new deal with the Ejido.

Figure 4.3: El Creston Deposit with Mineral Claims and Surface Rights Ownership
In September 2010, an additional 1,725 ha contiguous to the above were purchased from Francisco Navarro. In addition, Mercator entered into an Occupancy Agreement with Mr. Navarro for an additional 573 ha contiguous to the above. An Occupancy Agreement is a 20-year agreement allowing the Company to conduct mineral exploration and development. Surface rights are sufficient to support a mining operation with tailings.
Notwithstanding the acquisition of surface rights to the property, the Opodepe Ejido has blocked the access road to the property from Opodepe and is currently refusing all access to the El Creston main deposit area.
GA / CAEStarcore_ElCreston_ResourceUpdate_Report_CAPR002049_20221113_SRK.docxSeptember 2022
SRK Consulting
El Creston Moly Property NI 43-101 Resource UpdatePage 21
A secondary access north and west of Opodepe is currently the only viable property access until Starcore can renegotiate access via the Opodepe Ejido.
4.3 | Environmental Considerations |
The QP is not aware of any unusual, or insurmountable environmental or social encumbrances associated with potential mining at the site. There are no known environmental liabilities to which the Project is currently subject to.
4.4 | Mining Rights in Mexico |
Exploration concessions in Mexico are separate from surface rights. Permission for surface access must be granted with the owners of the surface rights to the areas covered by any exploration program inside the concessions. It commonly involves negotiations and agreements detailing the exploration program and agreement for access and remuneration to the owners.
The Mexican Mining Law was amended in 2005, with removal of distinction between an Exploration Concession and an Exploitation Concession. As a result, the property was converted under the new legislation and given expiry dates that are 50 years from the date they were originally recorded with the Public Registry of Mining.
Under the Mexican Mining Law, duties are assessed against each exploration concession, and they are calculated by multiplying a rate defined by the Mexican Government based on the age of the respective concessions by the number of hectares of the respective concession. These duties are paid semi-annually in January and July, to the Secretariy of Finance (Secretaria de Hacienda y Crédito Público).
Prior to starting any work and/or exploration activity, an authorization from the Ministry of Environment and Natural Resources ("SEMARNAT") must be obtained.
To request the authorization for an exploration project, the filing of an Exploration Preventive Report (“PR”) or an Environmental Impact Statement (“EIS”) is required.
A PR may be submitted if the project meets the specifications provided in the Official Mexican Standard NOM-120-SEMARNAT-2011. Once filed, SEMARNAT determines if the submission of an EIS is required with respect to the project in question.
GA / CAEStarcore_ElCreston_ResourceUpdate_Report_CAPR002049_20221113_SRK.docxSeptember 2022
SRK Consulting
El Creston Moly Property NI 43-101 Resource UpdatePage 22
5 | Accessibility, Climate, Local Resources, Infrastructure and Physiography |
The Creston property lies east of Highway 15, a four-lane highway that links Hermosillo, Sonora, with Nogales, Arizona. Access to the property from Hermosillo is via Highway 14 north from Hermosillo 70 km to Carbo junction. From the junction, a paved road is taken east 52 km to Rayon, then north along a well-maintained gravel road for 21 km to the junction with a secondary unpaved road crossing the San Miguel River 5 km south of Opodepe that leads to the Creston project. Opodepe is also connected with Ures to the south by a gravel road, providing an alternate route to Hermosillo.
5.2 | Local Resources and Infrastructure |
The El Creston property is located about 145 km by road, north-northeast of Hermosillo the capital of Sonora State with a population of approximately 940,000. The village of Opodepe, approximately 7 km northeast of El Creston, has a population of about 300. Many of the residents have experience in the mining industry.
Electric power and water are available at Opodepe, however a 45 km long power line will likely be required to provide power to any future development at the El Creston property, as Opodepe does not have the capacity for a large industrial site, discussions with the owners of water rights in the vicinity of the project will be necessary to support any future mining operation.
A gravel airstrip for a relatively small aircraft is located near Opodepe. A major power line and railroad are located at Carbo, which is 45 km southwest of the El Creston property. No surface infrastructure exists at the El Creston property itself.
The Cumpas molybdenum custom smelter operated by Molymex, S.A. de C.V. is located approximately 80 km east by direct line from Opodepe.
The Creston property is located in the Sonoran Desert. Daytime temperatures in the region may reach 46°C in the summer months of April to November but generally range from 41°C to 28°C. Winters are dry and mild, generally around 20°C, with occasional nights dropping to freezing in late December or January. Average temperatures for the Sonoran Desert region are 11°C for January, 18°C for April, 30°C for July, and 22°C for October.
Precipitation at Creston occurs generally in July and August. There is no surface water on the property. Water for drilling and maintaining the camp is transported from the San Miguel River, about 5 km east of Creston. Potential water sources, including the alluvial valley of Rio San Miguel de Horcasitas, are presently being studied by Creston Moly Corporation and its consultants.
GA / CAEStarcore_ElCreston_ResourceUpdate_Report_CAPR002049_20221113_SRK.docxSeptember 2022
SRK Consulting
El Creston Moly Property NI 43-101 Resource UpdatePage 23
Exploration and mining activity can proceed year-round on the Creston Project.
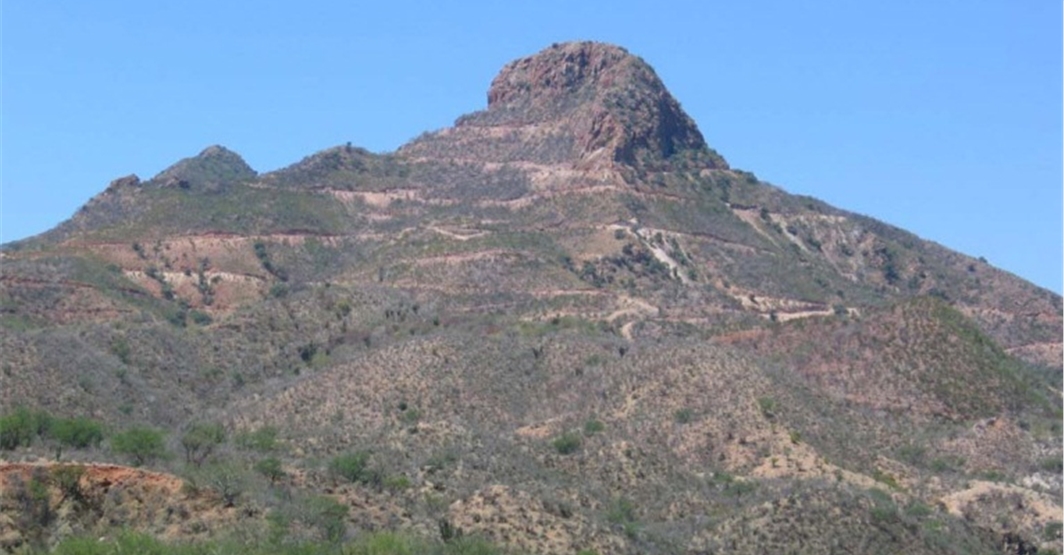
The Creston property is in the foothills of the Sierra Madre Occidental, a largely volcanic, northwest-trending mountain range forming the spine of north-western Mexico. The property lies within an area of considerable relief (Figure 5.1). The main prospect is along the base of an east-trending ridge which rises about 400 m above east-trending arroyos to the north and south. The crest of the ridge is formed by nearly continuous cliffs which range from 30 m to 100 m high and are largely inaccessible. The north face of the ridge is in most places precipitous, whereas the southern and eastern slopes are less rugged.
Cerro Creston, the central physiographic feature in the project area that forms a prominent ridge within the Main deposit, reaches a height of 1,000 m above sea level, with rugged terrain from there down to the 600 m level where there are more gentle foothills (Lodder et al., 1975). The Creston property lies primarily along the western bank of the San Miguel River.
Small woody desert shrubs and cacti characterize the lower elevations with trees at higher elevations. In areas with a high-water table, honey or velvet mesquite may form dense woodlands (Georgia Ventures Inc., 2007).

Photo: SRK Site Visit (2010)
Figure 5.1: General Physiography of the El Creston Area
GA / CAEStarcore_ElCreston_ResourceUpdate_Report_CAPR002049_20221113_SRK.docxSeptember 2022
SRK Consulting
El Creston Moly Property NI 43-101 Resource UpdatePage 24
Exploration on the El Creston property commenced in approximately 1936 after its molybdenum potential was identified in the early 1900’s. Surficial sampling, drilling, core sampling and mapping were completed by a variety of companies since this time. Creston Moly Corporation began work on the property in September 2007 and in 2011, Mercator acquired Creston Moly Corporation with plans to develop the El Creston property. In 2014, Mercator declared bankruptcy. Subsequently all the assets held by Creston Moly Corporation were acquired by Starcore for CA$2M on 19 February 2015.
Table 6.1 briefly summarizes the historic work completed by various companies prior to Creston Moly Corporation’s work.
Table 6.1: Summary of Historical Exploration Work Prior to Creston Moly Corporation
| | |
Work Period | Company | General Work Description |
1900 to 1935 | Unknown | An open cut into the main deposit, surficial sampling |
1936 to 1938 | H.C. Dudley | Diamond drilling, underground adits, mapping, chip sampling, geochemical analysis |
1960 to 1972 | AMAX, Guggenheim Exploration & New Jersey Zinc | Diamond drilling, core sampling (assays), mapping, geophysical surveying |
1973 to 1993 | Penoles, AMAX, Climax & Fresnillo | Geological mapping, geophysics, diamond drilling, core sampling, surficial sampling, geochemical analysis, RC drilling, underground adits |
1994 and 1995 | Orcana Resources | Geophysics, RC drilling |
6.1 | Historical Drilling & Underground Workings |
Drilling in the property was completed using both diamond drilling (“DDH”) and reverse circulation (“RC”) drilling methods, although by the number of holes and meters, diamond drilling dominates. Underground adits were completed as well, first in the 1930’s and then again in 1982.
Table 6.2 summarizes the historic drilling programs which comprises more approximately 16,000 m of core and RC drilling and five underground adits totalling 851 m.
GA / CAEStarcore_ElCreston_ResourceUpdate_Report_CAPR002049_20221113_SRK.docxSeptember 2022
SRK Consulting
El Creston Moly Property NI 43-101 Resource UpdatePage 25
Table 6.2: Summary of Drilling and Underground Development by Company and Year
| | | | | | | |
Company | Year | Core | RC | Underground Adit |
Number | Total Length | Number | Total Length | Number | Total Length |
H.C. Dudley | 1930’s | 2 | 202 | | | 2 | 188 |
AMAX | 1960 | 2 | 317 | | | | |
Guggenheim | 1966-1967 | 8 | 851 | | | | |
NJ Zinc | Late 1960’s | 4 | 924 | | | | |
AMAX | 1974-1982 | 39 | 11,763 | 6 | 1,500 | 3 | 663 |
Fresnillo | 1986-1988 | 2 | 434 | | | | |
Orcana | 1995 | | | 12 | 3,495 | | |
All Companies, All Years | 57 | 14,491 | 18 | 1,500 | 5 | 851 |
6.2 | Historical Mineral Resource Estimates |
Numerous historic resource estimates were completed for the Creston mineralization prior to the enactment of NI 43-101. Estimates have been recorded between 1975 and 1996. A selection of these estimates is summarized in Table 6.3.
Table 6.3: Selection of Historic Non-NI 43-101 Resource Estimates
| | | | | |
Year | Company | Tonnes | Grade Mo (%) | Cut off Mo (%) | Cu (%) |
1975 | AMAX | 43,500,000 | 0.119 | Unknown | n/a |
1978 | AMAX | 87,100,000 | 0.096 | 0.10 | n/a |
1979 | AMAX | 143,000,000 | 0.091 | 0.06 | n/a |
1979 | AMAX | 198,000,000 | 0.073 | 0.06 | n/a |
1983 | AMAX | 185,000,000 | 0.067 | 0.03 | n/a |
1996 | Orcana | 103,000,000 | 0.111 | Unknown | 0.38 |
The methodologies used to prepare the historical estimates presented in Table 6.3 are not known. The estimates are no longer relevant because they were prepared before the 2011 drilling was completed. The historical estimates do not use the mineral resource classification categories prescribed in NI 43-101. The QP has not done the work necessary to verify the historical estimates and they should not be relied upon as they are all superseded by the estimates presented in Section 14 of this report. The historical estimates are only quoted here for historical reasons. The Company is not treating the historical estimates as current mineral resource estimates. None of the above estimates reflect the current supporting data for the deposit and all were completed before NI 43-101 regulations were in effect. These historical estimates are all relevant in that they demonstrate the size and grade of mineralization at El Creston as it changed through time with additional exploration and drilling.
In 2007, P&E Engineering Co. (“P&E”) completed the first NI 43-101 technical report on the El Creston Moly Property on behalf of Georgia Ventures Inc. (P&E, 2007). This work was based
GA / CAEStarcore_ElCreston_ResourceUpdate_Report_CAPR002049_20221113_SRK.docxSeptember 2022
SRK Consulting
El Creston Moly Property NI 43-101 Resource UpdatePage 26
upon historic drilling and assays completed up to 1995. Creston Moly Corporation completed significant drilling between 2007 and later 2008 and MDA Engineering Inc. (“MDA”) utilized this additional work to complete an updated mineral resource in late 2008 (MDA, 2008).
The P&E mineral resource from 2007 and the MDA mineral resource from 2008 are summarized in Table 6.4.
Table 6.4: 2008 P&E and 2008 MDA Historical Resource Estimates Summary
| | | | | | | | |
Year | Consult. | Company | Resource Class | Tonnes | Grade Mo | Grade Cu | Contained Mo | Contained Cu |
Mo (%) | Cu (%) | (Mlb) | (Mlb) |
2007 | P&E | Georgia Ventures | Measured | | | | | |
Indicated | 92,873,000 | 0.083 | 0.06 | 169.9 | 122.8 |
Inferred | 84,221,000 | 0.076 | 0.05 | 141.1 | 92.8 |
2009 | MDA | Creston Moly Corp. | Measured | 52,240,000 | 0.074 | 0.05 | 85.5 | 58.1 |
Indicated | 124,650,000 | 0.070 | 0.04 | 192.7 | 121.1 |
Inferred | 16,300,000 | 0.051 | 0.06 | 18.3 | 21.9 |
The P&E estimate included both the Main zone and the Red Hill zone; however, the two were modelled as separate and distinct zones (P&E, 2008). The MDA estimate included only the Main zone, with the Red Hill zone being left out due to a lack of historic drilling quality assurance and quality control (“QA/QC”) and insufficient 2007/2008 drilling to accurately estimate the zone. The QP has not done the necessary work to fully verify these estimates, they are only quoted here for historical reasons and the historical estimates are being superseded by the estimate presented in this report.
The P&E and MDA historical estimate was prepared by using inverse distance square while the MDA estimate was prepared using ordinary kriging (“OK”) both applied geological wireframes representing the mineralized intervals to restrict the estimations. These estimates are no longer relevant because they were prepared before all the current drilling was completed. The historical estimates do use the mineral resource classification categories as prescribed in NI 43-101. The QP has not done the work necessary to verify the historical estimates and they should not be relied upon as they are all superseded by the estimates presented in Section 14 of this report. The historical estimates are only quoted here for historical reasons. The Company is not treating the historical estimates as current mineral resource estimates.
In 2011, SRK prepared a mineral resource estimate for the El Creston deposit on behalf of Creston Moly Corporation. The estimate used all drillholes drilled to June 2011. Mineral resources were estimated by ordinary kriging inside 10 m by 10 m by 12 m blocks using GEOVIA Surpac™ modelling software. Molybdenum and copper grades were estimated in three passes and resources were classified using resource categories as defined in NI 43-101. The historical resource is reliable and relevant but not current in that it doesn’t include all the current drill results. The estimate is superseded by the current mineral resource estimate presented in
GA / CAEStarcore_ElCreston_ResourceUpdate_Report_CAPR002049_20221113_SRK.docxSeptember 2022
SRK Consulting
El Creston Moly Property NI 43-101 Resource UpdatePage 27
Section 14 of this report. The mineral resources were reported at a grade of 0.035% molybdenum equivalent inside a Lerchs-Grossman optimized pit shell. Table 6.5 summarizes the SRK 2011 mineral resource. The Company is not treating the historical estimates as current mineral resource estimates. These historical estimates are relevant in that they demonstrate the size and grade of mineralization at El Creston as it changed through time with additional exploration and drilling.
Table 6.5: El Creston Mineral Resource Estimate (SRK, 2011)
| | | | | |
Resource Class | Total Tonnes | Mo | Contained Mo | Cu | Contained Cu |
(%) | (lbs) | (%) | (lbs) |
Measured | 67,200,000 | 0.080 | 118,800,000 | 0.06 | 89,400,000 |
Indicated | 199,100,000 | 0.058 | 255,000,000 | 0.06 | 280,400,000 |
Inferred | 21,900,000 | 0.043 | 20,600,000 | 0.06 | 27,700,000 |
Measured + Indicated | 266,300,000 | 0.064 | 373,900,000 | 0.06 | 369,800,000 |
Note:
| * | Reported at a cut-off grade of 0.035% molybdenum-equivalent within a Lerchs-Grossman optimized pit shell. Mineral resources are not mineral reserves and do not have demonstrated economic viability. All numbers have been rounded to reflect the relative accuracy of the estimates. |
The 2010, Creston Moly commissioned JDS Energy & Mining Inc. (“JDS”) to prepare a preliminary economic study (“PEA”) for the El Creston Project. The PEA envisaged mining by open pit method employing a conventional open pit truck shovel operation. The mine plan was developed following the selection of an optimized pit shell and subsequent design of an ultimate pit with ramps and designed slopes (JDS, 2010).
The stripping ratio for the life-of-mine averaged approximately 1:1. The inferred mineral resources included in the mine production plan represented 3.4% of the total plant feed. The PEA study was to be updated with the 2011 SRK resource estimate but after the purchase of Creston Moly by Mercator all engineering work on the El Creston Project ceased and the Project has remained inactive until now.
Despite having been explored by five adits, there has been no production from the El Creston Project.
GA / CAEStarcore_ElCreston_ResourceUpdate_Report_CAPR002049_20221113_SRK.docxSeptember 2022
SRK Consulting
El Creston Moly Property NI 43-101 Resource UpdatePage 28
7 | Geological Setting and Mineralization |
Regionally, the area is part of the Basin and Range Province. The Basin and Range Province is an extensional terrain of fault-bounded ranges and intervening valleys in the western United States that extends southward from Arizona and New Mexico into the states of Sonora and Chihuahua, Mexico. In northern Mexico, this province is bifurcated by the Sierra Madre Occidental, a north-northwest-trending mountain range about 1,200 km long and 200 km to 300 km wide that forms the spine of northern Mexico. The Creston property lies in the western or Sonoran portion of the Basin and Range Province, close to the western flank of the Sierra Madre Occidental (Figure 7.1).

Source: Wikipedia.org (with modifications)
GA / CAEStarcore_ElCreston_ResourceUpdate_Report_CAPR002049_20221113_SRK.docxSeptember 2022
SRK Consulting
El Creston Moly Property NI 43-101 Resource UpdatePage 29
Figure 7.1: Regional Geological Setting
The Sonoran portion of the Basin and Range Province is dominated by elongate, northwest-trending ranges separated by wide alluvial valleys. Precambrian gneiss, metamorphosed andesite, and granite form the basement. Basement rocks are overlain by Proterozoic quartzite and limestone, Paleozoic and Mesozoic carbonate sedimentary rocks, and Mesozoic volcanic and clastic and carbonate sedimentary rocks (Silberman et al., 1988). Mesozoic plutons cut these older units, and Tertiary extrusive and intrusive rocks, related to volcanic activity in the Sierra Madre, are widely distributed in the region.
The province exhibits widespread extension, similar to that seen in Arizona and south-eastern California. Northwest-trending, high-angle normal faults bound the ranges. There are also numerous low-angle thrust and detachment faults throughout the region.
The Creston area lies within a large roof pendant of Precambrian to Paleozoic metamorphic rocks which includes the Creston granite and the Tertiary-aged Sonoran batholith. The Sonoran batholith includes intrusions ranging from granodiorite to quartz monzonite in composition. Emplacement of the Tertiary batholith caused extensive fracturing of the roof pendant, which may have provided rock preparation prior to the Creston mineralization. Leon & Miller (1981) stated that although conclusive evidence of a younger intrusion responsible for the molybdenum mineralization at Creston has not been encountered, it is highly conceivable that such an intrusion does exist within the Project area.
The following geological description is taken from SRK (2011) with minor modifications.
The predominant lithologies known at El Creston include metamorphic rocks of Precambrian and perhaps Paleozoic age, intrusions of various compositions, dikes, and breccias of Paleozoic and Tertiary age, and Recent conglomerate, talus, and landslide deposits. The combination of strong hydrothermal alteration, post-mineralization structural events, and supergene effects makes some of the rock types virtually unrecognizable. This is particularly true in the Main deposit area, where contact relationships are difficult to map.
Phyllites, quartzite, gneisses, and metavolcanic rocks were intruded by the Creston granite, which has a weakly developed gneissic texture. While the Creston granite has been altered and mineralized, hosting most of the presently defined molybdenum mineralization in the Main deposit, the older metamorphic rocks intruded by the Creston granite are only locally altered and mineralized.
The Creston granite exhibits two phases. A coarse-grained, dark gray, predominantly equigranular rock is the main phase of the meta-granite and displays weakly developed foliation. Fine- to medium-grained, buff-white to brown, equigranular to locally porphyritic rocks form the weakly foliated fine-grained phase, which some authors have speculated may represent the chilled border or contact phase of the main granite. In the central part of the Creston deposit,
GA / CAEStarcore_ElCreston_ResourceUpdate_Report_CAPR002049_20221113_SRK.docxSeptember 2022
SRK Consulting
El Creston Moly Property NI 43-101 Resource UpdatePage 30
hydrothermal alteration related to the molybdenum mineralization has obliterated the original contacts and mineral contents of both phases of the Creston granite; the granite is generally fresh and unaltered only in the northern part of the property.
The most striking feature of the Creston granite within the Main deposit is its hololeucratic appearance. The rock is composed of quartz, potassium feldspar and altered plagioclase, with only local remnants of altered mafic minerals.
Creston Mining (2006) reported that the Creston granite is Mesozoic-Cenozoic in age, rather than Precambrian-Paleozoic as proposed by Leon (1978), Lodder et al. (1975), and Leon & Miller (1981). However, Creston Moly Corporation (2008) reports that the Creston granite is Proterozoic and that a recent regional geologic map of Sonora reports it is 1.4 Ga.
Foliation in the Creston granite trends N70°E and dips steeply both north and south (P&E, 2007 & 2008). Davis (1974) proposed that the foliation in the granite was produced by directed fracturing recrystallization. The metamorphic rocks, including the Creston granite, were structurally deformed sometime between the Proterozoic and Late Tertiary and were also intruded by a quartz monzonite stock during the Late Cretaceous to mid-Tertiary.
The Creston granite is the principal host of the molybdenum and copper mineralization at the Main deposit. It is the primary lithology in the upper plate of the low-angle Creston fault and lies adjacent to the quartz monzonite stock.
Three main types of unmetamorphosed intrusions, along with younger acidic to intermediate dikes, have been identified on the Creston property. The Meztli diorite is a medium-grained, porphyritic intrusion that forms an elongated, tabular body along the southern flanks of Cerro Creston. Although this intrusion does not contain any significant molybdenum mineralization, it does host supergene copper mineralization. A petrographic report by Rossetti (2007) concluded that the Meztli is actually strongly altered microgranite, probably a finer-grained variety of the Creston granite, and that the term “Meztli diorite” should be abandoned.
Fine-grained diorite that may be of Paleozoic age occurs over a large portion of the southeast part of the Main deposit area and also occurs as dikes in the central part of the Main deposit. This unit is a dark greenish white, fine- to locally medium-grained equigranular rock that is generally not mineralized. According to Rossetti (2007), this rock also can range in composition to monzodiorite.
Quartz monzonite porphyry was intruded between Late Cretaceous and mid-Tertiary time; it has been dated by K-Ar methods at 55.4 + 2.1 million years (“Ma”). (Krueger, 1978; Leon & Miller, 1981). The quartz monzonite porphyry is exposed immediately northeast and about 4 km west-southwest of the Creston deposit. It is also found as the most common unit below the Creston fault in the Main deposit area, as well as small apophyses above the fault. According to Lodder et al. (1975), the quartz monzonite forms part of an intrusive sequence of stocks, plugs, dikes, and
GA / CAEStarcore_ElCreston_ResourceUpdate_Report_CAPR002049_20221113_SRK.docxSeptember 2022
SRK Consulting
El Creston Moly Property NI 43-101 Resource UpdatePage 31
breccias that intruded the basement rocks along an east-west trend and probably underlies most of the Creston area.
Intrusion of a variety of acidic to intermediate dikes followed emplacement of the quartz monzonite. According to Lodder et al. (1975), these dikes and/or sills form a 4 km to 5 km-wide belt whose east-west axis follows the Precambrian tectonic grain and roughly coincides with the Cerro Creston ridge. About 80% of the exposed dikes are rhyolitic in composition, with the remaining 20% mainly diorite and minor aplite dikes (Lodder et al., 1975).
It should be noted that Krueger (1978) also reported a K-Ar date of 56.2 + 2.2 Ma on a sample identified only as “granite,” with no location given; MDA has no information on the relationship of this sample to any of the igneous rocks described above.
AMAX Corporation Ltd. (“AMAX”) identified numerous breccia bodies in the Cerro Creston area, which they classified as either “c” or “i” types (Leon & Miller, 1981). According to Leon (1978; Leon & Miller, 1981), the “c” breccias are composed of angular fragments of phyllite, meta-andesite, and occasional Creston granite within a quartz-rich matrix that exceeds 10% of the rock volume. Fragments in the “c” breccias are not rotated, and quartz contents in the breccia matrix are less than 10%. In the Red Hill area, the matrix of “c” breccias consists of quartz, epidote, chlorite, and pyrite, with local molybdenite. Within the Main deposit, the matrix is composed of quartz-sericite-molybdenite-pyrite.
According to Leon (1978; Leon & Miller 1981), the “i” breccias are represented by the centrally located breccia at Creston and the East Breccia about 1 km to the east (Leon, 1978). They are characterized by rotated, sub-angular to rounded fragments of Creston granite, porphyritic quartz monzonite, and rhyolite in a vuggy quartz or quartz-sericite matrix with minor rock flour. The volume of matrix material averages about 30%. According to Leon (1978), the central “i” breccia at Creston appears to be a breccia pipe; it is well exposed in the West adit. The East Breccia is a tabular breccia that seems to plunge to the southeast. The “i” breccias may be intrusive breccias related to the mineralization event (Leon, 1978).
In contrast to the AMAX interpretations about “c” and “i” breccias, Nuttycombe (1977) proposed that there are as many as five different types of breccias at Creston. Four formed as a result of intrusion and are pre-mineral; the fifth is of recent surficial origin, although it can be difficult to distinguish from the pre-mineral breccias.
Of the four pre-mineral varieties, contact dilation breccias, chimney-collapse breccias, and sheeted-collapse breccias are closely related and are of limited areal and volumetric extent. In contrast, gravity plate breccia is much larger in area and volume; although not directly related to the other three, Nuttycombe (1977) proposed that it also probably was related to emplacement of intrusions.
The gravity plate breccia is thick, shallowly dipping, and is bounded below by a sharp fault but gradually dies out upwards. Nuttycombe (1977) proposed that the gravity plate breccia was
GA / CAEStarcore_ElCreston_ResourceUpdate_Report_CAPR002049_20221113_SRK.docxSeptember 2022
SRK Consulting
El Creston Moly Property NI 43-101 Resource UpdatePage 32
intrusive-related because it often separates the underlying quartz monzonite porphyry from the overlying older basement rocks.
MDA modelled two breccias of significance within the Main deposit. The East Breccia is in the eastern portion of the resource area and continues well beyond the defined mineralization to the east. It is a tabular body that is elongated in a west-northwest direction, dips steeply to the south, and is floored by the Creston fault. While highly mineralized along its western extent, the East Breccia appears to be devoid of significant molybdenum mineralization to the east. A smaller body of breccia underlies the Cerro Creston ridge and is cut off at its base by the Gemini fault, and, although mineralized, it is mostly oxidized.
Massive veins of white, barren quartz are common and represent the latest event in the intrusive history at Creston (Leon, 1978). They are especially common in the eastern half of the Creston area.
Unconsolidated to Poorly Consolidated Units. Iron and manganese-cemented conglomerate with fragments from all of the above rock types is present as scattered occurrences throughout the property. Much of the Creston deposit is covered by a large mass of talus, consisting mainly of fragments of quartz monzonite porphyry and Creston granite in a loose matrix of crushed rock.
A N50°E to N60°E structural trend appears to have controlled emplacement of the Late Cretaceous-Tertiary quartz monzonite porphyry and also may have influenced Mo-Cu and Pb-Ag-Zn mineral zoning (Leon, 1978).
Low-angle normal faults that post-date mineralization are the most significant structural elements recognized at Creston with the Creston fault being the most important of these structures. The Creston fault, which strikes north-westerly and dips about 25˚ to 30˚ to the northeast, marks the contact between highly altered and mineralized Creston granite in the hanging wall and generally barren, fresh-appearing quartz monzonite porphyry in the footwall. The Creston fault is a zone of brecciation up to 50 m in width, with most of the brecciation lying in the upper plate Creston granite, but the fault plane itself at the contact is often marked by a zone of foliated gouge with widths measured in centimetres. The surface trace of the fault is marked by a wide zone of shattering, changes in rock type, breccia, and change in topographic slope. The amount and sense of displacement of the Creston fault is not known for certain, but this information is vital to further exploration at the project as the fault cuts off the Main deposit mineralization. AMAX believed the Creston fault to be a low-angle gravity structure with dip-slip offset of between 300 m and 450 m.
MDA modified this interpretation somewhat to suggest that the Creston fault, and the numerous associated faults that lie in the hanging wall of the structure, are low-angle normal faults related to extensional tectonics that post-date the Creston mineralization.
GA / CAEStarcore_ElCreston_ResourceUpdate_Report_CAPR002049_20221113_SRK.docxSeptember 2022
SRK Consulting
El Creston Moly Property NI 43-101 Resource UpdatePage 33
MDA modelled two faults originally identified by AMAX that occur in the upper plate of, and subparallel to, the Creston fault: the Gemini and Ordoñez faults. The Ordoñez fault generally lies a few tens of meters above the Creston fault and is characterized by a zone of intense brecciation that has been intruded by numerous dikes of varying compositions of both pre- and post-mineralization ages. The Ordoñez fault appears to merge into the Creston fault in the eastern portion of the Main deposit.
In the western portion of the Main deposit, the Ordoñez fault, as modelled, terminates the molybdenum mineralization, whereas the Creston fault cuts the mineralization in the eastern half of the deposit.
The Gemini fault is the uppermost low-angle fault in the upper plate of the Creston fault at Creston. The Gemini fault forms the floor of the breccia located along the Cerro Creston ridge and may have dip-slip movement of at least 200m (Leon & Miller, 1981).
The Carlos fault is located about halfway between the Creston and Gemini faults and is largely covered at the surface by talus. It is nearly parallel to the Creston and Gemini faults and appears to have had 20 m to 50 m of normal dip-slip movement (Leon, 1978).
There are many other structural zones, some of which have demonstrable shallow dips that were intersected by drillholes but have not been modelled. Lodder et al. (1975) reported the presence of several major, sub-horizontal, tabular tectonic breccias that occur in a roughly circular pattern around Cerro Creston, separating isolated patches of Creston granite from the underlying quartz monzonite stock. He believed that while these breccias have a wide variation in their strike, they generally appear to dip away from Cerro Creston at low angles (4° to 10°). Lodder et al. (1975) interpreted these tectonic breccia sheets as the brecciated bases of gravitational sliding blocks. AMAX also reported that the Creston fault was but one of a series of nearly parallel, low-angle, en-echelon faults located within the hanging wall of the fault. The series of upper plate faults are generally intruded by dikes of various compositions, and the faults are likely to be anastomosing.
Extensive steep faulting and shearing with both north-south and east-west trends are also reported to be common on the Creston property; however, the impact of these faults on the distribution of mineralization is believed to be minimal. There are reported to be at least four major vertical to sub-vertical faults with inferred vertical displacement of up to several hundred meters on the property. The most dominant one trends N70°E and dips 80°S in the basement rocks along the southern slopes of Cerro Creston. This fault is offset by three northwest-trending faults with horizontal displacements of up to 500 m.
The extensive system of faults at Creston have resulted in large areas of highly broken rock, which is reflected in low Rock Quality Designation (“RQD”) values measured in the core from Creston Moly Corporation. The RQD values are especially low, averaging less than 50% in the southern portion of the Main deposit, beneath the southern slopes of Cerro Creston ridge.
GA / CAEStarcore_ElCreston_ResourceUpdate_Report_CAPR002049_20221113_SRK.docxSeptember 2022
SRK Consulting
El Creston Moly Property NI 43-101 Resource UpdatePage 34
The Creston granite is extensively altered to potassic, phyllic, argillic, and propylitic alteration assemblages, and is locally strongly silicified, over an area measuring 2.5 km by 6 km. Most of the molybdenite is associated with potassic and phyllic (quartz-sericite) alteration and is often accompanied by various degrees of silicification. According to Leon & Miller (1981), there is evidence for at least two distinct alteration events – an early potassium-rich event and a later silica-rich hydrothermal event that was molybdenum bearing. Extensive post-mineralization faulting has made interpretation of the spatial relationships of alteration patterns difficult. Strong silicification occurs locally adjacent and peripheral to intrusive breccias, and this silicification clearly post-dates the potassic, phyllic, and propylitic alteration (Lodder et al., 1975).
Potassic alteration is characterized by pervasive potassium-feldspar flooding and veining and the formation of fine-grained secondary biotite. This alteration is interpreted by Leon & Miller (1981) to be related to the emplacement of the porphyritic quartz monzonite, and it is very widespread both on the surface and at depth. Biotite, quartz, sericite, topaz, and tourmaline, with pyrite, molybdenite, chalcopyrite, and locally traces of bornite, torbernite, and possible wolframite, are associated with the potassic alteration. Later hydrothermal events have altered the secondary biotite to chlorite or sericite.
Lodder et al. (1975) stated that mineralization markedly increases away from the intense pervasive potassic zone and towards the phyllic alteration zone, with part of the higher-grade molybdenite mineralization occurring at the contact of the two alteration zones.
Phyllic alteration occurs over most of the mineralized area and is characterized by pervasive sericitization of feldspars and biotite; Rossetti (2007) reported that rutile is also a common component. Sericite alteration ranges from weakly developed to zones of massive, fine- to medium-grained sericite. Zones of silicification are common in the phyllic zone. Leon & Miller (1981) believed that the phyllic alteration was directly associated with economic grades of molybdenum, however Rossetti (2007) disagrees. Creston Moly Corporation geologists have noted that some of the high-grade molybdenite mineralization intersected in the drillholes is associated with zones of strong phyllic alteration characterized by coarse-grained sericite.
There are two separate phases of silicification (Leon & Miller, 1981). The first phase was intimately associated with most of the molybdenum veinlet-hosted mineralization and generally contains molybdenite and pyrite with rare chalcopyrite. The second phase is barren to weakly mineralized and occurs as the matrix in the unmineralized portions of the East Breccia and as bull-quartz veins. In places, silicified zones have no associated sulfide mineralization, whereas in other cases strong molybdenum mineralization lies within strongly silicified zones, usually accompanied by phyllic alteration.
Propylitic alteration is characterized by chloritization of biotite, minor epidote, calcite, and fine-grained pyrite. Chloritization of secondary biotite is found at depth and beyond significant mineralization. High-grade Pb-Zn-Ag-Cu in quartz veins are found in the propylitic assemblage at the outer edges of the hydrothermal system (Lodder et al., 1975).
GA / CAEStarcore_ElCreston_ResourceUpdate_Report_CAPR002049_20221113_SRK.docxSeptember 2022
SRK Consulting
El Creston Moly Property NI 43-101 Resource UpdatePage 35
Argillic alteration is characterized by pervasive clay (kaolin) alteration of feldspar and the absence of ferromagnesian minerals and is not associated with significant molybdenum mineralization. Argillic alteration most strongly affects the Meztli diorite. Although it is generally weakly developed within the Creston granite, argillic alteration does occur where the granite is strongly sheared.
The Creston granite has been affected by all four types of alteration. Other rock types are either not pervasively altered, such as the phyllites and meta-andesites, or are altered by only one type of alteration assemblage, such as the argillized Meztli diorite.
The currently defined mineralized area occupies a zone about 1,600 m in an east-west direction, a maximum of 1,200 m in a north-south direction, and 550 m vertically. The Creston and Ordoñez faults terminate the bulk of the molybdenum mineralization in the Main deposit at depth, although some mineralization has been intersected in drillholes below the Creston fault at the Red Hill zone to the south. Mineralization at El Creston includes both molybdenum and copper minerals.
7.5.1 | Molybdenum Mineralization |
There are two principal styles of molybdenum mineralization at Creston: veinlet-hosted and breccia-hosted mineralization. The veinlet-hosted mineralization occurs primarily in the Creston granite and is the dominant style of molybdenum mineralization within the Main deposit resources. Molybdenite occurs as finely disseminated subhedral crystals 0.1 mm to 0.8 mm across, embedded in a pervasive, fine-grained quartz-sericite matrix, and also as coarsely crystalline molybdenite along the margins of quartz veins (Figure 7.2). The bulk of the molybdenite in this mode occurs as disseminations, but considerable amounts is present in quartz veins.
GA / CAEStarcore_ElCreston_ResourceUpdate_Report_CAPR002049_20221113_SRK.docxSeptember 2022
SRK Consulting
El Creston Moly Property NI 43-101 Resource UpdatePage 36

Source: MDA (2008)
Figure 7.2: Example of Coarse Crystalline Molybdenite Along Quartz Vein
The vertical to sub-vertical, sub-parallel molybdenite-bearing veins of this mode are numerous (up to 40 per metre). The veins are often of a vuggy nature and locally show cross-cutting relationships. The molybdenite in these veins is loosely bounded and is normally concentrated along the vein margins as coarse, subhedral to euhedral crystals up to 4 mm across. Locally, especially in the quartz veins, this combined mode carries possible recoverable amounts of chalcopyrite.
Creston Moly Corporation measured the orientations of a number of veins in outcrop within the Main deposit area and found the predominant orientation to be northwest striking (~315°) with high-angle dips to both the northeast and southwest. Lodder, et al., (1975) stated that the sub-vertical to vertical quartz veins normally trend 040° to 080°, are especially abundant over the central portion of the property, vary from hairline veinlets to 1 cm wide veins, and are spaced from one every 2 cm to one every 5 m.
The other important style of molybdenum mineralization in the Main deposit is hosted by the magmatic-hydrothermal East Breccia body. In this case, molybdenite typically occurs as fine-grained (0.05 mm to 1 mm) flakes at the contact of the quartz matrix with breccia fragments (Figure 7.3). There are also occasional high-grade, coarse-grained blebs of molybdenite in the breccia (Leon & Miller, 1981). Quartz-pyrite veinlets with molybdenite can also be found in fragments of the breccias and occasionally in the matrix.
GA / CAEStarcore_ElCreston_ResourceUpdate_Report_CAPR002049_20221113_SRK.docxSeptember 2022
SRK Consulting
El Creston Moly Property NI 43-101 Resource UpdatePage 37

Source: MDA (2008)
Figure 7.3: Molybdenite Mineralization Within East Breccia
Molybdenum also occurs as disseminated rosettes, ranging from 0.10 mm to 3mm in size, located in short high-grade intersections of massive coarse sericite within the Creston granite. Molybdenite may also occur with quartz along pre-mineralization structures (Lodder et al., 1975). Up to 8% pyrite is associated with molybdenite in irregular, parallel streaks or lenses in ribbon quartz veins. Finally, a particularly high-grade occurrence consists of fracture fillings and/or slip surfaces consisting of almost pure molybdenite.
Supergene oxidation and subsequent leaching are especially strong along the Cerro Creston ridge, where oxidation can extend for up to 90 m below the surface, averaging about 50 m in thickness (Lodder et al., 1975). Supergene alteration at Creston is characterized by a mineral assemblage that includes mixtures of clays, jarosite, goethite, and hematite with minor amounts of ferrimolybdite, malachite, chalcocite, turquoise, and ilsemannite (Lodder et al., 1975). Leon (1978), however, reported that no ferrimolybdite or ilsemannite have been observed in oxide zones, and thought that the molybdenum might be tied up in iron-rich oxides.
7.5.2 | Copper Mineralization |
Copper mineralization occurs at the Main deposit and consists primarily of chalcocite replacement of pyrite in the zone immediately below the oxidized – unoxidized boundary and along permeable
GA / CAEStarcore_ElCreston_ResourceUpdate_Report_CAPR002049_20221113_SRK.docxSeptember 2022
SRK Consulting
El Creston Moly Property NI 43-101 Resource UpdatePage 38
structures. The chalcocite is of supergene origin, and forms enrichment zones that parallel present-day topography, as well as extending significantly beyond the oxidized – unoxidized boundary along low-angle fault zones, especially the Ordoñez fault (MDA, 2008). These zones of copper enrichment occur most prominently in the southern portion of the Main deposit beneath the south slopes of the Cerro Creston ridge. Although the supergene copper mineralization coincides with molybdenum mineralization in many areas, the correlation between the two metals is poor. The copper extends to the south of the Main molybdenum zone, with the highest grades located between the Main zone and the Red Hill zone.
Oxide copper minerals found within the zone of oxidation include chalcanthite, brochantite, and turquoise (MDA, 2008). Copper values within the oxide zone are highly variable, but mainly low grade. Leon & Miller (1981) noted that oxidized primary copper minerals in the oxide zone suggest a low-grade, vein-controlled copper system, much like that encountered in the hypogene sulphide zone below.
Small quantities of chalcopyrite mineralization are commonly associated with molybdenite mineralization, with typical grades generally less than 0.1% copper. Chalcopyrite occurs as small discrete blebs in quartz veinlets, often accompanied by pyrite and, rarely, by sphalerite and molybdenite (Leon & Miller, 1981).
GA / CAEStarcore_ElCreston_ResourceUpdate_Report_CAPR002049_20221113_SRK.docxSeptember 2022
SRK Consulting
El Creston Moly Property NI 43-101 Resource UpdatePage 39
The molybdenum-copper mineralization found at the El Creston deposit has been characterized as belonging to low-fluorine type porphyry molybdenum deposit. Low-fluorine stockwork molybdenite deposits are closely related to porphyry copper deposits, being similar in their tectonic setting (continental volcanic arc) and the petrology (calc-alkaline) of associated igneous rock types (Ludington et al., 2009).
The deposits consist of stockwork bodies of molybdenite-bearing quartz veinlets that are present in and around the upper parts of intermediate to felsic intrusions. The deposits are relatively low grade (0.05% Mo to 0.2% Mo), but relatively large, commonly >50 Mt. The source plutons for these deposits range from granodiorite to granite in composition; the deposits primarily form in continental margin subduction related magmatic arcs, often concurrent with formation of nearby porphyry copper deposits.
Molybdenite-bearing quartz veinlets commonly contain small amounts of pyrite, and may also contain trace amounts of magnetite, scheelite, wolframite, galena, sphalerite or chalcopyrite. The veins may also contain K-feldspar ±biotite ±sericite ±clay minerals ±calcite ±anhydrite as gangue minerals. The veins are generally not composite, and all the major ore and gangue minerals seem to have formed contemporaneously. Peripheral polymetallic (Ag-Pb-Zn; silver-lead-zinc) veins are present at some deposits. In addition to stockwork veinlet systems, larger veins, sets of veins, and mineralized breccias are sometimes present.
Alteration assemblages are similar to those found in porphyry copper deposits. A central zone of potassic (and sometimes silicic) alteration is characterized by quartz ±K-feldspar ±biotite ±anhydrite. Distal to the potassic zone, phyllic alteration is present. The phyllic mineral assemblage is primarily quartz ±sericite ±carbonate minerals. Surrounding this may be a large propylitic zone (epidote +chlorite) which can extend for hundreds of meters, although this alteration is sometimes difficult to distinguish from regional metamorphic assemblages. Argillic alteration, consisting of clay minerals such as kaolinite and montmorillonite, whereas not common, may also be present, most typically as an irregularly distributed overprint on earlier alteration zones.
Areas of potassic alteration closely mimic the mineralized zones, whereas the phyllic alteration zone may be somewhat larger, extending hundreds of meters away from mineralized zone. The propylitic zone may be much larger, perhaps kilometres in extent. Potassic alteration appears to occur in vein envelopes and becomes pervasive only where veins are closely spaced. Phyllic alteration, whereas still vein-controlled, may be more pervasive, as the alteration envelopes are generally wider.
GA / CAEStarcore_ElCreston_ResourceUpdate_Report_CAPR002049_20221113_SRK.docxSeptember 2022
SRK Consulting
El Creston Moly Property NI 43-101 Resource UpdatePage 40
Starcore has not carried out any exploration on the El Creston Project but has announced a US$500,000 exploration program for the Project. The program is to include geological and magnetometry surveys. Results of these surveys are not currently available.
GA / CAEStarcore_ElCreston_ResourceUpdate_Report_CAPR002049_20221113_SRK.docxSeptember 2022
SRK Consulting
El Creston Moly Property NI 43-101 Resource UpdatePage 41
The mineral resources discussed in this report were estimated using the data provided by core and RC drilling. The drillholes utilized include historical (pre-2007) drilling and drilling completed by Creston Moly Corporation in 2008 and 2011. Starcore has not carried out a drill program on the property as of the effective date of this technical report. A total of 242 core holes and 18 RC holes have been drilled on the property, 187 by Creston Moly and 55 by previous operators representing a total of 52,182.47 m of core and 4,995 m of RC drilling (Table 10.1).
Table 10.1: Summary of All Drilling at El Creston
| | | |
Diamond Drilling |
Company | Year | Number of Holes | Length
(m) |
H.C. Dudley | 1937 | 2 | 202.00 |
Guggenheim | 1966-1967 | 8 | 851.35 |
New Jersey Zinc | 1981 | 4 | 923.70 |
AMAX | 1960, 1973-1976 | 39 | 11,763.58 |
Fresnillo | 1985-89 | 2 | 434.36 |
Creston Moly Corp. | 2007-2011 | 187 | 38,007.48 |
Core | Total | 242 | 52,182.47 |
Reverse Circulation |
Company | Year | Number of Holes | Length (m) |
AMAX | 1976 | 6 | 1,500.00 |
Orcana | 1995 | 12 | 3,495.00 |
RC | Total | 18 | 4,995.00 |
On the 260 holes drilled on the property, seven holes could not be included because of missing coordinate information.
10.2 | Pre-Creston Moly Drilling |
Only limited information is available about the historical drilling programs (per-Creston Moly) at El Creston. Most of the information in this section of the report is derived from copies of drill logs and from information from previous technical report on the property.
Holes drilled by H.C. Dudley were not included because of the unknown/uncertain location of the drill collars.
Holes drilled by Guggenheim were also excluded from the mineral resource estimate because of reported problems with core recovery during drilling and the uncertainty associated with the assay data. There is no information available about the type of core of drill procedures or contractor involved in the Guggenheim drill program.
GA / CAEStarcore_ElCreston_ResourceUpdate_Report_CAPR002049_20221113_SRK.docxSeptember 2022
SRK Consulting
El Creston Moly Property NI 43-101 Resource UpdatePage 42
New Jersey Zinc drilled four core holes on the El Creston property. Only one drill collar could be located and while included in the database, the hole was not used in the resource estimate because of uncertainty associated with the assay records and drill logs. No information regarding the type of core, drilling procedures or contractor could be located for the New Jersey drilling.
AMAX drilled two holes in 1960 and 37 core holes between 1973 and 1976 on the El Creston property. AMAX also drilled six RC holes in 1976.
A-1 was drilled with a Longyear rig, while A-2 was drilled with a Christensen rig. Hole A-1 was collared with NX to 23 m and BX to 57 m. BX core was recovered to 174 m and AX to at least 176 m (Sheridan & Parker, 1960). Hole A-2 was drilled with NX casing to 15 m, BX casing to 24 m, AX casing to 40 m, EX casing to 111 m, and as EX core to the total depth of 114.8 m (Sheridan & Parker, 1960).
From November 1974 to September 1975, AMAX drilled an additional 15 diamond-drillholes (A-3 to A-17) for a total of 3,100 m. The drill contractor for this program was AC Perforaciones S.A., owned by Jaime Varela of Cananea, Sonora. Three core rigs were used for the drill program, a Longyear 34 wireline drill that began the program in November 1974, a Longyear 44 wireline drill added in January 1975, and a Longyear 38 wireline drill mobilized in March 1975. The drills were capable of drilling HQ, NQ, and BQ core. Hole A-4 became the discovery hole when it encountered significant molybdenum mineralization at a depth of 115 m; the hole was stopped in mineralization at a depth of 186.45 m.
From the fall of 1976 to January 1978, AMAX drilled an additional 18 core holes for a total of 6,442 m. Of the 18 holes drilled, 16 were vertical, and two were angle holes. Boyles Bros. de Mexico was the drill contractor for the 1976-78 drill program. From September through December 1976, Boyles drilled with one Longyear 44 truck-mounted drill rig, one Longyear 38 rig drilling HQ and NX core and a Joy 22 rig, also drilling HQ and NX core (MDA, 2008).
From October 1978 to June 1979, an additional 12 holes were drilled, of which six were RC holes totaling 2,500 m and six were diamond-drill core holes totaling 1,939.50 m. The RC holes were drilled by Drilling Services Company of Tempe, Arizona using a 1975 Portadrill model TLT drilling machine.
The core holes were drilled by Boyles Bros. de Mexico using a Longyear 44 rig or Joy 22 rig.
Fresnillo drilled a vertical core hole (F-1) into the Main deposit in late 1985 to early 1986 and a second core hole (F-2) from August to October 1988 in an unknown location. The holes were not included in the drillhole database
Orcana Resources Ltd. (“Orcana”) drilled 12 RC holes (95-1 through 95-12) within the Main deposit in 1995. Two of the holes twinned AMAX core holes. There are no records of the contractor or drill rig type used to drill the Orcana holes. Based on copies of drill logs, it appears that some holes encountered some water which could have affected the recoveries. For this
GA / CAEStarcore_ElCreston_ResourceUpdate_Report_CAPR002049_20221113_SRK.docxSeptember 2022
SRK Consulting
El Creston Moly Property NI 43-101 Resource UpdatePage 43
reason, the Orcana drillholes were excluded from the mineral resource estimate. Figure 10.1 shows the distribution of all pre-Creston Moly drillholes.

Source: SRK (2022)
Figure 10.1: Planview Showing Distribution of Pre-Creston Moly Drillholes
10.3 | Creston Moly Drilling |
Creston Moly Corporation began their drill program at Creston in September 2007. One core rig was used initially with a second core rig being added in December 2007. Both were wireline core rigs operated by Layne Drilling of Hermosillo. All holes began with HQ core, which was reduced to NQ when required by drilling conditions.
Drillholes completed in 2010 and 2011 were drilled by Major Drilling of Hermosillo using primarily one drill rig recovering HQ sized core.
To prevent contamination, the drill contract stipulated that the drilling contractor could not use Mo-bearing rod grease or other drilling products containing molybdenum.
GA / CAEStarcore_ElCreston_ResourceUpdate_Report_CAPR002049_20221113_SRK.docxSeptember 2022
SRK Consulting
El Creston Moly Property NI 43-101 Resource UpdatePage 44
The core was transported to a secure facility at Creston Moly Corporation’s camp at Opodepe, where geotechnical and geological logging was conducted. High-quality digital photographs of the core in each core box were taken after the core pieces had been organized, and again after sampling intervals were marked. Detailed close-ups of mineralized core were also captured in each box.
Figure 10.2 shows the distribution of all Creston Moly drillholes.
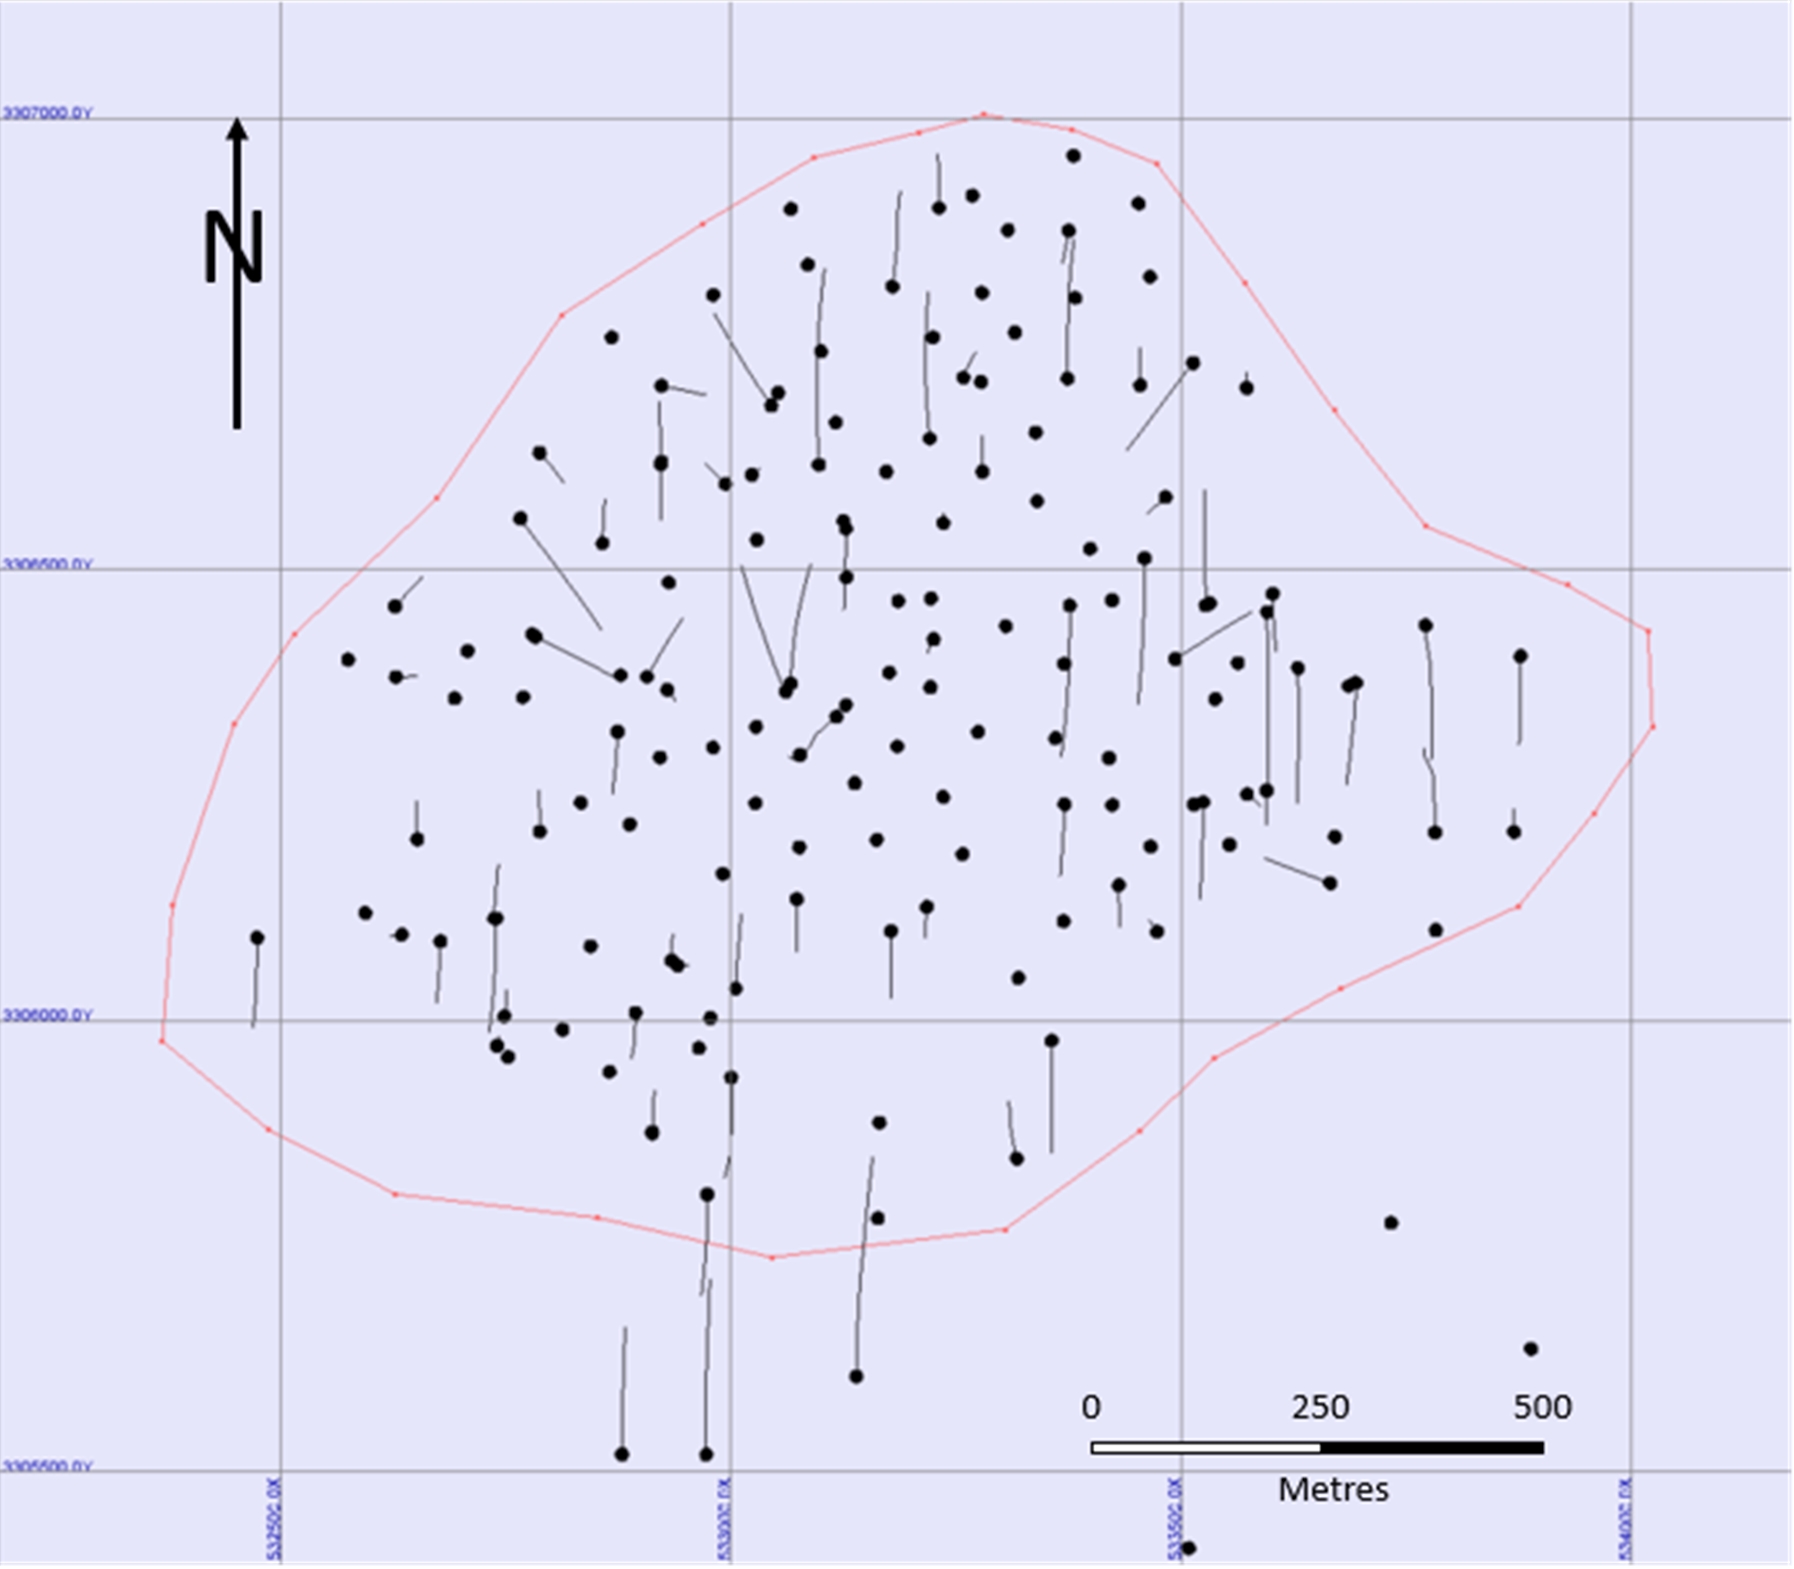
Source: SRK (2022)
Figure 10.2: Planview Showing the Distribution of Drillholes Drilled by Creston Moly
10.3.1 | Drill Collar Surveys |
The original local grid of AMAX was used for all in the database inherited by Creston Moly Corporation. The pre-Creston Moly drillholes were surveyed in local coordinates based on a property grid with a 10,000N 10,000E control point, which is no longer identifiable. Creston Moly Corporation acquired the Project topography from an aerial survey and changed the Project coordinates to UTM Zone 12 using the WGS84 datum. All access and drill roads were
GA / CAEStarcore_ElCreston_ResourceUpdate_Report_CAPR002049_20221113_SRK.docxSeptember 2022
SRK Consulting
El Creston Moly Property NI 43-101 Resource UpdatePage 45
rehabilitated with a dozer before the historic drillhole collars were resurveyed; however, many of these collars were destroyed.
All holes that could be located were surveyed in by Creston Moly and holes that couldn’t be located were positioned using their relative locations from the initial AMAX local grid coordinates. The QP is satisfied that the location of the AMAX drillhole collars are sufficiently accurate to be included in a mineral resource estimate.
There are no downhole survey data for the holes drilled prior to Creston Moly. Downhole surveys are also lacking for the first six holes drilled by Creston Moly, all of which were vertical holes. Multishot downhole surveys using a Reflex tool were taken at about 50 m intervals for all other Creston Moly holes. The downhole survey data indicate that the hole deviations are typically minor, usually changing by two degrees or less in both vertical and inclined holes, although a deviation of up to five degrees in one angle hole is recorded.
The QP is of the opinion that based on the deviation observed from the Creston Moly drillholes that it is unlikely that the vertical AMAX holes deviated very far from their azimuth and dip. Due to the large scale of the deposit and relatively wide drill spacing, the QP does not feel that the mineral resource is sensitive to the small errors or infrequently missing down-ole survey data and therefore believes that the AMAX holes are acceptable for inclusion in a mineral resource estimate.
10.3.3 | Relevant Drill Results |
All drill campaigns encountered significant molybdenum mineralization over significant widths. Table 10.2 summarizes the more significant drill intersections encountered in each of the campaigns used in the mineral resource estimate.
Table 10.2: Significant Drillhole Intersections used in the Mineral Resource Estimate
| | | | | | |
Hole-ID | Company | Year | From
(m) | To
(m) | Interval
(m) | Grade
(%Mo) |
A-11 | AMAX | 1975 | 68.00 | 280.00 | 212.00 | 0.090 |
Including | | | 152.00 | 192.00 | 40.00 | 0.173 |
A-18 | AMAX | 1975 | 256.00 | 352.00 | 96.00 | 0.092 |
A-19 | AMAX | 1975 | 30.00 | 282.00 | 252.00 | 0.061 |
A-20 | AMAX | 1976 | 70.00 | 276.00 | 206.00 | 0.094 |
A-21 | AMAX | 1976 | 26.00 | 374.00 | 348.00 | 0.075 |
Including | | | 190.00 | 214.00 | 24.00 | 0.082 |
A-22 | AMAX | 1976 | 16.00 | 236.00 | 220.00 | 0.065 |
A-24 | AMAX | 1976 | 94.00 | 354.00 | 260.00 | 0.060 |
Including | | | 150.00 | 170.00 | 20.00 | 0.104 |
A-30 | AMAX | 1976 | 64.00 | 262.00 | 198.00 | 0.059 |
Including | | | 166.00 | 204.00 | 38.00 | 0.140 |
A-31 | AMAX | 1976 | 70.00 | 318.00 | 248.00 | 0.095 |
GA / CAEStarcore_ElCreston_ResourceUpdate_Report_CAPR002049_20221113_SRK.docxSeptember 2022
SRK Consulting
El Creston Moly Property NI 43-101 Resource UpdatePage 46
| | | | | | |
Hole-ID | Company | Year | From
(m) | To
(m) | Interval
(m) | Grade
(%Mo) |
Including | | | 78.00 | 118.00 | 40.00 | 0.142 |
A-34 | AMAX | 1977 | 74.00 | 390.00 | 316.00 | 0.071 |
Including | | | 118.00 | 140.00 | 22.00 | 0.108 |
A-35 | AMAX | 1977 | 328.00 | 598.00 | 270.00 | 0.055 |
A-37 | AMAX | 1977 | 56.00 | 154.00 | 98.00 | 0.066 |
A-4200 | AMAX | 1978 | 52.00 | 204.00 | 152.00 | 0.068 |
Including | | | 178.00 | 204.00 | 26.00 | 0.135 |
EC07-003 | Creston | 2007 | 5.15 | 167.35 | 162.20 | 0.108 |
EC07-006 | Creston | 2007 | 136.40 | 220.70 | 84.30 | 0.071 |
EC07-007 | Creston | 2007 | 29.60 | 293.60 | 264.00 | 0.109 |
Including | | | 30.30 | 110.70 | 80.40 | 0.215 |
EC07-008 | Creston | 2007 | 23.50 | 189.60 | 166.10 | 0.151 |
Including | | | 102.60 | 166.85 | 64.25 | 0.213 |
EC07-009 | Creston | 2007 | 121.75 | 177.80 | 56.05 | 0.067 |
EC07-010 | Creston | 2007 | 22.45 | 128.74 | 106.29 | 0.051 |
EC07-010 | Creston | 2007 | 135.40 | 220.04 | 84.64 | 0.050 |
EC07-015 | Creston | 2007 | 38.75 | 169.05 | 130.30 | 0.058 |
EC08-017 | Creston | 2008 | 63.08 | 344.35 | 281.27 | 0.063 |
EC08-018 | Creston | 2008 | 53.40 | 197.30 | 143.90 | 0.061 |
EC08-019 | Creston | 2008 | 64.50 | 198.00 | 133.20 | 0.071 |
EC08-020 | Creston | 2008 | 120.80 | 294.40 | 173.60 | 0.106 |
Including | | | 228.35 | 252.75 | 24.40 | 0.178 |
EC08-021 | Creston | 2008 | 98.75 | 298.15 | 199.40 | 0.062 |
EC08-022 | Creston | 2008 | 250.50 | 310.35 | 59.85 | 0.059 |
EC08-022 | Creston | 2008 | 36.60 | 244.30 | 207.70 | 0.052 |
EC08-023 | Creston | 2008 | 85.05 | 330.80 | 245.95 | 0.082 |
EC08-024 | Creston | 2008 | 131.85 | 318.13 | 186.28 | 0.054 |
EC08-025 | Creston | 2008 | 55.03 | 352.45 | 297.42 | 0.101 |
EC08-027 | Creston | 2008 | 97.35 | 337.45 | 240.10 | 0.069 |
EC08-028 | Creston | 2008 | 109.05 | 212.55 | 103.50 | 0.050 |
EC08-029 | Creston | 2008 | 60.75 | 316.35 | 255.60 | 0.089 |
EC08-031 | Creston | 2008 | 186.35 | 255.80 | 69.45 | 0.068 |
EC08-031 | Creston | 2008 | 72.80 | 177.15 | 104.35 | 0.051 |
EC08-032 | Creston | 2008 | 49.50 | 317.50 | 268.00 | 0.081 |
EC08-033 | Creston | 2008 | 78.77 | 375.95 | 297.18 | 0.111 |
Including | | | 107.05 | 144.26 | 37.21 | 0.189 |
EC08-034 | Creston | 2008 | 11.95 | 290.85 | 278.90 | 0.070 |
EC08-035 | Creston | 2008 | 60.25 | 182.60 | 122.35 | 0.062 |
EC08-036 | Creston | 2008 | 81.18 | 180.10 | 98.92 | 0.088 |
EC08-036 | Creston | 2008 | 212.67 | 301.40 | 88.73 | 0.080 |
EC08-037 | Creston | 2008 | 127.00 | 251.90 | 124.90 | 0.088 |
EC08-037 | Creston | 2008 | 70.77 | 120.89 | 50.12 | 0.071 |
EC08-039 | Creston | 2008 | 40.85 | 346.07 | 305.22 | 0.083 |
EC08-040 | Creston | 2008 | 97.50 | 276.60 | 179.10 | 0.078 |
GA / CAEStarcore_ElCreston_ResourceUpdate_Report_CAPR002049_20221113_SRK.docxSeptember 2022
SRK Consulting
El Creston Moly Property NI 43-101 Resource UpdatePage 47
| | | | | | |
Hole-ID | Company | Year | From
(m) | To
(m) | Interval
(m) | Grade
(%Mo) |
EC08-041 | Creston | 2008 | 86.93 | 315.50 | 228.57 | 0.149 |
Including | | | 274.76 | 296.00 | 21.24 | 0.213 |
EC08-044 | Creston | 2008 | 102.68 | 311.00 | 208.32 | 0.091 |
EC08-045 | Creston | 2008 | 138.20 | 261.00 | 122.80 | 0.058 |
EC08-046 | Creston | 2008 | 34.46 | 241.10 | 206.64 | 0.100 |
Including | | | 82.50 | 141.62 | 59.12 | 0.204 |
EC08-047 | Creston | 2008 | 55.75 | 319.00 | 263.25 | 0.066 |
EC08-048 | Creston | 2008 | 7.53 | 172.75 | 165.22 | 0.098 |
EC08-049 | Creston | 2008 | 50.65 | 273.52 | 222.87 | 0.077 |
EC08-054 | Creston | 2008 | 239.60 | 496.50 | 256.90 | 0.080 |
Including | | | 408.20 | 442.30 | 34.10 | 0.205 |
EC08-057 | Creston | 2008 | 38.70 | 97.05 | 57.40 | 0.179 |
Including | | | 49.55 | 70.17 | 20.62 | 0.303 |
EC08-062 | Creston | 2008 | 221.50 | 499.10 | 277.60 | 0.058 |
EC08-063 | Creston | 2008 | 22.00 | 72.65 | 50.65 | 0.057 |
EC10-067 | Creston | 2010 | 128.10 | 271.45 | 143.30 | 0.111 |
EC10-070 | Creston | 2010 | 15.00 | 194.95 | 179.95 | 0.074 |
EC10-071 | Creston | 2010 | 64.05 | 148.00 | 83.95 | 0.068 |
EC10-072 | Creston | 2010 | 27.10 | 246.70 | 219.60 | 0.078 |
EC10-077 | Creston | 2010 | 64.05 | 186.05 | 122.00 | 0.057 |
EC10-090 | Creston | 2010 | 79.30 | 131.15 | 51.85 | 0.078 |
EC10-094 | Creston | 2010 | 0.00 | 54.90 | 54.90 | 0.078 |
EC10-095 | Creston | 2010 | 33.55 | 164.70 | 131.15 | 0.053 |
EC10-098 | Creston | 2010 | 15.25 | 100.65 | 85.40 | 0.108 |
EC10-099 | Creston | 2010 | 9.15 | 91.50 | 82.35 | 0.054 |
EC10-106 | Creston | 2010 | 36.60 | 201.30 | 164.70 | 0.105 |
EC10-107 | Creston | 2010 | 112.85 | 161.65 | 52.80 | 0.060 |
EC10-108 | Creston | 2010 | 39.65 | 276.60 | 236.95 | 0.057 |
EC10-109 | Creston | 2010 | 51.85 | 155.55 | 99.70 | 0.066 |
EC10-111 | Creston | 2010 | 91.50 | 241.00 | 149.50 | 0.058 |
EC10-113 | Creston | 2010 | 33.55 | 100.65 | 67.10 | 0.134 |
EC10-116 | Creston | 2010 | 67.10 | 135.00 | 67.90 | 0.078 |
EC10-121 | Creston | 2010 | 19.30 | 106.35 | 89.10 | 0.059 |
EC11-130 | Creston | 2011 | 48.80 | 131.25 | 82.45 | 0.072 |
EC11-135 | Creston | 2011 | 6.10 | 155.55 | 149.45 | 0.063 |
EC11-138 | Creston | 2011 | 30.50 | 103.70 | 73.20 | 0.076 |
EC11-139 | Creston | 2011 | 9.15 | 150.00 | 140.85 | 0.066 |
EC11-148 | Creston | 2011 | 62.70 | 115.00 | 52.30 | 0.117 |
EC11-151 | Creston | 2011 | 259.25 | 420.90 | 161.65 | 0.055 |
GT10-007 | Creston | 2010 | 79.30 | 143.35 | 64.05 | 0.071 |
GT10-011 | Creston | 2010 | 28.70 | 117.15 | 88.45 | 0.062 |
GT10-011 | Creston | 2010 | 123.25 | 199.50 | 76.25 | 0.057 |
GT10-012 | Creston | 2010 | 89.70 | 291.30 | 198.55 | 0.066 |
Note:
GA / CAEStarcore_ElCreston_ResourceUpdate_Report_CAPR002049_20221113_SRK.docxSeptember 2022
SRK Consulting
El Creston Moly Property NI 43-101 Resource UpdatePage 48
1 – Mo% represents the percent of molybdenum metal present in molybdenite. Assays are uncapped and intervals represent downhole lengths which are not necessarily representative of true thickness.
A significant portion of the molybdenite mineralization at Creston occurs as coarse flakes and radiating clusters along borders of closely spaced quartz veinlets. This loosely bound molybdenite can easily be lost during drilling, in drilling fluids, or may be broken free during the transport, handling, and splitting of drill core. These potential problems can be aggravated by poor core recovery.
The relatively low core recoveries in the earlier drilling by AMAX raise concerns about the drill core being representative of the mineralization, especially in the oxide zone where core recovery was generally 50% or less. Recoveries in fresh rock was generally good, approaching 100%. Drillholes with generally poor recoveries were not used in the current mineral resource estimate.
Given that many the holes drilled at El Creston are vertical and that the quartz-molybdenite veinlets often have subvertical in orientation, could result in overstatement of the lengths of mineralized intercepts in vertical drillholes, which could bias the estimation. Comparisons of the grades of angle holes to vertical holes provide evidence that there doesn’t appear to be a significant bias. Based on observation of drill core, the QP believes that the possible over-estimation due to vertical veins is not significant. To avoid problems that may be associated with poor core recovery, the QP excluded holes that had poorer recovery from the mineral resource estimate (Table 10.3).
Table 10.3: Number of Drillholes Eliminated from the Resource Estimation Database
| | | |
Company | Number of Hole | Number of Holes Eliminated | Reasons for Removing from Database |
Guggenheim | 8 DDH | 8 | Assay bias and no QA/QC |
NJ Zinc | 1 DDH | 1 | Lack of drillhole data, lack of QA/QC data |
AMAX | 39 DDH | 14 | Recovery issues, out of tolerance standards |
6 RC | 3 | Poor reconciliation with diamond drill core/possible water table issue |
Fresnillo | 2 DDH | 2 | Lack of QA/QC data |
Orcana | 12 RC | 12 | Lack of QA/QC data, issues with water table |
GA / CAEStarcore_ElCreston_ResourceUpdate_Report_CAPR002049_20221113_SRK.docxSeptember 2022
SRK Consulting
El Creston Moly Property NI 43-101 Resource UpdatePage 49
GA / CAEStarcore_ElCreston_ResourceUpdate_Report_CAPR002049_20221113_SRK.docxSeptember 2022
SRK Consulting
El Creston Moly Property NI 43-101 Resource UpdatePage 50
11 | Sample Preparation, Analyses, and Security |
Very little information is available regarding the sample preparation and security of the pre-Creston Moly drill programs. None of the Dudley, Guggenheim, New Jersey Zinc, Fresnillo or Orcana drillholes were utilized in the resource estimate, so their sampling procedures and analyses are not material to this report. Information on the AMAX sampling protocols is mainly derived from previous technical reports and from copies of assay certificates (MDA, 2008; P&E, 2007).
AMAX sampled all drill core at a regular 2 m interval. Few samples were broken at geological contact but over 995 of all samples were 2 m in length. Core was moved to the core logging facility in Opodepe where the core was logged by AMAX geologists. The core was split using a manual splitter and bagged for shipping to the assay laboratory. AMAX collected a total of 6,426 samples. In addition, AMAX included 212 standards and 894 duplicates in the samples sent to the lab for analysis. There are no indications that blanks were inserted in the assay stream.
AMAX routinely reviewed the assay results for accuracy but there are no records documenting their procedures for accepting or rejecting assay results. The QP couldn’t identify if the standards were from independent providers or certified.
AMAX completed numerous check-assaying programs, in general, other than for the 1975 drillholes, no significant issues were noted. Results from the 1975 drill program displayed high variability in repeat assays of original pulps at grades up to 0.03% Mo to 0.04% Mo (MDA, 2008). The results of the AMAX analytical standards suggested that most of the 1975 assay data is suspect.
Due to the standard results, as well as the poor recoveries experienced in the 1975 drillholes, Holes A-1 through A-15, except for A-6 and A-11, were excluded from the mineral resource database.
All Creston Moly drill core was placed in locked storage boxes at the drill site until collected by Creston Moly staff. The boxes were transported from the site to the logging facility in Opodepe where the core was held in a secure manner until it was logged and sampled by Creston Moly geologists.
Creston Moly developed drilling and sampling protocols designed to minimize loss of loosely bound molybdenite and to maximize sample recovery. In the historic sampling, a correlation between lower grades and lower recoveries was noted, so sample preparation and collection procedures were customized to minimize this possible problem. This included the use of core drilling over RC methods, completion of HQ core unless reduction to NQ was necessary, utilizing
GA / CAEStarcore_ElCreston_ResourceUpdate_Report_CAPR002049_20221113_SRK.docxSeptember 2022
SRK Consulting
El Creston Moly Property NI 43-101 Resource UpdatePage 51
minimal drill fluids, careful core handling procedures and full 3 m sampling. During the 2007 and 2008 drill campaigns, core was only split in half when necessary to complete field duplicates or in rare cases where it was necessary to preserve representative core. During the 2010 program, all core was sawn in half in order to preserve representative core and potentially for other testing.
The sampling was completed after all geological and geotechnical logging had been gathered and the core had been photographed and catalogued. The site geologists selected sample intervals of generally 3.05 m or less, with minimum sample lengths of 0.3 m. The beginning of each sample was marked in the core box.
Samplers filled plastic samples bags with either 100% or 50% of the sample interval’s core, depending on whether the samples were whole core (2007-2008) or half core (2010-2011). Samplers were careful to ensure that the entire sample was collected. Sample bags were secured with zip-ties and placed into another larger and labelled bag with the sample tag attached to it, and then also secured with a zip-tie.
AMAX half core samples were sent to Skyline Assayers & Laboratories (“Skyline”) in Tucson for sample preparation and analyses. Skyline is recognized as an industry leader for all types of base metal, ferrous and non-ferrous analysis including high quality ore-grade assays, sequential copper analyses of ores, and umpire assays of metallurgical products. Skyline is an ISO 17025:2017 accredited lab, the QP is unaware of the certification that Skyline held at the time of the AMAX assays.
At Skyline, samples were split, and a 200 g sample was crushed to nominal #10 mesh. The sample was then pulverized to #150 mesh.
All AMAX samples were analyzed for molybdenum disulfide (“MoS2”) and, in some cases, molybdenum oxide (“OxMo”). Where significant copper mineralization was present, the samples were also assayed for copper.
Skyline’s analyses included four-acid digestion and the determination of MoS2 was performed by colorimetric techniques. OxMo analysis involved digestion by hydrochloric acid with a colorimetric finish.
The bagged samples are picked up at Creston Moly Corporation’s logging facility in Opodepe by ALS Chemex Labs, Ltd. (“ALS”) staff and transported to ALS preparation facility in Hermosillo.
ALS is a global diversified testing services organization with a presence on every continent, offering a broad range of services to leading global companies. ALS is ISO 9001:2000 registered at the Vancouver facility which completed the El Creston analysis.
GA / CAEStarcore_ElCreston_ResourceUpdate_Report_CAPR002049_20221113_SRK.docxSeptember 2022
SRK Consulting
El Creston Moly Property NI 43-101 Resource UpdatePage 52
In Hermosillo, the samples were dried in stainless steel pans at a temperature not exceeding 95°C. All material from the sample bag was carefully placed in the drying pans to assure proper drying. After drying, the sample was placed back in the original sample bag and re-sealed.
Samples were then crushed until 70% of the sample passes 2 mm (#10 mesh) screening. A 1 kilogram (“kg”) sub-sample was then split off, using a riffle splitter. The 1 kg sub-sample was then pulverized to 85% passing Tyler #200 mesh with ring and puck equipment.
A 30 gram (“g”) sub-sample of the pulverized material was then sent to the ALS Vancouver facility for further processing, while the remaining material was returned to Creston Moly Corporation for storage at their office in Hermosillo. This preparation process followed ALS procedure PREP-31b and pulverizing code PUL-32. Throughout this process, internal QC tests were completed by ALS to assure that proper sample handling was followed.
The analysis of the 30 g sub-sample was completed at ALS in Vancouver. The ALS process code for the work in 2007/2008 was OG62 while for the 2010/2011 core it was ME-ICP61. These processes use four acid “near-total” digestion and are able to dissolve most minerals. The methods use both ICP-MS and ICP-AES techniques to maximize resolution, accuracy and detection limit. ALS assay results returned total Mo metal as opposed to the MoS2 assays provided by Skyline for the AMAX drill core.
ALS pulps and rejects were returned to Creston Moly Corporation and those samples which have been designated as having OxMo potential were sent to the Skyline laboratories. For most samples, Skyline assays the pulp for total molybdenum and OxMo. The total molybdenum analyses were completed using hydrochloric, nitric and perchloric acid digestion with ICP analysis. The OxMo assays were completed using hydrochloric acid digestion and read using ICP methods.
There are no records of the specific sample security applied during the AMAX drilling programs.
All drill core was securely stored at the drill site before being transported to the core logging facility by Creston Moly staff. All core at the logging facility was securely stored until such a time as logging and sampling was completed. Sampled bags were securely stored and sealed at the logging facility until they were picked up by ALS staff. After the samples were in ALS’s custody, they were securely stored according to ALS security protocols.
GA / CAEStarcore_ElCreston_ResourceUpdate_Report_CAPR002049_20221113_SRK.docxSeptember 2022
SRK Consulting
El Creston Moly Property NI 43-101 Resource UpdatePage 53
11.4 | Verifications by Creston Moly |
Creston Moly Corporation instituted a QA/QC program for all drilling campaigns completed on the property between 2007 and 2011. The QA/QC program included the insertion of duplicate, blanks and standard assays as well as the Umpire sampling program with Skyline laboratory.
Standards were provided by an independent certified commercial laboratory. Blank material was unmineralized granites from the Project area. Field duplicates were either ½ or ¼ core. Reject duplicates were prepared and analyzed by splitting the coarse rejects created during the original samples’ first crushing stage. Check assays were created by sampling the pulp of the original assays from ALS and sending this material to Skyline laboratory. Aside from the check assays, all QA/QC samples were inserted at regular sample intervals.
As part of the 2008 technical report, Creston Moly commissioned MDA to carry out a comprehensive verification of the AMAX drill data. MDA validated 95% of all AMAX assay data against copies of certificates and found only a few minor errors.
Table 11.1 summarizes the field duplicates, reject duplicates, blanks and standards completed during the 2007 to 2011 drill programs compared to the number of assays completed.
Table 11.1: QA/QC Samples Inserted by Creston Moly from 2007 to 2011
| | |
QA/QC Samples | 2007 to 2011 |
Number | Percent of Samples |
Total Sample Count | 12154 | |
Blanks | 410 | 3.37% |
Total Standards | 494 | 4.06% |
Duplicates | 255 | 2.11% |
Total QC Samples | 1,285 | 10.91% |
Skyline Umpire Assays | 126 | 1.04% |
Standards have been inserted at a rate of about 4.0%, which compares reasonably well with an industry standard insertion level of 5.0%. Duplicates have been inserted at a rate of 2.1%, which could be considered low; however, when the Skyline umpire samples are added, the number of duplicates is well within acceptable levels. It should be noted that the umpire duplicates are not a random selection from through the deposit but are a subset of samples at and above the upper oxide zone.
Duplicate assays from 2007 through to 2011 were completed using two sampling methods. Field duplicates, which involved sawing samples into two halves, and reject duplicates, which involved the sampling of reject assay material that has been crushed at the laboratory. Some of the field duplicates are ½ core samples (2007) and the 2008 to 2011 samples were ¼ core samples. The dominant duplicate analyses in 2010 and 2011 were reject duplicates. In addition,
GA / CAEStarcore_ElCreston_ResourceUpdate_Report_CAPR002049_20221113_SRK.docxSeptember 2022
SRK Consulting
El Creston Moly Property NI 43-101 Resource UpdatePage 54
duplicate check/umpire assays were completed using Skyline laboratory for samples where oxide molybdenum was suspected to be significant.
Field duplicate samples are typically collected to monitor sample preparation, as well as homogeneity of the sample submitted for assaying. Reject duplicate samples provide information about the sub-sampling variance introduced during the preparation process. Check or umpire assays can monitor potential laboratory bias.
The field duplicates were selected during sampling by sawing the sampled core into two halves. A total of 17 sets of duplicate ½ core samples from seven drillholes were analyzed. In addition, lab duplicates were prepared from re-sampling of the original coarse rejects created during the first crushing and splitting stage of the primary drill samples. A total of 238 reject sample duplicates were completed on 119 drillholes.
Generally paired values fall within the ± 20% range. About 30% of the pairs fall outside of the ±20% range which is considered acceptable given the coarse nature of the mineralization at El Creston. Figure 11.1 and Figure 11.2 compares the reject duplicate samples for both molybdenum and copper.
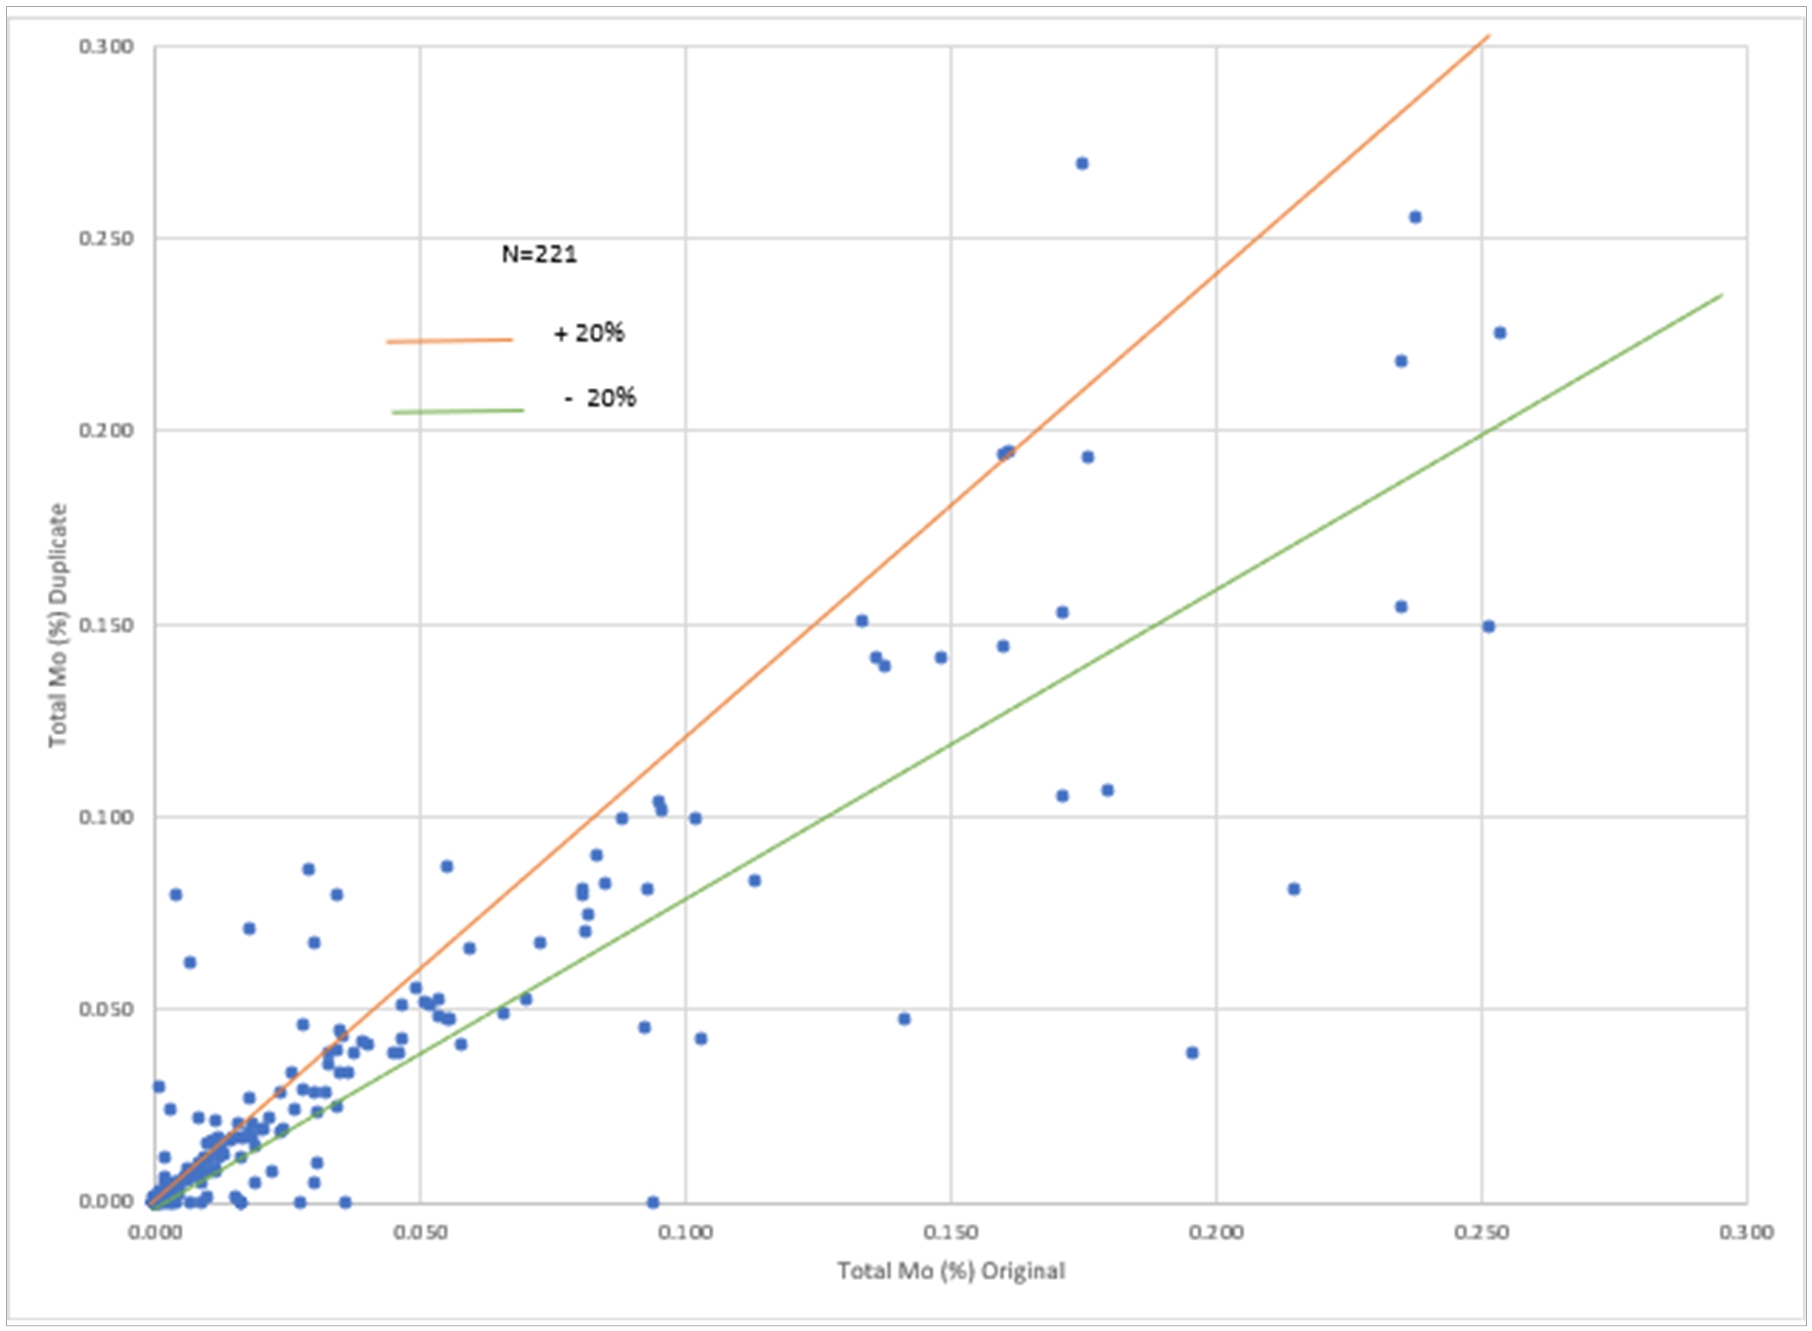
Source: SRK (2022)
Figure 11.1: Total Molybdenum Reject Duplicates
GA / CAEStarcore_ElCreston_ResourceUpdate_Report_CAPR002049_20221113_SRK.docxSeptember 2022
SRK Consulting
El Creston Moly Property NI 43-101 Resource UpdatePage 55

Source: SRK (2022)
Figure 11.2: Copper Reject Duplicates
The correlation of the reject duplicates for both molybdenum and copper is reasonable, without a significant bias shown for either metal.
Umpire or check assays have been completed for near surface/oxide zone samples only and are not representative of the entire deposit. The check assays were pulp duplicates of the ALS samples and were analyzed by Skyline laboratories to quantify both total molybdenum and OxMo. The total molybdenum values from Skyline were compared to the original ALS assay total molybdenum value. Figure 11.3 compares the total molybdenum percent check assay duplicates completed by ALS and Skyline.
No copper check assays were completed by Skyline.
GA / CAEStarcore_ElCreston_ResourceUpdate_Report_CAPR002049_20221113_SRK.docxSeptember 2022
SRK Consulting
El Creston Moly Property NI 43-101 Resource UpdatePage 56
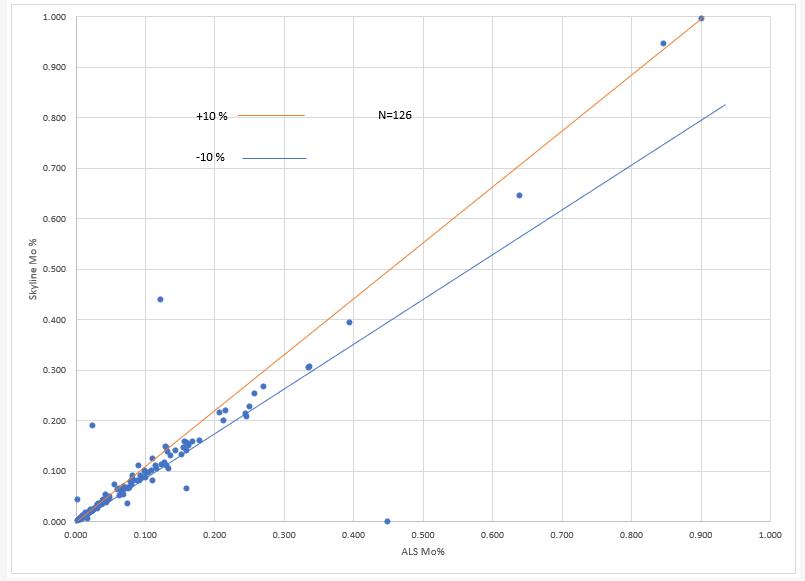
Source: SRK (2022)
Figure 11.3: 2008-2011 Total Molybdenum Umpire Assay Duplicates Compared
Overall, the correlation between the assay results from the two labs is extremely good and no bias is evident.
Field blanks are used to monitor contamination introduced during sample preparation and to monitor analytical accuracy of the lab. True blanks should not have any of the elements of interest much higher than the detection levels of the instrument being used.
Creston Moly Corporation inserted 410 blanks in the drillhole assays stream during the 2007-2011 program. The QP used a five times detection limit to qualify the blank results. The ALS ME-ICP61 analytical detection limit for molybdenum and copper is 1 part per million (“ppm”), while the ALS OG62 detection limit is 10 ppm for both.
Analytical blank results for both molybdenum and copper are acceptable. Six molybdenum values and four copper were above the detection limit threshold. The QP doesn’t believe that these infrequent blanks above the threshold indicate a serious systematic contamination issue. It is evident from the data that there was no significant contamination within the ALS laboratory.
GA / CAEStarcore_ElCreston_ResourceUpdate_Report_CAPR002049_20221113_SRK.docxSeptember 2022
SRK Consulting
El Creston Moly Property NI 43-101 Resource UpdatePage 57
11.4.3 | Reference Standard Samples |
Reference material control samples provide a means to monitor the precision and accuracy of the laboratory assay deliveries. In general, performance of the control samples used by Creston Moly Corporation was good, with most assay results falling within three standard deviations from the mean and showing no evidence of bias.
The reference standards ranged in molybdenum grade from 0.011% to 0.108% which provided a sufficient grade range for the El Creston deposit (Table 11.2). All standard copper values were between 0.32% Cu and 0.49% Cu, which is significantly higher than the deposit average. A lower grade copper standard should have been utilized, in the range of 0.05% Cu to 0.5% Cu.
Table 11.2: Standard Reference Material Used by Creston Moly
| | | | | |
Standard ID | Expected Value
(Mo %) | SD
(Mo %) | Expected Value
(Cu %) | SD
(Cu %) | Source |
CU-125 | 0.108 | 0.0040 | 0.42 | 0.009 | WCM Minerals |
CU-123 | 0.051 | 0.0019 | 0.49 | 0.012 | WCM Minerals |
CU-124 | 0.029 | 0.0010 | 0.36 | 0.009 | WCM Minerals |
CU-138 | 0.011 | 0.0005 | 0.48 | 0.009 | WCM Minerals |
CDN-MoS-1 | 0.065 | 0.0040 | n/a | n/a | Canadian Resource Laboratories Ltd. |
CU-174 | 0.036 | 0.0014 | 0.32 | 0.0052 | WCM Minerals |
Between 2007 and 2011, 494 standards were inserted into the assay batches. The QP reviewed all standard results against the expected value as determined by the lab and found that most standards performed reasonably well.
The results for the molybdenum reference standards show a slight, but immaterial low bias, and relatively little variability. None of the standards results fell outside the ±3 standard deviation (“±3δ”) of the expected assay value or the standards (Figure 11.4).
GA / CAEStarcore_ElCreston_ResourceUpdate_Report_CAPR002049_20221113_SRK.docxSeptember 2022
SRK Consulting
El Creston Moly Property NI 43-101 Resource UpdatePage 58
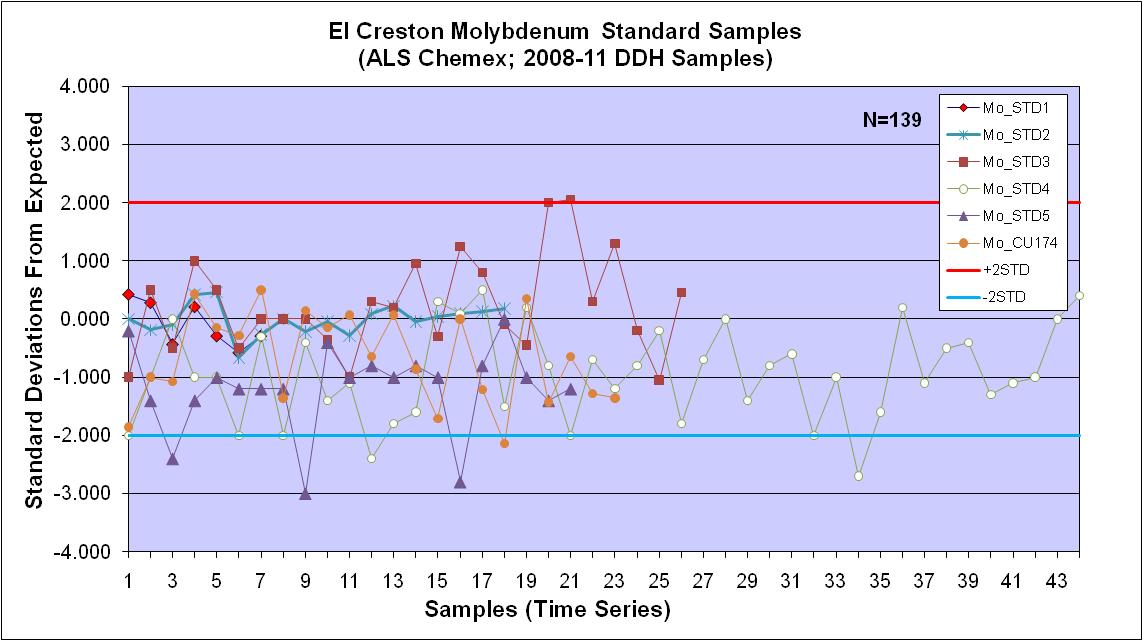
Source: SRK (2012)
Figure 11.4: Molybdenum Standard Reference Material Performance
The results for the copper reference standards indicate a very slight, but immaterial low bias, but very high variability. Sixteen results fell outside (“±3δ”) of expected value for the standard. The results of the copper standards are not ideal and should be investigated further. However, copper forms a minor component of the mineral resources at El Creston. The QP is of the opinion that these results do not materially affect the mineral resource.
Although copper results appear to be less precise than ideal, the QP believes that the overall reference standard results are sufficient to support the assay data.
Bulk density determinations were completed by ALS as part of the assay process. Samples were analyzed for bulk density during the 2007 and 2008 drilling, and again in the late 2010 and 2011 programs.
All results of the bulk density analysis were independently downloaded from the laboratory data and the database values were verified by the QP. Historic bulk density data was utilized and compared well with the 2007-2011 data. In total, there are 1,459 bulk density readings in the El Creston database. Of these, 1,425 samples are from the mineral resource area, 295 were collected by AMAX and 1,130 were collected from the Creston Moly drill core.
GA / CAEStarcore_ElCreston_ResourceUpdate_Report_CAPR002049_20221113_SRK.docxSeptember 2022
SRK Consulting
El Creston Moly Property NI 43-101 Resource UpdatePage 59
In the opinion of the QP, the sampling preparation, security and analytical procedures used by AMAX and Creston Moly are consistent with generally acceptable practices and appropriate for inclusion in the preparation of a mineral resource estimate for the El Creston deposit.
GA / CAEStarcore_ElCreston_ResourceUpdate_Report_CAPR002049_20221113_SRK.docxSeptember 2022
SRK Consulting
El Creston Moly Property NI 43-101 Resource UpdatePage 60
12.1 | Previous QP Verifications |
Data verification for the historical data was completed by MDA as part of their analysis resulting in their 2008 mineral resource estimation and NI 43-101 technical report. In addition, MDA completed verification of all 2007 and most of 2008 Creston Moly Corporation drilling and sampling. The QP reviewed the data verification undertaken by MDA as summarized in the 2008 technical report and completed independent data verification of the AMAX and Creston Moly assay data.
While the QP is not permitted to rely on the verifications done by previous independent Qualified Persons, the QP is of the opinion that the verifications by MDA add to the robustness of the El Creston database.
MDA’s verification included:
| • | Drillhole locations, dips and azimuths were compared to available maps, figures and logs as well as MDA GPS locations for holes that could be located. No significant discrepancies were found. |
| • | MDA checked assay certificates for a large number of the historical assays and made corrections where required. This included checking over 95% of the AMAX molybdenum assays and 81% of the copper assays against original assay certificates, logs, reports and maps (MDA, 2008). |
| • | Standard, blank and duplicate sample results were analyzed for all historical drilling when this type of data could be located. |
The MDA QA/QC analysis of the historical samples resulted in the elimination of selected drillholes from the final drill data used for mineral resource estimates.
12.2 | Verifications by the QP |
As part of the 2011 mineral resource update, SRK personnel under the supervision of the QP verified and validated the AMAX assay data against copies of assay certificates. All Creston Moly assay data were directly imported from ALS and the Creston Moly database was validated against the ALS data. No significant errors were noted. All significant AMAX assays were checked against the copies of assay certificates and the QP agreed with the conclusions derived by MDA in 2008. The QP decided to accept the verification by MDA as valid. The QP agreed that some AMAX drillholes showed possible assay bias and for this reason some AMAX holes were excluded from the resource database (Table 10.3 above). The QP carried out two site visits to the El Creston Project, the first visit as support for the 2011 technical report (SRK, 2011) and the most current site visit in support of the current technical report.
GA / CAEStarcore_ElCreston_ResourceUpdate_Report_CAPR002049_20221113_SRK.docxSeptember 2022
SRK Consulting
El Creston Moly Property NI 43-101 Resource UpdatePage 61
The QP visited the El Creston Project during a three-day period between 03 to 06 August 2010. During this period, drilling was being completed on the property. The QP observed the exploration work, assessed the logistical support, and reviewed drill core, drill site locations, mineralization and local geology. The QP was given full access to the site.
The QP did not complete any independent sampling during the August 2010 site visit. The QP logged mineralized sections of drill core from several drillholes, took photographs of molybdenite mineralization in core and verified that both molybdenum and copper minerals were present in the drill core.
A second site visit was carried out from 12 to 15 September 2022 by the QP. During the 2022 site visit, the surface access and geology were reviewed. The drill core was examined, and some holes were logged to verify the historical drill logs. Representative samples of the mineralization were also collected.
12.2.2 | Verifications of Analytical Quality Control Data |
The QP reviewed the QA/QC program implemented by Creston Moly and examined the results of the QA/QC programs and found them to be acceptable. The QP re-plotted all of the results for the blanks, standards and duplicates, and agreed the QA/QC data supports the inclusion of the assay data in the mineral resource estimation.
12.2.3 | Independent Verification Sampling |
The QP carried out a second filed visit as part of this technical report. As part of the site visit, the property access was verified, surface geology and drill site locations were verified. The drill core facility in Opodepe was visited and drill core was examined, and representative samples were collected (Table 12.1).
Table 12.1: Assay Results for Verification Samples Collected by the QP on the El Creston Project
| | | | | | | |
QP Sample No. | DDH | From | To | Original Mo (%) | Re-assay Mo (%) | Original Cu (%) | Re-assay Cu (%) |
12632 | EC10-066 | 134.20 | 137.25 | 0.055 | 0.043 | 0.01 | 0.01 |
12633 | EC10-066 | 247.05 | 250.00 | 0.146 | 0.004 | 0.00 | 0.00 |
12634 | EC10-066 | 250.00 | 235.15 | 0.001 | 0.000 | 0.00 | 0.01 |
12635 | EC10-070 | 124.80 | 127.35 | 0.439 | 0.431 | 0.02 | 0.02 |
12636 | EC11-150 | 295.85 | 298.90 | 0.055 | 0.026 | 0.04 | 0.03 |
12637 | EC11-130 | 103.70 | 106.75 | 0.116 | 0.000 | 0.03 | 0.04 |
Overall, the samples collected during the site visit agree very well with the previous assay results, however Sample No.12633 and Sample No.12637 returned significantly lower molybdenum values than the original samples. The difference in molybdenum values for these two samples reflects the coarse nature of the molybdenum mineralization occurring in narrow veins at El Creston and is indicative of the “nuggety” nature of some of the mineralization. This is typical of these types of deposits and not an indication of problems with the original assay data.
GA / CAEStarcore_ElCreston_ResourceUpdate_Report_CAPR002049_20221113_SRK.docxSeptember 2022
SRK Consulting
El Creston Moly Property NI 43-101 Resource UpdatePage 62
13 | Mineral Processing and Metallurgical Testing |
Starcore has not carried out any metallurgical testing of the mineralization at El Creston. Several tests were carried out by Creston Moly between 2008 and 2010 as part of their investigation of the property.
Metallurgical evaluations were carried out by METCON in 2008 (METCON, 2008). The discussion that follows was extracted from the METCON report.
13.1.1 | METCON Metallurgical Samples |
Three sets of samples were used to develop test samples.
Sample Set No.1 consisted of the entire cores of Drillholes 31 and 32 from Creston’s 2008 exploration program. Composite Test Sample No.1 was made from intervals in these drillholes to represent a possible ore product. This sample was used to determine the basic strategy for metallurgical testing.
Sample Set No.2 consisted of 20 high grade samples from which 15 samples were selected for testwork. Composite Test Samples No.3, 4, 3A and 4A were assembled from this sample set.
Sample Set No.3 consisted of 27 samples, 19 of which were of stockwork ore type, four of breccia ore type, and four were of mixed Oxide-Sulfide ore type. These samples were selected as representative of the average grades of the ore body of 0.086% Mo and 0.060% Cu. Flotation tests were conducted on the individual samples.
Sample Set No.1 Testing: Initial comminution and rougher flotation tests were conducted on Composite Test Sample No.1 to develop flotation parameters that would provide acceptable levels of metal recovery and concentrate grade. The composite sample assayed 0.1% Cu and 0.15% Mo.
The results of the flotation tests indicate that a primary grind size of 105 microns (“μ”) (P80) with the addition of 5 grams per metric tonne (“g/t”) sodium isopropyl xanthate (“SIPX”), 22 g/t fuel oil, ten minutes of rougher flotation, ten minutes of ceramic ball mill regrind, and two cleaning stages resulted in recoveries of 86.2% Cu and 69.34% Mo.
Sample Set No.2 Testing: Testing on Sample Set No.2 was to evaluate the flotation parameters for 15 high copper and molybdenum grade samples. The samples were classified into two main rock type groups (vein/stockwork in granite and brecciated metagranite). A total of four composites (3, 4, 3A, and 4A) were assembled from this set of samples in accordance with the two rock type classifications. The main objective in conducting these tests was to examine
GA / CAEStarcore_ElCreston_ResourceUpdate_Report_CAPR002049_20221113_SRK.docxSeptember 2022
SRK Consulting
El Creston Moly Property NI 43-101 Resource UpdatePage 63
flotation variability and to determine if acceptable levels of metal recovery and molybdenum concentrate grade were achievable. The parameters evaluated included the following:
| • | Flotation response by ore type |
| • | Flotation response by primary grind screen size analysis |
The results from 15 rougher flotation tests in an ore type variability series gave molybdenum recoveries ranging from 76.6% to 97.1% with the lowest recoveries corresponding to samples with the lowest molybdenum head grades (less than 0.1% Mo). Copper recoveries ranged from 36.36% to 98.81%.
Low copper recoveries were noted for the partially oxidized samples or where the head grade was low. Primary grind variability series and flotation kinetics tests indicated that a grind size of 80% passing 105 microns and a rougher flotation time of ten minutes were required to achieve acceptable copper and molybdenum recoveries. Additional rougher flotation kinetics tests conducted on the high copper grade composite (4A) indicated that at least ten minutes of flotation time and the addition of SIPX is required to achieve higher copper recovery.
Sample Set No.3 Testing: Testing on Sample Set No.3 was to evaluate flotation parameters on ten samples from Sample Set No.3 (copper and molybdenum grades close to the average grades of the deposit). The samples were classified in three main groups (Stockwork, Breccia, and mixed Oxide-Sulphide). The main objective of these tests was to examine flotation results variability by ore type and to determine if acceptable levels of metal recovery and molybdenum concentrate grade were achievable.
A total of ten individual rougher flotation tests were conducted on this set of samples. The flotation tests were conducted at a grind size of 105 microns and ten minutes flotation time.
The results of the testwork indicate the following:
| • | Molybdenum recovery of 97.91% was obtained for a single sample of breccia ore type which had a high molybdenum head grade. Molybdenum recoveries of up to 96% were achieved for the stockwork ore sample. |
| • | Copper recovery of 91.9% was achieved for the stockwork ore type which had a high copper head grade. |
| • | Mixed material containing both oxide and sulfide mineralization had lower recoveries for both metals. |
In 2010, Creston Moly commissioned JDS to prepare a PEA for the El Creston Project. As part of this study, JDS engaged G&T Metallurgical Services Ltd. (“G&T”) to help develop a metallurgical flowsheet for the Project. The following description is extracted from JDS (2010).
GA / CAEStarcore_ElCreston_ResourceUpdate_Report_CAPR002049_20221113_SRK.docxSeptember 2022
SRK Consulting
El Creston Moly Property NI 43-101 Resource UpdatePage 64
The G&T test program was aimed at developing a conventional Cu-Mo flowsheet comprising comminution and bulk flotation of Cu-Mo followed by Cu-Mo separation. Preliminary metallurgical testwork on the bulk flotation flowsheet has been completed on the two primary mineralization types – Hydrothermal Breccia (HBx) and Creston Granite (CG).
The flowsheet and results from the locked cycle testwork for the bulk flotation circuit are summarized as follows:
| • | HBx is slightly harder than CG with a Bond Rod Mill Work Index of 15.1 kWh/t and a Bond Ball Mill Work Index of 15.7 kWh/t. |
| • | High degree of liberation and recovery of Mo are achieved at a coarse grind. Target primary grind is a P80 of 340 microns to 360 microns. The coarse grind reduces the power requirements. The grinding circuit is designed to produce a primary P80 of 300 microns. |
| • | Bulk flotation circuit will comprise rougher flotation, regrind of rougher concentrate to 40 microns followed by three stages of cleaner flotation. |
The key general observations for the low-Cu HBx and CG mineralization were:
| • | Coarse primary grind produces high Mo and Cu recoveries while limiting Fe (pyrite) recovery, suggesting that the pyrite is not locked with Mo and Cu. |
| • | With the low Cu, Mo is the economic mineral of interest and a simple reagent regime using only fuel oil addition is needed to float the Mo. |
| • | Ag reports more to tailings, likely with the pyrite. |
| • | Preliminary, scoping Cu-Mo separation tests indicated the potential for achieving high Mo recovery and concentrate grade of over 50% Mo with the addition of the standard Sodium Hydrosulfide (“NaHS”) reagent. |
13.2.1 | G&T Metallurgical Samples |
A drillhole map of the deposit and assay data for HBx and CG designations were used to select samples that represent spatial distribution and global average deposit grade for each of the two ore types. Samples were selected from Drillholes EC00-003, 011, 0113, 014, 024, 029, and 047. A composite of each ore type was made up using minus #6 mesh reject samples. The composites were made up at site then shipped in drums to G&T for processing.
13.2.2 | Grindability Testing |
Drill core samples from 2010 drilling were used to determine the Bond Rod and Ball Mill Work Indexes, abrasion index. JK Drop Weight Test was run on the CG core while the SMC Test® was conducted on the HBx ore as dictated by the size of the available drill core samples. The data
GA / CAEStarcore_ElCreston_ResourceUpdate_Report_CAPR002049_20221113_SRK.docxSeptember 2022
SRK Consulting
El Creston Moly Property NI 43-101 Resource UpdatePage 65
was then used to design the grinding circuit using JKTech Simulation. One grinding circuit simulation has been completed to-date based on JK Drop Weight Test on the CG type. The grinding indexes for the two types of mineralization are tabulated in Table 13.1.
The Bond Ball Mill Work Index is based on the standard 106 micron closing screen. The data show that the hardness of both ores is fairly similar.
Table 13.1: Grindability Results
| | | |
Ore | Rod Mill Work Index (kwh/t) | Ball Mill Work Index (kwh/t) | Abrasion Index |
HBx Type | 12.2 | 15.7 | 0.2748 |
CG Type | 10.7 | 15.1 | 0.2659 |
Bulk Rougher Flotation Tests
Bulk rougher flotation tests were completed to investigate the effect of primary grind, pH and reagents on Mo and Cu recovery. Cu recovery appeared to improve with pH from the natural pH of 7 to 10. Mo recovery, however, was relatively insensitive to pH but with slight decrease as pH increased. Both Cu and Mo were relatively insensitive to grind between 140 microns and 360 microns.
Bulk Cleaner Flotation Tests
Bulk three-stage open cleaner tests were conducted on the HBx and CG mineralization to investigate the effect of the regrind size and depressants on Mo and Cu recovery and concentrate grades. The results indicated that the Mo minerals were not locked with the contaminants and high Mo grades could be achieved using depressants.
Preliminary Locked Cycle Tests
Table 13.2 shows the preliminary bulk flotation locked cycle tests on both the HBx and CG ores. The primary grind was between 340 microns and 360 microns.
Generally, the lock cycle tests established that high Mo recovery 83 to 85% could be achieved for both types of mineralization. However, the copper content of the CG mineralization type was still elevated in the cleaner concentrate and will probably require additional processing (Table 13.2).
Table 13.2: G&T Preliminary Locked Cycle Test Results
| | | | | | | | | | | | | |
| | Head Grade (%) | Bulk Rougher Recovery (%) | Cleaner Con Grade (%) | Cleaner Recovery (%) |
Test | Regrind (μ) | Cu | Mo | Fe | Cu | Mo | Fe | Cu | Mo | Fe | Cu | Mo | Fe |
HBx | | | | | | | | | | | | | |
40 | 46 | 0.02 | 0.099 | 2.6 | 68.2 | 92.1 | 7.1 | 5 | 42.2 | 4.6 | 49.3 | 83.7 | 0.1 |
42 | 60 | 0.02 | 0.104 | 2.7 | 77.8 | 94.4 | 5.8 | 6.4 | 39.6 | 5.6 | 65.5 | 85.4 | 0.4 |
CG | | | | | | | | | | | | | |
GA / CAEStarcore_ElCreston_ResourceUpdate_Report_CAPR002049_20221113_SRK.docxSeptember 2022
SRK Consulting
El Creston Moly Property NI 43-101 Resource UpdatePage 66
| | | | | | | | | | | | | |
41 | 29 | 0.05 | 0.553 | 1.3 | 54.2 | 91.2 | 7.2 | 11.8 | 26.4 | 9.8 | 40.7 | 83.2 | 0.7 |
43 | 41 | 0.06 | 0.057 | 1.3 | 48.9 | 92.6 | 6.8 | 10.8 | 22 | 11.8 | 45.2 | 90.3 | 2.1 |
14 | Mineral Resource Estimates |
The mineral resource statement presented herein represents the first-time disclosure of mineral resources prepared for the El Creston Molybdenum Project for Starcore International Mines Ltd. in accordance with the Canadian Securities Administrators’ National Instrument 43-101.
The mineral resource model prepared by the QP considers 181 core holes and three RC holes, 156 drilled by Creston Moly Corporation during the period of 2007 to 2011, and 28 holes drilled by AMAX in 1974-1975. The resource estimation work was completed by Dr. Gilles Arseneau, P. Geo. (APEGBC #23474) an appropriate “independent Qualified Person” as this term is defined in National Instrument 43-101. The effective date of the resource statement is 30 September 2022.
This section describes the resource estimation methodology and summarizes the key assumptions considered by the QP. In the opinion of the QP, the resource evaluation reported herein is a reasonable representation of the global molybdenum mineral resources found in the El Creston Project at the current level of sampling. The mineral resources have been estimated in conformity with generally accepted CIM “Estimation of Mineral Resource and Mineral Reserves Best Practices” guidelines and are reported in accordance with the Canadian Securities Administrators’ National Instrument 43-101. Mineral resources are not mineral reserves and do not have demonstrated economic viability. There is no certainty that all or any part of the mineral resource will be converted into mineral reserve.
The database used to estimate the El Creston Project mineral resources was audited by the QP. The QP is of the opinion that the current drilling information is sufficiently reliable to interpret with confidence the boundaries for stockwork molybdenum and copper mineralization and that the assay data are sufficiently reliable to support mineral resource estimation.
GEOVIA GEMs Version 6.8.4 was used to construct the geological solids, prepare assay data for geostatistical analysis, construct the block model, estimate metal grades and tabulate mineral resources. Sage2001 was used to model the variography of copper and molybdenum.
14.2 | Resource Estimation Procedures |
The resource evaluation methodology involved the following procedures:
| • | Database compilation and verification; |
| • | Construction of wireframe models for the boundaries of the stockwork molybdenum and copper mineralization; |
| • | Definition of resource domains; |
GA / CAEStarcore_ElCreston_ResourceUpdate_Report_CAPR002049_20221113_SRK.docxSeptember 2022
SRK Consulting
El Creston Moly Property NI 43-101 Resource UpdatePage 67
| • | Data conditioning (compositing and capping) for geostatistical analysis and variography; |
| • | Block modelling and grade interpolation; |
| • | Resource classification and validation; |
| • | Assessment of “reasonable prospects for economic extraction” and selection of appropriate cut-off grades; and |
| • | Preparation of the mineral resource statement. |
The database used to compile the mineral resource comprises of 184 drillholes, 181 core holes and three RC holes for a total of 44,780 m. Twenty holes were drilled by AMAX and 156 holes by Creston Moly (Table 14.1).
Table 14.1: Drillholes Used for El Creston Resource Estimation
| | | |
Company | Type | No. of Holes | Length
(m) |
AMAX | DDH | 25 | 8,483 |
AMAX | RC | 3 | 672 |
Creston | DDH | 156 | 35,625 |
Total RC | | 3 | 672 |
Total DDH | 181 | 44,108 |
All Total | | 184 | 44,780 |
The geological model is comprised of five surfaces representing various geological features and boundaries for modelling and grade interpolation purposes.
The surfaces modelled include:
| • | Lower limit of the oxide; |
| • | 3-D surface limit of higher-grade copper mineralization; |
The development of these surfaces is discussed below.
GA / CAEStarcore_ElCreston_ResourceUpdate_Report_CAPR002049_20221113_SRK.docxSeptember 2022
SRK Consulting
El Creston Moly Property NI 43-101 Resource UpdatePage 68
14.4.1 | Topographic Surface |
The topographic surface was created by interpretation from orthorectified air photos. This surface is sufficient for accurate determination of rock volumes and coding of the block model.
The oxide surface was modelled from a hard boundary between the dominantly oxidized zone near surface and the sulphide mineralization below using a 30% molybdenum oxide limit.
The interpretation was completed using implicit modelling techniques within LeapFrog® software. In most areas of the deposit, the data is sufficient to accurately model the boundary; however, there are places, particularly near the margin of the deposit, where interpretation is less constrained due to lack of drillholes and because:
| • | The furthest (downhole) OxMo assays remained within the zone of high OxMo%; or |
| • | The drillholes were not assayed for OxMo, only total molybdenum. |
Because every sample interval has not been analyzed for both total Mo and OxMo, there remains a risk that the recoverable molybdenum has been overstated in the mineral resource. However, the QP believes the current interpretation is relatively accurate to ensure that the mineral resource estimate is not materially biased by the inclusion of unrecoverable OxMo.
Sample composites and blocks located above the oxide boundary were excluded from the estimation of the mineral resource.
Two faults were modelled and used as hard boundaries to limit both composite selection and estimation.
The Gemini fault is located higher in the local geological sequence. The fault strikes approximately 095°, dipping approximately 30° toward the north. It cuts the topographic surface near of the south side of the main ridge and cuts the lower topography further to the north. Based upon the current understanding of the deposit, it forms the upper boundary to the mineralization.
The Creston fault is located lower in the local geological sequence and runs sub-parallel to the Gemini fault. The fault strikes approximately 110°, dipping approximately 30° to the north-northeast. The fault cuts topography lower on the south side of the main ridge, at an elevation of approximately 930 m in the west and 720 m in the east.
Both fault surfaces were supplied by Creston Moly Corporation and validated by the QP by reviewing the surfaces against drill log data and found that they were in general agreement with the drill logs. The QP notes that a more thorough structural interpretation would be desirable and may provide further refinement of the deposit’s mineralization. The fault surfaces were extrapolated outside the known data to ensure proper coding within the block model.
GA / CAEStarcore_ElCreston_ResourceUpdate_Report_CAPR002049_20221113_SRK.docxSeptember 2022
SRK Consulting
El Creston Moly Property NI 43-101 Resource UpdatePage 69
The Gemini fault was used as the upper boundary to both molybdenum and copper estimation and composite selection. The Creston fault was used as the lower boundary to both molybdenum and copper estimation and composite selection.
Molybdenum Main Zone
Molybdenum assays in the project database include MoS2 (AMAX, Orcana, and New Jersey Zinc), OxMo (AMAX and Guggenheim), and total molybdenum assays (Creston Moly Corporation and Guggenheim). All MoS2 assays were converted to total molybdenum values. OxMo values were also converted to total Mo and a total molybdenum value was calculated by adding the sum of molybdenum in sulphides and oxides.
The Creston Moly Corporation assays from 2007 through 2011 were reported as total molybdenum values. Where oxidized material was noted or expected, the samples were also assayed for OxMo at Skyline. Where OxMo values have been measured, the total molybdenum in sulphide has been calculated based on the following equation:

The Mo in sulphide value was used for all molybdenum grade estimation. Where no OxMo analyses were available the total molybdenum values were assumed to represent molybdenum in sulphides and used for estimation directly.
The molybdenum mineralization occurs primarily within the Creston granite as molybdenite crystals lining the walls of subvertical quartz veinlets and stockwork that are most commonly less than 10 cm in width. The breccia-hosted mineralization consists primarily of molybdenite that rims lithic fragments at the quartz-matrix/breccia-fragment contacts. A review of the assay data used to prepare the resource estimate showed that the total molybdenum assays could be grouped into three populations: a very low-grade, a low to medium-grade, and a very high-grade population (Figure 14.1).
The QP decided to use the low to medium grade as a threshold to model the main molybdenum domain at El Creston. The domain was modelled in GEMs on sections spaced at 20 m intervals. All assays were composited to identify the various grade domains. Some lower-grade intervals were included in the domains to assure reasonable geological continuity between sections.
GA / CAEStarcore_ElCreston_ResourceUpdate_Report_CAPR002049_20221113_SRK.docxSeptember 2022
SRK Consulting
El Creston Moly Property NI 43-101 Resource UpdatePage 70

Source: SRK (2022)
Figure 14.1: Probability Plot of Total Mo (%) showing Grade Populations
Copper Domain Surface
The copper mineralization at Creston is of much less economic importance than molybdenum and has not been studied in detail.
A wireframe was created by the QP to divide the mineralization zone into two copper domains. The division was used to limit the effect of higher-grade assays into areas of dominantly lower grades. The inner zone (“HGZ”) represents a supergene enriched copper zone, with significantly higher grades, (>0.20% Cu) which appears to grade into the lower zone. The lower zone (“LGZ”)
GA / CAEStarcore_ElCreston_ResourceUpdate_Report_CAPR002049_20221113_SRK.docxSeptember 2022
SRK Consulting
El Creston Moly Property NI 43-101 Resource UpdatePage 71
represents a volume of low-grade copper mineralization, with some higher-grade zones, potentially associated with fault structures.
The boundary of the HGZ was created through implicit modelling within LeapFrog® software. The model was created with a structural bias to follow the topographic surface and therefore model the supergene enrichment zone accurately. No specific sharp grade cut-off at depth was apparent; the copper values gradually decrease representing the change from higher grades to lower. The copper domain surface was used to split the volume occupied by the single molybdenum domain zone into the upper high grade and upper lower grade copper zones.
The current bulk density sampling database consists of 1,425 measurements in the mineral resource area, 395 collected by AMAX and 1,130 collected by Creston Moly between 2007 and 2011.
The Creston Moly Corporation data were collected from samples of whole core sent to Chemex; the dry bulk density of the samples was determined using Chemex Method OA-GRA08a. The exact methods employed by AMAX are unknown although it is reasonable to assume that the bulk densities were determined using the water immersion method. Average values of the various rock types and oxidation states of the AMAX determinations were compared to the Creston Moly Corporation values, with no significant differences noted.
A review of all density data indicated that the difference between the oxidized and unoxidized rocks was generally small (less than 10%) (Table 14.2).
Table 14.2: Comparison of Density Values for Fresh and Oxide Material
| | | | | |
Rock Type | Rock Code | Oxide | Fresh | % Diff | Total Count |
Hydrothermal Breccia | 10 | 2.51 | 2.58 | 2.71 | 60 |
Granite Porphyry | 20 | 2.41 | 2.56 | 5.86 | 78 |
Monzodiorite | 21 | 2.33 | 2.57 | 9.34 | 57 |
Felsic Dike | 23 | 2.67 | 2.67 | 0.00 | 8 |
Rhyolite | 25 | 2.54 | 2.57 | 1.17 | 11 |
Diorite | 30 | 2.46 | 2.67 | 7.87 | 77 |
Creston Granite | 50 | 2.53 | 2.57 | 1.56 | 980 |
Granite Gneiss | 51 | 2.52 | 2.63 | 4.18 | 40 |
Mafic Unit | 90 | 2.63 | 2.66 | 1.13 | 75 |
Unclassified | 99 | 2.53 | 2.57 | 1.56 | 39 |
GA / CAEStarcore_ElCreston_ResourceUpdate_Report_CAPR002049_20221113_SRK.docxSeptember 2022
SRK Consulting
El Creston Moly Property NI 43-101 Resource UpdatePage 72
14.5 | Evaluation of Outliers |
Block grade estimates may be unduly affected by high grade outliers. Therefore, assay data were evaluated for high grade outliers and capped to values that, on probability plots, appears as the lower boundary of a small but very high-grade population. An inflection point in each probability plot (Figure 14.2 and Figure 14.3) represents values where an infrequent, but high-grade population begins to affect the distribution. Analysis of probability plots suggests that capping total molybdenum values of 0.70% and molybdenum in sulphide was appropriate. Copper in the higher-grade zone was capped at 1.0% copper and copper in the low-grade zone was capped at 0.45% copper. No capping was applied to the molybdenum in oxide as no resources were estimated for the oxide zone.

Source: SRK (2022)
Figure 14.2: Cumulative Probability Plot, Molybdenum (in sulphide) Assays
GA / CAEStarcore_ElCreston_ResourceUpdate_Report_CAPR002049_20221113_SRK.docxSeptember 2022
SRK Consulting
El Creston Moly Property NI 43-101 Resource UpdatePage 73

Source: SRK (2022)
Figure 14.3: HGZ, Cumulative Probability Plot, Total Copper Assays
All capping was completed on raw assays, prior to compositing.
Most of the 2007 to 2011 Creston Moly Corporation samples were completed on 3.05 m sample lengths while the bulk of the historic sampling was completed at 2 m sample lengths. On average, 57% of the samples within the whole dataset fall below 3 m and 97% fall below 3.5 m. The most common sample lengths are 2 m and 3.05 m. Figure 14.4 shows the histogram of samples length and Table 14.3 summarizes the basic statistical data of the sample lengths.
GA / CAEStarcore_ElCreston_ResourceUpdate_Report_CAPR002049_20221113_SRK.docxSeptember 2022
SRK Consulting
El Creston Moly Property NI 43-101 Resource UpdatePage 74
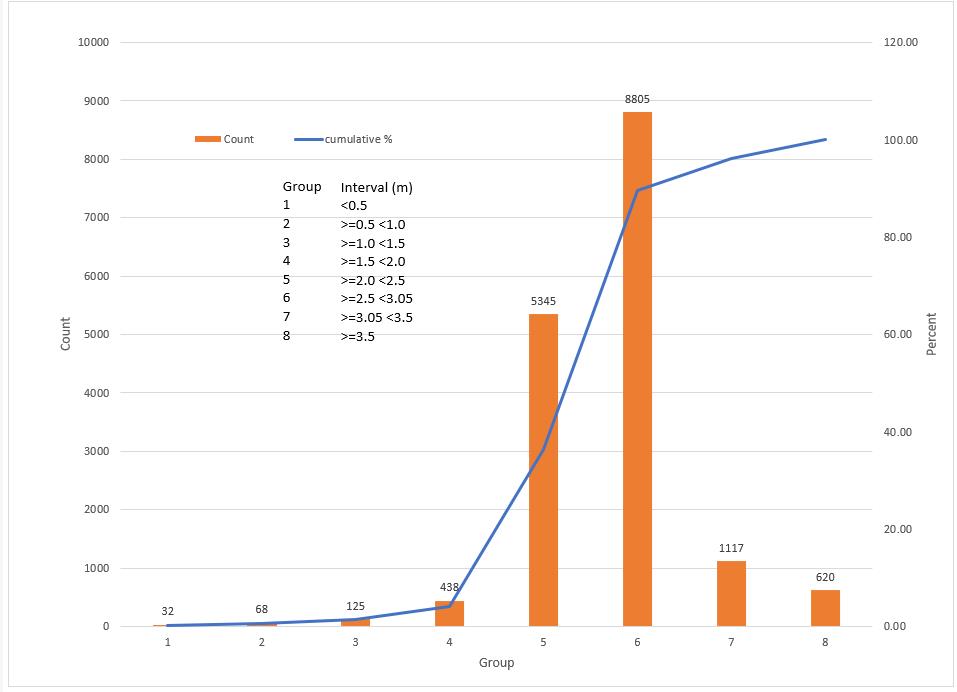
Source: SRK (2022)
Figure 14.4 Assay Length Histogram
Table 14.3 Sample Length Descriptive Statistics
| |
Statistic | Length
(m) |
Mean | 2.67 m |
Standard Deviation | 0.93 m |
Minimum | 0.20 m |
Maximum | 10.0 m |
Count | 16,368 |
The QP elected to continue to utilize 3 m composite length because most samples (97%) were 3.05 m in length or less.
Figure 14.5 shows the capped total molybdenum histogram for the composited assays and Figure 14.6 shows the capped composited copper data.
GA / CAEStarcore_ElCreston_ResourceUpdate_Report_CAPR002049_20221113_SRK.docxSeptember 2022
SRK Consulting
El Creston Moly Property NI 43-101 Resource UpdatePage 75

Source: SRK (2022)
Figure 14.5: Molybdenum Composite De-Clustered Histogram and Statistics

Source: SRK (2022)
Figure 14.6: Copper Composite De-Clustered Histogram and Statistics
14.7 | Statistical Analysis and Variography |
Variogram analysis was completed on the composites for each metal and within the mineralized domains. Nugget effects were established from downhole variograms. The nugget values are 15 and 5% of the total sill for molybdenum and copper respectively. Figure 14.7 and Figure 14.8 show the directional variograms and spherical models for molybdenum and copper.
GA / CAEStarcore_ElCreston_ResourceUpdate_Report_CAPR002049_20221113_SRK.docxSeptember 2022
SRK Consulting
El Creston Moly Property NI 43-101 Resource UpdatePage 76

Source: SRK (2022)
Figure 14.7: Molybdenum Directional Variograms

Source: SRK (2022)
Figure 14.8: Copper Directional Variograms
GA / CAEStarcore_ElCreston_ResourceUpdate_Report_CAPR002049_20221113_SRK.docxSeptember 2022
SRK Consulting
El Creston Moly Property NI 43-101 Resource UpdatePage 77
The variogram analysis was used to select estimation parameters for the ordinary kriging parameters as well as assist with the inverse-distance parameters.
A block model was constructed to cover the entire extent of the El Creston deposit mineralization and any potential pit limits. The geometrical parameters of the block model are summarized in Table 14.4. Due to the scale of the deposit; no sub-blocking or partial percent volume fields were utilized. All blocks are 10 m by 10 m by 12 m in size.
Table 14.4: Resource Block Model Extent
| | | |
Description | Easting
(X) | Northing
(Y) | Elevation
(Z) |
Block Model Origin (Min) (NAD 83 Zone 12) | 532,200 | 3,305,300 | 256 |
Parent Block Dimension (m) | 10 | 10 | 12 |
Number of Blocks | 192 | 192 | 96 |
Rotation (Degree) | 0 | 0 | 0 |
The molybdenum estimates were completed using ordinary kriging. The estimations were completed in three steps. All three estimation passes required composites from at least two drillholes.
Identical procedures were applied to estimate copper in the High-Grade Zone-Supergene (HGZ) and Lower Grade Zone-Primary (LGZ) domains. Assays within the HGZ were limited to a shell which was designed to preferentially follow topography.
For the estimates, hard boundaries were applied; limiting composite selection to those located only in the domain being estimated.
Table 14.5 and Table 14.6 summarize the molybdenum and copper estimation parameters.
GA / CAEStarcore_ElCreston_ResourceUpdate_Report_CAPR002049_20221113_SRK.docxSeptember 2022
SRK Consulting
El Creston Moly Property NI 43-101 Resource UpdatePage 78
Table 14.5: Variogram Parameters Used for Ordinary Kriging Estimation
| | | | | | | | | | |
Element | Domain | Model Type | Nugget Co | Sill C1 | Rotation (LRR) | Ranges a1, a2, a3 |
Around Z | Around X | Around Z | X | Y | Z |
Mo | Main | Spherical | 0.15 | 0.55 | 75 | 0 | 0 | 40 | 90 | 30 |
0.3 | 75 | 0 | 0 | 320 | 180 | 170 |
Cu | HGZ & LGZ | Spherical | 0.05 | 0.55 | 75 | 0 | 0 | 50 | 30 | 35 |
0.4 | 75 | 0 | 0 | 600 | 350 | 200 |
Table 14.6: Estimation Parameters
| | | | | | | | | | | |
Ellipse Orientation (LRR) | Search Ranges (m) | Composite Constraints |
Domain & Metal | Ellipse Volume | Major Bearing (Around Z) | Major Plunge (Around X) | Major Dip (around Z) | Major (Y) | Semi-Major (X) | Minor (Z) | Minimum Samples | Maximum Samples | Max per DH | Min DHs Required |
Mo | Step 1 | 75 (WNW) | 0 | 0 | 100 | 50 | 25 | 7 | 16 | 5 | 2 |
Step 2 | 150 | 75 | 50 | 6 | 16 | 5 | 2 |
Step 3 | 200 | 150 | 75 | 5 | 16 | 4 | 2 |
Cu HGZ | Step 1 | 75 (WNW) | 0 | 0 | 100 | 50 | 33 | 6 | 16 | 4 | 2 |
Step 2 | 150 | 75 | 50 | 5 | 16 | 4 | 2 |
Step 3 | 250 | 125 | 83 | 4 | 16 | 3 | 2 |
Cu LGZ | Step 1 | 75 (WNW) | 0 | 0 | 100 | 50 | 33 | 6 | 16 | 4 | 2 |
Step 2 | 150 | 75 | 50 | 5 | 16 | 4 | 2 |
Step 3 | 250 | 125 | 83 | 4 | 16 | 3 | 2 |
GA / CAEStarcore_ElCreston_ResourceUpdate_Report_CAPR002049_20221113_SRK.docxSeptember 2022
SRK Consulting
El Creston Moly Property NI 43-101 Resource UpdatePage 79
Within the main molybdenum zone, density was estimated using inverse distance weighted to the power of two (“ID2”) in a single estimation pass. The search ellipse was aligned along the trend of the mineralization with an ellipse measuring 400 m by 266 m by 266 m. A maximum of eight samples and a minimum of two samples were used to estimate each block. Un-estimated blocks within the main zone were assigned a value of 2.57 grams per centimetre cubed (“cm3”) for fresh rock and 2.53 g/cm3 for oxidized rock. The global average and the histogram of the estimated values were compared to the sample data to validate the estimate.
Outside the mineralization envelope, blocks were assigned 2.53 g/cm3 if they were above the oxidation surface and 2.59 g/cm3 if they were below the oxidation surface.
The QP is of the opinion that the number of bulk density measurements are sufficient to model the variability in bulk density throughout the deposit.
The block model estimates were validated by completing a series of visual inspections and by:
| • | Comparison of local “well-informed” block grades with average composite values contained within those blocks; and |
| • | Comparison of average assay grades with average block estimates along different directions – swath plots. |
Figure 14.9, Figure 14.10 and Figure 14.11 shows comparisons of estimated molybdenum and copper (HGZ & LGZ) block grades with borehole assay composite data contained within those blocks.
GA / CAEStarcore_ElCreston_ResourceUpdate_Report_CAPR002049_20221113_SRK.docxSeptember 2022
SRK Consulting
El Creston Moly Property NI 43-101 Resource UpdatePage 80
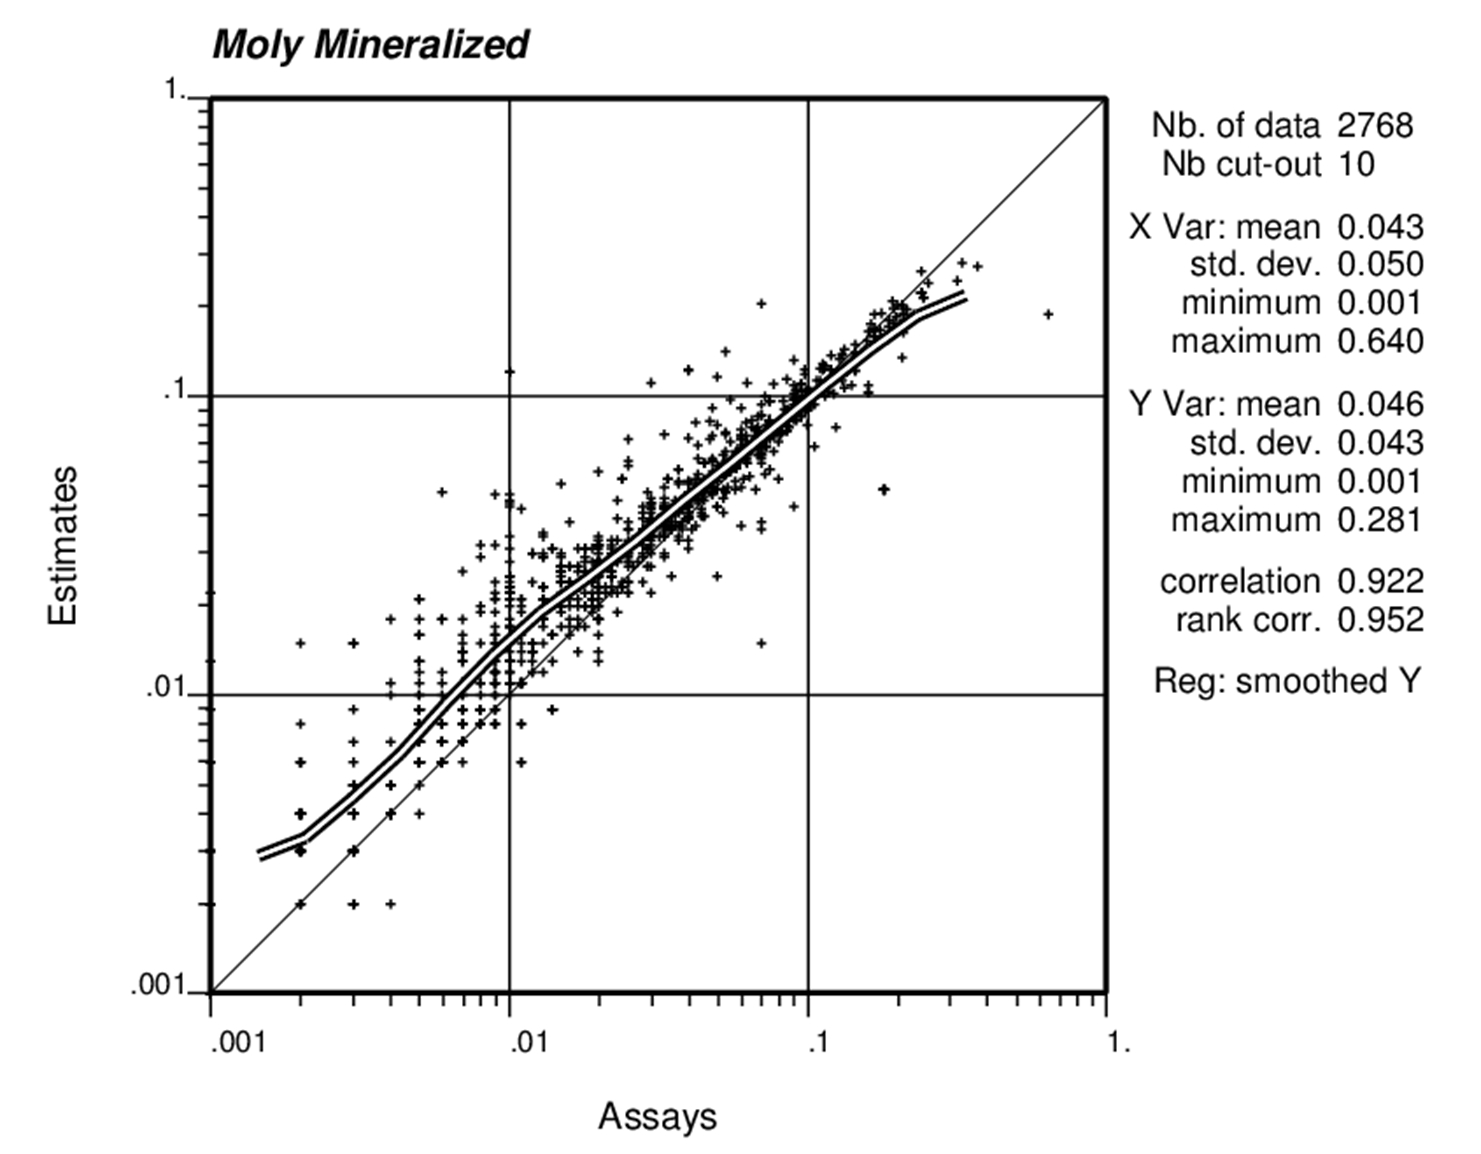
Source: SRK (2022)
Figure 14.9: Comparison of Molybdenum Estimates with Assay Averages within the Blocks
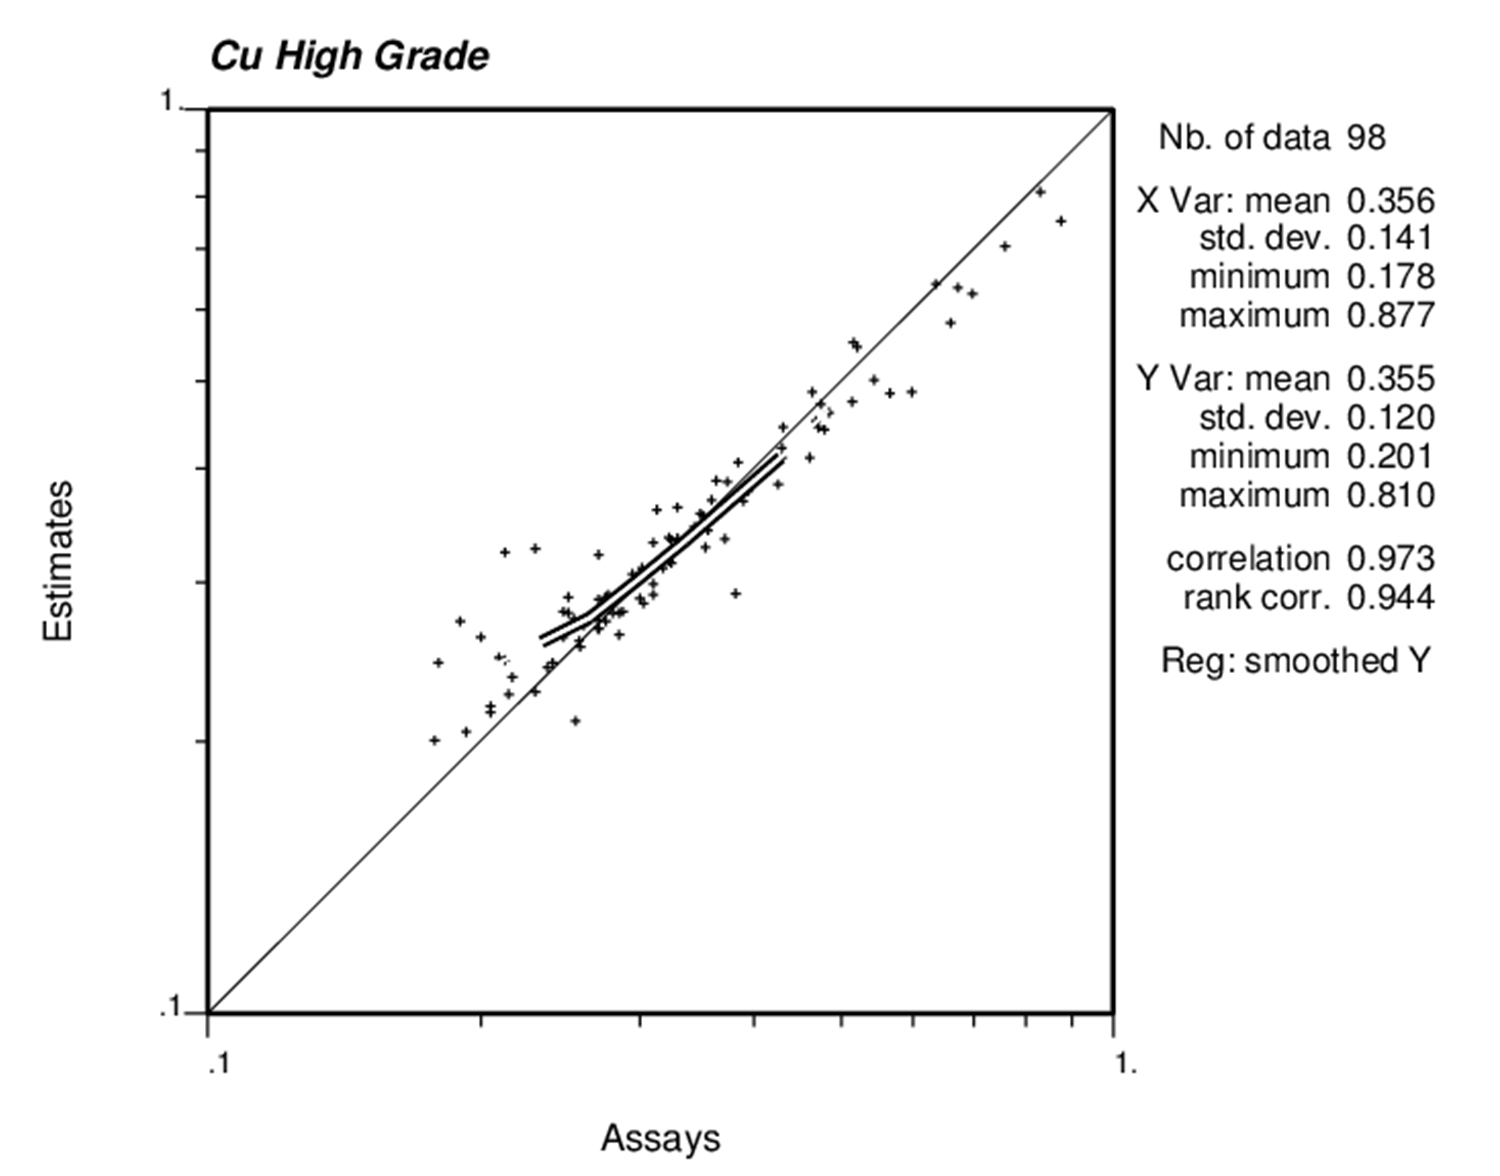
Source: SRK (2022)
Figure 14.10: Comparison of HGZ Copper Estimates With Assay Averages Within the Blocks
GA / CAEStarcore_ElCreston_ResourceUpdate_Report_CAPR002049_20221113_SRK.docxSeptember 2022
SRK Consulting
El Creston Moly Property NI 43-101 Resource UpdatePage 81

Source: SRK (2022)
Figure 14.11: Comparison of LGZ Copper Estimates With Assay Averages Within the Blocks
On average, the estimated blocks are extremely similar to the composite data, with high correlation (0.92 to 0.97) between the estimates and the composites.
Figure 14.12, Figure 14.13 and Figure 14.14 are swath plots highlighting average assay composite trends (blue) across the X, Y and Z directions, compared to the block model estimated values (red).

Source: SRK (2022)
Figure 14.12: Molybdenum Composites Compared to Block Estimates
GA / CAEStarcore_ElCreston_ResourceUpdate_Report_CAPR002049_20221113_SRK.docxSeptember 2022
SRK Consulting
El Creston Moly Property NI 43-101 Resource UpdatePage 82
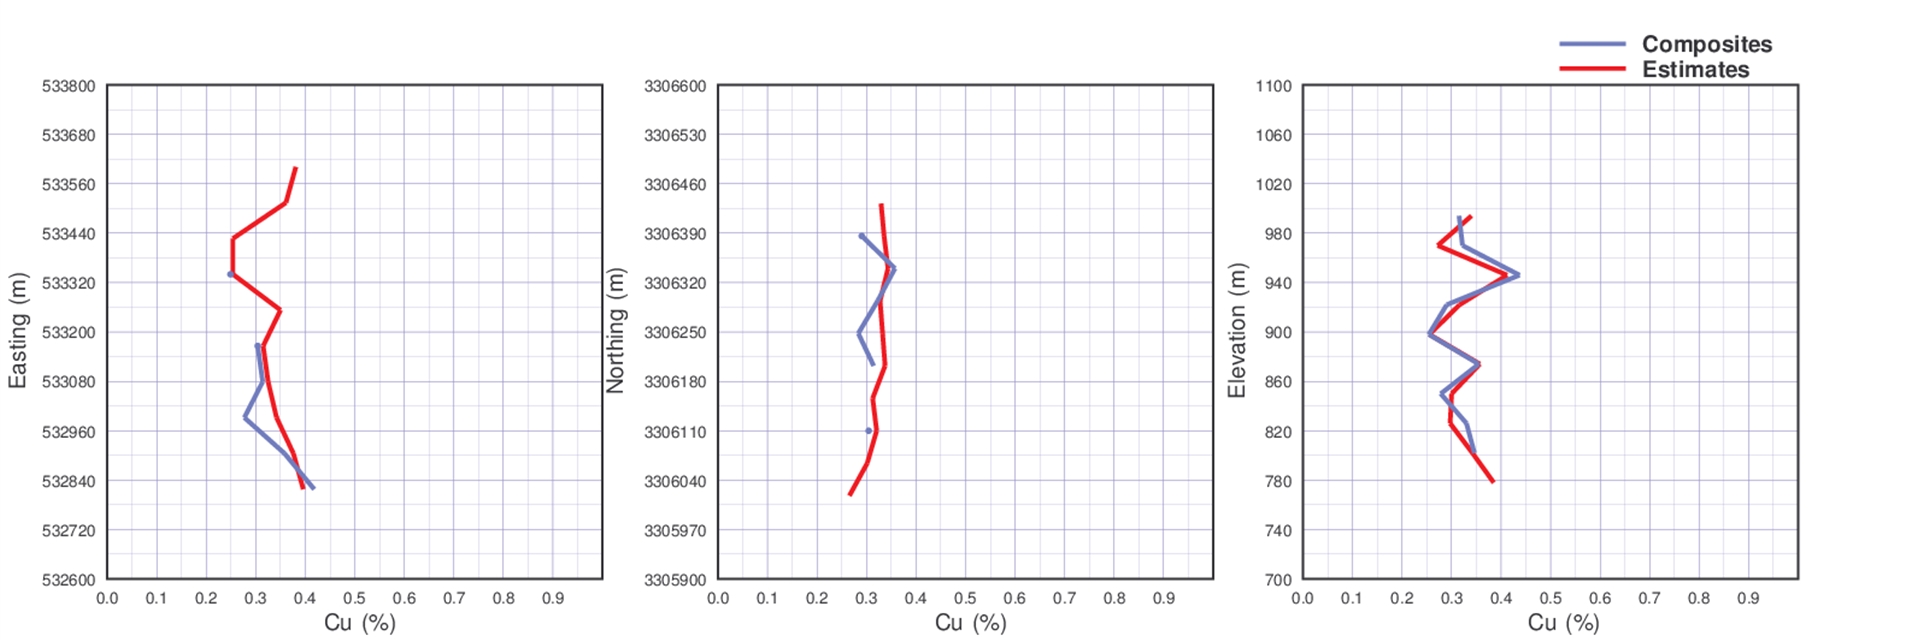
Source: SRK (2022)
Figure 14.13: HGZ Copper Composites Compared to Block Estimates
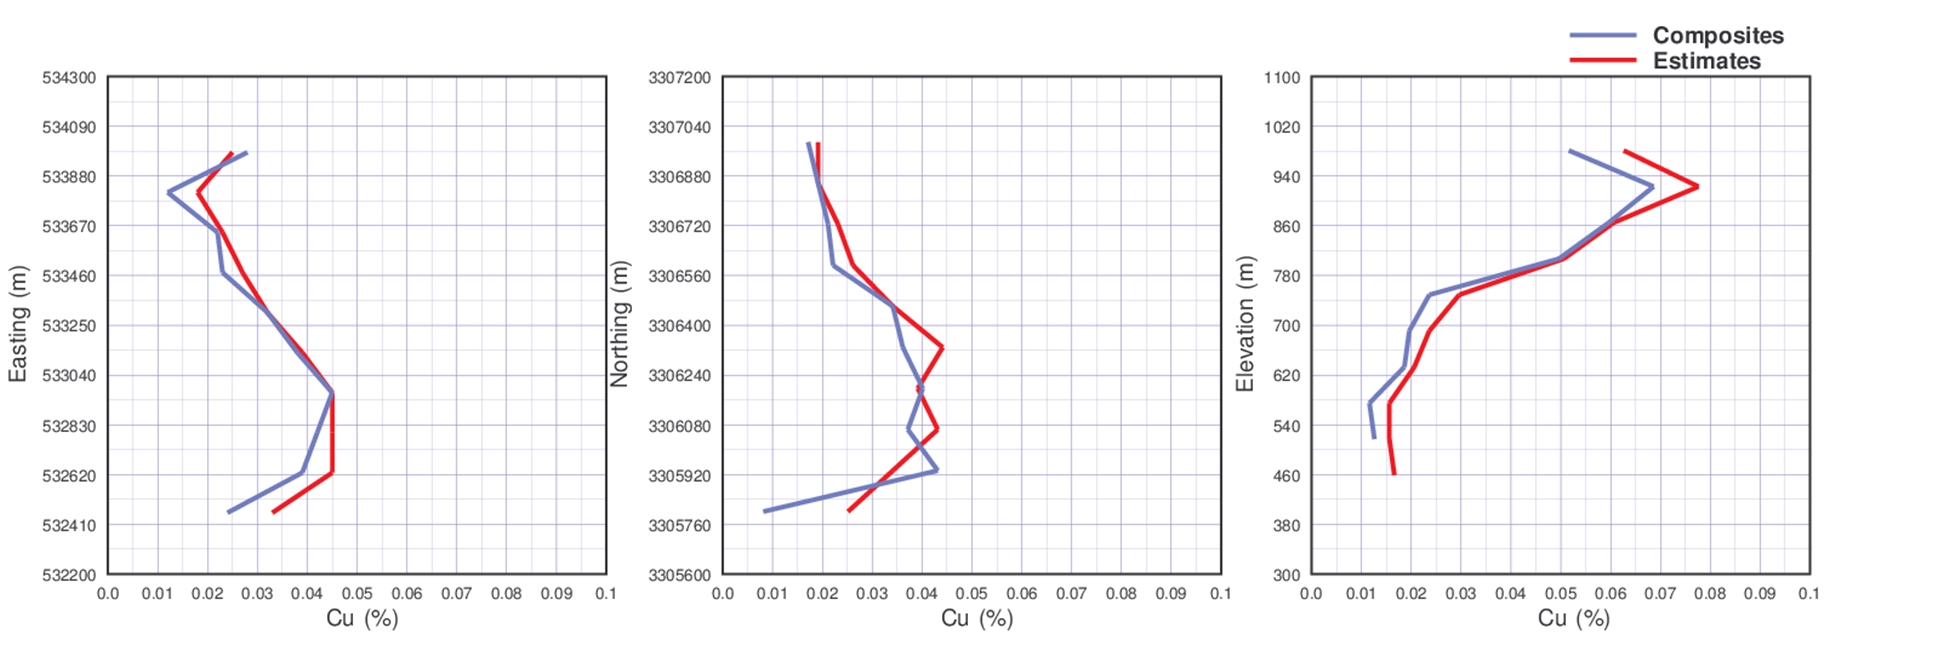
Source: SRK (2022)
Figure 14.14: LGZ Copper Composites Compared to Block Estimates
14.12 | Mineral Resource Classification |
Block model quantities and grade estimates for the El Creston Molybdenum Project were classified according to the CIM Definition Standards for Mineral Resources and Mineral Reserves (May 2014) by Dr. Gilles Arseneau, P. Geo. (APEGBC, 23474), an appropriate independent QP for the purpose of National Instrument 43-101.
Mineral resource classification is typically a subjective concept. Industry best practices suggest that resource classification should consider both the confidence in the geological continuity of the mineralized structures, the quality and quantity of exploration data supporting the estimates and the geostatistical confidence in the tonnage and grade estimates. Appropriate classification criteria should aim at integrating both concepts to delineate regular areas at similar resource classification.
GA / CAEStarcore_ElCreston_ResourceUpdate_Report_CAPR002049_20221113_SRK.docxSeptember 2022
SRK Consulting
El Creston Moly Property NI 43-101 Resource UpdatePage 83
Mineral resources are not mineral reserves and do not have demonstrated economic viability. The mineral resources may be affected by subsequent assessment of mining, environmental, processing, permitting, taxation, socio‑economic and other factors. There is insufficient information in this early stage of study to assess the extent to which the mineral resources will be affected by these factors that are more suitably assessed in a conceptual study.
To derive the classification for the El Creston Molybdenum deposit, the QP considered the following parameters:
| • | Data confidence, proportion of historic data and analytical QA/QC; |
| • | Data spacing (drillhole and assay); |
| • | Deposit geological model; |
| • | Metallurgical testing and analysis; and |
| • | Probability of grade exceeding cut-off. |
The QP is satisfied that the geological modelling honours the current geological information and knowledge. The location of the samples and the assay data are sufficiently reliable to support resource evaluation. The sampling information was acquired primarily by core drilling on sections spaced at 20 m.
The QP classified blocks as Measured if they were populated using more than eleven samples at an average distance of less than 80 m and where the probability of the grade exceeding cut-off was more than 90%. The grade probability was assigned by assigning all composites above cut-off an indicator of 1 and then estimating this indicator into the model using ID2 interpolant. This process assigns each estimated block a value between 0 and 1, representing the probability of the grade exceeding the cut-off. Blocks were considered Indicated if they were populated by more than eight samples at an average distance of less than 100 m. All other estimated blocks were classed as Inferred.
The results of the block-by-block classification, described above, were then re-interpreted for data continuity and spatial outliers. During this process, contiguous volumes of similarly classified material were grouped into the appropriate mineral resource classes.
The bulk of the deposit has been classified as Indicated with a core subset of the data meeting Measured classification. At the margin of the drillhole data, and to a lesser extent between the Main and Red Hill zones, material has been classified as Inferred.
14.13 | Mineral Resource Statement |
CIM Definition Standards for Mineral Resources and Mineral Reserves (May 2014) defines a mineral resource as:
“A Mineral Resource is a concentration or occurrence of solid material of economic interest in or on the Earth’s crust in such form, grade or quality and quantity that there are reasonable
GA / CAEStarcore_ElCreston_ResourceUpdate_Report_CAPR002049_20221113_SRK.docxSeptember 2022
SRK Consulting
El Creston Moly Property NI 43-101 Resource UpdatePage 84
prospects for eventual economic extraction. The location, quantity, grade or quality, continuity and other geological characteristics of a Mineral Resource are known, estimated or interpreted from specific geological evidence and knowledge, including sampling.”
The “material of economic interest” refers to diamonds, natural solid inorganic material, or natural solid fossilized organic material including base and precious metals, coal, and industrial minerals.
The “reasonable prospects for economic extraction” requirement generally implies that the quantity and grade estimates meet certain economic thresholds and that the mineral resources are reported at an appropriate cut-off grade taking into account extraction scenarios and processing recoveries. To meet this requirement, the QP considers that major portions of the El Creston Molybdenum Project are amenable for open pit extraction.
To determine the quantities of material offering “reasonable prospects for eventual economic extraction” by an open pit, the QP used a pit optimizer and reasonable mining assumptions to evaluate the proportions of the block model (Measured, Indicated and Inferred blocks) that could be “reasonably expected” to be mined from an open pit.
The optimization parameters were based on experience and benchmarking against similar projects (Table 14.7). Open pit mining and general and administration (“G&A”) costs were derived from copper open pit operations in northern Mexico and processing costs were derived from open pit molybdenum operations in southern United States. Metal prices were derived from Energy & Metal Consensus ForecastsTM (“EMCF”).
The reader is cautioned that the results from the pit optimization are used solely for the purpose of testing the “reasonable prospects for eventual economic extraction” by an open pit and do not represent an attempt to estimate mineral reserves. Mineral reserves can only be estimated from the results of an economic evaluation as part of a preliminary feasibility study or feasibility study. As such, no mineral reserves have been estimated as part of the present assignment. There is no certainty that all or any part of the mineral resources will be converted into a mineral reserve. The results are used as a guide to assist in the preparation of a mineral resource statement and to select an appropriate resource reporting cut-off grade.
Table 14.7: Assumptions Considered for Conceptual Open Pit Optimization.
| | |
Parameter | Value | Unit |
Molybdenum Price | 9.93 | US$ per lb |
Copper Price | 3.50 | US$ per lb |
Mining Cost | 2.00 | US$ per tonne mined |
Processing | 8.40 | US$ per tonne of feed |
Production rate | 50,000 | Tonnes per day |
General and Administrative | 0.92 | US$ per tonne of feed |
Overall Pit Slope | 45 | Degrees |
Molybdenum Recovery | 88 | Percent |
Copper Recovery | 84 | Percent |
GA / CAEStarcore_ElCreston_ResourceUpdate_Report_CAPR002049_20221113_SRK.docxSeptember 2022
SRK Consulting
El Creston Moly Property NI 43-101 Resource UpdatePage 85
| | |
In Situ Cut-off | 0.045 | Mo EQ% |
In Situ Cut-off | 11.00 | US$ |
The QP considers that the blocks located within the conceptual pit envelope show “reasonable prospects for eventual economic extraction” and can be reported as a mineral resource.
The mineral resource statement is presented in Table 14.8.
Table 14.8: Mineral Resource Statement at 0.045% Molybdenum Equivalent*, El Creston Molybdenum Project, Sonora Mexico, SRK Consulting, 30 September 2022
| | | | | | |
Category | Quantity | Grade | Metal |
Mo | Cu | Mo | Cu |
(Mt) | (%) | (%) | (Mlb) | (Mlb) |
Open Pit** |
Measured | 56.3 | 0.076 | 0.04 | 94.3 | 49.7 |
Indicated | 142.2 | 0.067 | 0.08 | 210.0 | 250.8 |
Measured Plus Indicated | 198.5 | 0.069 | 0.07 | 304.4 | 300.5 |
Inferred |
Notes:
| * | Mineral resources are reported in relation to a conceptual pit shell. Mineral resources are not mineral reserves and do not have demonstrated economic viability. All figures are rounded to reflect the relative accuracy of the estimate. All composites have been capped where appropriate. |
| ** | Open pit mineral resources are reported at a cut-off grade of 0.045% Mo EQ. Cut-off grades are based on a price of US$9.93 per lb of molybdenum and US$3.50 for copper recoveries of 88% for molybdenum and 84% for copper were applied. |
14.14 | Grade Sensitivity Analysis |
The mineral resources of the El Creston Project are sensitive to the selection of the reporting cut-off grade. To illustrate this sensitivity, quantities and grade estimated within the conceptual pit used to constrain the mineral resources are presented in Table 14.9 for the measured resource and Table 14.10 for the Indicated resource at different cut-off grades. There are no inferred mineral resources within the confining resource shell.
The reader is cautioned that the figures presented in this table should not be misconstrued with a mineral resource statement. The figures are only presented to show the sensitivity of the block model estimates to the selection of cut-off grade.
Figure 14.15
presents this sensitivity as grade tonnage curves for the combined Measured and Indicated mineral resources within the resource shell.
GA / CAEStarcore_ElCreston_ResourceUpdate_Report_CAPR002049_20221113_SRK.docxSeptember 2022
SRK Consulting
El Creston Moly Property NI 43-101 Resource UpdatePage 86
Table 14.9: Measured Quantities and Grade Estimates Within the Resource Shell*, El Creston Molybdenum Project at Various Cut-off Grades
| | | | | |
Cut-off Grade | Quantity | Grade | Mo Metal | Grade | Cu Metal |
Mo Eq (%) | (Mt) | Mo (%) | (Mlb) | Cu (%) | (Mlb) |
0.080 | 31 | 0.096 | 65 | 0.05 | 33 |
0.070 | 39 | 0.089 | 76 | 0.05 | 39 |
0.060 | 46 | 0.084 | 85 | 0.04 | 45 |
0.050 | 53 | 0.079 | 91 | 0.04 | 49 |
0.045 | 56 | 0.076 | 94 | 0.04 | 52 |
0.040 | 59 | 0.074 | 96 | 0.04 | 54 |
0.039 | 60 | 0.073 | 97 | 0.04 | 54 |
0.035 | 62 | 0.072 | 98 | 0.04 | 55 |
0.030 | 64 | 0.070 | 99 | 0.04 | 57 |
0.020 | 67 | 0.068 | 100 | 0.04 | 59 |
Note:
| * | The reader is cautioned that the figures in this table should not be misconstrued with a mineral resource statement. The figures are only presented to show the sensitivity of the block model estimates to the selection of cut-off grade. |
Table 14.10: Indicated Quantities and Grade Estimates Within the Resource Shell*, El Creston Molybdenum Project at Various Cut-off Grade
| | | | | |
Cut-off Grade | Quantity | Grade | Mo Metal | Grade | Cu Metal |
Mo Eq (%) | (Mt) | Mo (%) | (Mlb) | Cu (%) | (Mlb) |
0.080 | 81 | 0.081 | 145 | 0.11 | 188 |
0.070 | 98 | 0.077 | 166 | 0.10 | 209 |
0.060 | 116 | 0.073 | 186 | 0.09 | 228 |
0.050 | 134 | 0.069 | 203 | 0.08 | 243 |
0.045 | 142 | 0.067 | 210 | 0.08 | 249 |
0.040 | 149 | 0.065 | 215 | 0.08 | 254 |
0.039 | 151 | 0.065 | 216 | 0.08 | 255 |
0.035 | 156 | 0.064 | 219 | 0.08 | 258 |
0.030 | 161 | 0.063 | 222 | 0.07 | 260 |
0.020 | 168 | 0.061 | 225 | 0.07 | 264 |
Note:
| * | The reader is cautioned that the figures in this table should not be misconstrued with a mineral resource statement. The figures are only presented to show the sensitivity of the block model estimates to the selection of cut-off grade. |
GA / CAEStarcore_ElCreston_ResourceUpdate_Report_CAPR002049_20221113_SRK.docxSeptember 2022
SRK Consulting
El Creston Moly Property NI 43-101 Resource UpdatePage 87
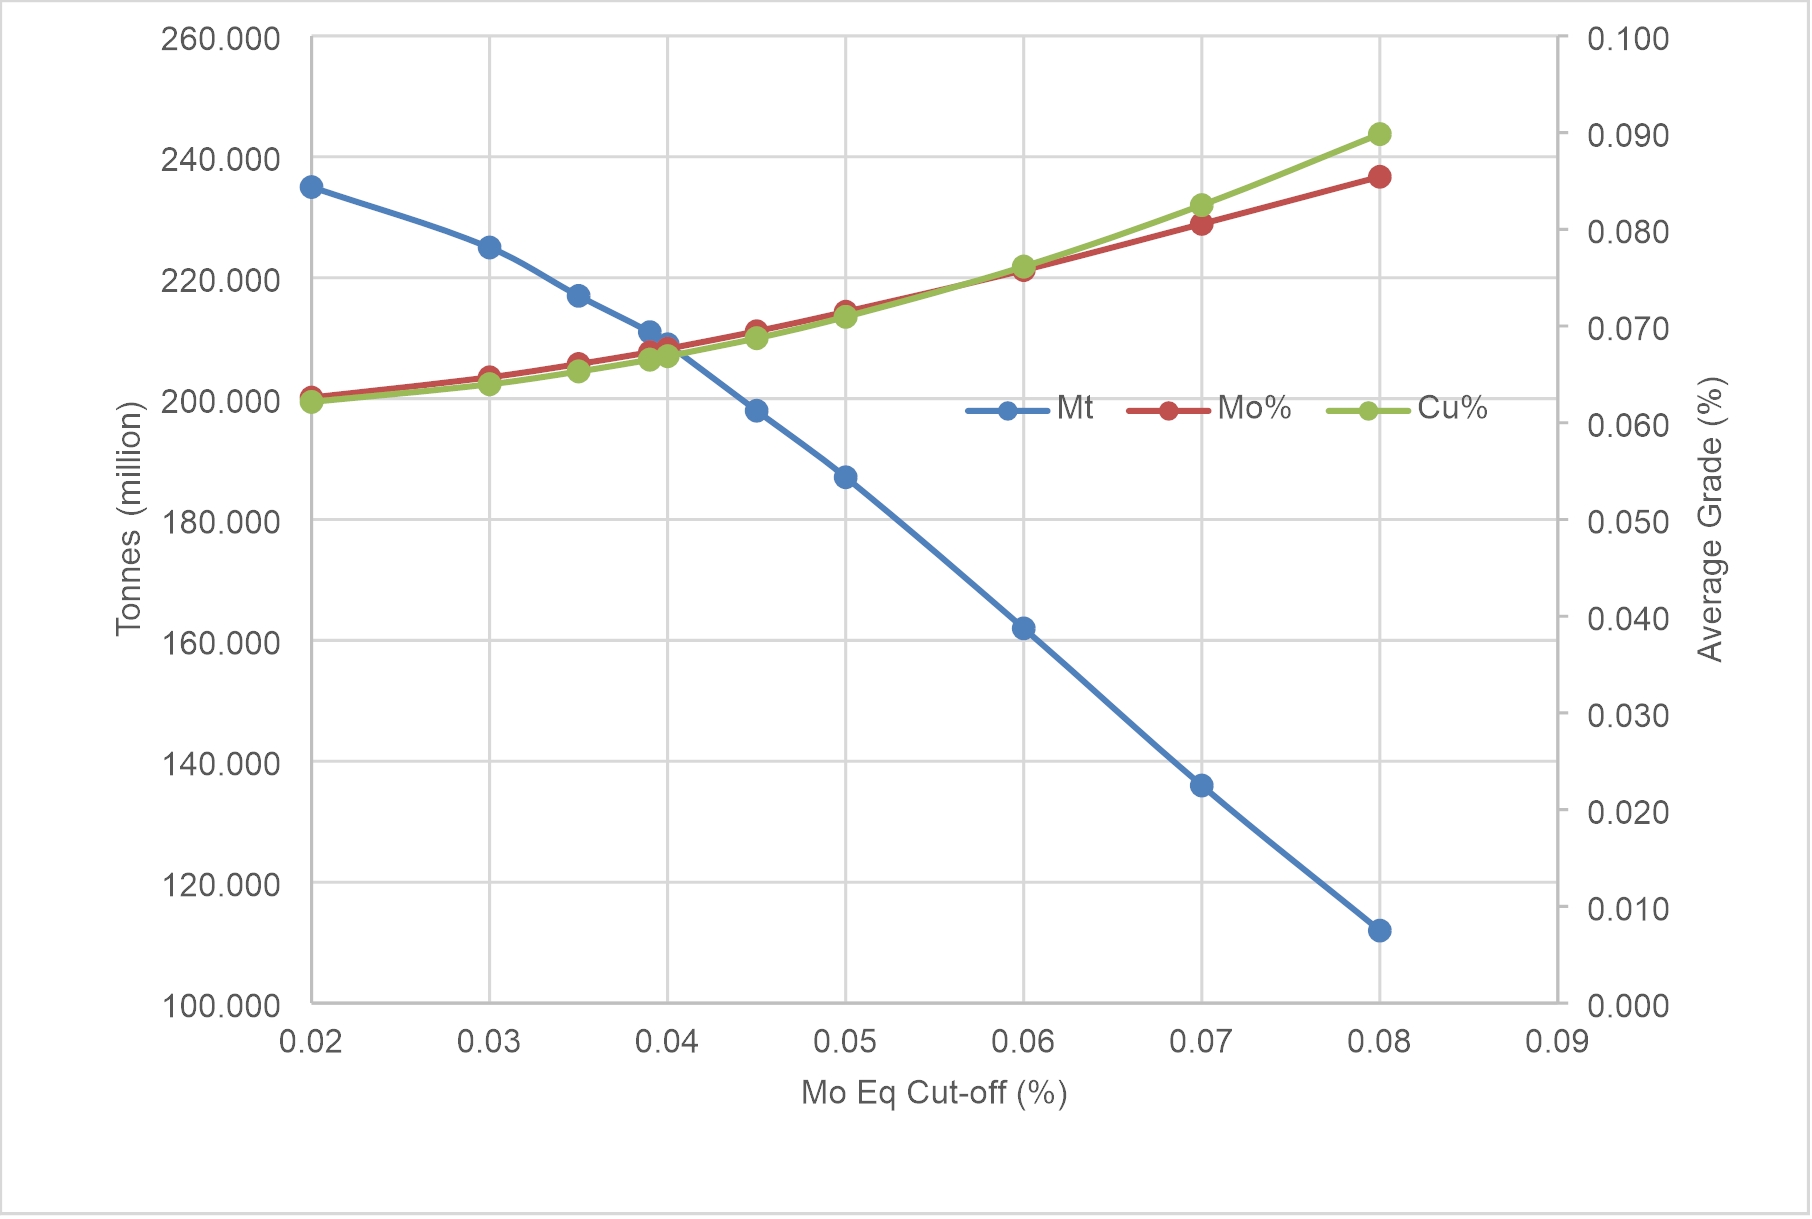
Source: SRK (2022)
Figure 14.15: Grade Tonnage Curves for the El Creston Molybdenum Project
14.15 | Previous Mineral Resource Estimates |
As a further validation of the mineral resource estimate, the QP compared the 2022 mineral resources estimated with the previous mineral resource estimate prepared in 2011. The 2011 mineral resource estimate was prepared by SRK using ordinary kriging and all data available in 2011. An additional 19 holes were added to the drillhole database for the 2022 estimate. The 2022 mineral resources used different parameters than what were used in 2011 to establish the reasonable prospect of eventual extraction which complicates the comparison between the two models (Table 14.11)
Table 14.11: Comparison of Economic Parameters used for the 2011 and 2022 Resource Estimates
| | |
Year of Estimate | 2011 | 2020 |
Mo Price (US$/lb) | 11.00 | 9.93 |
Cu Price (US$/lb) | 1.47 | 3.50 |
Mo Recovery (%) | 88.00 | 88.00 |
Cu Recovery (%) | 84.00 | 84.00 |
Mining Cost (US$/t) | $1.05 | $2.00 |
Process Cost (US$/t) | $6.23 | $8.40 |
G&A (US$/t) | $0.75 | $0.92 |
Total Costs (US$/t) | $8.03 | $11.32 |
Mo Eq Cut-off (%) | 0.035 | 0.045 |
GA / CAEStarcore_ElCreston_ResourceUpdate_Report_CAPR002049_20221113_SRK.docxSeptember 2022
SRK Consulting
El Creston Moly Property NI 43-101 Resource UpdatePage 88
As expected, the different economic parameters generated different optimized pit shells with the 2022 pit shell being slightly smaller (Figure 14.16).

Source: SRK (2022)
Note: Grid lines are 200 m apart
Figure 14.16: Comparison of 2011 and 2022 Resource Shells
Table 14.12 compares the 2011 and 2022 mineral resources at the 0.045 molybdenum equivalent grade cut-off. As can be seen the 2022 mineral resource reports less tonnage at slightly higher grade for a net reduction of contained metal reflecting the higher mining costs used in the 2022 estimation.
Table 14.12 : Comparison of 2022 and 2011 Mineral Resource Statements
| | | | | | |
Year | Class | Mt | Mo (%) | Mo (Mlb) | Cu (%) | Cu (Mlb) |
2022 | Measured | 56.3 | 0.076 | 94.3 | 0.04 | 49.6 |
2011 | Measured | 64.3 | 0.082 | 116.6 | 0.06 | 87.2 |
2022 | Indicated | 142.2 | 0.067 | 210.0 | 0.08 | 250.8 |
2011 | Indicated | 156.2 | 0.065 | 223.4 | 0.07 | 244.0 |
14.16 | Mineral Resource Risks and Opportunities |
The QP has noted a few risks associated with the mineral resource:
| • | The oxide component of the molybdenum mineralization has not been quantified for all assays. Where no oxide analyses were available, the total molybdenum values were assumed to represent molybdenum in sulphides and used for estimation directly. This creates a risk that molybdenite could have been over estimated, particularly along fault boundaries where oxidation would be expected. |
GA / CAEStarcore_ElCreston_ResourceUpdate_Report_CAPR002049_20221113_SRK.docxSeptember 2022
SRK Consulting
El Creston Moly Property NI 43-101 Resource UpdatePage 89
| • | Copper mineralization is not as well quantified as the molybdenum mineralization. Fewer copper assays have been completed from holes prior to 2007 which resulted in a less precise estimation of the copper in the model. |
| • | The Creston deposit is highly fractured and subject to poor core recovery in some locations. The loss of material during drilling creates a level of uncertainty in the assays which is then transferred to the mineral resource. |
| • | The Opodepe Ejido has blocked the access road to the property from Opodepe and is currently refusing all access to the El Creston main deposit area. While access to the property is available via an alternate route, work in the Main deposit area will not be possible until Starcore can negotiate a new agreement with the local Ejido. |
The QP believes that these risks are reasonable and don’t represent a significant risk to the mineral resources presented in this report. The QP believes that the mineral resource estimate presented herein accurately represents the current understanding of the El Creston deposit.
Mineralization at El Creston has been restricted to below the oxide surface and above the Creston fault. However, mineralization exists above the oxidation surface as molybdenum oxide. With additional metallurgical testing, some of the oxide could possibly be extracted and the possibility that some sulphide mineralization is present in the oxide zone is also good. This additional mineralization is not included in the current mineral resource statement.
Mineralization exists below the Creston fault from 3,305,750 north and 3,306,000 north between 532,750 east and 533,250 east. Limited drilling completed in the area, referred to as Red Hill Deep has returned encouraging results, including a 207.75 m intercept averaging 0.091% Mo with 0.06% Cu (Hole EC08-54) and 88 m averaging 0.076% Mo and 0.050% Cu. This area offers the potential to expand the mineralization if additional drillholes were targeted below the Creston fault.
In addition, surface sampling and mapping has identified additional zones of molybdenum and/or copper mineralization within the same trend of alteration that hosts the Creston Main and Red Hill deposits that have not been drilled.
GA / CAEStarcore_ElCreston_ResourceUpdate_Report_CAPR002049_20221113_SRK.docxSeptember 2022
SRK Consulting
El Creston Moly Property NI 43-101 Resource UpdatePage 90
There are no significant mineral projects immediately adjacent to the El Creston Project.
GA / CAEStarcore_ElCreston_ResourceUpdate_Report_CAPR002049_20221113_SRK.docxSeptember 2022
SRK Consulting
El Creston Moly Property NI 43-101 Resource UpdatePage 91
16 | Other Relevant Data and Information |
There is no other relevant data available about the El Creston Project.
GA / CAEStarcore_ElCreston_ResourceUpdate_Report_CAPR002049_20221113_SRK.docxSeptember 2022
SRK Consulting
El Creston Moly Property NI 43-101 Resource UpdatePage 92
17 | Interpretation and Conclusions |
The El Creston Molybdenum Project is an advanced staged exploration property located in Sonora State, Mexico. The molybdenum and copper mineralization has been estimated by the QP with all the drilling data available as of 30 September 2022.
The molybdenite mineralization occurs as finely disseminated subhedral crystals 0.1 mm to 0.8 mm across, embedded in a pervasive, fine-grained quartz-sericite matrix, and also as coarsely crystalline molybdenite along the margins of quartz veins.
The QP believes that the widely spaced drill sampling is suitably adequate to represent the disseminated and veinlet molybdenum mineralization but may not accurately represent these infrequent molybdenum veins with extremely high grades. To address this possible issue, the QP capped the molybdenum sample grades to limit the influence of the highest assays on block estimates.
While some molybdenum grades do occur below the Creston fault, the grade estimates were limited to the zone between the oxide boundary and the Creston fault.
The QP noted that the copper grades are not closely related to the molybdenum grades. The higher copper grades are dominantly associated with a 10 m to 100 m thick zone immediately under the oxide zone and offset to the south from the main molybdenum zone.
The El Creston mineral resources were estimated from 181 core holes and three RC drillholes by ordinary kriging. Mineral resources were classified according to the CIM Definition Standards for Mineral Resources and Mineral Reserves (May 2014) into Measured, Indicated and Inferred mineral resources.
To determine the quantities of material offering “reasonable prospects for eventual economic extraction” by an open pit, the QP used a pit optimizer and reasonable mining assumptions to evaluate the proportions of the block model that could be “reasonably expected” to be mined from an open pit.
The QP considers that the blocks located within the conceptual pit envelope show “reasonable prospects for eventual economic extraction” and can be reported as a mineral resource. Based on the drill data available, the QP estimated that the El Creston deposit contained 56.3 Mt grading 0.076% Mo and 0.04% Cu in the Measured category and 142.2 Mt grading 0.069% Mo and 0.07% Cu classified as Indicated mineral resources. There are no blocks classified as Inferred mineral resource within the Whittle optimized pit shell (Table 17.1).
GA / CAEStarcore_ElCreston_ResourceUpdate_Report_CAPR002049_20221113_SRK.docxSeptember 2022
SRK Consulting
El Creston Moly Property NI 43-101 Resource UpdatePage 93
Table 17.1: Mineral Resource Statement at 0.045% Molybdenum Equivalent*, El Creston Molybdenum Project, Sonora Mexico, SRK Consulting, 04 September 2022
| | | | | | | | | | |
Category | Quantity | Grade | Metal |
Mo | Cu | Mo | Cu |
(Mt) | (%) | (%) | (Mlb) | (Mlb) |
Open Pit** |
Measured | 56.3 | 0.076 | 0.04 | 94.3 | 49.7 |
Indicated | 142.2 | 0.067 | 0.08 | 210.0 | 250.8 |
Measured Plus Indicated | 198.5 | 0.069 | 0.07 | 304.4 | 300.5 |
Inferred | | | | | |
Notes:
| * | Mineral resources are reported in relation to a conceptual pit shell. Mineral resources are not mineral reserves and do not have demonstrated economic viability. All figures are rounded to reflect the relative accuracy of the estimate. All composites have been capped where appropriate. |
| ** | Open pit mineral resources are reported at a cut-off grade of 0.045% Mo EQ. Cut-off grades are based on a price of US$9.93 per lb of molybdenum and US$3.50 for copper recoveries of 88% for molybdenum and 84% for copper were applied. |
GA / CAEStarcore_ElCreston_ResourceUpdate_Report_CAPR002049_20221113_SRK.docxSeptember 2022
SRK Consulting
El Creston Moly Property NI 43-101 Resource UpdatePage 94
The QP Recommends that Starcore continues to explore the El Creston Project. Specifically, a US$500,000 exploration program is recommended for the El Creston Project. The program is to include geological and magnetometry surveys and to explore the area west of the main deposit where surface access is not being challenged (Table 18.1).
Table 18.1: Estimated Cost for the Exploration Program Proposed for the El Creston Project
| |
Description | Total Cost (US$) |
Geological Studies | $25,000 |
Ground Magnetic Survey | $250,000 |
Ground Geophysical Follow Up | $50,000 |
Technical Report | $100,000 |
Geochemical Studies | $25,000 |
Project Supervision | $50,000 |
Total | $500,000 |
Other than the current issue with surface access to the main part of the Creston deposit, the QP is unaware of any other significant factors and risks that may affect access, title, or the right or ability to perform the exploration work recommended for the El Creston Project.
GA / CAEStarcore_ElCreston_ResourceUpdate_Report_CAPR002049_20221113_SRK.docxSeptember 2022
SRK Consulting
El Creston Moly Property NI 43-101 Resource UpdatePage 95
Creston Mining Corporation, 2006. The Creston open-pit molybdenum deposit, Opodepe, Sonora, Mexico: Presentation, 25 p.
Creston Moly Corporation, 2008. Infill drilling continues to encounter significant molybdenum mineralization at El Creston deposit, Mexico: News release: http://www.sedar.com
Davis, J., 1974. Creston drillcore samples; report of petrographic investigation: Internal memorandum of AMAX Exploration, Inc., 6 p.
Georgia Ventures Inc., 2007. Drill filing statement in respect of the acquisition of Creston Mining Corporation, 59 p. plus appendices.
JDS Energy & Mining Inc., 2010. Preliminary Economic Assessment, El Creston Project, Opodepe, Sonora, Mexico: Technical report prepared for Creston Moly Corporation, 224 p.
Krueger, H.W., 1978. Correspondence with AMAX Exploration, Inc. regarding K-Ar age determinations, 3 p.
Leon, F.L. 1978. Phase II exploration program (October 1976 – January 1978), Creston project, Minera Opodepe, S.R.L. de C.V., Sonora, Mexico: Internal report of AMAX Exploration Inc., 38 p.
Leon, F.L. & Miller, C.P., 1981. Geology of the Creston molybdenum-copper deposit, in Ortlieb, L., and Roldán-Quintana, J., eds., Geology of northwestern Mexico and southern Arizona: Geological Society of America Cordilleran Section Meeting, Field Trip 7, p. 223–238.
Lodder, W., Hursh, J.C., Leon-Lopez, F.L. & Miller, C.P., 1975. Summary progress report 1974-1975, Creston Project (147), Sonora, Mexico, Minera Opodepe, S. de R. L. de C. V.: Internal report of AMAX Exploration, Inc., 41 p.
Ludington, S., Hammarstrom, J. & Piatak, N., 2009. Low-Fluorine stockwork molybdenite deposits: USGS Open File Report 2009-1211. 12 p.
METCON Research, 2008. Creston moly project – Process flowsheet development, October 2008.
Mine Development Associates (MDA), 2008. Technical Report Creston Molybdenum Project Sonora, Mexico: Technical report prepared by Mining Development Associates for Creston Moly Corporation, 141 p.
Nuttycombe, N.R., 1977. Creston mapping and thoughts on the Creston breccias: Internal memorandum of AMAX Exploration, Inc., 3 p. (incomplete).
GA / CAEStarcore_ElCreston_ResourceUpdate_Report_CAPR002049_20221113_SRK.docxSeptember 2022
SRK Consulting
El Creston Moly Property NI 43-101 Resource UpdatePage 96
P&E Mining Consultants Inc., 2007. Evaluation report on the Creston molybdenum deposit, Sonora State, Mexico, Latitude 29°54’46”N, Longitude 110°39’28”W: Technical report prepared for Georgia Ventures Inc., 71 p. plus appendices.
P&E Mining Consultants Inc., 2008. Evaluation report on the Creston molybdenum deposit, Sonora State, Mexico, Latitude 29°54’46”N, Longitude 110°39’28”W: Technical report prepared for Georgia Ventures Inc., 71 p. plus appendices.
Rossetti, P., 2007. Petrographic report on the Crestón molybdenum deposit (Sonora State, Mexico): Unpublished report, 26 p.
Sheridan, M.J. & Parker, P.D., 1960. Progress report, Creston project, June 8-24, 1960: Internal memorandum of American Metal Climax, Inc., 2 p.
Silberman, M. L., Giles, D.A. & Graubard, C., 1988. Characteristics of gold deposits in northern Sonora, Mexico; A preliminary report: Economic Geology, v. 83, p. 1966-1974.
SRK, 2011. El Creston Moly Property, Sonora, Mexico NI43-101 Resource Update: Technical report prepared by SRK Consulting (Canada) Inc. for Creston Moly Corporation, 131 p.
wikipedia.org/wiki/Basin_and_Range_Province
GA / CAEStarcore_ElCreston_ResourceUpdate_Report_CAPR002049_20221113_SRK.docxSeptember 2022
SRK Consulting
El Creston Moly Property NI 43-101 Resource UpdatePage 97
20 | Date and Signature Page |
This technical report was written by the following “Qualified Persons” and contributing authors. The effective date of this technical report is 30 September 2022.
| | |
Qualified Person | Signature | Date |
Dr. Gilles Arseneau, P. Geo. | “Original Signed” | 30 September 2022 |
Reviewed by:
Chris Elliott, FAusIMM
Project Reviewer
All data used as source material plus the text, tables, figures, and attachments of this document have been reviewed and prepared in accordance with generally accepted professional engineering and environmental practices.
GA / CAEStarcore_ElCreston_ResourceUpdate_Report_CAPR002049_20221113_SRK.docxSeptember 2022
CERTIFICATE Of Qualified person
To Accompany the report entitled: Independent Technical Report for the El Creston Molybdenum Project, Sonora, Mexico dated 30 September 2022.
I, Dr. Gilles Arseneau, residing in North Vancouver, B.C. do herby certify that:
| | |
1) | I am an Associate Consultant with the firm of SRK Consulting (Canada) Inc. (“SRK”) with an office at Suite #2200-1066 West Hastings Street, Vancouver, B.C., Canada, V6E 3X2; |
2) | I am a graduate of the University of New Brunswick with a B.Sc. (Geology) degree obtained in 1979, the University of Western Ontario with an M.Sc. (Geology) degree obtained in 1984, and the Colorado School of Mines with a Ph.D. (Geology) obtained in 1995. I have worked on several porphyry copper and molybdenum deposits similar to the deposits found at the El Creston Project; |
3) | I am a Professional Geoscientist registered as a member, in good standing, with the Association of Professional Engineers & Geoscientists of British Columbia (No. 23474); |
4) | I have personally inspected the subject Project on 13 to 15 September 2022 and on 03 to 06 August 2010; |
5) | I have read the definition of “Qualified Person” set out in National Instrument 43-101 and certify that by virtue of my education, affiliation to a professional association and past relevant work experience, I fulfill the requirements to be a “Qualified Person” for the purposes of National Instrument 43-101 and this technical report has been prepared in compliance with National Instrument 43-101 and Form 43-101F1; |
6) | I, as a Qualified Person, I am independent of the issuer as defined in Section 1.5 of National Instrument 43-101; |
7) | I am the author of this report and responsible for all sections and accept professional responsibility for all sections of this technical report; |
8) | I have had prior involvement with the subject property, I am co-author of a technical report for the subject property dated 16 December 2010; |
9) | I have read National Instrument 43-101 and confirm that this technical report has been prepared in compliance therewith; |
10) | I have not received, nor do I expect to receive, any interest, directly or indirectly, in the El Creston Project or securities of Starcore International Mines Ltd.; and |
11) | That, at the effective date of the technical report, to the best of my knowledge, information and belief, this technical report contains all scientific and technical information that is required to be disclosed to make the technical report not misleading. |
Vancouver, B.C. 30 September 2022 | “Original Signed” _________________________ Dr. Gilles Arseneau, P. Geo. Associate Consultant |
| |

| SRK Consulting (Canada) Inc. Suite 2200 - 1066 West Hastings Street Vancouver, BC V6E 3X2 T: +1.604.681.4196 F: +1.604.687.5532 vancouver@srk.com www.srk.com |
Project number: CAPR002049
Vancouver, B.C.
30 September 2022
To:
Securities Regulatory Authorities
B. C. Securities Commission (BCSC)
Alberta Securities Commission (ABC)
Ontario Securities Commission (OSC)
Toronto Stock Exchange (TSX)
CONSENT of AUTHOR
I, Dr. Gilles Arseneau, P. Geo., do hereby consent to the public filing of the technical report entitled “Independent Technical Report for the El Creston Molybdenum Project, Sonora, Mexico,” (the “Technical Report”) and dated 30 September 2022 and any extracts from or a summary of the Technical Report under the National Instrument 43-101 disclosure of Starcore International Mines Ltd. and to the filing of the Technical Report with any securities regulatory authorities.
I further consent to the company filing the report on SEDAR.
Dated this 30th day of September 2022.
“Original Signed”
________________________
Dr. Gilles Arseneau, P. Geo.
Associate Consultant
| | |
| Local Offices: Saskatoon Sudbury Toronto Vancouver Yellowknife | Group Offices: Africa Asia Australia Europe North America South America |