
MANAGEMENT DISCUSSION & ANALYSIS
For the period ended January 31, 2023
Directors and Officers as at March 15, 2023:
Directors:
|
Pierre Alarie Gary Arca |
Robert Eadie |
Jordan Estra Salvador Garcia |
Tanya Lutzke |
Federico Villaseñor |
Officers:
|
Executive Chairman and Chief Executive Officer– Robert Eadie President – Pierre Alarie Chief Operating Officer - Salvador Garcia |
Chief Financial Officer – Gary Arca |
Corporate Secretary – Cory Kent |
|
Contact Name:Gary Arca
Contact e-mail address:garca@starcore.com
TSX Symbol:SAM
Suite 750 – 580 Hornby Street, Box 113, Vancouver, British Columbia, Canada V6C 3B6
Telephone: (604) 602-4935 Fax: (604) 602-4936 e-mail. info@starcore.com website: www.starcore.com
Starcore International Mines Ltd.
MD&A
January 31, 2023
Page 2
Form 51-102-F1
STARCORE INTERNATIONAL MINES LTD.
MANAGEMENT DISCUSSION & ANALYSIS
For the period ended January 31, 2023
This MD&A is prepared as of March 15, 2023.
This Management Discussion and Analysis (“MD&A”) should be read in conjunction with the unaudited consolidated financial statements of Starcore International Mines Ltd. (“Starcore”, or the “Company”) for the period ended January 31, 2023.
Monetary amounts throughout this MD&A are shown in thousands of Canadian dollars, unless otherwise stated.
This MD&A includes certain statements that may be deemed “forward-looking statements”. Such statements and information include without limitation: statements regarding timing and amounts of capital expenditures and other assumptions; estimates of future reserves, resources, mineral production and sales; estimates of mine life; estimates of future mining costs, cash costs, mine site costs; estimates of future capital expenditures and other cash needs, and expectations as to the funding thereof; statements and information as to the projected development of certain ore deposits, including estimates of exploration, development and production and other capital costs, and estimates of the timing of such exploration, development and production or decisions with respect to such exploration, development and production; estimates of reserves and resources, and statements and information regarding anticipated future exploration; the anticipated timing of events with respect to the Company’s minesite and; statements and information regarding the sufficiency of the Company’s cash resources. Such statements and information reflect the Company’s views as at the date of this document and are subject to certain risks, uncertainties and assumptions, and undue reliance should not be placed on such statements and information. Many factors, known and unknown could cause the actual results to be materially different from those expressed or implied by such forward looking statements and information. Such risks include, but are not limited to: the volatility of prices of gold and other metals; uncertainty of mineral reserves, mineral resources, mineral grades and mineral recovery estimates; uncertainty of future production, capital expenditures, and other costs; currency fluctuations; financing of additional capital requirements; cost of exploration and development programs; mining risks, risks associated with foreign operations; risks related to title issues; governmental and environmental regulation; and the volatility of the Company’s stock price. Investors are cautioned that any such statements are not guarantees of future performance and that actual results or developments may differ materially from those projected in the forward-looking statements.
Starcore International Mines Ltd.
MD&A
January 31, 2023
Page 3
Description of Business
Starcore is engaged in exploring, extracting and processing gold and silver through its wholly-owned subsidiary, Compañia Minera Peña de Bernal, S.A. de C.V. (“Bernal”), which owns the San Martin mine in Queretaro, Mexico. The Company is a public reporting issuer on the Toronto Stock Exchange (“TSX”). The Company is also engaged in acquiring mining related operating assets and exploration assets in North America directly and through corporate acquisitions. The Company has interests in properties which are exclusively located in Mexico and Canada.
Financial Highlights for the period ended January 31, 2023:
| • | Cash and short-term investments on hand is $7.1 million at January 31, 2023 compared to $8.8 million at April 30, 2022; |
| • | Gold and silver sales of $6.2 million for the three months ended January 31, 2023 compared to $5.4 million for the three months ended January 31, 2022; |
| • | Loss from mining operations of $0.6 million for the three months ended January 31, 2023 compared to earnings of $0.4 million for the three months ended January 31, 2022; |
| • | Loss of $1.9 million for the three months ended January 31, 2023 compared to a loss of $0.4 million for the three months ended January 31, 2022; |
| • | Equivalent gold production of 2,182 ounces in the three months ended January 31, 2023 compared to production of 2,588 ounces in the three months ended January 31, 2022; |
| • | Mine operating cash cost is US$1,793/EqOz for the three months ended January 31, 2023 compared to cost of US$1,328/EqOz for the three months ended January 31, 2022; |
| • | All-in sustaining costs of US$1,866/EqOz for the nine months ended January 31, 2023, compared to costs of US$1,623/EqOz for the nine months ended January 31, 2022; |
| • | EBITDA(1) of $(1,443) for the nine months ended January 31, 2023, compared to $3,235 for the nine months ended January 31, 2022. |
| | |
Reconciliation of Net Income to EBITDA(1) | | |
For the period ended January 31, | 2023 | 2022 |
Net income (loss) | $(4,294) | $226 |
Loss on sale of exploration property | - | 40 |
Unrealized loss on investment | 164 | 246 |
Income tax expense (recovery) | (242) | 208 |
Depreciation and depletion | 2,929 | 2,515 |
EBITDA | $(1,443) | $3,235 |
EBITDA MARGIN(2) | (8.1%) | 17.8% |
(1) EBITDA (“Earnings before Interest, Taxes, Depreciation and Amortization”) is a non-GAAP financial performance measure with no standard definition under IFRS. It is therefore possible that this measure could not be comparable with a similar measure of another Corporation. The Corporation uses this non-GAAP measure which can also be helpful to investors as it provides a result which can be compared with the Corporation market share price.
(2) EBITDA MARGIN is a measurement of a company’s operating profitability calculated as EBITDA divided by total revenue. EBITDA MARGIN is a non-GAAP financial performance measure with no standard definition under IFRS. It is therefore possible that this measure could not be comparable with a similar measure of another Corporation. The Corporation uses this non-GAAP measure which can also be helpful to investors as it provides a result which can be compared with the Corporation market share price.
Starcore International Mines Ltd.
MD&A
January 31, 2023
Page 4
3. | Selected Annual Information |
The highlights of financial data for the Company for the three most recently completed financial years are as follows:
| | | |
Twelve Months Ended | April 30, 2022 | April 30, 2021 | April 30, 2020 |
Revenues | $25,679 | $26,799 | $24,820 |
Cost of Sales | (20,373) | (20,397) | (22,836) |
Earnings from mining operations | 5,306 | 6,402 | 1,984 |
Administrative Expenses | (3,878) | (3,843) | (4,396) |
Loss on Toiyabe | (40) | (1,116) | - |
Loss on investment | (287) | - | - |
Royalty sale | 1,600 | - | - |
Write off Altiplano | - | - | (39) |
Income tax (expense)/ recovery | (296) | 1,449 | (1,178) |
Total income/ (loss) | | | |
(i) Total income/ (loss) | $2,405 | $2,892 | $(3,629) |
(ii) Income/ (loss) per share – basic | $0.05 | $0.06 | $(0.07) |
(iii) Income/ (loss) per share – diluted | $0.05 | $0.06 | $(0.07) |
Total assets | $52,041 | $46,471 | $54,413 |
Total long-term liabilities | $8,225 | $7,531 | $10,855 |
Discussion of Acquisitions, Operations and Financial Condition
The following should be read in conjunction with the consolidated financial statements of the Company and notes attached thereto for the period ended January 31, 2023.
4.1San Martín Mine, Queretaro, Mexico
The San Martin Mine, located approximately 50 km east of the City of Queretaro, State of Queretaro, Mexico, consists of mining concessions covering 13,077 hectares and includes seven underground mining units and four units under exploration. Luismin (now “Goldcorp Mexico”) operated the mine from 1993 to January, 2007, when it was purchased by the Company. The Company expects to continue to operate the mine based on the current expected conversion of known resources, and exploration is able to maintain proven and probable reserves replacing those mined with new reserves, such that the total resource remains relatively constant from year to year.
Starcore has staked additional claims near its principal producing gold property, the San Martin gold mine, in Querétaro, Mexico. The geology department has completed a staking initiative that includes new claims to the west of the current mineral rights of the San Martin mine on private property, that holds exploration and development upside.
Reserves
The Company completed a Resource estimate “RESERVES AND RESOURCES IN THE SAN MARTIN MINE, MEXICO AS OF APRIL 30, 2022”, as filed on August 29, 2022, prepared by Erme Enriquez. (the “Technical Report”), which is also available on the Company website www.starcore.com. All assumptions are listed at the bottom of the reserve and resource table below.
Starcore International Mines Ltd.
MD&A
January 31, 2023
Page 5
Starcore International Mines, San Martin Mine Mineral Reserves and Resources As of April 30, 2022:
| | | | | | |
Category | Tonnes | Grade | Total Contained oz |
(g Au/t) | (g Ag/t) | (oz Au) | (oz Ag) | (Au Eq oz) |
Total Proven & Probable | 1,348,433 | 1.74 | 13 | 75,353 | 573,257 | 82,560 |
Total Inferred + Indicated | 1,481,770 | 1.78 | 14 | 84,999 | 643,744 | 93,092 |
Total Ounces Contained | 2,830,203 | 1.76 | 13 | 160,352 | 1,217,001 | 175,652 |
1. Reserve and Resource cut-off grades are based on a 1.41 g/t gold equivalent.
2. Metallurgical Recoveries of 86% gold and 55% silver.
3. Minimum mining widths of 2.0 meters.
4. Dilution factor of 20%.
5. Gold equivalents based on a 1:79.5 gold:silver ratio.
6. Price assumptions of $1750 per ounce for gold and $22 per ounce for silver.
Erme Enriquez C.P.G., BSc., MSc., is an independent consultant to the Company. He is a qualified person on the project as required under NI 43-101 and has prepared this technical information.
Production
The following table is a summary of mine production statistics for the San Martin mine for the three and nine months ended January 31, 2023 and for the previous year ended April 30, 2022:
| | | | |
(Unaudited) | Unit of measure | Actual results | Actual results | Actual results |
3 months ended | 9 months ended | 12 months ended |
31-Jan-23 | 31-Jan-23 | 30-Apr-22 |
Mine production of gold in dore | thousand ounces | 2.1 | 7.1 | 10.0 |
Mine production of silver in dore | thousand ounces | 8.1 | 38.1 | 85.4 |
Total mine production – equivalent ounces | thousand ounces | 2.2 | 7.6 | 11.2 |
| | | | |
Silver to Gold equivalency ratio | | 80.1 | 85.4 | 75.0 |
| | | | |
Mine Gold grade | grams/tonne | 1.30 | 1.48 | 1.58 |
Mine Silver grade | grams/tonne | 8.8 | 14.2 | 23.0 |
Mine Gold recovery | percent | 85.2% | 87.4% | 88.2% |
Mine Silver recovery | percent | 48.9% | 48.7% | 51.4% |
| | | | |
Milled | thousands of tonnes | 58.6 | 171.0 | 224.4 |
Mine development, preparation and exploration | meters | 1,757 | 5,625 | 7,474 |
| | | | |
Mine operating cash cost per tonne milled | US dollars/tonne | 67 | 67 | 62 |
Mine operating cash cost per equivalent ounce | US dollars/ounces | 1,793 | 1,511 | 1,239 |
| | | | |
Number of employees/contractors at minesite | | 248 | 248 | 253 |
During the quarter ended January 31, 2023, the mill operated at a rate of approximately 637 (January 31, 2022: 616) milled tonnes/day. Gold and silver grades during the quarter ending January 31, 2023 were 1.30 g/t and 8.8 g/t, respectively, compared to the prior year quarter ended January 31, 2022 comparable grades of 1.46 g/t and 21.1 g/t, respectively. Overall equivalent gold production from the mine during the period ending January 31, 2023 of 2,182 equivalent ounces was lower than the prior period’s production of 2,588 due to much lower ore grades and gold recovery processed during the current period. Overall development meters have decreased in the current period, to 1,757 meters, compared to 1,861 meters in the
Starcore International Mines Ltd.
MD&A
January 31, 2023
Page 6
prior period ended January 31, 2022. The development has been consistent with the current calendar period production tonnage budgeted.
Production cash costs of the mine for the period ended January 31, 2023 were higher at US$1,793/EqOz compared to US$1,328/EqOz in the prior comparable period ending January 31, 2022 due mainly to lower ounces produced coupled with higher tonnes milled in the current period. Overall cost per tonne averaged US$67/t, compared to US$61/t in the prior period due mainly to higher input costs for labour, electricity and fuel in the current period coupled with higher development costs per meter and to a less favourable exchange rate. The mine plan has been developed to ensure the mine is properly developed and mined so as to ensure a constant supply of ore in accordance with currently planned production capacity and ore grades. Changes to the plan that may involve production and capital investment are continually being assessed by management. Currently, the Company is continuing underground exploration in order to identify higher grade ore zones and has allocated an adequate budget to support year-long exploration.
During the quarter ended January 31, 2023, the Company incurred approximately US$333 in mine capital expenditures, which includes mine development drifting and drilling, machinery and equipment leases and purchases, and construction and tailings dam remediation, compared to US$337 in the prior comparable quarter ending January 31, 2022.
4.2 Property Activity
Starcore Announces US$2 Million Exploration Program for 2023
Starcore announced that its Board of Directors approved a US$2 million exploration budget for its most prolific projects.
Firstly, Starcore has budgeted US$500,000 for El Creston, an advanced moly project located in Opodepe, Sonora Mexico, where Starcore will inject US$500,000 for studies to confirm the presence of a copper porphyry at depth. The program will include surveys, geophysical studies of magnetometry, and the development of new geological models from existing drillhole data.
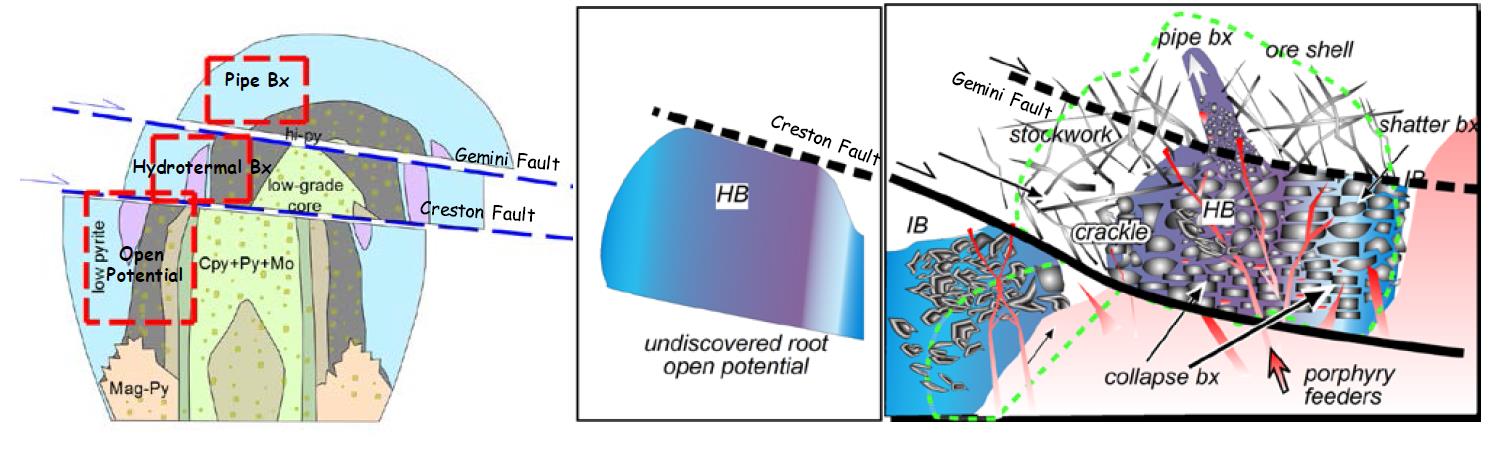
Fig 1) Zoom Model Lowell & Guilbert, 1970, representing geologic model of El Creston Porphyry Mo-Cu, and the open potential deep HB.
(HB: Hydrothermal Breccia; IB; intrusive Breccia).
Secondly, a budget of US$1 million has been allocated for the San Martin Mine concession with the following objectives:
a. To search for the extension of the San Martin Breccia in the southwest and eastern part of the mine
Starcore International Mines Ltd.
MD&A
January 31, 2023
Page 7

Fig 2) Geological Model San Martin Breccias, representing Eastern and Southern part of the deposit.
b. To confirm the geological potential of the north part of the concessions in the areas of Cerro Azul (North Area)
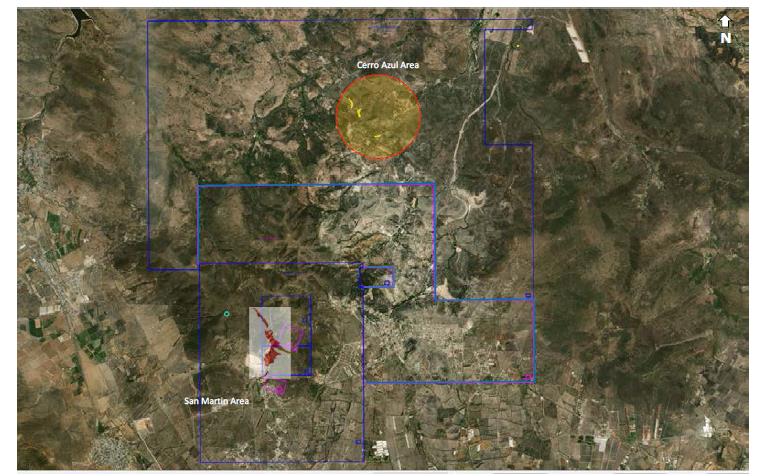
Fig 3) Claim Map representing Cerro Azul Area.
Starcore International Mines Ltd.
MD&A
January 31, 2023
Page 8
Lastly, the balance of the exploration budget of US$500,000 will be allocated towards new opportunities where Starcore has been invited to participate in potential joint ventures.
Salvador Garcia, B. Eng., a director of the Company and Chief Operating Officer, is the Company’s qualified person on the projects as required under NI 43-101and has prepared the technical information contained above.
San Martin Mine Activities – Queretaro, Mexico
In addition to the ongoing mine exploration and development that is currently being performed in development of the mine, management is continually assessing the potential for further exploration and development of the San Martin properties and continually modifying the exploration budget accordingly.
The mine operates two underground and one surface drill rigs to provide information to assist with mine planning in addition to exploration, with the intent of increasing the reserves and resources on the property, and the Company is budgeting targets of approximately 10,000 metres of underground development and exploration drilling in calendar 2023.
The gold and silver grades have dropped in the last two quarters and we have taken measures to conserve resources and reduce costs. One such measure was to halt drilling exploration carried out by contractors while we complete the new geological model of the mine using past data accumulated. This process includes the participation of two external geologists with extensive experience worldwide in structural geology and modeling of geological orebodies, along with our own geology team. We expect the new geological model to be ready in the next quarter which will define the exploration targets that we will use to continue underground exploration.
Overall, we have applied cost reductions in all areas of mine and administration, including management, to compensate for lower production. “In expectation of the decrease in production, we are reducing costs temporarily to return to our strategy of producing profitable ounces day by day," stated Salvador Garcia, Chief Operating Officer of the Company.
| | | | | | | | |
| | | | 9 Month YTD | |
San Martin Production | Q3 2023 | Q2 2023 | Q/Q Change | 2023 2022 | Y/Y Change |
Ore Milled (Tonnes) | 58,562 | 57,165 | 2% | 170,990 | 169,060 | 1% | |
Gold Equivalent Ounces | 2,182 | 2,452 | -11% | 7,559 | 8,265 | -9% | |
Gold Grade (Grams/Ton) | 1.29 | 1.46 | -12% | 1.48 | 1.55 | -5% | |
Silver Grade (Grams/Ton) | 8.85 | 12.83 | -31% | 14.20 | 21.62 | -34% | |
Gold Recovery (%) | 85.24 | 87.14 | -2% | 87.43 | 88.08 | -1% | |
Silver Recovery (%) | 48.95 | 47.86 | 2% | 48.71 | 51.01 | -5% | |
Gold: Silver Ratio | 80.13 | 88.46 | | 85.37 | 73.78 | | |
Salvador Garcia, Chief Operating Officer, is the Company’s qualified person under NI 43-101, and has reviewed and approved the scientific and technical disclosure on the San Martin Mine disclosed in this MD&A.
Starcore International Mines Ltd.
MD&A
January 31, 2023
Page 9
Creston Moly
On February 19, 2015, the Company acquired all of the shares of Creston Moly from Deloitte Restructuring Inc. in its capacity as trustee in bankruptcy of Mercator Minerals Ltd. at a purchase price of CDN $2 Million. In June, 2011, Mercator Minerals Ltd. (“Mercator”), a TSX listed company, acquired Creston Moly in a cash and shares deal valuing Creston Moly at approximately $194 million. BMO Capital Markets, financial advisor to Creston Moly and its Board, provided a fairness opinion to the effect that the consideration (of $194 million) was fair, from a financial point of view, to the shareholders of Creston Moly.1 The most significant asset in this acquisition was the El Creston project in Sonora, Mexico which had been advanced to a completed Preliminary Economic Assessment ("PEA"). Creston Moly is a British Columbia company that owns, through its subsidiaries, a 100% interest in the El Creston and the Ajax properties described below.
El Creston Project, Sonora, Mexico2
The El Creston molybdenum property is located in the State of Sonora, Mexico, 175 kilometres south of the US Border and 145 kilometers northeast of the city of Hermosillo. In 2010, a PEA was prepared on the property based on zones of porphyry-style molybdenum (“Mo”)/Copper (“Cu”) mineralization by an independent consulting firm. The result of this study indicated that the El Creston molybdenum-copper deposit had a US $561.9million net present value after tax (using an 8% discount rate). The internal rate of return (after tax) was calculated to be 22.3% and a capital cost payback was calculated to be four years. Other highlights of the report include:
| • | Large moly-copper deposit in a mining-friendly jurisdiction. Total Measured and Indicated Resources of 215 million tonnes grading 0.071% Mo and 0.06% Cu, containing 336 Mlbs Mo and 281 Mlbs Cu. Mineral resources that are not mineral reserves do not have demonstrated economic viability; |
| • | Initial Capital cost: US$655.9million with payback of 4 years, based on metal prices of $15/lb Mo and $2.60/lb Cu. Metal recoveries were estimated at 88% for Mo and 84% for Cu; |
| • | Low Operating Cost: operating cost of $US4.12/lb Mo, net of copper credits, 0.84:1 waste to ore strip ratio within an optimized pit containing an additional 7.6 million tonnes of Inferred Resources responsible for $20M of the NPV; |
| • | Excellent infrastructure: Road accessible with a 230kV power grid within 50 km; |
| • | Apart from the PEA, recommendations have been made to test known mineralization below the current pit-limiting “Creston Fault” where results such as drill hole EC08-54 returned 241.4m at 0.083% Mo and 0.059% Cu to a depth of 495m in the Red Hill Deep zone. |
David Visagie, P.Geo., an independent consultant, is the Company’s qualified person under NI 43-101, and has reviewed and approved the scientific and technical disclosure on the El Creston Project disclosed in this report.
El Creston Current Activities
The Company released its updated mineral resource estimate and NI 43-101 compliant Technical Report for its El Creston molybdenum project located near Opodepe, Mexico on December 1, 2022. The report entitled “Independent Technical Report for the El Creston Molybdenum Project, Sonora, Mexico” prepared by SRK Consulting (Canada) Inc. (“SRK Consulting”) has been filed on SEDAR and is also available on the Company’s website www.starcore.com . The Technical Report documents a mineral resource statement for the El Creston Project prepared by Dr. Gilles Arseneau, Qualified Person and associate consultant with SRK. It was prepared following the guidelines of the Canadian Securities Administrators’ National Instrument 43-101 and Form 43-101F1. Highlights of the report are outlined below.
1 | The information in this report relating to the acquisition of Creston Moly by Mercator has been drawn from documents filed under the Creston Moly Corp. issuer profile on SEDAR, more specifically: Creston’s Management Information Circular dated May 9, 2011 and filed on SEDAR on May 16, 2011, and Creston’s news release of June 6, 2011 as filed on SEDAR on June 7, 2011. |
2 | The technical information in this MD&A relating to the El Creston Project is based on the technical report entitled “Preliminary Economic Assessment, El Creston Project, Opodepe, Sonora, Mexico”, dated December 16, 2010, filed under the Creston Moly Corp. issuer profile on SEDAR on December 20, 2010. Information regarding the effective date of the mineral resources, key assumptions, parameters and methods used to estimate the mineral resources, and known risks that materially affect the mineral resources can be found in the technical report. The PEA provides information on El Creston that is historical and the Company cannot guarantee the accuracy of the data presented therein. The reader is cautioned not to place undue reliance on the historical data or its implications that have been derived from third-party sources. The PEA is referenced herein solely for historic context and background. |
Starcore International Mines Ltd.
MD&A
January 31, 2023
Page 10
Property Description and Ownership
The El Creston Project is located in north-central Sonora State in north-western Mexico. The property is about 145 kilometres (“km”) by road north-northeast of Hermosillo, the capital of Sonora State, 5 km southwest of the village of Opodepe. Access from Hermosillo is via Highway 15 north from Hermosillo 70 km to Carbo junction. From the junction, a paved road is followed east for 52 km to Rayon, then north along a well-maintained gravel road for 21 km to the junction with a secondary unpaved road crossing the San Miguel River 5 km south of Opodepe that leads to the Creston Project. The approximate center of the mineral resources described in Section 14 is 29°53’N latitude and 110°39’W longitude.
The property is comprised of nine concessions covering approximately 11,363 hectares (“ha”) wholly owned by Exploraciones Global, S.A. de C.V., a Mexican subsidiary of Starcore. All concessions are subject to a 3% net smelter return (“NSR”). There are no known environmental liabilities to which the project is currently subjected.
Geology and Mineralization
Regionally, the area is part of the Basin and Range Province which is an extensional terrain of fault-bounded ranges and intervening valleys in the western United States that extends southward from Nevada and Utah southwards into the states of Sonora and Chihuahua, Mexico. In northern Mexico, this province is bifurcated by the Sierra Madre Occidental, a north-northwest-trending mountain range about 1,200 km long and 200 km to 300 km wide that forms the spine of northern Mexico. The Creston property lies in the western or Sonoran portion of the Basin and Range Province, close to the western flank of the Sierra Madre Occidental.
The predominant lithologies known at El Creston include metamorphic rocks of Precambrian and perhaps Paleozoic age, intrusions of various compositions, dikes, and breccias of Paleozoic and Tertiary age, and Recent conglomerate, talus, and landslide deposits. Phyllites, quartzite, gneisses, and metavolcanic rocks were intruded by the Creston granite, which has a weakly developed gneissic texture. The Creston granite has been altered and mineralized, hosting most of the presently defined molybdenum (“Mo”) mineralization in the Main deposit, the older metamorphic rocks intruded by the Creston granite are only locally altered and mineralized.
There are two principal styles of mineralization at the Main deposit: predominantly subvertical quartz-molybdenite-pyrite veinlets hosted by the Creston granite and molybdenite-pyrite within the quartz matrix of magmatic-hydrothermal breccia of the East Breccia body, which cuts the Creston granite. While minor amounts of chalcopyrite accompany the molybdenite mineralization, more significant quantities of copper (“Cu”) occur as chalcocite replacements of pyrite within secondary enrichment blankets that parallel present-day topography. Some chalcocite also occurs below the enrichment blankets, primarily along permeable structural zones such as the Ordoñez fault zone.
The currently defined mineralized area occupies a zone about 1,600 metres (“m”) in an east-west direction, a maximum of 1,200 m in a north-south direction, and 550 m vertically. The Creston and Ordoñez faults terminate the bulk of the molybdenum mineralization at depth, although some mineralization has been intersected in drillholes below the Creston fault at the Red Hill zone to the south. Mineralization at El Creston includes both molybdenum and copper minerals.
Exploration Status
The property has been explored extensively in the past. Starcore has not carried out any recent exploration on the property but has announced a $500,000 US Dollars (“US$”) exploration program for the El Creston Project. The program is to include geological and magnetometry surveys.
Mineral Resource Estimate
The mineral resource model prepared by the QP considers 181 core holes and three reverse circulation holes, Creston Moly Corporation drilled 156 holes during the period of 2007 to 2011, 28 holes were drilled by AMAX between 1974-1975. The resource estimation work was completed by Dr. Gilles Arseneau, P. Geo. (APEGBC #23474) an appropriate “independent Qualified Person” as this term is defined in National Instrument 43-101. The mineral resources have been estimated in
Starcore International Mines Ltd.
MD&A
January 31, 2023
Page 11
conformity with generally accepted CIM “Estimation of Mineral Resource and Mineral Reserves Best Practices” guidelines and are reported in accordance with the Canadian Securities Administrators’ National Instrument 43-101.
GEOVIA GEMs™ Version 6.8.4 was used to construct the geological solids, prepare assay data for geostatistical analysis, construct the block model, estimate metal grades and tabulate mineral resources. Sage2001 was used to model the variography of copper and molybdenum.
The oxide surface was modelled from a hard boundary between the dominantly oxidized zone near surface and the sulphide mineralization below using a 30% molybdenum oxide limit. A wireframe was used to model the molybdenum mineralization with the Creston granite and the copper mineralization was modelled into high-grade and low-grade domains based on statistical analysis of the assay data. Assay data were capped prior to modelling based on statistical analysis. Molybdenum values were capped at 0.70% Mo and copper values in the higher-grade zone were capped at 1.0% Cu and 0.45% Cu in the low-grade copper zone. All assays were composited to 3.0 m length within the modelled domains.
Grades were estimated by ordinary kriging inside 10 m by 10 m by 12 m blocks. To determine the quantities of material offering “reasonable prospects for eventual economic extraction” by an open pit, the QP used a pit optimizer and reasonable mining assumptions to evaluate the proportions of the block model (Measured, Indicated and Inferred blocks) that could be “reasonably expected” to be mined from an open pit. The optimization parameters were based on experience and benchmarking against similar projects. Blocks within the resource shell were classified as Measured if they were populated using more than eleven samples at an average distance of less than 80 m and where the probability of the grade exceeding cut-off was more than 90%. Blocks were considered Indicated if they were populated by more than eight samples at an average distance of less than 100 m. All other estimated blocks were classed as Inferred. Based on the above parameters, the QP estimated that the El Creston deposit contained 56.3 million tonnes (“Mt”) grading 0.076% Mo and 0.04% Cu in the Measured category, and 142.2 Mt grading 0.067% Mo and 0.08% Cu classified as Indicated mineral resources. There are no blocks classified as Inferred mineral resource within the Whittle optimized pit shell (Table 1.1).
Table 1.1: Mineral Resource Statement at 0.045% Molybdenum Equivalent*, El Creston Molybdenum Project, Sonora Mexico, SRK Consulting, 30 September 2022:
| | | | | | | | |
Category | Quantity | Grade | Metal |
Mo | Cu | Mo | Cu |
(Mt) | (%) | (%) | (Mlb) | (Mlb) |
Open Pit** |
Measured | 56.3 | 0.076 | 0.04 | 94.3 | 49.7 |
Indicated | 142.2 | 0.067 | 0.08 | 210.0 | 250.8 |
Measured Plus Indicated | 198.5 | 0.069 | 0.07 | 304.4 | 300.5 |
Inferred |
* Mineral resources are reported in relation to a conceptual pit shell. Mineral resources are not mineral reserves and do not have demonstrated economic viability. All figures are rounded to reflect the relative accuracy of the estimate. All composites have been capped where appropriate.
** Open pit mineral resources are reported at a cut-off grade of 0.045% Mo EQ. Cut-off grades are based on a price of US$9.93 per lb of molybdenum and US$3.50 for copper, recoveries of 88% for molybdenum and 84% for copper were applied.
Conclusion and Recommendations
The El Creston Molybdenum Project is an advanced staged exploration property located in Sonora State, Mexico.
The molybdenite mineralization occurs as finely disseminated subhedral crystals 0.1 millimetres (“mm”) to 0.8 mm across, embedded in a pervasive, fine-grained quartz-sericite matrix, and as coarsely crystalline molybdenite along the margins of quartz veins. The QP believes that the widely spaced drill sampling is suitably adequate to represent the disseminated and veinlet molybdenum mineralization.
Starcore International Mines Ltd.
MD&A
January 31, 2023
Page 12
While some molybdenum grades do occur below the Creston fault, the grade estimates were limited to the zone between the oxide boundary and the Creston fault. The QP recommends that Starcore continue to explore the El Creston Project. Specifically, a US$500,000 exploration surface exploration program is recommended.
“We have always viewed El Creston as an extremely valuable asset, given that it is a copper-moly project,” said Robert Eadie, Starcore’s CEO. “We are happy that the report has been updated and we are now able to advance the project and share SRK Consulting’s findings with our shareholders.”
Opodepe Project, Sonora State, Mexico
The Company announced the start of DDH exploration on its MEZTLI 4 and TEOCUITLA claims located in Opodepe, Sonora, Mexico. This first stage explored five different veins that were discovered after more than eight months of geological works with more than 2000 samples taken. As reported in its news release of August 17, 2021, the Opodepe project represents a three-dimensional prospect for Starcore with possibilities as a moly deposit, or as a property with gold showings, and thirdly as a project with the potential for copper porphyry at depth. These concessions of 11,364 hectares (the MEZTLI 4 claims) have never been explored for precious metals. With the acquisition of 3,087 hectares northwest of the MEZTLI 4 claims (the TEOCUITLA concessions), Starcore now has a total of 14,451 hectares to explore, with five veins identified thus far for the initial stage of drilling. A summary of the samples taken are as follows:
| | | | | | | |
# Targets | Target | Claim | Recognized surface length (mt) | Economic length (mt) Surface | Economic width (mt) Surface | Au g/t | Ag g/t |
1 | Mana System | Meztli 4 | 2100 | 300 | 1.07 | 0.52 | 250 |
2 | Karla System NW | 1815 | 280 | 0.53 | 3.52 | 13 |
3 | Nom | 520 | 200 | 0.55 | 4.19 | 43 |
4 | El Guerigo | 1800 | 110 | 0.98 | 0.11 | 162 |
5 | San Gerónimo | 196 | 100 | 0.40 | 0.40 | 120 |
6 | Midas Vein | New claims acquired | 580 | 190 | 0.73 | 0.20 | 160 |
7 | La Aurora - La Espinada Vein | old Dumps | 0.21 | 241 |
8 | La Última | Old mining non visited |
9 | El Oro | Other claim | 500 | 70 | 0.53 | 10.30 | 5 |
TABLE OF ASSAYS LAB RESULTS
Salvador Garcia, B. Eng., a director of the Company and Chief Operating Officer, is the Company’s qualified person on the project as required under NI 43-101 and has prepared the technical information contained above.
Starcore International Mines Ltd.
MD&A
January 31, 2023
Page 13
Ajax, British Columbia, Canada3
Ajax Molybdenum Property is comprised of 11,718 hectares and is located 13 km north of Alice Arm, British Columbia in northwestern B.C.’s well-known mineralized belt, the “Golden Triangle”. The property, measuring 1718.65 hectares in size, was acquired in 2015 through its purchase of Creston Moly Corp. and its subsidiary Tenajon Resources Corp.. The Ajax Property, one of North America's largest undeveloped molybdenum deposits occupying a surface area of approximately 600 by 650 metres, is a world class primary molybdenum property in the advanced stage of exploration.
Ajax Current Activities
| The Company completed an eight-day prospecting, soil and rock chip sampling program on the Ajax Property which hosts the very large Ajax porphyry molybdenum occurrence that has been tested by 48 drill holes, beginning in the mid 1960’s. During Starcore’s September, 2021 limited field program, rock and soil sampling have revealed the potential for precious and base metal potential beyond the limits of the known molybdenum mineralization. |
Three rock samples collected from mineralization exposed in old pits along the south spine of Mt. McGuire, about 1.3 km from the known molybdenum mineralization, assayed up to 4.1 grams per tonne (g/t) silver, 0.23% copper, over limit for analysis method (greater than 100 g/t) tungsten and 794 g/t cobalt. In addition, two quartz veins sampled downslope from these pits assayed over limit (greater than 100 g/t) silver and over limit (greater than 1%) lead and zinc and over limit (greater than 0.2%) bismuth. Mineralization sampled in the vicinity of a documented BC MINFILE occurrence Ida, northeast of Mt. McGuire peak, assayed over limit (greater than 100 g/t) tungsten, 1.1 g/t silver and anomalous molybdenum and copper.
Soil sampling during the 2021 fieldwork identified two areas to the southwest of the known molybdenum mineralization. The North Anomaly, as defined by the 50 ppm molybdenum in soil contour, is 300 metres (m) long by 500 m wide. It trends westerly and is open along strike to the east and west. The South Anomaly is a 700 m long and open up to 500 m wide, east-west trend of anomalous gold, silver, copper, lead, zinc, cobalt and arsenic in-soil values.
Starcore is planning additional fieldwork for 2023 to further explore the potential of the higher level porphyry mineralization discovered in 2021.
Ian Webster P.Geo. is the Qualified Person, as defined by National Instrument 43-101, who has reviewed and approved the technical contents of this report.
Scottie Claims Royalty, Canada
Pursuant to the acquisition of Tenajon as part of the Creston Moly acquisition above, the Company acquired a 3% NSR in the Scottie gold claims located in B.C.. Starcore and Scottie Resources Corp. (“Scottie”) announced that Scottie acquired the 3% net smelter royalty interest (“NSR”) attached to the Summit Lake Property in the Skeena Mining Division of British Columbia from Tenajon Resources Corp., Starcore’s wholly-owned subsidiary, in consideration of $1.6 million. As the NSR was not allocated a value on purchase of Creston, the full amount is shown as a gain on the consolidated statement of operations and comprehensive income (loss) for the year ended April 30, 2022.
Toiyabe, Nevada, USA
The Company had the rights to a 100% undivided interest in the Toiyabe Gold Project (“Toiyabe”) consisting of 165 mining claims located in Lander County, Nevada, United States of America. During the year ended April 30, 2021, the Company entered into a binding agreement with Westward Gold Inc. (formerly IM Exploration Inc.) (“WG”) for the assignment of the Company’s option to acquire a 100% interest in Toiyabe from the Optionor. As consideration for the transfer of the Company’s option to acquire Toiyabe, WG made a cash payment of US$150,000 and issued the Company 4,100,000 common shares in the capital of WG which were received by our escrow agent and valued at fair market value at date of issue of $0.19 per share subject to a contractual escrow period of twelve (12) months (currently all of the shares have been released).
3 | Technical information in this report relating to the Ajax Project is based on the NI 43-101 Resource Estimate Press Release entitled “Tenajon Announces 75% Increase in Indicated Molybdenum Resources at Ajax Project”, dated May 15, 2008 and the technical report entitled “Update of Resource Estimation, Ajax Property, Alice Arm, British Columbia”, dated April 18, 2007, both of which are filed under the Tenajon Resources Corp. issuer profile on SEDAR. |
Starcore International Mines Ltd.
MD&A
January 31, 2023
Page 14
Impairment of Mining Interest
In determining the recoverable amounts of the Company’s mining interests, the Company’s management makes estimates of the discounted future cash flows expected to be derived from the Company’s mining properties, costs to sell the mining properties and the appropriate discount rate. The projected cash flows are significantly affected by changes in assumptions about gold’s selling price, future capital expenditures, changes in the amount of recoverable reserves, resources, and exploration potential, production cost estimates, discount rates and exchange rates.
The Company recorded loss for the period ended January 31, 2023 of $4,294 compared with earnings of $226 for the comparative period ended January 31, 2022. The details of the Company’s operating results and related revenues and expenses are as follows:
| | | |
For the nine month period ended January 31, | 2023 | 2022 | Variance |
Revenues | | | |
Mined ore | $17,724 | $18,220 | $(496) |
Cost of Sales | | | |
Mined ore | (14,520) | (12,394) | (2,126) |
Depreciation and depletion | (2,842) | (2,476) | (366) |
| | | |
Total Cost of Sales | (17,362) | (14,870) | (2,492) |
| | | |
Earnings from mining operations | 362 | 3,350 | (2,988) |
| | | |
Financing costs (net) | (120) | (134) | 14 |
Foreign exchange gain | 183 | 93 | 90 |
Management and director fees and salaries | (1,467) | (916) | (551) |
Office and administration | (1,261) | (576) | (685) |
Professional and consulting fees | (856) | (554) | (302) |
Pre-exploration costs | (65) | (25) | (40) |
Shareholder relations | (606) | (461) | (145) |
Transfer agent and regulatory fees | (98) | (57) | (41) |
| | | |
Earnings (loss) before taxes and other losses | (3,928) | 720 | (4,648) |
| | | |
Other losses | | | |
Unrealized loss on investment | (164) | (246) | 82 |
Loss on sale of exploration property | - | (40) | 40 |
| | | |
Income taxes | | | |
Current (expense)/recovery | (444) | (4) | (440) |
Deferred (expense)/recovery | 242 | (204) | 446 |
| | | |
Earnings (loss) for the period | $(4,294) | $226 | $(4,520) |
Overall, revenue from mining operations decreased by $496 for the period ended January 31, 2023 compared to the comparative period ended January 31, 2022, due mainly to lower metal production from a combination of lower ore grade and recovery in the current period compared to the prior comparable period.
Sales of metals for mining operations for the period ended January 31, 2023 approximated 7,136 ounces of gold and 38,986 ounces of silver sold at average prices in the period of US$1,789 and US$22.05 per ounce, respectively. This is a decrease in sale of gold ounces when compared to the prior comparable period ended January 31, 2022 where sales of metal approximated 7,068 ounces of gold and 60,006 ounces of silver, sold at higher average prices of US$1,802 per ounce for gold and higher average prices of US$24.42 per ounce for silver.
Starcore International Mines Ltd.
MD&A
January 31, 2023
Page 15
The total cost of sales above includes non-cash expenses for depreciation and depletion of $2,842 compared to $2,476 in the prior comparable period ending January 31, 2022, which is calculated based on the units of production from the mine over the expected mine production as a denominator. This calculation is based solely on the San Martin mine proven and probable reserves and a percentage of inferred resources in accordance with the Company’s policy of recognizing the value of expected Resources which will be converted to Proven and Probable Reserves, as assessed by management. The increase is largely due to higher amortization costs in the current period of the leases on mobile equipment in accordance with the change to IFRS 16.
For the nine-month period ending January 31, 2023, the Company had gross profit of $362 from mine operations compared to gross profit of $3,350 for the period ended January 31, 2022. The lower gross profit was due mainly to lower metal production as explained above, coupled with lower pricing realized on metal sales and higher mine operating costs per tonne during this period and to higher depreciation charges of $2,842, $366 higher than the prior year based on a higher CAPEX base.
Other Items
Changes in other items for the nine-month period ended January 31, 2023, resulted in the following significant changes from the period ended January 31, 2022:
| • | Management fees and salaries increased by $551 due to the addition of the president in the 4th quarter of fiscal 2022 and to accrual of RSU/ DSU expenses based on the new allocations made in fiscal 2022 which fluctuates with our share price; |
| • | Office and Administration increased by $685 due to higher corporate activity in the current year related to both mine and exploration properties. In addition, the Company increased the accrual of RSU expenses based on the new allocations made in fiscal 2022 which fluctuates with our share price; |
| • | Foreign exchange gain increase by $90 for the period ended January 31, 2023. The increase relates primarily to the fluctuations of the Mexican peso and Canadian dollar in relation to the US dollar, the functional currency of the mining operations, and may be realized or unrealized at the period end; |
| • | Professional and consulting fees increased by $302 to $856 for the period ended January 31, 2023. Professional fees relate primarily to charges in relations to legal, management and audit fees and increased mainly due to corporate activity and the acquisition of claims in the Opodepe Project; |
| • | Shareholder relations increased by $145 in the current period due to an increase in marketing expenses associated with European markets; |
| • | Current income tax expense of $444 relates to a reassessment of 2013 income taxes by Mexican Tax Authorities. While management believed the expenditures disallowed were proper, the reassessment was paid to avoid further penalties and interest while the Company reviews further action. Deferred Income Tax (“DIT”) expense decreased by $446 due mainly to the difference in asset base of the underlying amounts that determine the temporary differences from year to year and utilization of losses in the prior period against taxable income. |
Cash Flows
Cash outflow from operating activities was $1,920 during the period ended January 31, 2023, compared to a cash inflow of $3,283 for the comparative period ended January 31, 2022. Cash flows from operating activities were determined by removing non-cash expenses from the earnings and adjusting for non-cash working capital amounts. Financing activities resulted in an inflow of $615 (January 31, 2022: outflow of $386) due to the financing completed during the period for $1.2million (see below). Cash outflow from investing activities was $960 due to the Company spending $232 on investment in mining interest and plant and equipment, $728 on investment in exploration and evaluation assets. Overall cash decreased during the period ended January 31, 2023 by $1,687 after accounting for the effect of foreign exchange on cash.
Investor Relations Activities
During the period ended January 31, 2023, the Company responded directly to investor inquiries.
Starcore International Mines Ltd.
MD&A
January 31, 2023
Page 16
Financings, Principal Purposes & Milestones
During the period ended January 31, 2023, the Company completed a non-brokered private placement for $1,200,000 upon the issuance of 6,000,000 units (the “Units”) at a price of $0.20 per Unit. Each Unit is comprised of one common share of the Company and one-half of one transferable common share purchase warrant (the “Warrants”), each whole Warrant exercisable for a period of four years from the date of issue to purchase one common share of the Company at a price of $0.30 per share, provided that, if after the expiry of all resale restrictions, the closing price of the Company’s shares is equal to or greater than $0.40 per share for 20 consecutive trading days, the Company may, by notice to the Warrant holders reduce the remaining exercise period of the Warrants to not less than 30 days following the date of such notice.
The Company paid $47,000 as a finder’s fee for the portion of the financing attributable to the finder’s efforts. All of the securities issued pursuant to this private placement will have a hold period expiring four months plus one day after the closing date.
All-in Sustaining Costs
In conjunction with a non-GAAP initiative being undertaken within the gold mining industry, the Company has adopted an “all-in sustaining cash cost” (“AISC”) non-GAAP performance measure that the Company believes more fully defines the total costs associated with producing gold; however this performance measure has no standardized meaning. As the measure seeks to reflect the full cost of equivalent gold production from current mining operations, new project capital is not included in the calculation. This measure includes San Martin mining operations coupled with related capital costs. Accordingly it is intended to provide additional information and should not be considered in isolation or as a substitute for measures of performance prepared in accordance with GAAP. The Company reports this measure on a sales basis based solely on sales of metal from the San Martin mining operations:
| | | | |
(In Canadian Dollars unless indicated) | Sustaining Costs (in 000’s) | Sustaining Costs Per Ounce (in $/oz) |
For the period ended January 31, | 2023 | 2022 | 2023 | 2022 |
| | | | |
Total cost of sales cash costs1 | $14,520 | $12,394 | $1,912 | $1,573 |
Total corporate and administration cash costs1,2 | 4,264 | 2,548 | 561 | 323 |
Foreign exchange (gain)/loss | 183 | (93) | 24 | (12) |
Reclamation and closure accretion | 147 | 21 | 19 | 3 |
Sustaining capital expenditures and exploration | (395) | 1,129 | (52) | 143 |
| | | | |
All-in sustaining cash costs | 18,719 | 15,999 | 2,464 | 2,030 |
Foreign exchange adjustment | (4,544) | (3,204) | (598) | (407) |
| | | | |
| | | | |
All-in sustaining USD cash costs | $14,175 | $12,795 | $1,866 | $1,623 |
| | | | |
Total equivalent ounces sold | 7,595 | 7,882 | | |
1 Excludes non-cash depletion and depreciation of $2,929 from cost of sales and from corporate and administration costs for the period ended January 31, 2023 (January 31, 2022: $2,476).
2 Includes share-based compensation of $195 for the period ended January 31, 2023 (January 31, 2022: $70).
The AISC of US$1,866/EqOz is higher than the prior period comparable amount of US$1,623/EqOz due mainly to the higher costs of production and development coupled with additional sustaining exploration costs, further decreased by lower metal sales as the. Overall mine costs were also higher averaging US$67/t, compared to US$61/t in the prior period due mainly to higher input costs for labour, electricity and fuel in the current period coupled with higher development costs per meter and to a less favourable exchange rate.
Starcore International Mines Ltd.
MD&A
January 31, 2023
Page 17
5. | Summary of Quarterly Results |
The following is a summary of the Company’s financial results for the eight most recently completed quarters:
| | | | |
| Q3 31-Jan-23 | Q2 31-Oct-22 | Q1 31-Jul-22 | Q4 30-Apr-22 |
Total Revenue | $6,162 | $4,812 | $6,750 | $7,459 |
Earnings from mining operations | $(553) | $(132) | $1,047 | $1,956 |
Earnings (loss) for period | $(1,862) | $(1,774) | $(658) | $2,179 |
Per share – basic and diluted | $(0.03) | $(0.03) | $(0.01) | $0.05 |
| Q3 31-Jan-22 | Q2 31-Oct-21 | Q1 31-Jul-21 | Q4 30-Apr-21 |
Total Revenue | $5,387 | $6,672 | $6,161 | $5,123 |
Earnings from mining operations | $420 | $1,366 | $1,564 | $15 |
Earnings (loss) for period | $(391) | $(318) | $935 | $(875) |
Per share – basic and diluted | $(0.01) | $(0.00) | $0.02 | $(0.02) |
Discussion
The Company reports a loss of $1,862 for the quarter ending January 31, 2023 compared to a loss of $391 in the comparative quarter ended January 31, 2022. For more detailed discussion on the quarterly production results and financial results for the quarter ended January 31, 2023.
31, 2022, please refer to Sections 4.1 and 4.3 under “Results of Operations”.
6. | Liquidity and Commitments |
The Company expects to continue to receive income and cash flows from the mining operations at San Martin (section 4.1). Management expects that this will result in sufficient working capital and liquidity for the Company for the next twelve months.
As at January 31, 2023, the Company had the following commitments:
The Company has a land rental commitment with respect to the land at the mine site, for $260 per year which is currently being renegotiated. The Company also has ongoing concession commitments on the mine site and on exploration and evaluation assets of approximately $800 per year.
a)The Company has a land rental commitment with respect to the land at the mine site, for $260 per year which is currently being renegotiated. The Company also has ongoing concession commitments on the mine site and on exploration and evaluation assets of approximately $800 per year.
| b) | The Company has management contracts to officers and directors totaling $600 and US$315 per year, payable monthly, expiring in April 2024 and US$400 per year until December 2023. Subsequent to January 31, 2023, management agreed to defer 25% of the amounts payable on these contracts indefinitely. |
| | | | |
Obligations due within twelve months
of January 31, | 2022 | 2023 | 2024 | 2025 and beyond |
| | | | |
Trade and other payables | $2,443 | $- | $- | $- |
Reclamation and closure obligations | $- | $- | $- | $4,185 |
The capital resources of the Company are the mining interests, plant and equipment, with an amortized historical cost of $28,950 as at January 31, 2023. The Company is committed to further expenditures of capital required to maintain and to further develop the San Martin mine which management believes will be funded directly from the operating cash flows of the mine.
Starcore International Mines Ltd.
MD&A
January 31, 2023
Page 18
8. | Off Balance Sheet Arrangements |
The Company has no off-balance sheet transactions.
9. | Transactions with Related Parties |
N/A
Due to mine operating activity of the San Martin mine discussed throughout this MD&A and as detailed in Section 4.1, the operations and activities are similar to previous quarters, which are discussed in Section 4.3 – Results of Operations.
N/A
12. | Critical Accounting Estimates |
The Company makes estimates and assumptions about the future that affect the reported amounts of assets and liabilities. Estimates and judgements are continually evaluated based on historical experience and other factors, including expectations of future events that are believed to be reasonable under the circumstances. In the future, actual experience may differ from these estimates and assumptions.
The effect of a change in accounting estimate is recognized prospectively by including it in the Company’s profit or loss in the period of the change, if it affects that period only, or in the period of the change and future periods, if it affects both.
Information about critical judgements in applying accounting policies that have the most significant risk of causing material adjustment to the carrying amounts of assets and liabilities recognized in the consolidated financial statements within the current financial period are discussed below:
| a) | Economic Recoverability and Profitability of Future Economic Benefits of Mining Interests |
Management has determined that mining interests, evaluation, development and related costs incurred which have been capitalized are economically recoverable. Management uses several criteria in its assessments of economic recoverability and probability of future economic benefit including geologic and metallurgic information, history of conversion of mineral deposits to proven and probable reserves, scoping and feasibility studies, accessible facilities, existing permits and life of mine plans.
b)Rehabilitation Provisions
Rehabilitation provisions have been created based on the Company’s internal estimates. Assumptions, based on the current economic environment, have been made which management believes are a reasonable basis upon which to estimate the future liability. These estimates take into account any material changes to the assumptions that occur when reviewed regularly by management. Estimates are reviewed annually and are based on current regulatory requirements. Significant changes in estimates of contamination, restoration standards and techniques will result in changes to provisions from period to period.
Actual rehabilitation costs will ultimately depend on future market prices for the rehabilitation costs, which will reflect the market condition at the time that the rehabilitation costs are actually incurred. The final cost of the currently recognized rehabilitation provision may be higher or lower than currently provided. The inflation rate applied to estimated future rehabilitation and closure costs is 7.65% (April 30, 2022: 7.65%) and the discount rate currently applied in the calculation of the net present value of the provision is 10% (April 30, 2022: 10%).
Starcore International Mines Ltd.
MD&A
January 31, 2023
Page 19
c)Impairments
The Company assesses its mining interest, plant and equipment assets annually to determine whether any indication of impairment exists. Where an indicator of impairment exists, a formal estimate of the recoverable amount is made, which is considered to be the higher of the fair value less costs to sell and value in use. These assessments require the use of estimates and assumptions such as long-term commodity prices, discount rates, future capital requirements, exploration potential and operating performance.
d)Income Taxes
Significant judgment is required in determining the provision for income taxes. There are many transactions and calculations undertaken during the ordinary course of business for which the ultimate tax determination is uncertain. The Company recognizes liabilities and contingencies for anticipated tax audit issues based on the Company’s current understanding of tax law. For matters where it is probable that an adjustment will be made, the Company records its best estimate of the tax liability including the related interest and penalties in the current tax provision. Management believes they have adequately provided for the probable outcome of these matters; however, the final outcome may result in a materially different outcome than the amount included in the tax liabilities.
In addition, the Company recognizes deferred tax assets relating to tax losses carried forward to the extent there are sufficient taxable temporary differences (deferred tax liabilities) relating to the same taxation authority and the same taxable entity against which the unused tax losses can be utilized. However, utilization of the tax losses also depends on the ability of the taxable entity to satisfy certain tests at the time the losses are recuperated.
e)Mineral Reserves and Mineral Resource Estimates
Mineral reserves are estimates of the amount of ore that can be economically and legally extracted from the Company’s mining properties. The Company estimates its mineral reserve and mineral resources based on information compiled by Qualified Persons as defined by Canadian Securities Administrators National Instrument 43-101 Standards for Disclosure of Mineral Projects. Such information includes geological data on the size, depth and shape of the mineral deposit, and requires complex geological judgments to interpret the data. The estimation of recoverable reserves is based upon factors such as estimates of commodity prices, future capital requirements, and production costs along with geological assumptions and judgments made in estimating the size and grade that comprise the mineral reserves. Changes in the mining reserve or mineral resource estimates may impact the carrying value of mineral properties and deferred development costs, property, plant and equipment, provision for site reclamation and closure, recognition of deferred income tax assets and depreciation and amortization charges.
f)Units of Production Depletion and Depreciation
Estimated recoverable reserves are used in determining the depreciation of mine specific assets. This results in depreciation charges proportional to the depletion of the anticipated remaining life of mine production. Each item’s life, which is assessed annually, has regard to both its physical life limitations and to present assessments of economically recoverable reserves of the mine property at which the asset is located. These calculations require the use of estimates and assumption, including the amount of recoverable reserves and estimate of future capital expenditure. Changes are accounted for prospectively.
13. | Changes in Accounting Policies |
N/A
14. | Financial and Other Instruments |
All significant financial assets, financial liabilities and equity instruments of the Company are either recognized or disclosed in the audited consolidated financial statements together with other information relevant for making a reasonable assessment of future cash flows, interest rate risk and credit risk. Where practicable the fair values of financial assets and financial liabilities have been determined and disclosed; otherwise only available information pertinent to fair value has been disclosed.
In the normal course of business, the Company’s assets, liabilities and forecasted transactions are impacted by various market
Starcore International Mines Ltd.
MD&A
January 31, 2023
Page 20
risks, including currency risks associated with inventory, revenues, cost of sales, capital expenditures, interest earned on cash and the interest rate risk associated with floating rate debt.
Currency risk is the risk to the Company's earnings that arises from fluctuations of foreign exchange rates and the degree of volatility of these rates. The primary currency the Company exposed to is the United States dollar which is also the functional currency of the San Martin Mine. The Company does not use derivative instruments to reduce its exposure to foreign currency risk. At January 31, 2023 the Company had the following financial assets and liabilities denominated in CDN and denominated in Mexican Pesos:
| | |
In ‘000 of | CAD$ | MXN$ |
| | |
Cash | $938 | MP 4,822 |
Other working capital amounts – net | $(430) | MP (10,500) |
At January 31, 2023, US dollar amounts were converted at a rate of $1.3335 Canadian dollars to $1 US dollar and MP were converted at a rate of MP18.8150 to $1 US Dollar.
15.1 | Disclosure of Outstanding Share Capital as at March 15, 2023 |
| | |
| Number | Book Value |
Common Shares | 55,646,851 | $51,878 |
There are no options outstanding nor any granted subsequent to January 31, 2023.
During the period ending January 31, 2032, 3,000,000 warrants were issued as discussed in “4.3 Results of Operations - Financings, Principal Purposes & Milestones”.
15.2 | Disclosure Controls and Procedures |
The Company’s management, with the participation of its Chief Executive Officer and Chief Financial Officer, has evaluated the effectiveness of the Company’s disclosure controls and procedures. Based upon the results of that evaluation, the Company’s Chief Executive Officer and Chief Financial Officer have concluded that, as of the end of the period covered by this report, the Company’s disclosure controls and procedures were effective to provide reasonable assurance that the information required to be disclosed by the Company in reports it files is recorded, processed, summarized and reported, within the appropriate time periods and forms.
Internal Controls Over Financial Reporting
The Company’s management, with the participation of its Chief Executive Officer and Chief Financial Officer, are responsible for establishing and maintaining adequate internal control over financial reporting. Under the supervision of the Chief Financial Officer, the Company’s internal control over financial reporting is a process designed to provide reasonable assurance regarding the reliability of financial reporting and the preparation of audited consolidated financial statements for external purposes in accordance with IFRS. The Company’s controls include policies and procedures that:
| • | pertain to the maintenance of records that, in reasonable detail, accurately and fairly reflect the transactions and dispositions of the assets of the Company; |
| • | provide reasonable assurance that transactions are recorded as necessary to permit preparation of consolidated financial statements in accordance with IFRS; and |
| • | provide reasonable assurance regarding prevention or timely detection of unauthorized acquisition, use or disposition of the Company’s assets that could have a material effect on the annual consolidated financial statements or interim financial statements. |
There has been no material change in the Company’s internal control over financial reporting during the Company’s period ended January 31, 2023.
Starcore International Mines Ltd.
MD&A
January 31, 2023
Page 21
Limitations of Controls and Procedures
The Company’s management, including the Chief Executive Officer and Chief Financial Officer, believe that any disclosure controls and procedures or internal controls over financial reporting, no matter how well conceived and operated, can provide only reasonable, not absolute, assurance that the objectives of the control system are met. Further, the design of a control system must reflect the fact that there are resource constraints, and the benefits of controls must be considered relative to their costs. Because of the inherent limitations in all control systems, they cannot provide absolute assurance that all control issues and instances of fraud, if any, within the Company have been prevented or detected. These inherent limitations include the realities that judgments in decision-making can be faulty, and that breakdowns can occur because of simple error or mistake. Additionally, controls can be circumvented by the individual acts of some persons, by collusion of two or more people, or by unauthorized override of the control. The design of any systems of controls also is based in part upon certain assumptions about the likelihood of future events, and there can be no assurance that any design will succeed in achieving its stated goals under all potential future conditions. Accordingly, because of the inherent limitations in a cost-effective control system, misstatements due to error or fraud may occur and not be detected.