Exhibit 99.2
| BlueLinx Quarterly Review 2nd Quarter 2007 |
| BlueLinx Holdings Inc. Safe Harbor Statement and Use of Non-GAAP and Pro Forma Information Forward-Looking Statement Safe Harbor - This presentation includes "forward-looking statements" within the meaning of the Private Securities Litigation Reform Act of 1995. All of these forward-looking statements are based on estimates and assumptions made by our management that, although believed by BlueLinx to be reasonable, are inherently uncertain. Forward-looking statements involve risks and uncertainties, including, but not limited to, economic, competitive, governmental and technological factors outside of its control, that may cause our business, strategy or actual results to differ materially from the forward-looking statements. These risks and uncertainties may include, among other things: changes in the supply and/or demand for products which we distribute, especially as a result of conditions in the residential housing market; general economic business conditions in the United States; the activities of competitors; changes in significant operating expenses; changes in the availability of capital; the ability to identify acquisition opportunities and effectively and cost-efficiently integrate acquisitions; general economic and business conditions in the United States; adverse weather patterns or conditions; acts of war or terrorist activities; variations in the performance of the financial markets; and other factors described in the "Risk Factors" section in the Company's Annual Report on Form 10-K for the fiscal year ended December 30, 2006, and in its periodic reports filed with the SEC from time to time. In addition, the statements in this presentation are made as of August 7, 2007. The Company expects that subsequent events or developments will cause its views to change. The Company undertakes no obligation to update any of the forward-looking statements made herein, whether as a result of new information, future events, changes in expectation or otherwise. These forward-looking statements should not be relied upon as representing the Company's views as of any date subsequent to August 7, 2007. Use of Non-GAAP and Pro Forma* Financial Information - To supplement GAAP financial statements, the Company uses non-GAAP, or pro forma measures of operating results. This non-GAAP, or pro forma financial information is provided as additional information for investors and is not in accordance with or an alternative to GAAP. These adjusted results exclude certain costs, expenses, gains and losses, and we believe their exclusion can enhance an overall understanding of our past financial performance and also our prospects for the future. These adjustments to our GAAP results are made with the intent of providing both management and investors a more complete understanding of the operating performance of the Company as opposed to GAAP results, which may include non-recurring, infrequent or other non-cash charges that are not material to the ongoing performance of the Company's business. Company management uses these non-GAAP and pro forma results as a basis for planning and forecasting core business activity in future periods. The presentation of this additional information is not meant to be considered in isolation or as a substitute for net earnings, diluted earnings per share or net cash provided by (used in) operating activities prepared in accordance with generally accepted accounting principles in the United States. |
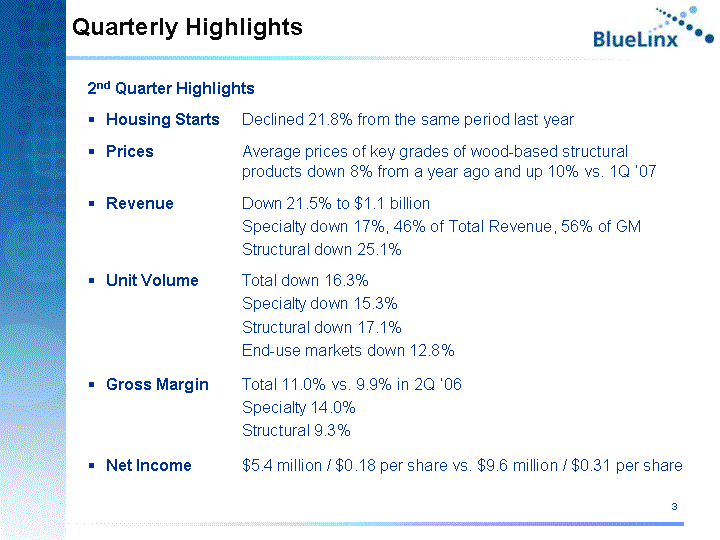
| 2nd Quarter Highlights 2nd Quarter Highlights Housing Starts Declined 21.8% from the same period last year Declined 21.8% from the same period last year Prices Average prices of key grades of wood-based structural products down 8% from a year ago and up 10% vs. 1Q '07 Average prices of key grades of wood-based structural products down 8% from a year ago and up 10% vs. 1Q '07 Revenue Down 21.5% to $1.1 billion Specialty down 17%, 46% of Total Revenue, 56% of GM Structural down 25.1% Down 21.5% to $1.1 billion Specialty down 17%, 46% of Total Revenue, 56% of GM Structural down 25.1% Unit Volume Total down 16.3% Specialty down 15.3% Structural down 17.1% End-use markets down 12.8% Total down 16.3% Specialty down 15.3% Structural down 17.1% End-use markets down 12.8% Gross Margin Total 11.0% vs. 9.9% in 2Q '06 Specialty 14.0% Structural 9.3% Total 11.0% vs. 9.9% in 2Q '06 Specialty 14.0% Structural 9.3% Net Income $5.4 million / $0.18 per share vs. $9.6 million / $0.31 per share $5.4 million / $0.18 per share vs. $9.6 million / $0.31 per share Quarterly Highlights |
| Introduction Steve Macadam Chief Executive Officer |
| BlueLinx continues to focus on its long term strategic objectives in a difficult operating environment Profitably grow specialty revenues to 60+% of total sales Profitably grow structural while reducing exposure to volatility Outgrow the market over the long term 2nd Quarter Progress Cultivate new customers and suppliers Manage costs and working capital Invest in our business Introduction |

| Lynn Wentworth Chief Financial Officer & Treasurer Financial Review |
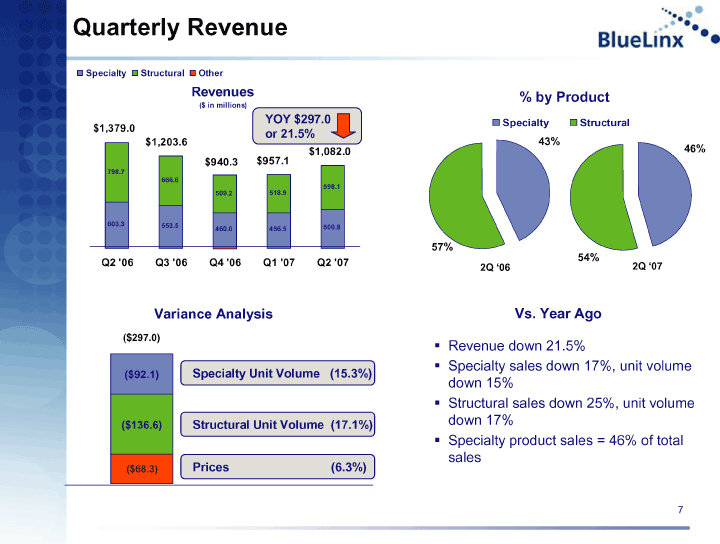
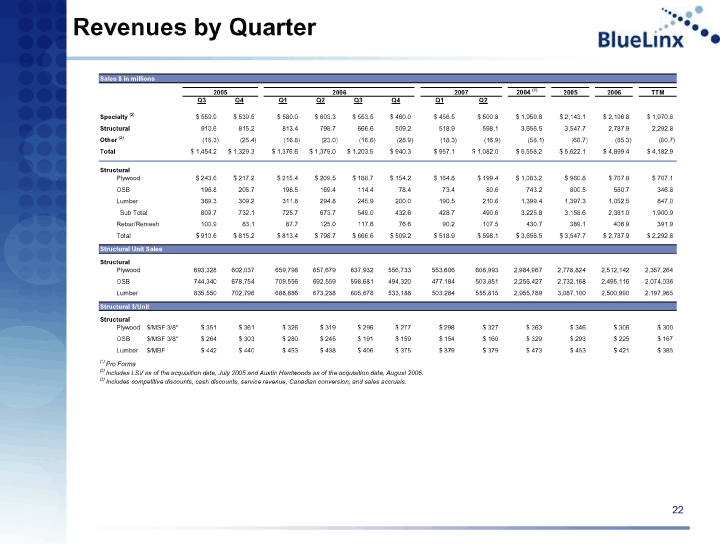
| Quarterly Revenue Q4 '05 Q1 '06 Q2 '06 Q3 '06 Q4 '06 Q1 '07 Q2 '07 Specialty 539.5 580 603.3 553.5 460 456.5 500.8 Structural 815.2 813.4 798.7 666.6 509.2 518.9 598.1 Other -25.4 -16.8 -23 -16.6 -28.9 -18.3 -16.9 Specialty Unit Volume (15.3%) YOY $297.0 or 21.5% Structural Unit Volume (17.1%) Prices (6.3%) ($297.0) 2Q '07 Specialty 500.8 Structural 598.1 2Q '06 2Q '07 2Q '06 Specialty 603.3 Structural 798.4 Vs. Year Ago Revenue down 21.5% Specialty sales down 17%, unit volume down 15% Structural sales down 25%, unit volume down 17% Specialty product sales = 46% of total sales % by Product |
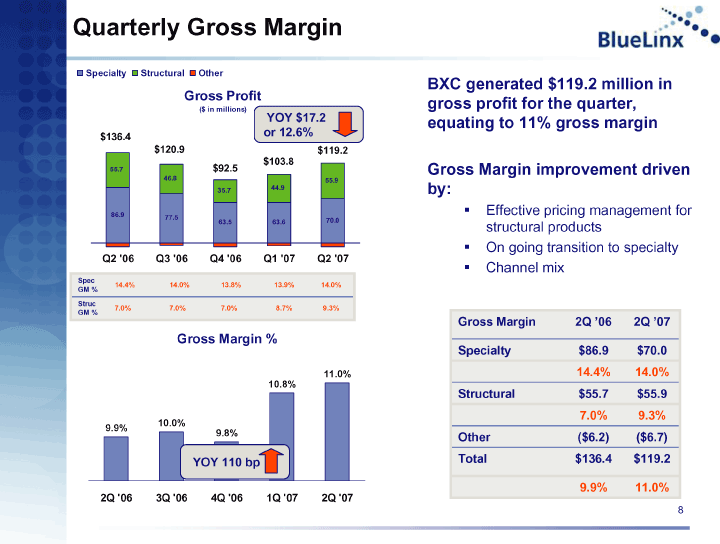
| Quarterly Gross Margin Q4 '05 Q1 '06 Q2 '06 Q3 '06 Q4 '06 Q1 '07 Q2 '07 Speciatly 76.8 80.4 86.9 77.5 63.5 63.6 70 Structural 67.8 55.8 55.7 46.8 35.7 44.9 55.9 Other -4.3 -6.2 -6.2 -3.4 -6.7 -4.8 -6.7 BXC generated $119.2 million in gross profit for the quarter, equating to 11% gross margin Gross Margin improvement driven by: Effective pricing management for structural products On going transition to specialty Channel mix $119.2 YOY $17.2 or 12.6% 1Q '06 2Q '06 3Q '06 4Q '06 1Q '07 2Q '07 GM % 0.094 0.099 0.1 0.098 0.108 0.11 YOY 110 bp $136.4 $120.9 $103.8 $92.5 Gross Margin 2Q '06 2Q '07 Specialty $86.9 $70.0 14.4% 14.0% Structural $55.7 $55.9 7.0% 9.3% Other ($6.2) ($6.7) Total $136.4 $119.2 9.9% 11.0% Spec GM % 14.4% 14.0% 13.8% 13.9% 14.0% Struc GM % 7.0% 7.0% 7.0% 8.7% 9.3% |

| Quarterly Operating Expense Operating Expense 1Q '06 102.3 2Q '06 103.2 3Q '06 104.9 4Q '06 91.9 1Q '07 93.9 2Q '07 98.7 YOY $4.5 or 4.4% BXC continued to tightly manage operating costs during the quarter, resulting in a decrease from the prior year quarter Lower payroll cost related to headcount reductions |
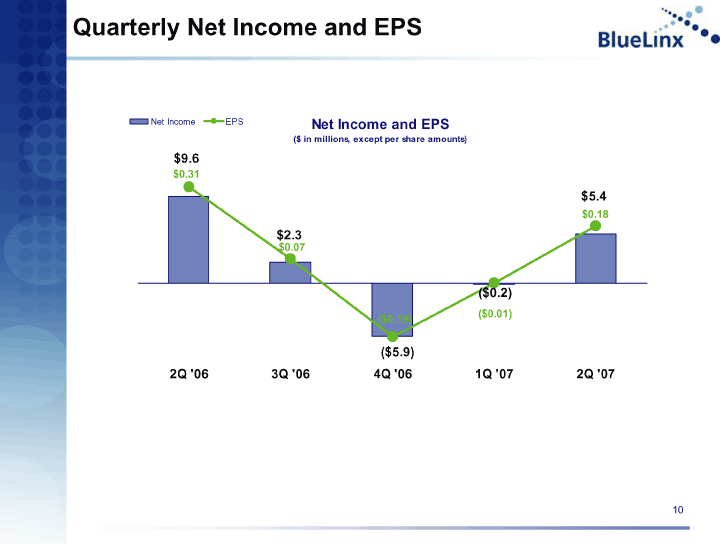
| Quarterly Net Income and EPS 1Q '06 2Q '06 3Q '06 4Q '06 1Q '07 2Q '07 Net Income 9.8 9.6 2.3 -5.9 -0.2 5.4 EPS 0.32 0.31 0.07 -0.19 -0.01 0.18 |
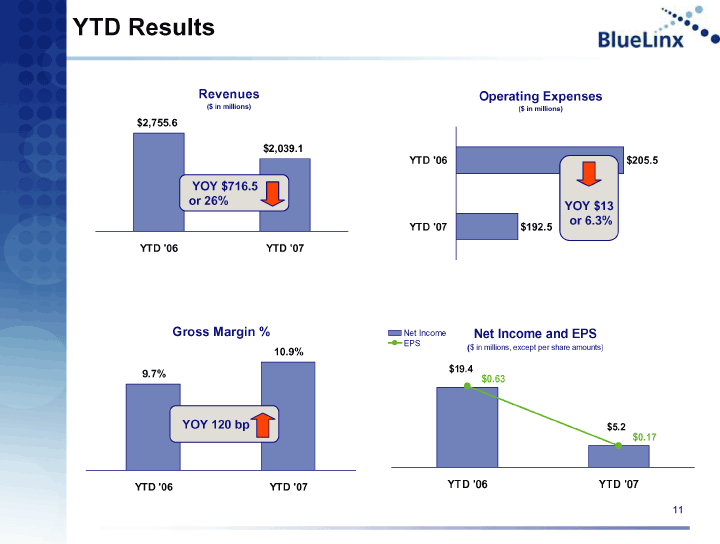
| YTD Results revenue YTD '06 2755.556 YTD '07 2039.104 YOY $716.5 or 26% YTD '06 YTD '07 GM % 0.097 0.109 YOY 120 bp Operating Expense YTD '06 205.495 YTD '07 192.549 YOY $13 or 6.3% YTD '06 YTD '07 Net Income 19.405 5.245 EPS 0.63 0.17 |
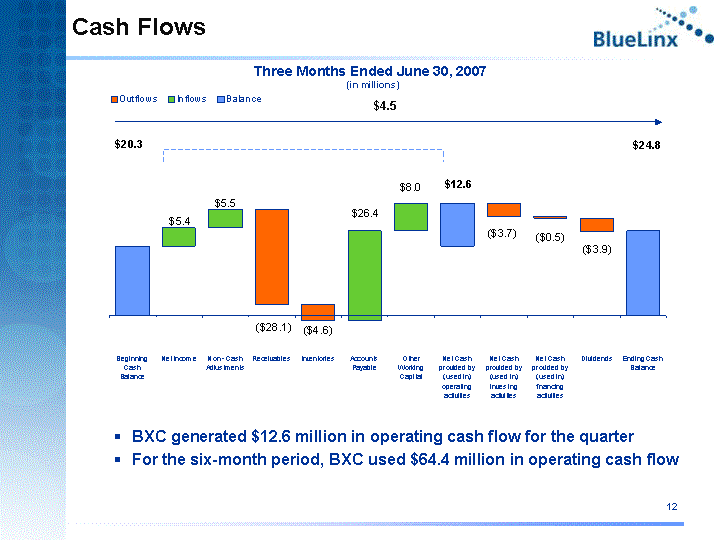
| Cash Flows Beginning Cash Balance 0 20.262 Net Income 20.262 5.434 Non - Cash Adjustments 25.696 5.541 Receivables 3.134 28.103 Inventories 3.134 -1.538 Accounts Payable -1.538 24.839 Other Working Capital 24.839 8.058 Net Cash provided by (used in) operating activities 20.262 12.635 Net Cash provided by (used in) investing activities 29.025 3.728 Net Cash provided by (used in) financing activities 28.52 0.505 Dividends 24.612 3.908 Ending Cash Balance 24.8 Three Months Ended June 30, 2007 (in millions) BXC generated $12.6 million in operating cash flow for the quarter For the six-month period, BXC used $64.4 million in operating cash flow $4.5 |
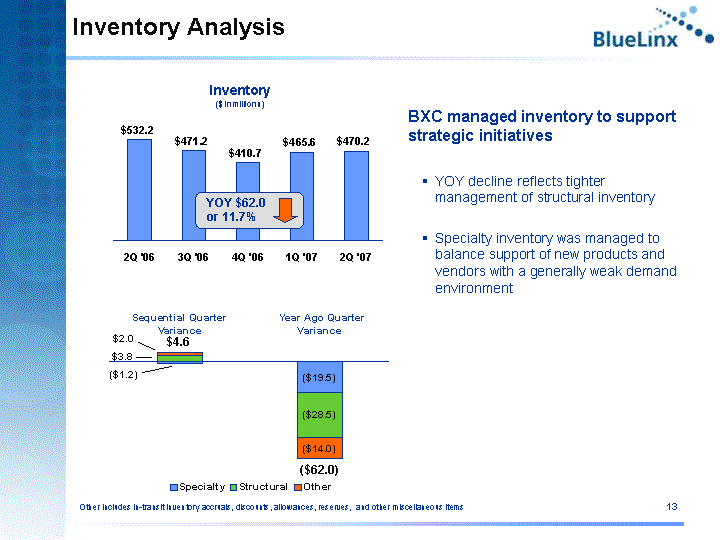
| Inventory Analysis BXC managed inventory to support strategic initiatives YOY decline reflects tighter management of structural inventory Specialty inventory was managed to balance support of new products and vendors with a generally weak demand environment 1Q '06 2Q '06 3Q '06 4Q '06 1Q '07 2Q '07 Inventory 501.2 532.2 471.2 410.7 465.6 470.2 YOY $62.0 or 11.7% Sequential Quarter Variance Year Ago Quarter Variance Specialty -1.2 -19.5 Structural 3.8 -28.5 Other 2 -14 Other includes in-transit inventory accruals, discounts, allowances, reserves, and other miscellaneous items $4.6 ($62.0) |
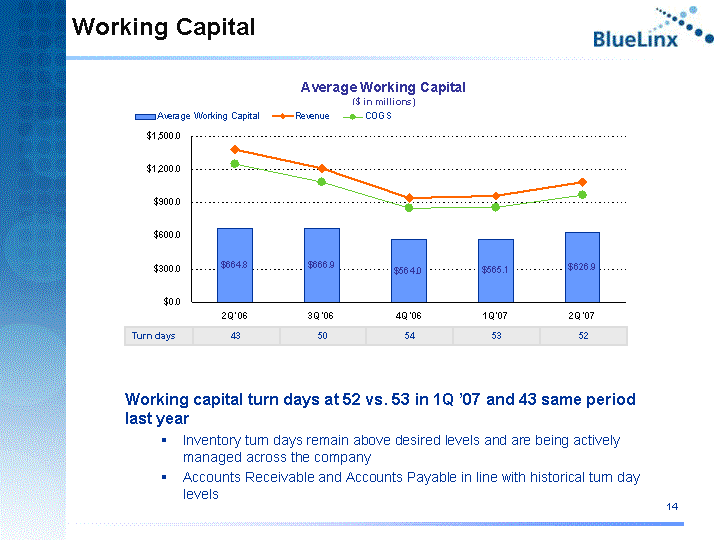
| Working Capital 1Q '06 2Q '06 3Q '06 4Q '06 1Q '07 2Q '07 Average Working Capital 606.7 664.8 666.9 564 565.118 626.929 Revenue 1376.6 1379 1203.5 940.3 957.114 1081.99 COGS 1246.7 1242.5 1082.7 847.7 853.359 962.752 Working capital turn days at 52 vs. 53 in 1Q '07 and 43 same period last year Inventory turn days remain above desired levels and are being actively managed across the company Accounts Receivable and Accounts Payable in line with historical turn day levels Turn days 43 50 54 53 52 |
| Summary 2nd Quarter Achievements Managed margins well in this continued challenging environment 11% gross margin vs. 9.9% for the same period a year ago Aggressively managed costs 4.4%, $4.5 million decline in operating expenses from a year ago Inventory tightly managed to balance specialty growth objective with overall demand environment Making necessary investments to support specialty growth strategy Inventory management and forecasting, financial budgeting and reporting, order tracking and visibility, and sales training Financially sound with financial resources necessary to continue pursuing our strategic objectives and maintain our dividend |
| George Judd President & Chief Operating Officer Operations Review |
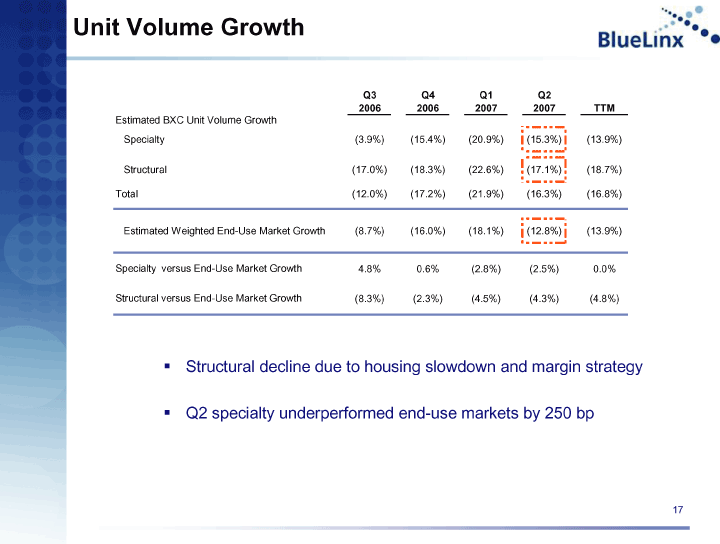
| Structural decline due to housing slowdown and margin strategy Q2 specialty underperformed end-use markets by 250 bp Unit Volume Growth Unit Volume Growth |
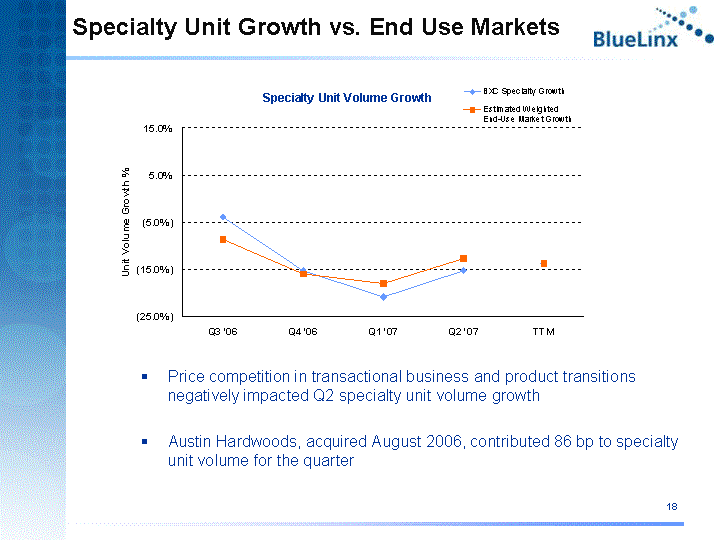
| Price competition in transactional business and product transitions negatively impacted Q2 specialty unit volume growth Austin Hardwoods, acquired August 2006, contributed 86 bp to specialty unit volume for the quarter Specialty Unit Growth vs. End Use Markets |
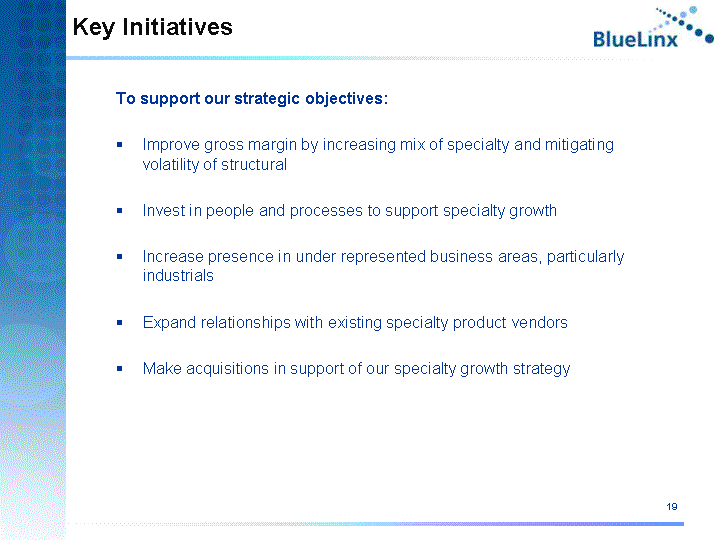
| Key Initiatives To support our strategic objectives: Improve gross margin by increasing mix of specialty and mitigating volatility of structural Invest in people and processes to support specialty growth Increase presence in under represented business areas, particularly industrials Expand relationships with existing specialty product vendors Make acquisitions in support of our specialty growth strategy |
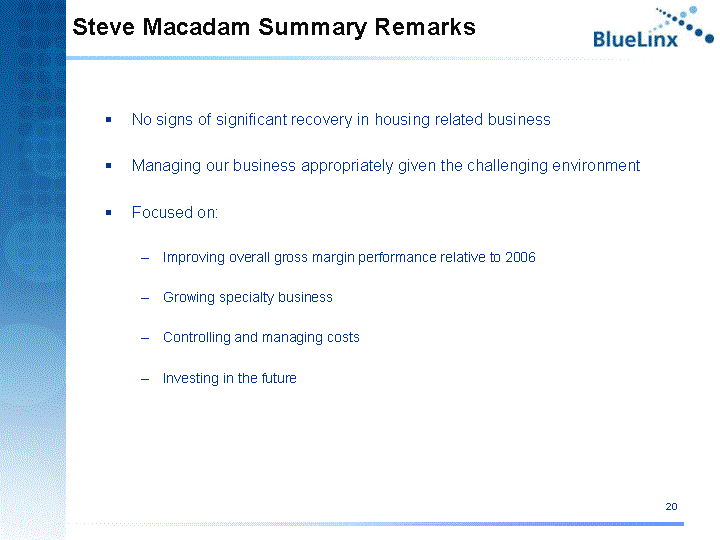
| Steve Macadam Summary Remarks No signs of significant recovery in housing related business Managing our business appropriately given the challenging environment Focused on: Improving overall gross margin performance relative to 2006 Growing specialty business Controlling and managing costs Investing in the future |
| Appendix TOPIC PAGE Revenues by Quarter 22 Unit Volume Growth by Quarter 23 Market Growth by Quarter 24 Gross Margin by Quarter 25 Profit and Loss Statement by Quarter 26 Inventory by Quarter 27 Gross Margin % Analysis 28 Channel Mix Analysis 29 Structural Product Price Trends 30 |
| Revenues by Quarter Revenues by Quarter |
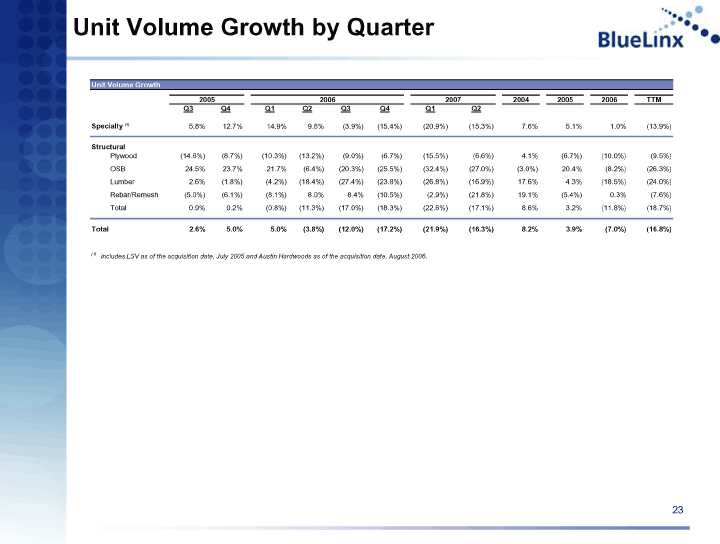
| Unit Volume Growth by Quarter Unit Volume Growth by Quarter |
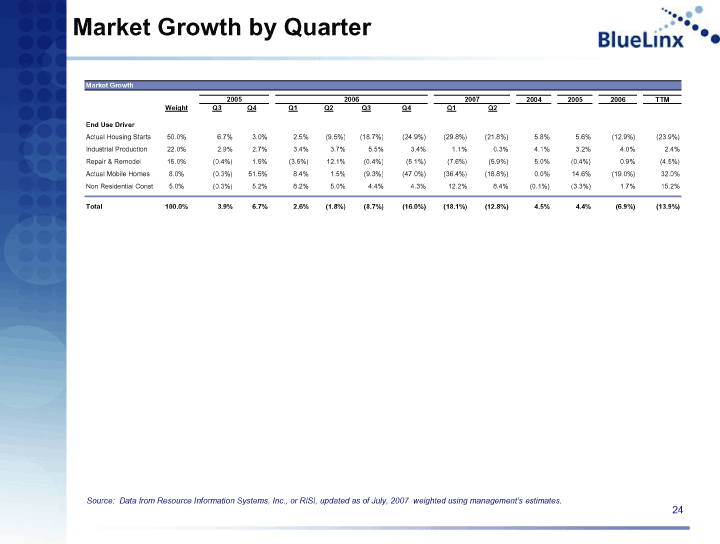
| Source: Data from Resource Information Systems, Inc., or RISI, updated as of July, 2007 weighted using management's estimates. Market Growth by Quarter Market Growth by Quarter |

| Gross Margin by Quarter Gross Margin by Quarter |
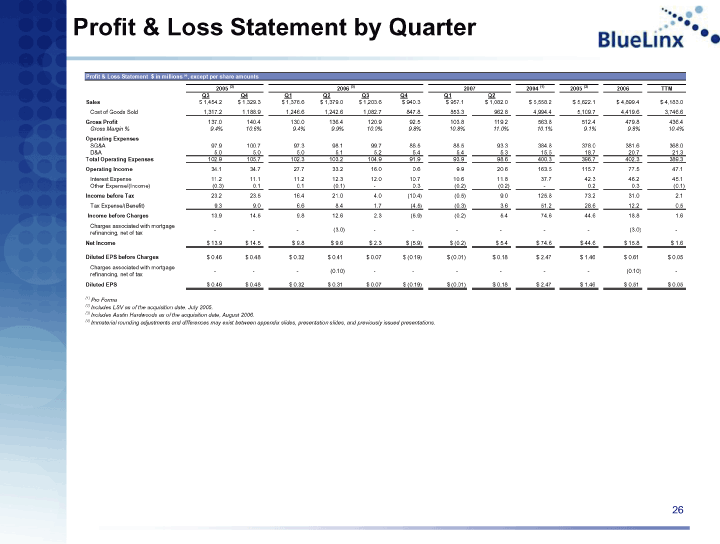
| Profit & Loss Statement by Quarter Profit & Loss Statement by Quarter |
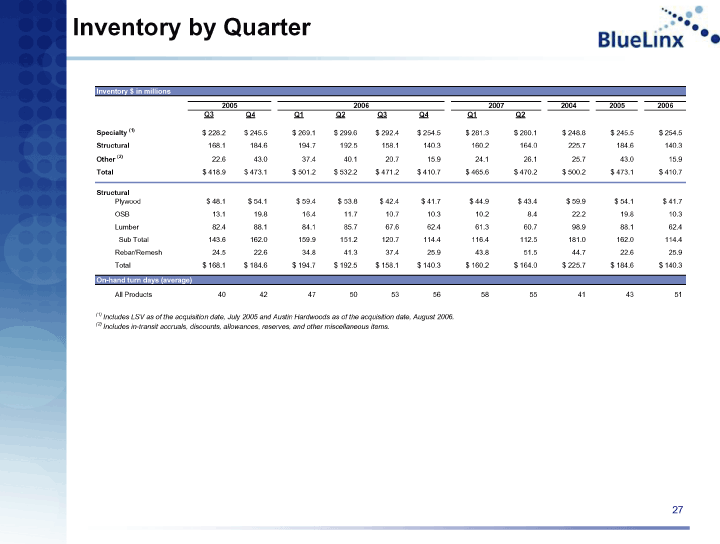
| Inventory by Quarter Inventory by Quarter |
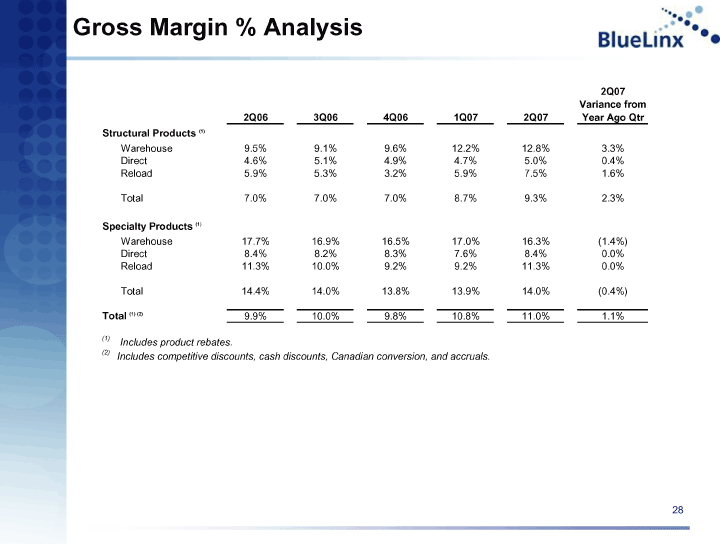
| Gross Margin % Analysis Gross Margin % Analysis |
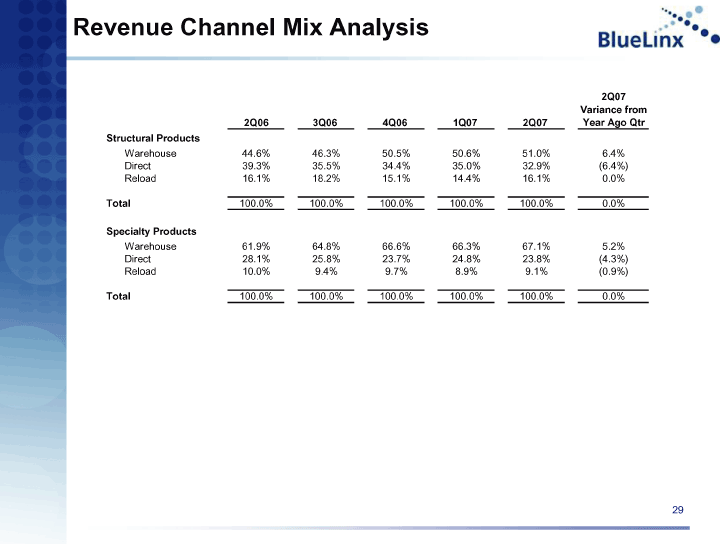
| Revenue Channel Mix Analysis Revenue Channel Mix Analysis |
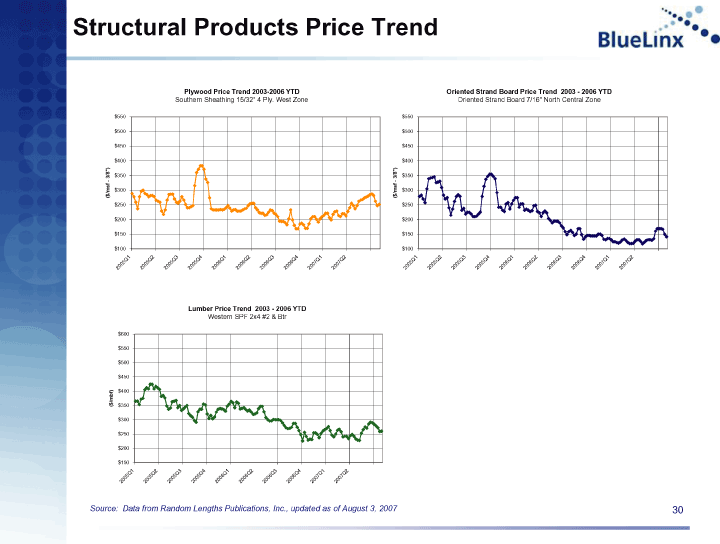
| Source: Data from Random Lengths Publications, Inc., updated as of August 3, 2007 Structural Products Price Trend Structural Products Price Trend Structural Products Price Trend Structural Products Price Trend |