Exhibit 99.2
 | BlueLinx Quarterly Review 1st Quarter 2013 |
 | BlueLinx Holdings Inc. Forward-Looking Statement Safe Harbor - This presentation includes “forward-looking statements” within the meaning of the Private Securities Litigation Reform Act of 1995. All of these forward-looking statements are based on estimates and assumptions made by our management that, although believed by us to be reasonable, are inherently uncertain. Forward-looking statements involve risks and uncertainties, including, but not limited to, economic, competitive, governmental and technological factors outside of our control, that may cause our business, strategy or actual results to differ materially from the forward-looking statements. These risks and uncertainties may include, among other things: changes in the supply and/or demand for products which we distribute, especially as a result of conditions in the residential housing market; general economic and business conditions in the United States; the activities of competitors; changes in significant operating expenses; changes in the availability of capital; the ability to identify acquisition opportunities and effectively and cost-efficiently integrate acquisitions; adverse weather patterns or conditions; acts of war or terrorist activities; variations in the performance of the financial markets; and other factors described in the “Risk Factors” section in our Annual Report on Form 10-K for the fiscal year ended December 29, 2012, and in our other periodic reports filed with the SEC. In addition, the statements in this presentation are made as of May 1, 2013. We undertake no obligation to update any of the forward-looking statements made herein, whether as a result of new information, future events, changes in expectation or otherwise. These forward-looking statements should not be relied upon as representing our views as of any date subsequent to May 1, 2013. Use of Non-GAAP and Adjusted Financial Information - To supplement GAAP financial information, we use adjusted measures of operating results which are non-GAAP measures. This non-GAAP adjusted financial information is provided as additional information for investors. These adjusted results exclude certain costs, expenses, gains and losses, and we believe their exclusion can enhance an overall understanding of our past financial performance and also our prospects for the future. These adjustments to our GAAP results are made with the intent of providing both management and investors a more complete understanding of our operating performance by excluding non-recurring, infrequent or other non-cash charges that are not believed to be material to the ongoing performance of our business. The presentation of this additional information is not meant to be considered in isolation or as a substitute for GAAP measures of net earnings, diluted earnings per share or net cash provided by (used in) operating activities prepared in accordance with generally accepted accounting principles in the United States. Slide 2 |
 | Opening Remarks George Judd Chief Executive Officer Slide 3 |
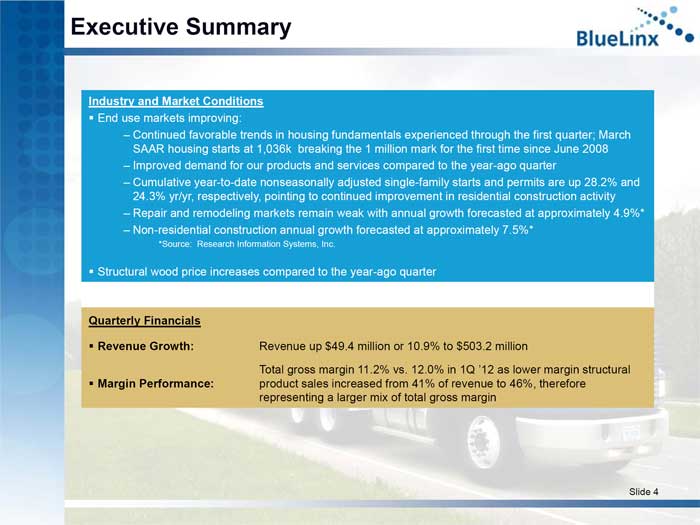 | Executive Summary Industry and Market Conditions End use markets improving: – Continued favorable trends in housing fundamentals experienced through the first quarter; March SAAR housing starts at 1,036k breaking the 1 million mark for the first time since June 2008 – Improved demand for our products and services compared to the year-ago quarter – Cumulative year-to-date nonseasonally adjusted single-family starts and permits are up 28.2% and 24.3% yr/yr, respectively, pointing to continued improvement in residential construction activity – Repair and remodeling markets remain weak with annual growth forecasted at approximately 4.9%* – Non-residential construction annual growth forecasted at approximately 7.5%* *Source: Research Information Systems, Inc. Structural wood price increases compared to the year-ago quarter Quarterly Financials Revenue Growth: Revenue up $49.4 million or 10.9% to $503.2 million Total gross margin 11.2% vs. 12.0% in 1Q ‘12 as lower margin structural Margin Performance: product sales increased from 41% of revenue to 46%, therefore representing a larger mix of total gross margin Slide 4 |
 | Quarterly Review Doug Goforth Chief Financial Officer and Treasurer Slide 5 |
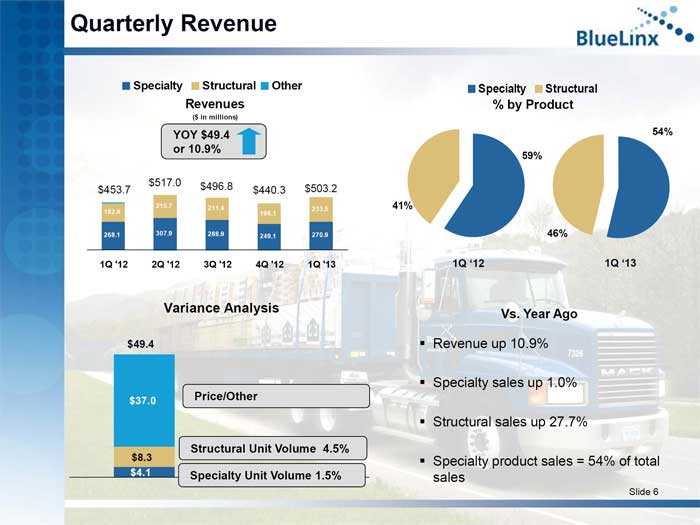 | Quarterly Revenue Specialty Structural Other Revenues ($ in millions) YOY $49.4 or 10.9% $517.0 $496.8 $453.7 $440.3 $503.2 215.7 211.4 182.9 233.5 196.1 268.1 307.9 288.9 249.1 270.9 1Q ‘12 2Q ‘12 3Q ‘12 4Q ‘12 1Q ‘13 Variance Analysis $49.4 $37.0 Price/Other Structural Unit Volume 4.5% $8.3 $4.1 Specialty Unit Volume 1.5% Specialty Structural % by Product 54% 59% 41% 46% 1Q ‘12 1Q ‘13 Vs. Year Ago Revenue up 10.9% Specialty sales up 1.0% Structural sales up 27.7% Specialty product sales = 54% of total sales Slide 6 |
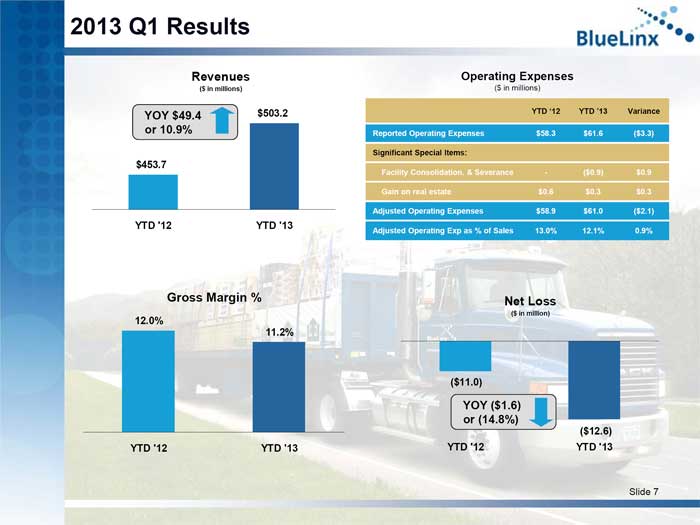 | 2013 Q1 Results Revenues ($ in millions) YOY $49.4 $503.2 or 10.9% $453.7 YTD ‘12 YTD ‘13 Gross Margin % 12.0% 11.2% YTD ‘12 YTD ‘13 Operating Expenses ($ in millions) YTD ‘12 YTD ‘13 Variance Reported Operating Expenses $58.3 $61.6 ($3.3) Significant Special Items: Facility Consolidation. & Severance - ($0.9) $0.9 Gain on real estate $0.6 $0.3 $0.3 Adjusted Operating Expenses $58.9 $61.0 ($2.1) Adjusted Operating Exp as % of Sales 13.0% 12.1% 0.9% Net Loss ($ in million) ($11.0) YOY ($1.6) or (14.8%) ($12.6) YTD ‘12 YTD ‘13 Slide 7 |
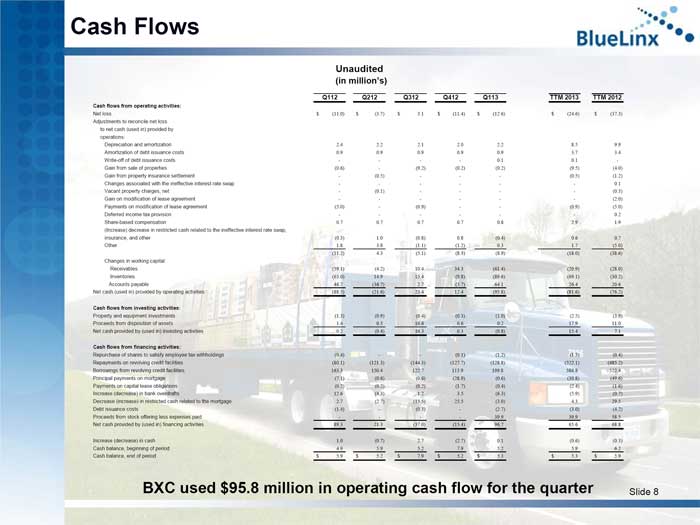 | Cash Flows Unaudited (in million’s) Q112 Q212 Q312 Q412 Q113 TTM 2013 TTM 2012 Cash flows from operating activities: Net loss $ (11.0) $ (3.7) $ 3.1 $ (11.4) $ (12.6) $ (24.6) $ (37.3) Adjustments to reconcile net loss to net cash (used in) provided by operations: Depreciation and amortization 2.4 2.2 2.1 2.0 2.2 8.5 9.9 Amortization of debt issuance costs 0.9 0.9 0.9 0.9 0.9 3.7 3.4 Write-off of debt issuance costs - - - - 0.1 0.1 - Gain from sale of properties (0.6) - (9.2) (0.2) (0.2) (9.5) (4.0) Gain from property insurance settlement - (0.5) - - - (0.5) (1.2) Changes associated with the ineffective interest rate swap - - - - - - 0.1 Vacant property charges, net - (0.1) - - - - (0.3) Gain on modification of lease agreement - - - - - - (2.0) Payments on modification of lease agreement (5.0) - (0.9) - - (0.9) (5.0) Deferred income tax provision - - - - - - 0.2 Share-based compensation 0.7 0.7 0.7 0.7 0.8 2.9 1.9 (Increase) decrease in restricted cash related to the ineffective interest rate swap, insurance, and other (0.3) 1.0 (0.8) 0.8 (0.4) 0.6 0.7 Other 1.8 3.8 (1.1) (1.2) 0.3 1.7 (5.0) (11.2) 4.3 (5.1) (8.3) (8.9) (18.0) (38.6) Changes in working capital: Receivables (59.1) (4.2) 10.4 34.3 (61.4) (20.9) (28.0) Inventories (65.0) 14.9 15.4 (9.8) (89.6) (69.1) (30.2) Accounts payable 46.7 (36.7) 2.7 (3.7) 64.1 26.4 20.6 Net cash (used in) provided by operating activities (88.5) (21.6) 23.4 12.4 (95.8) (81.6) (76.2) Cash flows from investing activities: Property and equipment investments (1.3) (0.9) (0.4) (0.3) (1.0) (2.5) (3.9) Proceeds from disposition of assets 1.4 0.5 16.6 0.6 0.2 17.9 11.0 Net cash provided by (used in) investing activities 0.2 (0.4) 16.3 0.3 (0.8) 15.4 7.1 Cash flows from financing activities: Repurchase of shares to satisfy employee tax withholdings (0.4) - - (0.1) (1.2) (1.3) (0.4) Repayments on revolving credit facilities (80.1) (121.3) (144.3) (127.7) (128.8) (522.1) (485.2) Borrowings from revolving credit facilities 163.3 150.4 122.7 113.9 199.8 586.8 522.4 Principal payments on mortgage (7.1) (0.6) (0.6) (28.9) (0.6) (30.8) (49.6) Payments on capital lease obligations (0.2) (0.2) (0.2) (1.7) (0.4) (2.4) (1.6) Increase (decrease) in bank overdrafts 12.6 (4.3) 1.2 3.5 (6.3) (5.9) (0.7) Decrease (increase) in restricted cash related to the mortgage 2.7 (2.7) (15.5) 25.5 (3.0) 4.3 29.5 Debt issuance costs (1.4) - (0.3) - (2.7) (3.0) (4.2) Proceeds from stock offering less expenses paid - - - - 39.9 39.9 58.5 Net cash provided by (used in) financing activities 89.3 21.3 (37.0) (15.4) 96.7 65.6 68.8 Increase (decrease) in cash 1.0 (0.7) 2.7 (2.7) 0.1 (0.6) (0.3) Cash balance, beginning of period 4.9 5.9 5.2 7.9 5.2 5.9 6.2 Cash balance, end of period $ 5.9 $ 5.2 $ 7.9 $ 5.2 $ 5.3 $ 5.3 $ 5.9 BXC used $95.8 million in operating cash flow for the quarter Slide 8 |
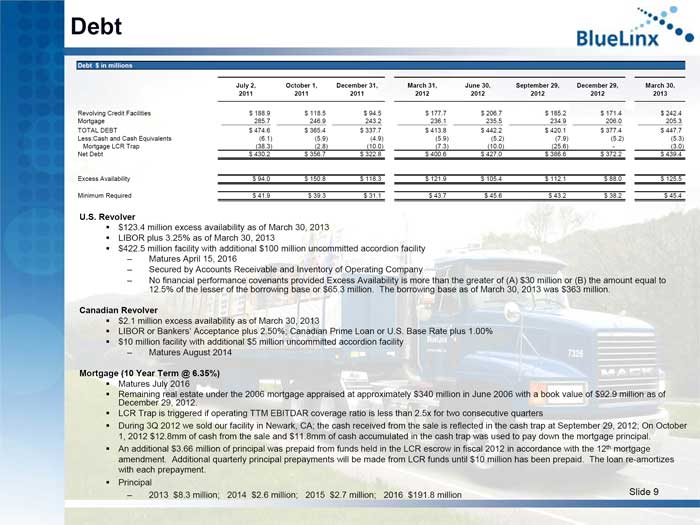 | Debt Debt $ in millions July 2, October 1, December 31, March 31, June 30, September 29, December 29, March 30, 2011 2011 2011 2012 2012 2012 2012 2013 Revolving Credit Facilities $ 188.9 $ 118.5 $ 94.5 $ 177.7 $ 206.7 $ 185.2 $ 171.4 $ 242.4 Mortgage 285.7 246.9 243.2 236.1 235.5 234.9 206.0 205.3 TOTAL DEBT $ 474.6 $ 365.4 $ 337.7 $ 413.8 $ 442.2 $ 420.1 $ 377.4 $ 447.7 Less:Cash and Cash Equivalents (6.1) (5.9) (4.9) (5.9) (5.2) (7.9) (5.2) (5.3) Mortgage LCR Trap (38.3) (2.8) (10.0) (7.3) (10.0) (25.6) - (3.0) Net Debt $ 430.2 $ 356.7 $ 322.8 $ 400.6 $ 427.0 $ 386.6 $ 372.2 $ 439.4 Excess Availability $ 94.0 $ 150.8 $ 118.3 $ 121.9 $ 105.4 $ 112.1 $ 88.0 $ 125.5 Minimum Required $ 41.9 $ 39.3 $ 31.1 $ 43.7 $ 45.6 $ 43.2 $ 38.2 $ 45.4 U.S. Revolver $123.4 million excess availability as of March 30, 2013 LIBOR plus 3.25% as of March 30, 2013 $422.5 million facility with additional $100 million uncommitted accordion facility – Matures April 15, 2016 – Secured by Accounts Receivable and Inventory of Operating Company – No financial performance covenants provided Excess Availability is more than the greater of (A) $30 million or (B) the amount equal to 12.5% of the lesser of the borrowing base or $65.3 million. The borrowing base as of March 30, 2013 was $363 million. Canadian Revolver $2.1 million excess availability as of March 30, 2013 LIBOR or Bankers’ Acceptance plus 2.50%; Canadian Prime Loan or U.S. Base Rate plus 1.00% $10 million facility with additional $5 million uncommitted accordion facility – Matures August 2014 Mortgage (10 Year Term @ 6.35%) Matures July 2016 Remaining real estate under the 2006 mortgage appraised at approximately $340 million in June 2006 with a book value of $92.9 million as of December 29, 2012. LCR Trap is triggered if operating TTM EBITDAR coverage ratio is less than 2.5x for two consecutive quarters During 3Q 2012 we sold our facility in Newark, CA; the cash received from the sale is reflected in the cash trap at September 29, 2012; On October 1, 2012 $12.8mm of cash from the sale and $11.8mm of cash accumulated in the cash trap was used to pay down the mortgage principal. An additional $3.66 million of principal was prepaid from funds held in the LCR escrow in fiscal 2012 in accordance with the 12th mortgage amendment. Additional quarterly principal prepayments will be made from LCR funds until $10 million has been prepaid. The loan re-amortizes with each prepayment. Principal – 2013 $8.3 million; 2014 $2.6 million; 2015 $2.7 million; 2016 $191.8 million Slide 9 |
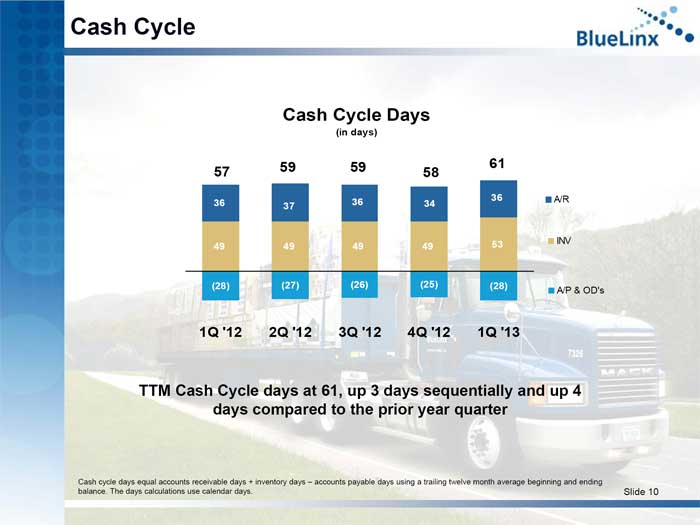 | Cash Cycle Cash Cycle Days (in days) 59 59 61 57 58 36 36 A/R 36 37 34 53 INV 49 49 49 49 0 (28) (27) (26) (25) (28) A/P & OD’s 1Q ‘12 2Q ‘12 3Q ‘12 4Q ‘12 1Q ‘13 TTM Cash Cycle days at 61, up 3 days sequentially and up 4 days compared to the prior year quarter Cash cycle days equal accounts receivable days + inventory days – accounts payable days using a trailing twelve month average beginning and ending balance. The days calculations use calendar days. Slide 10 |
 | George Judd Chief Executive Officer Slide 11 |
 | Closing Remarks 2013 focus: – Revenue growth – Operating discipline – Customer care Long term strategic objectives: – Profitably grow specialty revenues to 60+% of total sales – Profitably manage structural products – Profitably outgrow the market over the long term – Expand product lines – Increase share of multi-family and commercial construction Slide 12 |
 | Appendix TOPIC PAGE Profit and Loss Statement by Quarter 14 Revenues by Quarter 15 Channel Mix Analysis 16 Unit Volume by Quarter 17 Gross Margin by Quarter 18 Operating Expense by Quarter 19 Structural Product Price Trends 20 Reconciliation of GAAP Debt to Non-GAAP Net Debt 21 Reconciliation of GAAP Net cash used in operating activities to Non-GAAP EBITDA 22 Slide 13 |
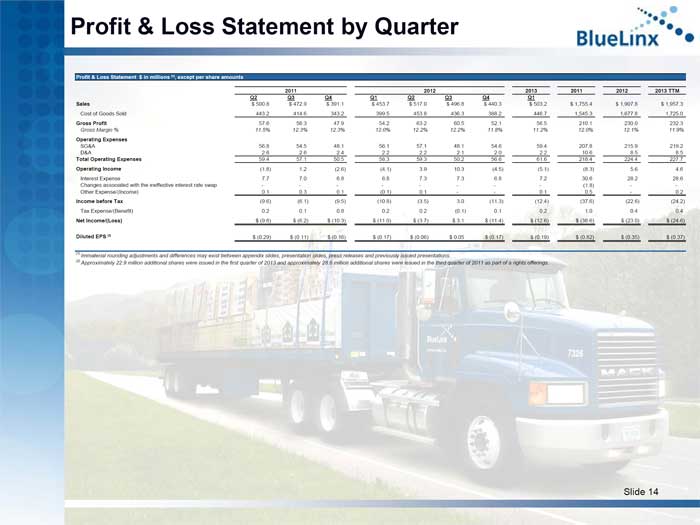 | Profit & Loss Statement by Quarter Profit & Loss Statement $ in millions (1), except per share amounts 2011 2012 2013 2011 2012 2013 TTM Q2 Q3 Q4 Q1 Q2 Q3 Q4 Q1 Sales $ 500.8 $ 472.9 $ 391.1 $ 453.7 $ 517.0 $ 496.8 $ 440.3 $ 503.2 $ 1,755.4 $ 1,907.8 $ 1,957.3 Cost of Goods Sold 443.2 414.6 343.2 399.5 453.8 436.3 388.2 446.7 1,545.3 1,677.8 1,725.0 Gross Profit 57.6 58.3 47.9 54.2 63.2 60.5 52.1 56.5 210.1 230.0 232.3 Gross Margin % 11.5% 12.3% 12.3% 12.0% 12.2% 12.2% 11.8% 11.2% 12.0% 12.1% 11.9% Operating Expenses SG&A 56.8 54.5 48.1 56.1 57.1 48.1 54.6 59.4 207.8 215.9 219.2 D&A 2.6 2.6 2.4 2.2 2.2 2.1 2.0 2.2 10.6 8.5 8.5 Total Operating Expenses 59.4 57.1 50.5 58.3 59.3 50.2 56.6 61.6 218.4 224.4 227.7 Operating Income (1.8) 1.2 (2.6) (4.1) 3.9 10.3 (4.5) (5.1) (8.3) 5.6 4.6 Interest Expense 7.7 7.0 6.8 6.8 7.3 7.3 6.8 7.2 30.6 28.2 28.6 Changes associated with the ineffective interest rate swap - - - - - - - - (1.8) - - Other Expense/(Income) 0.1 0.3 0.1 (0.1) 0.1 - - 0.1 0.5 - 0.2 Income before Tax (9.6) (6.1) (9.5) (10.8) (3.5) 3.0 (11.3) (12.4) (37.6) (22.6) (24.2) Tax Expense/(Benefit) 0.2 0.1 0.8 0.2 0.2 (0.1) 0.1 0.2 1.0 0.4 0.4 Net Income/(Loss) $ (9.8) $ (6.2) $ (10.3) $ (11.0) $ (3.7) $ 3.1 $ (11.4) $ (12.6) $ (38.6) $ (23.0) $ (24.6) Diluted EPS (2) $ (0.29) $ (0.11) $ (0.16) $ (0.17) $ (0.06) $ 0.05 $ (0.17) $ (0.19) $ (0.82) $ (0.35) $ (0.37) (1) Immaterial rounding adjustments and differences may exist between appendix slides, presentation slides, press releases and previously issued presentations. (2) Approximately 22.9 million additional shares were issued in the first quarter of 2013 and approximately 28.6 million additional shares were issued in the third quarter of 2011 as part of a rights offerings. Slide 14 |
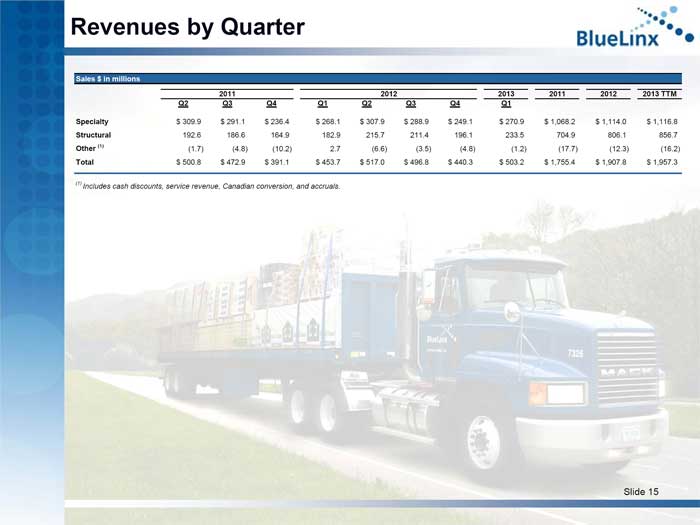 | Revenues by Quarter Sales $ in millions 2011 2012 2013 2011 2012 2013 TTM Q2 Q3 Q4 Q1 Q2 Q3 Q4 Q1 Specialty $ 309.9 $ 291.1 $ 236.4 $ 268.1 $ 307.9 $ 288.9 $ 249.1 $ 270.9 $ 1,068.2 $ 1,114.0 $ 1,116.8 Structural 192.6 186.6 164.9 182.9 215.7 211.4 196.1 233.5 704.9 806.1 856.7 Other (1) (1.7) (4.8) (10.2) 2.7 (6.6) (3.5) (4.8) (1.2) (17.7) (12.3) (16.2) Total $ 500.8 $ 472.9 $ 391.1 $ 453.7 $ 517.0 $ 496.8 $ 440.3 $ 503.2 $ 1,755.4 $ 1,907.8 $ 1,957.3 (1) Includes cash discounts, service revenue, Canadian conversion, and accruals. Slide 15 |
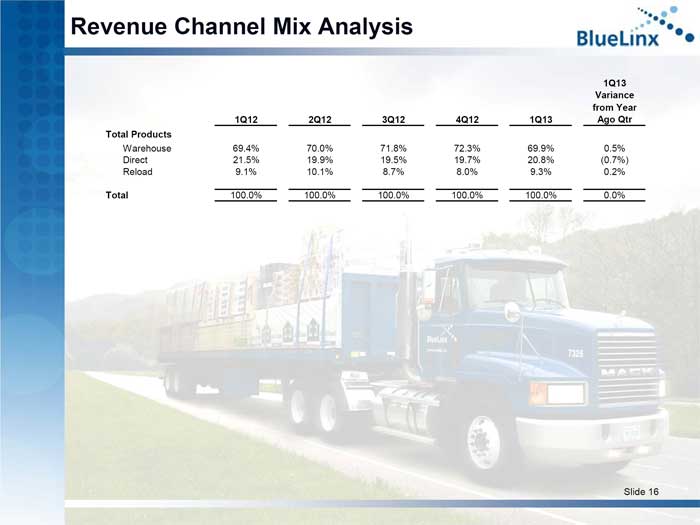 | Revenue Channel Mix Analysis 1Q13 Variance from Year 1Q12 2Q12 3Q12 4Q12 1Q13 Ago Qtr Total Products Warehouse 69.4% 70.0% 71.8% 72.3% 69.9% 0.5% Direct 21.5% 19.9% 19.5% 19.7% 20.8% (0.7%) Reload 9.1% 10.1% 8.7% 8.0% 9.3% 0.2% Total 100.0% 100.0% 100.0% 100.0% 100.0% 0.0% Slide 16 |
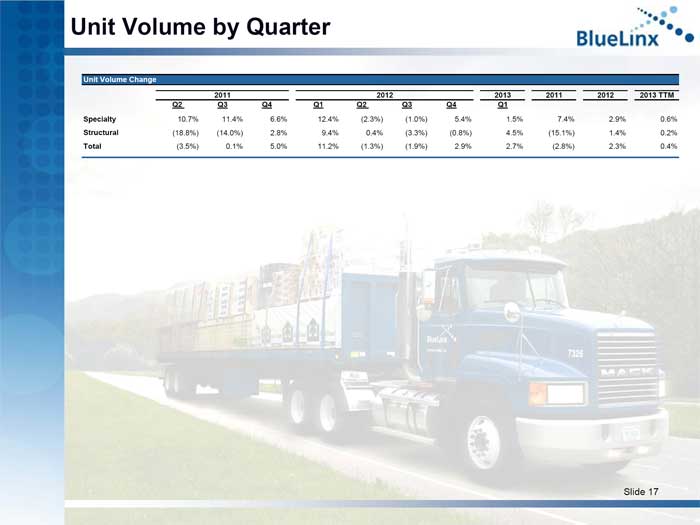 | Unit Volume by Quarter Unit Volume Change 2011 2012 2013 2011 2012 2013 TTM Q2 Q3 Q4 Q1 Q2 Q3 Q4 Q1 Specialty 10.7% 11.4% 6.6% 12.4% (2.3%) (1.0%) 5.4% 1.5% 7.4% 2.9% 0.6% Structural (18.8%) (14.0%) 2.8% 9.4% 0.4% (3.3%) (0.8%) 4.5% (15.1%) 1.4% 0.2% Total (3.5%) 0.1% 5.0% 11.2% (1.3%) (1.9%) 2.9% 2.7% (2.8%) 2.3% 0.4% Slide 17 |
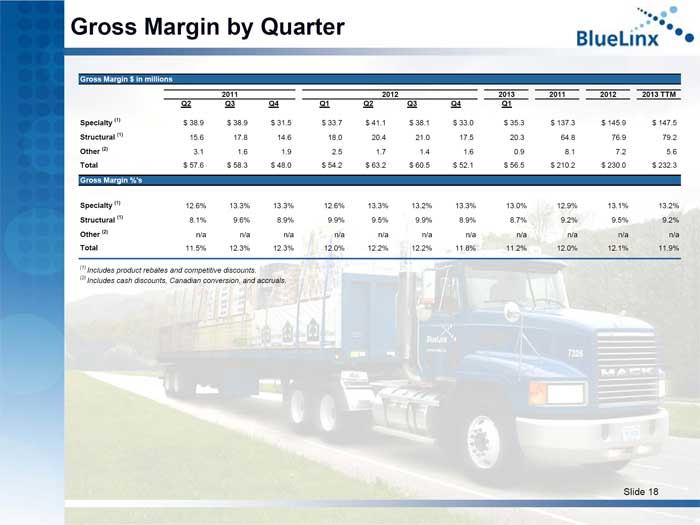 | Gross Margin by Quarter Gross Margin $ in millions 2011 2012 2013 2011 2012 2013 TTM Q2 Q3 Q4 Q1 Q2 Q3 Q4 Q1 Specialty (1) $ 38.9 $ 38.9 $ 31.5 $ 33.7 $ 41.1 $ 38.1 $ 33.0 $ 35.3 $ 137.3 $ 145.9 $ 147.5 Structural (1) 15.6 17.8 14.6 18.0 20.4 21.0 17.5 20.3 64.8 76.9 79.2 Other (2) 3.1 1.6 1.9 2.5 1.7 1.4 1.6 0.9 8.1 7.2 5.6 Total $ 57.6 $ 58.3 $ 48.0 $ 54.2 $ 63.2 $ 60.5 $ 52.1 $ 56.5 $ 210.2 $ 230.0 $ 232.3 Gross Margin %’s Specialty (1) 12.6% 13.3% 13.3% 12.6% 13.3% 13.2% 13.3% 13.0% 12.9% 13.1% 13.2% Structural (1) 8.1% 9.6% 8.9% 9.9% 9.5% 9.9% 8.9% 8.7% 9.2% 9.5% 9.2% Other (2) n/a n/a n/a n/a n/a n/a n/a n/a n/a n/a n/a Total 11.5% 12.3% 12.3% 12.0% 12.2% 12.2% 11.8% 11.2% 12.0% 12.1% 11.9% (1) Includes product rebates and competitive discounts. (2) Includes cash discounts, Canadian conversion, and accruals. Slide 18 |
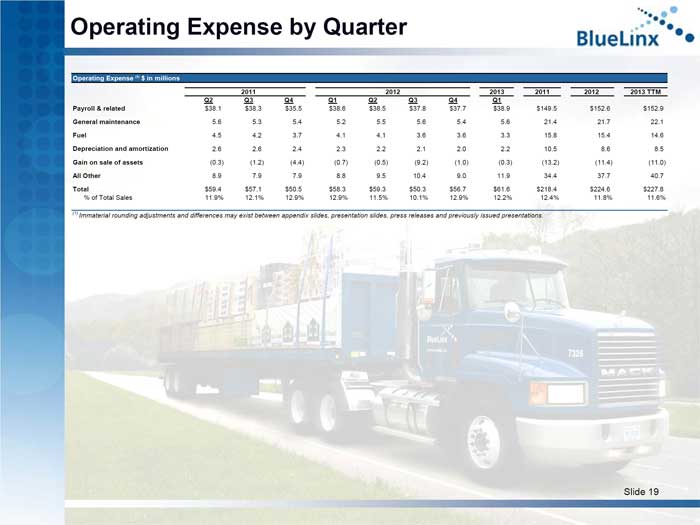 | Operating Expense by Quarter Operating Expense (1) $ in millions 2011 2012 2013 2011 2012 2013 TTM Q2 Q3 Q4 Q1 Q2 Q3 Q4 Q1 Payroll & related $38.1 $38.3 $35.5 $38.6 $38.5 $37.8 $37.7 $38.9 $149.5 $152.6 $152.9 General maintenance 5.6 5.3 5.4 5.2 5.5 5.6 5.4 5.6 21.4 21.7 22.1 Fuel 4.5 4.2 3.7 4.1 4.1 3.6 3.6 3.3 15.8 15.4 14.6 Depreciation and amortization 2.6 2.6 2.4 2.3 2.2 2.1 2.0 2.2 10.5 8.6 8.5 Gain on sale of assets (0.3) (1.2) (4.4) (0.7) (0.5) (9.2) (1.0) (0.3) (13.2) (11.4) (11.0) All Other 8.9 7.9 7.9 8.8 9.5 10.4 9.0 11.9 34.4 37.7 40.7 Total $59.4 $57.1 $50.5 $58.3 $59.3 $50.3 $56.7 $61.6 $218.4 $224.6 $227.8 % of Total Sales 11.9% 12.1% 12.9% 12.9% 11.5% 10.1% 12.9% 12.2% 12.4% 11.8% 11.6% (1) Immaterial rounding adjustments and differences may exist between appendix slides, presentation slides, press releases and previously issued presentations. Slide 19 |
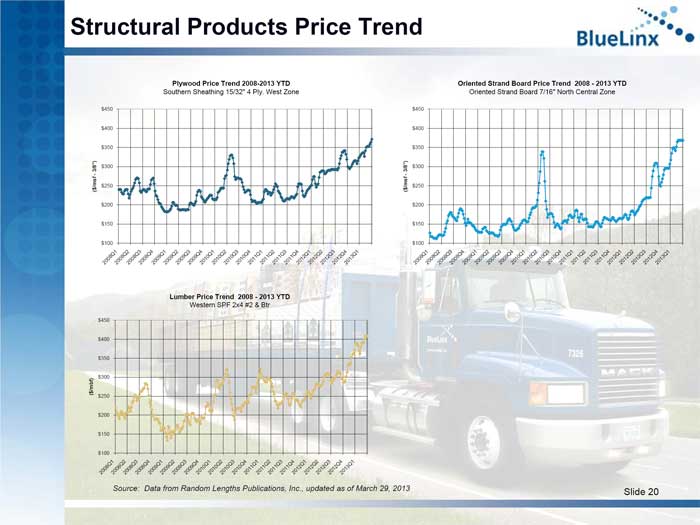 | Structural Products Price Trend Plywood Price Trend 2008-2013 YTD Southern Sheathing 15/32” 4 Ply. West Zone Lumber Price Trend 2008 - 2013 YTD Western SPF 2x4 #2 & Btr Oriented Strand Board Price Trend 2008 - 2013 YTD Oriented Strand Board 7/16” North Central Zone Source: Data from Random Lengths Publications, Inc., updated as of March 29, 2013 Slide 20 |
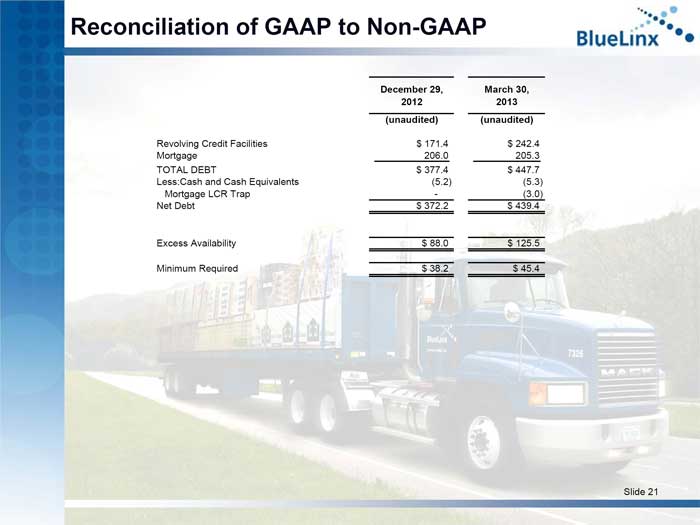 | Reconciliation of GAAP to Non-GAAP December 29, March 30, 2012 2013 (unaudited) (unaudited) Revolving Credit Facilities $ 171.4 $ 242.4 Mortgage 206.0 205.3 TOTAL DEBT $ 377.4 $ 447.7 Less:Cash and Cash Equivalents (5.2) (5.3) Mortgage LCR Trap - (3.0) Net Debt $ 372.2 $ 439.4 Excess Availability $ 88.0 $ 125.5 Minimum Required $ 38.2 $ 45.4 Slide 21 |
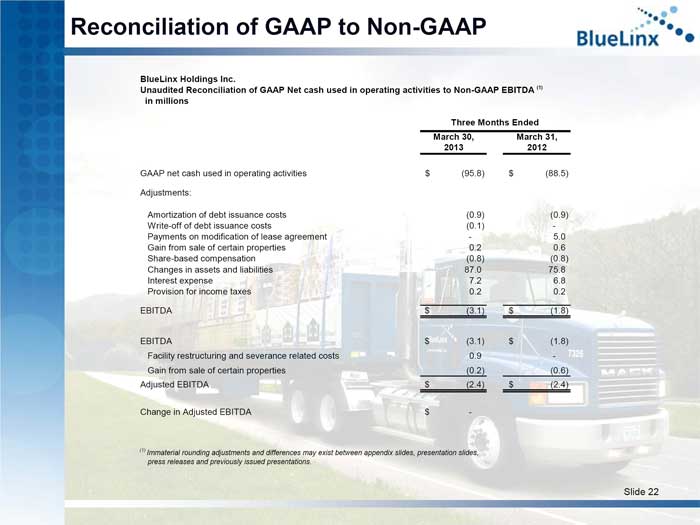 | Reconciliation of GAAP to Non-GAAP BlueLinx Holdings Inc. Unaudited Reconciliation of GAAP Net cash used in operating activities to Non-GAAP EBITDA (1) in millions Three Months Ended March 30, March 31, 2013 2012 GAAP net cash used in operating activities $ (95.8) $ (88.5) Adjustments: Amortization of debt issuance costs (0.9) (0.9) Write-off of debt issuance costs (0.1) - Payments on modification of lease agreement - 5.0 Gain from sale of certain properties 0.2 0.6 Share-based compensation (0.8) (0.8) Changes in assets and liabilities 87.0 75.8 Interest expense 7.2 6.8 Provision for income taxes 0.2 0.2 EBITDA $ (3.1) $ (1.8) EBITDA $ (3.1) $ (1.8) Facility restructuring and severance related costs 0.9 - Gain from sale of certain properties (0.2) (0.6) Adjusted EBITDA $ (2.4) $ (2.4) Change in Adjusted EBITDA $ - (1) Immaterial rounding adjustments and differences may exist between appendix slides, presentation slides, press releases and previously issued presentations. Slide 22 |
 | www.BlueLinxco.com |