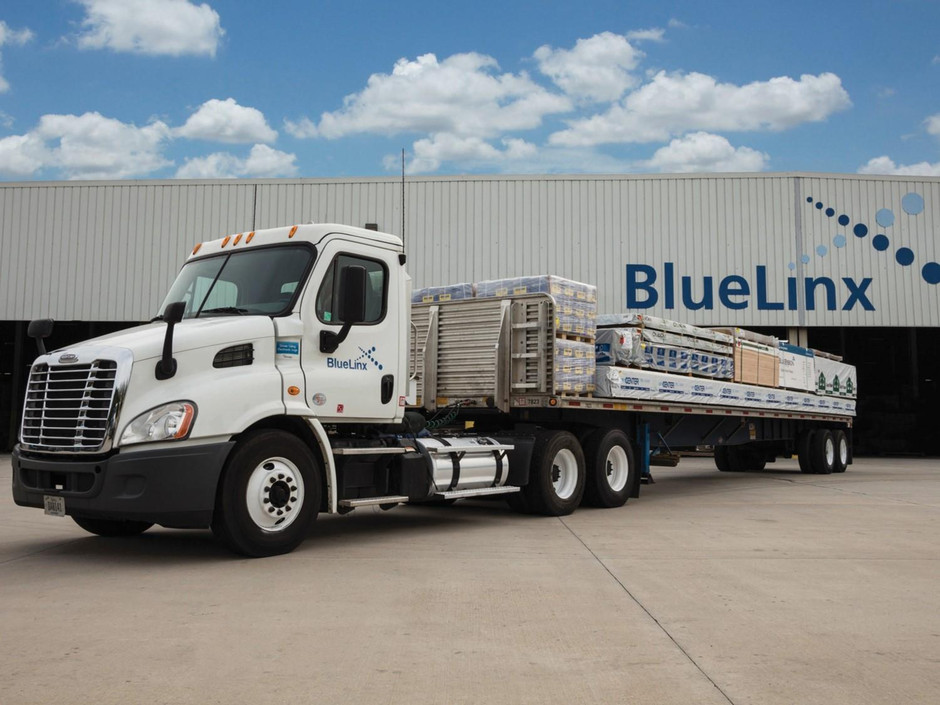
BlueLinx Quarterly Review First Quarter 2016
2 Forward-Looking Statement Safe Harbor - This presentation includes "forward-looking statements" within the meaning of the Private Securities Litigation Reform Act of 1995. All of these forward-looking statements are based on estimates and assumptions made by our management that, although believed by us to be reasonable, are inherently uncertain. Forward-looking statements involve risks and uncertainties, including, but not limited to, economic, competitive, governmental and technological factors outside of our control, that may cause our business, strategy or actual results to differ materially from the forward-looking statements. These risks and uncertainties may include, among other things: changes in the prices, supply, and/or demand for products which we distribute; general economic and business conditions in the United States; the activities of competitors; changes in significant operating expenses; changes in the availability of capital and interest rates; adverse weather patterns or conditions; acts of cyber intrusion; variations in the performance of the financial markets, including the credit markets; and other factors described in the "Risk Factors" section in our Annual Report on Form 10-K for the fiscal year ended January 2, 2016, and in our other periodic reports filed with the SEC. In addition, the statements in this presentation are made as of May 12, 2016. We undertake no obligation to update any of the forward-looking statements made herein, whether as a result of new information, future events, changes in expectation or otherwise. These forward-looking statements should not be relied upon as representing our views as of any date subsequent to May 12, 2016. Use of Non-GAAP and Adjusted Financial Information - The Company reports its financial results in accordance with accounting principles generally accepted in the U.S. (“GAAP”). The Company also believes that presentation of certain non-GAAP measures may be useful to investors. Any non-GAAP measures used herein are reconciled to the most relevant GAAP presentation. The Company cautions that non-GAAP measures should be considered in addition to, but not as a substitute for, the Company’s reported GAAP results. Immaterial Rounding Differences - Immaterial rounding adjustments and differences may exist between slides, press releases, and previously issued presentations. BlueLinx Holdings Inc.
3 Susan O’Farrell Chief Financial Officer and Treasurer
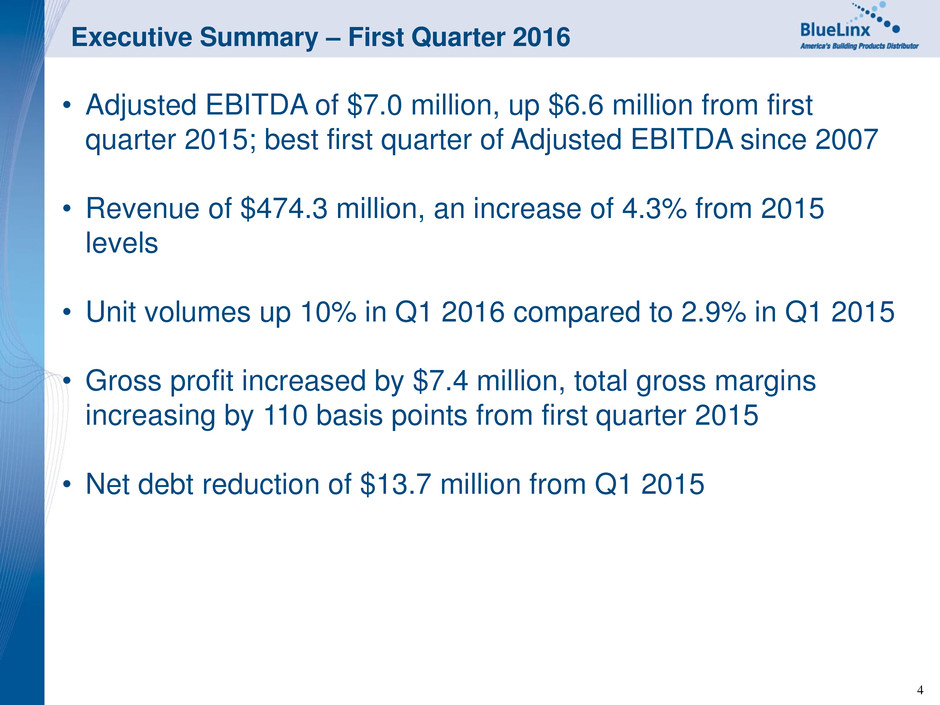
4 Executive Summary – First Quarter 2016 • Adjusted EBITDA of $7.0 million, up $6.6 million from first quarter 2015; best first quarter of Adjusted EBITDA since 2007 • Revenue of $474.3 million, an increase of 4.3% from 2015 levels • Unit volumes up 10% in Q1 2016 compared to 2.9% in Q1 2015 • Gross profit increased by $7.4 million, total gross margins increasing by 110 basis points from first quarter 2015 • Net debt reduction of $13.7 million from Q1 2015
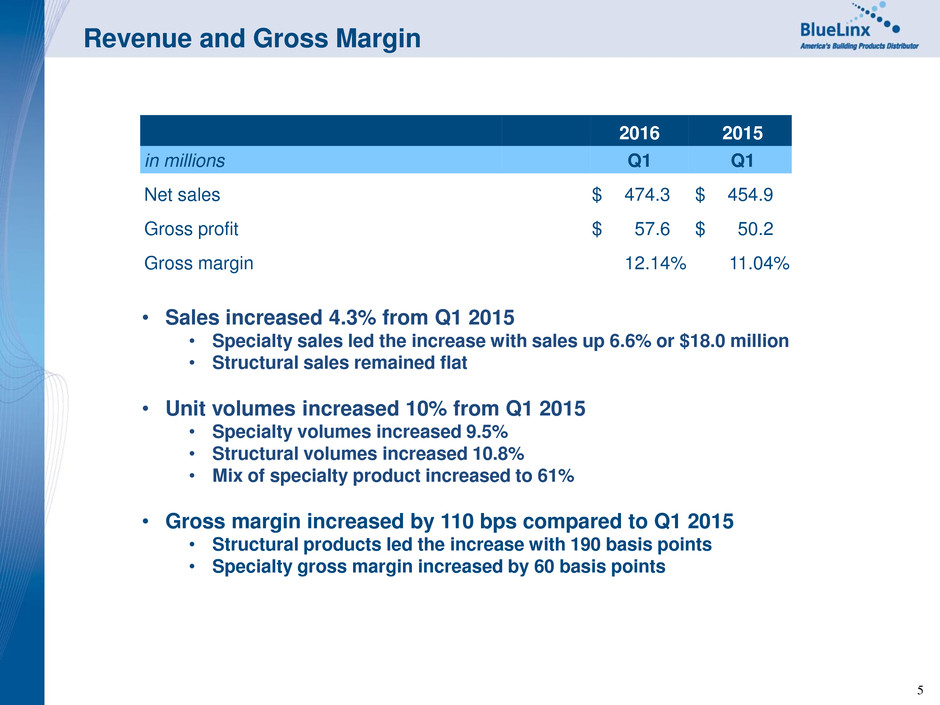
5 2016 2015 in millions Q1 Q1 Net sales $ 474.3 $ 454.9 Gross profit $ 57.6 $ 50.2 Gross margin 12.14 % 11.04 % Revenue and Gross Margin • Sales increased 4.3% from Q1 2015 • Specialty sales led the increase with sales up 6.6% or $18.0 million • Structural sales remained flat • Unit volumes increased 10% from Q1 2015 • Specialty volumes increased 9.5% • Structural volumes increased 10.8% • Mix of specialty product increased to 61% • Gross margin increased by 110 bps compared to Q1 2015 • Structural products led the increase with 190 basis points • Specialty gross margin increased by 60 basis points

6 2016 2015 Q1 Q1 Selling, general, and administrative $ 54.8 $ 50.0 Depreciation and amortization 2.5 2.3 Total operating expenses $ 57.3 $ 52.3 Operating Expenses • Selling, General & Administrative expenses up by $4.8 million for the quarter primarily in direct sales related incentives and refinancing expenses • When excluding the refinancing charges, operating expenses remained comparable year-over-year, even with increased sales volume
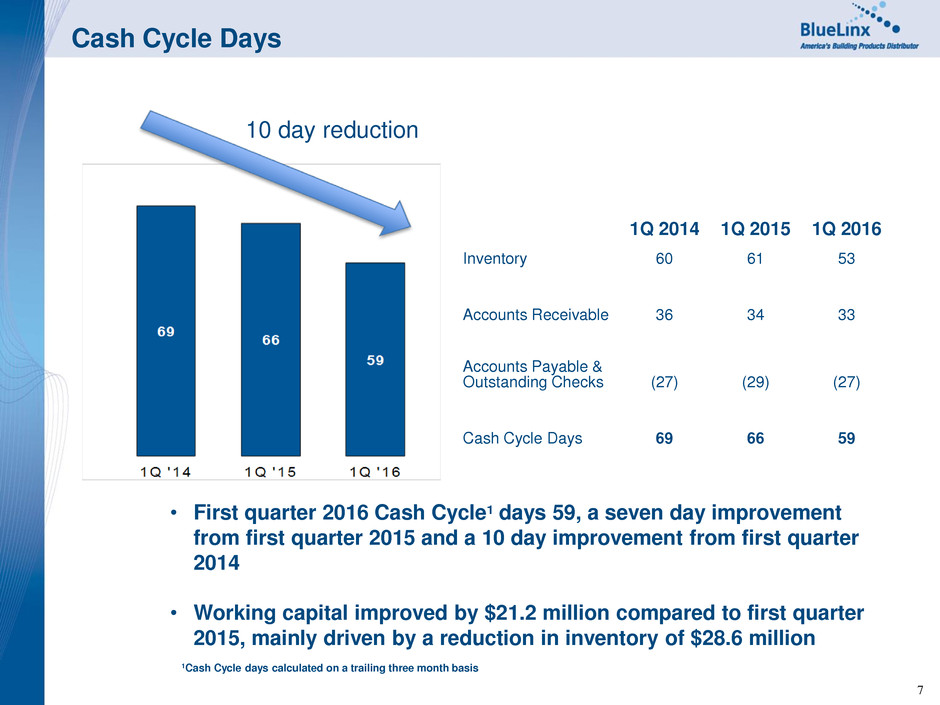
7 Cash Cycle Days 10 day reduction • First quarter 2016 Cash Cycle1 days 59, a seven day improvement from first quarter 2015 and a 10 day improvement from first quarter 2014 • Working capital improved by $21.2 million compared to first quarter 2015, mainly driven by a reduction in inventory of $28.6 million 1Cash Cycle days calculated on a trailing three month basis 1Q 2014 1Q 2015 1Q 2016 Inventory 60 61 53 Accounts Receivable 36 34 33 Accounts Payable & Outstanding Checks (27) (29) (27) Cash Cycle Days 69 66 59
8 Mitch Lewis Chief Executive Officer
9 Key Emphasis • Focus on facility and real estate monetization • Improve inventory management and planning, including strategic product assortment • Continue margin enhancement activities • Capitalize on current market conditions • Emphasize local customer interaction to enhance market share Key Emphasis for BlueLinx
10 TOPIC PAGE Statements of Operations 11 Adjusted EBITDA 12 Net Debt 13 Gross Profit and Margin 14 Appendix
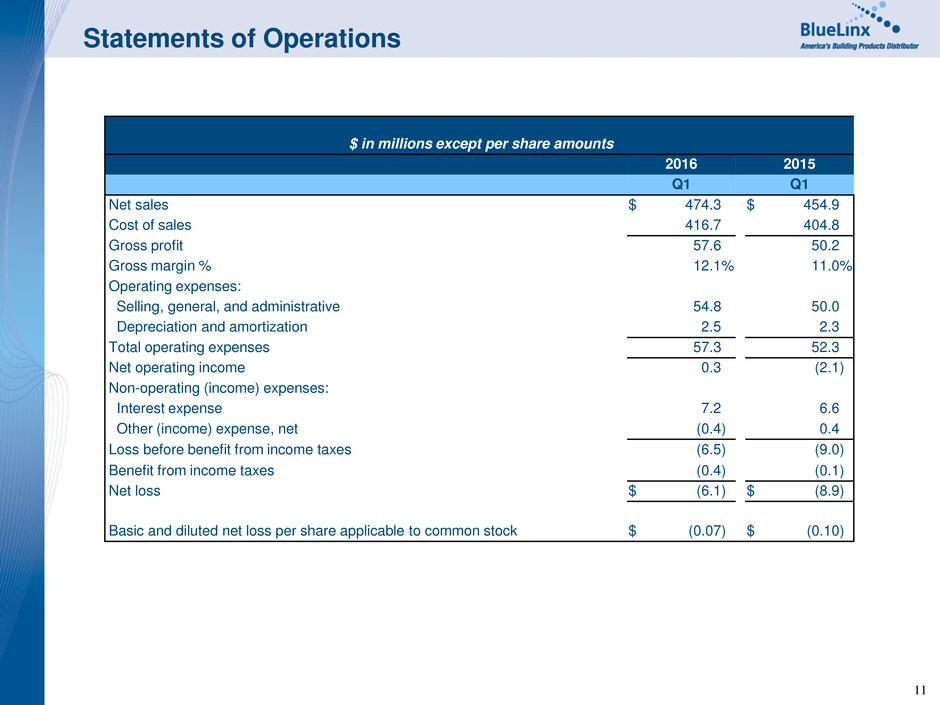
11 Statements of Operations $ in millions except per share amounts 2016 2015 Q1 Q1 Net sales $ 474.3 $ 454.9 Cost of sales 416.7 404.8 Gross profit 57.6 50.2 Gross margin % 12.1 % 11.0 % Operating expenses: Selling, general, and administrative 54.8 50.0 Depreciation and amortization 2.5 2.3 Total operating expenses 57.3 52.3 Net operating income 0.3 (2.1 ) Non-operating (income) expenses: Interest expense 7.2 6.6 Other (income) expense, net (0.4 ) 0.4 Loss before benefit from income taxes (6.5 ) (9.0 ) Benefit from income taxes (0.4 ) (0.1 ) Net loss $ (6.1 ) $ (8.9 ) Basic and diluted net loss per share applicable to common stock $ (0.07 ) $ (0.10 )
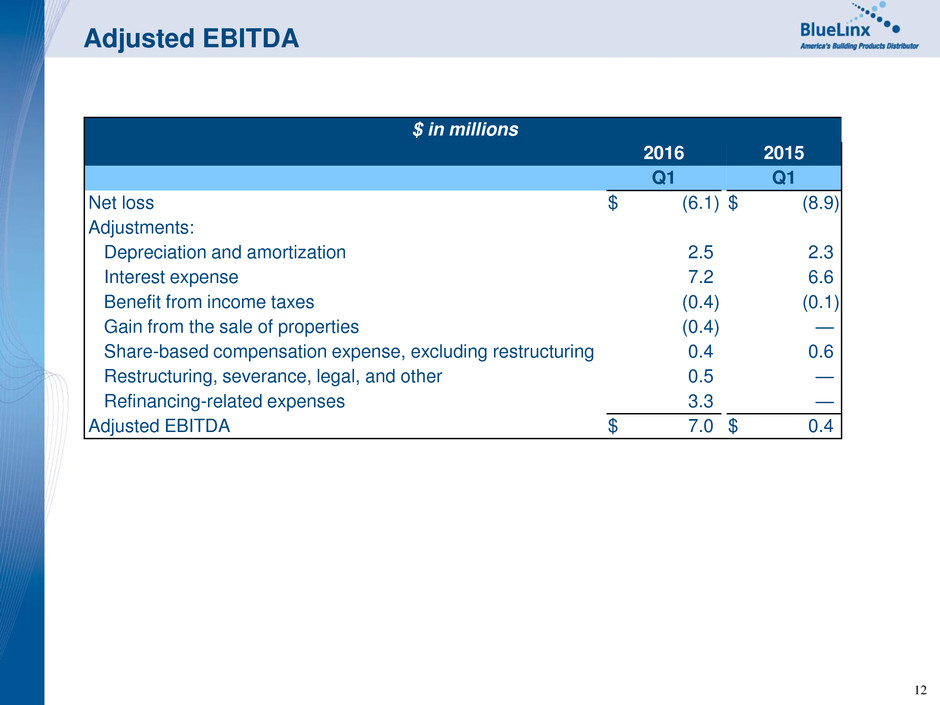
12 Adjusted EBITDA $ in millions 2016 2015 Q1 Q1 Net loss $ (6.1 ) $ (8.9 ) Adjustments: Depreciation and amortization 2.5 2.3 Interest expense 7.2 6.6 Benefit from income taxes (0.4 ) (0.1 ) Gain from the sale of properties (0.4 ) — Share-based compensation expense, excluding restructuring 0.4 0.6 Restructuring, severance, legal, and other 0.5 — Refinancing-related expenses 3.3 — Adjusted EBITDA $ 7.0 $ 0.4
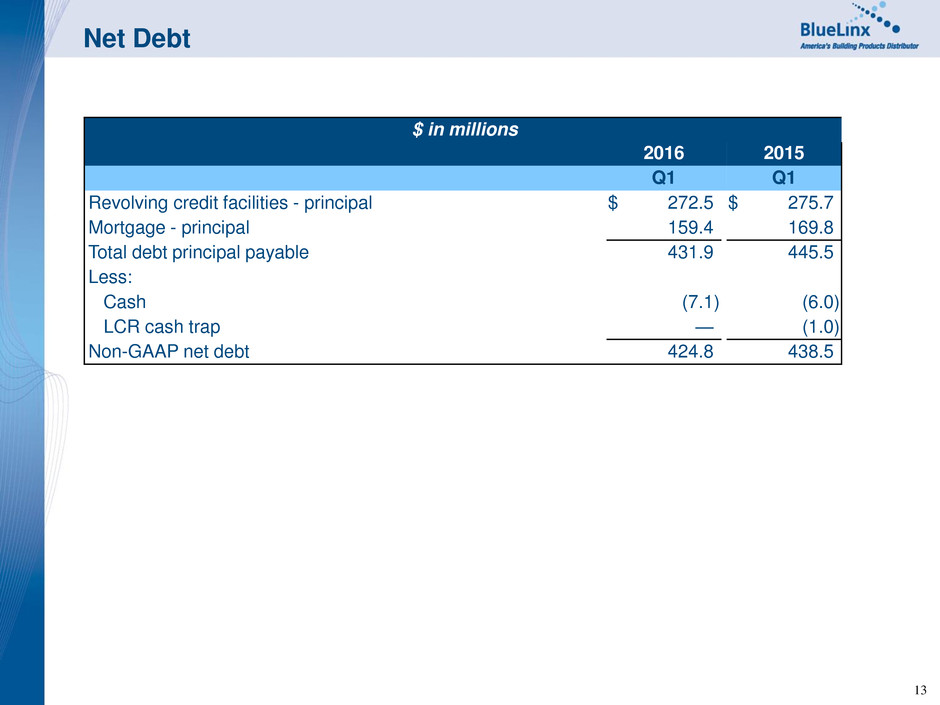
13 Net Debt $ in millions 2016 2015 Q1 Q1 Revolving credit facilities - principal $ 272.5 $ 275.7 Mortgage - principal 159.4 169.8 Total debt principal payable 431.9 445.5 Less: Cash (7.1 ) (6.0 ) LCR cash trap — (1.0 ) Non-GAAP net debt 424.8 438.5
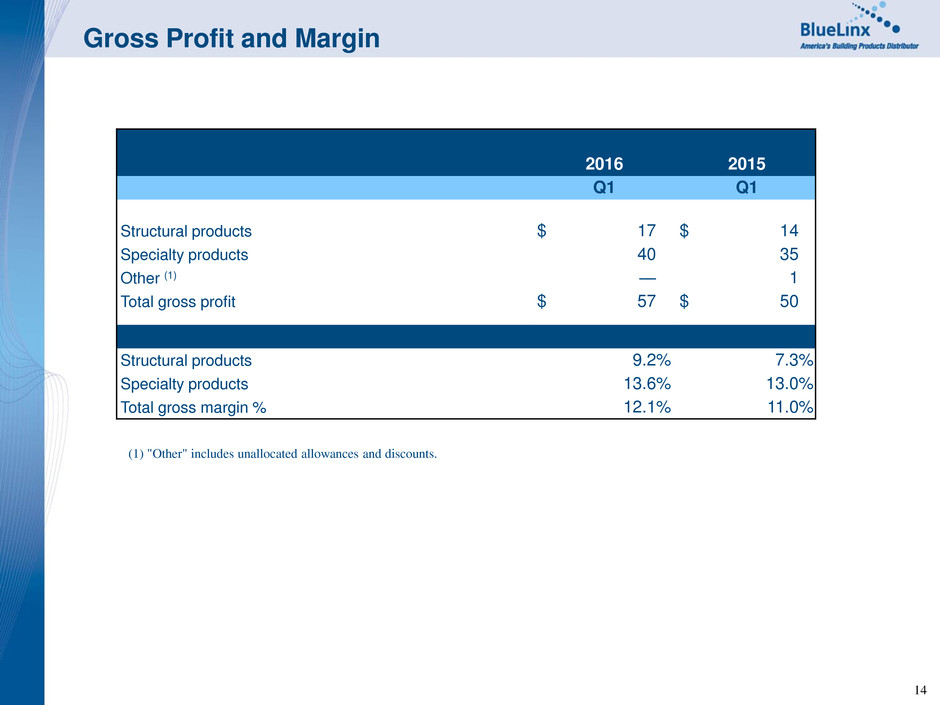
14 Gross Profit and Margin 2016 2015 Q1 Q1 Structural products $ 17 $ 14 Specialty products 40 35 Other (1) — 1 Total gross profit $ 57 $ 50 Structural products 9.2 % 7.3 % Specialty products 13.6 % 13.0 % Total gross margin % 12.1 % 11.0 % (1) "Other" includes unallocated allowances and discounts.

www.BlueLinxco.com


