Investor Presentation May 2019 www.bluelinxco.com NYSE: BXC

Disclaimer | Notes to Investors Forward-Looking Statements. This presentation contains forward-looking statements. Forward-looking statements include, without limitation, any statement that predicts, forecasts, indicates or implies future results, performance, liquidity levels or achievements, and may contain the words “believe,” “anticipate,” “expect,” “estimate,” “intend,” “project,” “plan,” “will be,” “will likely continue,” “will likely result” or words or phrases of similar meaning. The forward-looking statements in this presentation include statements about our ability to achieve profitable growth; our expectations for the housing market, single family housing starts, residential construction and repair and remodeling spending; the potential benefits of the acquisition of Cedar Creek; expected levels of run-rate synergies and our confidence in achieving those run-rate synergies; the expected cost to achieve run-rate synergies; our real estate monetization strategy and its potential benefits, and our ability to monetize our real estate; our ability to expand EBITDA and generate cash flow; our ability to utilize our net operating losses to offset gains, including gains from real estate sales; our expected annual uses of cash; our potential cash available for debt reduction; and our deleveraging plan and ability to deleverage. Forward-looking statements are based on estimates and assumptions made by our management that, although believed by us to be reasonable, are inherently uncertain. Forward-looking statements involve risks and uncertainties that may cause our business, strategy, or actual results to differ materially from the forward-looking statements. These risks and uncertainties include those discussed under the heading “Risk Factors” in Item 1A of our Annual Report on Form 10-K for the year ended December 29, 2018, and those discussed in our Quarterly Reports on Form 10-Q and in our periodic reports filed with the Securities and Exchange Commission from time to time. We operate in a changing environment in which new risks can emerge from time to time. It is not possible for management to predict all of these risks, nor can it assess the extent to which any factor, or a combination of factors, may cause our business, strategy, or actual results to differ materially from those contained in forward-looking statements. Factors that may cause these differences include, among other things: our ability to integrate and realize anticipated synergies from acquisitions; loss of material customers, suppliers, or product lines in connection with acquisitions; our indebtedness and its related limitations; sufficiency of cash flows and capital resources; changes in interest rates; fluctuations in commodity prices; adverse housing market conditions; disintermediation by customers and suppliers; changes in prices, supply and/or demand for our products; inventory management; competitive industry pressures; industry consolidation; product shortages; loss of and dependence on key suppliers and manufacturers; new tariffs; our ability to monetize real estate assets; our ability to successfully implement our strategic initiatives; fluctuations in operating results; sale-leaseback transactions and their effects; real estate leases; exposure to product liability claims; changes in our product mix; petroleum prices; information technology security and business interruption risks; litigation and legal proceedings; natural disasters and unexpected events; activities of activist stockholders; labor and union matters; limits on net operating loss carryovers; pension plan assumptions and liabilities; risks related to our internal controls; retention of associates and key personnel; federal, state, local and other regulations, including environmental laws and regulations; and changes in accounting principles. Given these risks and uncertainties, we caution you not to place undue reliance on forward-looking statements. We expressly disclaim any obligation to update or revise any forward-looking statement as a result of new information, future events or otherwise, except as required by law. Non-GAAP Measures and Supplementary Information. BlueLinx reports its financial results in accordance with accounting principles generally accepted in the United States (“GAAP”). We also believe that presentation of certain non-GAAP measures, such as Adjusted EBITDA, as well as GAAP-based and non-GAAP supplemental financial measures, may be useful to investors and may provide a more complete understanding of the factors and trends affecting the business than using reported GAAP results alone. Explanations of these non-GAAP measures and GAAP-based and non-GAAP supplemental financial measures are included in the accompanying Appendix to this presentation. And any non-GAAP measures used herein are reconciled herein or in the financial tables in the Appendix to their most directly comparable GAAP measures. We caution that non-GAAP measures should be considered in addition to, but not as a substitute for, our reported GAAP results. Immaterial Rounding Differences. Immaterial rounding adjustments and differences may exist between slides, press releases, and previously issued presentations. This presentation and the associated remarks made during this presentation are integrally related and are intended to be presented and understood together. 2
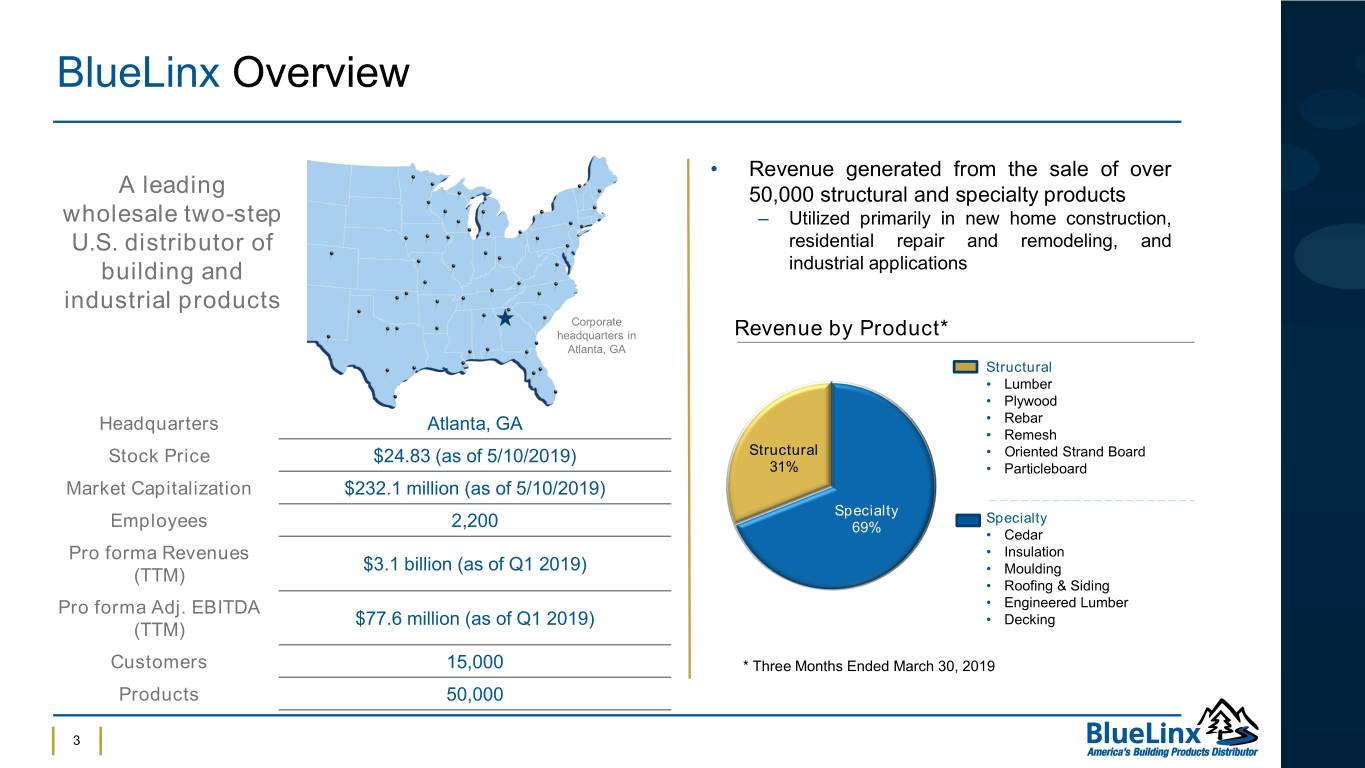
BlueLinx Overview • Revenue generated from the sale of over A leading 50,000 structural and specialty products wholesale two-step ‒ Utilized primarily in new home construction, U.S. distributor of residential repair and remodeling, and building and industrial applications industrial products Corporate headquarters in Revenue by Product* Atlanta, GA Structural • Lumber • Plywood Headquarters Atlanta, GA • Rebar • Remesh Stock Price $24.83 (as of 5/10/2019) Structural • Oriented Strand Board 31% • Particleboard Market Capitalization $232.1 million (as of 5/10/2019) Specialty Specialty Employees 2,200 69% • Cedar Pro forma Revenues • Insulation $3.1 billion (as of Q1 2019) (TTM) • Moulding • Roofing & Siding Pro forma Adj. EBITDA • Engineered Lumber $77.6 million (as of Q1 2019) • Decking (TTM) Customers 15,000 * Three Months Ended March 30, 2019 Products 50,000 3

Solid Competitive Dynamics BlueLinx is an Established Market Leader in Building Distribution The BlueLinx / Cedar Creek combination achieves need for scale Comprehensive product and services portfolio, along with an established to enhance EBITDA Margins in customer base, provides opportunity for profitable growth 01 advance of housing recovery Long-term Market Prognosis for Housing is Strong Well-positioned to capitalize on Favorable long-term demographics coupled with below historical average continued U.S. housing market starts lead to solid “long-term” trends 02 recovery 2018 Acquisition of Cedar Creek Provides Scale: EBITDA Expansion and Cash Flow Potential Synergies from Cedar Creek Strong cash flow and financial flexibility to support long-term 03 acquisition expected to be at least deleveraging plan $50M annually 4
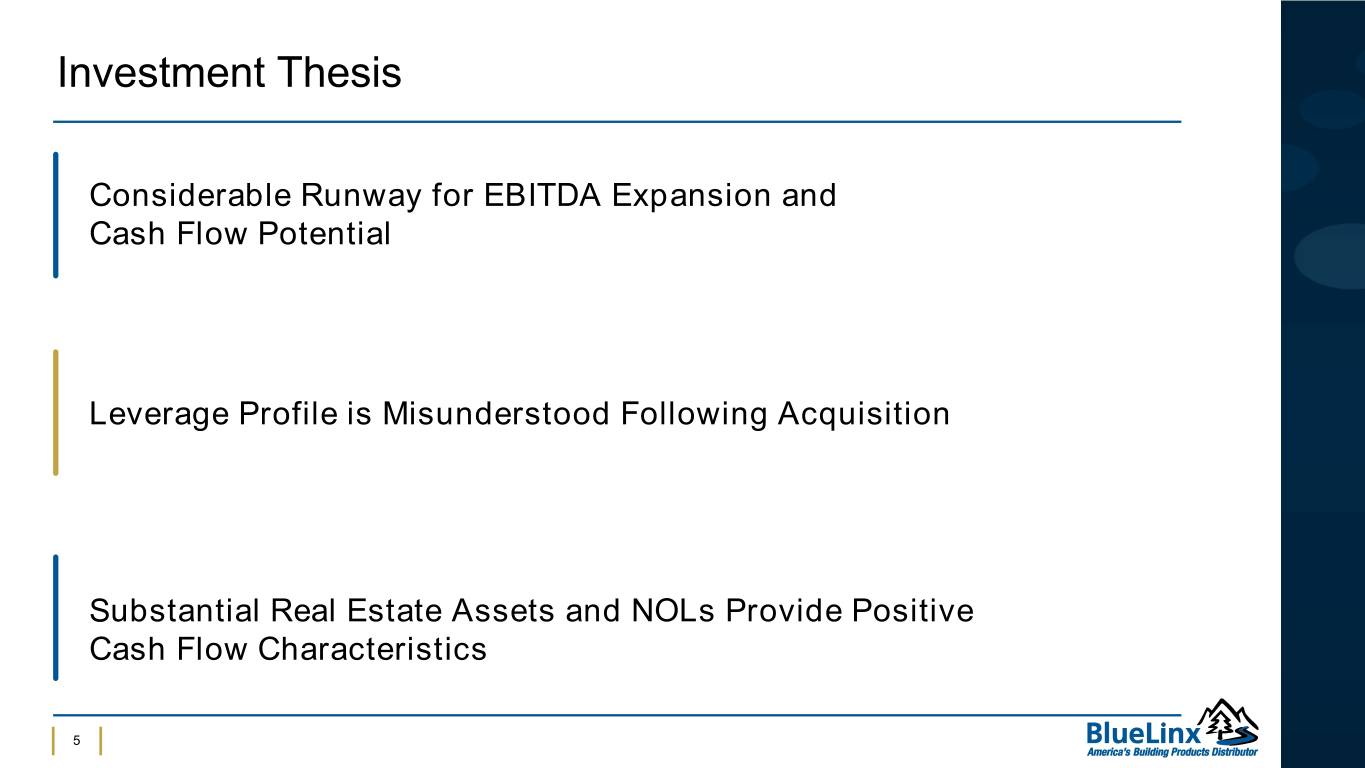
Investment Thesis Well-positioned to capitalize on Considerable Runway for EBITDA 0Expansioncontinued U.S. housing and market Cash Flow Potential 1 recovery Leverage Profile is Misunderstood0 Following Acquisition 2 Substantial Real Estate Assets and0 NOLs Provide Positive Cash Flow Characteristics 3 5
The Building Distribution Market: Where BlueLinx Fits
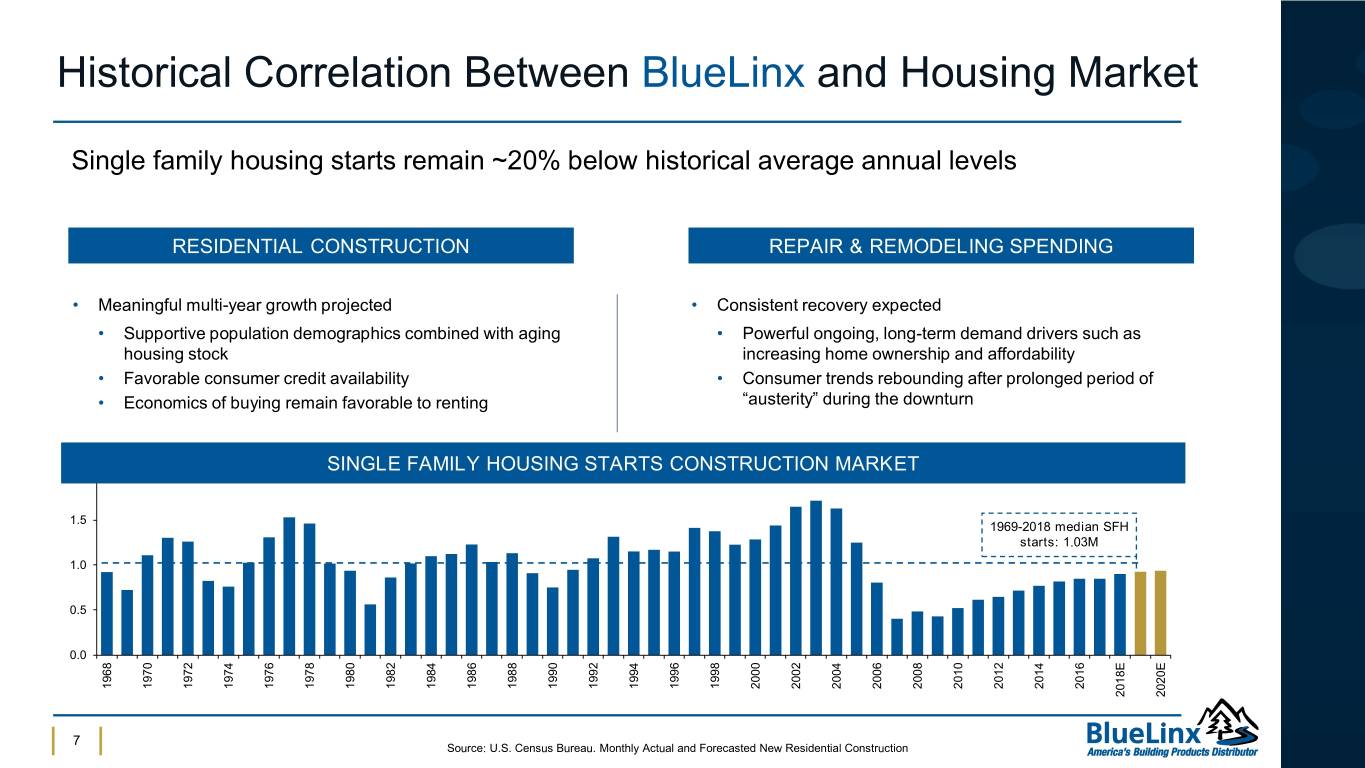
Historical Correlation Between BlueLinx and Housing Market Single family housing starts remain ~20% below historical average annual levels RESIDENTIAL CONSTRUCTION REPAIR & REMODELING SPENDING • Meaningful multi-year growth projected • Consistent recovery expected • Supportive population demographics combined with aging • Powerful ongoing, long-term demand drivers such as housing stock increasing home ownership and affordability • Favorable consumer credit availability • Consumer trends rebounding after prolonged period of • Economics of buying remain favorable to renting “austerity” during the downturn SINGLE FAMILY HOUSING STARTS CONSTRUCTION MARKET 2.0 1.5 1969-2018 median SFH starts: 1.03M 1.0 0.5 0.0 1968 1970 1972 1974 1976 1978 1980 1982 1984 1986 1988 1990 1992 1994 1996 1998 2000 2002 2004 2006 2008 2010 2012 2014 2016 2018E 2020E 7 Source: U.S. Census Bureau. Monthly Actual and Forecasted New Residential Construction

Builders / Housing Market Outlook • Builders Confidence Index suggests positive • U.S. Housing Starts down 10% and Single growth in single-family housing market Family Housing Starts (SFHS) down 5% in Q1 2019 versus Q1 2018 • According to the latest National Association of Home Builders Wells Fargo Housing • April 2019 U.S. SFHS down 5% compared to Market Index, the May index reading was 66, April 2018 in April it was 63. At 51 or higher, the general outlook is positive. BUILDERS CONFIDENCE INDEX U.S. SINGLE FAMILY HOUSING STARTS NAHB Builders Confidence Index (%) (in 000s) U.S. Census Bureau, Seasonally Adjusted 80 1,400 70 1,200 50-year Historical 60 Average 1,013K 1,000 50 800 40 600 30 400 20 10 200 0 0 2007 2010 2013 2016 2019 2007 2010 2013 2016 2019 8

The Building Distribution Value Chain: BlueLinx’s Wholesale / “Two-Step” Distribution Wholesale Distributor Building Products Local Lumber Yards End Market Pro Dealers Manufacturers “Big Box” Retailers Consumer National Homebuilders • Key path to market for most of the Contractors & Local lumber building Homebuilders products industry • Fills the necessary step between building products manufacturers and “DIY” Customers “pro dealers,” local lumber yards, specialty distributors and big box retailers 9
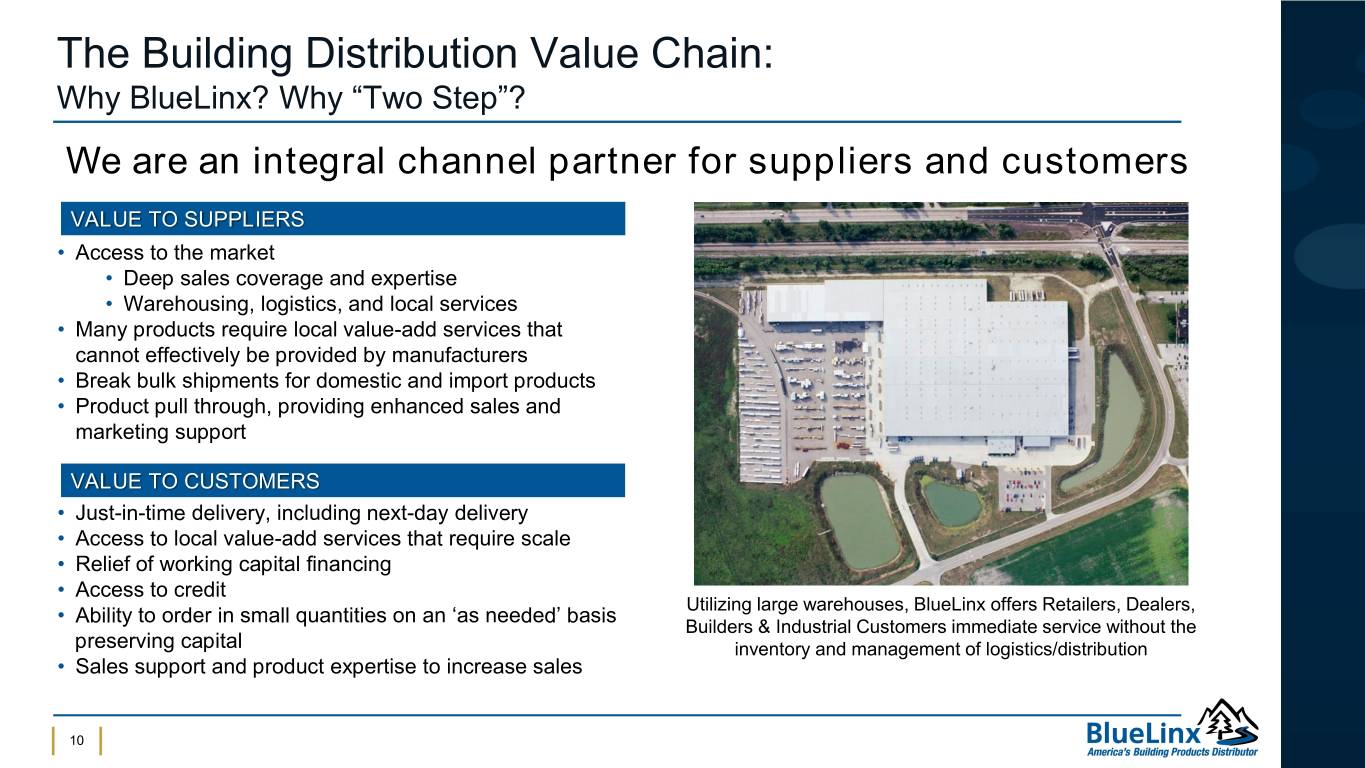
The Building Distribution Value Chain: Why BlueLinx? Why “Two Step”? We are an integral channel partner for suppliers and customers VALUE TO SUPPLIERS • Access to the market • Deep sales coverage and expertise • Warehousing, logistics, and local services • Many products require local value-add services that cannot effectively be provided by manufacturers • Break bulk shipments for domestic and import products • Product pull through, providing enhanced sales and marketing support VALUE TO CUSTOMERS • Just-in-time delivery, including next-day delivery • Access to local value-add services that require scale • Relief of working capital financing • Access to credit Utilizing large warehouses, BlueLinx offers Retailers, Dealers, • Ability to order in small quantities on an ‘as needed’ basis Builders & Industrial Customers immediate service without the preserving capital inventory and management of logistics/distribution • Sales support and product expertise to increase sales 10

The Building Product / Distribution Market • “Two Step” distribution with substantial real estate assets • Predominant focus East of the Rockies • Revenues of $3.1 billion (TTM as of Q1 2019) • 2,200 employees • 62 locations Company Ticker / Private HQ Revenues* Employees* Distributors / Competitors Weyerhauser NYSE: WY Seattle, WA $7.5 Billion 9,300 Boise Cascade NYSE: BCC Boise, ID $5.0 Billion 6,040 Huttig Building Products NASDAQ: HBP St. Louis, MO $839 Million 1,360 Customers / Suppliers ABC Supply Co. Private Beloit, WI $9 Billion (est.) 13,000 Builders FirstSource NYSE: BLDR Dallas, TX $7.7 Billion 15,000 Beacon Roofing Supply NASDAQ: BECN Herndon, VA $6.4 Billion 8,400 HD Supply NASDAQ: HDS Atlanta, GA $6.0 Billion 11,500 BMC Stock Holdings NASDAQ: BMCH Atlanta, GA $3.7 Billion 9,500 Patrick Industries NASDAQ: PATK Elkhart, IL $2.3 Billion 8,000 *Source: Company reports / Bloomberg / Revenues as of last reported 12 month totals 11

BlueLinx’s Value Proposition

“One-stop” Shopping PRODUCT DETAIL VALUE-ADDED SERVICES & PROCESSES • Combination of structural and specialty products are • ~700 customer-facing sales personnel utilized in new home construction, residential repair and • ~50 plan design drawers for residential builders remodeling, and industrial applications • Inventory stocking & automated order processing • BlueLinx offers a variety of branded and private-label products encompassing over 50,000 SKUs • Deliveries available within 24 hours of order SAMPLE PRODUCT OFFERING VALUE-ADDED NO. OF COMPANY PROCESS FACILITIES DIFFERENTIATION ✓ In-house manufacturing provides consistently high Moulding Operations 5 service levels and customized capabilities ✓ Next-day delivery on custom Hardwood/ orders Softwood 16 ✓ Enhanced product reducing Fabrication customer inventory requirements ✓ Immediate availability of custom products otherwise difficult to Timber Operations 6 procure or subject to long lead- times 13

The BlueLinx Story - Industry Leaders Merge in April 2018 May 2004 Dec 2004 2014 2017 Cerberus Initial Public New senior After 13 year 1954 purchased Offering executive team put investment, Formed as a division BlueLinx from G-P in place Cerberus conducts of Georgia-Pacific secondary offering of its shares April 2018 Completed transformative acquisition of Cedar Creek 1977 1982 2010 2010-2016 Founded in First expansion Acquired by Nine strategic Tulsa, OK beyond initial Charlesbank acquisitions location Capital Partners 14

The BlueLinx Story - Creating an Industry Leader • BlueLinx became a top-3 U.S. distributor COMBINED FOOTPRINT with the Cedar Creek acquisition (all of BXC’s facilities are located east of the Rockies) • Over $3B in Pro forma revenue in 2017 • Expanded offerings, capabilities and geographic reach to accelerate growth • No equity dilution as a result of Cedar Creek acquisition ¹As of April 2018 acquisition date 15
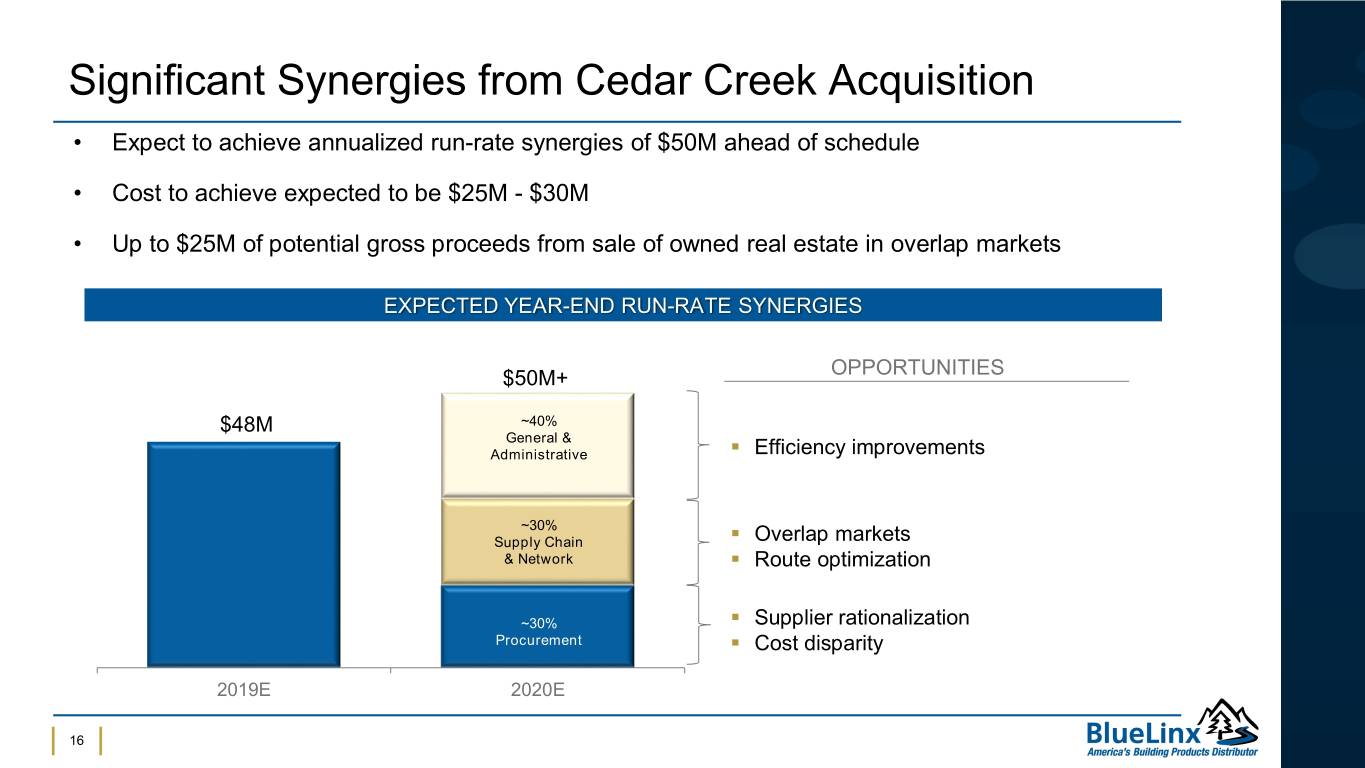
Significant Synergies from Cedar Creek Acquisition • Expect to achieve annualized run-rate synergies of $50M ahead of schedule • Cost to achieve expected to be $25M - $30M • Up to $25M of potential gross proceeds from sale of owned real estate in overlap markets EXPECTED YEAR-END RUN-RATE SYNERGIES $50M+ OPPORTUNITIES $48M ~40% General & Administrative ▪ Efficiency improvements ~30% Supply Chain ▪ Overlap markets & Network ▪ Route optimization ~30% ▪ Supplier rationalization Procurement ▪ Cost disparity 2019E 2020E 16

Proven Leadership in the Building Products Industry Executive Years of Experience Past Experience Mitchell B. Lewis 30+ CEO, President & Director CEO President Attorney Susan C. O’Farrell 30+ CFO & Treasurer VP, Finance Director Assoc. Partner Alex Averitt1 20+ Chief Operating Officer CEO, COO, VP General Manager Shyam K. Reddy 15+ Chief Transformation Officer CAO, GC & Corp. Secretary Reg. Admin. Partner Ron Herrin2 30+ VP, Procurement Director, Sales General Manager Brian J. Sasadu2 15+ Chief Human Resources Officer SVP, HR Attorney Justin Heineman2 20+ General Counsel VP, Chief Corp. Counsel Partner 1. New leadership from Cedar Creek acquisition (April 2018) 17 2. New to role within last 2 years

Proven Leadership Delivering Results New Management Adjusted EBITDA: Adjusted Team EBITDA $68.4 million 100 Adjusted EBITDA: 90 $1.3 million Adjusted EBITDA: $43.9 million 80 • Consolidated operations and streamlined costs 70 • Sold real estate 60 • Completed CMBS repayment from $110 million in sale leaseback transactions 50 40 Acquired Cedar Creek in April 2018 with no dilution 30 to shareholders 20 10 0 2013 2014 2015 2016 2017 2018 18

Financial Highlights
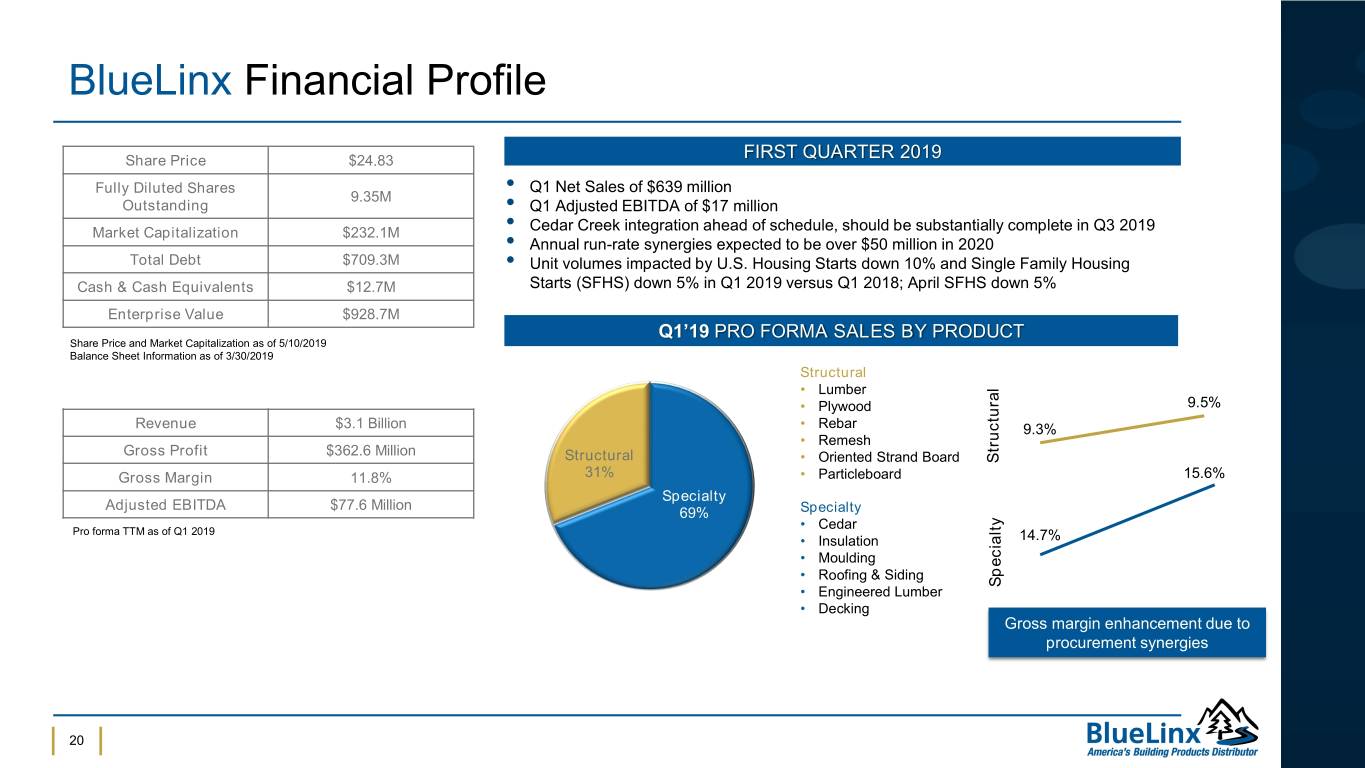
BlueLinx Financial Profile Share Price $24.83 FIRST QUARTER 2019 Fully Diluted Shares Q1 Net Sales of $639 million 9.35M • Outstanding • Q1 Adjusted EBITDA of $17 million Market Capitalization $232.1M • Cedar Creek integration ahead of schedule, should be substantially complete in Q3 2019 • Annual run-rate synergies expected to be over $50 million in 2020 Total Debt $709.3M • Unit volumes impacted by U.S. Housing Starts down 10% and Single Family Housing Cash & Cash Equivalents $12.7M Starts (SFHS) down 5% in Q1 2019 versus Q1 2018; April SFHS down 5% Enterprise Value $928.7M Q1’19 PRO FORMA SALES BY PRODUCT Share Price and Market Capitalization as of 5/10/2019 Balance Sheet Information as of 3/30/2019 Structural • Lumber • Plywood 9.5% Revenue $3.1 Billion • Rebar 9.3% • Remesh Gross Profit $362.6 Million Structural • Oriented Strand Board Structural Gross Margin 11.8% 31% • Particleboard 15.6% Specialty Adjusted EBITDA $77.6 Million 69% Specialty • Cedar Pro forma TTM as of Q1 2019 • Insulation 14.7% • Moulding • Roofing & Siding • Engineered Lumber Specialty • Decking Gross margin enhancement due to procurement synergies 20
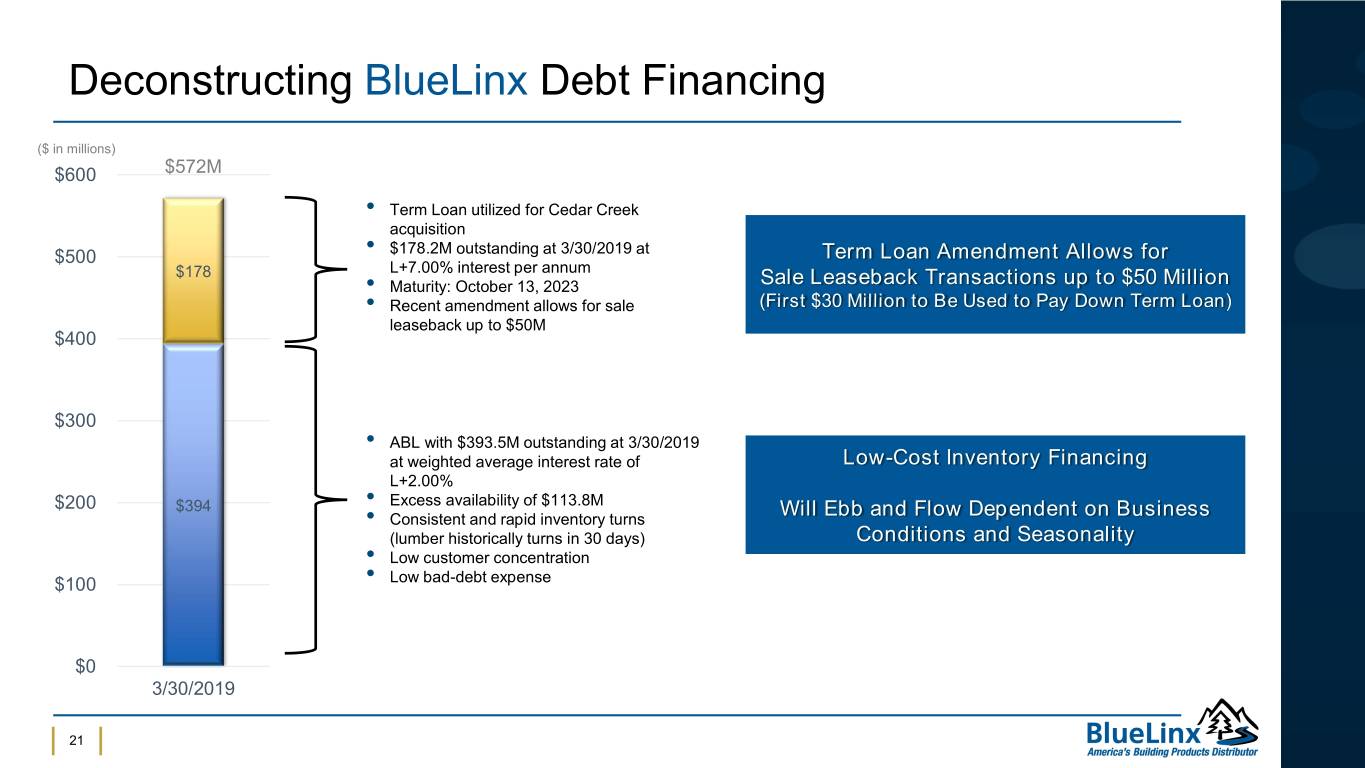
Deconstructing BlueLinx Debt Financing ($ in millions) $600 $572M • Term Loan utilized for Cedar Creek acquisition $500 • $178.2M outstanding at 3/30/2019 at Term Loan Amendment Allows for $178 L+7.00% interest per annum • Maturity: October 13, 2023 Sale Leaseback Transactions up to $50 Million • Recent amendment allows for sale (First $30 Million to Be Used to Pay Down Term Loan) leaseback up to $50M $400 $300 • ABL with $393.5M outstanding at 3/30/2019 at weighted average interest rate of Low-Cost Inventory Financing L+2.00% $200 $394 • Excess availability of $113.8M Will Ebb and Flow Dependent on Business • Consistent and rapid inventory turns (lumber historically turns in 30 days) Conditions and Seasonality • Low customer concentration $100 • Low bad-debt expense $0 3/30/2019 21

Strong Deleveraging Potential Post Integration Estimated Annual Uses of Cash1 Potential Cash Available for (Before Real Estate Monetization) Debt Reduction ABL Interest2 $20M Term Loan Interest3 $16 Cash Available $110M for Debt Pay Down Finance Lease Payments3,4 $22 $80M $50M CapEx3 $5 $30M Cash Taxes3,5 $2 Uses of $70M $70M $70M $70M Cash Other3,6 $5 Total $70M $100M $120M $150M $180M 1 1Provided solely to illustrate potential future annual uses of cash ADJ EBITDA FOR ILLUSTRATIVE PURPOSES 2Estimated based on average ABL balance post acquisition Note: 9.34M outstanding shares as of March 30, 2019 3Estimated based on annualized cash estimates by multiplying Q3 2018 and Q4 2018 by two 1Provided solely to illustrate potential cash available for debt reduction 42018 Finance Lease Principal ($7), Finance Lease Interest ($15) at various levels of assumed future Adjusted EBITDA 52018 Cash taxes primarily consist of state taxes due to Federal NOLs 62018 comprised mostly of pension cash payments 22
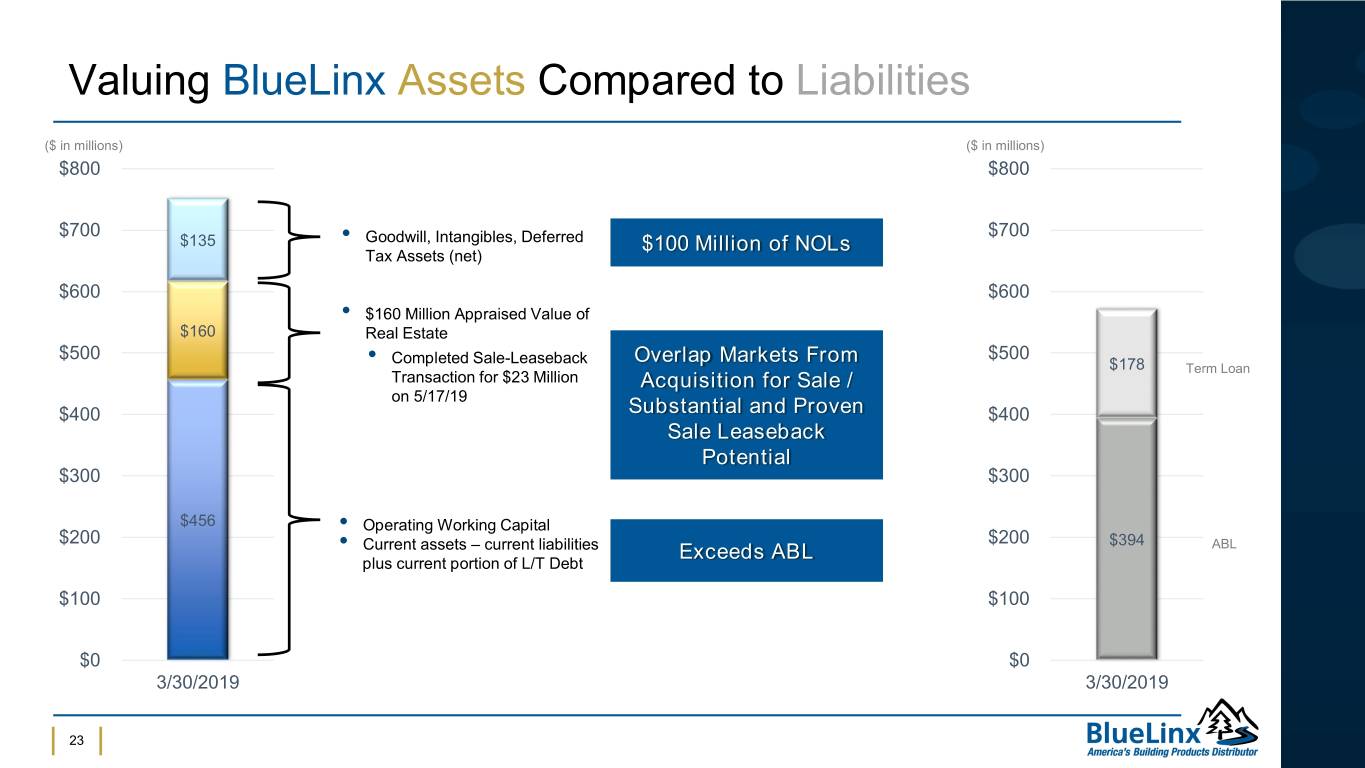
Valuing BlueLinx Assets Compared to Liabilities ($ in millions) ($ in millions) $800 $800 $700 $700 $135 • Goodwill, Intangibles, Deferred $100 Million of NOLs Tax Assets (net) $600 $600 • $160 Million Appraised Value of $160 Real Estate $500 • Completed Sale-Leaseback Overlap Markets From $500 $178 Term Loan Transaction for $23 Million Acquisition for Sale / on 5/17/19 $400 Substantial and Proven $400 Sale Leaseback Potential $300 $300 $456 • Operating Working Capital $200 $200 $394 • Current assets – current liabilities Exceeds ABL ABL plus current portion of L/T Debt $100 $100 $0 $0 3/30/2019 3/30/2019 23
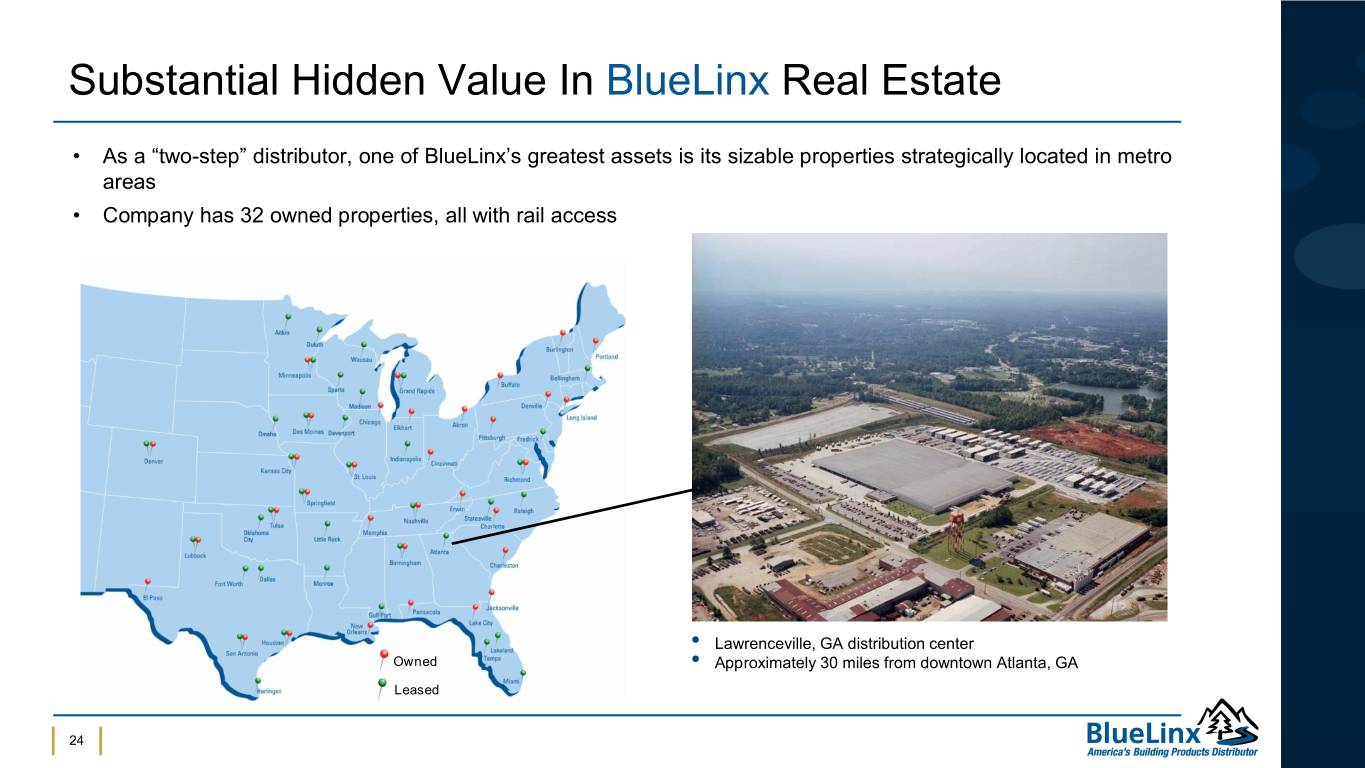
Substantial Hidden Value In BlueLinx Real Estate • As a “two-step” distributor, one of BlueLinx’s greatest assets is its sizable properties strategically located in metro areas • Company has 32 owned properties, all with rail access • Lawrenceville, GA distribution center Owned • Approximately 30 miles from downtown Atlanta, GA Leased 24
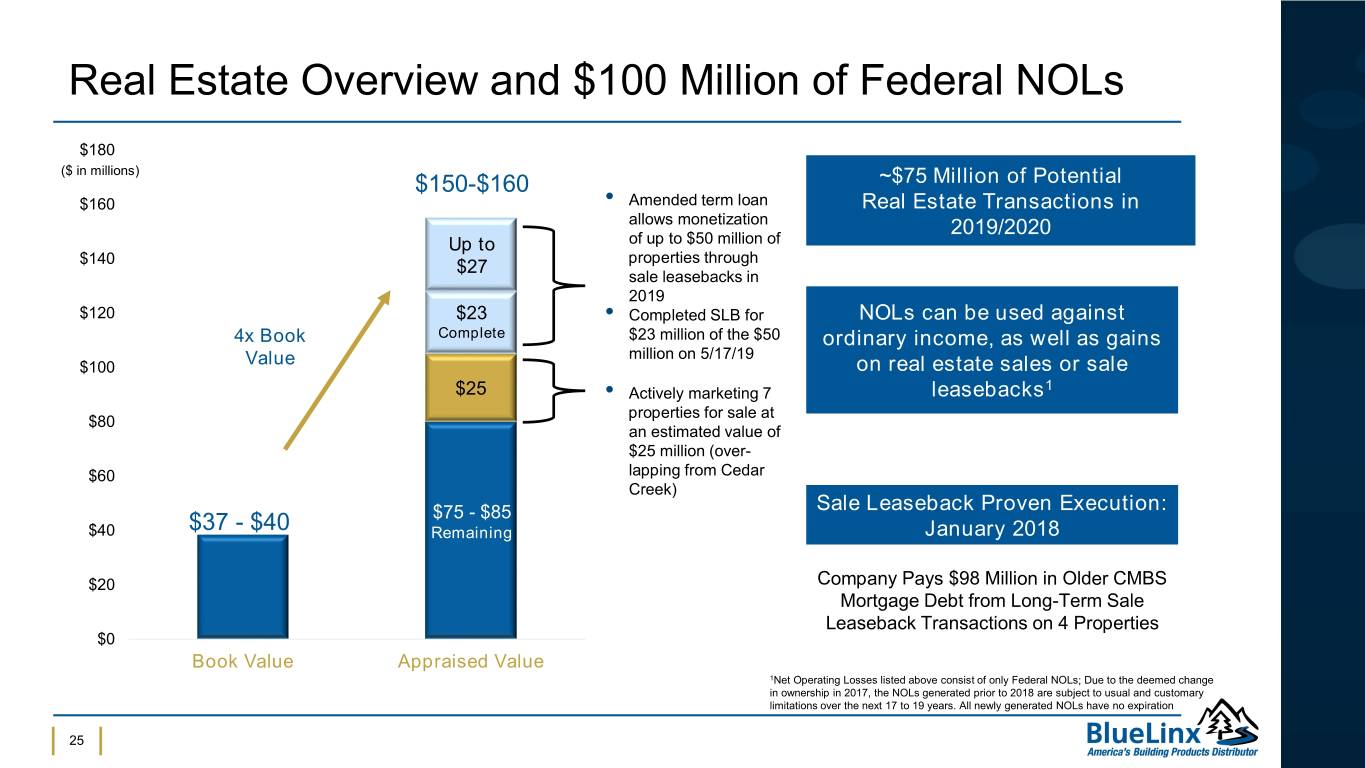
Real Estate Overview and $100 Million of Federal NOLs $180 ($ in millions) $150-$160 ~$75 Million of Potential $160 • Amended term loan Real Estate Transactions in allows monetization 2019/2020 Up to of up to $50 million of $140 $27 properties through sale leasebacks in 2019 $120 $23 • Completed SLB for NOLs can be used against 4x Book Complete $23 million of the $50 ordinary income, as well as gains million on 5/17/19 $100 Value on real estate sales or sale 1 $25 • Actively marketing 7 leasebacks properties for sale at $80 an estimated value of $25 million (over- $60 lapping from Cedar Creek) $75 - $85 Sale Leaseback Proven Execution: $40 $37 - $40 Remaining January 2018 $20 Company Pays $98 Million in Older CMBS Mortgage Debt from Long-Term Sale Leaseback Transactions on 4 Properties $0 Book Value Appraised Value 1Net Operating Losses listed above consist of only Federal NOLs; Due to the deemed change in ownership in 2017, the NOLs generated prior to 2018 are subject to usual and customary limitations over the next 17 to 19 years. All newly generated NOLs have no expiration 25

Investment Conclusion EBITDA Expansion and Cash Flow Potential • Leading market position set to benefit from turn0 in housing starts • Acquisition of Cedar Creek provided necessary scale to be leader in markets served • Identifiable and achievable cost savings of at 1least $50M through supply chain, G&A and procurement • Considerable cash flow potential with synergies in place Facilitating a Better Understanding of the Leverage Profile • The Company’s ABL is low cost inventory financing0 that provides considerable operating flexibility • Term loan utilized to acquire Cedar Creek • Term loan allows for and can be reduced by sale2 leaseback transactions Substantial Real Estate Assets and NOLs Expected to Accelerate Deleveraging Plans • $150 - $160 million of appraised real estate with0 proven ability to de-lever from sale leaseback transactions and real estate sales • $25 million of real estate actively being marketed from overlap locations • $100 million of NOLs can be used against ordinary3 income, as well as gains on real estate sales or sale leasebacks 26
Appendix

Commodity Lumber and Panel Business Impacts FRAMING LUMBER COMPOSITE PRICE STRUCTURAL PANEL COMPOSITE PRICE Source: Random Lengths Source: Random Lengths $650 $650 $550 $550 $450 $450 $350 $350 $250 $250 Mar Jun Sep Dec Mar Jun Sep Dec HIGHLIGHTS • Pricing in commodity lumber and panels negatively impacted Q1 2019 sales results • Framing lumber prices down 28%1 • Structural panel prices down 31%1 • Expect Q2 commodity prices to continue to be a net sales headwind for the company 1Price comparison at end of quarter 28
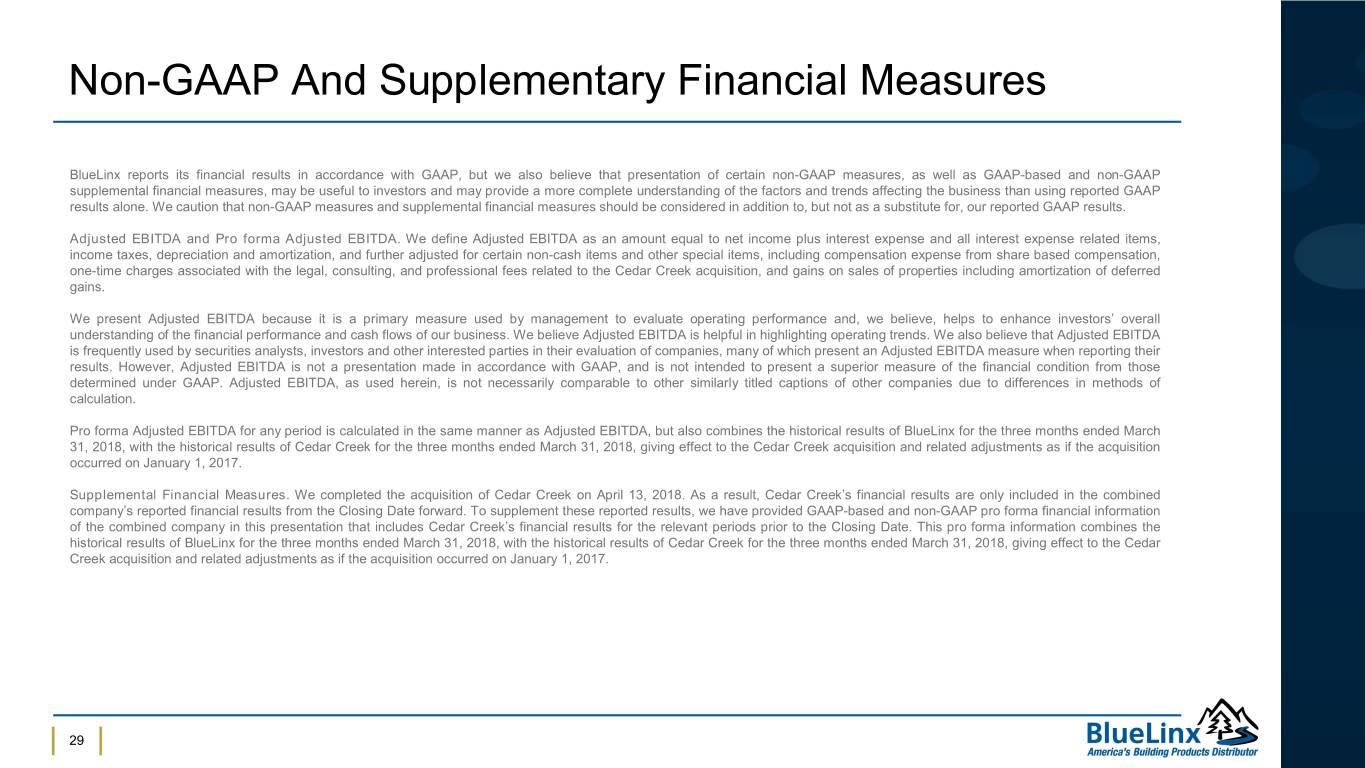
Non-GAAP And Supplementary Financial Measures BlueLinx reports its financial results in accordance with GAAP, but we also believe that presentation of certain non-GAAP measures, as well as GAAP-based and non-GAAP supplemental financial measures, may be useful to investors and may provide a more complete understanding of the factors and trends affecting the business than using reported GAAP results alone. We caution that non-GAAP measures and supplemental financial measures should be considered in addition to, but not as a substitute for, our reported GAAP results. Adjusted EBITDA and Pro forma Adjusted EBITDA. We define Adjusted EBITDA as an amount equal to net income plus interest expense and all interest expense related items, income taxes, depreciation and amortization, and further adjusted for certain non-cash items and other special items, including compensation expense from share based compensation, one-time charges associated with the legal, consulting, and professional fees related to the Cedar Creek acquisition, and gains on sales of properties including amortization of deferred gains. We present Adjusted EBITDA because it is a primary measure used by management to evaluate operating performance and, we believe, helps to enhance investors’ overall understanding of the financial performance and cash flows of our business. We believe Adjusted EBITDA is helpful in highlighting operating trends. We also believe that Adjusted EBITDA is frequently used by securities analysts, investors and other interested parties in their evaluation of companies, many of which present an Adjusted EBITDA measure when reporting their results. However, Adjusted EBITDA is not a presentation made in accordance with GAAP, and is not intended to present a superior measure of the financial condition from those determined under GAAP. Adjusted EBITDA, as used herein, is not necessarily comparable to other similarly titled captions of other companies due to differences in methods of calculation. Pro forma Adjusted EBITDA for any period is calculated in the same manner as Adjusted EBITDA, but also combines the historical results of BlueLinx for the three months ended March 31, 2018, with the historical results of Cedar Creek for the three months ended March 31, 2018, giving effect to the Cedar Creek acquisition and related adjustments as if the acquisition occurred on January 1, 2017. Supplemental Financial Measures. We completed the acquisition of Cedar Creek on April 13, 2018. As a result, Cedar Creek’s financial results are only included in the combined company’s reported financial results from the Closing Date forward. To supplement these reported results, we have provided GAAP-based and non-GAAP pro forma financial information of the combined company in this presentation that includes Cedar Creek’s financial results for the relevant periods prior to the Closing Date. This pro forma information combines the historical results of BlueLinx for the three months ended March 31, 2018, with the historical results of Cedar Creek for the three months ended March 31, 2018, giving effect to the Cedar Creek acquisition and related adjustments as if the acquisition occurred on January 1, 2017. 29
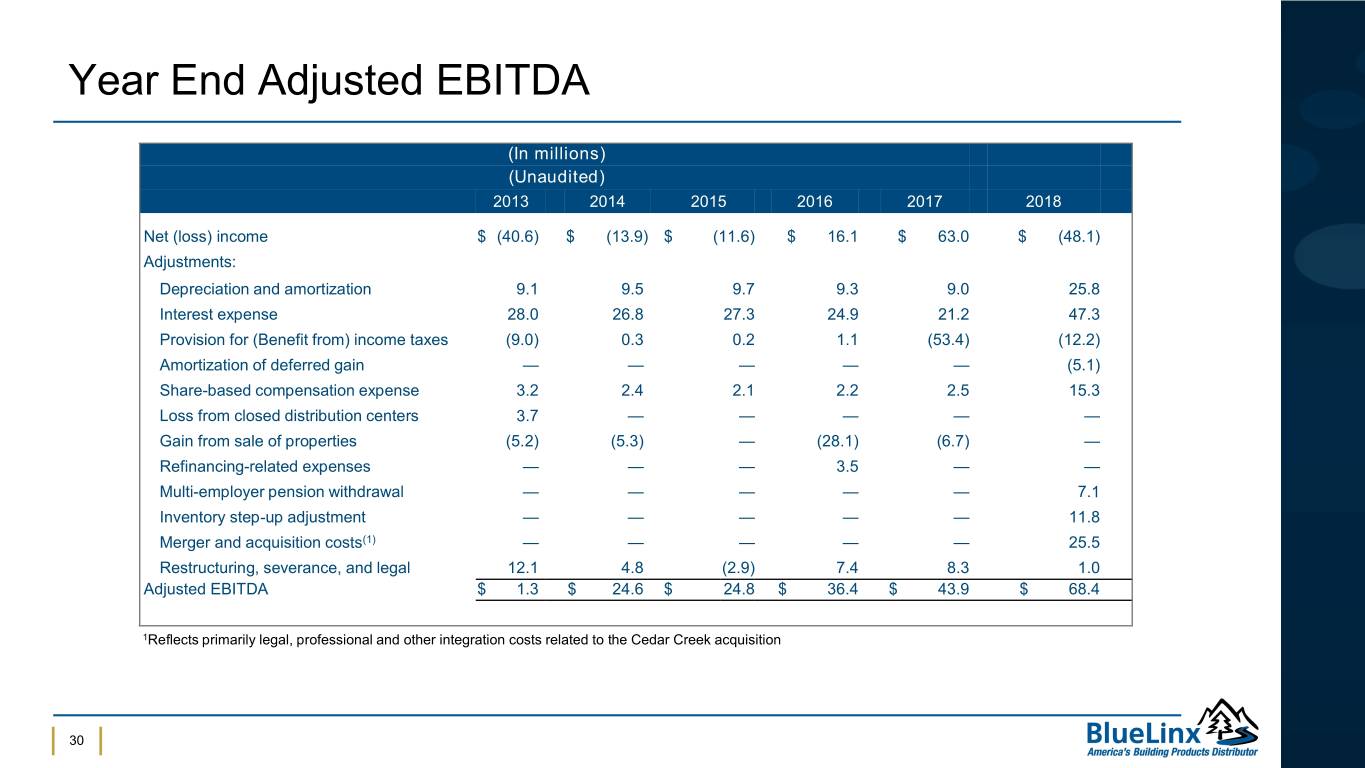
Year End Adjusted EBITDA (In millions) (Unaudited) 2013 2014 2015 2016 2017 2018 Net (loss) income $ (40.6) $ (13.9) $ (11.6) $ 16.1 $ 63.0 $ (48.1) Adjustments: Depreciation and amortization 9.1 9.5 9.7 9.3 9.0 25.8 Interest expense 28.0 26.8 27.3 24.9 21.2 47.3 Provision for (Benefit from) income taxes (9.0) 0.3 0.2 1.1 (53.4) (12.2) Amortization of deferred gain — — — — — (5.1) Share-based compensation expense 3.2 2.4 2.1 2.2 2.5 15.3 Loss from closed distribution centers 3.7 — — — — — Gain from sale of properties (5.2) (5.3) — (28.1) (6.7) — Refinancing-related expenses — — — 3.5 — — Multi-employer pension withdrawal — — — — — 7.1 Inventory step-up adjustment — — — — — 11.8 Merger and acquisition costs(1) — — — — — 25.5 Restructuring, severance, and legal 12.1 4.8 (2.9) 7.4 8.3 1.0 Adjusted EBITDA $ 1.3 $ 24.6 $ 24.8 $ 36.4 $ 43.9 $ 68.4 1Reflects primarily legal, professional and other integration costs related to the Cedar Creek acquisition 30
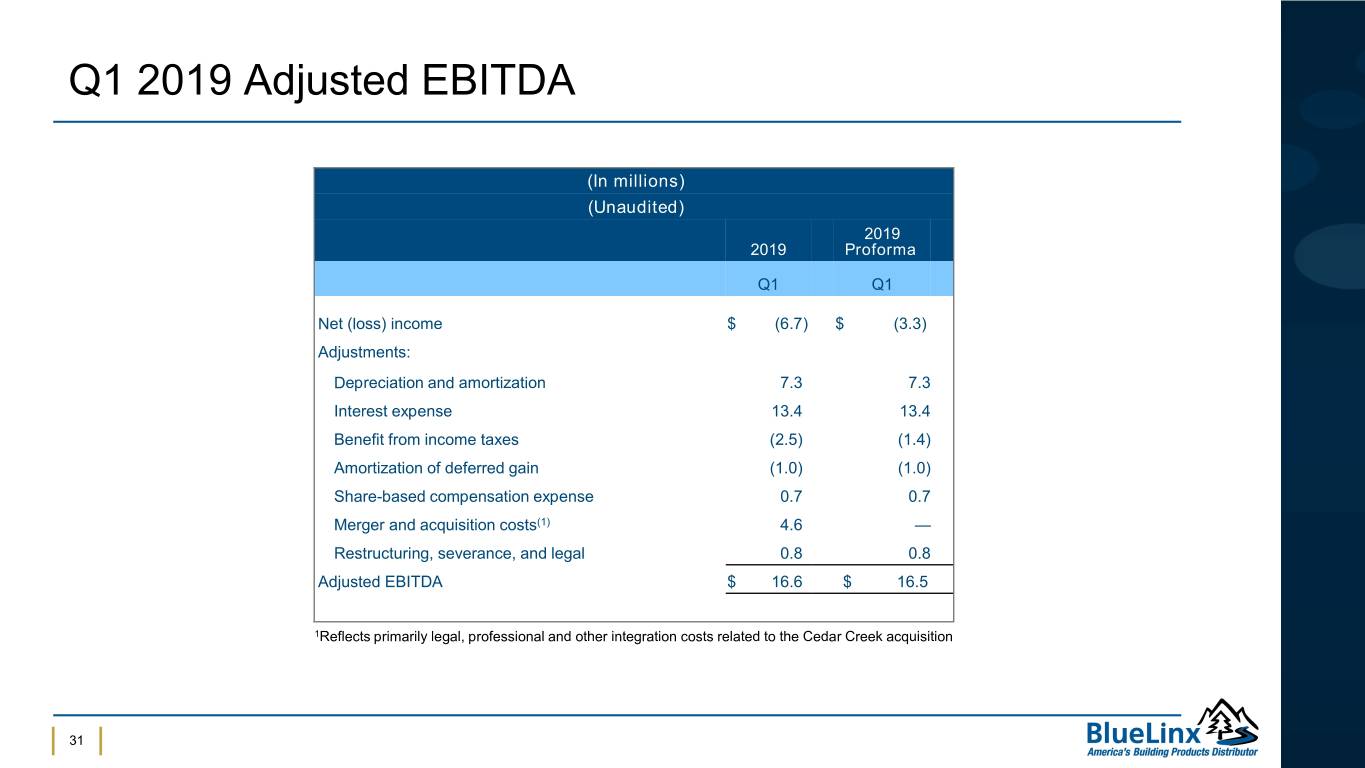
Q1 2019 Adjusted EBITDA (In millions) (Unaudited) 2019 2019 Proforma Q1 Q1 Net (loss) income $ (6.7) $ (3.3) Adjustments: Depreciation and amortization 7.3 7.3 Interest expense 13.4 13.4 Benefit from income taxes (2.5) (1.4) Amortization of deferred gain (1.0) (1.0) Share-based compensation expense 0.7 0.7 Merger and acquisition costs(1) 4.6 — Restructuring, severance, and legal 0.8 0.8 Adjusted EBITDA $ 16.6 $ 16.5 1Reflects primarily legal, professional and other integration costs related to the Cedar Creek acquisition 31

Pro forma TTM Adjusted EBITDA as of Q1 2019 (In millions) (Unaudited) 2018 2018 2018 2019 TTM Q2 Q3 Q4 Q1 TOTAL Net (loss) income $ 9.2 $ (6.2) $ (11.4) $ (3.3) $ (11.7) Adjustments: Depreciation and amortization 8.7 8.1 7.6 7.3 31.7 Interest expense 12.6 13.3 13.4 13.4 52.7 Provision for (Benefit from) income taxes 4.8 (6.3) (2.6) (1.4) (5.5) Amortization of deferred gain (1.3) (1.3) (1.3) (1.0) (4.8) Share-based compensation expense 3.8 1.7 0.6 0.7 6.8 Multi-employer pension withdrawal — 6.5 0.6 — 7.1 Restructuring, severance, and legal (0.1) 0.8 (0.1) 0.8 1.4 Adjusted EBITDA $ 37.7 $ 16.6 $ 6.8 $ 16.5 $ 77.6 1Reflects primarily legal, professional and other integration costs related to the Cedar Creek acquisition 32
Contact Us Mary Moll | BlueLinx Investor Relations 1950 Spectrum Circle, Suite 300, Marietta, GA 30067 (866) 671-5138 | investor@bluelinxco.com 33


