|
Exhibit 99.1 
|
Manitex International, Inc.
Corporate Presentation
(NASDAQ: MNTX)
December 2013
Focused manufacturer of engineered lifting equipment
Forward Looking Statements & Non-GAAP Measures
Safe Harbor Statement under the U.S. Private Securities Litigation Reform Act of 1995: This presentation contains statements that are forward-looking in nature which express the beliefs and expectations of management including statements regarding the Company’s expected results of operations or liquidity; statements concerning projections, predictions, expectations, estimates or forecasts as to our business, financial and operational results and future economic performance; and statements of management’s goals and objectives and other similar expressions concerning matters that are not historical facts. In some cases, you can identify forward-looking statements by terminology such as
“anticipate,” “estimate,” “plan,” “project,” “continuing,” “ongoing,” “expect,” “we believe,” “we intend,” “may,” “will,” “should,” “could,” and similar expressions. Such statements are based on current plans, estimates and expectations and involve a number of known and unknown risks, uncertainties and other factors that could cause the Company’s future results, performance or achievements to differ significantly from the results, performance or achievements expressed or implied by such forward-looking statements. These factors and additional information are discussed in the Company’s filings with the Securities and Exchange Commission and statements in this presentation should be evaluated in light of these important factors. Although we believe that these statements are based upon reasonable assumptions, we cannot guarantee future results. Forward-looking statements speak only as of the date on which they are made, and the Company undertakes no obligation to update publicly or revise any forward-looking statement, whether as a result of new information, future developments or otherwise.
Non-GAAP Measures: Manitex International from time to time refers to various non-GAAP (generally accepted accounting principles) financial measures in this presentation. Manitex believes that this information is useful to understanding its operating results without the impact of special items. See Manitex’s Third Quarter 2013 earnings release on the Investor Relations section of our website www.manitexinternational.com for a description and/or reconciliation of these measures.
Focused manufacturer of engineered lifting equipment
12/4/2013
Nasdaq: MNTX
Company Snapshot
Manitex
International, Inc.
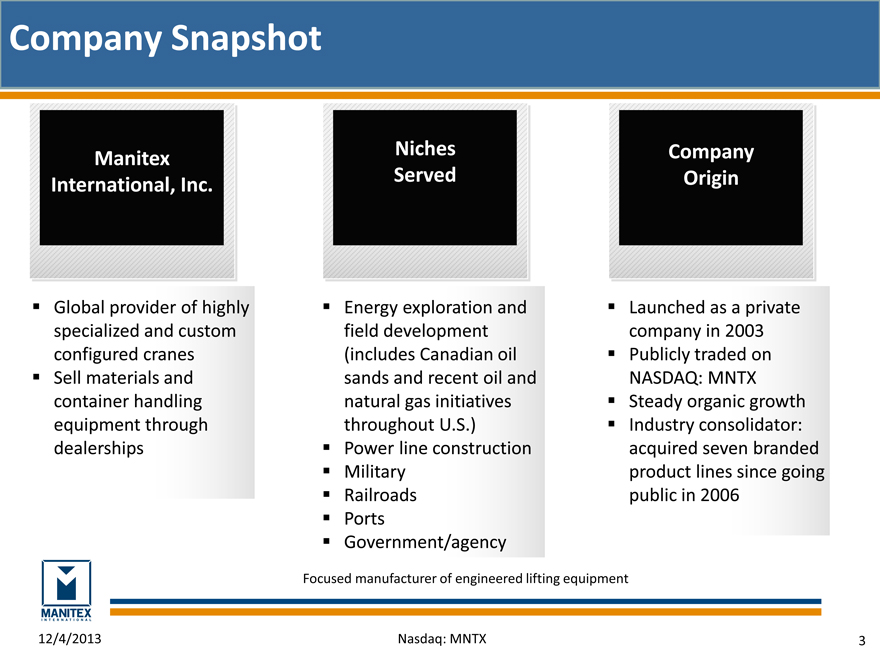
Global provider of highly specialized and custom configured cranes Sell materials and container handling equipment through dealerships
Niches
Served
Energy exploration and field development (includes Canadian oil sands and recent oil and natural gas initiatives throughout U.S.) Power line construction Military Railroads Ports Government/agency
Company Origin
Launched as a private company in 2003 Publicly traded on NASDAQ: MNTX Steady organic growth Industry consolidator: acquired seven branded product lines since going public in 2006
Focused manufacturer of engineered lifting equipment
12/4/2013
Nasdaq: MNTX
#44 on Forbes Best Small Companies List for Two Consecutive Years: 2012 & 2013
Forbes
America’s Best
Small Companies
According to Forbes, this list compiles “an annual ranking of America’s Best Small Companies that have experienced strong growth over the past five years. The 2012 list highlights public companies with sales under $1 billion, which are ranked based on return on equity, sales growth and earnings growth over the past year and the past five years.” Forbes methodology factored in stock performance versus each company’s peer group during the last 12 months.
Focused manufacturer of engineered lifting equipment
12/4/2013
Nasdaq: MNTX
Financial Summary
Key Statistics
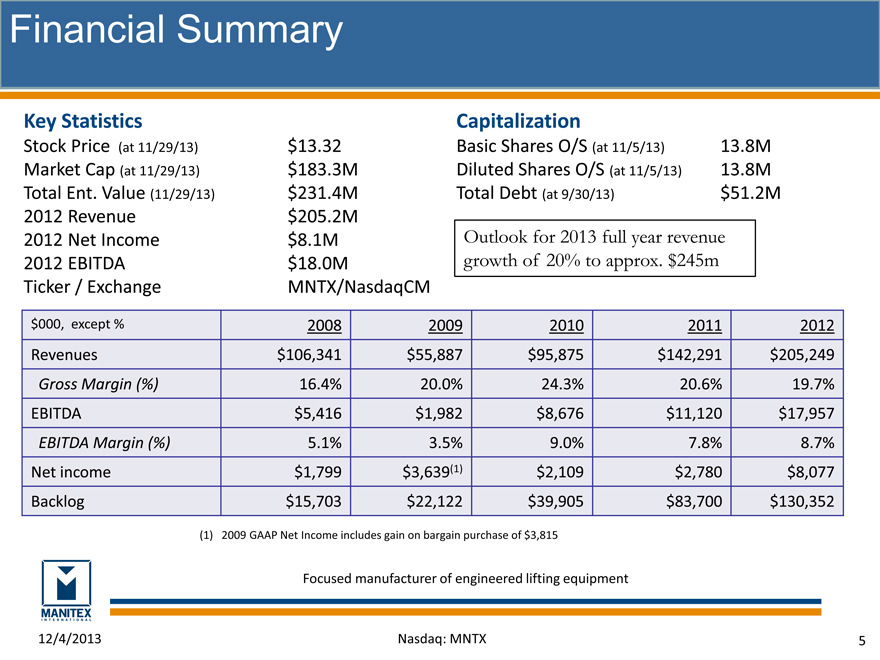
Stock Price (at 11/29/13) Market Cap (at 11/29/13)
Total Ent. Value (11/29/13) 2012 Revenue 2012 Net Income 2012 EBITDA Ticker / Exchange
$13.32 $183.3M $231.4M $205.2M $8.1M $18.0M
MNTX/NasdaqCM
Capitalization
Basic Shares O/S (at 11/5/13) 13.8M Diluted Shares O/S (at 11/5/13) 13.8M Total Debt (at 9/30/13) $51.2M
Outlook for 2013 full year revenue growth of 20% to approx. $245m
$000, except % 2008 2009 2010 2011 2012
Revenues $106,341 $55,887 $95,875 $142,291 $205,249
Gross Margin (%) 16.4% 20.0% 24.3% 20.6% 19.7%
EBITDA $5,416 $1,982 $8,676 $11,120 $17,957
EBITDA Margin (%) 5.1% 3.5% 9.0% 7.8% 8.7%
Net income $1,799 $3,639(1) $2,109 $2,780 $8,077
Backlog $15,703 $22,122 $39,905 $83,700 $130,352
(1) | | 2009 GAAP Net Income includes gain on bargain purchase of $3,815 |
Focused manufacturer of engineered lifting equipment
12/4/2013
Nasdaq: MNTX
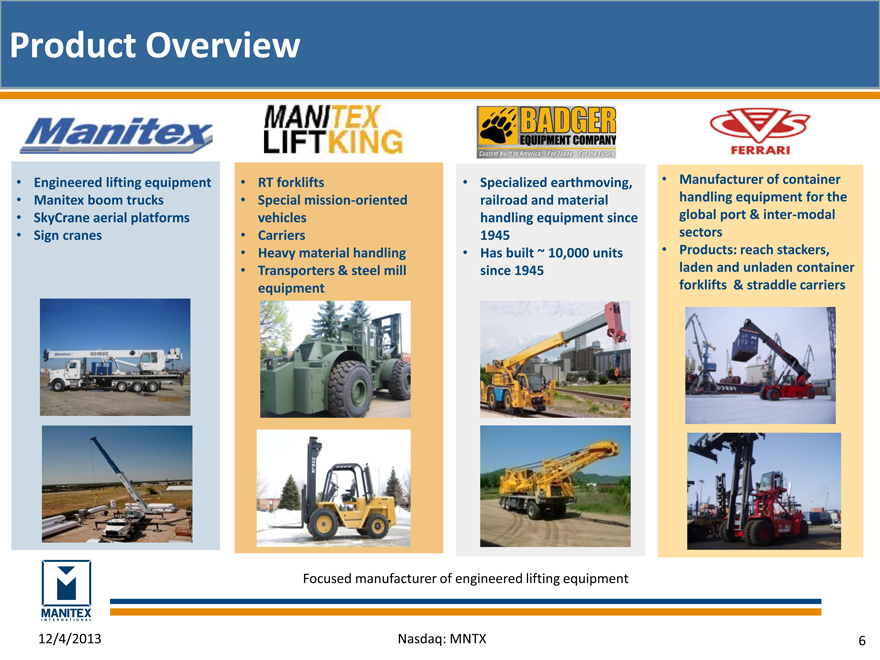
Product Overview
RT forklifts
Special mission-oriented vehicles
Carriers
Heavy material handling Transporters & steel mill equipment
Specialized earthmoving, railroad and material handling equipment since
1945
Has built ~ 10,000 units since 1945
Manufacturer of container handling equipment for the global port & inter-modal sectors Products: reach stackers, laden and unladen container forklifts & straddle carriers
Focused manufacturer of engineered lifting equipment
12/4/2013
Nasdaq: MNTX
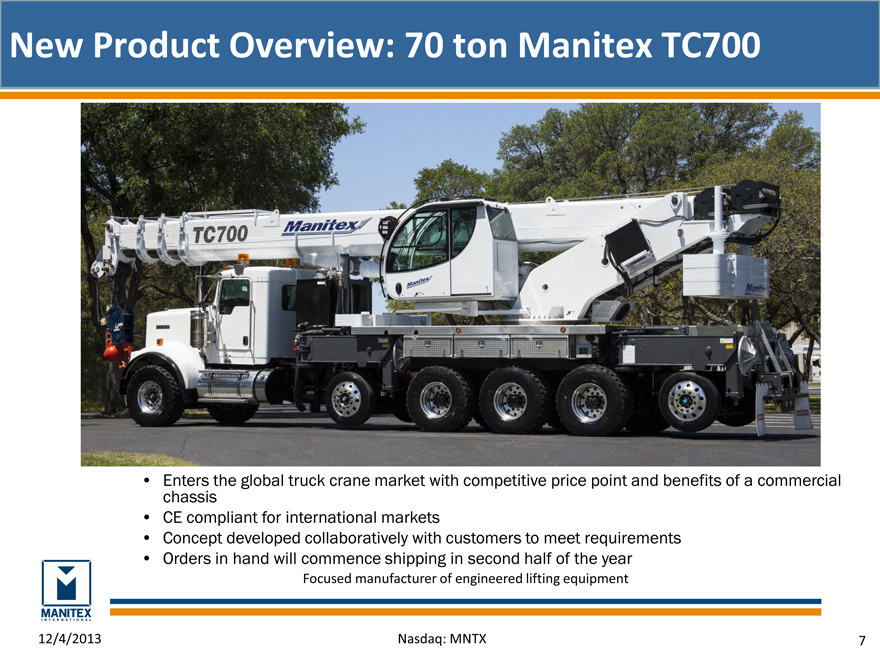
New Product Overview: 70 ton Manitex TC700
Enters the global truck crane market with competitive price point and benefits of a commercial chassis CE compliant for international markets Concept developed collaboratively with customers to meet requirements Orders in hand will commence shipping in second half of the year
Focused manufacturer of engineered lifting equipment
12/4/2013 Nasdaq: MNTX 7
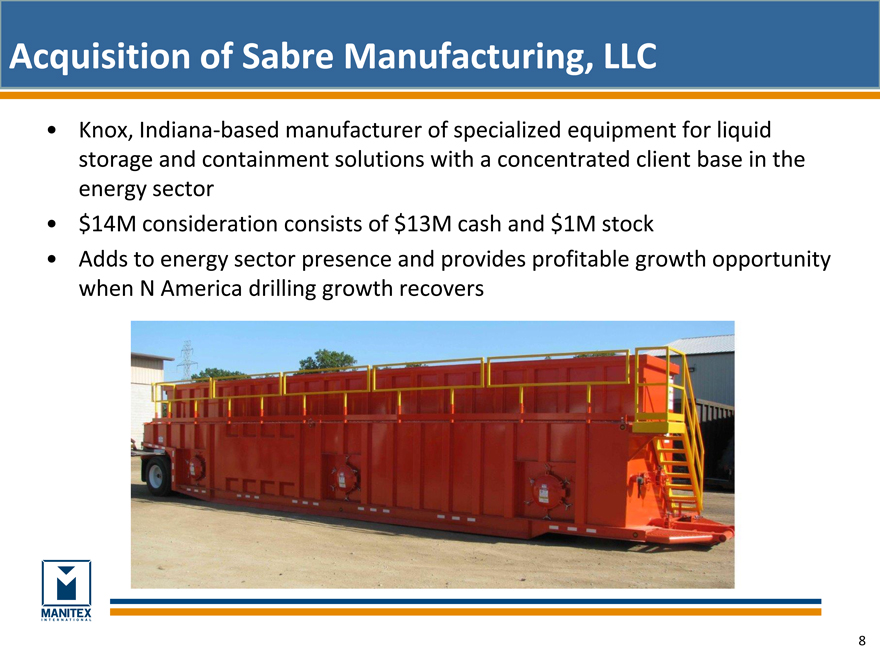
Acquisition of Sabre Manufacturing, LLC
Knox, Indiana-based manufacturer of specialized equipment for liquid storage and containment solutions with a concentrated client base in the energy sector $14M consideration consists of $13M cash and $1M stock Adds to energy sector presence and provides profitable growth opportunity when N America drilling growth recovers
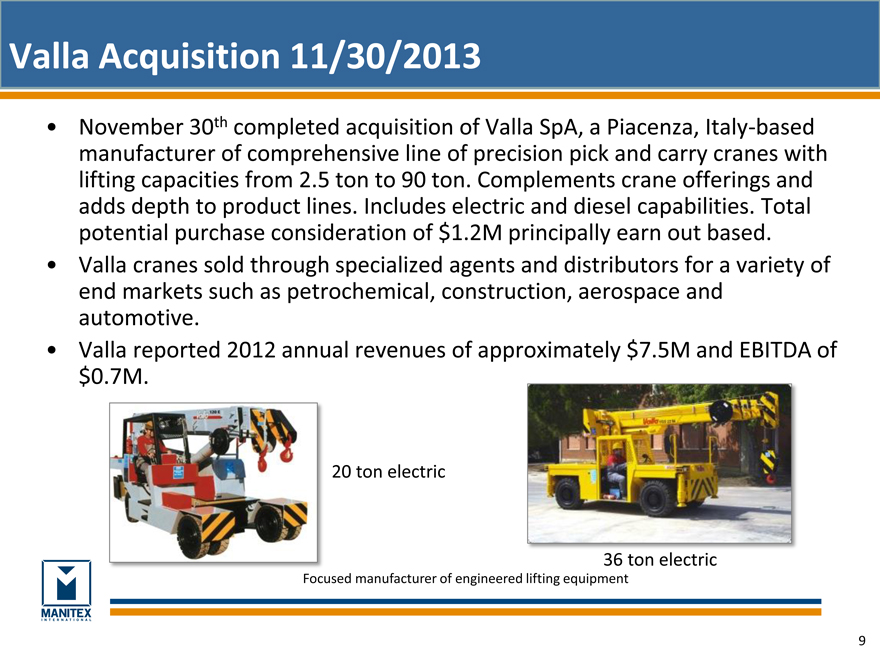
Valla Acquisition 11/30/2013
November 30th completed acquisition of Valla SpA, a Piacenza, Italy-based manufacturer of comprehensive line of precision pick and carry cranes with lifting capacities from 2.5 ton to 90 ton. Complements crane offerings and adds depth to product lines. Includes electric and diesel capabilities. Total potential purchase consideration of $1.2M principally earn out based. Valla cranes sold through specialized agents and distributors for a variety of end markets such as petrochemical, construction, aerospace and automotive.
Valla reported 2012 annual revenues of approximately $7.5M and EBITDA of $0.7M.
20 ton electric
36 ton electric
Focused manufacturer of engineered lifting equipment
9
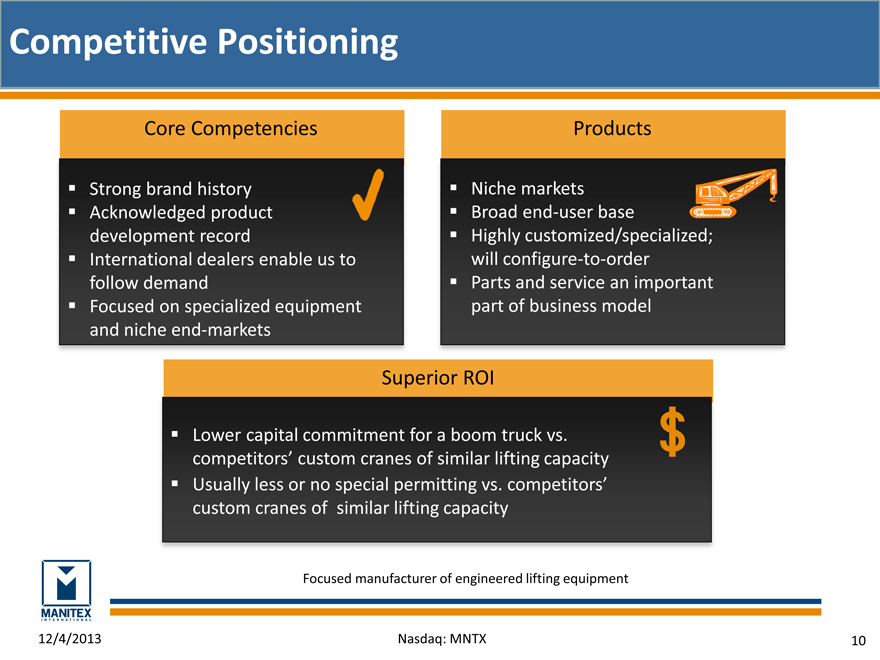
Competitive Positioning
Core Competencies
Strong brand history Acknowledged product development record
International dealers enable us to follow demand Focused on specialized equipment and niche end-markets
Products
Niche markets Broad end-user base
Highly customized/specialized; will configure-to-order Parts and service an important part of business model
Superior ROI
Lower capital commitment for a boom truck vs. competitors’ custom cranes of similar lifting capacity Usually less or no special permitting vs. competitors’ custom cranes of similar lifting capacity
Focused manufacturer of engineered lifting equipment
12/4/2013 Nasdaq: MNTX 10
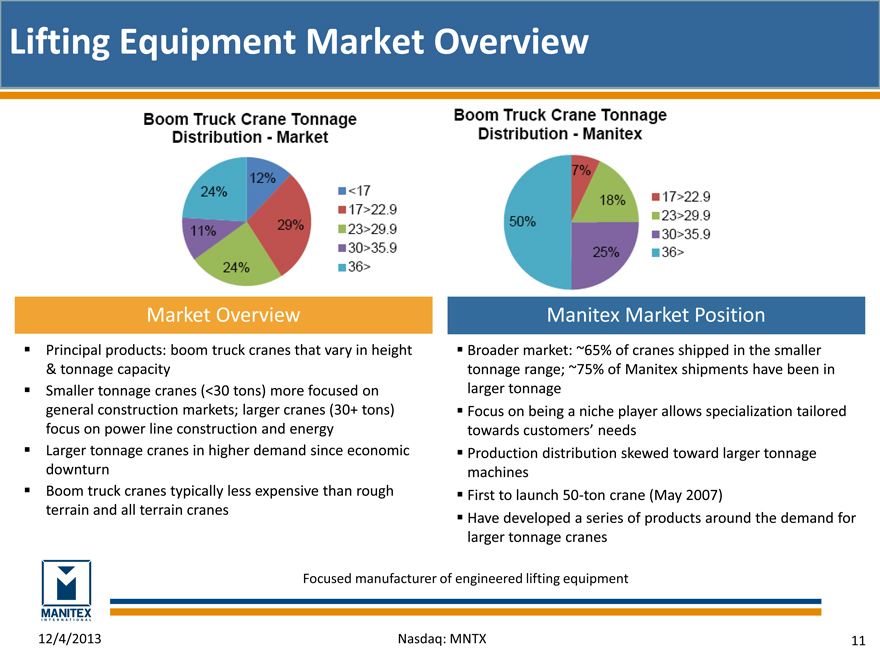
Lifting Equipment Market Overview
Boom Truck Crane Tonnage Distribution – Market
24%
11%
24%
29%
12%
<17
17>22.9
23>29.9
30>35.9
36>
Boom Truck Crane Tonnage Distribution – Manitex
50%
7%
18%
25%
17>22.9
23>29.9
30>35.9
36>
Market Overview
Principal products: boom truck cranes that vary in height & tonnage capacity Smaller tonnage cranes (<30 tons) more focused on general construction markets; larger cranes (30+ tons) focus on power line construction and energy Larger tonnage cranes in higher demand since economic downturn Boom truck cranes typically less expensive than rough terrain and all terrain cranes
Manitex Market Position
Broader market: ~65% of cranes shipped in the smaller tonnage range; ~75% of Manitex shipments have been in larger tonnage Focus on being a niche player allows specialization tailored towards customers’ needs
Production distribution skewed toward larger tonnage machines First to launch 50-ton crane (May 2007) Have developed a series of products around the demand for larger tonnage cranes
Focused manufacturer of engineered lifting equipment
12/4/2013 Nasdaq: MNTX 11
Replacement Parts & Service
Consistent Recurring Revenue
Consistent recurring revenue stream throughout the cycle Spares relate to swing drives, rotating components, and booms among others, many of which are proprietary
Serve additional brands
Service team for crane equipment
Automated proprietary system implemented in principal operations
Focused manufacturer of engineered lifting equipment
12/4/2013 Nasdaq: MNTX 12
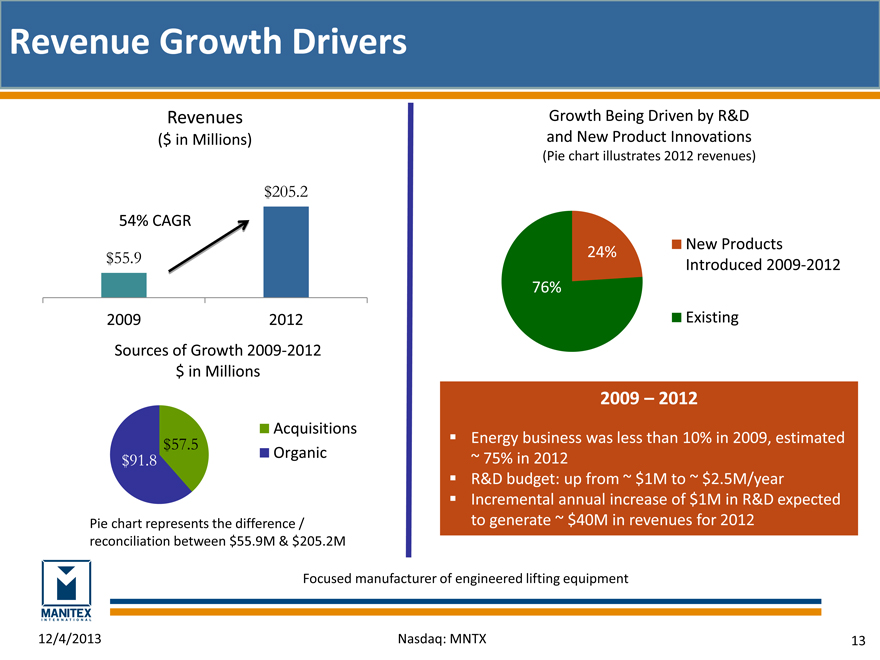
Revenue Growth Drivers
Revenues
($ in Millions)
54% CAGR
$55.9
2009
$205.2
2012
Sources of Growth 2009-2012 $ in Millions
Acquisitions Organic
$91.8
$57.5
Pie chart represents the difference / reconciliation between $55.9M & $205.2M
Growth Being Driven by R&D and New Product Innovations
(Pie chart illustrates 2012 revenues)
76%
24%
New Products Introduced 2009-2012
Existing
2009 – 2012
Energy business was less than 10% in 2009, estimated
~ 75% in 2012
R&D budget: up from ~ $1M to ~ $2.5M/year Incremental annual increase of $1M in R&D expected to generate ~ $40M in revenues for 2012
Focused manufacturer of engineered lifting equipment
12/4/2013 Nasdaq: MNTX 13
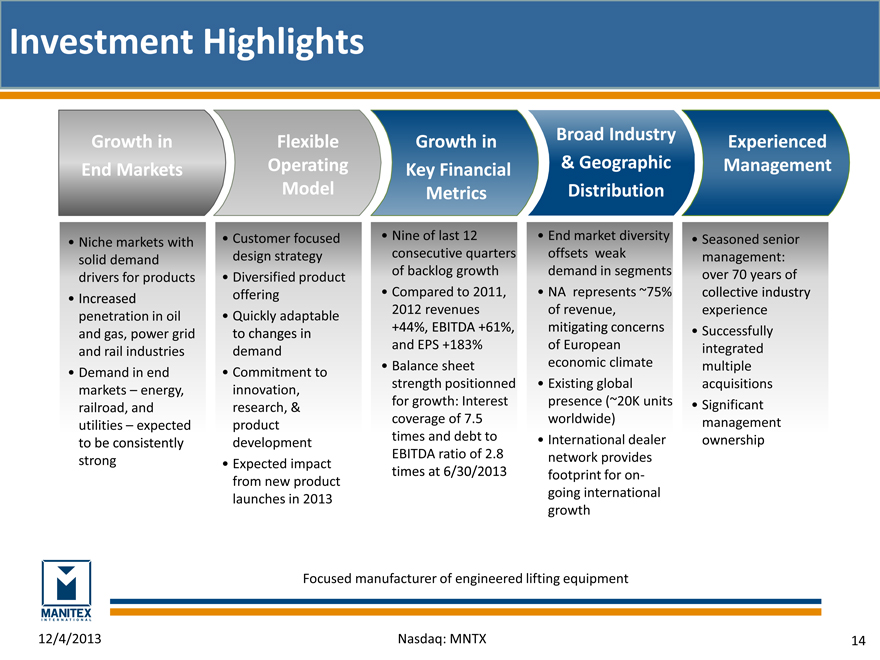
Investment Highlights
Growth in End Markets
Niche markets with solid demand drivers for products
Increased penetration in oil and gas, power grid and rail industries Demand in end markets – energy, railroad, and utilities – expected to be consistently strong
Flexible Operating Model
Customer focused design strategy Diversified product offering Quickly adaptable to changes in demand Commitment to innovation, research, & product development Expected impact from new product launches in 2013
Growth in Key Financial Metrics
Nine of last 12 consecutive quarters of backlog growth Compared to 2011, 2012 revenues
+44%, EBITDA +61%, and EPS +183% Balance sheet strength positionned for growth: Interest coverage of 7.5 times and debt to EBITDA ratio of 2.8 times at 6/30/2013
Broad Industry
& Geographic Distribution
End market diversity offsets weak demand in segments NA represents ~75% of revenue, mitigating concerns of European economic climate Existing global presence (~20K units worldwide) International dealer network provides footprint for on-going international growth
Experienced Management
Seasoned senior management: over 70 years of collective industry experience Successfully integrated multiple acquisitions Significant management ownership
Focused manufacturer of engineered lifting equipment
12/4/2013 Nasdaq: MNTX 14
Financial Overview
Manitex International, Inc.
September 2013
Focused manufacturer of engineered lifting equipment
12/4/2013 Nasdaq: MNTX 15
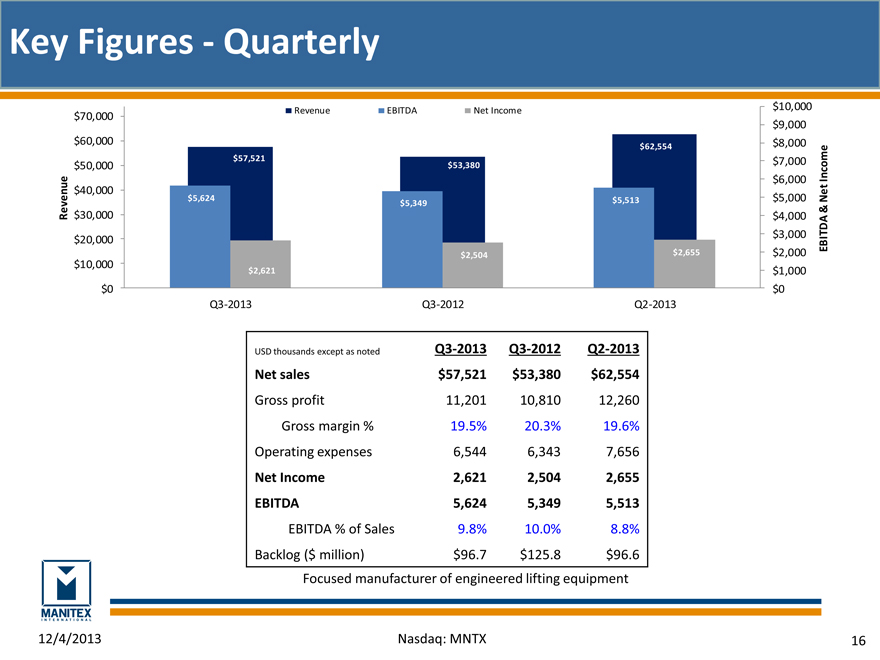
Key Figures—Quarterly
$70,000
$60,000
$50,000 nue $40,000 ve Re $30,000 $20,000
$10,000
$0
Revenue EBITDA Net Income
$57,521 $5,624 $2,621
$53,380 $5,349 $2,504
$62,554 $5,513 $2,655
$10,000 $9,000 $8,000 e $7,000 ncom $6,000I $5,000Net
& $4,000 $3,000 EBITDA $2,000 $1,000 $0
Q3-2013 Q3-2012 Q2-2013
USD thousands except as noted Q3-2013 Q3-2012 Q2-2013
Net sales $57,521 $53,380 $62,554
Gross profit 11,201 10,810 12,260 Gross margin % 19.5% 20.3% 19.6% Operating expenses 6,544 6,343 7,656
Net Income 2,621 2,504 2,655
EBITDA 5,624 5,349 5,513
EBITDA % of Sales 9.8% 10.0% 8.8%
Backlog ($ million) $96.7 $125.8 $96.6
Focused manufacturer of engineered lifting equipment
12/4/2013 Nasdaq: MNTX 16
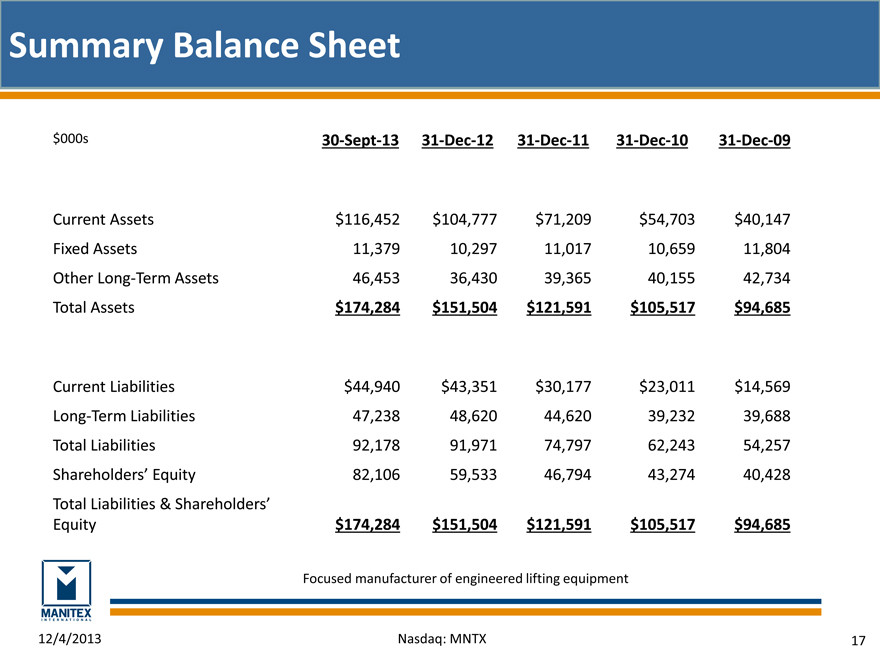
Summary Balance Sheet
$000s 30-Sept-13 31-Dec-12 31-Dec-11 31-Dec-10 31-Dec-09
Current Assets $116,452 $104,777 $71,209 $54,703 $40,147
Fixed Assets 11,379 10,297 11,017 10,659 11,804
Other Long-Term Assets 46,453 36,430 39,365 40,155 42,734
Total Assets $174,284 $151,504 $121,591 $105,517 $ 94,685
Current Liabilities $44,940 $43,351 $30,177 $23,011 $14,569
Long-Term Liabilities 47,238 48,620 44,620 39,232 39,688
Total Liabilities 92,178 91,971 74,797 62,243 54,257
Shareholders’ Equity 82,106 59,533 46,794 43,274 40,428
Total Liabilities & Shareholders’
Equity $174,284 $151,504 $121,591 $105,517 $ 94,685
Focused manufacturer of engineered lifting equipment
12/4/2013 Nasdaq: MNTX 17
Working Capital
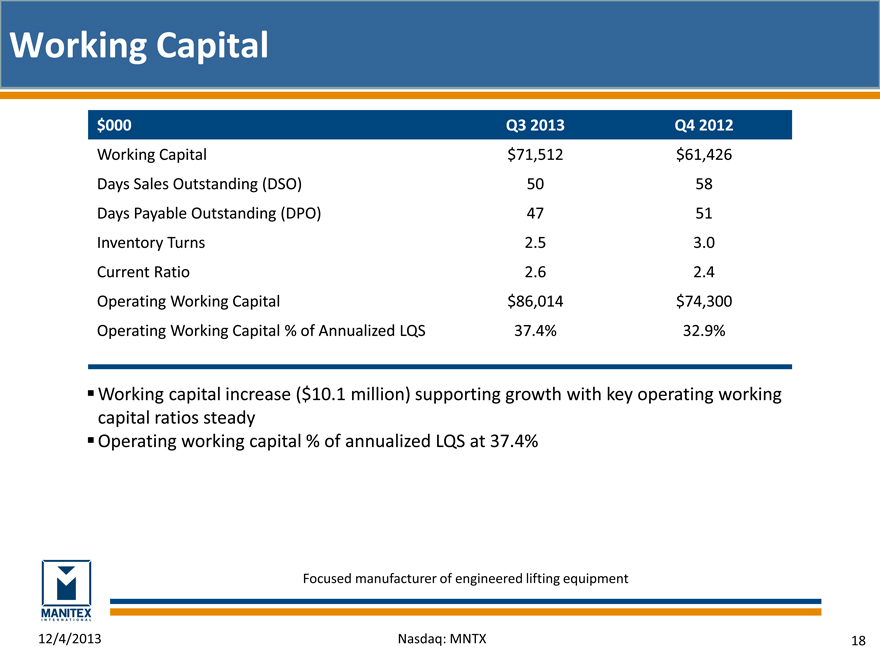
$000 Q3 2013 Q4 2012
Working Capital $71,512 $61,426 Days Sales Outstanding (DSO) 50 58 Days Payable Outstanding (DPO) 47 51 Inventory Turns 2.5 3.0 Current Ratio 2.6 2.4 Operating Working Capital $86,014 $74,300 Operating Working Capital % of Annualized LQS 37.4% 32.9%
Working capital increase ($10.1 million) supporting growth with key operating working capital ratios steady Operating working capital % of annualized LQS at 37.4%
Focused manufacturer of engineered lifting equipment
12/4/2013 Nasdaq: MNTX 18
Debt & Liquidity
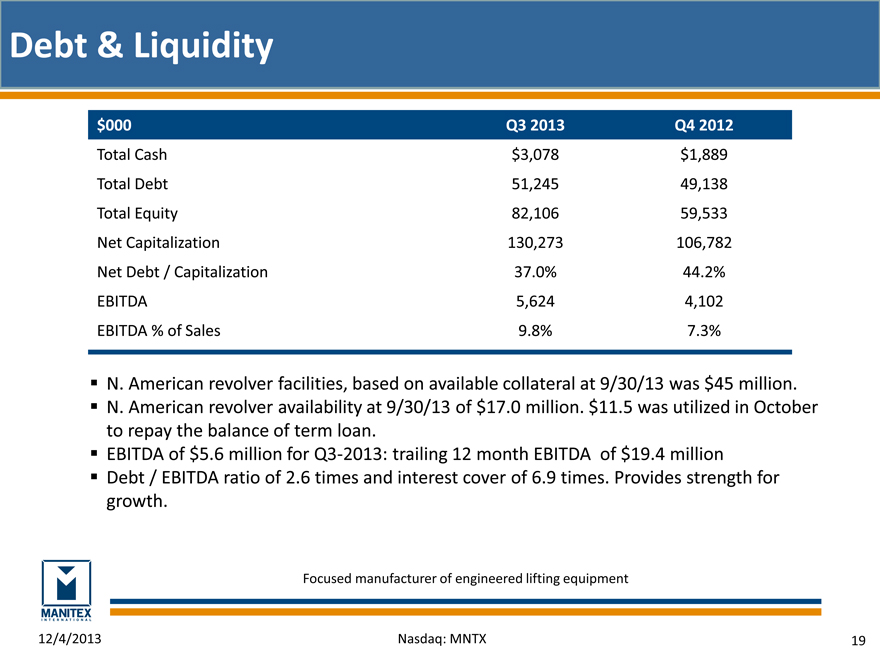
$000 Q3 2013 Q4 2012
Total Cash $3,078 $1,889
Total Debt 51,245 49,138
Total Equity 82,106 59,533
Net Capitalization 130,273 106,782
Net Debt / Capitalization 37.0% 44.2%
EBITDA 5,624 4,102
EBITDA % of Sales 9.8% 7.3%
N. American revolver facilities, based on available collateral at 9/30/13 was $45 million. N. American revolver availability at 9/30/13 of $17.0 million. $11.5 was utilized in October to repay the balance of term loan.
EBITDA of $5.6 million for Q3-2013: trailing 12 month EBITDA of $19.4 million Debt / EBITDA ratio of 2.6 times and interest cover of 6.9 times. Provides strength for growth.
Focused manufacturer of engineered lifting equipment
12/4/2013 Nasdaq: MNTX 19
Experienced Management Team
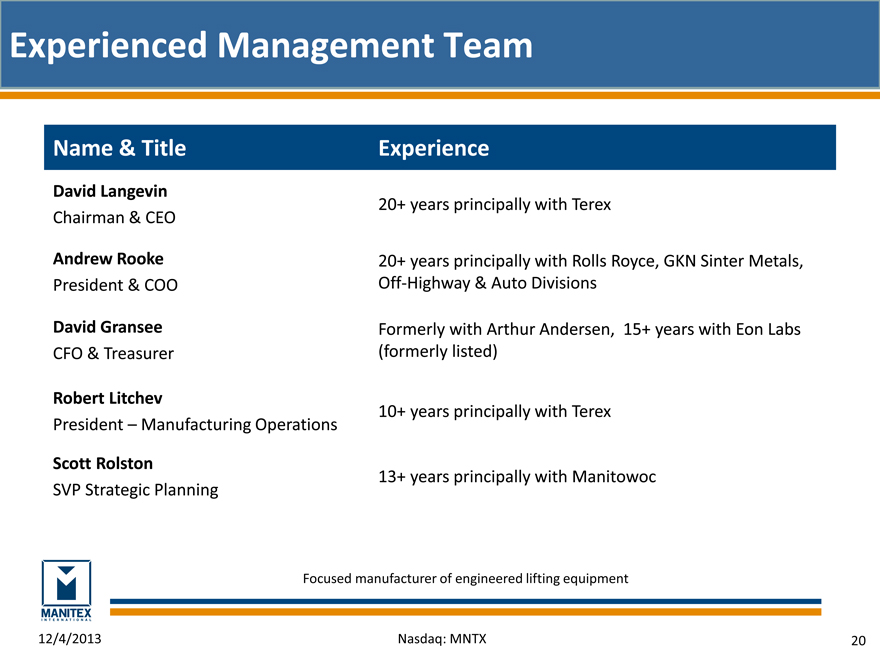
Name & Title Experience
David Langevin 20+ years principally with Terex Chairman & CEO
Andrew Rooke 20+ years principally with Rolls Royce, GKN Sinter Metals, President & COO Off-Highway & Auto Divisions
David Gransee Formerly with Arthur Andersen, 15+ years with Eon Labs CFO & Treasurer (formerly listed)
Robert Litchev 10+ years principally with Terex President – Manufacturing Operations
Scott Rolston 13+ years principally with Manitowoc SVP Strategic Planning
Focused manufacturer of engineered lifting equipment
12/4/2013 Nasdaq: MNTX 20
Company Timeline
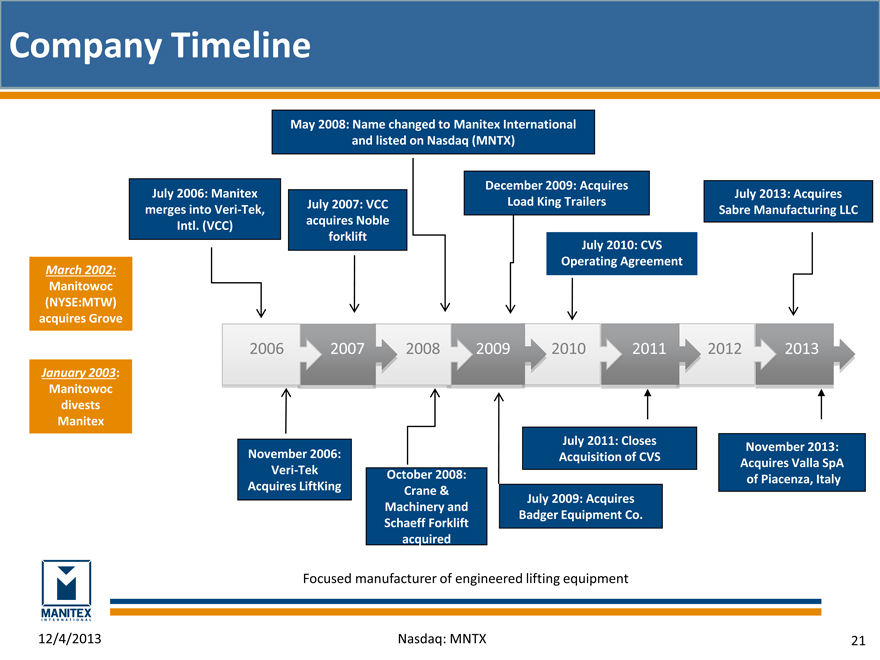
May 2008: Name changed to Manitex International and listed on Nasdaq (MNTX)
March 2002:
Manitowoc (NYSE:MTW) acquires Grove
January 2003: Manitowoc divests Manitex
July 2006: Manitex
July 2007: VCC merges into Veri-Tek, acquires Noble Intl. (VCC) forklift
December 2009: Acquires
July 2013: Acquires Load King Trailers Sabre Manufacturing LLC
July 2010: CVS Operating Agreement
2006 2007 2008 2009 2010 2011 2012 2013
July 2011: Closes
November 2013: November 2006: Acquisition of CVS
Acquires Valla SpA Veri-Tek October 2008: of Piacenza, Italy Acquires LiftKing Crane & July 2009: Acquires Machinery and Badger Equipment Co.
Schaeff Forklift acquired
Focused manufacturer of engineered lifting equipment
12/4/2013 Nasdaq: MNTX 21
Operating Companies
Brand
Products
Boom trucks and cranes
Sign cranes
Parts
Rough terrain cranes
Specialized construction equipment
Parts
Rough terrain forklifts
Special mission-oriented vehicles
Custom specialized carriers
Parts
Custom trailers
Hauling systems for heavy equipment transport
Parts
Reach stackers
Container handling forklifts
Parts
Specialized equipment for liquid storage & containment
8,000-21,000 gallon capacities
End Markets
Energy exploration
Power transmission
Industrial projects
Infrastructure development
Railroad
Construction
Refineries
Municipality
Military
Utility
Ship building
Commercial
Energy
Mining
Railroad
Commercial construction
Global container market
Large client base in energy sector
Petrochemical
Waste management
Oil & gas drilling
Drivers
Strong end market demand for specialized, competitively differentiated products for oil, gas, and energy sectors
Product development
Equipment replacement cycle in small tonnage flexible cranes for refinery market
More efficient product offering across end markets
Steady, profitable growth from both commercial and military application of products
U.S. energy exploration build-out
Oil and gas exploration
General infrastructure construction
International container market and global trade
Re-establishing customer relationships and select product categories
Reputation for quality & innovation
Serves a market of over $1B annually
At acquisition, TTM (3/31/13) revenues ~ $39.1M, adjusted EBITDA ~ $4.5M, EBIT ~ $4.2M
Focused manufacturer of engineered lifting equipment
12/4/2013 Nasdaq: MNTX 22
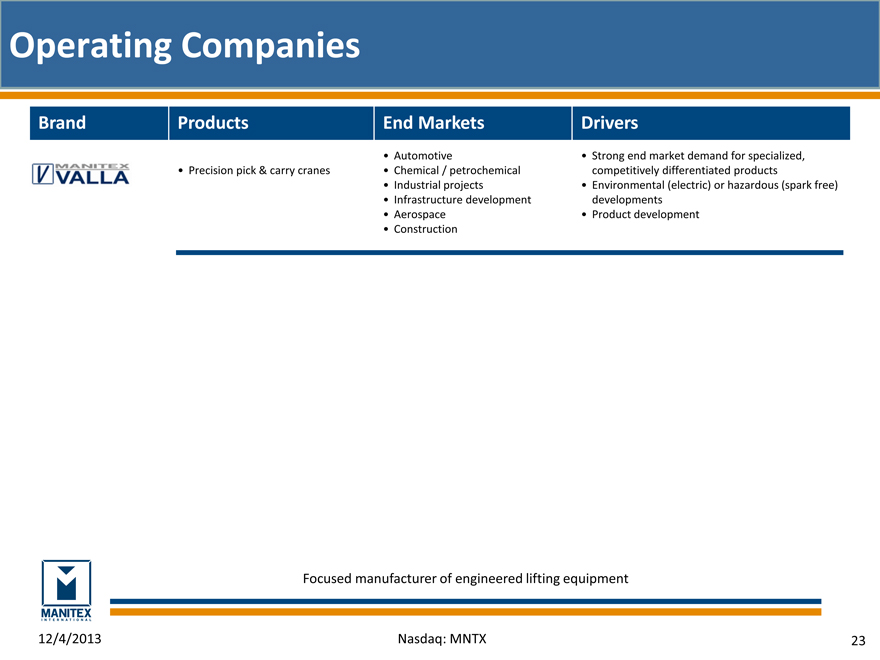
Operating Companies
Brand
Products End Markets Drivers
• Automotive • Strong end market demand for specialized,
Precision pick & carry cranes Chemical / petrochemical competitively differentiated products
• Industrial projects • Environmental (electric) or hazardous (spark free)
• Infrastructure development developments
• Aerospace • Product development
• Construction
Focused manufacturer of engineered lifting equipment
12/4/2013 Nasdaq: MNTX 23