 “Focused manufacturer of engineered lifting equipment” Manitex International, Inc. (NASDAQ:MNTX) Conference Call Second Quarter 2015 August 5th, 2015 Exhibit 99.2 |
 2 Forward Looking Statements & Non GAAP Measures “Focused manufacturer of engineered lifting equipment” Safe Harbor Statement under the U.S. Private Securities Litigation Reform Act of 1995: This presentation contains statements that are forward-looking in nature which express the beliefs and expectations of management including statements regarding the Company’s expected results of operations or liquidity; statements concerning projections, predictions, expectations, estimates or forecasts as to our business, financial and operational results and future economic performance; and statements of management’s goals and objectives and other similar expressions concerning matters that are not historical facts. In some cases, you can identify forward-looking statements by terminology such as “anticipate,” “estimate,” “plan,” “project,” “continuing,” “ongoing,” “expect,” “we believe,” “we intend,” “may,” “will,” “should,” “could,” and similar expressions. Such statements are based on current plans, estimates and expectations and involve a number of known and unknown risks, uncertainties and other factors that could cause the Company's future results, performance or achievements to differ significantly from the results, performance or achievements expressed or implied by such forward-looking statements. These factors and additional information are discussed in the Company's filings with the Securities and Exchange Commission and statements in this presentation should be evaluated in light of these important factors. Although we believe that these statements are based upon reasonable assumptions, we cannot guarantee future results. Forward-looking statements speak only as of the date on which they are made, and the Company undertakes no obligation to update publicly or revise any forward-looking statement, whether as a result of new information, future developments or otherwise. Non-GAAP Measures: Manitex International from time to time refers to various non-GAAP (generally accepted accounting principles) financial measures in this presentation. Manitex believes that this information is useful to understanding its operating results without the impact of special items. See Manitex’s Second Quarter 2015 Earnings Release on the Investor Relations section of our website www.manitexinternational.com for a description and/or reconciliation of these measures. |
 3 “Focused manufacturer of engineered lifting equipment” Overview Core boom truck market - impact of energy sector o Reduced new equipment purchases & redeployment of surplus equipment into other growing sectors Manitex diversification actions and benefits PM Group (acquisition January 15 th 2015) o $23m revenues and 10% EBITDA margins in Q2-2015 o Little exposure to energy or N. America markets, where MNTX is strong, growth in international markets ASV (51% acquisition December 2014) o $32m revenues and 10% EBITDA margins in Q2-2015 o General construction markets N. America & Australasia Cost and debt reduction and portfolio review o Cost saving project delivering to plan: approx. 50% of forecast ytd savings delivered in first half for benefit of $2.0 million |
 4 “Focused manufacturer of engineered lifting equipment” Commercial Overview Q2 market conditions generally slow. o Oil and gas demand significantly lower impacting core crane products o N. American general construction demand for our equipment steady in the quarter o European and international markets modest improvement and together with benefit from more competitive Euro. o Strong US dollar impacting translation of sales / profit as well as adversely impacting demand eg in Canada Significant activity and interest related to our new acquisition products o PM sales increased 17% compared to Q1-2015 with gains in N. America, Europe and Middle East o Assembly / manufacturing project at our Georgetown TX facility proceeding to plan o ASV brand well received and gaining momentum. o Full range of product for H2-2015 (skid steer and compact track loaders) o New ASV dealer sign-ups accelerating into second half of the year. 6/30/15 Backlog of $97.5 million (12/31/14, $107.3 million; 6/30/14, $102.5 million): o Broad based order book: ASV 13%, PM 18% both increases quarter over quarter, Manitex 69% o Military orders for second half of 2015 shipments included |
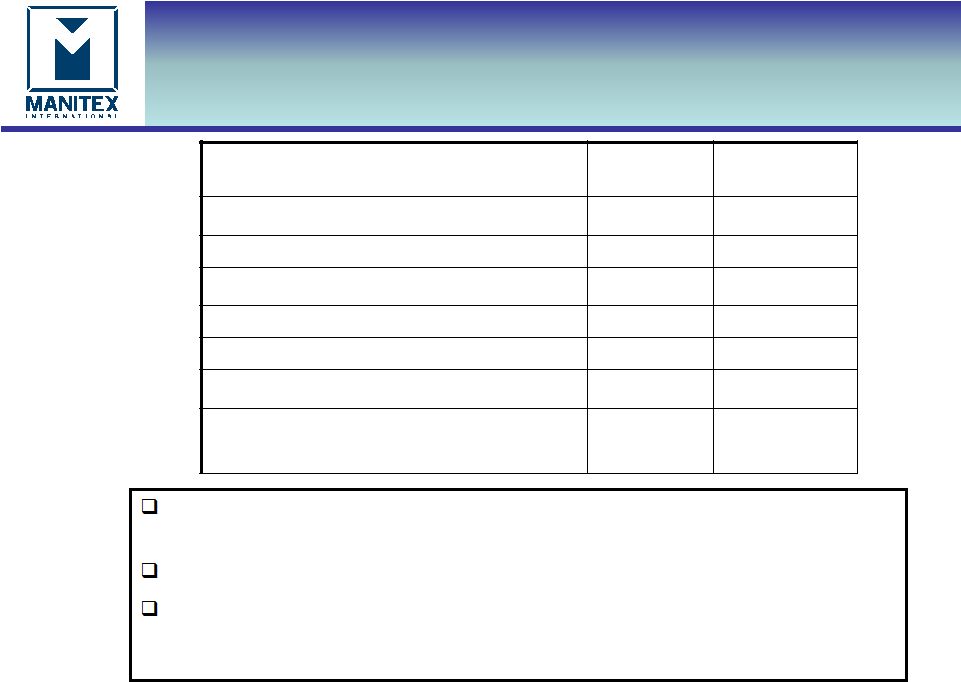
 5 Key Figures - Quarterly “Focused manufacturer of engineered lifting equipment” USD thousands Q2-2015* Q2-2014 Q1-2015* Net sales $105,604 $68,399 $105,882 % change in Q2-2015 to prior period 54.4% -- Gross profit 19,816 13,144 19,453 Gross margin % 18.8% 19.2% 18.4% Adjusted Operating expenses 14,811 7,966 14,284 Adjusted Net Income 351 2,986 1,518 Adjusted Earnings Per Share $0.02 $0.22 $0.10 Adjusted Ebitda 8,091 6,293 8,030 Adjusted Ebitda % of Sales 7.7% 9.2% 7.6% Working capital 97,548 84,392 98,938 Current ratio 1.8 2.5 1.8 Backlog 97,455 102,517 109,625 % change in Q2-2015 to prior period (9.2%) (11.1%) *As adjusted. See reconciliation to US GAAP on appendix |
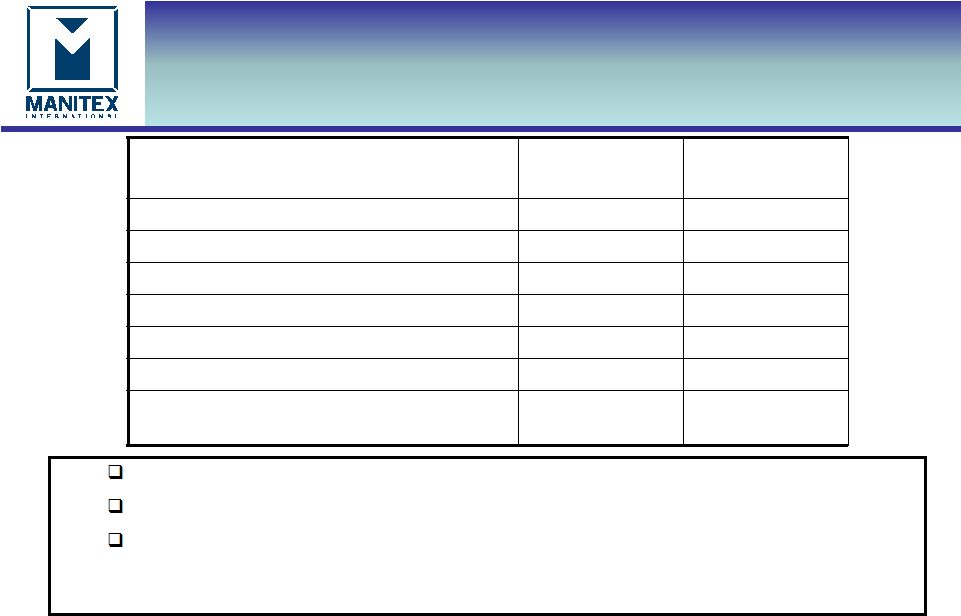
 6 “Focused manufacturer of engineered lifting equipment” Q2-2015 Operating Performance* (*as adjusted for acquisition related costs) $m Q2-2014 sales $68.4 Currency translation (10.2) Sales from acquisitions 55.4 Volume (8.0) Q2-2015 sales $105.6 $m Q2-2014 Net income $3.0 Increase in gross margin from sales 6.7 Operating expenses from acquisitions (7.8) Reduced SG&A & R&D 0.9 Interest expense (3.2) Other income (expense) (0.2) Tax & other 1.2 Attributable to noncontrolling interest (0.2) Q2-2015 Adjusted net income $0.4 |
 7 Working Capital “Focused manufacturer of engineered lifting equipment” $000 June 30, 2015 December 31, 2014 Working Capital $97,548 $85,627 Days sales outstanding (DSO) 68 83 Days payable outstanding (DPO) 60 60 Inventory turns 2.8 2.2 Current ratio 1.8 2.0 Operating working capital 145,506 121,571 Operating working capital % of annualized last quarters sales (LQS) 34.4% 45.4% Operating working capital increase of $23.9m of which $20.2m from PM acquisition in January. Improved % to LQS Working capital ratios now reflect higher proportion of international activity. Current ratio would be 2.1 at June 2015 adjusting for PM working capital facilities of $20.0m that are transactional and therefore current, (compared to N. American term lines of credit that are long term) |
 8 “Focused manufacturer of engineered lifting equipment” $000 June 30, 2015 December 31, 2014 Total Cash $6,308 $4,370 Total Debt 197,030 112,294 Total Equity 137,296 128,006 Net capitalization $328,018 $235,930 Net debt / capitalization 58.1% 45.7% Debt to Pro-forma TTM adjusted EBITDA ratio 5.5 5.4 Repayments of term debt of $5.2m in Q2-2015 and $8.0 million year to date June 30 th. . Cash and availability under working capital lines of $42 million. Cash provided by operating activities in three months ended June 30 th 2015 was $7.0 million, compared to usage of $4.4m for the second quarter of 2014. Debt & Liquidity • Net capitalization is the sum of debt plus equity minus cash • Net debt is total debt less cash |
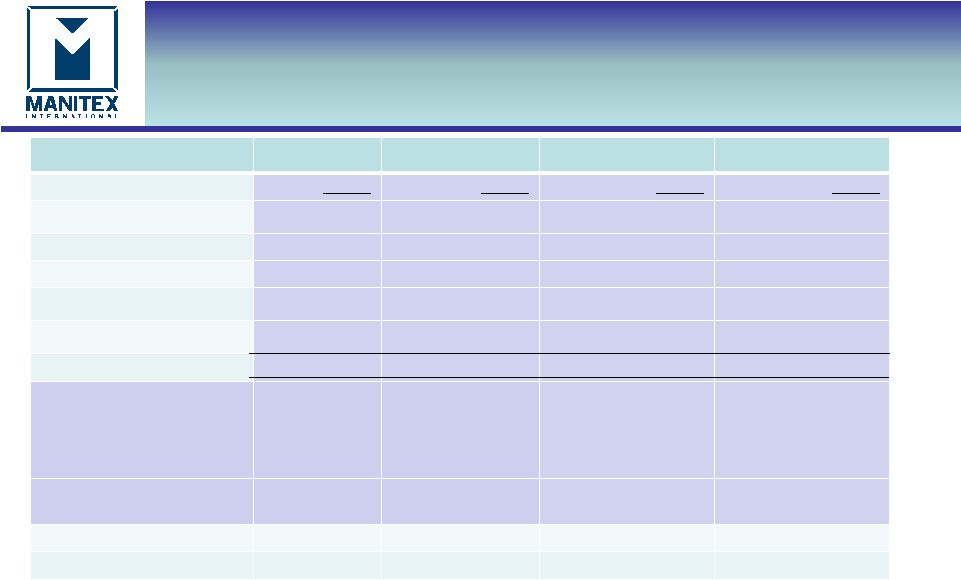 9 “Focused manufacturer of engineered lifting equipment” Debt USD millions PM ASV Manitex & CVS Total 6/30/15 6/30/15 6/30/15 6/30/15 Working capital borrowings 20.0 16.2 45.3 81.5 Bank term debt 35.4 39.0 9.1 83.5 Capital leases - 3.6 3.6 Convertible notes 21.0 21.0 Other notes 7.4 7.4 $55.4 $55.2 $86.4 $197.0 Note: Non-recourse to Manitex International Inc. $55.4 $55.2 $7.4 $115.4 Availability on working capital lines plus cash $42.0 |
 10 Summary “Focused manufacturer of engineered lifting equipment” Very clear goals in place Implementation and execution of integration of PM strategy Cash generation to continue debt reduction Expand ASV through new distribution Begin program of strategic rationalization to drive growth in highest margin products and operating units |
 11 APPENDIX “Focused manufacturer of engineered lifting equipment” Reconciliation of Q2-2015 Adjusted net income and adjusted EPS Reconciliation of Q2-2015 Adjusted EBITDA to GAAP net income Q2-2015 Acquisition and other expense Three Months Ended Six Months Ended June 30, 2015 June 30, 2014 June 30, 2015 June 30, 2014 Net income (loss) 138 2,986 (86) 4,863 Net income attributable to noncontrolling interest 178 -- 472 -- Income tax 134 1,437 168 2,342 Interest expense 3,899 716 6,833 1,521 Foreign currency transaction losses (gain) 266 (86) (679) (75) Other (income) expense & loss from non- marketable equity investment 29 125 78 138 Acquisition and other expense 361 -- 3,388 -- Depreciation & Amortization 3086 1,115 5,986 2,226 Adjusted Earnings before interest, taxes, depreciation and amortization (Adjusted EBITDA) $8,091 $6,293 $16,160 $11,015 Adjusted EBITDA % to sales 7.7% 9.2% 7.6% 8.4% Second Quarter 2015 Pre-tax After-tax EPS Deal transaction related $361 $258 $0.01 Exceptional operating cost -- -- -- Change in noncontrolling interest $(45) $(45) $-- Total $316 $213 $0.01 Three Months Ended Six Months Ended June 30, 2015 June 30, 2014 June 30, 2015 June 30, 2014 Net (loss) income as reported $138 $2,986 ($86) $4,863 Pre – tax acquisition and other expenses 361 -- 3,388 -- Tax effect based on jurisdictional blend (103) -- (982) -- Change in net income attributable to noncontrolling interest (45) -- (451) -- Adjusted Net Income $351 $2,986 $1,869 $4,863 Weighted average diluted shares outstanding 16,031,011 13,874,289 15,925,241 13,857,398 Diluted earnings per share as reported $0.01 $0.22 ($0.01) $0.35 Total EPS Effect $0.01 -- $0.13 -- Adjusted Diluted earnings per share $0.02 $0.22 $0.12 $0.35 |