Exhibit 99.1
MANITEX INTERNATIONAL, INC.
(NASD A Q : M N T X )
Corporate Presentation December 2015
FO RWARD-LOOKIN G S TAT E M E N T
& N O N—G A A P M E A S U R E S
Safe Harbor Statement under the U.S. Private Securities Litigation Reform Act of 1995: This presentation contains statements that are forward-looking in nature which express the beliefs and expectations of management including statements regarding the Company’s expected results of operations or liquidity; statements concerning projections, predictions, expectations, estimates or forecasts as to our business, financial and operational results and future economic performance; and statements of management’s goals and objectives and other similar expressions concerning matters that are not historical facts. In some cases, you can identify forward-looking statements by terminology such as “anticipate,” “estimate,” “plan,” “project,” “continuing,” “ongoing,” “expect,” “we believe,” “we intend,” “may,” “will,” “should,” “could,” and similar expressions. Such statements are based on current plans, estimates and expectations and involve a number of known and unknown risks, uncertainties and other factors that could cause the Company’s future results, performance or achievements to differ significantly from the results, performance or achievements expressed or implied by such forward-looking statements. These factors and additional information are discussed in the Company’s filings with the Securities and Exchange Commission and statements in this presentation should be evaluated in light of these important factors. Although we believe that these statements are based upon reasonable assumptions, we cannot guarantee future results. Forward-looking statements speak only as of the date on which they are made, and the Company undertakes no obligation to update publicly or revise any forward-looking statement, whether as a result of new information, future developments or otherwise.
Non-GAAP Measures: Manitex International from time to time refers to various non-GAAP (generally accepted accounting principles) financial measures in this presentation. Manitex believes that this information is useful to understanding its operating results without the impact of special items. See Manitex’s Q3 2015 earnings release on the Investor Relations section of our website www.manitexinternational.com for a description and/or reconciliation of these measures.
NASDAQ : MNTX
C O M PA N Y S N A P S H OT
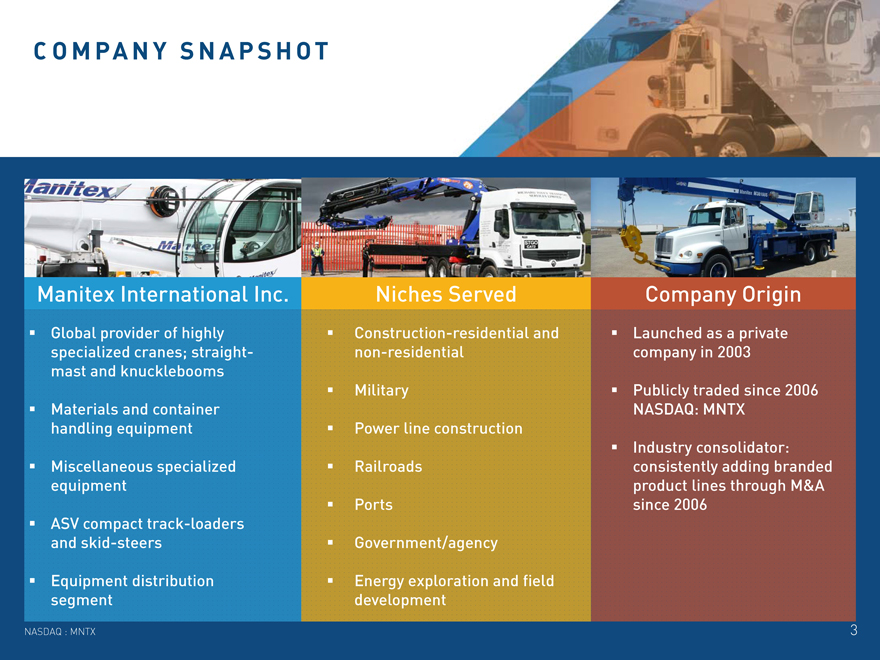
Manitex International Inc.
Global provider of highly specialized cranes; straight-mast and knucklebooms
Materials and container handling equipment
Miscellaneous specialized equipment
ASV compact track-loaders and skid-steers
Equipment distribution segment
Niches Served
Construction-residential and non-residential
Military
Power line construction Railroads Ports Government/agency
Energy exploration and field development
Company Origin
Launched as a private company in 2003
Publicly traded since 2006 NASDAQ: MNTX
Industry consolidator: consistently adding branded product lines through M&A since 2006
NASDAQ : MNTX
COMPA N Y T I M E L I N E
MARCH 2002
Manitowoc (NYSE:MTW) acquires Grove
JANUARY 2003
Manitowoc divests Manitex
NASDAQ : MNTX
O U R L A R G E S T P R O D U CT G R O U P S
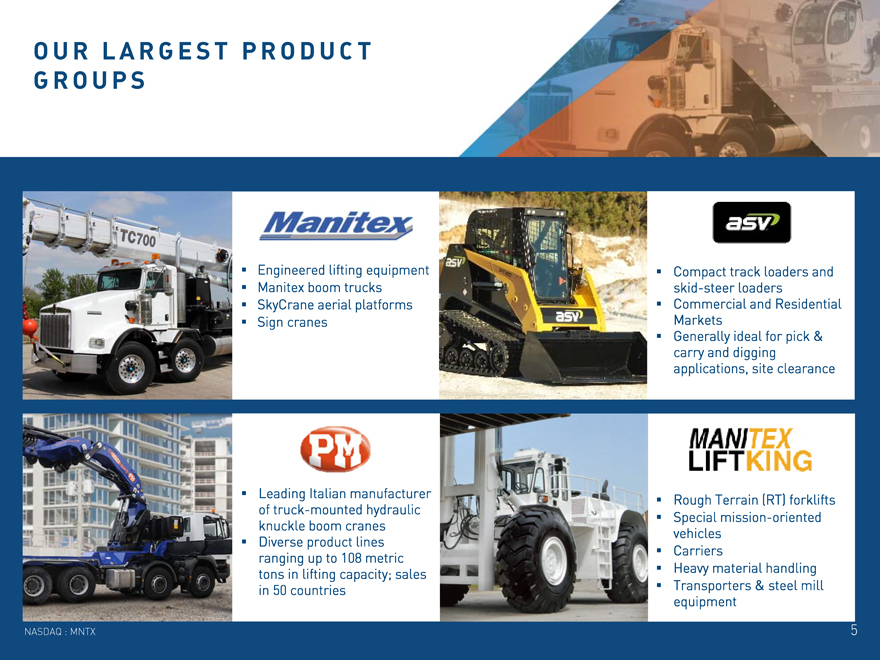
Engineered lifting equipment Manitex boom trucks SkyCrane aerial platforms Sign cranes
Compact track loaders and skid-steer loaders Commercial and Residential Markets Generally ideal for pick & carry and digging applications, site clearance
Leading Italian manufacturer of truck-mounted hydraulic knuckle boom cranes Diverse product lines ranging up to 108 metric tons in lifting capacity; sales in 50 countries
Rough Terrain (RT) forklifts Special mission-oriented vehicles Carriers Heavy material handling Transporters & steel mill equipment
NASDAQ : MNTX
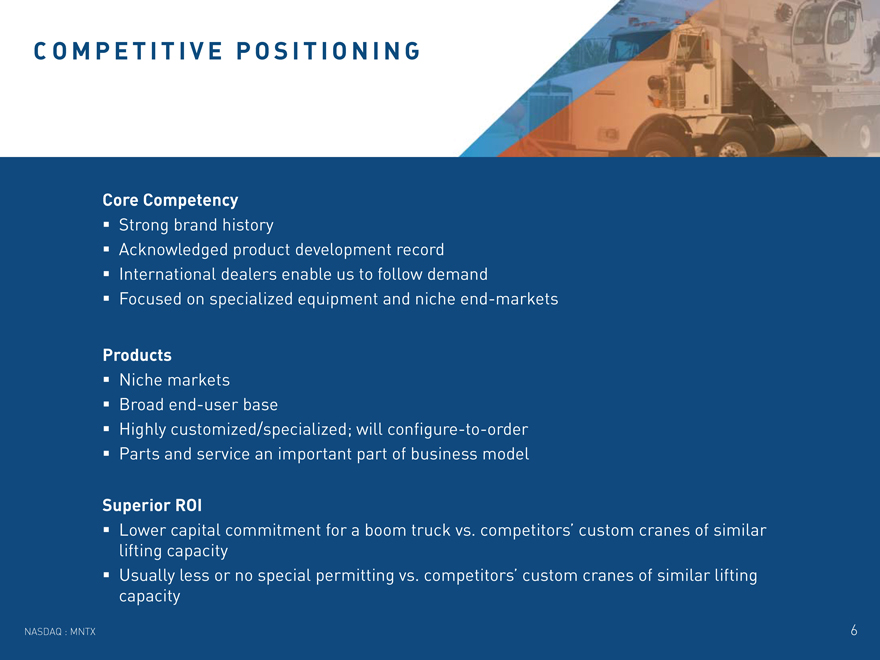
C O M P E T I T I V E P O S I T I O N I N G
Core Competency
Strong brand history
Acknowledged product development record International dealers enable us to follow demand
Focused on specialized equipment and niche end-markets
Products
Niche markets Broad end-user base
Highly customized/specialized; will configure-to-order Parts and service an important part of business model
Superior ROI
Lower capital commitment for a boom truck vs. competitors’ custom cranes of similar lifting capacity Usually less or no special permitting vs. competitors’ custom cranes of similar lifting capacity
NASDAQ : MNTX
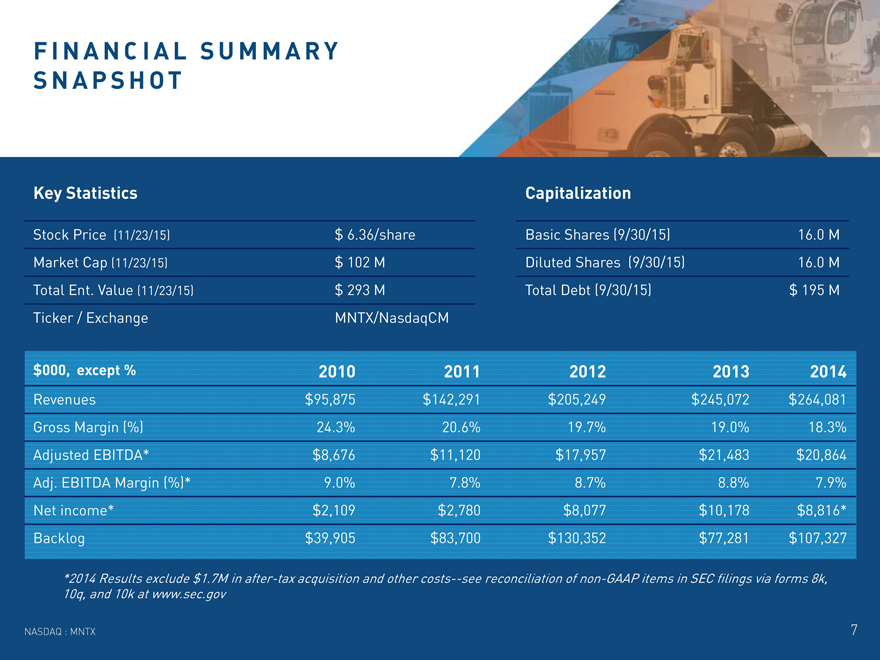
F I N A N C I A L S U M M A R Y S N A P S H OT
Key Statistics Capitalization
Stock Price (11/23/15) $ 6.36/share Basic Shares (9/30/15) 16.0 M Market Cap (11/23/15) $ 102 M Diluted Shares (9/30/15) 16.0 M Total Ent. Value (11/23/15) $ 293 M Total Debt (9/30/15) $ 195 M Ticker / Exchange MNTX/NasdaqCM
$000, except % 2010 2011 2012 2013 2014
Revenues $95,875 $142,291 $205,249 $245,072 $264,081 Gross Margin (%) 24.3% 20.6% 19.7% 19.0% 18.3% Adjusted EBITDA* $8,676 $11,120 $17,957 $21,483 $20,864 Adj. EBITDA Margin (%)* 9.0% 7.8% 8.7% 8.8% 7.9% Net income* $2,109 $2,780 $8,077 $10,178 $8,816* Backlog $39,905 $83,700 $130,352 $77,281 $107,327
*2014 Results exclude $1.7M in after-tax acquisition and other costs—see reconciliation of non-GAAP items in SEC filings via forms 8k, 10q, and 10k at www.sec.gov
NASDAQ : MNTX
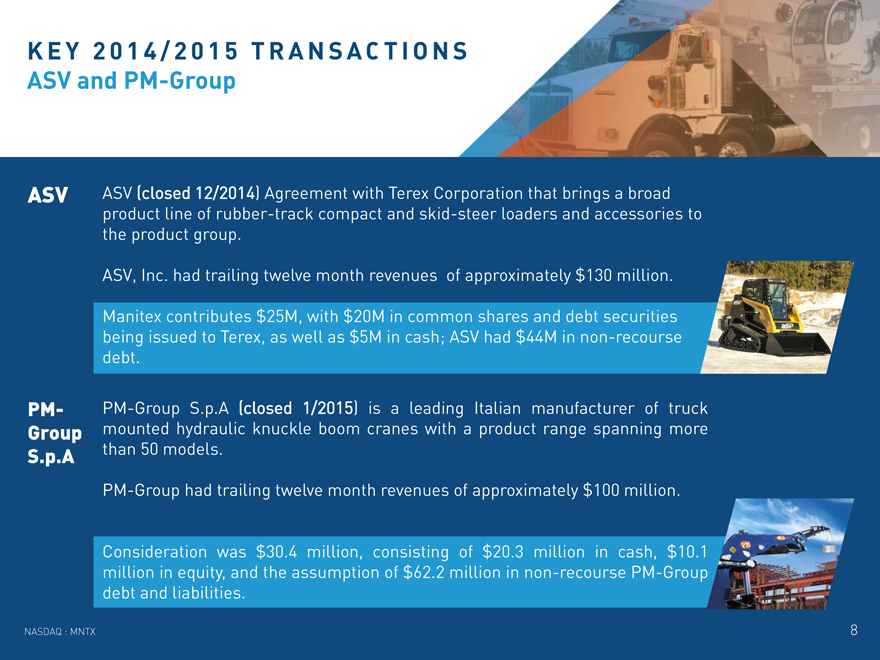
K E Y 2 0 1 4 / 2 0 1 5 T R A N S A CT I O N S ASV and PM-Group
ASV ASV (closed 12/2014) Agreement with Terex Corporation that brings a broad product line of rubber-track compact and skid-steer loaders and accessories to the product group.
ASV, Inc. had trailing twelve month revenues of approximately $130 million.
Manitex contributes $25M, with $20M in common shares and debt securities being issued to Terex, as well as $5M in cash; ASV had $44M in non-recourse debt.
PM- PM-Group S.p.A (closed 1/2015) is a leading Italian manufacturer of truck Group mounted hydraulic knuckle boom cranes with a product range spanning more than 50 models.
S.p.A
PM-Group had trailing twelve month revenues of approximately $100 million.
Consideration was $30.4 million, consisting of $20.3 million in cash, $10.1 million in equity, and the assumption of $62.2 million in non-recourse PM-Group debt and liabilities.
NASDAQ : MNTX
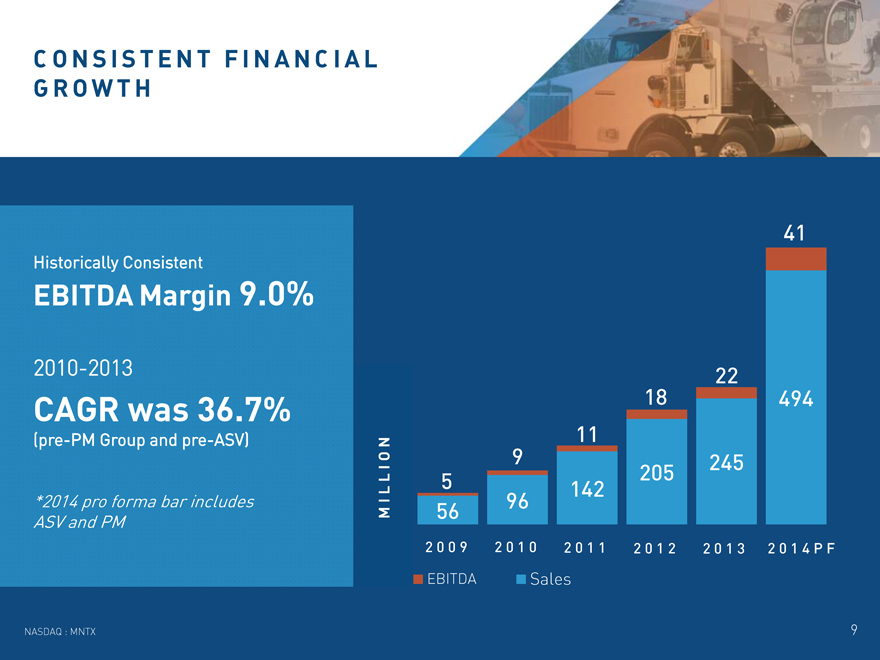
C O N S I S T E N T F I N A N C I A L G R O W T H
Historically Consistent
EBITDA Margin 9.0%
2010-2013
CAGR was 36.7%
(pre-PM Group and pre-ASV)
*2014 pro forma bar includes ASV and PM
41
22
18 494 11
9 205 245
MILLION 96
56
2009 2010 2011 2012 2013 2014P F
EBITDA Sales
NASDAQ : MNTX
9
M A R G I N E X PA N S I O N O P P O R T U N I T I E S 2015-2017
Cost reductions through sourcing and operating efficiency initiatives
$4 million in expense reductions identified for 2015; $3 million realized through 9/30/15 $15 million in additional expense reductions to be implemented through 2018
Continued integration of ASV and PM Group
Optimize our capital allocation
Invest in and grow our higher margin businesses-PM, ASV, Manitex are our portfolio’s “top producers” with respect to margins and addressable markets Consider “addition by subtraction” for lower margin units that could have synergies elsewhere
Balance sheet improvement
Return our debt and capital ratios to historic range Reduce debt servicing costs
NASDAQ : MNTX
10
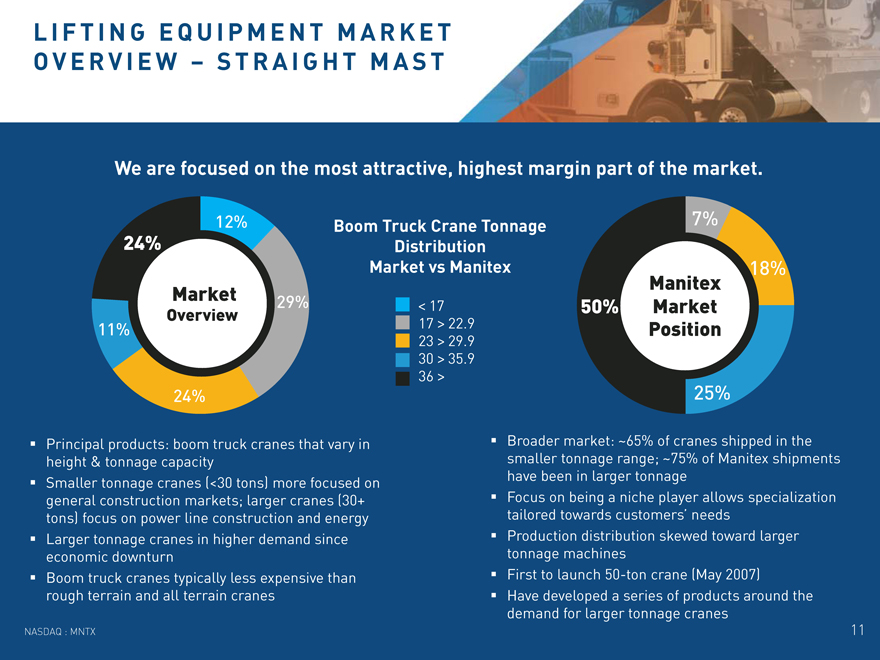
L I F T I N G E Q U I P M E N T M A R K E T O V E R V I E W – S T R A I G H T M A S T
We are focused on the most attractive, highest margin part of the market.
12% 7%
Boom Truck Crane Tonnage 24% Distribution
Market vs Manitex 18%
Manitex Market 29% < 17 50% Market
Overview
17 > 22.9
11% Position
23 > 29.9
30 > 35.9
36 >
24% 25%
Principal products: boom truck cranes that vary in height & tonnage capacity Smaller tonnage cranes (<30 tons) more focused on general construction markets; larger cranes (30+ tons) focus on power line construction and energy Larger tonnage cranes in higher demand since economic downturn Boom truck cranes typically less expensive than rough terrain and all terrain cranes
Broader market: ~65% of cranes shipped in the smaller tonnage range; ~75% of Manitex shipments have been in larger tonnage Focus on being a niche player allows specialization tailored towards customers’ needs Production distribution skewed toward larger tonnage machines First to launch 50-ton crane (May 2007) Have developed a series of products around the demand for larger tonnage cranes
NASDAQ : MNTX
11
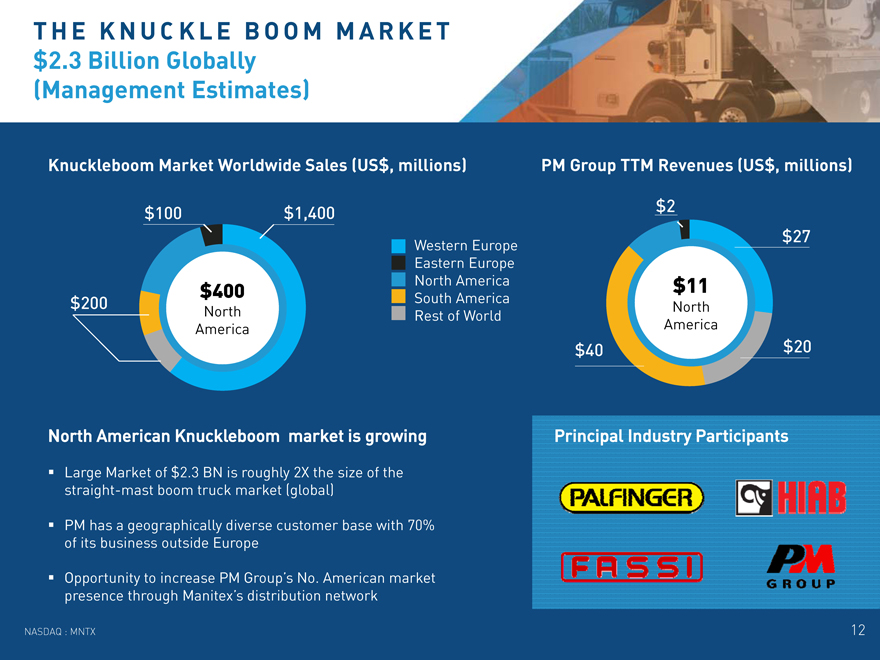
T H E K N U C K L E B O O M M A R K E T $2.3 Billion Globally (Management Estimates)
Knuckleboom Market Worldwide Sales (US$, millions) PM Group TTM Revenues (US$, millions)
$2 $100 $1,400
Western Europe $27 Eastern Europe North America $11 $400 South America $200 North North Rest of World America America
$40 $20
North American Knuckleboom market is growing
Large Market of $2.3 BN is roughly 2X the size of the straight-mast boom truck market (global)
PM has a geographically diverse customer base with 70% of its business outside Europe
Opportunity to increase PM Group’s No. American market presence through Manitex’s distribution network
NASDAQ : MNTX
Principal Industry Participants
12
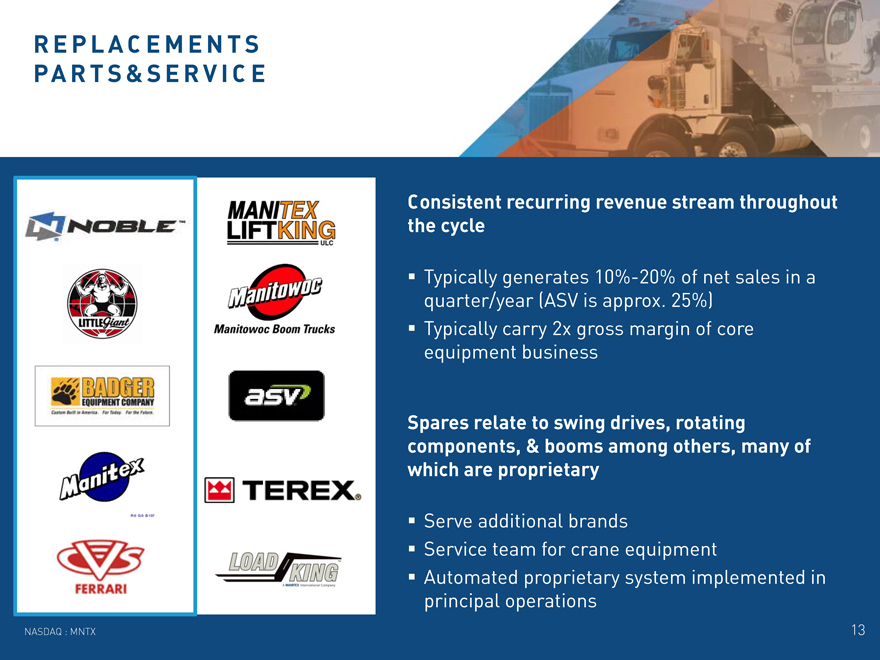
REPLA C E M E N T S PA R T S & S E R V I C E
Consistent recurring revenue stream throughout the cycle
Typically generates 10%-20% of net sales in a quarter/year (ASV is approx. 25%) Typically carry 2x gross margin of core equipment business
Spares relate to swing drives, rotating components, & booms among others, many of which are proprietary
Serve additional brands
Service team for crane equipment
Automated proprietary system implemented in principal operations
NASDAQ : MNTX
13
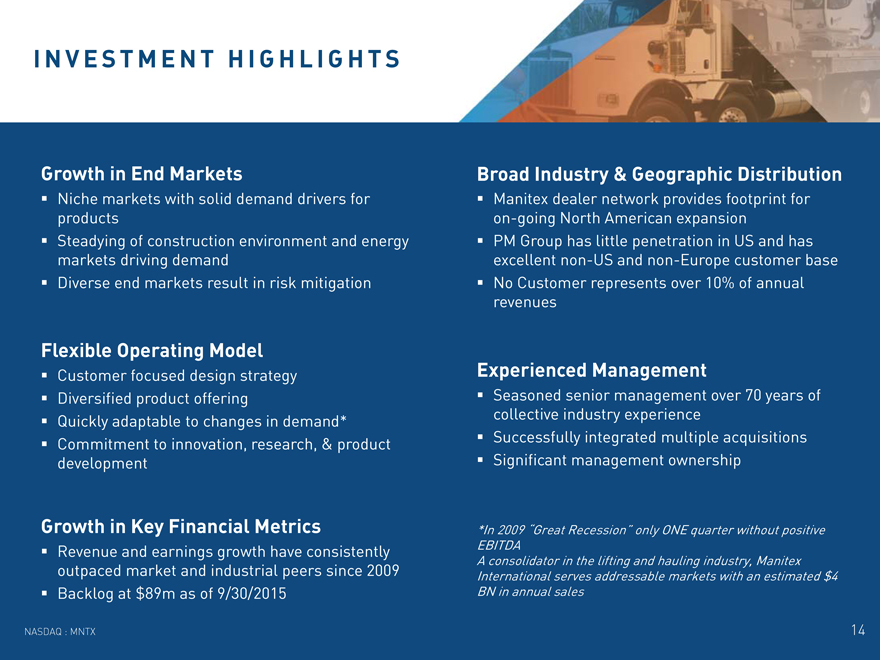
I N V E S T M E N T H I G H L I G H T S
Growth in End Markets
Niche markets with solid demand drivers for products Steadying of construction environment and energy markets driving demand Diverse end markets result in risk mitigation
Flexible Operating Model
Customer focused design strategy Diversified product offering Quickly adaptable to changes in demand* Commitment to innovation, research, & product development
Growth in Key Financial Metrics
Revenue and earnings growth have consistently outpaced market and industrial peers since 2009 Backlog at $89m as of 9/30/2015
Broad Industry & Geographic Distribution
Manitex dealer network provides footprint for on-going North American expansion PM Group has little penetration in US and has excellent non-US and non-Europe customer base No Customer represents over 10% of annual revenues
Experienced Management
Seasoned senior management over 70 years of collective industry experience Successfully integrated multiple acquisitions Significant management ownership
*In 2009 “Great Recession” only ONE quarter without positive EBITDA
A consolidator in the lifting and hauling industry, Manitex International serves addressable markets with an estimated $4 BN in annual sales
NASDAQ : MNTX
14
MANITEX INTERNATIONAL, INC.
F I N A N C I A L O V E R V I E W
December 2015
*Results may contain adjustments, please see reconciliation to GAAP on Slide 20 and other Manitex source disclosure and CSS filings.
15
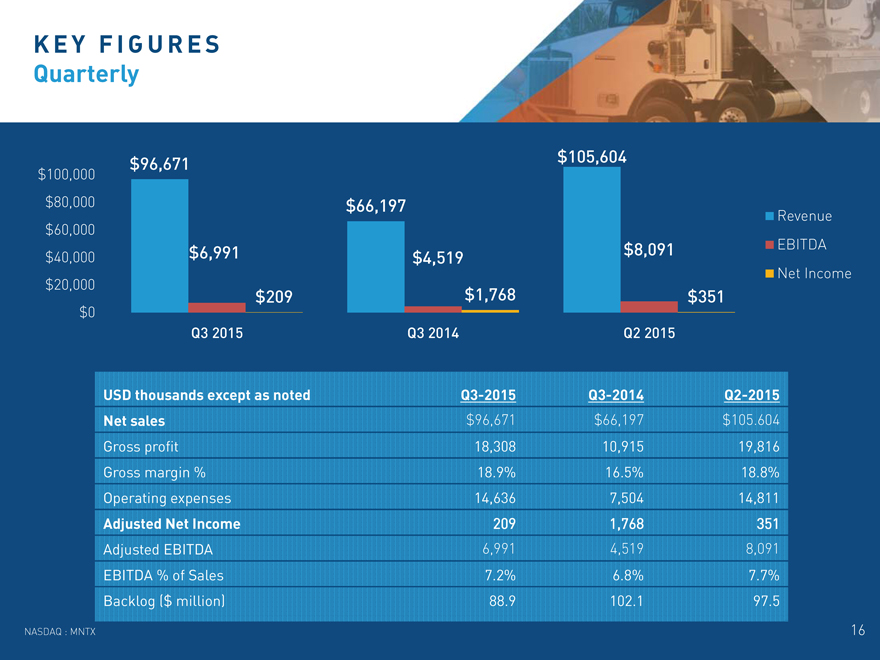
K E Y F I G U R E S Quarterly
$105,604 $96,671 $100,000
$80,000 $66,197
Revenue $60,000 $8,091 EBITDA $40,000 $6,991 $4,519
Net Income $20,000 $209 $1,768 $351 $0
Q3 2015 Q3 2014 Q2 2015
USD thousands except as noted Q3-2015 Q3-2014 Q2-2015
Net sales $96,671 $66,197 $105.604
Gross profit 18,308 10,915 19,816 Gross margin % 18.9% 16.5% 18.8% Operating expenses 14,636 7,504 14,811
Adjusted Net Income 209 1,768 351 Adjusted EBITDA 6,991 4,519 8,091 EBITDA % of Sales 7.2% 6.8% 7.7% Backlog ($ million) 88.9 102.1 97.5
NASDAQ : MNTX
16
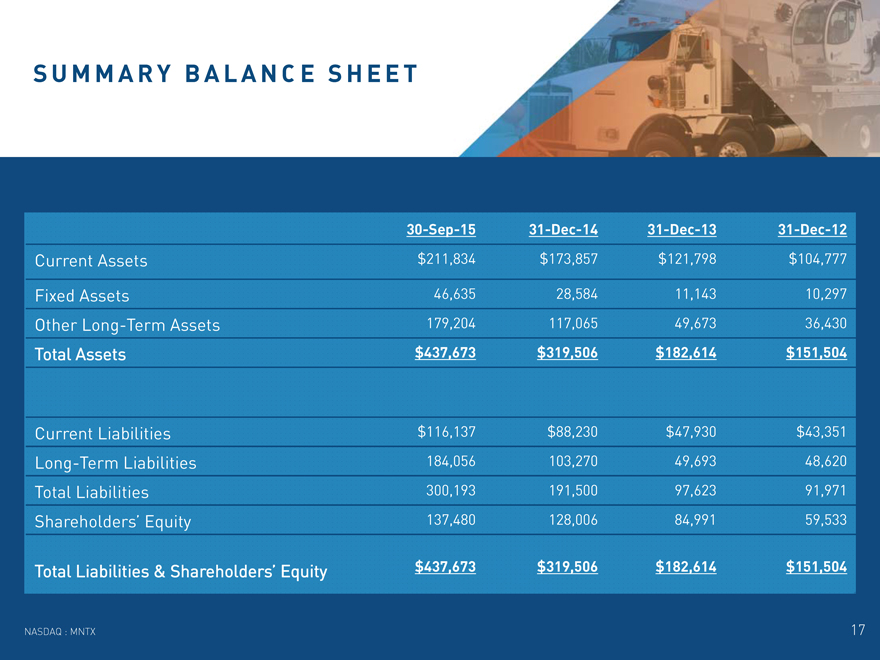
S U M M A R Y B A L A N C E S H E E T
30-Sep-15 31-Dec-14 31-Dec-13 31-Dec-12
Current Assets $211,834 $173,857 $121,798 $104,777 Fixed Assets 46,635 28,584 11,143 10,297 Other Long-Term Assets 179,204 117,065 49,673 36,430
Total Assets $437,673 $319,506 $182,614 $151,504
Current Liabilities $116,137 $88,230 $47,930 $43,351 Long-Term Liabilities 184,056 103,270 49,693 48,620 Total Liabilities 300,193 191,500 97,623 91,971 Shareholders’ Equity 137,480 128,006 84,991 59,533
Total Liabilities & Shareholders’ Equity $437,673 $319,506 $182,614 $151,504
NASDAQ : MNTX
17
W O R K I N G C A P I TA L
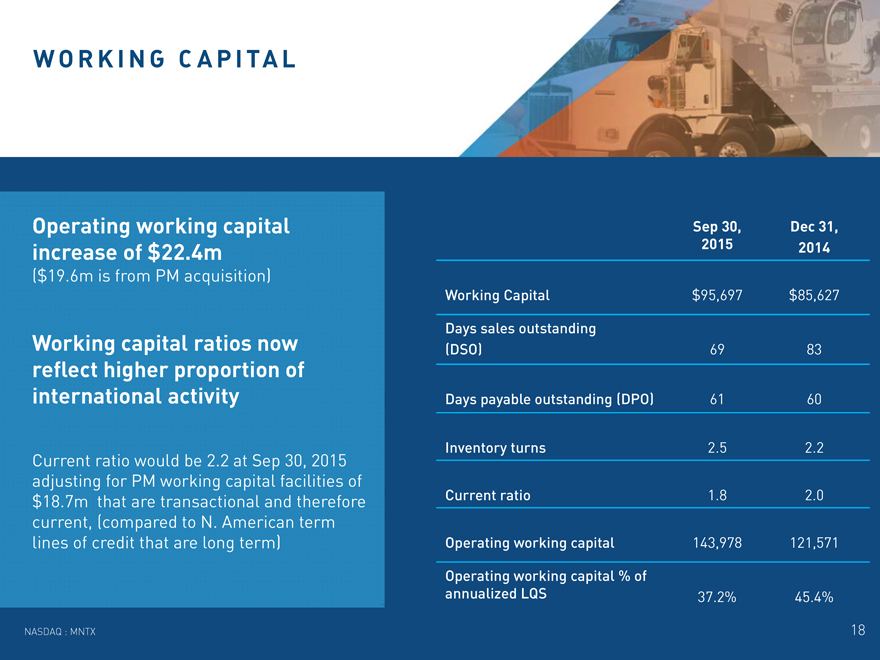
Operating working capital increase of $22.4m
($19.6m is from PM acquisition)
Working capital ratios now reflect higher proportion of international activity
Current ratio would be 2.2 at Sep 30, 2015 adjusting for PM working capital facilities of $18.7m that are transactional and therefore current, (compared to N. American term lines of credit that are long term)
Sep 30, Dec 31, 2015 2014
Working Capital $95,697 $85,627
Days sales outstanding
(DSO) 69 83 Days payable outstanding (DPO) 61 60 Inventory turns 2.5 2.2 Current ratio 1.8 2.0
Operating working capital 143,978 121,571
Operating working capital % of annualized LQS 37.2% 45.4%
NASDAQ : MNTX
18
D E B T A N D L I Q U I D I T Y
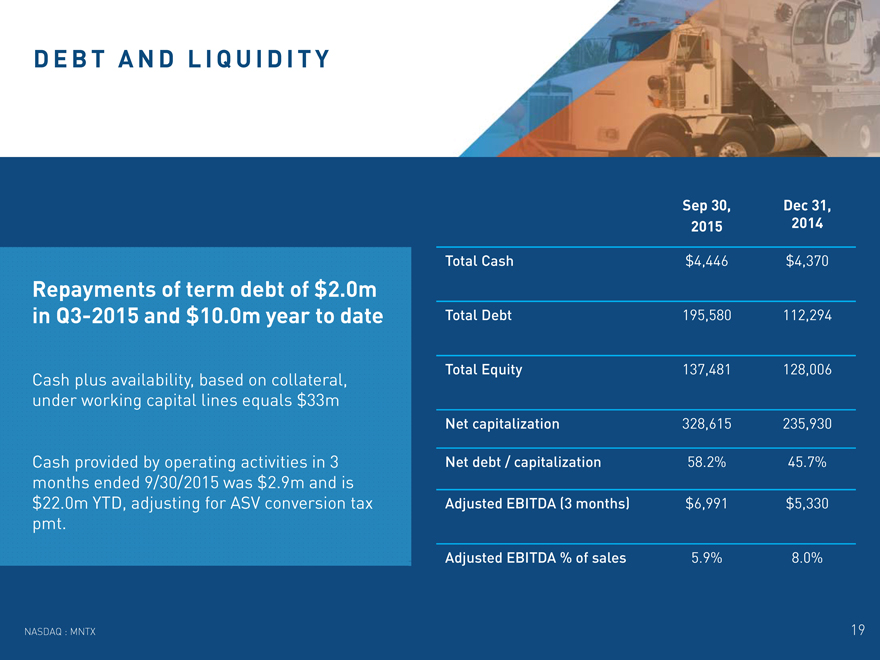
Repayments of term debt of $2.0m in Q3-2015 and $10.0m year to date
Cash plus availability, based on collateral, under working capital lines equals $33m
Cash provided by operating activities in 3 months ended 9/30/2015 was $2.9m and is $22.0m YTD, adjusting for ASV conversion tax pmt.
Sep 30, Dec 31, 2015 2014
Total Cash $4,446 $4,370 Total Debt 195,580 112,294 Total Equity 137,481 128,006
Net capitalization 328,615 235,930 Net debt / capitalization 58.2% 45.7% Adjusted EBITDA (3 months) $6,991 $5,330
Adjusted EBITDA % of sales 5.9% 8.0%
NASDAQ : MNTX
19
D E B T A N D L I Q U I D I T Y
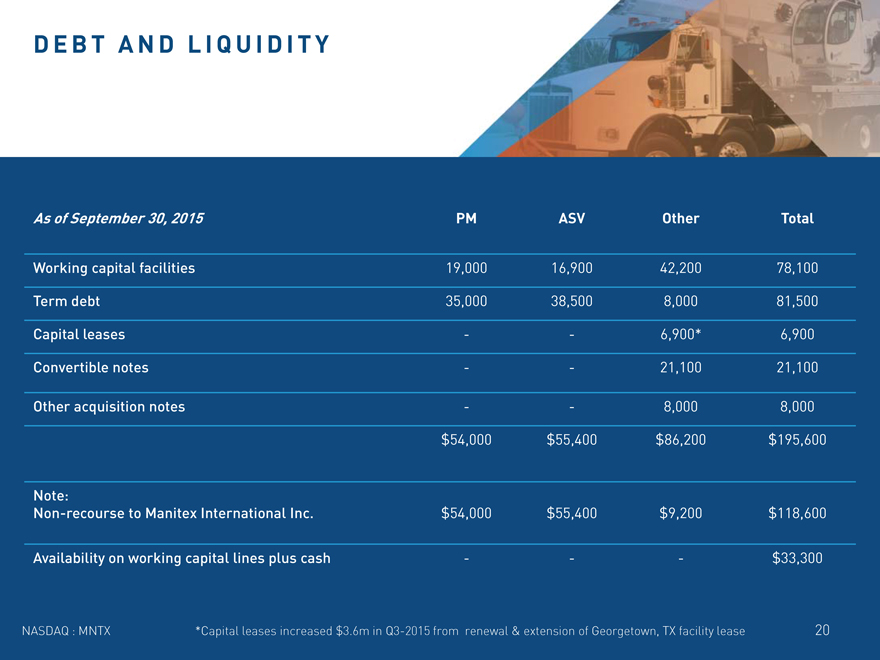
As of September 30, 2015 PM ASV Other Total
Working capital facilities 19,000 16,900 42,200 78,100
Term debt 35,000 38,500 8,000 81,500
Capital leases — 6,900* 6,900 Convertible notes — 21,100 21,100
Other acquisition notes — 8,000 8,000 $54,000 $55,400 $86,200 $195,600
Note:
Non-recourse to Manitex International Inc. $54,000 $55,400 $9,200 $118,600
Availability on working capital lines plus cash ——$33,300
NASDAQ : MNTX *Capital leases increased $3.6m in Q3-2015 from renewal & extension of Georgetown, TX facility lease
20
*NON-G A A P R E C O N C I L I AT I O N S Q3 2015
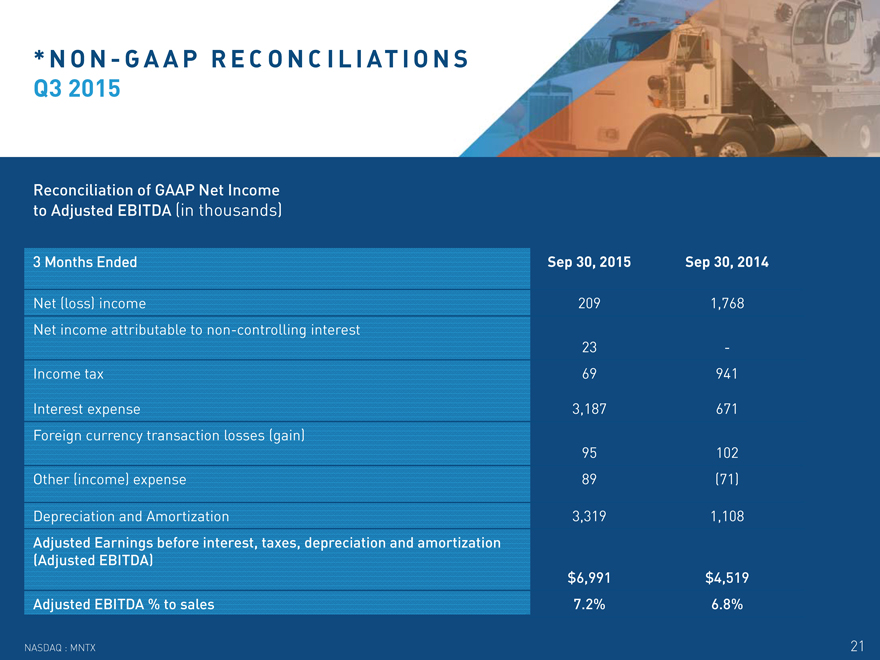
Reconciliation of GAAP Net Income to Adjusted EBITDA (in thousands)
3 | | Months Ended Sep 30, 2015 Sep 30, 2014 |
Net (loss) income 209 1,768 Net income attributable to non-controlling interest
23 -Income tax 69 941
Interest expense 3,187 671 Foreign currency transaction losses (gain)
95 102 Other (income) expense 89 (71)
Depreciation and Amortization 3,319 1,108
Adjusted Earnings before interest, taxes, depreciation and amortization (Adjusted EBITDA) $6,991 $4,519
Adjusted EBITDA % to sales 7.2% 6.8%
NASDAQ : MNTX
21
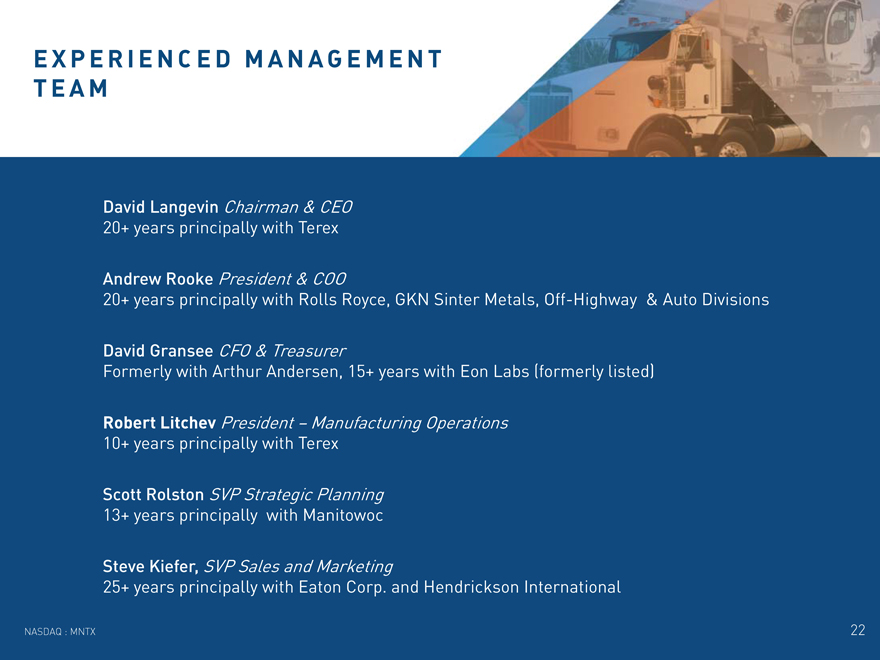
E X P E R I E N C E D M A N A G E M E N T T E A M
David Langevin Chairman & CEO
20+ years principally with Terex
Andrew Rooke President & COO
20+ years principally with Rolls Royce, GKN Sinter Metals, Off-Highway & Auto Divisions
David Gransee CFO & Treasurer
Formerly with Arthur Andersen, 15+ years with Eon Labs (formerly listed)
Robert Litchev President – Manufacturing Operations
10+ years principally with Terex
Scott Rolston SVP Strategic Planning
13+ years principally with Manitowoc
Steve Kiefer, SVP Sales and Marketing
25+ years principally with Eaton Corp. and Hendrickson International
NASDAQ : MNTX
22
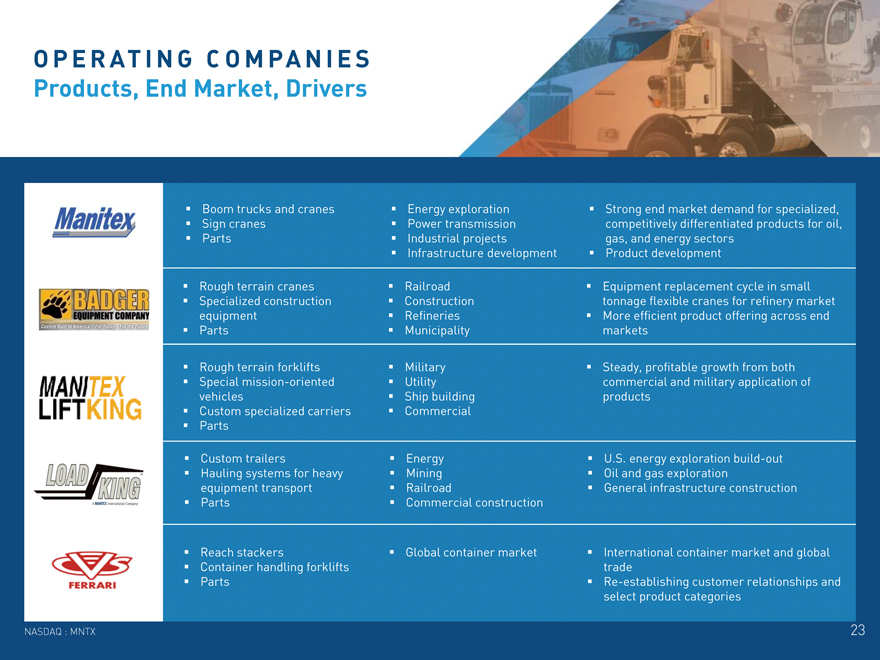
OPERAT I N G C O M PA N I E S Products, End Market, Drivers
Boom trucks and cranes Sign cranes Parts
Rough terrain cranes Specialized construction equipment Parts
Rough terrain forklifts Special mission-oriented vehicles Custom specialized carriers Parts
Custom trailers
Hauling systems for heavy equipment transport Parts
Reach stackers
Container handling forklifts Parts
Energy exploration Power transmission Industrial projects Infrastructure development
Railroad Construction Refineries Municipality
Military Utility Ship building Commercial
Energy Mining Railroad
Commercial construction
Global container market
Strong end market demand for specialized, competitively differentiated products for oil, gas, and energy sectors Product development
Equipment replacement cycle in small tonnage flexible cranes for refinery market More efficient product offering across end markets
Steady, profitable growth from both commercial and military application of products
U.S. energy exploration build-out Oil and gas exploration General infrastructure construction
International container market and global trade Re-establishing customer relationships and select product categories
NASDAQ : MNTX
23
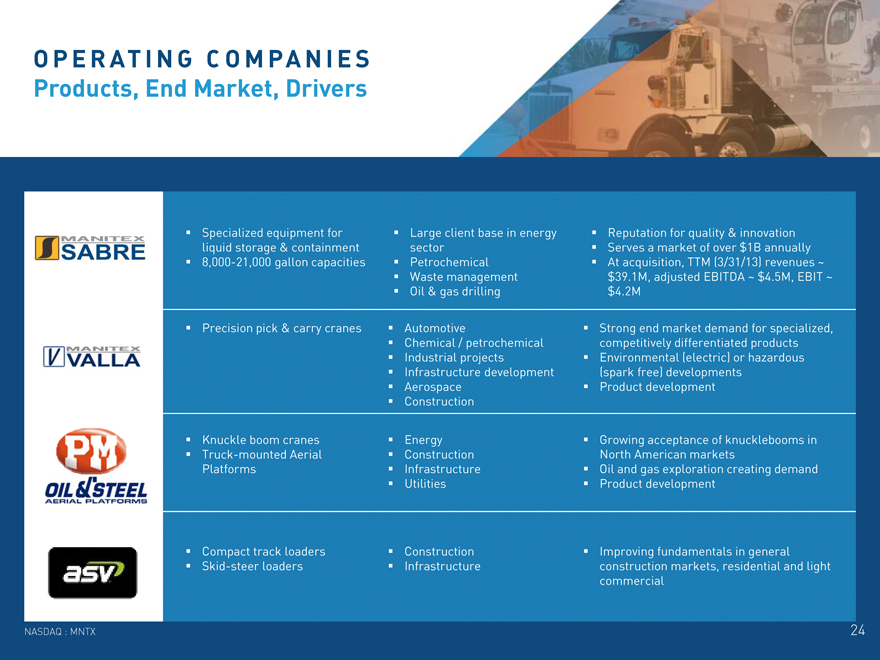
OPERAT I N G C O M PA N I E S Products, End Market, Drivers
Specialized equipment for liquid storage & containment 8,000-21,000 gallon capacities
Precision pick & carry cranes
Knuckle boom cranes Truck-mounted Aerial Platforms
Compact track loaders Skid-steer loaders
Large client base in energy sector Petrochemical Waste management Oil & gas drilling
Automotive
Chemical / petrochemical Industrial projects Infrastructure development Aerospace Construction
Energy Construction Infrastructure Utilities
Construction Infrastructure
Reputation for quality & innovation Serves a market of over $1B annually At acquisition, TTM (3/31/13) revenues ~ $39.1M, adjusted EBITDA ~ $4.5M, EBIT ~ $4.2M
Strong end market demand for specialized, competitively differentiated products Environmental (electric) or hazardous (spark free) developments Product development
Growing acceptance of knucklebooms in North American markets Oil and gas exploration creating demand Product development
Improving fundamentals in general construction markets, residential and light commercial
NASDAQ : MNTX
24
MANITEX INTERNATIONAL, INC.
(NASD A Q : M N T X ) D e ce m b e r 2 0 1 5
D a v i d L a n g e v i n , C E O
7 | | 0 8—2 3 7—2 0 6 0 d j l a n g e v i n @ a o l . c o m |
P e t e r S e l t z b e r g , I R D a r r o w A s s o c i a t e s , I n c .
5 | | 1 6—5 1 0—8 7 6 8 p s e l t z b e r g @ d a r r o w i r. c o m |
25