|
Exhibit 99.1 
|
MANITEX INTERNATIONAL, INC.
(NASDAQ: MNTX)
Corporate Presentation
March 2017
|
|
Safe Harbor Statement under the U.S. Private Securities Litigation Reform Act of 1995: This presentation contains statements that are forward-looking in nature which express the beliefs and expectations of management including statements regarding the Company’s expected results of operations or liquidity; statements concerning projections, predictions, expectations, estimates or forecasts as to our business, financial and operational results and future economic performance; and statements of management’s goals and objectives and other similar expressions concerning matters that are not historical facts. In some cases, you can identify forward-looking statements by terminology such as “anticipate,” “estimate,” “plan,” “project,” “continuing,” “ongoing,” “expect,” “we believe,” “we intend,” “may,” “will,” “should,” “could,” and similar expressions. Such statements are based on current plans, estimates and expectations and involve a number of known and unknown risks, uncertainties and other factors that could cause the Company’s future results, performance or achievements to differ significantly from the results, performance or achievements expressed or implied by such forwardlooking statements. These factors and additional information are discussed in the Company’s filings with the Securities and Exchange Commission and statements in this presentation should be evaluated in light of these important factors. Although we believe that these statements are based upon reasonable assumptions, we cannot guarantee future results. Forwardlooking statements speak only as of the date on which they are made, and the Company undertakes no obligation to update publicly or revise any forward-looking statement, whether as a result of new information, future developments or otherwise.Non-GAAP Measures: Manitex International from time to time refers to variousnon-GAAP (generally accepted accounting principles) financial measures in this presentation. Manitex believes that this information is useful to understanding its operating results without the impact of special items. See Manitex’s Q4 2016 earnings release on the Investor Relations section of our website www.manitexinternational.com for a description and/or reconciliation of these measures. FORWARD-LOOKING STATEMENT &NON-GAAP MEASURES NASDAQ : MNTX 2
|

|
PRODUCT OVERVIEW ? Global provider of highly specialized straight- mast and knuckle booms cranes ? Miscellaneous specialized industrial equipment ? ASV compact track-loaders and skid-steers ? Equipment distribution segment ? Construction-residential andnon-residential ? Power line construction ? Railroads ? Energy exploration and field development ? Warehouses and distribution ? Launched as a private company in 2003 as divested from Manitowoc ? Publicly traded since 2006 NASDAQ: MNTX ? Industry consolidator: consistently adding branded product lines through M&A since 2006 Manitex International Inc. NASDAQ : MNTX 3 Niches Served Company Origin
|
|
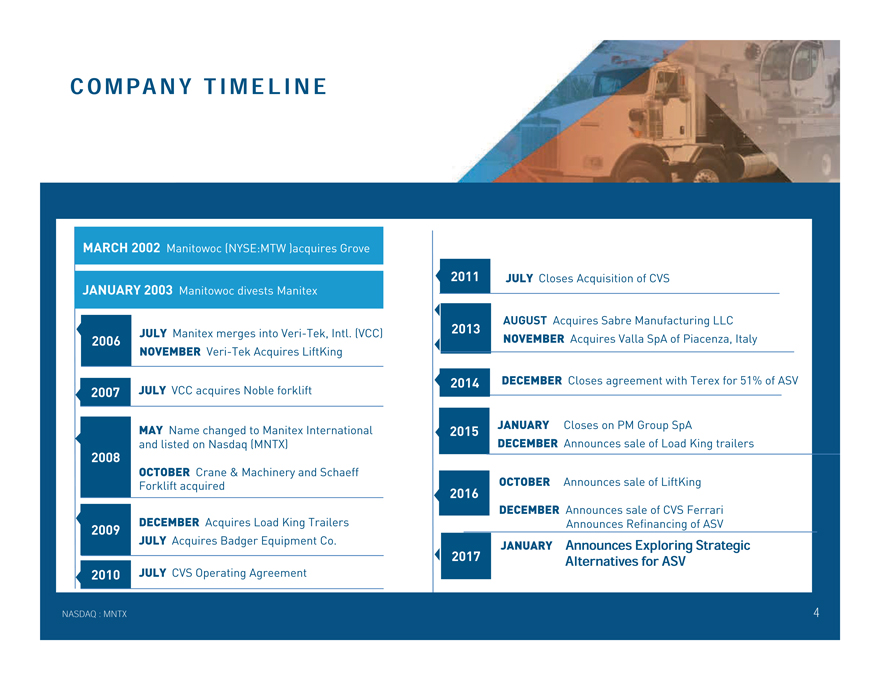
Here are my thoughts: Sidoti is top 10 among a limited number of options for companies that have limited or no institutional sponsorship. There will be people there, but like Craig Hallum’s conference in November and all others that we’ve attended, you can expect only a few 1/1s to be booked by their team with qualified investment pros, and there will be numerous bankers and service providers that will pop up COMPANY TIMELINE NASDAQ : MNTX 4 MARCH 2002 Manitowoc (NYSE:MTW )acquires Grove JANUARY 2003 Manitowoc divests Manitex 2006 JULY Manitex merges intoVeri-Tek, Intl. (VCC) NOVEMBERVeri-Tek Acquires LiftKing 2007 JULY VCC acquires Noble forklift 2008 MAY Name changed to Manitex International and listed on Nasdaq (MNTX) OCTOBER Crane & Machinery and Schaeff Forklift acquired 2009 DECEMBER Acquires Load King Trailers JULY Acquires Badger Equipment Co. 2010 JULY CVS Operating Agreement 2011 JULY Closes Acquisition of CVS 2013 AUGUST Acquires Sabre Manufacturing LLC NOVEMBER Acquires Valla SpA of Piacenza, Italy 2014 DECEMBER Closes agreement with Terex for 51% of ASV 2015 JANUARY Closes on PM Group SpA DECEMBER Announces sale of Load King trailers 2016 OCTOBER Announces sale of LiftKing DECEMBER Announces sale of CVS Ferrari Announces Refinancing of ASV 2017 JANUARY Announces Exploring Strategic Alternatives for ASV
|
|
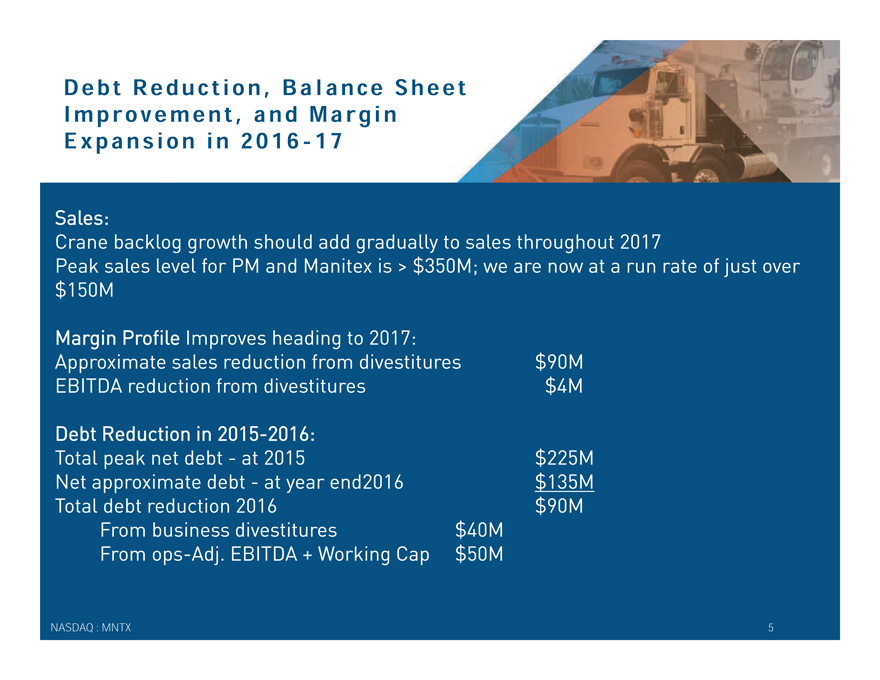
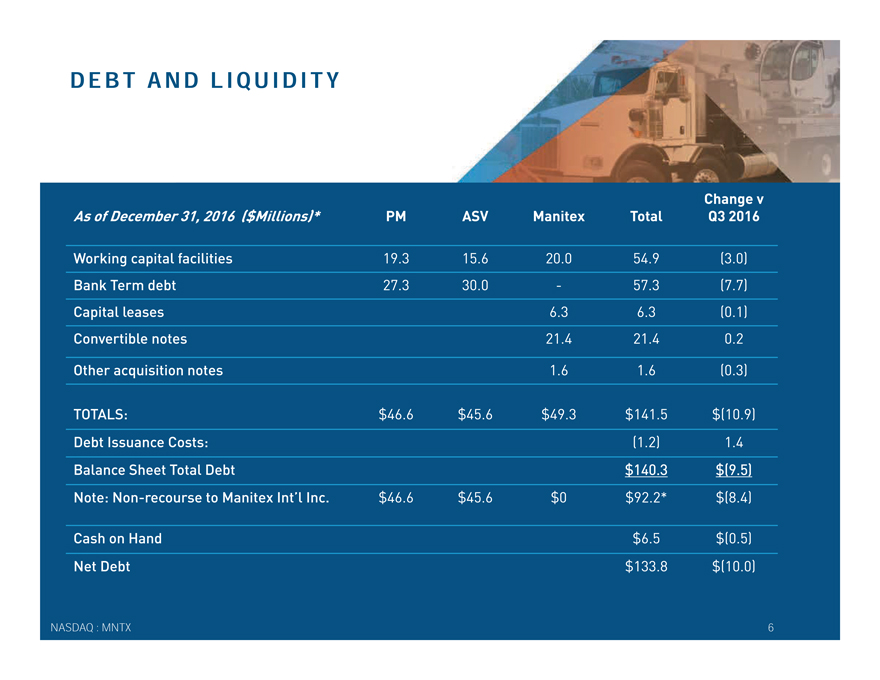
Debt Reduction, Balance Sheet Improvement, and Margi n Expansion in2016-17 Sales: Crane backlog growth should add gradually to sales throughout 2017 Peak sales level for PM and Manitex is > $350M; we are now at a run rate of just over $150M Margin Profile Improves heading to 2017: Approximate sales reduction from divestitures $90M EBITDA reduction from divestitures $4M Debt Reduction in 2015-2016: Total peak net debt—at 2015 $225M Net approximate debt—at year end2016 $135M Total debt reduction 2016 $90M From business divestitures $40M Fromops-Adj. EBITDA + Working Cap $50M NASDAQ : MNTX 5
|
|
DEBT AND LIQUIDITY As of December 31, 2016 ($Millions)* PM ASV Manitex Total Change v Q3 2016 Working capital facilities 19.3 15.6 20.0 54.9 (3.0) Bank Term debt 27.3 30.0—57.3 (7.7) Capital leases 6.3 6.3 (0.1) Convertible notes 21.4 21.4 0.2 Other acquisition notes 1.6 1.6 (0.3) TOTALS: $46.6 $45.6 $49.3 $141.5 $(10.9) Debt Issuance Costs: (1.2) 1.4 Balance Sheet Total Debt $140.3 $(9.5) Note:Non-recourse to Manitex Int’l Inc. $46.6 $45.6 $0 $92.2* $(8.4) Cash on Hand $6.5 $(0.5) Net Debt $133.8 $(10.0) NASDAQ : MNTX 6
|
|
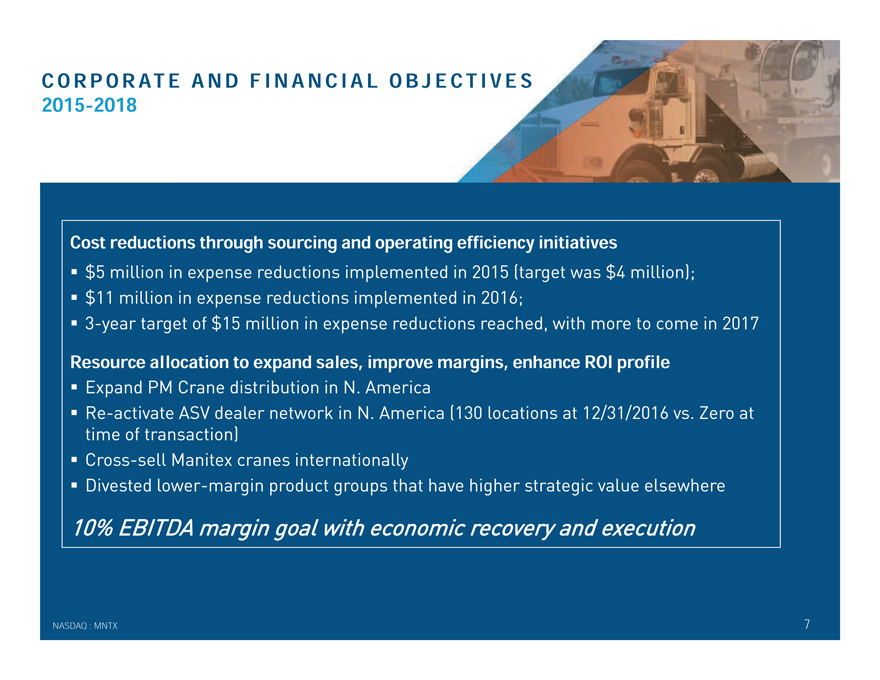
CORPORATE AND FINANCIAL OBJECTIVES 2015-2018 Cost reductions through sourcing and operating efficiency initiatives ? $5 million in expense reductions implemented in 2015 (target was $4 million); ? $11 million in expense reductions implemented in 2016; ?3-year target of $15 million in expense reductions reached, with more to come in 2017 Resource allocation to expand sales, improve margins, enhance ROI profile ? Expand PM Crane distribution in N. America ?Re-activate ASV dealer network in N. America (130 locations at 12/31/2016 vs. Zero at time of transaction) ? Cross-sell Manitex cranes internationally ? Divested lower-margin product groups that have higher strategic value elsewhere 10% EBITDA margin goal with economic recovery and execution NASDAQ : MNTX 7
|
|
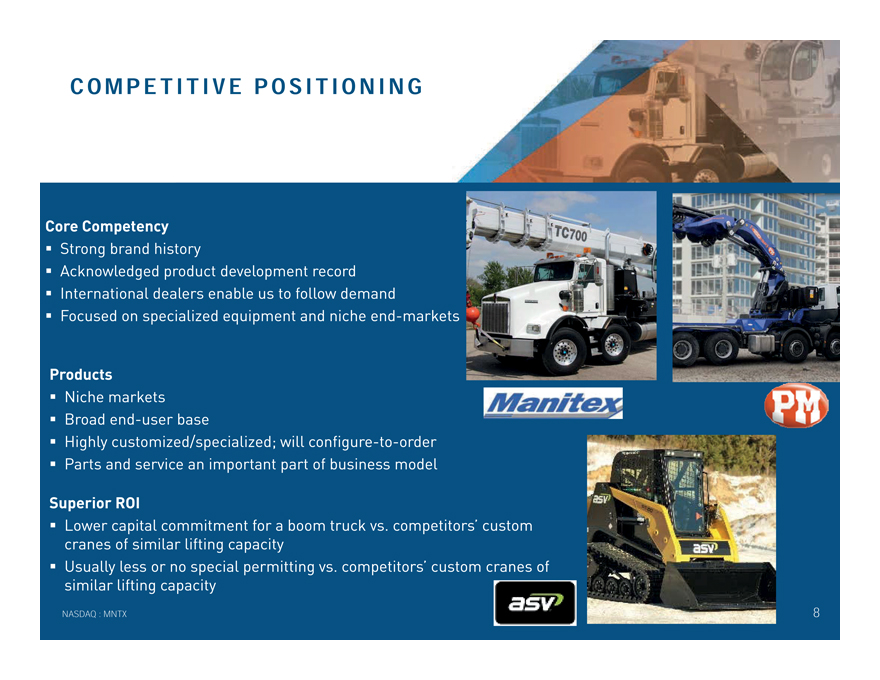
COMPETITIVE POSITIONING Core Competency ? Strong brand history ? Acknowledged product development record ? International dealers enable us to follow demand ? Focused on specialized equipment and nicheend-markets Products ? Niche markets ? Broadend-user base ? Highly customized/specialized; willconfigure-to-order ? Parts and service an important part of business model Superior ROI ? Lower capital commitment for a boom truck vs. competitors’ custom cranes of similar lifting capacity ? Usually less or no special permitting vs. competitors’ custom cranes of similar lifting capacity NASDAQ : MNTX 8
|
|
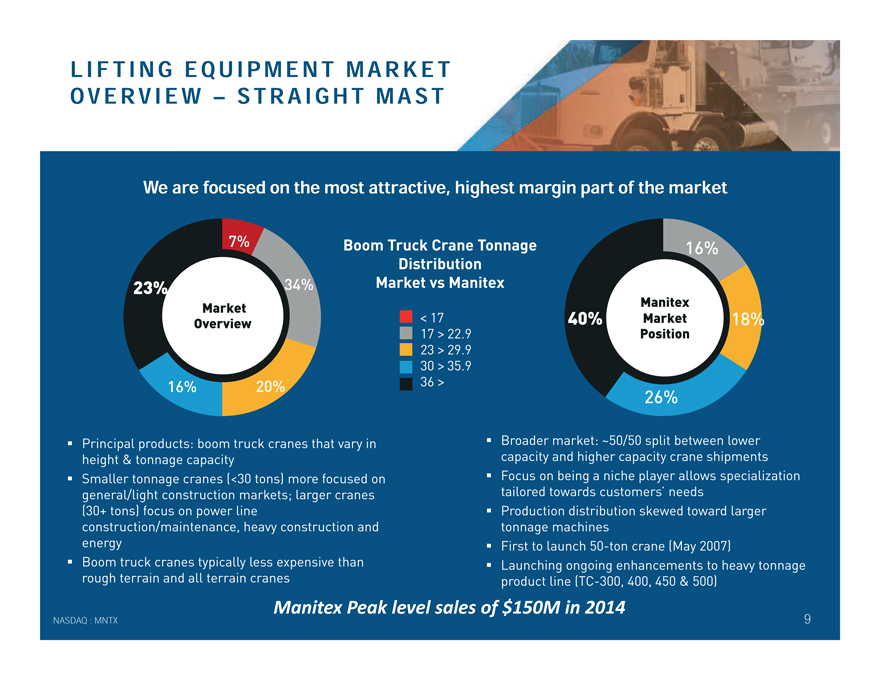
LIFTING EQUIPMENT MARKET OVERVIEW – STRAIGHT MAST ? Broader market: ~50/50 split between lower capacity and higher capacity crane shipments ? Focus on being a niche player allows specialization tailored towards customers’ needs ? Production distribution skewed toward larger tonnage machines ? First to launch50-ton crane (May 2007) ? Launching ongoing enhancements to heavy tonnage product line(TC-300, 400, 450 & 500) 7% 16% 20% 16% 18% 26% Manitex Market Position Boom Truck Crane Tonnage Distribution Market vs Manitex < 17 17 > 22.9 23 > 29.9 30 > 35.9 36 > NASDAQ : MNTX 9 34% We are focused on the most attractive, highest margin part of the market 23% 40% Market Overview ? Principal products: boom truck cranes that vary in height & tonnage capacity ? Smaller tonnage cranes (<30 tons) more focused on general/light construction markets; larger cranes (30+ tons) focus on power line construction/maintenance, heavy construction and energy ? Boom truck cranes typically less expensive than rough terrain and all terrain cranes Manitex Peak level sales of $150M in 2014
|
|
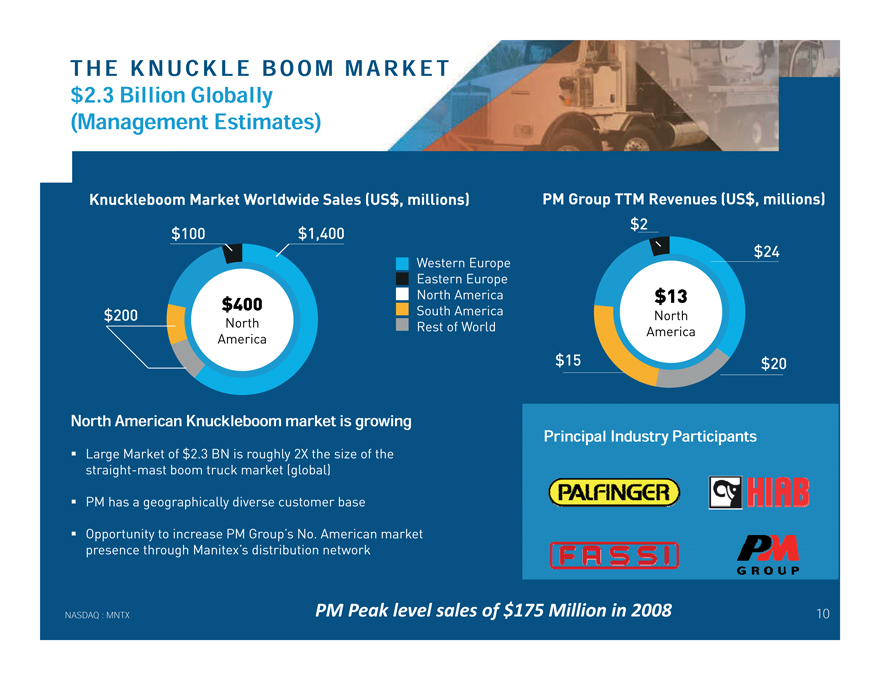
THE KNUCKLE BOOM MARKET $2.3 Billion Globally (Management Estimates) North American Knuckleboom market is growing ? Large Market of $2.3 BN is roughly 2X the size of the straight-mast boom truck market (global) ? PM has a geographically diverse customer base ? Opportunity to increase PM Group’s No. American market presence through Manitex’s distribution network $200 $100 $1,400 $400 North America Knuckleboom Market Worldwide Sales (US$, millions) Western Europe Eastern Europe North America South America Rest of World $20 $2 $13 North America $24 PM Group TTM Revenues (US$, millions) NASDAQ : MNTX 10 $15 Principal Industry Participants PM Peak level sales of $175 Million in 2008
|
|
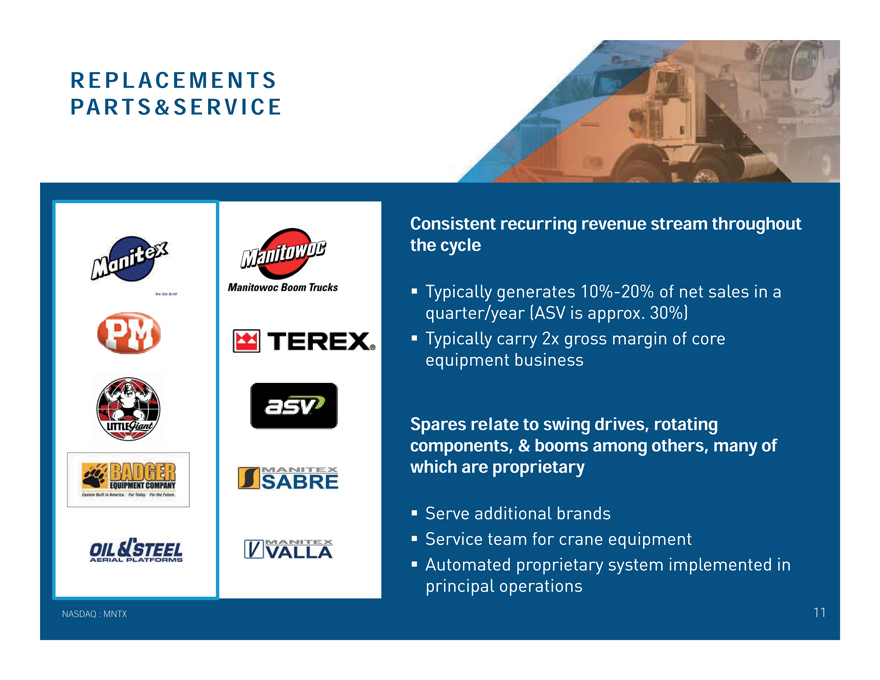
REPLACEMENTS PARTS&SERVICE Consistent recurring revenue stream throughout the cycle ? Typically generates10%-20% of net sales in a quarter/year (ASV is approx. 30%) ? Typically carry 2x gross margin of core equipment business Spares relate to swing drives, rotating components, & booms among others, many of which are proprietary ? Serve additional brands ? Service team for crane equipment ? Automated proprietary system implemented in principal operations NASDAQ : MNTX 11
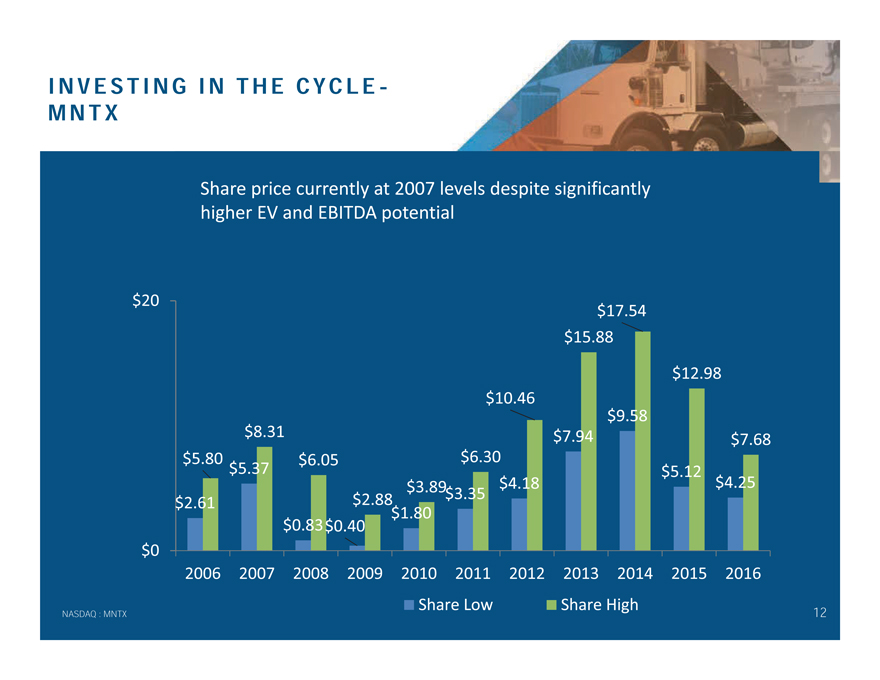
INVESTING IN THE CYCLEMNTX NASDAQ : MNTX 12 $2.61 $5.37 $0.83$0.40 $1.80 $3.35 $4.18 $7.94 $9.58 $5.12 $4.25 $5.80 $8.31 $6.05 $2.88 $3.89 $6.30 $10.46 $15.88 $17.54 $12.98 $7.68 $0 $20 2006 2007 2008 2009 2010 2011 2012 2013 2014 2015 2016 Share Low Share High Share price currently at 2007 levels despite significantly higher EV and EBITDA potential
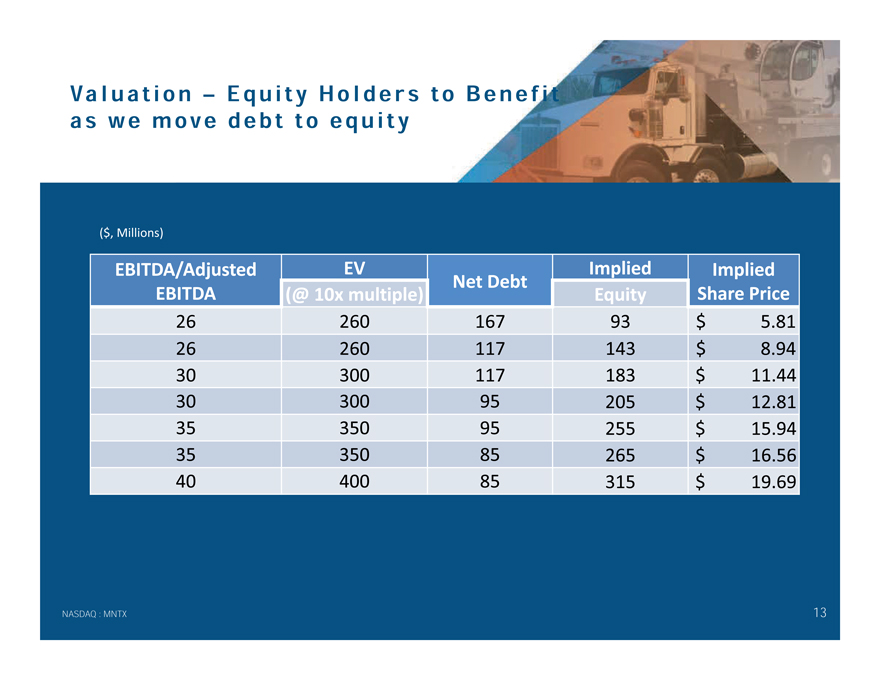
Val u a t i o n – Equity Holders t o B e n e f i t a s we move d e b t t o e q u i t y NASDAQ : MNTX 13 EBITDA/Adjusted EBITDA EV Net Debt Implied Implied (@ 10x multiple) Equity Share Price 26 260 167 93 $ 5.81 26 260 117 143 $ 8.94 30 300 117 183 $ 11.44 30 300 95 205 $ 12.81 35 350 95 255 $ 15.94 35 350 85 265 $ 16.56 40 400 85 315 $ 19.69 ($, Millions)
MANITEX INTERNATIONAL, INC. FINANCIAL OVERVIEW March 2017 *Results may contain adjustments, please see reconciliation to GAAP on Slide 19 and other Manitex source disclosure and SEC filings.
|
|
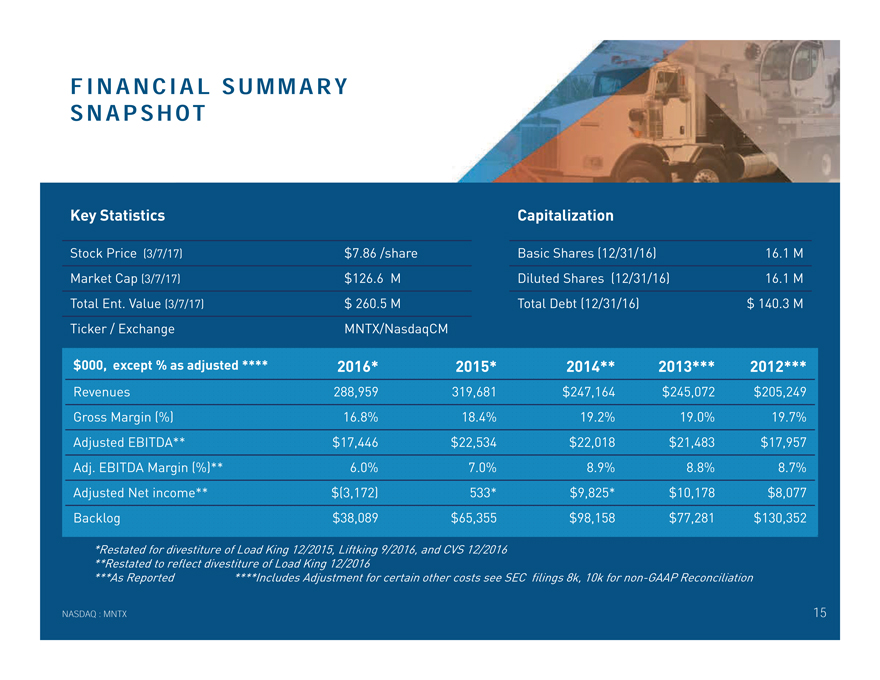
FINANCIAL SUMMARY SNAPSHOT Key Statistics $000, except % as adjusted **** 2016* 2015* 2014** 2013*** 2012*** Revenues 288,959 319,681 $247,164 $245,072 $205,249 Gross Margin (%) 16.8% 18.4% 19.2% 19.0% 19.7% Adjusted EBITDA** $17,446 $22,534 $22,018 $21,483 $17,957 Adj. EBITDA Margin (%)** 6.0% 7.0% 8.9% 8.8% 8.7% Adjusted Net income** $(3,172) 533* $9,825* $10,178 $8,077 Backlog $38,089 $65,355 $98,158 $77,281 $130,352 *Restated for divestiture of Load King 12/2015, Liftking 9/2016, and CVS 12/2016 **Restated to reflect divestiture of Load King 12/2016 ***As Reported ****Includes Adjustment for certain other costs see SEC filings 8k, 10k fornon-GAAP Reconciliation Stock Price (3/7/17) $7.86 /share Market Cap (3/7/17) $126.6 M Total Ent. Value (3/7/17) $ 260.5 M Ticker / Exchange MNTX/NasdaqCM Basic Shares (12/31/16) 16.1 M Diluted Shares (12/31/16) 16.1 M Total Debt (12/31/16) $ 140.3 M Capitalization NASDAQ : MNTX 15
|
|
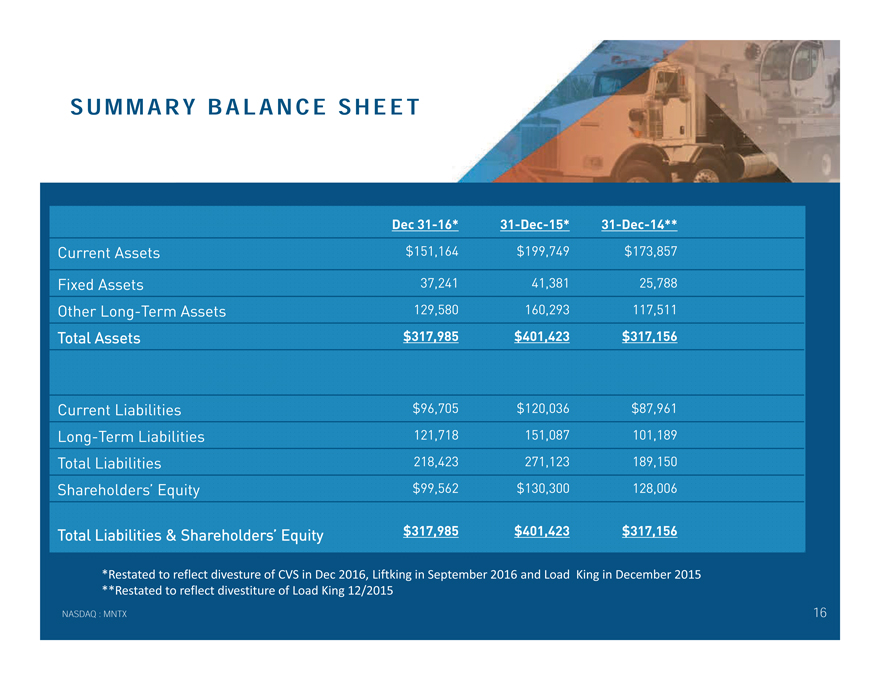
SUMMARY BALANCE SHEET Dec31-16*31-Dec-15*31-Dec-14** Current Assets $151,164 $199,749 $173,857 Fixed Assets 37,241 41,381 25,788 Other Long-Term Assets 129,580 160,293 117,511 Total Assets $317,985 $401,423 $317,156 Current Liabilities $96,705 $120,036 $87,961 Long-Term Liabilities 121,718 151,087 101,189 Total Liabilities 218,423 271,123 189,150 Shareholders’ Equity $99,562 $130,300 128,006 Total Liabilities & Shareholders’ Equity $317,985 $401,423 $317,156 NASDAQ : MNTX 16 *Restated to reflect divesture of CVS in Dec 2016, Liftking in September 2016 and Load King in December 2015 **Restated to reflect divestiture of Load King 12/2015
|
|
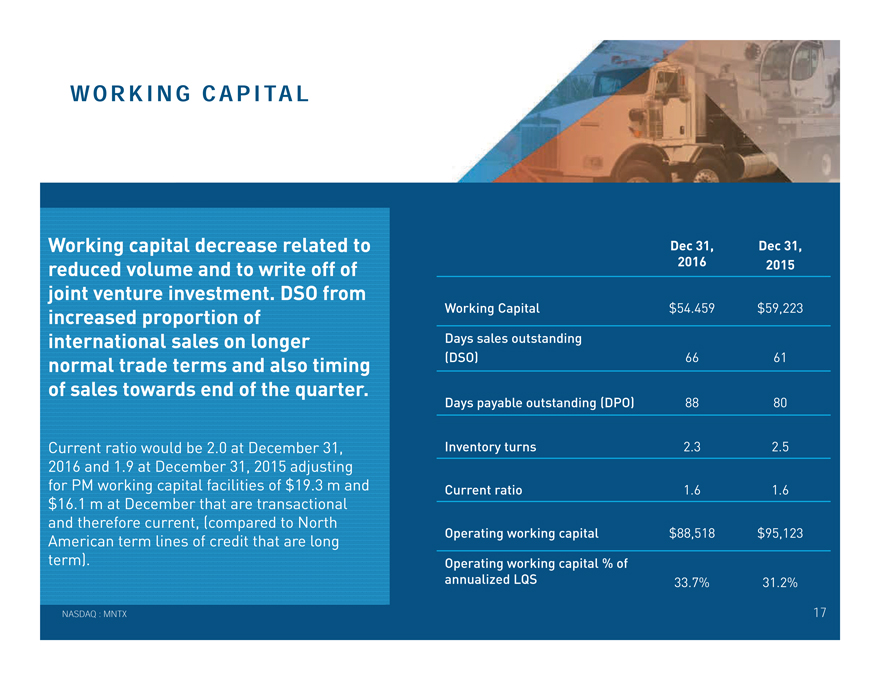
WORKING CAPITAL Working capital decrease related to reduced volume and to write off of joint venture investment. DSO from increased proportion of international sales on longer normal trade terms and also timing of sales towards end of the quarter. Current ratio would be 2.0 at December 31, 2016 and 1.9 at December 31, 2015 adjusting for PM working capital facilities of $19.3 m and $16.1 m at December that are transactional and therefore current, (compared to North American term lines of credit that are long term). Dec 31, 2016 Dec 31, 2015 Working Capital $54.459 $59,223 Days sales outstanding (DSO) 66 61 Days payable outstanding (DPO) 88 80 Inventory turns 2.3 2.5 Current ratio 1.6 1.6 Operating working capital $88,518 $95,123 Operating working capital % of annualized LQS 33.7% 31.2% NASDAQ : MNTX 17
|
|
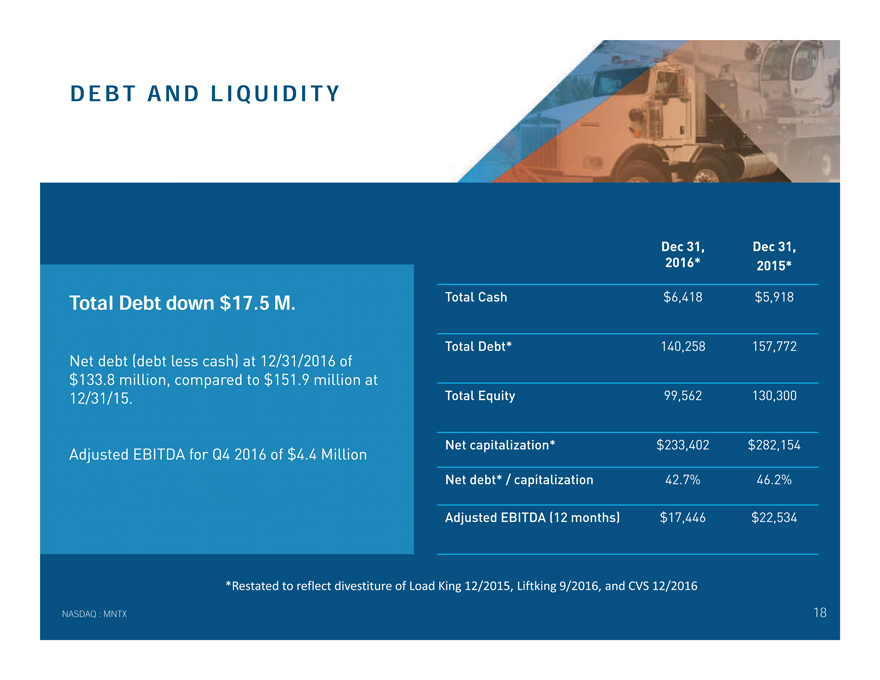
DEBT AND LIQUIDITY Total Debt down $17.5 M. Net debt (debt less cash) at 12/31/2016 of $133.8 million, compared to $151.9 million at 12/31/15. Adjusted EBITDA for Q4 2016 of $4.4 Million Dec 31, 2016* Dec 31, 2015* Total Cash $6,418 $5,918 Total Debt* 140,258 157,772 Total Equity 99,562 130,300 Net capitalization* $233,402 $282,154 Net debt* / capitalization 42.7% 46.2% Adjusted EBITDA (12 months) $17,446 $22,534 NASDAQ : MNTX 18 *Restated to reflect divestiture of Load King 12/2015, Liftk
|
|
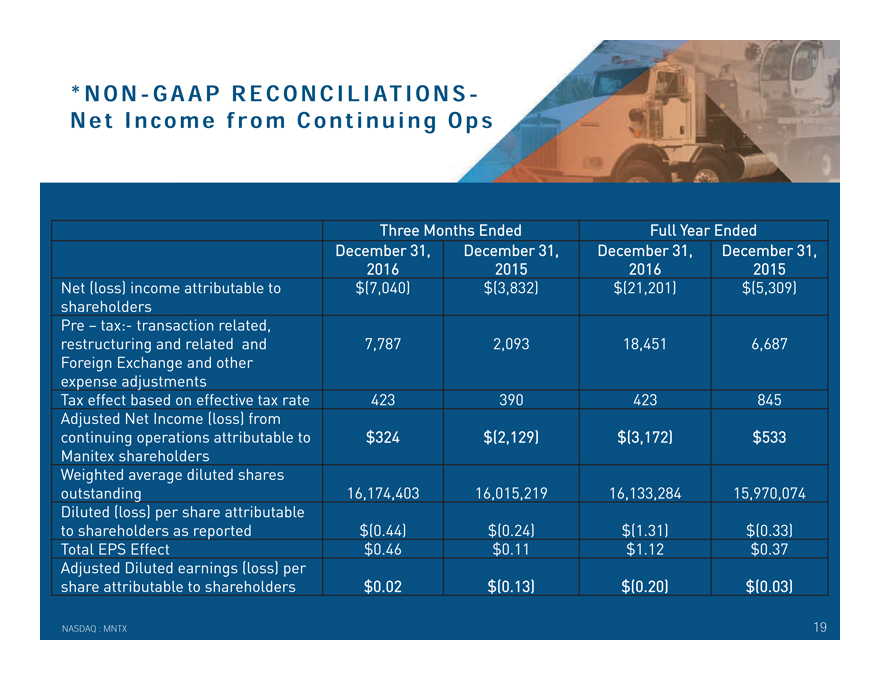
*NON-GAAP RECONCILIATIONSNet Income from Continuing Ops NASDAQ : MNTX 19 Three Months Ended Full Year Ended December 31, 2016 December 31, 2015 December 31, 2016 December 31, 2015 Net (loss) income attributable to shareholders $(7,040) $(3,832) $(21,201) $(5,309) Pre – tax:- transaction related, restructuring and related and Foreign Exchange and other expense adjustments 7,787 2,093 18,451 6,687 Tax effect based on effective tax rate 423 390 423 845 Adjusted Net Income (loss) from continuing operations attributable to Manitex shareholders $324 $(2,129) $(3,172) $533 Weighted average diluted shares outstanding 16,174,403 16,015,219 16,133,284 15,970,074 Diluted (loss) per share attributable to shareholders as reported $(0.44) $(0.24) $(1.31) $(0.33) Total EPS Effect $0.46 $0.11 $1.12 $0.37 Adjusted Diluted earnings (loss) per share attributable to shareholders $0.02 $(0.13) $(0.20) $(0.03)ing 9/2016, and CV
|

|
*NON-GAAP RECONCILIATIONSAdjusted EBITDA NASDAQ : MNTX 20 Three Months Ended Full Year Ended December 31, 2016 December 31, 2015 December 31, 2016 December 31, 2015 Operating (loss) income $(3,033) $(1,879) $(1,715) $5,208Pre-tax:- transaction related, restructuring and related expense and foreign exchange and other adjustments 4,835 1,345 7,920 5,820 Adjusted operating income $1,802 $(534) $6,205 $11,028 Depreciation & Amortization 2,634 2,759 11,241 11,506 Adjusted Earnings before interest, taxes, depreciation and amortization (Adjusted EBITDA) $4,436 $2,225 $17,446 $22,534 Adjusted EBITDA % to sales 6.8% 2.9% 6.0% 7.0%S 12/201
|
|
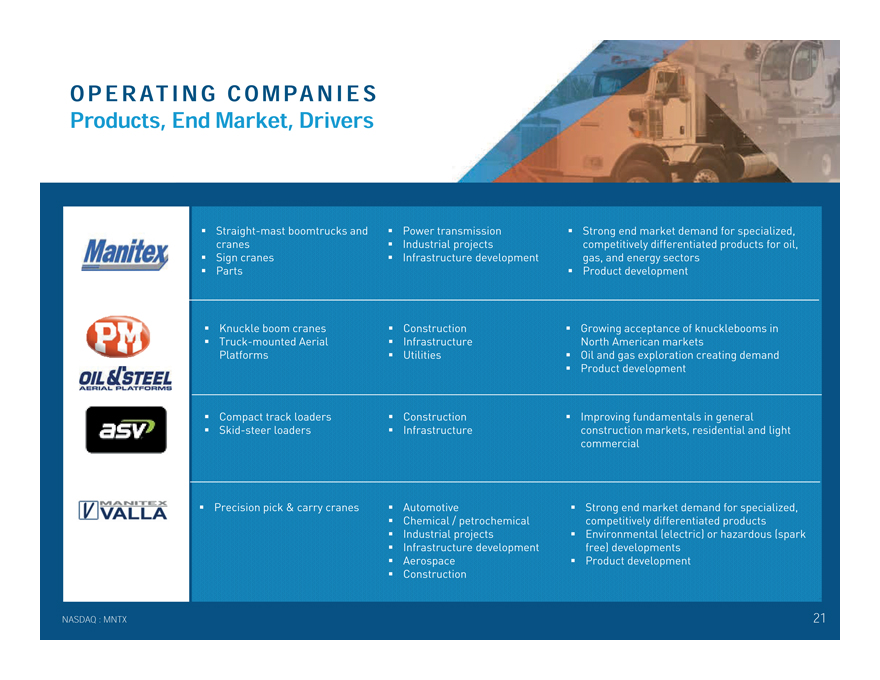
OPERATING COMPANIES Products, End Market, Drivers ? Straight-mast boomtrucks and cranes ? Sign cranes ? Parts ? Power transmission ? Industrial projects ? Infrastructure development ? Strong end market demand for specialized, competitively differentiated products for oil, gas, and energy sectors ? Product development NASDAQ : MNTX 21 ? Knuckle boom cranes ? Truck-mounted Aerial Platforms ? Construction ? Infrastructure ? Utilities ? Growing acceptance of knucklebooms in North American markets ? Oil and gas exploration creating demand ? Product development ? Compact track loaders ? Skid-steer loaders ? Construction ? Infrastructure ? Improving fundamentals in general construction markets, residential and light commercial ? Precision pick & carry cranes ? Automotive ? Chemical / petrochemical ? Industrial projects ? Infrastructure development ? Aerospace ? Construction ? Strong end market demand for specialized, competitively differentiated products ? Environmental (electric) or hazardous (spark free) developments ? Product development6
|
|
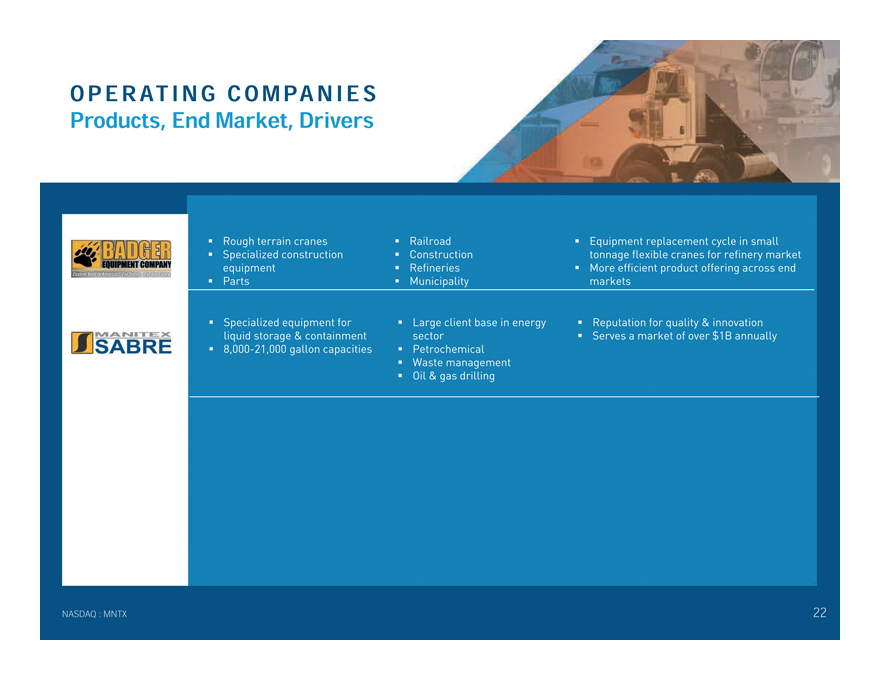
OPERATING COMPANIES Products, End Market, Drivers ? Specialized equipment for liquid storage & containment ?8,000-21,000 gallon capacities ? Large client base in energy sector ? Petrochemical ? Waste management ? Oil & gas drilling ? Reputation for quality & innovation ? Serves a market of over $1B annually NASDAQ : MNTX 22 ? Rough terrain cranes ? Specialized construction equipment ? Parts ? Railroad ? Construction ? Refineries ? Municipality ? Equipment replacement cycle in small tonnage flexible cranes for refinery market ? More efficient product offering across end markets
|
|
EXPERIENCED MANAGEMENT TEAM David Langevin, Chairman & CEO 20+ years principally with Terex David Gransee, CFO & Treasurer Formerly with Arthur Andersen, 15+ years with Eon Labs (formerly listed) Michael Schneider, SVP – Financial Operations Formerly with Ernst & Young, 20+ years in financial operations Scott Rolston, SVP Strategic Planning 13+ years principally with Manitowoc Steve Kiefer, SVP Sales and Marketing 25+ years principally with Eaton Corp. and Hendrickson International Jim Peterson, SVP Operations 35+ years in manufacturing operations Luigi Fucili, CEO PM Group 10+ years principally with PM Group NASDAQ : MNTX 23
MANITEX INTERNATIONAL, INC. (NASDAQ: MNTX) March 2017 D a v i d L a n g e v i n , C E O 7 0 8—2 3 7—2 0 6 0 d l a n g ev i n @ m a n i t ex . com Pet e r S e l t z b e rg , IR D a r row A s s o c i a t e s , I n c . 5 1 6—4 1 9—9 9 1 5 p s e l t z b e rg@darrow i r. com


