Exhibit 99.1
MANITEX INTERNATIONAL, INC.
(NASDAQ: MNTX)
Corporate Presentation
August 2017
FORWARD-LOOKING STATEMENT
&NON-GAAP MEASURES
Safe Harbor Statement under the U.S. Private Securities Litigation Reform Act of 1995: This presentation contains
statements that are forward-looking in nature which express the beliefs and expectations of management including
statements regarding the Company’s expected results of operations or liquidity; statements concerning projections,
predictions, expectations, estimates or forecasts as to our business, financial and operational results and future economic
performance; and statements of management’s goals and objectives and other similar expressions concerning matters that
are not historical facts. In some cases, you can identify forward-looking statements by terminology such as “anticipate,”
“estimate,” “plan,” “project,” “continuing,” “ongoing,” “expect,” “we believe,” “we intend,” “may,” “will,” “should,” “could,”
and similar expressions. Such statements are based on current plans, estimates and expectations and involve a number of
known and unknown risks, uncertainties and other factors that could cause the Company’s future results, performance or
achievements to differ significantly from the results, performance or achievements expressed or implied by such forwardlooking
statements. These factors and additional information are discussed in the Company’s filings with the Securities and
Exchange Commission and statements in this presentation should be evaluated in light of these important factors. Although
we believe that these statements are based upon reasonable assumptions, we cannot guarantee future results. Forwardlooking
statements speak only as of the date on which they are made, and the Company undertakes no obligation to update
publicly or revise any forward-looking statement, whether as a result of new information, future developments or otherwise.
Non-GAAP Measures: Manitex International from time to time refers to variousnon-GAAP (generally accepted accounting
principles) financial measures in this presentation. Manitex believes that this information is useful to understanding its
operating results without the impact of special items. See Manitex’s Q2 2017 earnings release on the Investor Relations
section of our website www.manitexinternational.com for a description and/or reconciliation of these measures. NASDAQ : MNTX2
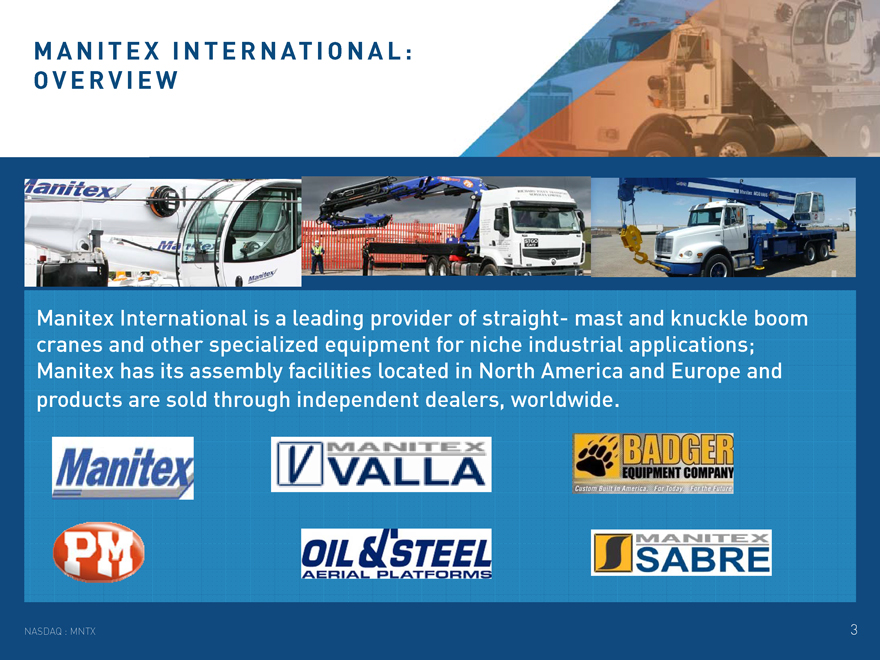
MANITEX INTERNATIONAL:
OVERVIEW
Manitex International is a leading provider of straight- mast and knuckle boom
cranes and other specialized equipment for niche industrial applications;
Manitex has its assembly facilities located in North America and Europe and
products are sold through independent dealers, worldwide. NASDAQ : MNTX 3
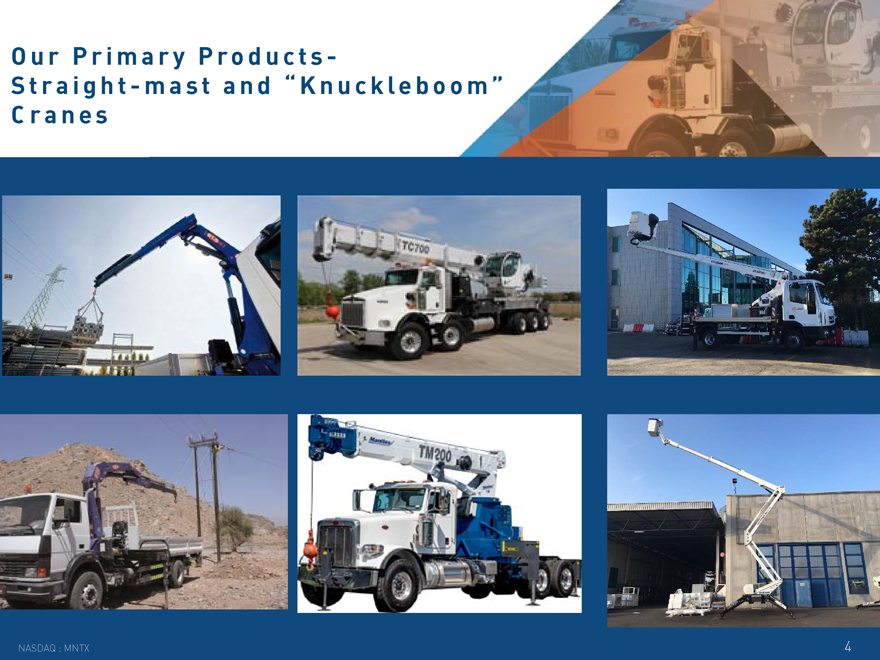
Our Primary Products-
Straight-mast a n d “Knuckleboom”
Cranes NASDAQ : MNTX 4
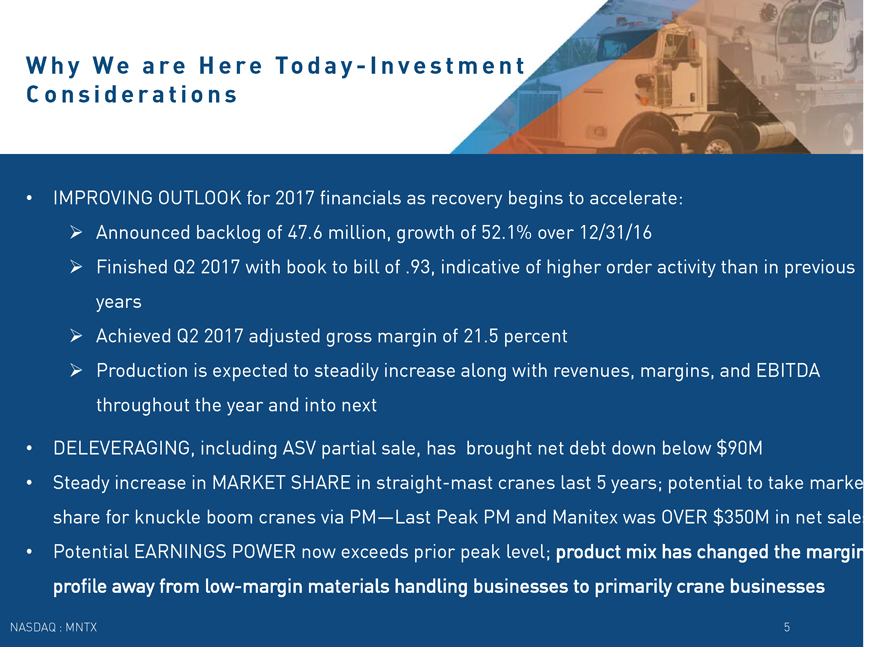
Why We are Here Today-Investment
Considerations
IMPROVING OUTLOOK for 2017 financials as recovery begins to accelerate:
Announced backlog of 47.6 million, growth of 52.1% over 12/31/16
Finished Q2 2017 with book to bill of .93, indicative of higher order activity than in previous
years
Achieved Q2 2017 adjusted gross margin of 21.5 percent
Production is expected to steadily increase along with revenues, margins, and EBITDA
throughout the year and into next
• DELEVERAGING, including ASV partial sale, has brought net debt down below $90M
• Steady increase in MARKET SHARE in straight-mast cranes last 5 years; potential to take marke
share for knuckle boom cranes via PM—Last Peak PM and Manitex was OVER $350M in net sales
• Potential EARNINGS POWER now exceeds prior peak level; product mix has changed the margin
profile away fromlow-margin materials handling businesses to primarily crane businesses NASDAQ : MNTX5
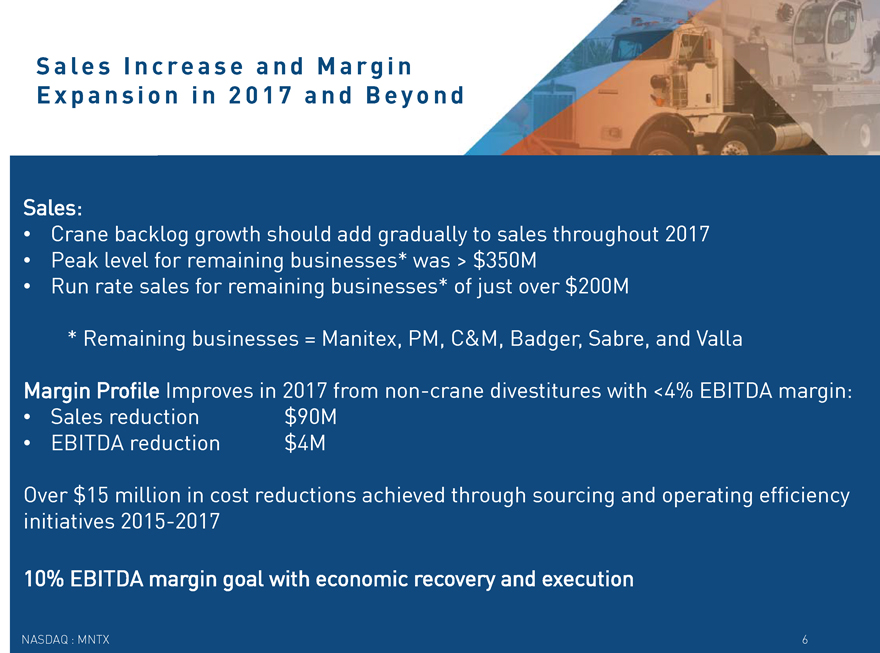
Sales Increase and Margin
Expansion in 2017 and Beyond
Sales:
• Crane backlog growth should add gradually to sales throughout 2017
• Peak level for remaining businesses* was > $350M
• Run rate sales for remaining businesses* of just over $200M
* Remaining businesses = Manitex, PM, C&M, Badger, Sabre, and Valla
Margin Profile Improves in 2017 fromnon-crane divestitures with <4% EBITDA margin:
• Sales reduction $90M
• EBITDA reduction $4M
Over $15 million in cost reductions achieved through sourcing and operating efficiency
initiatives 2015-2017
10% EBITDA margin goal with economic recovery and execution NASDAQ : MNTX 6
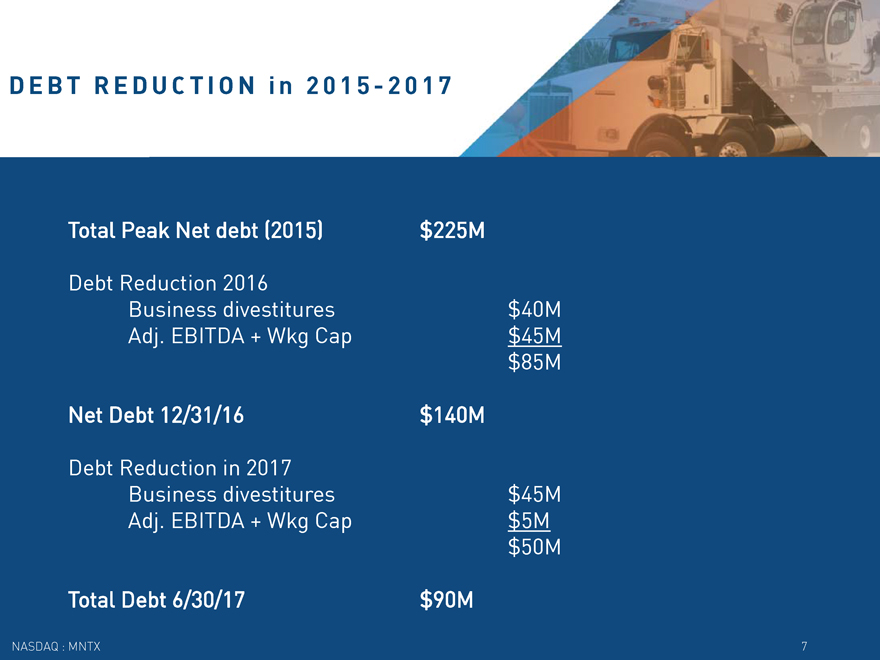
DEBT REDUCTION in 2015-2017
Total Peak Net debt (2015) $225M
Debt Reduction 2016
Business divestitures $40M
Adj. EBITDA + Wkg Cap $45M
$85M
Net Debt 12/31/16 $140M
Debt Reduction in 2017
Business divestitures $45M
Adj. EBITDA + Wkg Cap $5M
$50M
Total Debt 6/30/17 $90M NASDAQ : MNTX 7
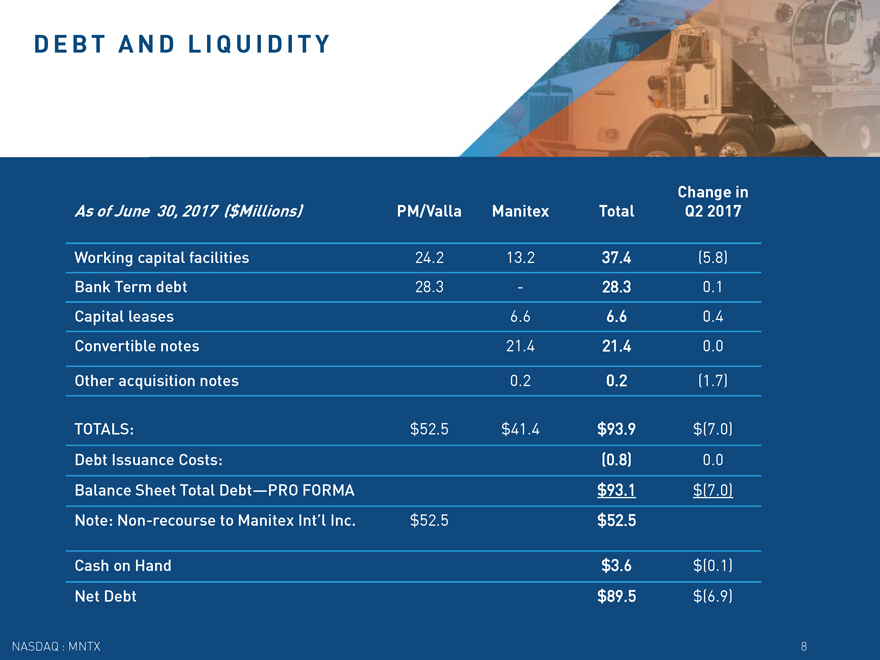
DEBT AND LIQUIDITY
As of June 30, 2017 ($Millions) PM/Valla Manitex Total
Change in
Q2 2017
Working capital facilities 24.2 13.2 37.4 (5.8)
Bank Term debt 28.3 - 28.3 0.1
Capital leases 6.6 6.6 0.4
Convertible notes 21.4 21.4 0.0
Other acquisition notes 0.2 0.2 (1.7)
TOTALS: $52.5 $41.4 $93.9 $(7.0)
Debt Issuance Costs: (0.8) 0.0
Balance Sheet Total Debt—PRO FORMA $93.1 $(7.0)
Note:Non-recourse to Manitex Int’l Inc. $52.5 $52.5
Cash on Hand $3.6 $(0.1)
Net Debt $89.5 $(6.9)
NASDAQ : MNTX 8
LIFTING EQUIPMENT MARKET
OVERVIEW – STRAIGHT MAST
7%
23% 34%
Market Overview
16% 20%
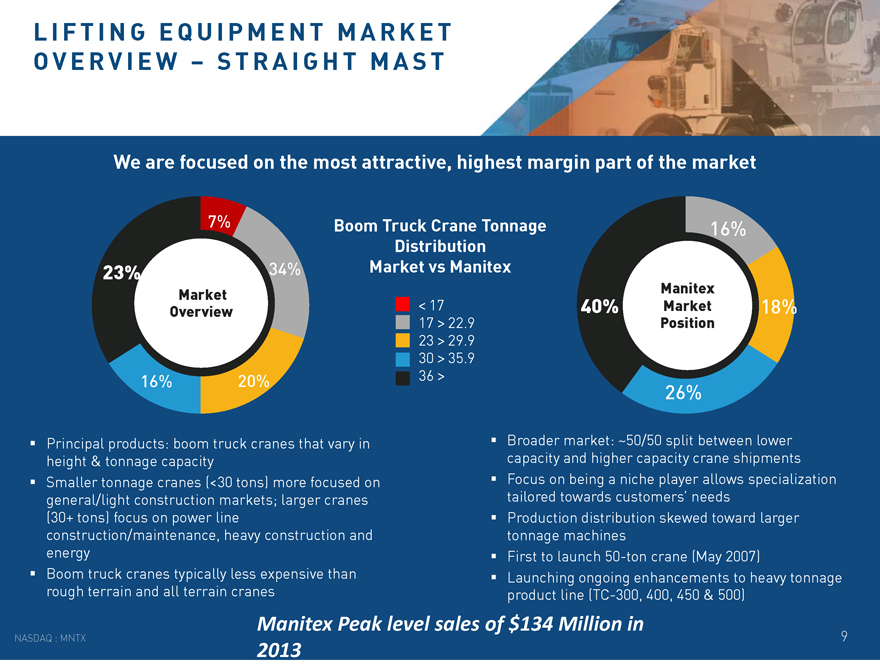
We are focused on the most attractive, highest margin part of the market
Boom Truck Crane Tonnage Distribution Market vs Manitex
< 17
17 > 22.9
23 > 29.9
30 > 35.9
36 >
16%
Manitex
40% Market 18%
Position
26%
Principal products: boom truck cranes that vary in height & tonnage capacity Smaller tonnage cranes (<30 tons) more focused on general/light construction markets; larger cranes (30+ tons) focus on power line construction/maintenance, heavy construction and energy Boom truck cranes typically less expensive than rough terrain and all terrain cranes
Broader market: ~50/50 split between lower capacity and higher capacity crane shipments Focus on being a niche player allows specialization tailored towards customers’ needs Production distribution skewed toward larger tonnage machines First to launch50-ton crane (May 2007) Launching ongoing enhancements to heavy tonnage product line(TC-300, 400, 450 & 500)
NASDAQ : MNTX
Manitex Peak level sales of $134 Million in 2013
9
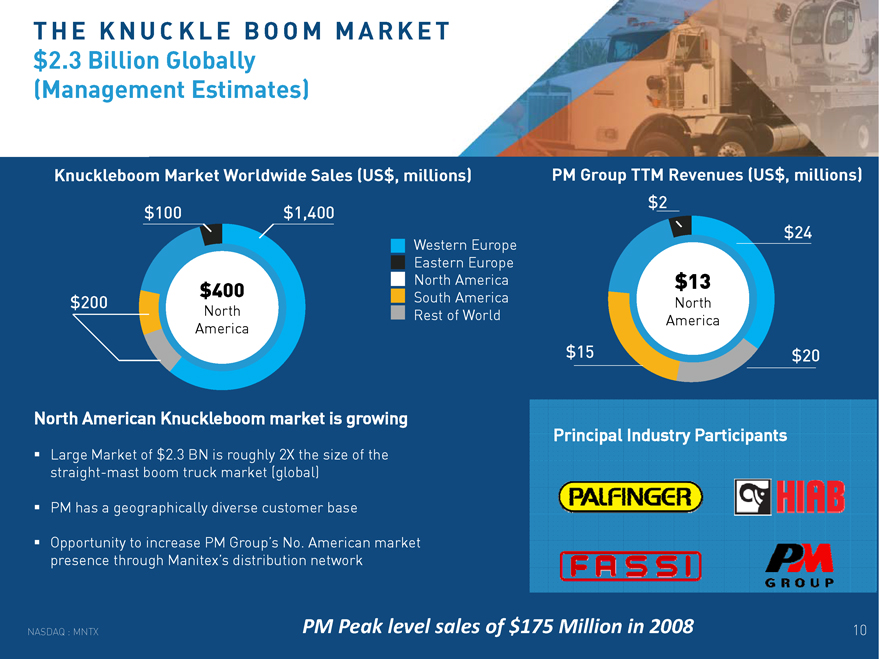
THE KNUCKLE BOOM MARKET $2.3 Billion Globally (Management Estimates)
Knuckleboom Market Worldwide Sales (US$, millions)
$100 $1,400
Western Europe Eastern Europe North America $400 South America $200 North Rest of World America
North American Knuckleboom market is growing
Large Market of $2.3 BN is roughly 2X the size of the straight-mast boom truck market (global)
PM has a geographically diverse customer base
Opportunity to increase PM Group’s No. American market presence through Manitex’s distribution network
PM Group TTM Revenues (US$, millions) $2 $24
$13
North America
$15 $20
Principal Industry Participants
NASDAQ : MNTX
PM Peak level sales of $175 Million in 2008
10
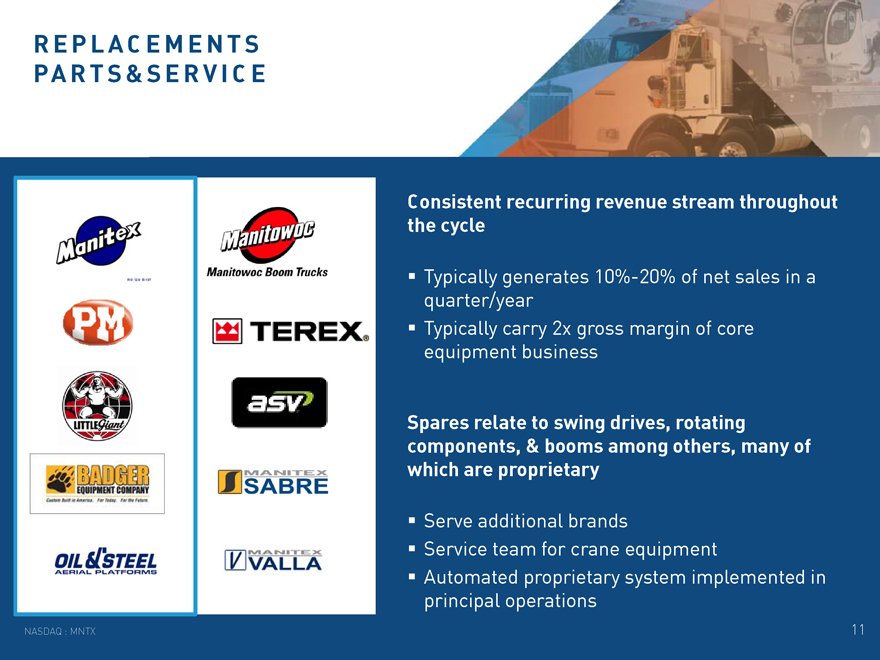
REPLACEMENTS PARTS & SERVICE
Consistent recurring revenue stream throughout the cycle
Typically generates10%-20% of net sales in a quarter/year Typically carry 2x gross margin of core equipment business
Spares relate to swing drives, rotating components, & booms among others, many of which are proprietary
Serve additional brands
Service team for crane equipment
Automated proprietary system implemented in principal operations
NASDAQ : MNTX
11
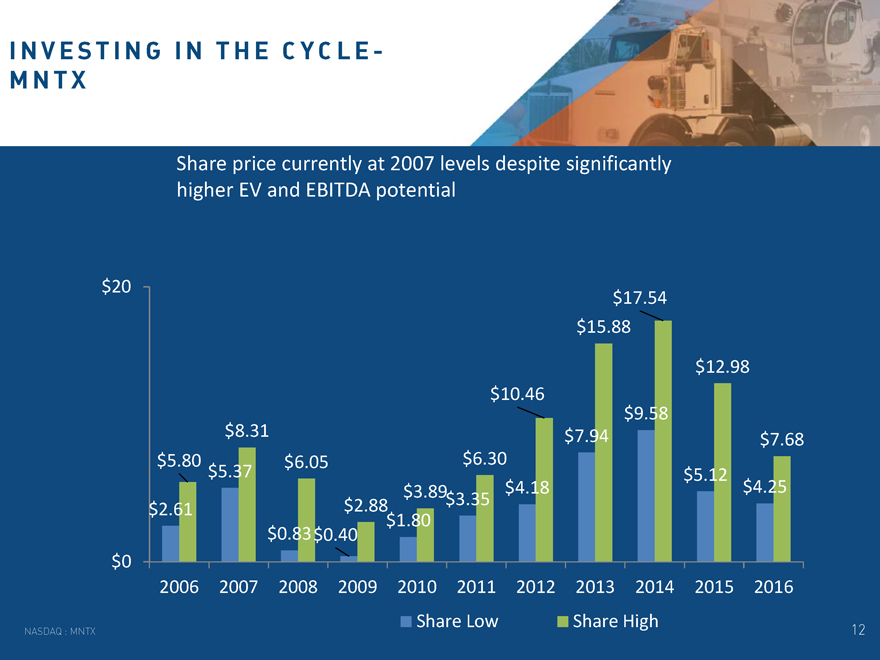
INVESTING IN THE CYCLE-MNTX
Share price currently at 2007 levels despite significantly higher EV and EBITDA potential
$20
$17.54
$15.88
$12.98
$10.46 $9.58 $8.31 $7.94 $7.68 $5.80 $6.05 $6.30 $5.37 $5.12 $3.89 $4.18 $4.25 $2.88 $3.35 $2.61 $1.80 $0.83$0.40 $0 2006 2007 2008 2009 2010 2011 2012 2013 2014 2015 2016
NASDAQ : MNTX
Share Low
Share High
12
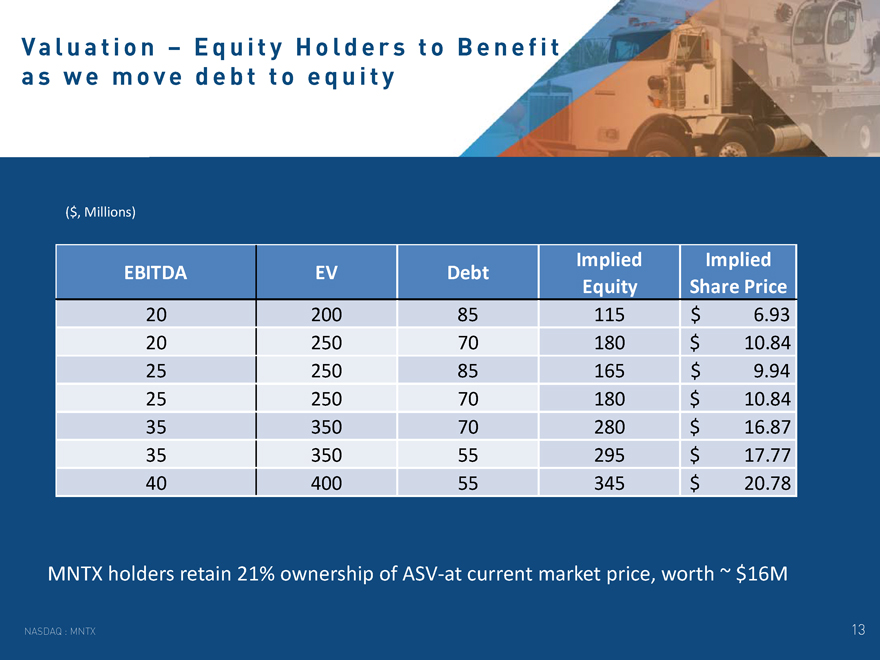
Valuation – Equity Holders to Benefit as we move debt to equity
($, Millions)
Implied Implied EBITDA EV Debt Equity Share Price
20 200 85 115 $ 6.93
20 250 70 180 $ 10.84
25 250 85 165 $ 9.94
25 250 70 180 $ 10.84
35 350 70 280 $ 16.87
35 350 55 295 $ 17.77
40 400 55 345 $ 20.78
MNTX holders retain 21% ownership of ASV-at current market price, worth ~ $16M
NASDAQ : MNTX
13
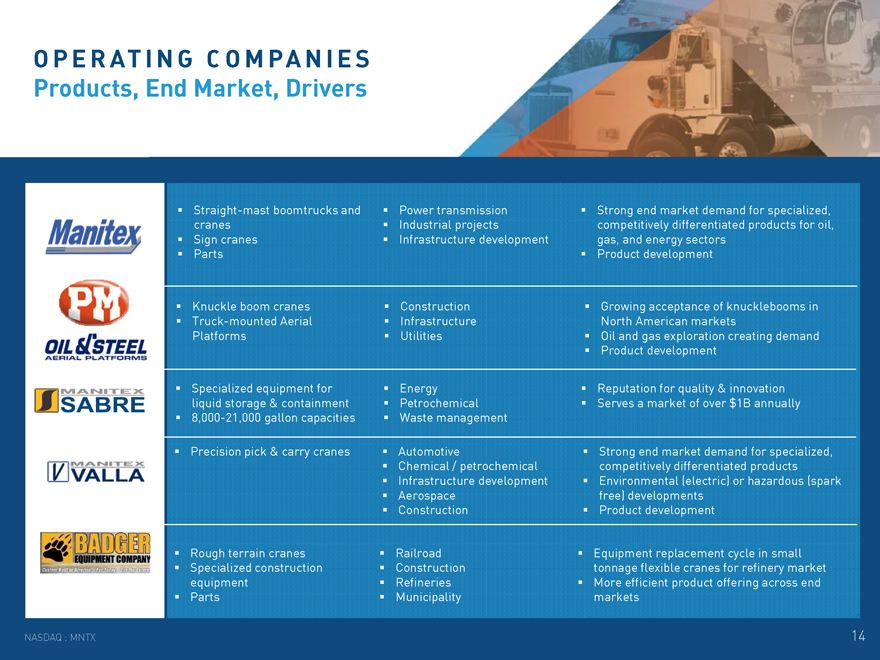
OPERATING COMPANIES Products, End Market, Drivers
Straight-mast boomtrucks and Power transmission Strong end market demand for specialized, cranes Industrial projects competitively differentiated products for oil, Sign cranes Infrastructure development gas, and energy sectors Parts Product development
Knuckle boom cranes Construction Growing acceptance of knucklebooms in Truck-mounted Aerial Infrastructure North American markets Platforms Utilities Oil and gas exploration creating demand Product development
Specialized equipment for Energy Reputation for quality & innovation liquid storage & containment Petrochemical Serves a market of over $1B annually8,000-21,000 gallon capacities Waste management
Precision pick & carry cranes Automotive Strong end market demand for specialized, Chemical / petrochemical competitively differentiated products Infrastructure development Environmental (electric) or hazardous (spark Aerospace free) developments Construction Product development
Rough terrain cranes Railroad Equipment replacement cycle in small Specialized construction Construction tonnage flexible cranes for refinery market equipment Refineries More efficient product offering across end Parts Municipality markets
NASDAQ : MNTX
14
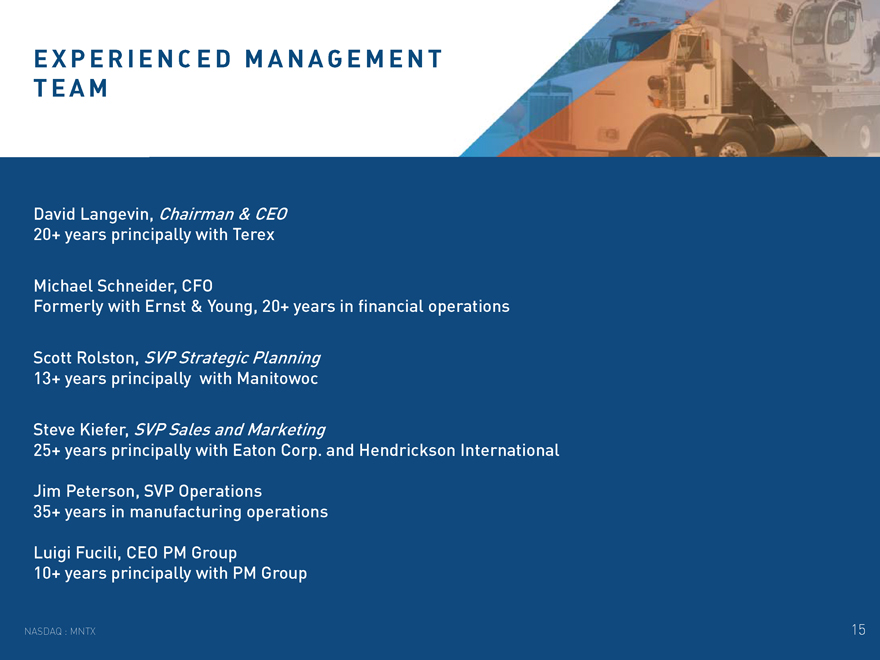
EXPERIENCED MANAGEMENT TEAM
David Langevin, Chairman & CEO 20+ years principally with Terex
Michael Schneider, CFO
Formerly with Ernst & Young, 20+ years in financial operations
Scott Rolston, SVP Strategic Planning
13+ years principally with Manitowoc
Steve Kiefer, SVP Sales and Marketing
25+ years principally with Eaton Corp. and Hendrickson International
Jim Peterson, SVP Operations 35+ years in manufacturing operations
Luigi Fucili, CEO PM Group
10+ years principally with PM Group
NASDAQ : MNTX
15
MANITEX INTERNATIONAL, INC.
FINANCIAL OVERVIEW
August 2017
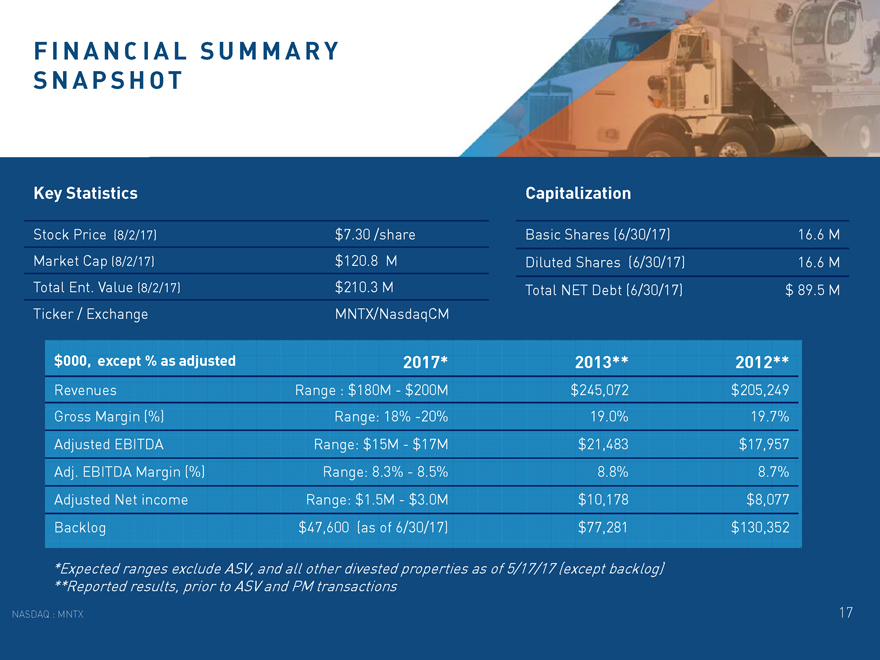
FINANCIAL SUMMARY SNAPSHOT
Key Statistics Capitalization
Stock Price (8/2/17) $7.30 /share Basic Shares (6/30/17) 16.6 M Market Cap (8/2/17) $120.8 M Diluted Shares (6/30/17) 16.6 M Total Ent. Value (8/2/17) $210.3 M Total NET Debt (6/30/17) $ 89.5 M Ticker / Exchange MNTX/NasdaqCM
$000, except % as adjusted 2017* 2013** 2012**
Revenues Range : $180M - $200M $245,072 $205,249 Gross Margin (%) Range: 18%-20% 19.0% 19.7% Adjusted EBITDA Range: $15M - $17M $21,483 $17,957 Adj. EBITDA Margin (%) Range: 8.3% - 8.5% 8.8% 8.7% Adjusted Net income Range: $1.5M - $3.0M $10,178 $8,077 Backlog $47,600 (as of 6/30/17) $77,281 $130,352
*Expected ranges exclude ASV, and all other divested properties as of 5/17/17 (except backlog) **Reported results, prior to ASV and PM transactions
NASDAQ : MNTX
17
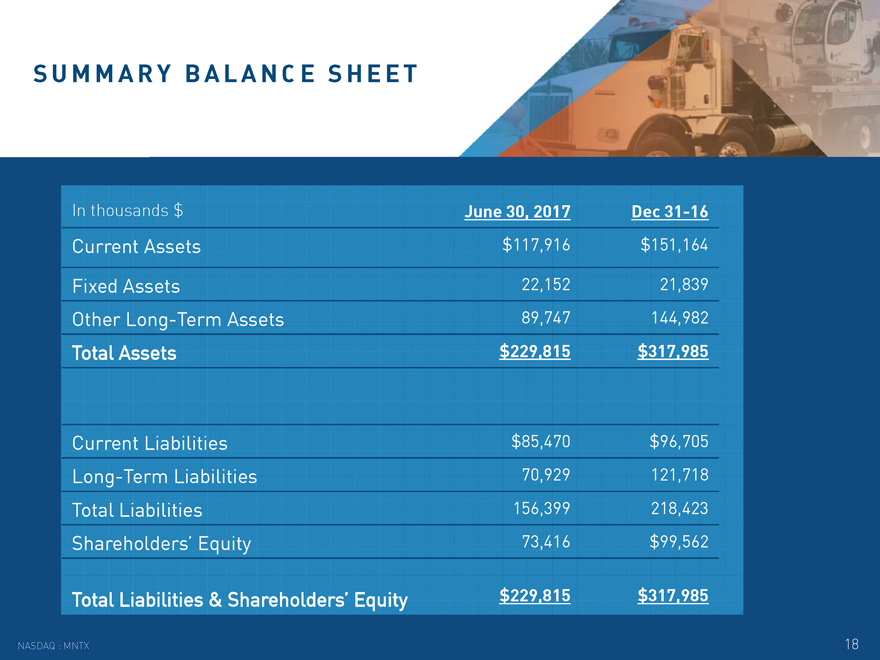
SUMMARY BALANCE SHEET
In thousands $ June 30, 2017 Dec31-16
Current Assets $117,916 $151,164
Fixed Assets 22,152 21,839 Other Long-Term Assets 89,747 144,982
Total Assets $229,815 $317,985
Current Liabilities $85,470 $96,705 Long-Term Liabilities 70,929 121,718 Total Liabilities 156,399 218,423 Shareholders’ Equity 73,416 $99,562
Total Liabilities & Shareholders’ Equity $229,815 $317,985
NASDAQ : MNTX
18
MANITEX INTERNATIONAL, INC.
(NASDAQ : MNTX) August 2017
David Langevin, CEO
708 - 237 - 2060 dlangevin@manitex.com
Peter Seltzberg , IRD arrow Associates, Inc.
516 - 419 - 9915 pseltzberg@darrowir.com