Exhibit 99.1
MANITEX INTERNATIONAL, INC.(NASDAQ: MNTX)Corporate Presentation May 2018
|
 |
FORWARD-LOOKING STATEMENT&NON-GAAP MEASURESSafe Harbor Statement under the U.S. Private Securities Litigation Reform Act of 1995: This presentation contains statements that are forward-looking in nature which express the beliefs and expectations of management including statements regarding the Company’s expected results of operations or liquidity; statements concerning projections, predictions, expectations, estimates or forecasts as to our business, financial and operational results and future economic performance; and statements of management’s goals and objectives and other similar expressions concerning matters that are not historical facts. In some cases, you can identify forward-looking statements by terminology such as “anticipate,” “estimate,” “plan,” “project,” “continuing,” “ongoing,” “expect,” “webelieve,” “we intend,” “may,” “will,” “should,” “could,” and similar expressions. Such statements are based on current plans, estimatesand expectations and involve a number of known and unknown risks, uncertainties and other factors that could cause the Company’s future results, performance or achievements to differ significantly from the results, performance or achievements expressed or implied by such forward-looking statements. These factors and additional information are discussed in the Company’s filings with the Securities and Exchange Commission and statements in this presentation should be evaluated in light of these important factors. Althoughwe believe that these statements are based upon reasonable assumptions, we cannot guarantee future results. Forward-looking statements speak only as of the date on which they are made, and the Company undertakes no obligation to update publicly or revise any forward-looking statement, whether as a result of new information, future developments or otherwise.Non-GAAP Measures: Manitex International from time to time refers to variousnon-GAAP (generally accepted accounting principles) financial measures in this presentation. Manitex believes that this information is useful to understanding its operating results without the impact of special items. See Manitex’sQ4 2017 earnings release on the Investor Relations section of our website www.manitexinternational.com for a description and/or reconciliation of these measures.NASDAQ : MNTX 2
|
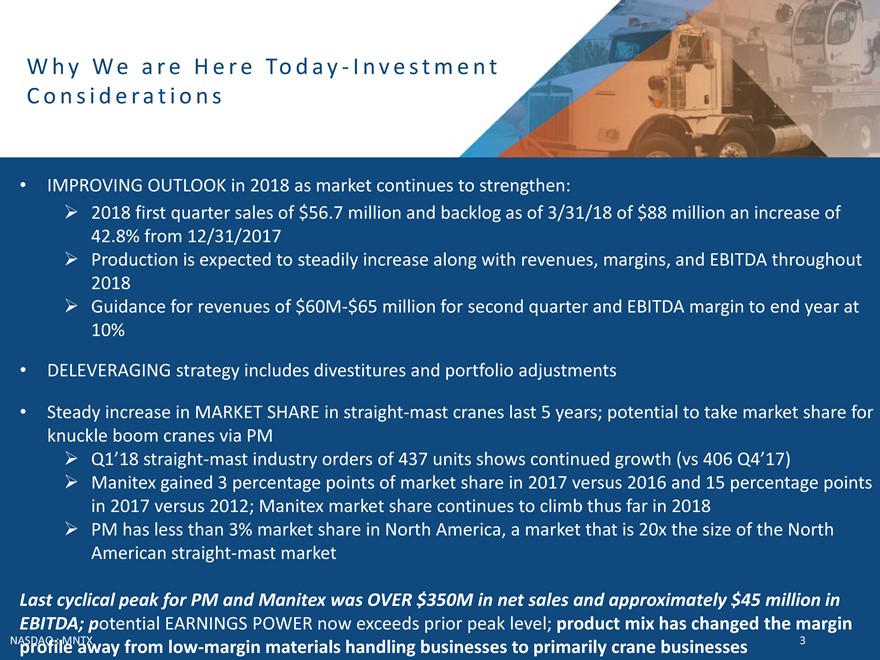 |
Why We are Here Today-Investment Considerations IMPROVING OUTLOOK in 2018 as market continues to strengthen: 2018 first quarter sales of $56.7 million and backlog as of 3/31/18 of $88 million an increase of 42.8% from 12/31/2017 Production is expected to steadily increase along with revenues, margins, and EBITDA throughout 2018 Guidance for revenues of$60M-$65 million for second quarter and EBITDA margin to end year at 10% DELEVERAGING strategy includes divestitures and portfolio adjustments Steady increase in MARKET SHARE in straight-mast cranes last 5 years; potential to take market share for knuckle boom cranes via PM Q1’18 straight-mast industry orders of 437 units shows continued growth (vs 406 Q4’17) Manitexgained 3 percentage points of market share in 2017 versus 2016 and 15 percentage points in 2017 versus 2012; Manitexmarket share continues to climb thus far in 2018 PM has less than 3% market share in North America, a market that is 20x the size of the North American straight-mast marketLast cyclical peak for PM and Manitex was OVER $350M in net sales and approximately $45 million in EBITDA; potential EARNINGS POWER now exceeds prior peak level; product mix has changed the marginNASDAQ profile : MNTX away fromlow-margin materials handling businesses to primarily crane businesses 3
|
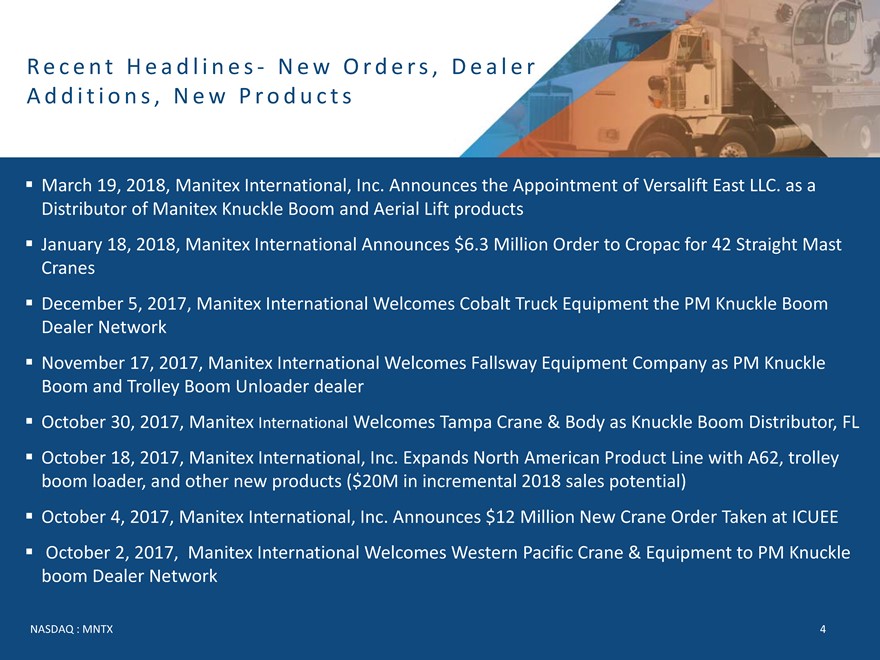 |
Recent Headlines- New Orders, Dealer Additions, New Products March 19, 2018, ManitexInternational, Inc. Announces the Appointment of VersaliftEast LLC. as a Distributor of ManitexKnuckle Boom and Aerial Lift products January 18, 2018, ManitexInternational Announces $6.3 Million Order to Cropacfor 42 Straight Mast Cranes December 5, 2017, ManitexInternational Welcomes Cobalt Truck Equipment the PM Knuckle Boom Dealer Network November 17, 2017, ManitexInternational Welcomes FallswayEquipment Company as PM Knuckle Boom and Trolley Boom Unloader dealer October 30, 2017, Manitex International Welcomes Tampa Crane & Body as Knuckle Boom Distributor, FL October 18, 2017, Manitex International, Inc. Expands North American Product Line with A62, trolley boom loader, and other new products ($20M in incremental 2018 sales potential) October 4, 2017, Manitex International, Inc. Announces $12 Million New Crane Order Taken at ICUEE October 2, 2017, Manitex International Welcomes Western Pacific Crane & Equipment to PM Knuckle boom Dealer NetworkNASDAQ : MNTX 4
|
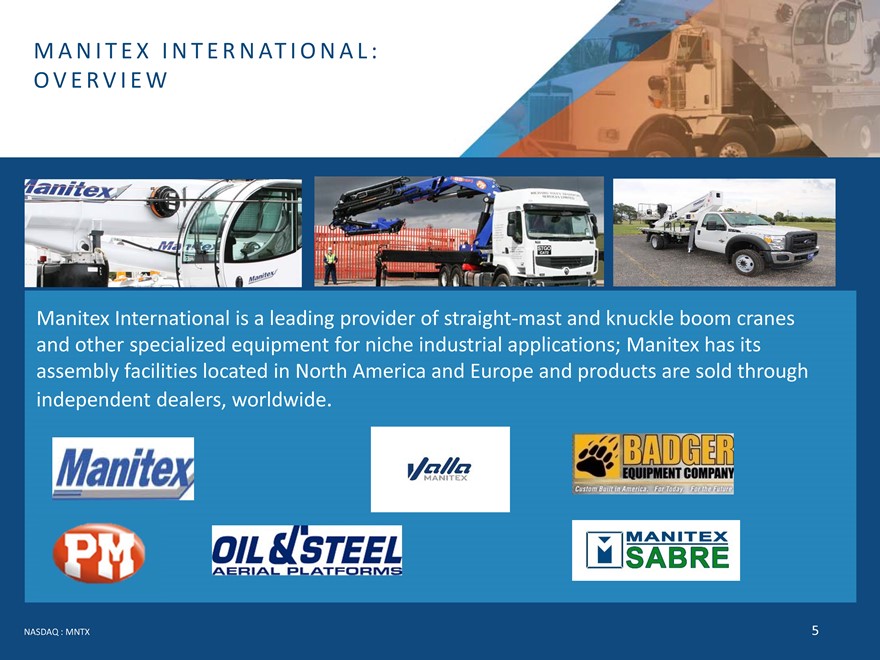 |
MANITEX INTERNATIONAL: OVERVIEWManitex International is a leading provider of straight-mast and knuckle boom cranes and other specialized equipment for niche industrial applications; Manitex has its assembly facilities located in North America and Europe and products are sold through independent dealers, worldwide. NASDAQ : MNTX 5
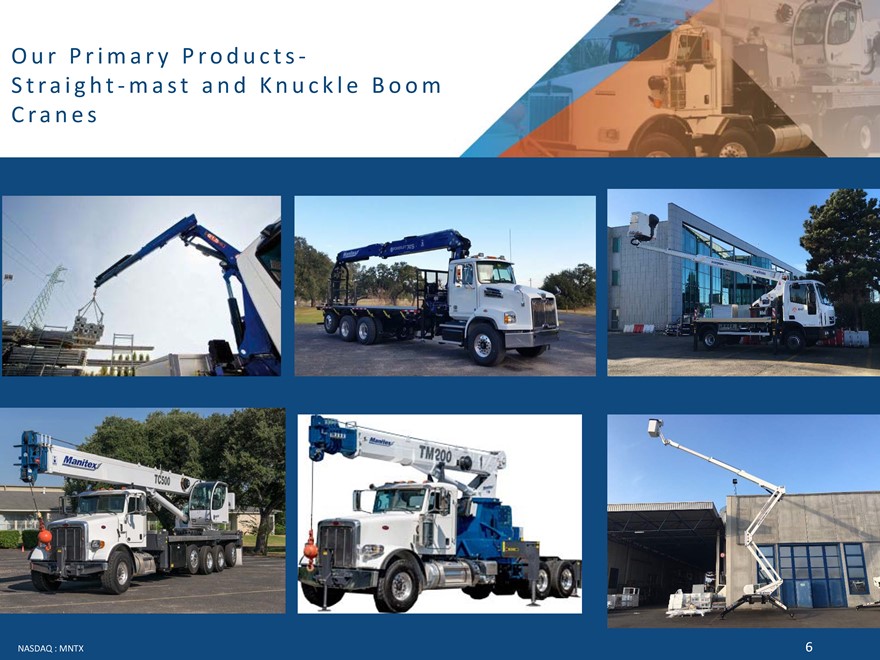
Our Primary Products-Straight-mast and Knuckle Boom CranesNASDAQ : MNTX 6
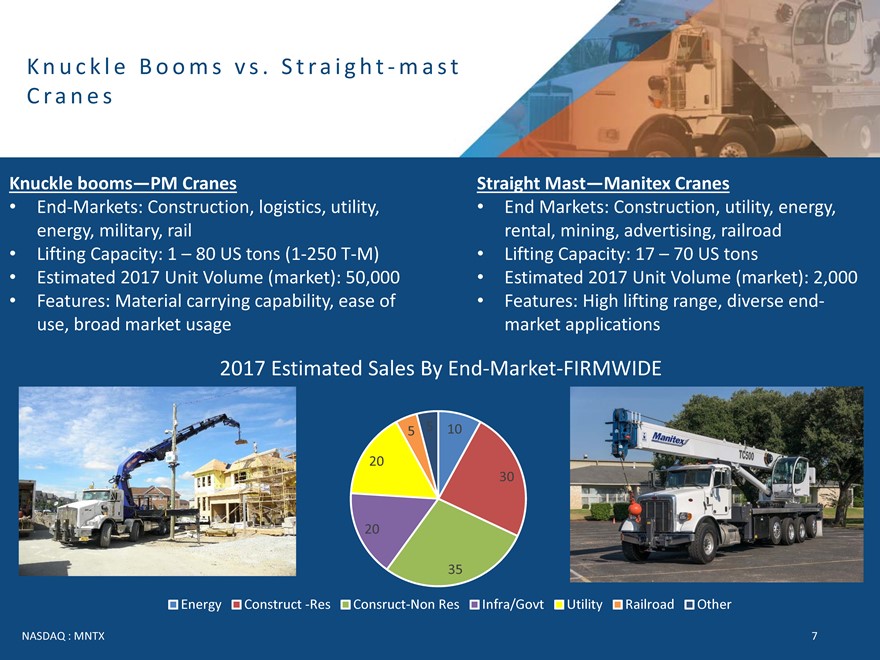
Knuckle Booms vs. Straight-mast CranesKnuckle booms—PM Cranes Straight Mast—Manitex CranesEnd-Markets: Construction, logistics, utility, End Markets: Construction, utility, energy, energy, military, rail rental, mining, advertising, railroad Lifting Capacity: 1 –80 US tons(1-250T-M) Lifting Capacity: 17 –70 US tons Estimated 2017 Unit Volume (market): 50,000 Estimated 2017 Unit Volume (market): 2,000 Features: Material carrying capability, ease of Features: High lifting range, diverseend-use, broad market usage market applications2017 Estimated Sales ByEnd-Market-FIRMWIDE5 5 10 20 302035Energy Construct-Res Consruct-Non Res Infra/Govt Utility Railroad OtherNASDAQ : MNTX 7
|
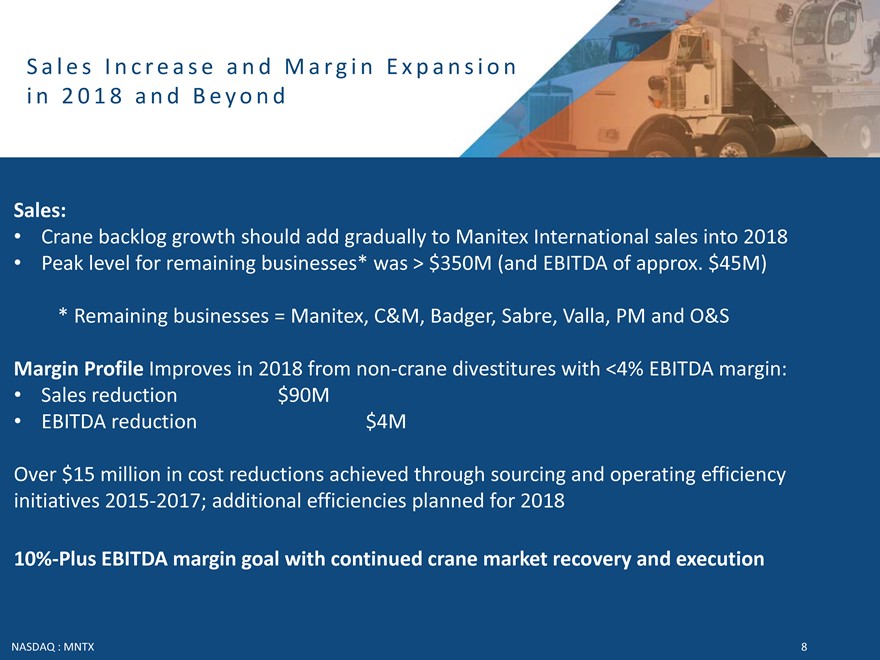 |
Sales Increase and Margin Expansion in 2018 and BeyondSales: Crane backlog growth should add gradually to Manitex International sales into 2018 Peak level for remaining businesses* was > $350M (and EBITDA of approx. $45M) * Remaining businesses = Manitex, C&M, Badger, Sabre, Valla, PM and O&SMargin Profile Improves in 2018 fromnon-crane divestitures with <4% EBITDA margin: Sales reduction $90M EBITDA reduction $4MOver $15 million in cost reductions achieved through sourcing and operating efficiency initiatives 2015-2017; additional efficiencies planned for 201810%-Plus EBITDA margin goal with continued crane market recovery and executionNASDAQ : MNTX 8
|
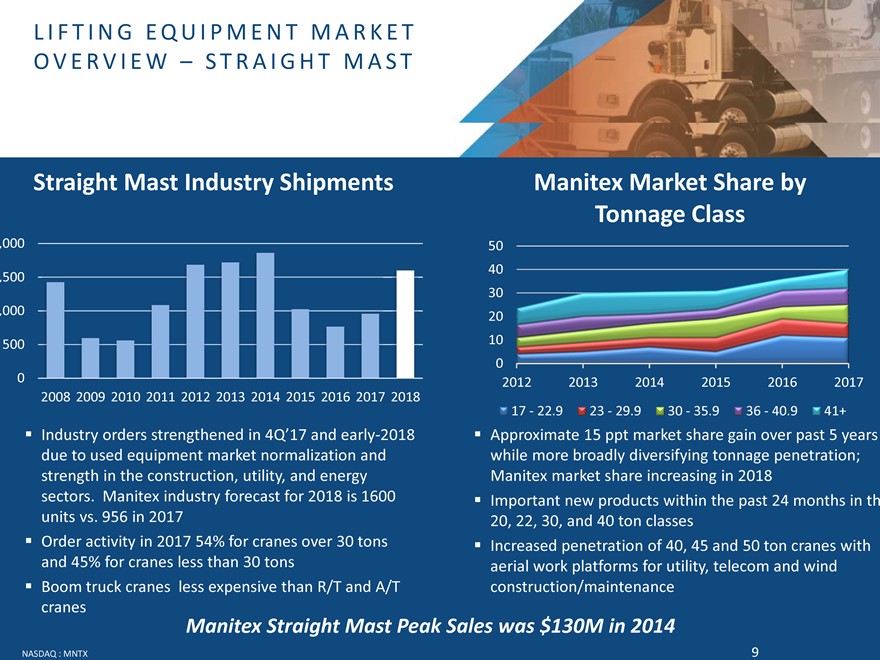 |
LIFTING EQUIPMENT MARKET OVERVIEW – STRAIGHT MASTStraight Mast Industry Shipments ManitexMarket Share by Tonnage Class,000 50 40 ,500 30 ,000 20 500 10 00 2012 2013 2014 2015 2016 2017 2008 2009 2010 2011 2012 2013 2014 2015 2016 2017 201817—22.9 23—29.9 30—35.9 36—40.9 41+ Industry orders strengthened in 4Q’17 and early-2018 Approximate 15 ppt market share gain over past 5 years due to used equipment market normalization and while more broadly diversifying tonnage penetration; strength in the construction, utility, and energy Manitex market share increasing in 2018 sectors. Manitex industry forecast for 2018 is 1600 Important new products within the past 24 months in th units vs. 956 in 2017 20, 22, 30, and 40 ton classes Order activity in 2017 54% for cranes over 30 tons Increased penetration of 40, 45 and 50 ton cranes with and 45% for cranes less than 30 tons aerial work platforms for utility, telecom and wind Boom truck cranes less expensive than R/T and A/T construction/maintenance cranesManitexStraight Mast Peak Sales was $130M in 2014NASDAQ : MNTX 9
|
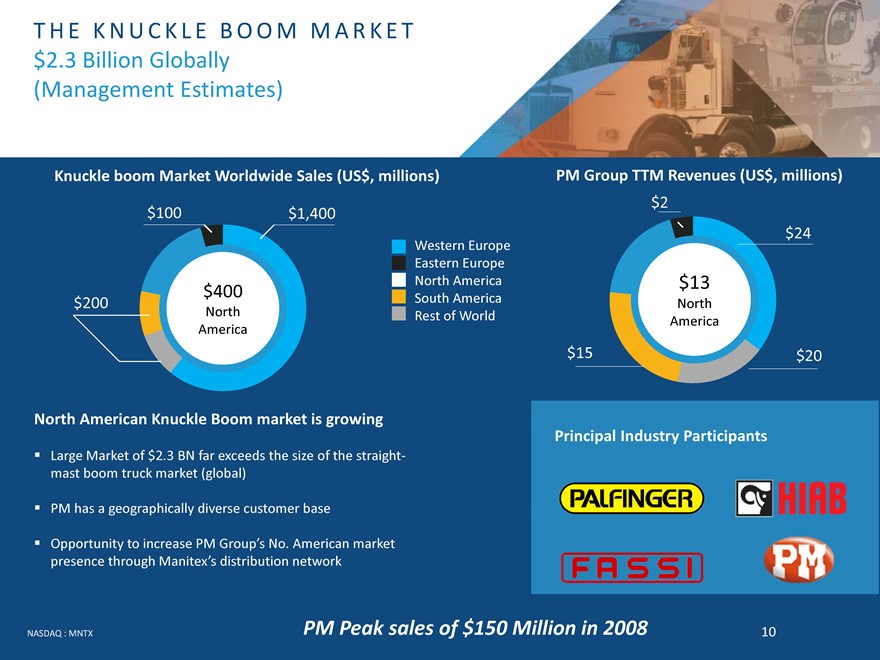 |
THE KNUCKLE BOOM MARKET $2.3 Billion Globally (Management Estimates)Knuckle boom Market Worldwide Sales (US$, millions) PM Group TTM Revenues (US$, millions) $2 $100 $1,400Western Europe $24 Eastern Europe North America $13 $400 South America North $200North Rest of WorldAmerica America$15 $20North American Knuckle Boom market is growingPrincipal Industry Participants Large Market of $2.3 BN far exceeds the size of the straight-mast boom truck market (global) PM has a geographically diverse customer base Opportunity to increase PM Group’s No. American market presence through Manitex’sdistribution networkNASDAQ : MNTX PM Peak sales of $150 Million in 2008 10
|
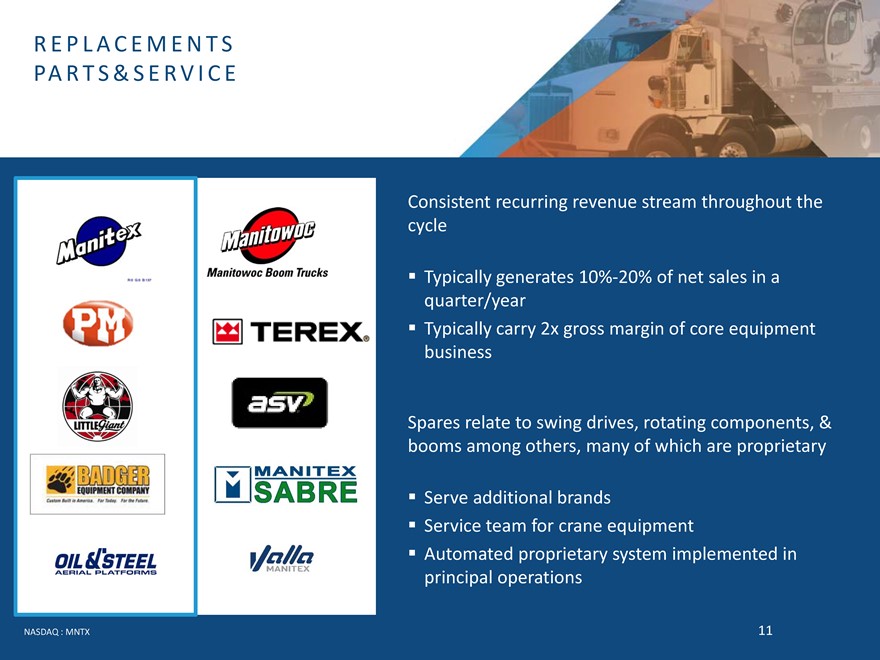 |
REPLACEMENTS PARTS&SERVICEConsistent recurring revenue stream throughout the cycle Typically generates10%-20% of net sales in a quarter/year Typically carry 2x gross margin of core equipment businessSpares relate to swing drives, rotating components, & booms among others, many of which are proprietary Serve additional brands Service team for crane equipment Automated proprietary system implemented in principal operationsNASDAQ : MNTX 11
|
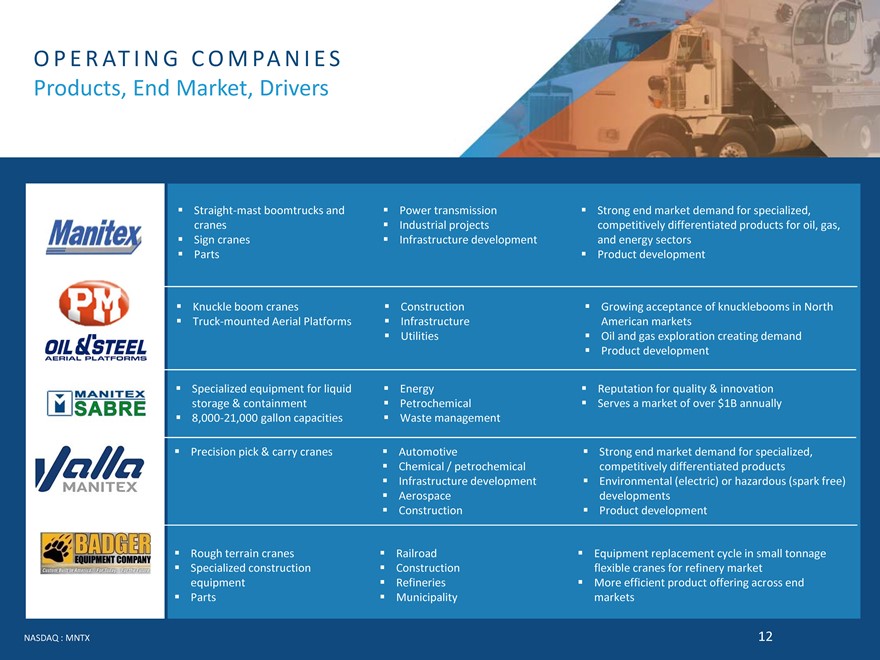 |
OPERATING COMPANIES Products, End Market, Drivers Straight-mast boomtrucksand Power transmission Strong end market demand for specialized, cranes Industrial projects competitively differentiated products for oil, gas, Sign cranes Infrastructure development and energy sectors Parts Product development Knuckle boom cranes Construction Growing acceptance of knuckleboomsin North Truck-mounted Aerial Platforms Infrastructure American markets Utilities Oil and gas exploration creating demand Product development Specialized equipment for liquid Energy Reputation for quality & innovation storage & containment Petrochemical Serves a market of over $1B annually8,000-21,000 gallon capacities Waste management Precision pick & carry cranes Automotive Strong end market demand for specialized, Chemical / petrochemical competitively differentiated products Infrastructure development Environmental (electric) or hazardous (spark free) Aerospace developments Construction Product development Rough terrain cranes Railroad Equipment replacement cycle in small tonnage Specialized construction Construction flexible cranes for refinery market equipment Refineries More efficient product offering across end Parts Municipality marketsNASDAQ : MNTX 12
|
 |
EXPERIENCED MANAGEMENT TEAMDavid Langevin, Chairman & CEO 20+ years principally with TerexSteve Kiefer, President & COO25+ years principally with Eaton Corp. and Hendrickson InternationalSherman Jung, Vice President of Financial Reporting 20+ years in financial operations and SEC ReportingScott Rolston, SVP Strategic Planning30+ years principally with Manitex and ManitowocJim Peterson, Executive Vice President, Operations 35+ years in manufacturing operationsLuigi Fucili, CEO PM Group 10+ years principally with PM GroupNASDAQ : MNTX 13
MANITEX INTERNATIONAL, INC.FINANCIAL OVERVIEWMay 2018
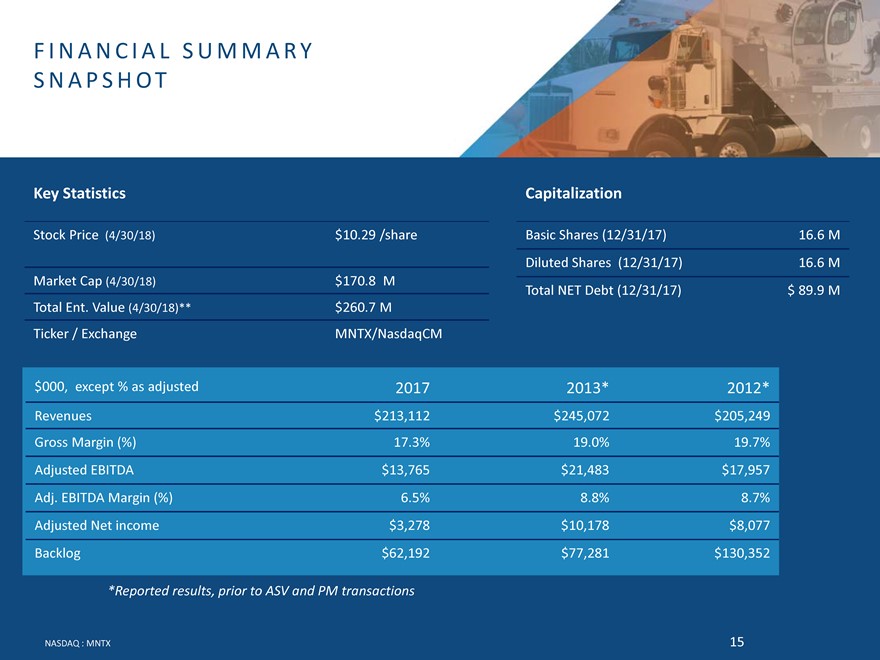
FINANCIAL SUMMARY SNAPSHOTKey Statistics CapitalizationStock Price (4/30/18) $10.29 /share Basic Shares (12/31/17) 16.6 MDiluted Shares (12/31/17) 16.6 M Market Cap (4/30/18) $170.8 MTotal NET Debt (12/31/17) $ 89.9 M Total Ent. Value (4/30/18)** $260.7 MTicker / Exchange MNTX/NasdaqCM$000, except % as adjusted 2017 2013* 2012* Revenues $213,112 $245,072 $205,249Gross Margin (%) 17.3% 19.0% 19.7% Adjusted EBITDA $13,765 $21,483 $17,957 Adj. EBITDA Margin (%) 6.5% 8.8% 8.7% Adjusted Net income $3,278 $10,178 $8,077 Backlog $62,192 $77,281 $130,352*Reported results, prior to ASV and PM transactionsNASDAQ : MNTX 15
|
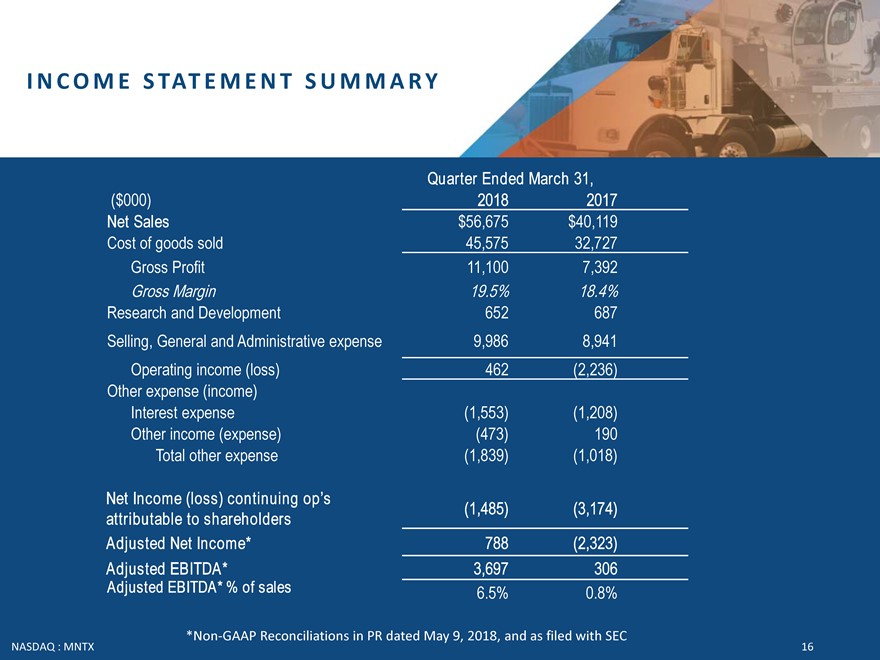 |
INCOME STATEMENT SUMMARYQuarter Ended March 31,($000) 2018 2017 Net Sales $56,675 $40,119 Cost of goods sold 45,575 32,727 Gross Profit 11,100 7,392Gross Margin 19.5% 18.4%Research and Development 652 687 Selling, General and Administrative expense 9,986 8,941 Operating income (loss) 462 (2,236) Other expense (income) Interest expense (1,553) (1,208) Other income (expense) (473) 190 Total other expense (1,839) (1,018)Net Income (loss) continuing op’s (1,485) (3,174) attributable to shareholders Adjusted Net Income* 788 (2,323) Adjusted EBITDA* 3,697 306Adjusted EBITDA* % of sales 6.5%0.8%*Non-GAAP Reconciliations in PR dated May 9, 2018, and as filed with SECNASDAQ : MNTX 16
|
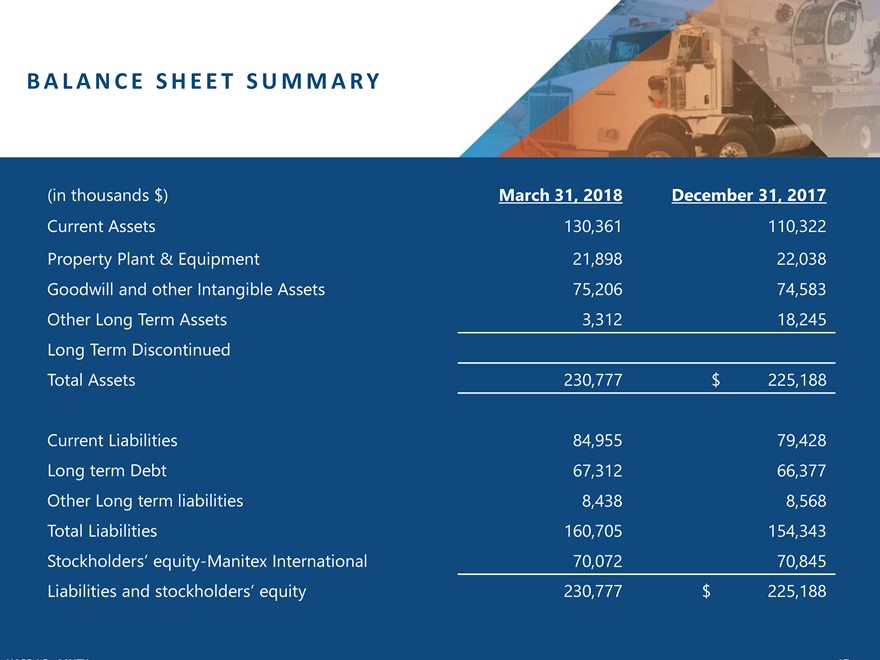 |
BALANCE SHEET SUMMARY(in thousands $) March 31, 2018 December 31, 2017Current Assets 130,361 110,322 Property Plant & Equipment 21,898 22,038 Goodwill and other Intangible Assets 75,206 74,583 Other Long Term Assets 3,312 18,245 Long Term Discontinued Total Assets 230,777 $ 225,188Current Liabilities 84,955 79,428 Long term Debt 67,312 66,377 Other Long term liabilities 8,438 8,568 Total Liabilities 160,705 154,343 Stockholders’ equity-Manitex International 70,072 70,845 Liabilities and stockholders’ equity 230,777 $ 225,188NASDAQ : MNTX 17
MANITEX INTERNATIONAL, INC.(NASDAQ: MNTX) May 2018David Langevin,CEO708-237-2060 dlangevin@manitex.comPeter Seltzberg, IR Darrow Associates,Inc.516-419-9915 pseltzberg@darrowir.com